Embed Size (px)
Citation preview
This article was originally published in a journal published byElsevier, and the attached copy is provided by Elsevier for the
author’s benefit and for the benefit of the author’s institution, fornon-commercial research and educational use including without
limitation use in instruction at your institution, sending it to specificcolleagues that you know, and providing a copy to your institution’s
administrator.
All other uses, reproduction and distribution, including withoutlimitation commercial reprints, selling or licensing copies or access,
or posting on open internet sites, your personal or institution’swebsite or repository, are prohibited. For exceptions, permission
may be sought for such use through Elsevier’s permissions site at:
http://www.elsevier.com/locate/permissionusematerial
Autho
r's
pers
onal
co
py
Astrophysics of CAI formation as revealed by silicon isotopeLA-MC-ICPMS of an igneous CAI
Anat Shahar a,⁎, Edward D. Young a,b
a Department of Earth and Space Sciences, University of California Los Angeles, United Statesb Institute of Geophysics and Planetary Physics, University of California Los Angeles, United States
Received 20 December 2006; received in revised form 4 March 2007; accepted 6 March 2007
Editor: R.W. Carlson
Available online 13 March 2007
Abstract
Silicon isotope ratios of a typical CAI from the Leoville carbonaceous chondrite, obtained in situ by laser ablation MC-ICPMS,together with existing 25Mg/24Mg data, reveal a detailed picture of the astrophysical setting of CAI melting and subsequent heating.Models for the chemical and isotopic effects of evaporation of the molten CAI are used to produce a univariant relationshipbetween PH2
and time during melting. The result shows that this CAI was molten for a cumulative time of no more than 70 daysand probably less than 15 days depending on temperature. The object could have been molten for an integrated time of just a fewhours if isotope ratio zoning was eliminated after melting by high subsolidus temperatures (e.g., N1300 K) for ∼500 yr. In all casessubsolidus heating sufficient to produce diffusion-limited isotope fractionation at the margin of the solidified CAI is required.These stable isotope data point to a two-stage history for this igneous CAI involving melting for a cumulative timescale of hours tomonths followed by subsolidus heating for years to hundreds of years. The thermobarometric history deduced from combining Siand Mg isotope ratio data implicates thermal processing in the disk, perhaps by passage through shockwaves, following melting.This study underscores the direct link between the meaning of stable isotope ratio zoning, or lack thereof, and the inferredastrophysical setting of melting and subsequent processing of CAIs.© 2007 Elsevier B.V. All rights reserved.
Keywords: silicon isotopes; meteorites; CAI; laser ablation
1. Introduction
Isotope cosmobarometry refers to the use of stableisotope fractionation in primitive meteoritical materialsas an ambient gas pressure indicator [1]. In this context,we are concerned with estimating the pressures(dominated by H2) attending igneous calcium–alumi-num-rich inclusion (CAI) formation in the early solar
system. The partial pressure of H2 (PH2) is a key clue to
the astrophysical environs of CAI formation in the solarprotoplanetary disk. In this paper we demonstrate that Siisotope ratios of a CAI obtained in situ by laser ablationmultiple-collector inductively coupled plasma-sourcemass spectrometery (LA-MC-ICPMS) can be used as acosmobarometer to constrain the thermobarometrichistory of the object. We show further that comparisonof Si and Mg isotope fractionations provides anespecially useful way to elucidate the physicochemicalenvironments of CAI formation. The comparison is
Earth and Planetary Science Letters 257 (2007) 497–510www.elsevier.com/locate/epsl
⁎ Corresponding author.E-mail address: [email protected] (A. Shahar).
0012-821X/$ - see front matter © 2007 Elsevier B.V. All rights reserved.doi:10.1016/j.epsl.2007.03.012
Autho
r's
pers
onal
co
py
revealing because while these elements are similar involatility, their mass-dependent isotope fractionationsupon evaporation are distinctive. The results bear on thepressure, temperature, composition, and time pathfollowed by CAIs in the early solar system prior totheir incorporation into chondrite parent bodies.
There is a wealth of information about the physicalchemistry associated with evaporation and condensation ofCAI-like liquids at low pressures. The kinetics of isotopefractionation during condensation and evaporation are alsowell known. Previous work includes parameterization ofthe thermodynamics that controls the rates of evaporationof Ca, Al, Mg, and Si from CaO–Al2O3–MgO–SiO2
(CMAS) melts and experimental determinations ofevaporation factors, γi (γi relates measured evaporationrates for species i to the evaporation rates predicted by theHertz–Knudsen equation) [2,3]. With this information it ispossible to calculate the extent of Si and Mg isotopefractionation resulting from evaporation of amoltenCMASobject in space as a function of pressure, temperature,chemical composition, and time.
It is well known that igneous CAIs tend to have high29Si/28Si and high 25Mg/24Mg relative to chondriticvalues [4], and experimental and computational datahave been used previously to predict Si and Mg isotopefractionation during evaporation [e.g., 2]. Earlier studieshave also used chemical compositions and mineralogiesof igneous CAIs to estimate pressures, temperatures andtimescales of heating [5]. Yet there have been few if anysystematic studies that relate observed isotope fractio-nations in CAIs to their conditions and timescales offormation.
In this study we apply what is known about thephysical chemistry of CMAS melt evaporation and/orcondensation to high-precision, in-situ LA-MC-ICPMS
29Si/28Si data for CAI Levoille 144A, together withexisting 25Mg/24Mg data for the object, to estimate thepressure (PH2
) and time interval for its evaporation in theearly solar nebula. We show that the time-PH2
history ofCAI 144A, and by analogy other similar igneous CAIs,can be reconstructed in detail by combining Si and Mgisotopic data for the object. The result is a uniqueunivariant relationship between hydrogen pressure andtime for melting of the CAI. This PH2
-time constraint inturn limits the number of astrophysical settings for CAImelting and processing.
2. Analytical methods
We developed our laser-based silicon isotope ratiomeasurement technique using a multiple-collectordouble-focusing magnetic-sector inductively coupledplasma-source mass spectrometer (MC-ICPMS, Ther-moFinnigan Neptune™). Three Faraday collectors werespaced to collect 28Si+, 29Si+, and 30Si+ simultaneously.Potential molecular interferences for cardinal mass/charge (m/z) values corresponding to 28Si+, 29Si+, and30Si+ include 28N2
+ and 12C16O+ for m/z=28, 14N15N+
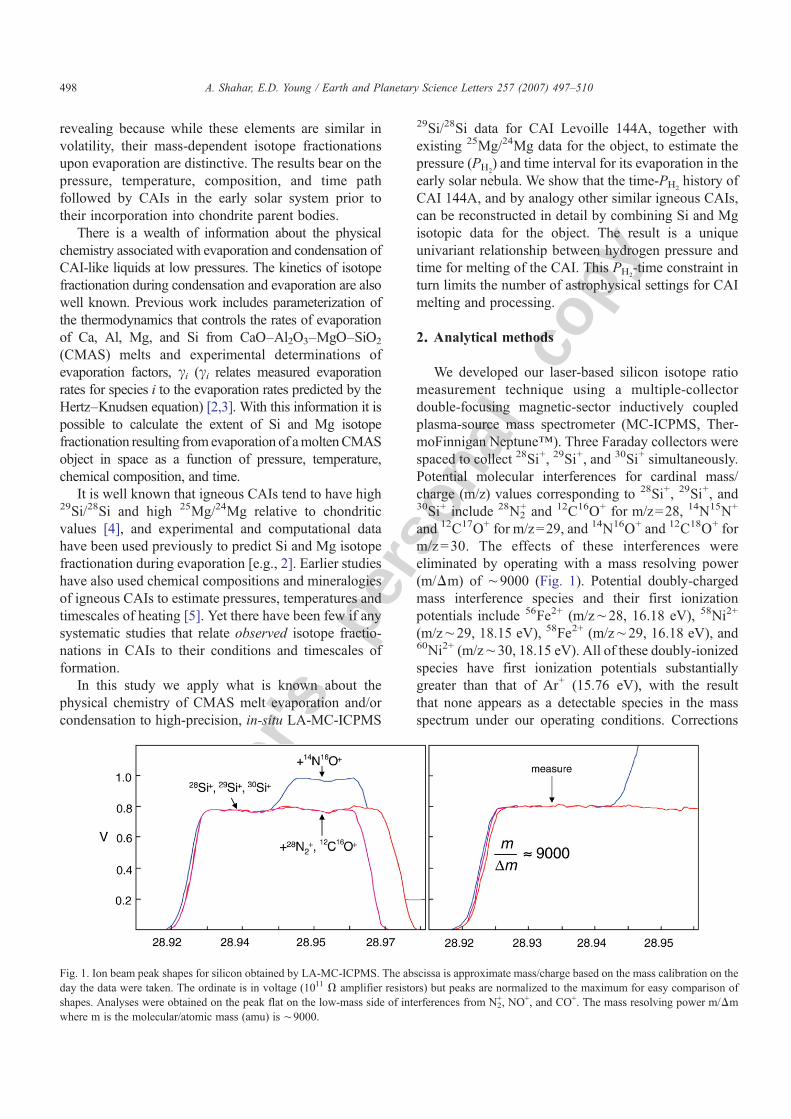
and 12C17O+ for m/z=29, and 14N16O+ and 12C18O+ form/z=30. The effects of these interferences wereeliminated by operating with a mass resolving power(m/Δm) of ∼9000 (Fig. 1). Potential doubly-chargedmass interference species and their first ionizationpotentials include 56Fe2+ (m/z∼28, 16.18 eV), 58Ni2+
(m/z∼29, 18.15 eV), 58Fe2+ (m/z∼29, 16.18 eV), and60Ni2+ (m/z∼30, 18.15 eV). All of these doubly-ionizedspecies have first ionization potentials substantiallygreater than that of Ar+ (15.76 eV), with the resultthat none appears as a detectable species in the massspectrum under our operating conditions. Corrections
Fig. 1. Ion beam peak shapes for silicon obtained by LA-MC-ICPMS. The abscissa is approximate mass/charge based on the mass calibration on theday the data were taken. The ordinate is in voltage (1011 Ω amplifier resistors) but peaks are normalized to the maximum for easy comparison ofshapes. Analyses were obtained on the peak flat on the low-mass side of interferences from N2
+, NO+, and CO+. The mass resolving power m/Δmwhere m is the molecular/atomic mass (amu) is ∼9000.
498 A. Shahar, E.D. Young / Earth and Planetary Science Letters 257 (2007) 497–510

Autho
r's
pers
onal
co
py
for instrumental mass bias (∼5%) were performed bysample-standard bracketing. Our in-house standard forthis purpose is USNM #136718 forsterite (San Carlosolivine).
Isotope analyses were corrected by subtracting apreceding on-peak background measurement. Typical29Si+ signal intensities during CAI measurements were∼50 mV (using 1011 Ω amplifier resistors) and back-grounds for m/z=28, 29, and 30 were 4, 2, and 1 mV,respectively. Isotope ratio measurements during laserablation consist of the mean of seven to ten ∼4 s in-tegration cycles. Sample and standard measurementswere separated by a ∼90 s interval.
All analyses are reported as per mil deviations fromthe standard such that
diSi ¼ ðiSi=28SiÞunknownðiSi=28SiÞstd
−1
!� 103 ð1Þ
and where i refers to either 29 or 30. The usualinternational standard for Si isotope ratio measurementsin natural samples is NBS-28 quartz [6,7]. Our working
standard, San Carlos olivine, has not been measuredrelative to NBS-28 (to the best of our knowledge) but isnonetheless a better standard for laser ablation becausequartz does not couple as well with the laser beam. Onecan infer from previous studies of basalts, meteorites,and lunar rocks that San Carlos olivine δ29Si, represent-ing Earth's mantle, could be ~−0.2‰ relative to NBS-28 [8,9]. Because our uncertainties are comparable tothe likely difference between δ29Si of San Carlos olivineand NBS-28, and because this difference betweenstandards is also uncertain, we have not converted ourδ28Si values to the NBS-28 scale.
We used a 193 nm excimer laser operated with apulse repetition rate of 2 to 6 Hz and UV fluence ofbetween 21 and 27 J/cm2. In-situ analyses were acquiredfrom spots measuring 100 μm in diameter and ∼20–30 μm deep. At this sampling scale melilite analyses,comprising the majority of the data, often include spinelin subordinate quantities (Fig. 2). The amount of spinelin each analysis varies from spot to spot. Ablationproducts of samples and standards were introduced tothe mass spectrometer in a flow of He gas (0.5 l/min)
Fig. 2. Backscattered electron (BSE) images of CAI Leoville 144A. A: whole CAI embedded in surrounding matrix. Black spots are laser ablation pitsfrom this Si isotope study and previous Mg and O isotope studies. B: melilite (medium grey) and spinel (dark grey) palisades (e.g., doughnut shape inleft side of BSE image) in the northeast quadrant of the CAI. Black pits are various laser ablation craters. C: Close-up image of a laser ablation pitshowing sparse inclusions of spinel in melilite. D: Close-up of laser ablation pit including melilite with no spinel visible at bottom of pit (cf. C).Slightly darker grey ring around laser pit is debris left from ablation.
499A. Shahar, E.D. Young / Earth and Planetary Science Letters 257 (2007) 497–510
Autho
r's
pers
onal
co
py
[10]. Helium carried laser ablation products from thesample chamber to a mixing volume where it wascombined with dry Ar gas (0.63 l/min). The sample+He+Ar mixture was then passed to the plasma source.
Precision of our LA-MC-ICPMS analyses is onthe order of ±0.2‰ 1σ for both δ29Si and δ30Si basedon replicate analyses of our standards. The accuracyof the Si isotope ratio results was assessed using asynthetic glass on the CaMgSi2O6–CaAl2Si2O8 join(Di0.59An0.41) prepared with a 1% spike of 28Si (OakRidge silicon batch no. 143292: 99.94% 28Si; 0.04%29Si; 0.02% 30Si). The gravimetric δ29Si and δ30Si val-ues of the spiked glass based on the isotopic composi-tion of NBS-28 (isotopically normal Si) [8] are −10.70and −10.72‰, respectively. The glass was made from1.083mg of OakRidge 28Si spike, 99.319mg of NBS-28SiO2, 42.741 mg Mg(OH)2, 89.359 mg CaCO3 and21.372 mg Al2O3. LA-MC-ICPMS analyses of thisglass yield results indistinguishable from the gravi-metric 29Si/28Si and 30Si/28Si values (Online Supple-mental Material). Accurate analyses of the glass showthat over the range of composition space spannedby our samples (e.g., from Mg0.89Fe0.11SiO4 olivineto ∼CaMg0.5AlSi2O7 glass), matrix effects are negli-gible. This result is consistent with previous studiesusing similar methods for Mg isotope ratio analysisby LA-MC-ICPMS [10–12].
3. Method formodelingCAI 29Si/28Si and 25Mg/24Mgvariations
3.1. Model details
We modeled the isotopic evolution of CAIs,including rates of mass loss, time-dependent variationsin isotope ratios, and time-dependent variations inelemental concentrations. The models consist of numer-ical solutions to the problem of elemental and isotopicfractionation at the moving surface of an evaporatingsphere coupled with diffusional transport within thesphere. The shrinking sphere represents a volatilizingprotoCAI where the rate of surface retreat is a functionof the average volatility of the object as prescribed bydifferences between ambient and equilibrium vaporpressures of the constituent elements. The implicit finitedifference scheme for solving this problem, akin to aninverse Stefan problem, was described previously [13].We modified the implementation of the solution to theproblem to account for the effect of Si and Mg isotopefractionation.
Isotope fractionation in a volatilizing CAI will havebeen controlled by the relative rates of evaporation and
diffusion. Rates of CAI evaporation can be obtainedfrom rates of its constituent Si, Mg, Ca, and Al. The totalgas flux from a liquid CAI is given, to a good ap-proximation [e.g., [2]], as Jtotal∼JSiO+JMg+JCa+JAl+JAlO+JAlOH where Ji is the molar evaporative fluxof species i. Fluxes are calculated using a modifiedHertz-Knudsen equation [3] :
J i¼giðPi;eq−PiÞffiffiffiffiffiffiffiffiffiffiffiffi
2pmiRTp
1þgi ro
Dgasi
ffiffiffiffiffiffiffiffiffiffiRT2pmi
r ð2Þ
where R is the gas constant, mi is the mass of the speciesof interest (e.g., kg/mole), Pi,eq is the equilibrium vaporpressure for the CMAS melt, Pi is ambient backgroundvapor pressure of i, Di
gas is the diffusion coefficient of iin the background gas (H2), γi is the evaporationcoefficient (dimensionless factor characterizing depar-tures from the Hertz-Knudsen equation), and ro is theoriginal radius of the evaporating object. In practice,rather than calculating Pi,eq explicitly, we used theparameterization of equilibrium vapor pressures givenby equation 18 in Richter et al. [3]. The parameterizationconsists of a reference flux at a specific temperature andpartial pressure of O2 (a function of PH2
) and anactivation energy at fixed fugacity of O2 of 650 kJ/mol[3]. Reference fluxes for SiO and Mg were taken fromTable 1 of Richter et al. (experimental data for BCAI-SSI). Reference fluxes for Ca, Al, AlO, and AlOH werecalculated from equilibrium vapor pressures for aCMAS melt given by Grossman et al. [2]. For allcalculations shown here we used a value of 0.03 for γi incases where γ is not already implicit in reference fluxes(see below) [3]. The use of a single, temperature-independent evaporation coefficient is consistent withincorporating the activation energy of 650 kJ/mol intothe parameterization of fluxes [3].
Young and Galy [14] noted that Eq. (2) includes twodistinct pressure effects on evaporation rate and isotopefractionation of a molten sphere in space. The first is theslowing of evaporation where Pi approaches Pi,eq andthe other is inefficient removal of evaporated gas specieswhere total background pressure (∼PH2
) inhibitsdiffusion in the gas phase. They noted that the presenceof isotope fractionation in CAIs suggests that PibPi,eq
and low PH2during CAI formation. Galy et al. [1] and
Young and Galy [14] showed that since chondrules lackstable isotope fractionation, either PH2
was higher thantypical solar nebula values (PH2
N10−3 bar) or Pi waselevated due to a high number density of chondrulesduring chondrule formation. Cuzzi and Alexander [15]
500 A. Shahar, E.D. Young / Earth and Planetary Science Letters 257 (2007) 497–510
Autho
r's
pers
onal
co
py
quantified the effect of chondrule number density onsuppression of isotope fractionation and concluded thatthe number density of chondrules during their formationwas at least 10 m−3, corresponding to an average linearspacing between chondrules of 10 cm.
There is no a priori way of knowing Pi,eq−Pi duringCAI formation since fractionation ensures only that theinequality Pi,eqNPi obtains. Here we assume Pi,eqNNPi
by setting Pi equal to zero in Eq. (2). The tacitassumption is that, unlike chondrules, the numberdensity of CAIs during their formation was notsufficient to permit an overall elevation in backgroundpartial pressures of Mg and Si. We can quantify thisassumption with an estimate of the pressure of gasmolecules or atoms i produced by a population ofevaporating CAIs. Results (see Online SupplementalMaterial) for melting time spans of 6 to 48 h(representing probable timescales for individual melting
events constrained by cooling timescales [16]) show thatPi/Pi,eq becomes significant for CAI number densities of10−3 m−3 to 2 m−3, or an average linear spacingbetween CAIs of ∼8 to 0.8 m. Since the transitionbetween effective vacuum (Pi/Pi,eq∼0) and equilibra-tion (Pi/Pi,eq=1) is abrupt in comparison to all possiblenumber densities, we conclude that CAIs are fraction-ated because their linear spacing was more than ∼8 mduring their formation. The alternative of allowing for areduced evaporation rate due to a finite Pi/Pi,eq valuebetween 0 and 1 requires a just-so spacing betweenCAIs of between 8 and 0.8 m (we cannot, however,reject the possibility that there was another source of Mgand Si in the region of CAI formation). Note that ourcalculated maximum number density of CAIs is 4 ordersof magnitude lower than that calculated for chondrules[15]. In any event, by assuming Pi/Pi,eq=0 in ourcalculations we are invoking a linear spacing of N8 mfor CAIs in the vicinity of 144A.
The r.h.s. denominator term in Eq. (2) corrects forreturn of evaporated species due to a finite diffusionthrough the surrounding gas at higher pressures. Thedenominator in Eq. (2) also relates the isotopefractionation factor associated with evaporation to thatwhere return flow is important. This relationship isgiven by Richter et al. [3] and was built into our modelcalculations. In practice the pressure threshold where thedenominator in Eq. (2) deviates noticeably from 1 (i.e.,PH2
N10−3 bar) is greater than most plausible solarnebula environments.
Total gas flux can be combined with the molarvolume of the CMAS melt, V̂melt, obtained from CMASpartial molar volumes [e.g., 17], to arrive at the rate ofevaporation expressed as a shrink rate of the moltensphere:
dr=dt ¼ �r ¼V̂meltJtotal: ð3ÞThis evaporative shrink rate, the pre-evaporative
radius of the object ro, and the diffusivity of the elementof interest in the condensed phase, Di, togetherdetermine the Péclet number for species i, or Péi, suchthat
P ́ei ¼ −r0�r
Dið4Þ
and the negative sign accounts for a negative dr/dt(shrinking sphere). The value for Péi specifies theimportance of advective transport (surface retreat due toevaporation) relative to diffusive transport of i (diffusionin the condensed phase) and can be used to predict notonly the bulk isotopic composition of the residual
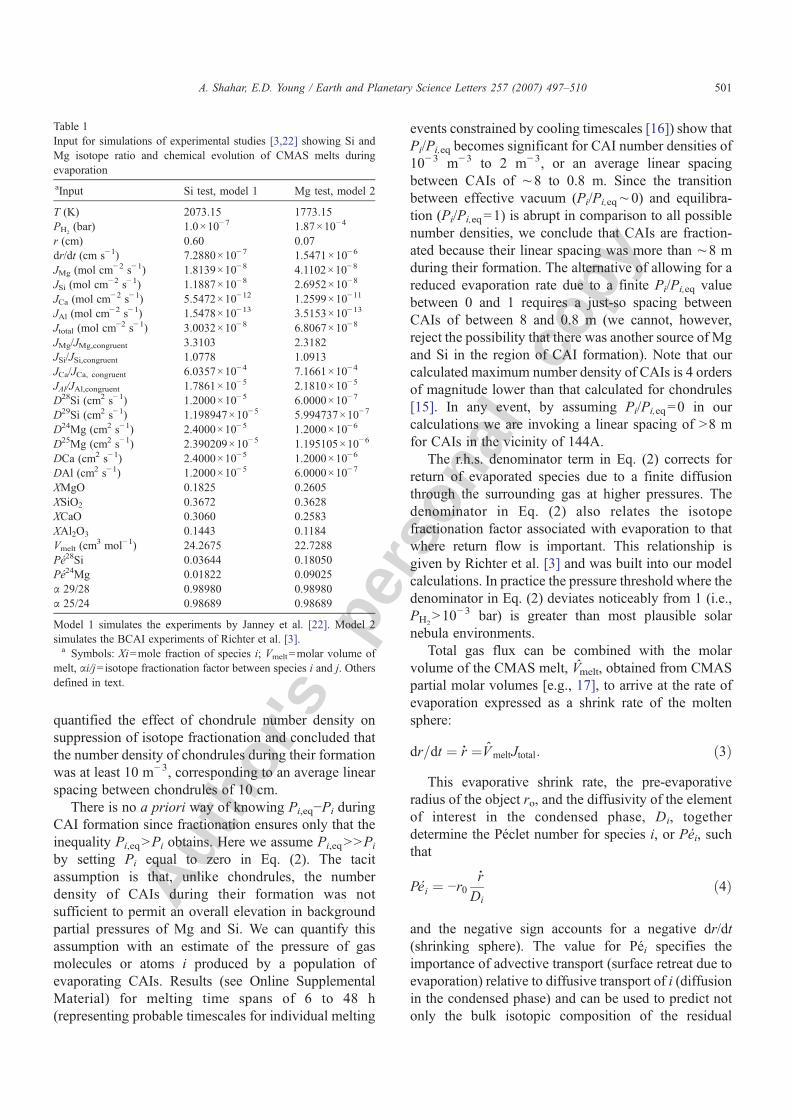
Table 1Input for simulations of experimental studies [3,22] showing Si andMg isotope ratio and chemical evolution of CMAS melts duringevaporationaInput Si test, model 1 Mg test, model 2
T (K) 2073.15 1773.15PH2
(bar) 1.0×10⁻⁷ 1.87×10⁻⁴
r (cm) 0.60 0.07dr/dt (cm s−1) 7.2880×10⁻⁷ 1.5471×10⁻⁶
JMg (mol cm−2 s−1) 1.8139×10⁻⁸ 4.1102×10⁻⁸
JSi (mol cm−2 s−1) 1.1887×10⁻⁸ 2.6952×10⁻⁸
JCa (mol cm−2 s−1) 5.5472×10⁻¹² 1.2599×10⁻¹¹
JAl (mol cm−2 s−1) 1.5478×10⁻¹³ 3.5153×10⁻¹³
Jtotal (mol cm−2 s−1) 3.0032×10⁻⁸ 6.8067×10⁻⁸
JMg/JMg,congruent 3.3103 2.3182JSi/JSi,congruent 1.0778 1.0913JCa/JCa, congruent 6.0357×10⁻⁴ 7.1661×10⁻⁴
JAl/JAl,congruent 1.7861×10⁻⁵ 2.1810×10⁻⁵
D28Si (cm2 s−1) 1.2000×10⁻⁵ 6.0000×10⁻⁷
D29Si (cm2 s−1) 1.198947×10⁻⁵ 5.994737×10⁻⁷
D24Mg (cm2 s−1) 2.4000×10⁻⁵ 1.2000×10⁻⁶
D25Mg (cm2 s−1) 2.390209×10⁻⁵ 1.195105×10⁻⁶
DCa (cm2 s−1) 2.4000×10⁻⁵ 1.2000×10⁻⁶
DAl (cm2 s−1) 1.2000×10⁻⁵ 6.0000×10⁻⁷
XMgO 0.1825 0.2605XSiO2 0.3672 0.3628XCaO 0.3060 0.2583XAl2O3 0.1443 0.1184Vmelt (cm
3 mol−1) 24.2675 22.7288Pé28Si 0.03644 0.18050Pé24Mg 0.01822 0.09025α 29/28 0.98980 0.98980α 25/24 0.98689 0.98689
Model 1 simulates the experiments by Janney et al. [22]. Model 2simulates the BCAI experiments of Richter et al. [3].a Symbols: Xi=mole fraction of species i; Vmelt=molar volume of
melt, αi/j=isotope fractionation factor between species i and j. Othersdefined in text.
501A. Shahar, E.D. Young / Earth and Planetary Science Letters 257 (2007) 497–510
Autho
r's
pers
onal
co
py
evaporating liquid or solid but also the degree of isotopezoning caused by evaporation in the condensed phase[13]. Where Péi≥0.1, substantial zoning in chemicaland isotopic concentrations are to be expected. Theparameterization of evaporation fluxes provided byRichter et al. [3] and Grossman et al. [2], CMAS partialmolar volumes of Courtial and Dingwell [17], anddiffusion coefficients for Si, Mg, Ca and Al in silicatemelts [18,19] permit one to calculate the temperatureand PH2
conditions under which CAI melts acquiredtheir Si and Mg isotope ratios.
With the above thermochemical and kinetic data, thedistribution of light element isotopes in CAIs can becalculated using the method described by Young et al.[13]. Calculated bulk isotope ratios and isotope ratiozoning patterns are obtained by solving the equation
Aci;condAt
¼ DiA2ci;condAr2
þ 2rAci;condAr
� �ð5Þ
where ci,cond is the concentration of species i in thecondensed phase and r is the radial position within theobject. Eq. (5) can be solved subject to the boundaryconditions ∂ci,cond/∂t=0 at r=0 and
DiAci;condAr
jr¼sðtÞ ¼ ci;condðJi=Ji;cong−1Þ �r ð6Þ
at the moving surface r= s(t) of the evaporating object.In Eq. (6) Ji,cong=xir /̇ V̂melt is the molar congruent fluxfor i where xi is the mole fraction of i in the condensedphase. Congruent flux refers to the evaporative flux ofthe species in the absence of species-specific vaporpressures. In the dimensionless form of Eq. (5), Péi isthe negative of the rate of surface migration due to lossof species i [13]. We emphasize that Eqs. (5) and (6),originally derived by Young et al. [13] for congruentevaporation, are appropriate for incongruent evapora-tion when the fractionation factor α is replaced by theflux ratio Ji/Ji,cong in Eq. (6) [20]. The latter flux ratio isthe effective elemental partitioning due to volatility foreach isotopologue species. For such a calculation eachisotopic species has a distinct diffusivity Di and Pecletnumber Péi. The formulation of the problem given byRichter et al. [3] is virtually identical to that describedhere; these workers replaced the Péi used by Younget al. [13,20] with “evaporation numbers”, Evi. It isstraightforward to show that Péi=Evi / 3.
Solutions for concentrations of elements using Eqs.(5) and (6) are obtained by solving the equationsnumerically (implicit finite difference) for each elementrelative to the others (i.e., pseudo-binary calculations)and renormalizing the resulting concentrations for each
element to the total. Isotope ratios are obtained bysolving for each isotopologue separately and then takingthe ratio of the results. Evaporation isotope fractionationfactors α define the isotope specificity of evaporation atthe surface of the condensed phase because α=Ji′ /Jiwhere ′ signifies the rare isotopologue. When evaluatingthe equations one takes into account the small dif-ferences in diffusivities between the isotopes as well asthe different evaporative fluxes [21]. Here, we use theexpression Di′ /Di=(mi /mi′)
β where mi is the mass of thediffusing species. For Si we use a β of 0.025 based onexperimental measurements of Ge diffusion [21] and forMg we use a β of 0.10 based on analogy with diffusionof Ca [21]. The β values for Ca and Al were both takento be 0.10. In all cases these values for β are smallcompared with the purely theoretical value of 0.5 butthey nonetheless play an important role in controllingisotope fractionation in the interior of the evaporatingobject where PéiN0.1.
3.2. Validation
In order to validate our calculation scheme wemodeled the measured changes in Mg isotope ratios andchemical compositions attending evaporation of type BCAI-like liquids in the laboratory (“BCAI” experiments)reported by Richter et al. [3] and Si isotope fractionationmeasured for analogous experiments reported by Janneyet al. [22]. These models of experiments test our abilityto capture the physical chemistry of incongruentevaporation with our calculations. Inputs for the modelsare listed in Table 1. We performed our calculations atT=2073 K and PH2
=1×10⁻⁷ bar for the Si calculations(model 1) and at T=1773 K and PH2
=1.87×10⁻⁴ barfor the Mg calculations (model 2), matching theconditions of the respective experiments.
Chemical diffusion is more rapid than tracer dif-fusion of major elements in these melts and evaporationcan lead to chemical gradients as well as isotopicgradients. Accordingly, we used the chemical diffusiv-ities for Mg, Si, Ca, and Al in CMAS melts indicatedby Kress and Ghiorso [19], Liang et al. [18], andreferences therein. Rates of diffusion in the meltphase depend on the direction in composition spacefollowed, but in general a review of the diagonalizeddiffusion matrices for melts in the systems CAS andCMAS suggests that at 1773 K DMg ~1.2×10⁻⁶ cm2
s−1∼DCa∼2×DSi∼DAl. Some of the melts used toderive these diffusivities have SiO2 concentrationsgreater than CAIs. Relationships between viscosity,silica content, and diffusivity imply that we could beunderestimating Di by as much as a factor of 5 (based on
502 A. Shahar, E.D. Young / Earth and Planetary Science Letters 257 (2007) 497–510
Autho
r's
pers
onal
co
py
experimental C(M)AS SiO2 concentrations of 50% vs.25% for CAIs) with the effect that Péi may beoverestimated by as much as 5×. Typical activationenergies (Ea) for diffusion in relevant systems suggesta median Ea of 300 kJ/mol. This value was used toaccount for temperature (Table 1).
Our evaporation rates (i.e., shrink rates) match thoseof the experiments, as they must, because our referencefluxes were derived from these experiments. What ismore, we find that the evaporation rates derived fromthe parameterized thermodynamics [3] also successfullypredict the measured evaporation rates of forsterite(solid or liquid) [23]. For example, Naghahara andOzawa [23] measured evaporation fluxes for solidforsterite in 2×10⁻⁷ bar of H2 gas at 1973 K of 6.9×10⁻⁷ to 1.1×10⁻⁶ g cm−2 s−1. The calculated valueusing the parameterized thermodynamics is 1.0×10⁻⁶.Similarly, at 6×10⁻⁴ bar H2 Nagahara and Ozawaobtained a flux of 5.4×10⁻⁵ g cm−2 s−1 that compareswell with the calculated value of 5.8×10⁻⁵. Althoughthe parameterization of the thermodynamics wasderived from type B CAI melt compositions, the abilityto successfully predict forsterite evaporation rates showsthat the calculations are valid over a range of com-positions, encompassing at the least the compositionaljoins from CMAS to Mg2SiO4.
We calculated the evaporation histories of 28Si, 29Si,24Mg, 25Mg, Ca, and Al under the appropriate experi-mental conditions [3,22] using the “BCAI” starting
composition. The calculations simulate the chemicaland Si and Mg isotopic compositions of the residualmelts in the experiments. Our results were comparedwith the bulk Si and Mg isotope ratios and bulkchemical compositions of evaporative residues reportedby Janney et al. and Richter et al. Bulk compositions inour models are obtained by integrating each chemicalparameter with respect to the radius of the modelspherical residue.
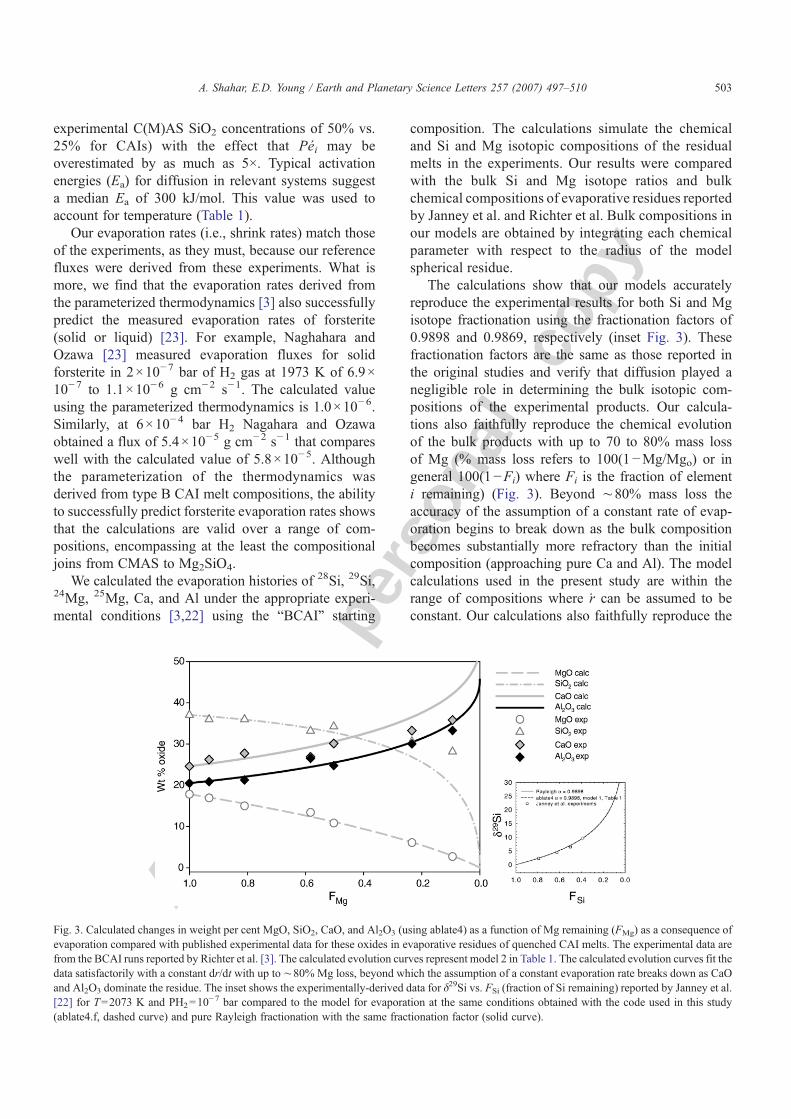
The calculations show that our models accuratelyreproduce the experimental results for both Si and Mgisotope fractionation using the fractionation factors of0.9898 and 0.9869, respectively (inset Fig. 3). Thesefractionation factors are the same as those reported inthe original studies and verify that diffusion played anegligible role in determining the bulk isotopic com-positions of the experimental products. Our calcula-tions also faithfully reproduce the chemical evolutionof the bulk products with up to 70 to 80% mass lossof Mg (% mass loss refers to 100(1−Mg/Mgo) or ingeneral 100(1−Fi) where Fi is the fraction of elementi remaining) (Fig. 3). Beyond ∼80% mass loss theaccuracy of the assumption of a constant rate of evap-oration begins to break down as the bulk compositionbecomes substantially more refractory than the initialcomposition (approaching pure Ca and Al). The modelcalculations used in the present study are within therange of compositions where r˙ can be assumed to beconstant. Our calculations also faithfully reproduce the
Fig. 3. Calculated changes in weight per cent MgO, SiO2, CaO, and Al2O3 (using ablate4) as a function of Mg remaining (FMg) as a consequence ofevaporation compared with published experimental data for these oxides in evaporative residues of quenched CAI melts. The experimental data arefrom the BCAI runs reported by Richter et al. [3]. The calculated evolution curves represent model 2 in Table 1. The calculated evolution curves fit thedata satisfactorily with a constant dr/dt with up to ∼80% Mg loss, beyond which the assumption of a constant evaporation rate breaks down as CaOand Al2O3 dominate the residue. The inset shows the experimentally-derived data for δ29Si vs. FSi (fraction of Si remaining) reported by Janney et al.[22] for T=2073 K and PH2=10
−7 bar compared to the model for evaporation at the same conditions obtained with the code used in this study(ablate4.f, dashed curve) and pure Rayleigh fractionation with the same fractionation factor (solid curve).
503A. Shahar, E.D. Young / Earth and Planetary Science Letters 257 (2007) 497–510
Autho
r's
pers
onal
co
pyexperimental timescales of evaporation (e.g., 180 minfor 40% loss of Mg, not shown), verifying theapplicability of Eq. (3).
4. Sample description
Leoville 144A is a 10×6 mm compact type Ainclusion from a section of the Natural History Museum(NHM) #144 sample of the CV3 meteorite Leoville(Fig. 2A). It is composed mainly of melilite (Ak10–25),magnesian spinel, minor Al–Ti-rich diopside with∼10 wt.% Ti2O3 and 7 wt.% TiO2, and minor perovskitetypically associated with diopside. The CAI is mantledby a Wark-Lovering rim composed of hibonite laths,spinel, and perovskite as well as relatively Ti-poordiopside. The object has been studied extensively[11,24]. It has typical igneous CAI oxygen isotopesystematics with δ18O∼δ17O ranging from −40‰ to0‰ relative to standard mean ocean water (SMOW)[25] and with most, but not all, values spread along thecarbonaceous chondrite anhydrous mineral (CCAM)mixing line in oxygen three-isotope space. Magnesiumisotope ratios define radiogenic excesses in 26Mg/24Mg,δ26Mg⁎, corresponding to an initial 26Al/27Al of6×10−5 [11]. The oxidation state of Ti in the interiorof the object suggests that it crystallized with a fugacityof oxygen (fO2) defined by a gas of ~ solar composition[24]. In brief, Leoville 144A is an unremarkable, typical,
albeit rather large, igneous type A CAI from a CV3meteorite.
5. Isotope ratio results
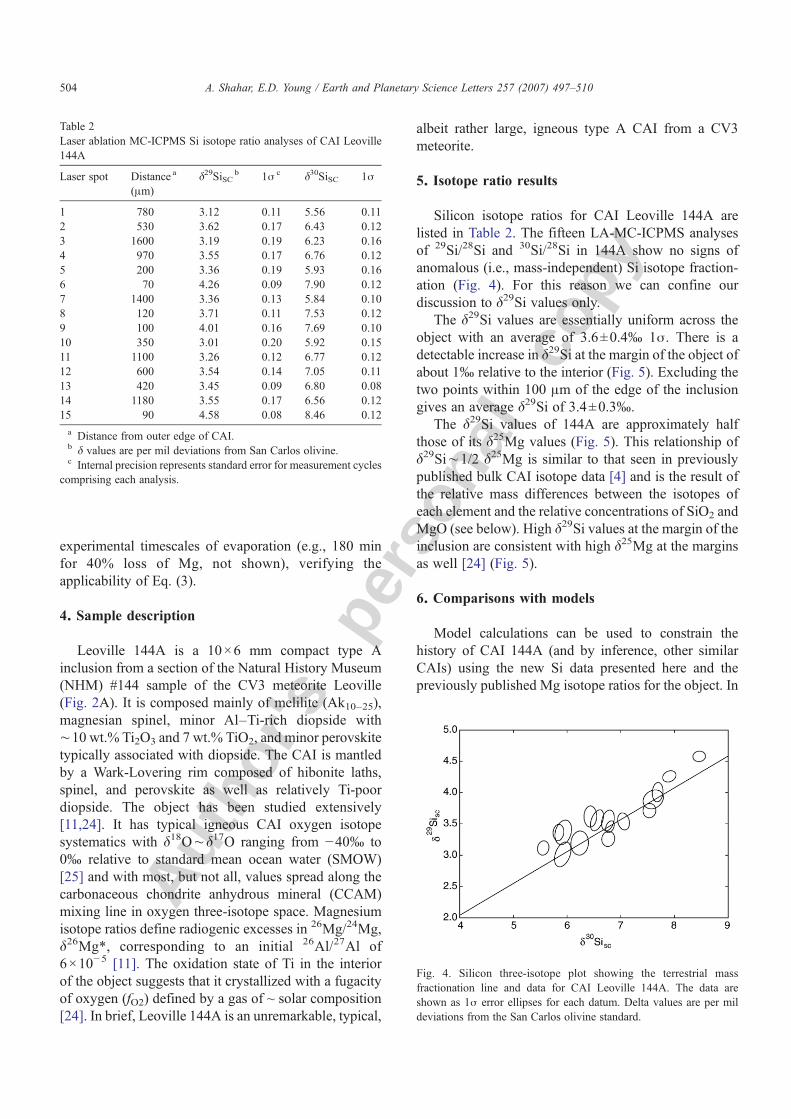
Silicon isotope ratios for CAI Leoville 144A arelisted in Table 2. The fifteen LA-MC-ICPMS analysesof 29Si/28Si and 30Si/28Si in 144A show no signs ofanomalous (i.e., mass-independent) Si isotope fraction-ation (Fig. 4). For this reason we can confine ourdiscussion to δ29Si values only.
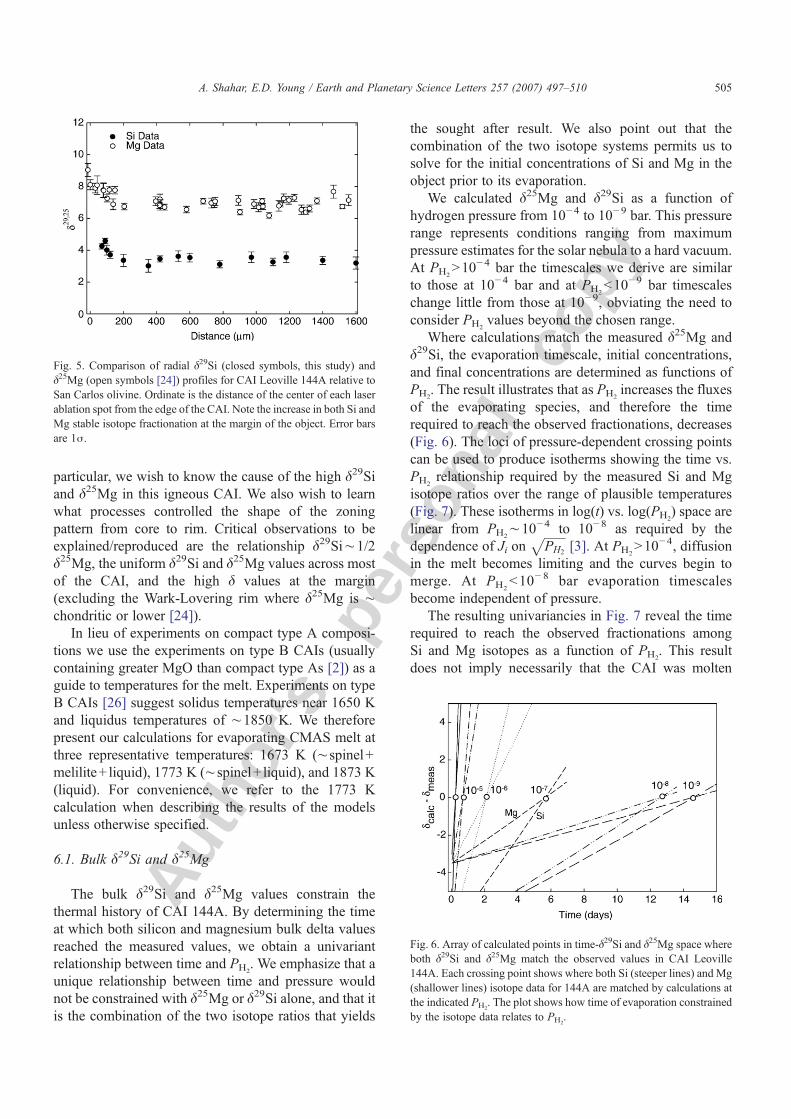
The δ29Si values are essentially uniform across theobject with an average of 3.6±0.4‰ 1σ. There is adetectable increase in δ29Si at the margin of the object ofabout 1‰ relative to the interior (Fig. 5). Excluding thetwo points within 100 μm of the edge of the inclusiongives an average δ29Si of 3.4±0.3‰.
The δ29Si values of 144A are approximately halfthose of its δ25Mg values (Fig. 5). This relationship ofδ29Si∼1/2 δ25Mg is similar to that seen in previouslypublished bulk CAI isotope data [4] and is the result ofthe relative mass differences between the isotopes ofeach element and the relative concentrations of SiO2 andMgO (see below). High δ29Si values at the margin of theinclusion are consistent with high δ25Mg at the marginsas well [24] (Fig. 5).
6. Comparisons with models
Model calculations can be used to constrain thehistory of CAI 144A (and by inference, other similarCAIs) using the new Si data presented here and thepreviously published Mg isotope ratios for the object. In
Fig. 4. Silicon three-isotope plot showing the terrestrial massfractionation line and data for CAI Leoville 144A. The data areshown as 1σ error ellipses for each datum. Delta values are per mildeviations from the San Carlos olivine standard.
Table 2Laser ablation MC-ICPMS Si isotope ratio analyses of CAI Leoville144A
Laser spot Distance a δ29SiSCb 1σ c δ30SiSC 1σ
(μm)
1 780 3.12 0.11 5.56 0.112 530 3.62 0.17 6.43 0.123 1600 3.19 0.19 6.23 0.164 970 3.55 0.17 6.76 0.125 200 3.36 0.19 5.93 0.166 70 4.26 0.09 7.90 0.127 1400 3.36 0.13 5.84 0.108 120 3.71 0.11 7.53 0.129 100 4.01 0.16 7.69 0.1010 350 3.01 0.20 5.92 0.1511 1100 3.26 0.12 6.77 0.1212 600 3.54 0.14 7.05 0.1113 420 3.45 0.09 6.80 0.0814 1180 3.55 0.17 6.56 0.1215 90 4.58 0.08 8.46 0.12
a Distance from outer edge of CAI.b δ values are per mil deviations from San Carlos olivine.c Internal precision represents standard error for measurement cycles
comprising each analysis.
504 A. Shahar, E.D. Young / Earth and Planetary Science Letters 257 (2007) 497–510
Autho
r's
pers
onal
co
py
particular, we wish to know the cause of the high δ29Siand δ25Mg in this igneous CAI. We also wish to learnwhat processes controlled the shape of the zoningpattern from core to rim. Critical observations to beexplained/reproduced are the relationship δ29Si∼1/2δ25Mg, the uniform δ29Si and δ25Mg values across mostof the CAI, and the high δ values at the margin(excluding the Wark-Lovering rim where δ25Mg is ∼chondritic or lower [24]).
In lieu of experiments on compact type A composi-tions we use the experiments on type B CAIs (usuallycontaining greater MgO than compact type As [2]) as aguide to temperatures for the melt. Experiments on typeB CAIs [26] suggest solidus temperatures near 1650 Kand liquidus temperatures of ∼1850 K. We thereforepresent our calculations for evaporating CMAS melt atthree representative temperatures: 1673 K (∼spinel+melilite+ liquid), 1773 K (∼spinel+ liquid), and 1873 K(liquid). For convenience, we refer to the 1773 Kcalculation when describing the results of the modelsunless otherwise specified.
6.1. Bulk δ29Si and δ25Mg
The bulk δ29Si and δ25Mg values constrain thethermal history of CAI 144A. By determining the timeat which both silicon and magnesium bulk delta valuesreached the measured values, we obtain a univariantrelationship between time and PH2
. We emphasize that aunique relationship between time and pressure wouldnot be constrained with δ25Mg or δ29Si alone, and that itis the combination of the two isotope ratios that yields
the sought after result. We also point out that thecombination of the two isotope systems permits us tosolve for the initial concentrations of Si and Mg in theobject prior to its evaporation.
We calculated δ25Mg and δ29Si as a function ofhydrogen pressure from 10−4 to 10−9 bar. This pressurerange represents conditions ranging from maximumpressure estimates for the solar nebula to a hard vacuum.At PH2
N10−4 bar the timescales we derive are similarto those at 10−4 bar and at PH2
b10−9 bar timescaleschange little from those at 10−9, obviating the need toconsider PH2
values beyond the chosen range.Where calculations match the measured δ25Mg and
δ29Si, the evaporation timescale, initial concentrations,and final concentrations are determined as functions ofPH2
. The result illustrates that as PH2increases the fluxes
of the evaporating species, and therefore the timerequired to reach the observed fractionations, decreases(Fig. 6). The loci of pressure-dependent crossing pointscan be used to produce isotherms showing the time vs.PH2
relationship required by the measured Si and Mgisotope ratios over the range of plausible temperatures(Fig. 7). These isotherms in log(t) vs. log(PH2
) space arelinear from PH2
∼10−4 to 10−8 as required by thedependence of Ji on
ffiffiffiffiffiffiffiPH2
p[3]. At PH2
N10−4, diffusionin the melt becomes limiting and the curves begin tomerge. At PH2
b10− 8 bar evaporation timescalesbecome independent of pressure.
The resulting univariancies in Fig. 7 reveal the timerequired to reach the observed fractionations amongSi and Mg isotopes as a function of PH2
. This resultdoes not imply necessarily that the CAI was molten
Fig. 5. Comparison of radial δ29Si (closed symbols, this study) andδ25Mg (open symbols [24]) profiles for CAI Leoville 144A relative toSan Carlos olivine. Ordinate is the distance of the center of each laserablation spot from the edge of the CAI. Note the increase in both Si andMg stable isotope fractionation at the margin of the object. Error barsare 1σ.
Fig. 6. Array of calculated points in time-δ29Si and δ25Mg space whereboth δ29Si and δ25Mg match the observed values in CAI Leoville144A. Each crossing point shows where both Si (steeper lines) and Mg(shallower lines) isotope data for 144A are matched by calculations atthe indicated PH2
. The plot shows how time of evaporation constrainedby the isotope data relates to PH2
.
505A. Shahar, E.D. Young / Earth and Planetary Science Letters 257 (2007) 497–510
Autho
r's
pers
onal
co
pycontinuously over the indicated time spans. Rather, theyindicate the cumulative times in the liquid state requiredby the isotope data. For example, 15 days in the moltenstate (i.e., the maximum for the 1773 K isotherm) mightwell represent 15 individual 1-day melting events. Fig. 7depicts the unique solution for 144A, but the sameprinciple can be applied to other igneous CAIs. Resultsfor other CAIs will yield curves similar in shape to thosein Fig. 7 but displaced vertically at low pressuresdepending upon the degree of isotope fractionation. Allsuch curves for different CAIs must converge to shorttimescales at high pressures (hours at PH2
≤10−4 bar)but will exhibit more variation in duration of melting atlower pressures in accordance with their differentisotopic fractionations.
It is clear from Fig. 7 that CAI 144Awas molten for acumulative time of no more than 70 days. If evaporationoccurred ~100° above the solidus, the timescale wasless than 15 days.
The calculations also show that the precursor to themelted 144A object was already CAI-like in composi-tion. In order to satisfy the observed isotope ratios at alltemperatures and pressures investigated, the CAI had to
have had specific and well-defined initial concentrationsof SiO2 and MgO of 23±2 wt.% and 15±2 wt.%,respectively, with the remainder plausibly evenly splitbetween CaO and Al2O3, e.g., 31% CaO, and 31%Al2O3 (the final result is not sensitive to the relativeproportions of CaO and Al2O3). This starting compo-sition is more calcic and aluminous than typicalchondrite and points to a CAI-like precursor to themelted object not unlike that predicted from thecondensation trends for CAI precursors calculated byGrossman et al. [2]. The final compositions of theevaporated residues in the models are all essentially thesame at PH2
b1×10−4 bar. The final composition is10.05±0.05 wt.% MgO, 18.80±0.2 wt.% SiO2, 35.6±0.1 wt.% CaO, and 35.6±0.1 wt.% Al2O3. Theuncertainties here represent the range of final composi-tions constrained by the models at PH2
=10−9 to 10−4
bar and are likely to be numerical in origin. At 10−4 barthe final composition is slightly different with 9.9 wt.%MgO, 16.6 wt.% SiO2, and again the remainder equallydivided between CaO and Al2O3. We do not have awhole-rock chemical analysis of 144A (much of theobject not in thin section was dissolved for bulk Mgisotope work) but the model final compositions wederive are consistent with typical igneous CAI bulkcomposition [2].
6.2. δ29Si and δ25Mg radial profiles
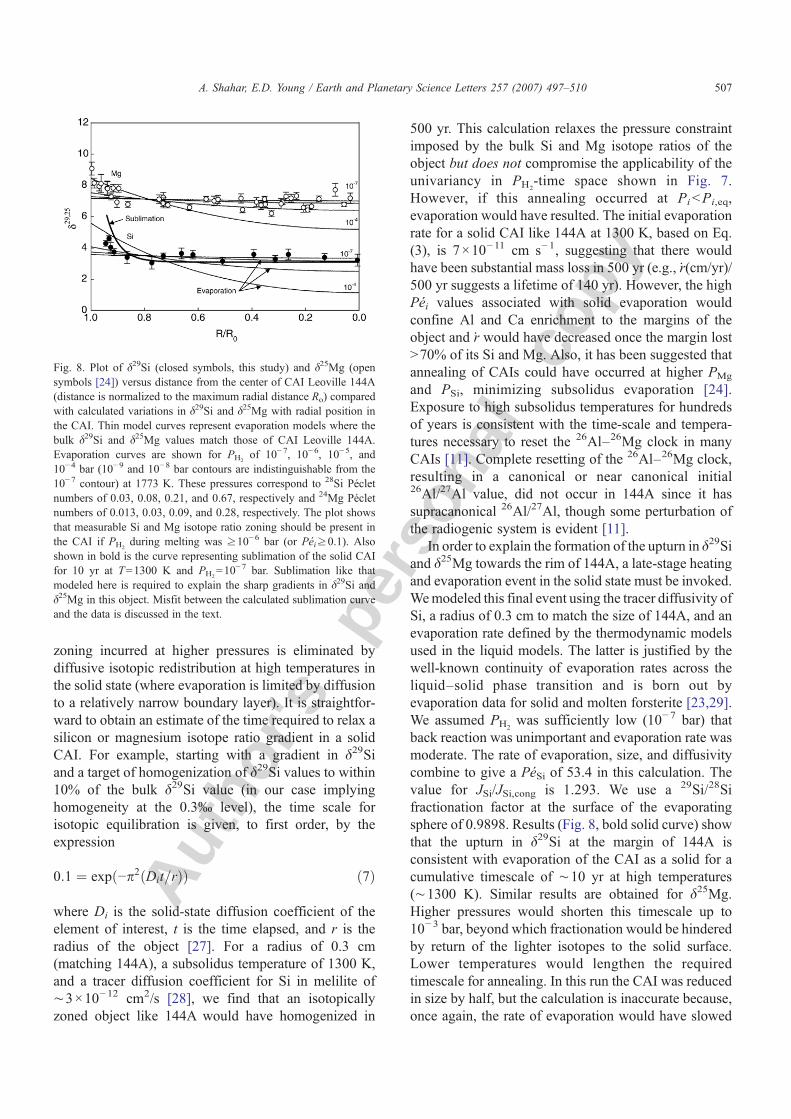
The time intervals for CAI melting determined fromthe whole-rock calculations can be used to calculate theexpected variations in δ29Si and δ25Mg as a function ofradius across the CAI. At pressures b10−6 bar thecalculated profiles are relatively flat for both 29Si/28Siand 26Mg/24Mg (Fig. 8). This is because the Pécletnumbers associated with these models are sufficientlylow that diffusion is not a limitation to the evaporativeflux (Fig. 8). At PN10−6 bar detectable isotope ratiozoning is expected (Fig. 8). The Péclet numbers at thesehigher pressures are N0.1.
The relatively flat calculated isotope ratio profiles atPH2
b10−6 bar match the data for the interior of the CAI(the sharp increases in δ29Si and δ25Mg do not matchany of the profiles calculated for the liquid state, seebelow). In the simplest interpretation, the lack of zoning(except near the margin) suggests that the CAI melted atPH2
b10−6 bar. Such a low pressure would place animportant constraint on the astrophysical environmentfor CAI melting.
It is possible, however, to circumvent the conclusionthat the CAI was melted at PH2
b10−6 if annealing in thesolid state is invoked. In this scenario, the isotope ratio
Fig. 7. Calculated PH2-time curves for evaporation of a molten CAI
like Leoville 144A at 1673 K (near solidus), 1773 K, and 1873 (nearliquidus) K. The curve represents the loci of points shown in Fig. 6,with each point corresponding to the conditions under which bothδ29Si and δ25Mg match the observed values. Also shown are regions inPH2
-time space corresponding to melting by encounter with a smallnumber (e.g.,b5) of gas shock fronts, a large number of shock fronts, asingle solar flare in the inner annulus of the protoplanetary disk, andmultiple solar flares. The derivation of the region in PH2
-time spaceoccupied by each astrophysical setting is described in the text. Thefigure shows that encounters with either a relatively few number ofshock fronts or many solar flares (e.g., of order 10) can explain themelting and volatilization of Leoville 144A. Exposure to a single flareand a large number (e.g., N5) of shock fronts are excluded as possiblecauses of melting.
506 A. Shahar, E.D. Young / Earth and Planetary Science Letters 257 (2007) 497–510
Autho
r's
pers
onal
co
pyzoning incurred at higher pressures is eliminated bydiffusive isotopic redistribution at high temperatures inthe solid state (where evaporation is limited by diffusionto a relatively narrow boundary layer). It is straightfor-ward to obtain an estimate of the time required to relax asilicon or magnesium isotope ratio gradient in a solidCAI. For example, starting with a gradient in δ29Siand a target of homogenization of δ29Si values to within10% of the bulk δ29Si value (in our case implyinghomogeneity at the 0.3‰ level), the time scale forisotopic equilibration is given, to first order, by theexpression
0:1 ¼ expð−p2ðDit=rÞÞ ð7Þ
where Di is the solid-state diffusion coefficient of theelement of interest, t is the time elapsed, and r is theradius of the object [27]. For a radius of 0.3 cm(matching 144A), a subsolidus temperature of 1300 K,and a tracer diffusion coefficient for Si in melilite of∼3×10⁻¹² cm2/s [28], we find that an isotopicallyzoned object like 144A would have homogenized in
500 yr. This calculation relaxes the pressure constraintimposed by the bulk Si and Mg isotope ratios of theobject but does not compromise the applicability of theunivariancy in PH2
-time space shown in Fig. 7.However, if this annealing occurred at PibPi,eq,evaporation would have resulted. The initial evaporationrate for a solid CAI like 144A at 1300 K, based on Eq.(3), is 7×10⁻¹¹ cm s−1, suggesting that there wouldhave been substantial mass loss in 500 yr (e.g., r˙(cm/yr)/500 yr suggests a lifetime of 140 yr). However, the highPéi values associated with solid evaporation wouldconfine Al and Ca enrichment to the margins of theobject and r˙ would have decreased once the margin lostN70% of its Si and Mg. Also, it has been suggested thatannealing of CAIs could have occurred at higher PMg
and PSi, minimizing subsolidus evaporation [24].Exposure to high subsolidus temperatures for hundredsof years is consistent with the time-scale and tempera-tures necessary to reset the 26Al–26Mg clock in manyCAIs [11]. Complete resetting of the 26Al–26Mg clock,resulting in a canonical or near canonical initial26Al/27Al value, did not occur in 144A since it hassupracanonical 26Al/27Al, though some perturbation ofthe radiogenic system is evident [11].
In order to explain the formation of the upturn in δ29Siand δ25Mg towards the rim of 144A, a late-stage heatingand evaporation event in the solid state must be invoked.Wemodeled this final event using the tracer diffusivity ofSi, a radius of 0.3 cm to match the size of 144A, and anevaporation rate defined by the thermodynamic modelsused in the liquid models. The latter is justified by thewell-known continuity of evaporation rates across theliquid–solid phase transition and is born out byevaporation data for solid and molten forsterite [23,29].We assumed PH2
was sufficiently low (10−7 bar) thatback reaction was unimportant and evaporation rate wasmoderate. The rate of evaporation, size, and diffusivitycombine to give a PéSi of 53.4 in this calculation. Thevalue for JSi/JSi,cong is 1.293. We use a 29Si/28Sifractionation factor at the surface of the evaporatingsphere of 0.9898. Results (Fig. 8, bold solid curve) showthat the upturn in δ29Si at the margin of 144A isconsistent with evaporation of the CAI as a solid for acumulative timescale of ∼10 yr at high temperatures(∼1300 K). Similar results are obtained for δ25Mg.Higher pressures would shorten this timescale up to10−3 bar, beyond which fractionation would be hinderedby return of the lighter isotopes to the solid surface.Lower temperatures would lengthen the requiredtimescale for annealing. In this run the CAI was reducedin size by half, but the calculation is inaccurate because,once again, the rate of evaporation would have slowed
Fig. 8. Plot of δ29Si (closed symbols, this study) and δ25Mg (opensymbols [24]) versus distance from the center of CAI Leoville 144A(distance is normalized to the maximum radial distance Ro) comparedwith calculated variations in δ29Si and δ25Mg with radial position inthe CAI. Thin model curves represent evaporation models where thebulk δ29Si and δ25Mg values match those of CAI Leoville 144A.Evaporation curves are shown for PH2
of 10−7, 10−6, 10−5, and10−4 bar (10−9 and 10−8 bar contours are indistinguishable from the10−7 contour) at 1773 K. These pressures correspond to 28Si Pécletnumbers of 0.03, 0.08, 0.21, and 0.67, respectively and 24Mg Pécletnumbers of 0.013, 0.03, 0.09, and 0.28, respectively. The plot showsthat measurable Si and Mg isotope ratio zoning should be present inthe CAI if PH2
during melting was ≥10−6 bar (or Péi≥0.1). Alsoshown in bold is the curve representing sublimation of the solid CAIfor 10 yr at T=1300 K and PH2
=10−7 bar. Sublimation like thatmodeled here is required to explain the sharp gradients in δ29Si andδ25Mg in this object. Misfit between the calculated sublimation curveand the data is discussed in the text.
507A. Shahar, E.D. Young / Earth and Planetary Science Letters 257 (2007) 497–510
Autho
r's
pers
onal
co
py
once Mg and Si were depleted by more than ∼70%,something not accounted for when using a fixed r˙. Thislack of a time-dependent r˙ most likely plays a role inprecluding a perfect fit to the data at the margin sincePéSi will also have evolved to lower values (Fig. 8).
The combination of Si and Mg isotope ratios in CAI144A point to a thermobarometric history involving aperiod of supersolidus evaporation for ∼1 to 70 daysfollowed by late-stage sublimation lasting years. If lackof isotope ratio zoning resulted from reequilibration bytracer diffusion in the solid state, then a post-meltinginterval of heating lasting ≥102 yr is implied. Weemphasize that the times referred to here are integratedand may represent the cumulative effects of numerousshorter events.
7. Astrophysical implications
The Si and Mg isotope data for 144A place importantconstraints on where in the solar protoplanetary disk theCAI may have been melted and subsequently heated.Among existing models for processing solids in theearly solar system, there are at least two plausibleastrophysical settings for the melting of this igneousCAI and, by extrapolation, other igneous CAIs withsimilar isotope systematics. One is melting by passageof the CAI into shockwaves resulting in an integratedmelting interval of hours to one or two days and theother is exposure to many solar flare events in the earlysolar system amounting to a total melting time of nomore than ∼70 days (Fig. 7). This excludes many otherpossibilities. For example, hundreds of melting eventsby shock heating or melting by a single solar flare areexcluded by the mass fractionation exhibited by the CAI(Fig. 7), as shown below.
The shockwave model for heating chondrules andigneous CAIs predicts that millimeter sized objectspassing through a high-density gas front at supersonicvelocities experience temperatures of 1400 K to 2200 Kfor roughly one day with radiative heating aboveambient temperatures for several days. Time scales formelting are expected to be on the order of hours.Pressures in the shock exceed ambient by a factor of 10to 100 [30]. Assuming the solar protoplanetary diskmass was in the range from 0.02 M⊙ (the minimum) to0.13 M⊙ (a reasonable large value), the calculations byBoss et al. [31] suggest a range in ambient midplanepressures in the inner disk (Rb5 AU) from 10−7 bar(R=5AU, 0.02M⊙, gas number density=4×1011 cm−3)to 10−4 bar (R=1 AU, 0.13 M⊙, gas number density=4×1014 cm−3). Therefore, if melting of 144A occurred ina shockwave, the likely pressure was between 10−6 bar to
10−3 bar for a time span of the order of a day or less. Theseconditions are consistentwith thehigh-pressure endof theunivariant time-pressure trajectory for 144A required byits Si and Mg isotope ratios (Fig. 7). Shockwave heatingwould imply that the CAI was at one time zoned in29Si/28Si and 25Mg/24Mg because of the rapid rate ofevaporation at high PH2
.An alternative hypothesis for CAI formation consis-
tent with the Si and Mg isotope data presented here isexposure to numerous solar flare events. This wouldoccur if CAIs formed in the inner annulus of the solarprotoplanetary disk and were later dispersed to moredistal regions of the disk, perhaps by x-winds [32,33].The latter model predicts that CAIs formed in thereconnection ring of the solar protoplanetary disk wherethey were exposed to solar flares that occurred in cyclesthat persisted for perhaps tens of years [32]. As eachindividual solar flare event within an active cycleprobably lasted for a few days, and CAIs are thought tobe resident in the reconnection ring for on the order of30 days, multiple melting events are implied. Ourmodeling of the Si and Mg isotope data suggests amaximum duration of melting of ∼70 days at vacuum(or 15 days at a median temperature of 1773 K) and isconsistent with residence of 144A in the reconnectionring region adjacent the protosun during active flaring.Melting by flares in the reconnection ring would likelyoccur at low gas pressures, suggesting that in this casethe lack of Si and Mg isotope ratio zoning in the body of144A is a primary feature and not the consequence ofsubsequent diffusive reequilibration.
The difference between the two scenarios describedabove is the PH2
associated with melting, and assess-ment of the pressure attending melting of the CAIdepends on the interpretation of the lack of substantialvariation in 29Si/28Si and 25Mg/24Mg with radius acrossthe object (excluding the margin, see below). If melt-ing occurred at PH2
greater than 10−6 bar (gas numberdensity=4×1012 cm−3), as in a shock heating event orevents, there would have been a significant curvature inthe radial δ29Si and δ25Mg profiles in the CAI (Fig. 8).We showed above that elimination of this profile wouldrequire ∼500 yr of exposure to high temperatures of∼1300 K. Centimeter-sized objects like CAIs arebelieved to have had a mean lifetime in the nebula oforder 104 yr at heliocentric radii of 2 to 4 AU (and attotal disk masses of 0.02–0.13 M⊙) [34], and extensivesubsolidus heating of CAIs for an integrated heatinginterval of hundreds of years spanning a total timeinterval (hot and cold intervals) of 300,000 yr in theprotoplanetary disk has been proposed recently [11]. Itappears that there was ample time for CAI 144A to have
508 A. Shahar, E.D. Young / Earth and Planetary Science Letters 257 (2007) 497–510
Autho
r's
pers
onal
co
py
experienced sufficient thermal processing to eliminateany Si and Mg isotope ratio gradients incurred duringmelting, if they existed. However, hundreds of years ofsubsolidus heating should have reset the 26Al–26Mgdecay system early in the life of the CAI, implying thatthe initial 26Al/27Al recorded in this object should bebelow the initial for the solar system. This is not the casefor 144A [11].
The alternative to subsolidus reequilibration is thatPH2
was less than 10−6 bar during melting (obviating theneed for subsolidus reequilibration). In this case,multiple solar flare events are implied in so far as thegas pressures required to prevent isotopic zoning arethought to be too low to be consistent with shock heating.
Regardless of the thermobarometric history invokedto explain the lack of isotope ratio zoning in the body of144A, subsolidus heating events subsequent to meltingare required to explain the sharp gradients in Si and Mgisotope ratios at the margin of the object. The ∼10 yrtimescale obtained by modeling the profile as sublima-tion of the solid CAI is consistent with heating bynumerous shock events or flares, or perhaps by passageinto the inner nebula where ambient temperaturesexceeded 1000 K [31].
The Si and Mg isotope ratio data for 144A require aminimum duration of post-melting thermal processing athigh temperatures (TN∼1300 K) of ∼10 to ∼500 yr,depending upon the pressure attending melting.
8. Conclusions
Silicon LA-MC-ICPMS has been developed andapplied to determine the astrophysical setting offormation of the CAI Leoville 144A. The new Si datacombined with existing Mg isotope ratio data andmodels for the physical chemistry of evaporation placeconstraints on the time-pressure history of this CAI and,by extrapolation, other CAIs with similar Si and Mgisotope systematics. We find that the CAI was moltenfor a total of no more than 70 days and perhaps as littleas a few hours, depending upon its subsequent history.Our results are consistent with melting either byexposure to a few shockwaves in the protoplanetarydisk at PH2
≥10−6 bar or by exposure to numerous solarflare events like those envisaged in the x-wind model atmuch lower PH2
. Each of these two scenarios hasimplications for the timescale of heating subsequent tomelting. Shockwave heating requires hundreds of yearsof subsolidus heating to erase isotope zoning that wouldhave been incurred during melting. Exposure to solarflares implies lower PH2
during melting and obviates theneed for hundreds of years of subsolidus heating. In
either case, years of sublimation of the solid CAI arerequired to explain the details of the Si and Mg isotoperatio profiles in the margin of the object. This workshows that combining Si and Mg isotope ratio data forCAIs yields constraints on the thermobarometrichistories of CAIs and on the astrophysical setting oftheir melting.
Acknowledgements
The authors acknowledge support from NASA'sCosmochemsitry program (EDY), the University ofCalifornia Los Angeles, and a grant from NASA'sInstitute of Astrobiology to the Institute of Geophysicsand Planetary Physics Center for Astrobiology atUCLA. We thank Matthieu Gounelle (Paris) and OscarLovera (UCLA) for helpful input. Sara Russell (NHM)made CAI Leoville 144A available to us for study andhas contributed substantially to our understanding ofthis object. Richard Ash (Univ. of Maryland) collectedoxygen isotope ratio data cited herein while workingwith EDY at Oxford University. We thank ConelAlexander and Harold Connolly for their thoughtfuland helpful reviews of an earlier version of the paper.
Appendix A. Supplementary data
Supplementary data associated with this article canbe found, in the online version, at doi:10.1016/j.epsl.2007.03.012.
References
[1] A. Galy, E.D. Young, R.D. Ash, R.K. O'Nions, The formation ofchondrules at high gas pressures in the solar nebula, Science 290(2000) 1751–1753.
[2] L. Grossman, D.S. Ebel, S.B. Simon, A.M. Davis, F.M. Richter,N.M. Parsad, Major element chemical and isotopic compositionsof refractory inclusions in C3 chondrites: the separate roles ofcondensation and evaporation, Geochim. Cosmochim. Acta 64(2000) 2879–2894.
[3] F.M. Richter, A.M. Davis, D.S. Ebel, A. Hashimoto, Elemental andisotopic fractionation of typeB calcium–aluminum-rich inclusions:experiments, theoretical considerations, and constraints on theirthermal evolution, Geochim. Cosmochim. Acta 66 (3) (2002)521–540.
[4] R.N. Clayton, R.W. Hinton, A.M. Davis, Isotopic variations in therock-forming elements in meteorites, Philos. Trans. R. Soc. Lond.,A 325 (1988) 483–501.
[5] F.M. Richter, R.A. Mendybaev, A.M. Davis, Conditions in theprotoplanetary disk as seen by the type B CAIs, Meteorit. Planet.Sci. 41 (2006) 83–93.
[6] T. Ding, D. Wan, R. Bai, Z. Zhang, Y. Shen, R. Meng, Siliconisotope abundance ratios and atomic weights of NBS-28 andother reference materials, Geochim. Cosmochim. Acta 69 (2005)5487–5494.
509A. Shahar, E.D. Young / Earth and Planetary Science Letters 257 (2007) 497–510
Autho
r's
pers
onal
co
py
[7] C. Molini-Velsko, T.K. Mayeda, R.N. Clayton, Isotopic compositionof silicon in meteorites, Geochim. Cosmochim. Acta 50 (1986)2719–2726.
[8] T. Ding, S. Jiang, D. Wan, Y. Li, J. Li, H. Song, Z. Liu, X. Yao,Silicon Isotope Geochemistry, 1996 125 pp., Beijing.
[9] C.B. Douthitt, The geochemistry of the stable isotopes of silicon,Geochim. Cosmochim. Acta 46 (1982) 1449–1458.
[10] E.D. Young, R.D. Ash, A. Galy, N.S. Belshaw, Mg isotopeheterogeneity in the Allende meteorite measured by UV laserablation-MC-ICPMS and comparisons with O isotopes, Geochim.Cosmochim. Acta 66 (4) (2002) 683–698.
[11] E.D. Young, J.I. Simon, A. Galy, S.S. Russell, E. Tonui, O.Lovera, Supra-canonical Al-26/Al-27 and the residence time ofCAls in the solar protoplanetary disk, Science 308 (5719) (2005)223–227.
[12] E.D. Young, J.I. Simon, A. Galy, S.S. Russell, E. Tonui, O.Lovera, Supra-canonical Al-26/Al-27 and the residence time ofCAls in the solar protoplanetary disk, Science 308 (5719) (2005)Supplemental on-line material.
[13] E.D. Young, H. Nagahara, B.O. Mysen, D.M. Audet, Non-Rayleigh oxygen isotope fractionation by mineral evaporation:theory and experiments in the system SiO2, Geochim. Cosmo-chim. Acta 62 (18) (1998) 3109–3116.
[14] E.D. Young, A. Galy, The isotope geochemistry and cosmo-chemistry of magnesium, in: geochemistry of non-traditionalstable isotopes, Reviews in Mineralogy & Geochemistry, vol. 55,MSA, 2004, pp. 197–230.
[15] J.N. Cuzzi, C.M.O.D. Alexander, Chondrule formation inparticle-rich nebular regions at least hundreds of kilometersacross, Nature 441 (2006) 483–485.
[16] E.M. Stolper, Crystallization sequences of Ca–Al-rich inclusionsfrom Allende: an experimental study, Geochim. Cosmochim.Acta 46 (1982) 2159–2180.
[17] P. Courtial, D.B. Dingwell, Densities of melts in the CaO–MgO–Al2O3–SiO2 system, Am. Mineral. 84 (1999) 465–476.
[18] Y. Liang, F.M. Richter, B. Watson, Diffusion in silicate melts: II.Multicomponent diffusion in CaO–Al2O3–SiO2 at 1500 °C and1 GPa, Geochim. Cosmochim. Acta 60 (1996) 5021–5035.
[19] V.C. Kress, M.S. Ghiorso, Multicomponent diffusion in MgO–Al2O3–SiO2 and CaO–MgO–Al2O3–SiO2 melts, Geochim.Cosmochim. Acta 57 (1993) 4453–4466.
[20] E.D. Young, Assessing the implications of K isotope cosmo-chemistry for evaporation in the preplanetary solar nebula,Earth Planet. Sci. Lett. 183 (1–2) (2000) 321–333.
[21] F.M. Richter, A.M. Davis, D.J. DePaolo, B. Watson, Isotopefractionation by chemical diffusion between molten basalt andrhyolite, Geochim. Cosmochim. Acta 67 (2003) 3905–3923.
[22] P.E. Janney, F.M. Richter, A.M. Davis, R.A. Mendybaev, M.Wadhwa, Silicon isotope ratio variations in CAI evaporationresidues measured by laser ablation multicollector ICPMS, Lunarand Planetary Science Conference, vol. XXXVI, 2005, p. 2123.
[23] H. Nagahara, K. Ozawa, Evaporation of forsterite in H2 gas,Geochim. Cosmochim. Acta 60 (1996) 1445–1459.
[24] J.I. Simon, E.D. Young, S.S. Russell, E.K. Tonui, K.A. Dyl, C.E.Manning, A short timescale for changing oxygen fugacity in thesolar nebula revealed by high-resolution 26Al–26Mg dating ofCAI rims, Earth Planet. Sci. Lett. 238 (3–4) (2005) 272–283.
[25] E.D. Young, S.S. Russell, R.D. Ash, Ultraviolet laer ablationmeasurements of oxygen isotope ratios in a Leoville compact typeA CAI, Lunar and Planetary Science Conference, vol. XXXI,2000, p. 1873, abstr.
[26] E.M. Stolper, J.M. Paque, Crystallization sequences of Ca–Al-rich inclusions from Allende: the effects of cooling rate andmaximum temperature, Geochim. Cosmochim. Acta 50 (1986)1785–1806.
[27] H.S. Carslaw, J.C. Jaeger, Conduction of Heat in Solids, OxfordUniversity Press, New York, 1959 510 pp.
[28] M.Morioka, H. Nagasawa,Diffusion in single crystals of melilite:II. Cations, Geochim. Cosmochim. Acta 55 (1991) 751–759.
[29] A.M. Davis, A. Hashimoto, R.N. Clayton, T.K. Mayeda, Isotopemass fractionation during evaporation of Mg2SiO4, Nature 347(1990) 655–658.
[30] S.J. Desch, H.C. Connolly, A model of the thermal processing ofparticles in solar nebula shocks: Applications to the cooling rateof chondrules, Meteoritics 37 (2002) 183–202.
[31] A.P. Boss, Evolution of the solar nebula III. Protoplanetary disksundergoing mass accretion, Astrophys. J. 469 (1996) 906–920.
[32] F.H. Shu, H. Shang, M. Gounelle, A.F. Glassgold, T. Lee, Theorigin of chondrules and refractory inclusions in chondriticmeteorites, Astrophys. J. 548 (2001) 1029–1050.
[33] F.H. Shu, H. Shang, T. Lee, Toward an astrophysical theory ofchondrites, Science 271 (1996) 1545–1552.
[34] S.J. Weidenschilling, Radial drift of particles in the solar nebula:implications for planetesimal formation, Icarus 165 (2003) 438–442.
510 A. Shahar, E.D. Young / Earth and Planetary Science Letters 257 (2007) 497–510


![Author's personal copy - MITweb.mit.edu/nnf/publications/GHM145.pdfAuthor's personal copy completion in the reaction solution[8]. Indeed, we observed unreactedamino groupsin the polymer](https://img.pdfslide.us/doc/110x75/5e355eb1bb6d1a06f11a264c/authors-personal-copy-authors-personal-copy-completion-in-the-reaction-solution8.jpg)