Embed Size (px)
Citation preview
This article appeared in a journal published by Elsevier. The attachedcopy is furnished to the author for internal non-commercial researchand education use, including for instruction at the authors institution
and sharing with colleagues.
Other uses, including reproduction and distribution, or selling orlicensing copies, or posting to personal, institutional or third party
websites are prohibited.
In most cases authors are permitted to post their version of thearticle (e.g. in Word or Tex form) to their personal website orinstitutional repository. Authors requiring further information
regarding Elsevier’s archiving and manuscript policies areencouraged to visit:
http://www.elsevier.com/authorsrights
Author's personal copy
Strength prediction and reliability of brittle epoxy adhesively bondeddissimilar joint
Mohd Afendi a,n, M.S. Abdul Majid a, Ruslizam Daud a, A. Abdul Rahman b, Tokuo Teramoto c
a School of Mechatronic Engineering, Universiti Malaysia Perlis, Arau 02600, Perlis, Malaysiab PETRONAS Chemical Fertiliser Kedah Sdn. Bhd., Km 3, Jalan Jeniang, Gurun 08300, Kedah, Malaysiac Graduate School of Systems and Information Engineering, University of Tsukuba, Tennoudai 1-1-1, Tsukuba, Ibaraki 305-8573, Japan
a r t i c l e i n f o
Article history:Accepted 11 March 2013Available online 27 March 2013
Keywords:Bond thicknessSingularityDissimilar adherendsInterface mechanicsPredictionReliability
a b s t r a c t
This paper deals with strength and failure prediction as well as reliability issues of adhesive joints ofbrittle epoxy bonding of two dissimilar adherends. Effects of bond thickness and scarf angle upon thestrength of such joints are also addressed. Three kinds of adhesive joints, i.e., butt, scarf and shear joints,are considered. It is found that the strength prediction of various adhesive joints under consideration canbe done by establishing interface corner toughness, Hc, parameter. For adhesive joints with an interfacialcrack, fracture toughness, Jc, or interfacial toughness, Kc, can be used as a fracture criterion depending onthe fracture type observed. The predicted strengths based on these fracture criteria (i.e., Hc, Jc and Kc) arein good agreement with experimental data obtained. Weibull modulus is a suitable parameter to definethe strength reliability of adhesive joints. From experimental data, scarf joint of 451 is identified to bepreferable since it satisfies both outstanding load-bearing performance and tolerable reliability. Inaddition, the Weibull statistical method has made possible the strength reliability determination of non-cracked adhesive joints.
& 2013 Elsevier Ltd. All rights reserved.
1. Introduction
Integrity and reliability of adhesive joints are very crucial instructural engineering and industrial applications. Therefore,destructive testing and stress analyses are essential in predictingthe performance of adhesive joints. In general, strength and failurepredictions of adhesive joints are either based on strength ofmaterials or the fracture mechanics approach [1]. Nevertheless,these predictions remain tolerably difficult due to lack of sufficientcriteria with sound physical basis [2,3]. In the case of adhesive jointsbonded with relatively rigid brittle adhesive resin, so far, there issome evidence that presents the relation between strength andbond thickness of such joints can be satisfactorily estimated bymeans of stress singularity based fracture parameters, i.e., interfacecorner toughness, Hc, or critical fracture energy, Gc.
Some investigators validated experimentally the Hc stressintensity factor parameter. For instance, Reedy and Guess [4]accurately predicted the dependence of cylindrical butt joint'sstrength upon the bond thickness by using Hc approach. They alsoreported the difference of measured strength between joints withsteel-steel and aluminium–aluminium adherends. This “adher-end's stiffness effect” has been correlated to the difference in
order of stress singularity at the interface corner. Further, Reedy[5] examined the connexion between interface corner and inter-face fracture mechanics approaches using both asymptotic andfinite element solutions. The applicability of both techniques to theproblem of unstable failure which initiates from an interfacecorner has been validated.
In another study, Akisanya and Meng [6] used their experi-mental results to support the application of Hc as a fractureinitiation criterion at the interface corner of bonded joints. Usingelastic-plastic finite element analysis, they concluded that in orderfor Hc to be applicable, failure process zone (i.e. or plastic zone)should be fully embedded within the region over which thesingularity dominates the stress field. Qian and Akisanya [7]reported the tensile strength prediction of scarf joints subjectedto a combination of mechanical and thermal loading by Hc fracturecriterion with a good accuracy. This study led to a better under-standing of failure mechanisms and influences of joint geometryand cure temperature.
Most recently, Mintzas and Nowell have applied Hc fracturecriterion for predicting the strength of adhesively bonded butt,scarf and double lap joints [8]. To predict the strength of thesejoints, they employed asymptotic stress analysis combined with apath independent contour integral method. They reported that thepredicted joint strengths are comparable to those experimentalresults found in the literatures. The conditions under which this Hc
fracture criterion is valid are also discussed.
Contents lists available at SciVerse ScienceDirect
journal homepage: www.elsevier.com/locate/ijadhadh
International Journal of Adhesion & Adhesives
0143-7496/$ - see front matter & 2013 Elsevier Ltd. All rights reserved.http://dx.doi.org/10.1016/j.ijadhadh.2013.03.008
n Corresponding author. Tel.: +604 988 5162; fax: +604 988 5167.E-mail address: [email protected] (M. Afendi).
International Journal of Adhesion & Adhesives 45 (2013) 21–31
Author's personal copy
With the progress of fracture mechanics methodology, manyresearchers have analysed the strain energy release rate (SERR) orstress intensity factor (SIF) to predict the strength and growth of acracked adhesive joint. This approach is actually a complementaryapproach to that of stress magnitude and distribution analysis.However, the stress intensity factor of adhesive joint is not easilydeterminable when the crack grows at or near to an interfacebecause it exhibits oscillatory singularity behaviour so it hasindefinite value. Thus, many studies dealing with adhesive jointstends to use SERR instead of SIF [9]. It was reported that the Gc (i.e.,critical SERR) can be employed as a mixed mode fracture criterion[10]. There are many techniques available that can be used todetermine the SERR in finite element (FE) analysis, e.g. J integral,virtual crack closure, virtual crack extension and stiffness deriva-tive. Rice's J integral, which is the most popular, has been widelyused to predict the strength of adhesive joints having a crack withfairly good results [9,11].
Reliability analysis is crucially required in engineering safetydesign, especially in the strength prediction of brittle materials;ceramic components, rock, timber, etc. Based on recent interest inthis similar study, Weibull statistics based probability approachreceives increasing attention and appears to be the most widelyused in practice. More recently, Weibull strength distributionapproach has been proven by some researchers to be the mostpromising failure criterion and also as an effective reliabilityindicator for joints bonded with brittle adhesive [12–14]. Evenso, rather less work has been undertaken to facilitate the design ofadhesive joints. Some investigations are briefly reviewed below.
Seo and Lim [12] have investigated experimentally the values oftensile, four-point bending and shear strength using thermoset-ting epoxy resin based adhesively bonded butt joints. Theyreported in their study, the effects of adhesive sectional area(i.e., 2�3, 3�4, 4�5 and 5�6 mm2) and compared the abovementioned test methods in terms of joint strength, standarddeviation and Weibull modulus, m. It was observed that strengthfor tensile and four-point bending specimens decreases withincreasing adhesive sectional area. They concluded that specimenwith adhesive sectional area of 5�6 mm2 has the highest strengthprobability in the tensile and shear tests, while in the four-pointbending test is 3�4 mm2. Besides, shear specimen is least affectedby the adhesive sectional area if compared to other test methodsand yet has similar strength probability to those in the tensilespecimens.
Arenas et al. [13] proposed the use of a statistical analysis basedon Weibull distribution to define an optimum bond thickness thatcombines the best mechanical performance (i.e., shear tensilestrength) with high reliability. In their experimental study, theyapplied acrylic adhesive to manufacture the single lap joint with6160 aluminium alloy adherend. As a result, the optimum bondthickness for their single lap joint was reported as 0.5 mm.
Vallée et al. [14] have developed a probabilistic method basedon Weibull statistical distribution for the strength prediction ofbalanced adhesively bonded double lap joints composed of pul-truded GFRP adherends. They also presented a short reviewregarding the size effects on strength of materials and FRPcomposites.
Hadj-Ahmed et al. [3] proposed a strength probability law topredict the shear strength of a double lap adhesive joint throughanalytical and numerical investigations. They related the influenceof both bond thickness and overlap length upon joint strength tothe Weibull modulus, m. The adhesive behaviour varies in accor-dance to the m value (i.e., m≤3.2; low, 3.2≤m≤5; intermediate orm≥5; and high dispersion). They pointed out that optimal bondthickness becomes more pronounced particularly when m is inintermediate dispersion (i.e., relatively ductile) model. The exis-tence of an optimal bond thickness can be attributed to
competition between “number of defects” and stress concentra-tion effects. In the case of overlap length, they have reported thatdispersion character of adhesive does not influence the depen-dence of joint strength on the overlap length, and adhesive jointdisplays nearly same “limit overlap length”.
Burrow et al. [15] used Weibull analysis to determine thereliability of data from bond strengths to dentin measurementsas well as tensile tests on resin-based dental restorative materials.With the help of Weibull analysis, they have: (i) determinedwhether or not the test method has a significant effect on bondtest results, (ii) obtained the information related to the overallperformance of an adhesive material, and (iii) theoretically mod-elled the behaviour of materials systems in dental restorations.
In this paper, the authors are concerned with the prediction ofmechanical performance and failure characteristics of adhesivejoints of dissimilar adherends bonded with relatively brittleadhesive. The authors have also employed the reliability analysisof strength of these joints based upon the statistical Weibullanalysis of strength distribution. The effects of stress singularityat the interface corner and scale sensitivity upon strength andfailure of brittle adhesive joints will be discussed.
2. Stress singularity based strength prediction
2.1. Hc parameter
Most recently, much attention has been paid to the validationof interface corner failure criterion. Consider an adhesive jointbody within linear elasticity context behaviour. When the body issubjected to a remote uniaxial load, the asymptotic stress fielddevelops at the vicinity of interface corners and exhibits singular-ity behaviour in the form of [16]:
s≈Hr−λ ð1Þwhere s is the stress, r is distance from the interface corner, H isintensity of stress singularity and λ is order of stress singularity.The H failure criterion has been originally proposed by Groth [17]and is analogous to the linear elastic fracture mechanics (LEFM)concept, where it is associated with the discontinuity at theinterface corner instead of crack. Failure is assumed to initiate atthe interface corner when H exceeds the critical value, Hc.
In order for Hc to be a valid failure criterion, any plasticity (i.e.,non-linear deformation or failure process zone) must be confinedto a small singularity region at the interface corner: conditionreferred to as small scale yielding theory in LEFM. There arealready some experimental evidences, which emphasised that Hc
and λ parameters can be effectively used to successfully predict theonset of failure and eventually evaluate the relationship betweenbond thickness and adherend stiffness, and the strength of certainadhesively-bonded butt and scarf joints [4,18,19]. Hence, theevaluation of λ in such adhesive joints is of technical importance,and this can be fulfilled via adopting the calculation method asperformed by Bogy [20]. In this study, the calculation of λ at aninterface corner of a bi-material joint was carried out analyticallyby using Fortran PowerStation 4.0 software (i.e., see Appendix A).The results will be discussed in the following section.
2.2. Jc parameter
Hc parameter which has been explained in the previoussubsection is suitable to the problem of adhesive joint withoutdefect. However, for adhesive joint with intrinsic or artificialinterfacial crack the application of fracture toughness, Jc parameteras a fracture is seemed to be appropriate. This fracture criterionparameter has the non-dimensional form of a combination of
M. Afendi et al. / International Journal of Adhesion & Adhesives 45 (2013) 21–3122
Author's personal copy
parameters as follows [21,22]:
ϕ2 at
h i¼ E−adhJc
s2c tð2Þ
where ϕ is a function to be determined, a is the crack length, t isbond thickness and E−adh ¼ Eadh=ð1−ν2c Þ is the plane strain Young'smodulus of adhesive layer. Therefore, if one knows the fracturetoughness of a particular adhesive joint which is independent of t,one may predict critical fracture stress, sc of the said adhesivejoint. The critical fracture stress of an adhesive joint with a defectcan be derived as:
sc ¼ffiffiffiffiffiffiffiffiffiffiffiffiffiffiffiE�adhJcϕ2t
sð3Þ
Fracture toughness can be evaluated by J integral calculation inFE analysis. For a nonlinear elastic body containing a crack in 2Dproblem, the J integral is given by [11]:
J ¼ZΓ
Wdy−Ti∂ui
∂xds
� �ð4Þ
where ui is the displacement vector component and ds is thelength increment along an arbitrary counterclockwise contour Γaround the crack-tip. The strain energy density is defined by
W ¼WðεijÞ ¼Z εij
0sijdεij ð5Þ
where sij and εij are the stress and strain tensors, respectively. Thecomponents of traction vector are given by
Ti ¼ sijnj ð6Þwhere nj is the components of the unit vector normal to Γ.
To evaluate J integral of FE model, series of ANSYS commandsfor J contour integration formulation were saved in a macro file.After FE analysis solution was converged, a set of circular contoursaround the crack-tip was defined. The radius of contours weredefined as 0.25a, 0.5a, 0.75a and a, where a is the crack length. Themacro file was then executed at each pre-determined circularcontour and the corresponding J value has been recorded. Thus,J was taken as an average value from a set of J values obtained ateach execution. Refer to Appendix B for macro of J integral inANSYS. Calibration of J value is needed beforehand because theactual bond thickness in a specimen might be varied from thetargeted value.
3. Weibull statistical strength distribution
When the failure of material is sensitive to the nature anddistribution of flaws or defects within the specimens, this materialstrength will exhibit a scale sensitivity or size effect. This sizeeffect is indeed based on weakest link theory and thus the severitylevel of defects will determine the variability of failure load. Thelarger the specimen is, the higher the severity level is and thelower the strength of corresponding sample will be. The size effecton the material strength is adequately explained by statisticalprobability theories such as Weibull strength distribution theory.Two types of Weibull statistical distribution are available: two-parameter and three-paramater. Due to its simplicity, in this study,the authors have chosen two-parameter Weibull distribution (i.e.,shape and scale parameters) to represent the strength probabil-ities of adhesive joint. As originally proposed by Weibull [23], thecumulative probability of failure, Pf in the simplified form can beexpressed by:
Pf ¼ 1−exp −ss0
� �m� �ð7Þ
where m and s0 are shape and scale parameters, respectively. m isconveniently referred to as the Weibull modulus. These twoparameters can be determined by several means; however, thelinear regression method is more straightforward. Furthermore, ifone takes double natural logarithms for Eq. (4), one may consideranother empirical equation:
Y ¼ ln ln1
1−Pf
� �¼mln s−mlns0 ð8Þ
Thus,m can be readily obtained directly from the slope of plot Yagainst ln s. The Pf can be calculated by experimentally testing anumber (n) of specimens, and then ranking the measuredstrengths in ascending order [12]. In literature, Pf is often definedby using several estimators [24], and the most established to beused is the following equation [12,15,25]:
Pf−1 ¼i
nþ 1ð9Þ
in which i is the ranking of the failure stress and n is total numberof tested specimens.
4. Experimental procedures
Epoxy adhesive resin used in this study was Hi-Super 30produced by Cemedine Co., Japan. General information regardingmaterial properties of this adhesive are tabulated in Table 1. Theadhesive was prepared prior to bonding by mixing thoroughlyepoxy resin and hardener inside a 12 mL ointment container at 1:1ratio (i.e., 3.5 g each) using a centrifugal conditioning mixer.Schedule of diffusion and de-foaming were 1 min and 3 min,respectively. Cure state was at room temperature (R.T.) for over24 h. Adherends consisted of SUS304 stainless steel and YH75aluminium alloy. Mechanical properties of adhesive and adher-ends are given in Table 2.
To investigate strength and failure behaviour of adhesive joints,butt, scarf and shear joint specimens were prepared and its
Table 1Material properties of adhesive used in this study.z
Property High-super30
Viscosity (Pa s; 23 1C) Epoxy 70Hardener 160
Density (g/cm3) Epoxy 1.17Hardener 1.14
Curing time (min) 30Mature bonding time (h) 1Tensile shear strength (N/mm2)a 17.5T-peel strength (N/mm)b 0.47Hardness (Shore-D) 82Linear expansion coefficient (�10−5) 67Glass transition temperature (1C) 43Volume resistivity (Ω cm) 3.8�1011
Water absorption (%) 2.3
z Manufacturer's catalogue.a JIS K6850.b JIS K6854.
Table 2Mechanical properties of materials.
Material E (GPa) sy (MPa) υ
Epoxy adhesive 3.4 36.5 0.396SUS304a 206 307.8 0.3YH75 (Al-alloy)a 71 559.0 0.33
a Data taken from manufacturer's catalogue.
M. Afendi et al. / International Journal of Adhesion & Adhesives 45 (2013) 21–31 23
Author's personal copy
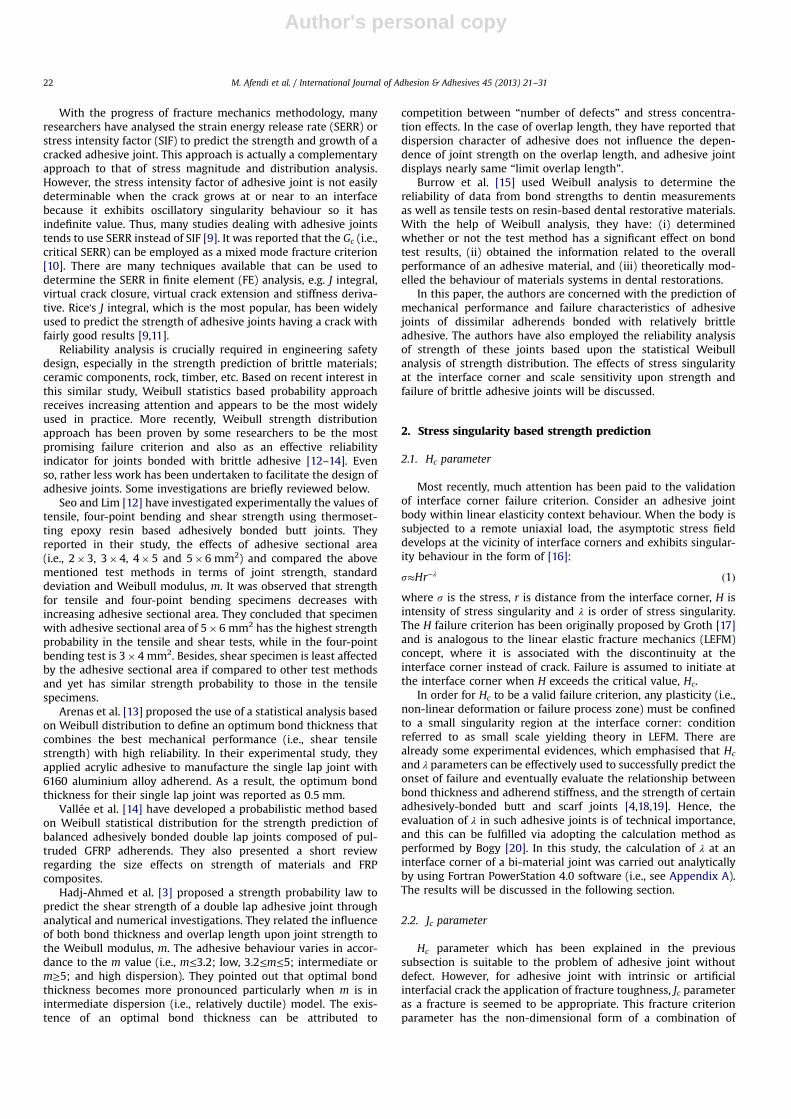
configuration and dimensions are shown in Fig. 1. Prior to bond-ing, bonding surfaces were uniformly polished with # 2000waterproof abrasive paper and afterward degreased with acetone.Adhesive bond thickness, t inside a specimen was controlled byusing a specially developed fixture and varied between 0.1 mmand 1.2 mm (i.e., Series A). For Series A, three specimens wereprepared at each bond thickness. Other 10 specimens having only0.1 mm bond thickness were also prepared (i.e., Series B). Afterspecimens were totally cured, the excessive adhesive was carefullyremoved by a portable grinder and curving knife. Then, actualbond thickness of each specimen was measured by a digitalmicroscope.
For specimens with interfacial crack, an interfacial crack whichoriginated from an interface corner was inserted to represent astraight flaw at adhesive joints interface. This pre-crack wasintroduced by pasting a strip of 0.05 mm thick Teflon tape onthe edge of adherend surface prior to bonding. Ratio a/W isconstant at 1/8, where a is interface pre-crack length and W isthe specimen width.
Failure tensile tests of adhesive joint specimens were carriedout by a universal testing machine (INSTRON 4206). All specimenswere tested at R.T. with the crosshead speed held constant at0.5 mm/min.
5. Results and discussion
5.1. Strength and failure prediction
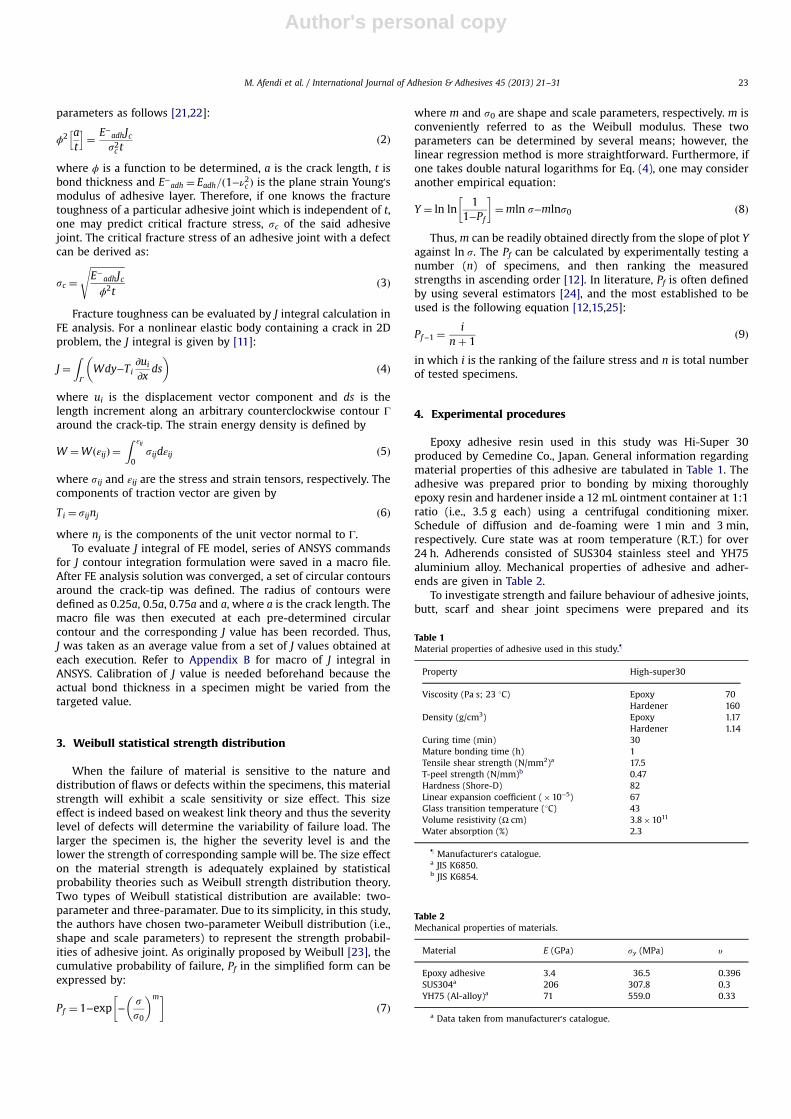
5.1.1. Non-cracked adhesive jointFig. 2 shows the load versus crosshead displacement of various
adhesive joints tested under tension or shear force in this study.
This figure only shows the representative results obtained fromadhesive joint specimens having (a) 0.1 mm, and (b) 1.0 mm bondthickness (i.e., part of Series A). It is noted that the failure load ofscarf joints specimen decreases with increasing scarf angle. Shearjoint specimen shows the lowest failure load. In all specimens,load increases gradually with displacement until sudden failureoccurs. Very similar trends have also been found on other speci-mens having bond thickness between 0.1 mm and 1.2 mm.
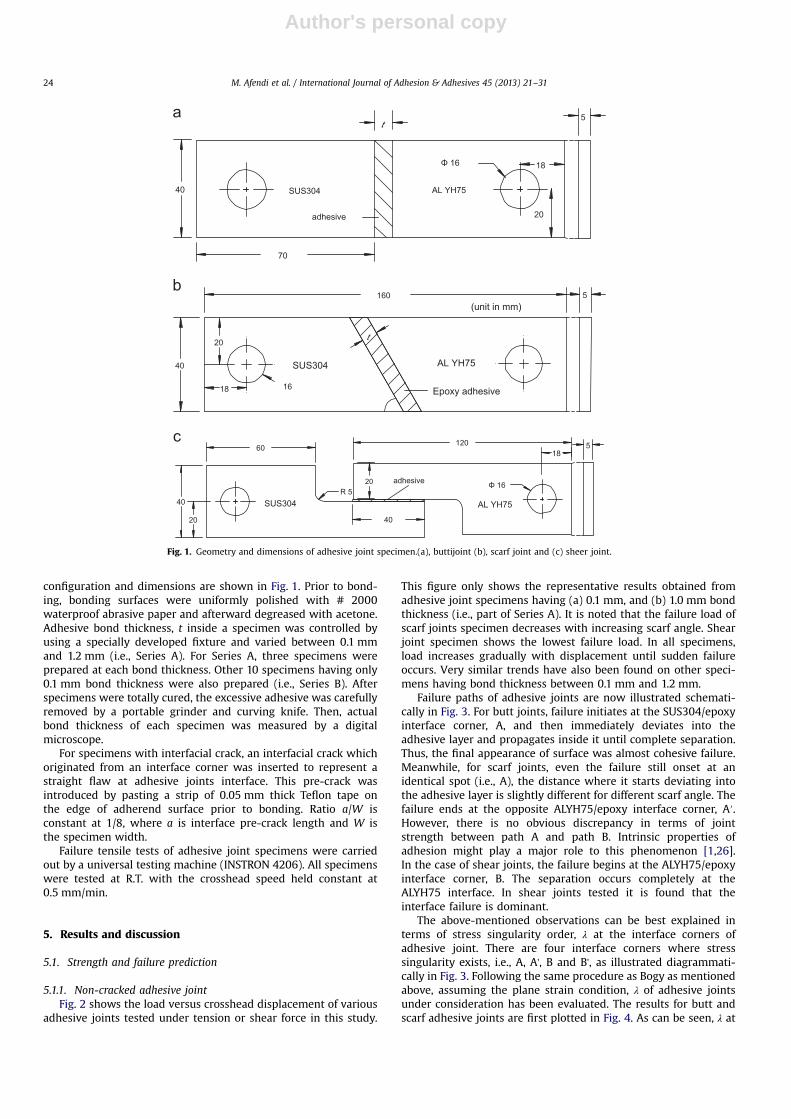
Failure paths of adhesive joints are now illustrated schemati-cally in Fig. 3. For butt joints, failure initiates at the SUS304/epoxyinterface corner, A, and then immediately deviates into theadhesive layer and propagates inside it until complete separation.Thus, the final appearance of surface was almost cohesive failure.Meanwhile, for scarf joints, even the failure still onset at anidentical spot (i.e., A), the distance where it starts deviating intothe adhesive layer is slightly different for different scarf angle. Thefailure ends at the opposite ALYH75/epoxy interface corner, A′.However, there is no obvious discrepancy in terms of jointstrength between path A and path B. Intrinsic properties ofadhesion might play a major role to this phenomenon [1,26].In the case of shear joints, the failure begins at the ALYH75/epoxyinterface corner, B. The separation occurs completely at theALYH75 interface. In shear joints tested it is found that theinterface failure is dominant.
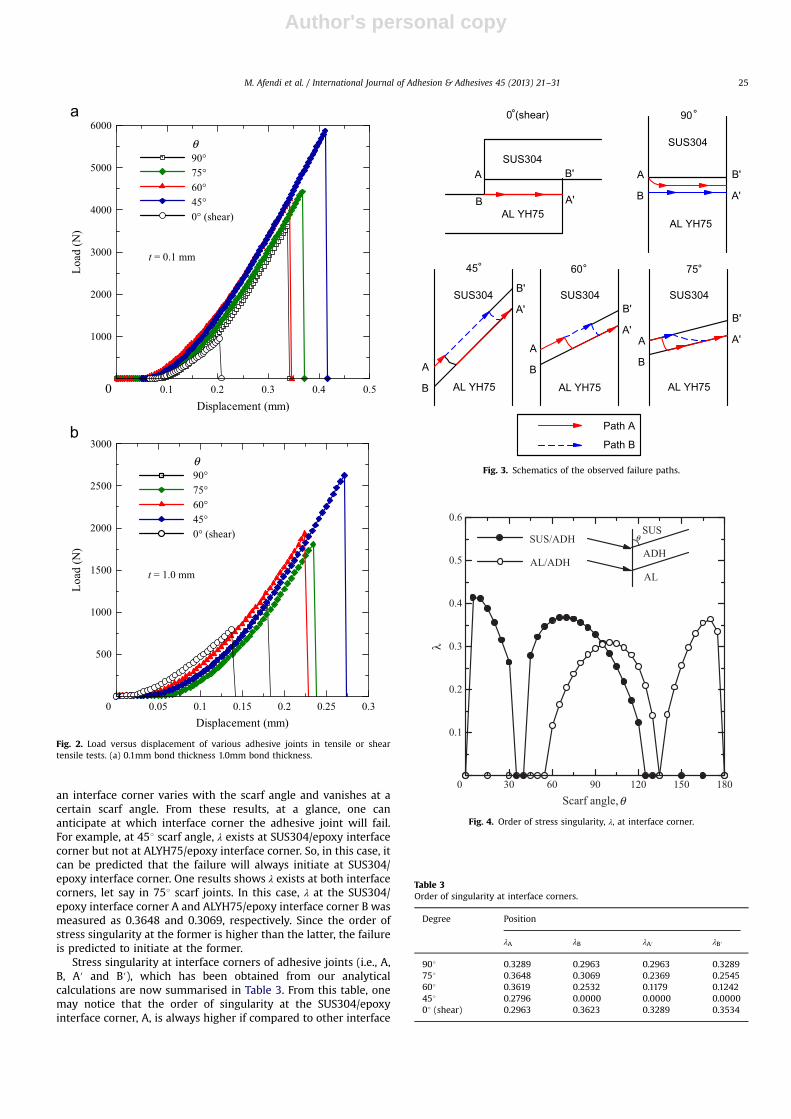
The above-mentioned observations can be best explained interms of stress singularity order, λ at the interface corners ofadhesive joint. There are four interface corners where stresssingularity exists, i.e., A, A', B and B', as illustrated diagrammati-cally in Fig. 3. Following the same procedure as Bogy as mentionedabove, assuming the plane strain condition, λ of adhesive jointsunder consideration has been evaluated. The results for butt andscarf adhesive joints are first plotted in Fig. 4. As can be seen, λ at
Fig. 1. Geometry and dimensions of adhesive joint specimen.(a), buttijoint (b), scarf joint and (c) sheer joint.
M. Afendi et al. / International Journal of Adhesion & Adhesives 45 (2013) 21–3124
Author's personal copy
an interface corner varies with the scarf angle and vanishes at acertain scarf angle. From these results, at a glance, one cananticipate at which interface corner the adhesive joint will fail.For example, at 451 scarf angle, λ exists at SUS304/epoxy interfacecorner but not at ALYH75/epoxy interface corner. So, in this case, itcan be predicted that the failure will always initiate at SUS304/epoxy interface corner. One results shows λ exists at both interfacecorners, let say in 751 scarf joints. In this case, λ at the SUS304/epoxy interface corner A and ALYH75/epoxy interface corner B wasmeasured as 0.3648 and 0.3069, respectively. Since the order ofstress singularity at the former is higher than the latter, the failureis predicted to initiate at the former.
Stress singularity at interface corners of adhesive joints (i.e., A,B, A′ and B′), which has been obtained from our analyticalcalculations are now summarised in Table 3. From this table, onemay notice that the order of singularity at the SUS304/epoxyinterface corner, A, is always higher if compared to other interface
90°75°60°45°0° (shear)
Displacement (mm)
Load
(N)
t = 0.1 mm
0 0.1 0.2 0.3 0.4 0.5
1000
2000
3000
4000
5000
6000
Displacement (mm)
Load
(N)
t = 1.0 mm
0 0.05 0.1 0.15 0.2 0.25 0.3
500
1000
1500
2000
2500
3000
θ
90°75°60°45°0° (shear)
θ
Fig. 2. Load versus displacement of various adhesive joints in tensile or sheartensile tests. (a) 0.1mm bond thickness 1.0mm bond thickness.
45 60 75
SUS304
AL YH75
SUS304 SUS304
AL YH75 AL YH75
Path A
Path B
A
B
A
B
A
B
B'
A' B'
A'B'
A'
90
SUS304SUS304
°
A
B
B'
A'
0 (shear)
AL YH75
A
B
B'
A'
AL YH75
°
° ° °
Fig. 3. Schematics of the observed failure paths.
SUS/ADH
AL/ADH
SUS
ADH
AL
0 30 60 90 120 150 180
0.1
0.2
0.3
0.4
0.5
0.6
Scarf angle,θ
θ
λ
Fig. 4. Order of stress singularity, λ, at interface corner.
Table 3Order of singularity at interface corners.
Degree Position
λA λB λA′ λB′
901 0.3289 0.2963 0.2963 0.3289751 0.3648 0.3069 0.2369 0.2545601 0.3619 0.2532 0.1179 0.1242451 0.2796 0.0000 0.0000 0.000001 (shear) 0.2963 0.3623 0.3289 0.3534
M. Afendi et al. / International Journal of Adhesion & Adhesives 45 (2013) 21–31 25
Author's personal copy
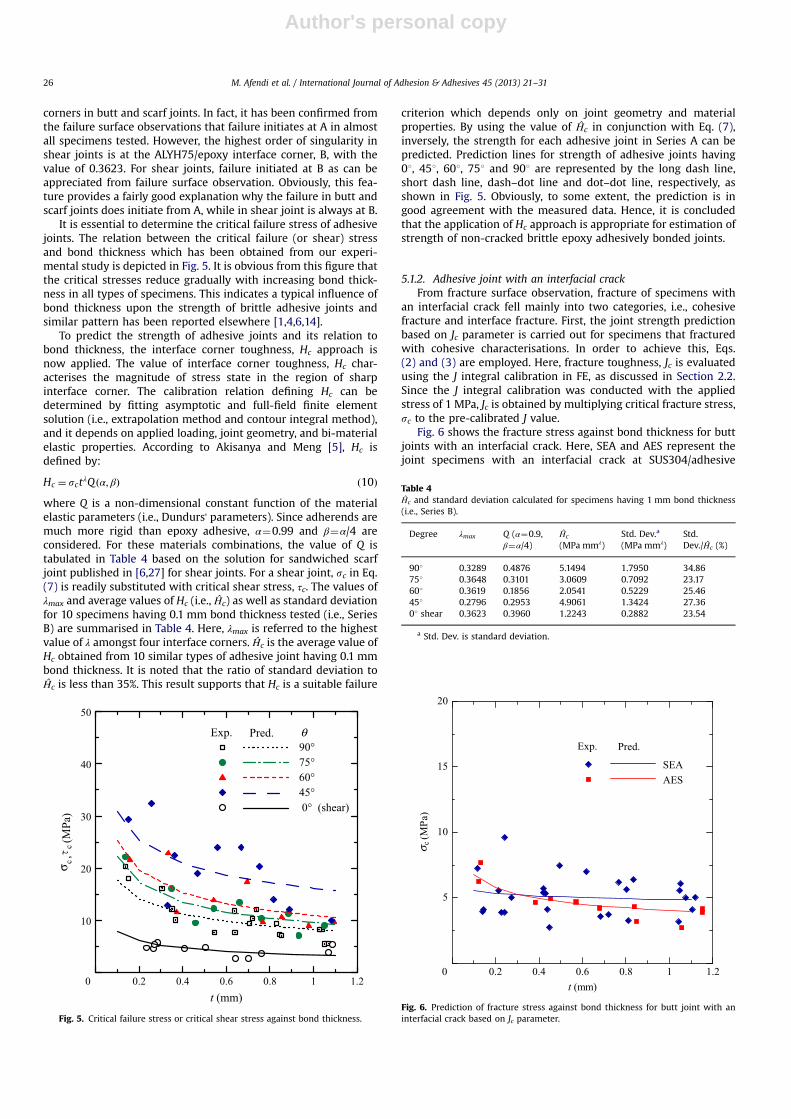
corners in butt and scarf joints. In fact, it has been confirmed fromthe failure surface observations that failure initiates at A in almostall specimens tested. However, the highest order of singularity inshear joints is at the ALYH75/epoxy interface corner, B, with thevalue of 0.3623. For shear joints, failure initiated at B as can beappreciated from failure surface observation. Obviously, this fea-ture provides a fairly good explanation why the failure in butt andscarf joints does initiate from A, while in shear joint is always at B.
It is essential to determine the critical failure stress of adhesivejoints. The relation between the critical failure (or shear) stressand bond thickness which has been obtained from our experi-mental study is depicted in Fig. 5. It is obvious from this figure thatthe critical stresses reduce gradually with increasing bond thick-ness in all types of specimens. This indicates a typical influence ofbond thickness upon the strength of brittle adhesive joints andsimilar pattern has been reported elsewhere [1,4,6,14].
To predict the strength of adhesive joints and its relation tobond thickness, the interface corner toughness, Hc approach isnow applied. The value of interface corner toughness, Hc char-acterises the magnitude of stress state in the region of sharpinterface corner. The calibration relation defining Hc can bedetermined by fitting asymptotic and full-field finite elementsolution (i.e., extrapolation method and contour integral method),and it depends on applied loading, joint geometry, and bi-materialelastic properties. According to Akisanya and Meng [5], Hc isdefined by:
Hc ¼ sctλQ ðα; βÞ ð10Þwhere Q is a non-dimensional constant function of the materialelastic parameters (i.e., Dundurs' parameters). Since adherends aremuch more rigid than epoxy adhesive, α¼0.99 and β¼α/4 areconsidered. For these materials combinations, the value of Q istabulated in Table 4 based on the solution for sandwiched scarfjoint published in [6,27] for shear joints. For a shear joint, sc in Eq.(7) is readily substituted with critical shear stress, τc. The values ofλmax and average values of Hc (i.e., Ĥc) as well as standard deviationfor 10 specimens having 0.1 mm bond thickness tested (i.e., SeriesB) are summarised in Table 4. Here, λmax is referred to the highestvalue of λ amongst four interface corners. Ĥc is the average value ofHc obtained from 10 similar types of adhesive joint having 0.1 mmbond thickness. It is noted that the ratio of standard deviation toĤc is less than 35%. This result supports that Hc is a suitable failure
criterion which depends only on joint geometry and materialproperties. By using the value of Ĥc in conjunction with Eq. (7),inversely, the strength for each adhesive joint in Series A can bepredicted. Prediction lines for strength of adhesive joints having01, 451, 601, 751 and 901 are represented by the long dash line,short dash line, dash–dot line and dot–dot line, respectively, asshown in Fig. 5. Obviously, to some extent, the prediction is ingood agreement with the measured data. Hence, it is concludedthat the application of Hc approach is appropriate for estimation ofstrength of non-cracked brittle epoxy adhesively bonded joints.
5.1.2. Adhesive joint with an interfacial crackFrom fracture surface observation, fracture of specimens with
an interfacial crack fell mainly into two categories, i.e., cohesivefracture and interface fracture. First, the joint strength predictionbased on Jc parameter is carried out for specimens that fracturedwith cohesive characterisations. In order to achieve this, Eqs.(2) and (3) are employed. Here, fracture toughness, Jc is evaluatedusing the J integral calibration in FE, as discussed in Section 2.2.Since the J integral calibration was conducted with the appliedstress of 1 MPa, Jc is obtained by multiplying critical fracture stress,sc to the pre-calibrated J value.
Fig. 6 shows the fracture stress against bond thickness for buttjoints with an interfacial crack. Here, SEA and AES represent thejoint specimens with an interfacial crack at SUS304/adhesive
t (mm)
90° 75° 60° 45° 0° (shear)
Exp. Pred.
0 0.2 0.4 0.6 0.8 1 1.2
10
20
30
40
50
c(M
Pa)
c,σ�
θ
Fig. 5. Critical failure stress or critical shear stress against bond thickness.
Table 4Ĥc and standard deviation calculated for specimens having 1 mm bond thickness(i.e., Series B).
Degree λmax Q (α¼0.9,β¼α/4)
Ĥc
(MPa mmλ)Std. Dev.a
(MPa mmλ)Std.Dev./Ĥc (%)
901 0.3289 0.4876 5.1494 1.7950 34.86751 0.3648 0.3101 3.0609 0.7092 23.17601 0.3619 0.1856 2.0541 0.5229 25.46451 0.2796 0.2953 4.9061 1.3424 27.3601 shear 0.3623 0.3960 1.2243 0.2882 23.54
a Std. Dev. is standard deviation.
t (mm)
Exp. Pred.
SEAAES
0 0.2 0.4 0.6 0.8 1 1.2
5
10
15
20
c(M
Pa)
σ
Fig. 6. Prediction of fracture stress against bond thickness for butt joint with aninterfacial crack based on Jc parameter.
M. Afendi et al. / International Journal of Adhesion & Adhesives 45 (2013) 21–3126
Author's personal copy
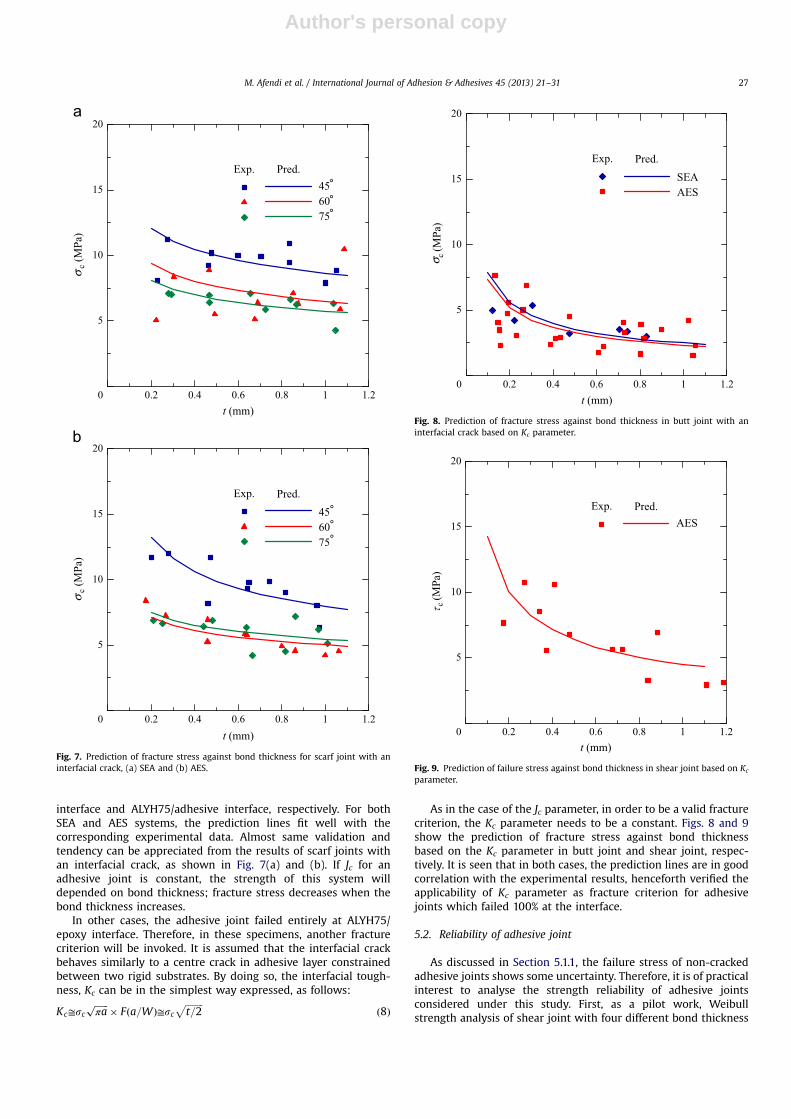
interface and ALYH75/adhesive interface, respectively. For bothSEA and AES systems, the prediction lines fit well with thecorresponding experimental data. Almost same validation andtendency can be appreciated from the results of scarf joints withan interfacial crack, as shown in Fig. 7(a) and (b). If Jc for anadhesive joint is constant, the strength of this system willdepended on bond thickness; fracture stress decreases when thebond thickness increases.
In other cases, the adhesive joint failed entirely at ALYH75/epoxy interface. Therefore, in these specimens, another fracturecriterion will be invoked. It is assumed that the interfacial crackbehaves similarly to a centre crack in adhesive layer constrainedbetween two rigid substrates. By doing so, the interfacial tough-ness, Kc can be in the simplest way expressed, as follows:
Kc≅scffiffiffiffiffiffiπa
p � Fða=WÞ≅scffiffiffiffiffiffiffiffit=2
pð8Þ
As in the case of the Jc parameter, in order to be a valid fracturecriterion, the Kc parameter needs to be a constant. Figs. 8 and 9show the prediction of fracture stress against bond thicknessbased on the Kc parameter in butt joint and shear joint, respec-tively. It is seen that in both cases, the prediction lines are in goodcorrelation with the experimental results, henceforth verified theapplicability of Kc parameter as fracture criterion for adhesivejoints which failed 100% at the interface.
5.2. Reliability of adhesive joint
As discussed in Section 5.1.1, the failure stress of non-crackedadhesive joints shows some uncertainty. Therefore, it is of practicalinterest to analyse the strength reliability of adhesive jointsconsidered under this study. First, as a pilot work, Weibullstrength analysis of shear joint with four different bond thickness
t (mm)
Exp. Pred.456075
0 0.2 0.4 0.6 0.8 1 1.2
5
10
15
20
Exp. Pred.456075
0 0.2 0.4 0.6 0.8 1 1.2
5
10
15
20
t (mm)
°°°
°°°
c (M
Pa)
σc (
MPa
)σ
Fig. 7. Prediction of fracture stress against bond thickness for scarf joint with aninterfacial crack, (a) SEA and (b) AES.
t (mm)
Exp. Pred.SEAAES
0 0.2 0.4 0.6 0.8 1 1.2
5
10
15
20
c (M
Pa)
σFig. 8. Prediction of fracture stress against bond thickness in butt joint with aninterfacial crack based on Kc parameter.
t (mm)
Exp. Pred.AES
0 0.2 0.4 0.6 0.8 1 1.2
5
10
15
20
c (M
Pa)
�
Fig. 9. Prediction of failure stress against bond thickness in shear joint based on Kc
parameter.
M. Afendi et al. / International Journal of Adhesion & Adhesives 45 (2013) 21–31 27
Author's personal copy
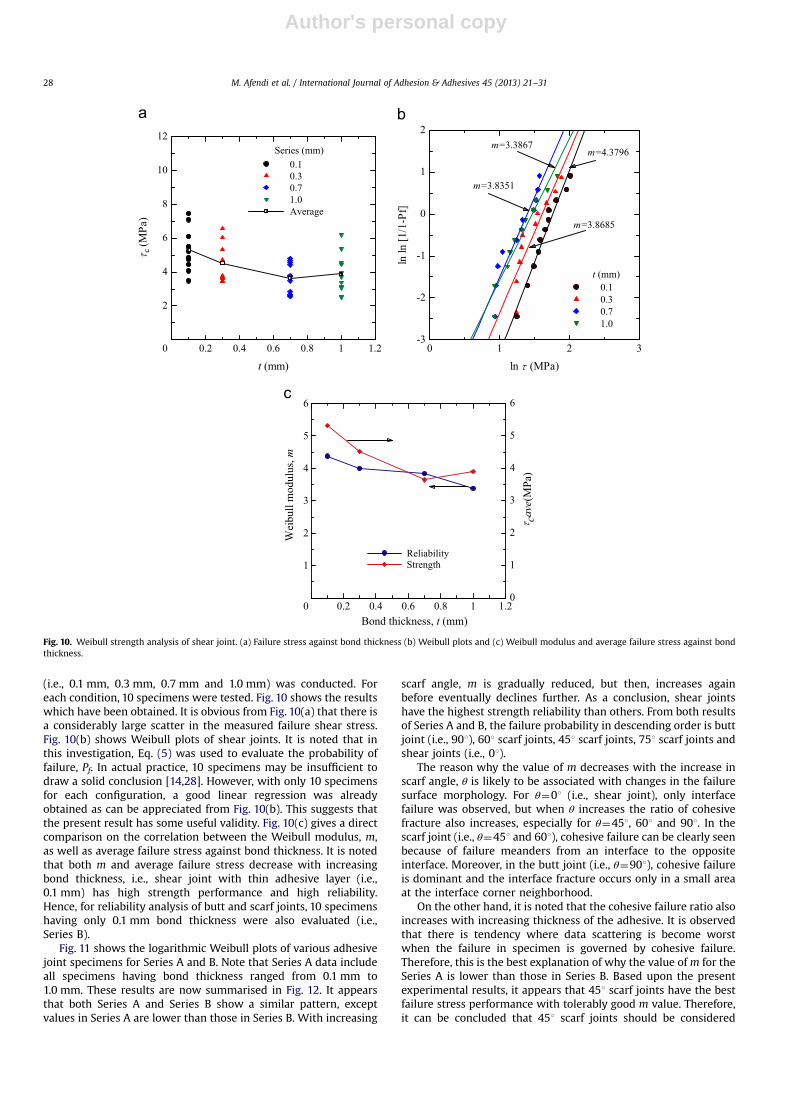
(i.e., 0.1 mm, 0.3 mm, 0.7 mm and 1.0 mm) was conducted. Foreach condition, 10 specimens were tested. Fig. 10 shows the resultswhich have been obtained. It is obvious from Fig. 10(a) that there isa considerably large scatter in the measured failure shear stress.Fig. 10(b) shows Weibull plots of shear joints. It is noted that inthis investigation, Eq. (5) was used to evaluate the probability offailure, Pf. In actual practice, 10 specimens may be insufficient todraw a solid conclusion [14,28]. However, with only 10 specimensfor each configuration, a good linear regression was alreadyobtained as can be appreciated from Fig. 10(b). This suggests thatthe present result has some useful validity. Fig. 10(c) gives a directcomparison on the correlation between the Weibull modulus, m,as well as average failure stress against bond thickness. It is notedthat both m and average failure stress decrease with increasingbond thickness, i.e., shear joint with thin adhesive layer (i.e.,0.1 mm) has high strength performance and high reliability.Hence, for reliability analysis of butt and scarf joints, 10 specimenshaving only 0.1 mm bond thickness were also evaluated (i.e.,Series B).
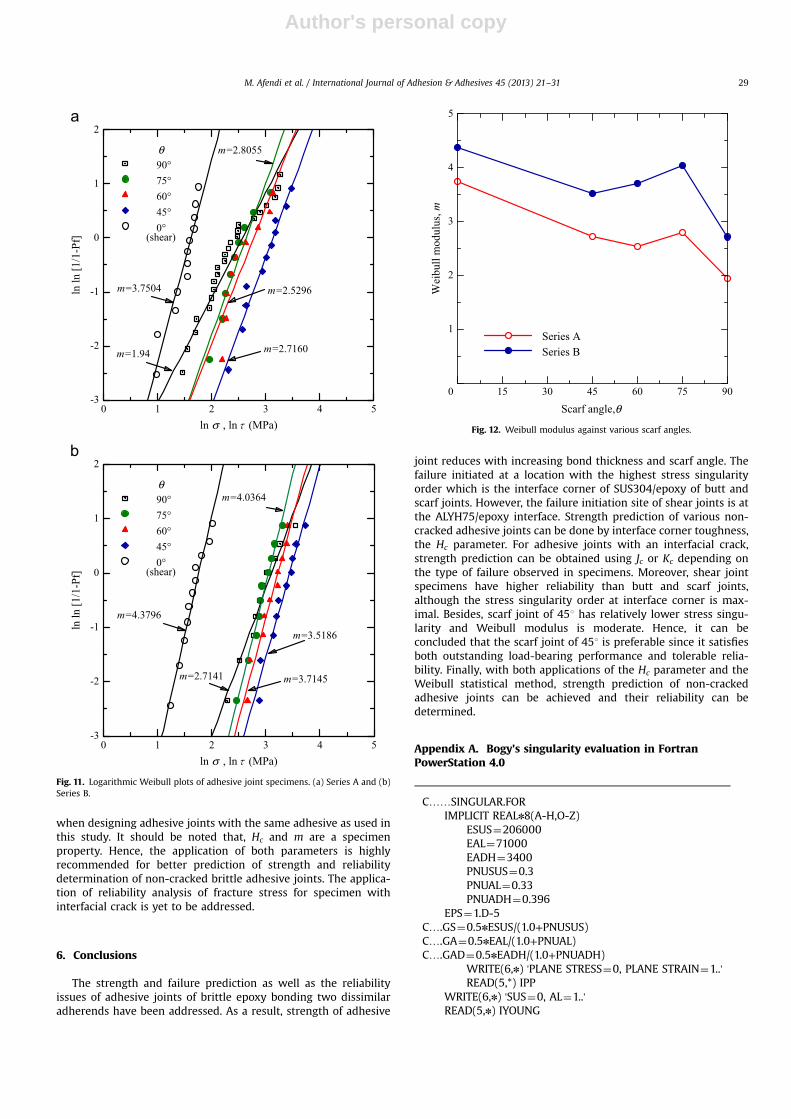
Fig. 11 shows the logarithmic Weibull plots of various adhesivejoint specimens for Series A and B. Note that Series A data includeall specimens having bond thickness ranged from 0.1 mm to1.0 mm. These results are now summarised in Fig. 12. It appearsthat both Series A and Series B show a similar pattern, exceptvalues in Series A are lower than those in Series B. With increasing
scarf angle, m is gradually reduced, but then, increases againbefore eventually declines further. As a conclusion, shear jointshave the highest strength reliability than others. From both resultsof Series A and B, the failure probability in descending order is buttjoint (i.e., 901), 601 scarf joints, 451 scarf joints, 751 scarf joints andshear joints (i.e., 01).
The reason why the value of m decreases with the increase inscarf angle, θ is likely to be associated with changes in the failuresurface morphology. For θ¼01 (i.e., shear joint), only interfacefailure was observed, but when θ increases the ratio of cohesivefracture also increases, especially for θ¼451, 601 and 901. In thescarf joint (i.e., θ¼451 and 601), cohesive failure can be clearly seenbecause of failure meanders from an interface to the oppositeinterface. Moreover, in the butt joint (i.e., θ¼901), cohesive failureis dominant and the interface fracture occurs only in a small areaat the interface corner neighborhood.
On the other hand, it is noted that the cohesive failure ratio alsoincreases with increasing thickness of the adhesive. It is observedthat there is tendency where data scattering is become worstwhen the failure in specimen is governed by cohesive failure.Therefore, this is the best explanation of why the value ofm for theSeries A is lower than those in Series B. Based upon the presentexperimental results, it appears that 451 scarf joints have the bestfailure stress performance with tolerably good m value. Therefore,it can be concluded that 451 scarf joints should be considered
ln ln
[1/1
-Pf]
0.10.30.71.0
t (mm)
m=4.3796m=3.3867
m=3.8685
m=3.8351
0 1 2 3-3
-2
-1
0
1
2
t (mm)
0.10.30.71.0Average
Series (mm)
0 0.2 0.4 0.6 0.8 1 1.2
2
4
6
8
10
12
Bond thickness, t (mm)
Wei
bull
mod
ulus
, m
ReliabilityStrength
0 0.2 0.4 0.6 0.8 1 1.2
1
2
3
4
5
6
0
1
2
3
4
5
6
cave
(MPa
)�
ln (MPa)�
c (M
Pa)
�
Fig. 10. Weibull strength analysis of shear joint. (a) Failure stress against bond thickness (b) Weibull plots and (c) Weibull modulus and average failure stress against bondthickness.
M. Afendi et al. / International Journal of Adhesion & Adhesives 45 (2013) 21–3128
Author's personal copy
when designing adhesive joints with the same adhesive as used inthis study. It should be noted that, Hc and m are a specimenproperty. Hence, the application of both parameters is highlyrecommended for better prediction of strength and reliabilitydetermination of non-cracked brittle adhesive joints. The applica-tion of reliability analysis of fracture stress for specimen withinterfacial crack is yet to be addressed.
6. Conclusions
The strength and failure prediction as well as the reliabilityissues of adhesive joints of brittle epoxy bonding two dissimilaradherends have been addressed. As a result, strength of adhesive
joint reduces with increasing bond thickness and scarf angle. Thefailure initiated at a location with the highest stress singularityorder which is the interface corner of SUS304/epoxy of butt andscarf joints. However, the failure initiation site of shear joints is atthe ALYH75/epoxy interface. Strength prediction of various non-cracked adhesive joints can be done by interface corner toughness,the Hc parameter. For adhesive joints with an interfacial crack,strength prediction can be obtained using Jc or Kc depending onthe type of failure observed in specimens. Moreover, shear jointspecimens have higher reliability than butt and scarf joints,although the stress singularity order at interface corner is max-imal. Besides, scarf joint of 451 has relatively lower stress singu-larity and Weibull modulus is moderate. Hence, it can beconcluded that the scarf joint of 451 is preferable since it satisfiesboth outstanding load-bearing performance and tolerable relia-bility. Finally, with both applications of the Hc parameter and theWeibull statistical method, strength prediction of non-crackedadhesive joints can be achieved and their reliability can bedetermined.
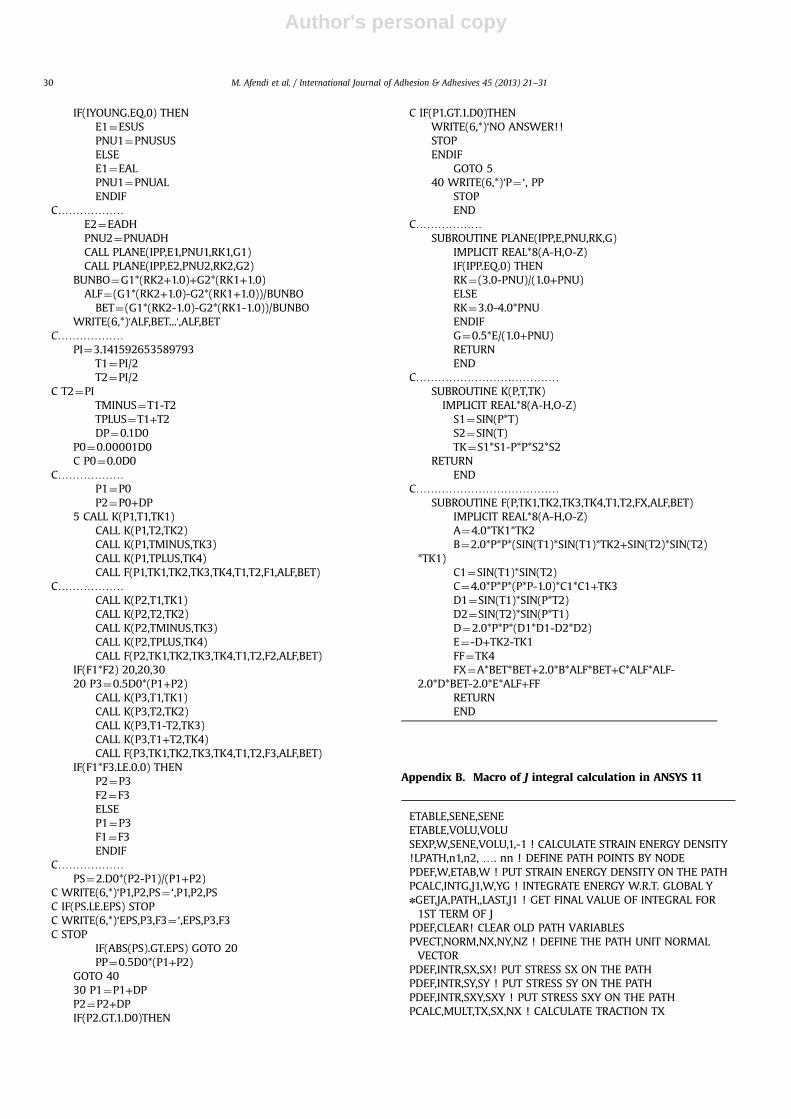
Appendix A. Bogy's singularity evaluation in FortranPowerStation 4.0
C……SINGULAR.FORIMPLICIT REALn8(A-H,O-Z)
ESUS¼206000EAL¼71000EADH¼3400PNUSUS¼0.3PNUAL¼0.33PNUADH¼0.396
EPS¼1.D-5C….GS¼0.5nESUS/(1.0+PNUSUS)C….GA¼0.5nEAL/(1.0+PNUAL)C….GAD¼0.5nEADH/(1.0+PNUADH)
WRITE(6,n) 'PLANE STRESS¼0, PLANE STRAIN¼1..'READ(5,*) IPP
WRITE(6,n) 'SUS¼0, AL¼1..'READ(5,n) IYOUNG
ln ln
[1/1
-Pf]
m=3.7504
m=2.8055
m=2.5296
m=2.7160m=1.94
0 1 2 3 4 5-3
-2
-1
0
1
2
ln ln
[1/1
-Pf]
90°75°60°45°0°
m=4.3796
m=4.0364
m=3.5186
m=3.7145m=2.7141
0 1 2 3 4 5-3
-2
-1
0
1
2
(shear)
ln , ln (MPa)σ �
θ
90°75°60°45°0°
(shear)
θ
ln , ln (MPa)σ �
Fig. 11. Logarithmic Weibull plots of adhesive joint specimens. (a) Series A and (b)Series B.
Series A Series B
Wei
bull
mod
ulus
, m
0 15 30 45 60 75 90
1
2
3
4
5
Scarf angle,θ
Fig. 12. Weibull modulus against various scarf angles.
M. Afendi et al. / International Journal of Adhesion & Adhesives 45 (2013) 21–31 29
Author's personal copy
IF(IYOUNG.EQ.0) THENE1¼ESUSPNU1¼PNUSUSELSEE1¼EALPNU1¼PNUALENDIF
C………………E2¼EADHPNU2¼PNUADHCALL PLANE(IPP,E1,PNU1,RK1,G1)CALL PLANE(IPP,E2,PNU2,RK2,G2)
BUNBO¼G1*(RK2+1.0)+G2*(RK1+1.0)ALF¼(G1*(RK2+1.0)-G2*(RK1+1.0))/BUNBO
BET¼(G1*(RK2-1.0)-G2*(RK1-1.0))/BUNBOWRITE(6,*)'ALF,BET...',ALF,BET
C………………PI¼3.141592653589793
T1¼PI/2T2¼PI/2
C T2¼PITMINUS¼T1-T2TPLUS¼T1+T2DP¼0.1D0
P0¼0.00001D0C P0¼0.0D0
C………………P1¼P0P2¼P0+DP
5 CALL K(P1,T1,TK1)CALL K(P1,T2,TK2)CALL K(P1,TMINUS,TK3)CALL K(P1,TPLUS,TK4)CALL F(P1,TK1,TK2,TK3,TK4,T1,T2,F1,ALF,BET)
C………………CALL K(P2,T1,TK1)CALL K(P2,T2,TK2)CALL K(P2,TMINUS,TK3)CALL K(P2,TPLUS,TK4)CALL F(P2,TK1,TK2,TK3,TK4,T1,T2,F2,ALF,BET)
IF(F1*F2) 20,20,3020 P3¼0.5D0*(P1+P2)
CALL K(P3,T1,TK1)CALL K(P3,T2,TK2)CALL K(P3,T1-T2,TK3)CALL K(P3,T1+T2,TK4)CALL F(P3,TK1,TK2,TK3,TK4,T1,T2,F3,ALF,BET)
IF(F1*F3.LE.0.0) THENP2¼P3F2¼F3ELSEP1¼P3F1¼F3ENDIF
C………………PS¼2.D0*(P2-P1)/(P1+P2)
C WRITE(6,*)‘P1,P2,PS¼ ‘,P1,P2,PSC IF(PS.LE.EPS) STOPC WRITE(6,*)‘EPS,P3,F3¼ ‘,EPS,P3,F3C STOP
IF(ABS(PS).GT.EPS) GOTO 20PP¼0.5D0*(P1+P2)
GOTO 4030 P1¼P1+DPP2¼P2+DPIF(P2.GT.1.D0)THEN
C IF(P1.GT.1.D0)THENWRITE(6,*)‘NO ANSWER!!STOPENDIF
GOTO 540 WRITE(6,*)‘P¼ ‘, PP
STOPEND
C………………SUBROUTINE PLANE(IPP,E,PNU,RK,G)
IMPLICIT REAL*8(A-H,O-Z)IF(IPP.EQ.0) THENRK¼(3.0-PNU)/(1.0+PNU)ELSERK¼3.0-4.0*PNUENDIFG¼0.5*E/(1.0+PNU)RETURNEND
C…………………………………SUBROUTINE K(P,T,TK)IMPLICIT REAL*8(A-H,O-Z)S1¼SIN(P*T)S2¼SIN(T)TK¼S1*S1-P*P*S2*S2
RETURNEND
C…………………………………SUBROUTINE F(P,TK1,TK2,TK3,TK4,T1,T2,FX,ALF,BET)
IMPLICIT REAL*8(A-H,O-Z)A¼4.0*TK1*TK2B¼2.0*P*P*(SIN(T1)*SIN(T1)*TK2+SIN(T2)*SIN(T2)
*TK1)C1¼SIN(T1)*SIN(T2)C¼4.0*P*P*(P*P-1.0)*C1*C1+TK3D1¼SIN(T1)*SIN(P*T2)D2¼SIN(T2)*SIN(P*T1)D¼2.0*P*P*(D1*D1-D2*D2)E¼-D+TK2-TK1FF¼TK4FX¼A*BET*BET+2.0*B*ALF*BET+C*ALF*ALF-
2.0*D*BET-2.0*E*ALF+FFRETURNEND
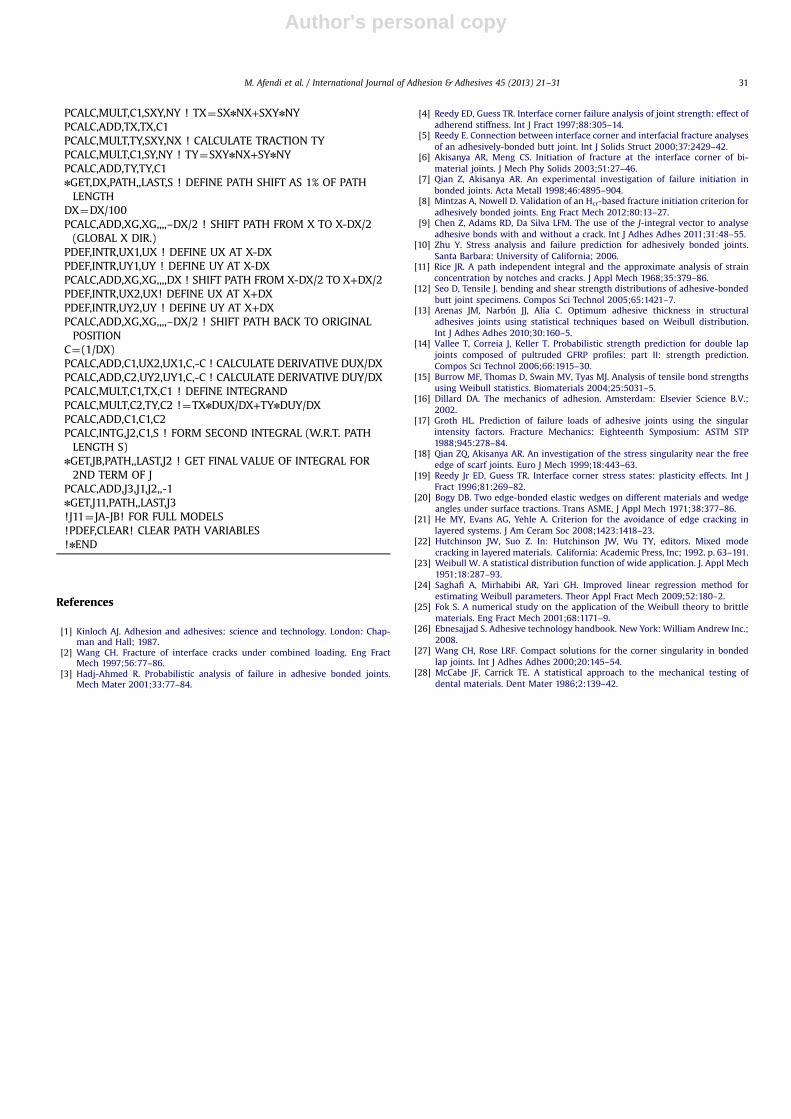
Appendix B. Macro of J integral calculation in ANSYS 11
ETABLE,SENE,SENEETABLE,VOLU,VOLUSEXP,W,SENE,VOLU,1,-1 ! CALCULATE STRAIN ENERGY DENSITY!LPATH,n1,n2, …. nn ! DEFINE PATH POINTS BY NODEPDEF,W,ETAB,W ! PUT STRAIN ENERGY DENSITY ON THE PATHPCALC,INTG,J1,W,YG ! INTEGRATE ENERGY W.R.T. GLOBAL YnGET,JA,PATH,,LAST,J1 ! GET FINAL VALUE OF INTEGRAL FOR1ST TERM OF J
PDEF,CLEAR! CLEAR OLD PATH VARIABLESPVECT,NORM,NX,NY,NZ ! DEFINE THE PATH UNIT NORMALVECTOR
PDEF,INTR,SX,SX! PUT STRESS SX ON THE PATHPDEF,INTR,SY,SY ! PUT STRESS SY ON THE PATHPDEF,INTR,SXY,SXY ! PUT STRESS SXY ON THE PATHPCALC,MULT,TX,SX,NX ! CALCULATE TRACTION TX
M. Afendi et al. / International Journal of Adhesion & Adhesives 45 (2013) 21–3130
Author's personal copy
PCALC,MULT,C1,SXY,NY ! TX¼SXnNX+SXYnNYPCALC,ADD,TX,TX,C1PCALC,MULT,TY,SXY,NX ! CALCULATE TRACTION TYPCALC,MULT,C1,SY,NY ! TY¼SXYnNX+SYnNYPCALC,ADD,TY,TY,C1nGET,DX,PATH,,LAST,S ! DEFINE PATH SHIFT AS 1% OF PATHLENGTH
DX¼DX/100PCALC,ADD,XG,XG,,,,–DX/2 ! SHIFT PATH FROM X TO X-DX/2(GLOBAL X DIR.)
PDEF,INTR,UX1,UX ! DEFINE UX AT X-DXPDEF,INTR,UY1,UY ! DEFINE UY AT X-DXPCALC,ADD,XG,XG,,,,DX ! SHIFT PATH FROM X-DX/2 TO X+DX/2PDEF,INTR,UX2,UX! DEFINE UX AT X+DXPDEF,INTR,UY2,UY ! DEFINE UY AT X+DXPCALC,ADD,XG,XG,,,,–DX/2 ! SHIFT PATH BACK TO ORIGINALPOSITION
C¼(1/DX)PCALC,ADD,C1,UX2,UX1,C,-C ! CALCULATE DERIVATIVE DUX/DXPCALC,ADD,C2,UY2,UY1,C,-C ! CALCULATE DERIVATIVE DUY/DXPCALC,MULT,C1,TX,C1 ! DEFINE INTEGRANDPCALC,MULT,C2,TY,C2 !¼TXnDUX/DX+TYnDUY/DXPCALC,ADD,C1,C1,C2PCALC,INTG,J2,C1,S ! FORM SECOND INTEGRAL (W.R.T. PATHLENGTH S)
nGET,JB,PATH,,LAST,J2 ! GET FINAL VALUE OF INTEGRAL FOR2ND TERM OF J
PCALC,ADD,J3,J1,J2,,-1nGET,J11,PATH,,LAST,J3!J11¼ JA-JB! FOR FULL MODELS!PDEF,CLEAR! CLEAR PATH VARIABLES!nEND
References
[1] Kinloch AJ. Adhesion and adhesives: science and technology. London: Chap-man and Hall; 1987.
[2] Wang CH. Fracture of interface cracks under combined loading. Eng FractMech 1997;56:77–86.
[3] Hadj-Ahmed R. Probabilistic analysis of failure in adhesive bonded joints.Mech Mater 2001;33:77–84.
[4] Reedy ED, Guess TR. Interface corner failure analysis of joint strength: effect ofadherend stiffness. Int J Fract 1997;88:305–14.
[5] Reedy E. Connection between interface corner and interfacial fracture analysesof an adhesively-bonded butt joint. Int J Solids Struct 2000;37:2429–42.
[6] Akisanya AR, Meng CS. Initiation of fracture at the interface corner of bi-material joints. J Mech Phy Solids 2003;51:27–46.
[7] Qian Z, Akisanya AR. An experimental investigation of failure initiation inbonded joints. Acta Metall 1998;46:4895–904.
[8] Mintzas A, Nowell D. Validation of an Hcr-based fracture initiation criterion foradhesively bonded joints. Eng Fract Mech 2012;80:13–27.
[9] Chen Z, Adams RD, Da Silva LFM. The use of the J-integral vector to analyseadhesive bonds with and without a crack. Int J Adhes Adhes 2011;31:48–55.
[10] Zhu Y. Stress analysis and failure prediction for adhesively bonded joints.Santa Barbara: University of California; 2006.
[11] Rice JR. A path independent integral and the approximate analysis of strainconcentration by notches and cracks. J Appl Mech 1968;35:379–86.
[12] Seo D, Tensile J. bending and shear strength distributions of adhesive-bondedbutt joint specimens. Compos Sci Technol 2005;65:1421–7.
[13] Arenas JM, Narbón JJ, Alía C. Optimum adhesive thickness in structuraladhesives joints using statistical techniques based on Weibull distribution.Int J Adhes Adhes 2010;30:160–5.
[14] Vallee T, Correia J, Keller T. Probabilistic strength prediction for double lapjoints composed of pultruded GFRP profiles: part II: strength prediction.Compos Sci Technol 2006;66:1915–30.
[15] Burrow MF, Thomas D, Swain MV, Tyas MJ. Analysis of tensile bond strengthsusing Weibull statistics. Biomaterials 2004;25:5031–5.
[16] Dillard DA. The mechanics of adhesion. Amsterdam: Elsevier Science B.V.;2002.
[17] Groth HL. Prediction of failure loads of adhesive joints using the singularintensity factors. Fracture Mechanics: Eighteenth Symposium: ASTM STP1988;945:278–84.
[18] Qian ZQ, Akisanya AR. An investigation of the stress singularity near the freeedge of scarf joints. Euro J Mech 1999;18:443–63.
[19] Reedy Jr ED, Guess TR. Interface corner stress states: plasticity effects. Int JFract 1996;81:269–82.
[20] Bogy DB. Two edge-bonded elastic wedges on different materials and wedgeangles under surface tractions. Trans ASME, J Appl Mech 1971;38:377–86.
[21] He MY, Evans AG, Yehle A. Criterion for the avoidance of edge cracking inlayered systems. J Am Ceram Soc 2008;1423:1418–23.
[22] Hutchinson JW, Suo Z. In: Hutchinson JW, Wu TY, editors. Mixed modecracking in layered materials. California: Academic Press, Inc; 1992. p. 63–191.
[23] Weibull W. A statistical distribution function of wide application. J. Appl Mech1951;18:287–93.
[24] Saghafi A, Mirhabibi AR, Yari GH. Improved linear regression method forestimating Weibull parameters. Theor Appl Fract Mech 2009;52:180–2.
[25] Fok S. A numerical study on the application of the Weibull theory to brittlematerials. Eng Fract Mech 2001;68:1171–9.
[26] Ebnesajjad S. Adhesive technology handbook. New York: William Andrew Inc.;2008.
[27] Wang CH, Rose LRF. Compact solutions for the corner singularity in bondedlap joints. Int J Adhes Adhes 2000;20:145–54.
[28] McCabe JF, Carrick TE. A statistical approach to the mechanical testing ofdental materials. Dent Mater 1986;2:139–42.
M. Afendi et al. / International Journal of Adhesion & Adhesives 45 (2013) 21–31 31

![THE EXPONENTIATED GENERALIZED FLEXIBLE WEIBULL … · 2018. 9. 8. · Weibull family, Mudholkar and Srivastava [18], beta-Weibull distribution, Famoye et al. [6], generalized modified](https://img.pdfslide.us/doc/110x75/606a7b06ad36ab11840c32be/the-exponentiated-generalized-flexible-weibull-2018-9-8-weibull-family-mudholkar.jpg)


![The Exponential Flexible Weibull Extension Distribution · The Weibull distribution (WD) introduced by Weibull [23], is a popular distribution for modeling lifetime data where the](https://img.pdfslide.us/doc/110x75/606a8074a09a1e439f024a10/the-exponential-flexible-weibull-extension-distribution-the-weibull-distribution.jpg)