Embed Size (px)
Citation preview

ORIGINAL ARTICLE
Geographic genetic structure of Iberian columbines (gen.Aquilegia)
Jose L. Garrido1• Julio M. Alcantara2
• Pedro J. Rey2• Monica Medrano1
•
Javier Guitian4• Marıa C. Castellanos3
• Jesus M. Bastida2• Rafael Jaime2
•
Carlos M. Herrera1
Received: 15 September 2016 / Accepted: 15 May 2017 / Published online: 9 June 2017
� Springer-Verlag Wien 2017
Abstract Southern European columbines (genus Aquile-
gia) are involved in active processes of diversification, and
the Iberian Peninsula offers a privileged observatory to
witness the process. Studies on Iberian columbines have
provided significant advances on species diversification,
but we still lack a complete perspective of the genetic
diversification in the Iberian scenario. This work explores
how genetic diversity of the genus Aquilegia is geograph-
ically structured across the Iberian Peninsula. We used
Bayesian clustering methods, principal coordinates analy-
ses, and NJ phenograms to assess the genetic relationships
among 285 individuals from 62 locations and detect the
main lineages. Genetic diversity of Iberian columbines
consists of five geographically structured lineages, corre-
sponding to different Iberian taxa. Differentiation among
lineages shows particularly complex admixture patterns at
Northeast and highly homogeneous toward Northwest and
Southeast. This geographic genetic structure suggests the
existence of incomplete lineage sorting and interspecific
hybridization as could be expected in recent processes of
diversification under the influence of quaternary postglacial
migrations. This scenario is consistent with what is pro-
posed by the most recent studies on European and Iberian
columbines, which point to geographic isolation and
divergent selection by habitat specialization as the main
diversification drivers of the Iberian Aquilegia complex.
Keywords AFLP � Aquilegia � Diversification � IberianPeninsula � Quaternary postglacial migrations � Spatialgenetic structure
Introduction
Over the last four decades, research on adaptive radiations
of Angiosperms favored the view that they were mainly
driven by processes of sympatric speciation through pol-
linator-mediated reproductive isolation, so with phenotypic
differentiation mostly involving reproductive traits. The
recent diversification of the genus Aquilegia in North
America strongly supported this view (Hodges and Arnold
1994; Hodges 1997; Whittall and Hodges 2007; Hodges
and Derieg 2009). However, recent studies on the
Euroasiatic part of the genus have challenged the generality
of this perspective, showing that its diversification has been
mainly driven by processes of allopatric speciation through
geographic isolation and habitat specialization, and mostly
involving vegetative traits (Medrano et al. 2006; Alcantara
et al. 2010; Bastida et al. 2010; Garrido et al. 2012; Fior
et al. 2013; Lega et al. 2014).
These recent studies have also revealed that the endemic
taxa from Southern European mountain systems are
involved in probably the most active stages of this genus’
Handling editor: Pablo Vargas.
Electronic supplementary material The online version of thisarticle (doi:10.1007/s00606-017-1428-5) contains supplementarymaterial, which is available to authorized users.
& Jose L. Garrido
1 Depto. Ecologıa Evolutiva, Estacion Biologica de Donana,
Consejo Superior de Investigaciones Cientıficas (EBD-
CSIC), Avenida Americo Vespucio, 26, 41092 Seville, Spain
2 Depto. Biologıa Animal, Biologıa Vegetal y Ecologıa,
University of Jaen, 23071 Jaen, Spain
3 School of Life Sciences, University of Sussex,
Brighton BN1 9QG, UK
4 Depto. Botanica, University of Santiago de Compostela,
15782 Santiago de Compostela, A Coruna, Spain
123
Plant Syst Evol (2017) 303:1145–1160
DOI 10.1007/s00606-017-1428-5
Author's personal copy

diversification, and point to the Iberian Peninsula as an
optimal natural laboratory for deepening in the study of the
European radiation of Aquilegia. In fact, studies on Iberian
columbines show that some of the differentiation patterns
in vegetative traits observed nowadays can be explained by
the same divergent selection pressures that currently occur
in different habitats (Alcantara et al. 2010). Moreover,
vegetative traits of these columbines exhibit higher evo-
lutionary potential than floral traits (Castellanos et al. 2011;
Alcantara et al. 2014) and show higher adaptability in
defense against herbivores (Jaime et al. 2013), irradiance
and water stress (Jaime et al. 2014), and soil properties
tolerance (Bastida et al. 2014). In general, these findings
agree with the expectations on the divergence drivers of the
European columbines (Bastida et al. 2010; Fior et al.
2013).
These studies have provided relevant results working
with some Iberian species in particular, and in some specific
geographic areas. Nonetheless, it becomes necessary to
provide a complete perspective of the Iberian divergence
process by considering all its taxonomic and environmental
diversity as a whole, since it may provide interesting keys
on Aquilegia diversification hardly to detect otherwise. This
work explores how genetic diversity of the Iberian Aquile-
gia taxa is geographically structured across the Iberian
Peninsula. Given its high habitat heterogeneity (precisely
one of the factors shaping the pattern of diversification
proposed for Southern European columbines; Bastida et al.
2010; Fior et al. 2013), this geographic context allows us to
assess the influence of geographic isolation and habitat
specialization on the establishment of the geographic pat-
terns of genetic variation that canalize taxonomic diversi-
fication. Besides, a great part of the divergence time of
southern European columbines (\1.7 my; Bastida et al.
2010) overlaps with the period of stronger quaternary cli-
matic oscillations (0.7 my; Taberlet et al. 1998; Kadereit
et al. 2004). Thus, given the critical influence of these
events on the settlement of current European flora, this work
may provide interesting insights on overall diversification
patterns of European plants.
Recent studies on geographic structuring of genetic
variation on European columbines distributed across the
European Alpine System (Lega et al. 2014) and central
Mediterranean islands (Garrido et al. 2012) have revealed
strongly structured spatial genetic patterns. These kinds of
patterns, when coupled with limited dispersal abilities, like
in Aquilegia (Hodges and Arnold 1994; Strand et al. 1996),
are often associated with geographic isolation scenarios
with restricted gene flow between populations and subse-
quent population differentiation by genetic drift (see Edh
et al. 2007).
Spatial patterns of genetic variation in recently radiated
groups are often particularly complex mostly due to their
high levels of incomplete lineage sorting (Pamilo and Nei
1988; Maddison and Knowles 2006; Joly et al. 2009). This
circumstance may become further ‘blurred’ by the high
interfertility of these taxa (Prazmo 1965; Taylor 1967).
Therefore, these groups usually exhibit uncoupled patterns
of genetic and phenotypic differentiation that generate
discrepancies between taxonomy and phylogeny (Wang
et al. 2005; Whitfield and Lockhart 2007; Parks et al. 2009;
Rymer et al. 2010). Accordingly, the diversification of
Aquilegia has generated a high number of taxa with low
genetic divergence but that exhibit clear phenotypic dif-
ferences (Hodges and Arnold 1994; Ro and McPheron
1997; Whittall et al. 2006; Whittall and Hodges 2007).
Thus, predefined taxonomic entities may not agree with the
genetic structure of the group, hindering traditional
approaches to the study of spatial genetic structure based
on a priori-defined populations and species. To avoid this
problem we use analytical approaches that do not consider
any a priori taxonomic affiliation of the studied
populations.
Specifically, the following questions are addressed:
(i) How are the Iberian columbines structured genetically
across the Iberian Peninsula?; (ii) How does the genetic
structure found match with current taxonomy?, (iii) Which
may be the main factors shaping this geographic genetic
structure?, and, finally, (iv) Are these results compatible
with the scenario of divergence by geographic isolation and
habitat specialization recently proposed for the European
columbines?
Methods
Study species and sites
Columbines are perennial herbs consisting of an erect
rhizomatous stem growing from a basal rosette with bi- or
tri-ternate compound leaves. Hermaphrodite, commonly
pendant flowers, are radially symmetrical and exhibit five
sepals and five petals, each petal consisting of a flat limb
and a backwardly directed spur. Basal rosettes grow during
April–May and develop one or several inflorescences
flowering from May to July, or even August in the case of
high altitude species (Cullen and Heywood 1964; Whitte-
more 1997; Nold 2003). They occur from sea level to
2500 m a.s.l.
Three species inhabit the Iberian Peninsula: A. vulgaris
(with 4 subspecies), A. pyrenaica (with 4 subspecies), and
A. viscosa (with 1 subspecies) (Dıaz 1986). Out of the four
vulgaris subspecies, Avv (see Fig. 1 for distribution details
and names abbreviations) is widely distributed across the
Iberian Peninsula, whereas Avd, Avn, and Avp are,
respectively, endemic to the Northwestern mountain
1146 J. L. Garrido et al.
123
Author's personal copy

systems, Sierra Nevada, and the Ports of Tortosa-Beceite.
A fifth vulgaris subspecies, A. v. hispanica (Avh), is
questioned as a well-differentiated taxon (Dıaz 1986). The
pyrenaica subspecies, App, Apg, Apd, and Apc are,
respectively, narrow endemics to the Pyrenean range,
Sierra de Guara, Cantabrian range, and Sierra del Pozo.
Finally, the only viscosa subspecies, Avi, inhabits the
eastern Pyrenean range. A. vulgaris occurs in moist
developed soils near water streams, damp forest gaps, and
alpine meadows, while A. pyrenaica and A. viscosa inhabit
rocky limestone outcrops, cliff bases, and stony alpine
meadows with shallow calcareous soils (Dıaz 1986).
Plant material was collected between 2003 and 2009,
from 285 wild individuals at 62 Iberian locations. Figure 1
and Table 1 show geographic details of each location and
their attributed taxa. Our sampling strategy was designed to
cover most distribution areas of the different Aquilegia taxa
across the Iberian Peninsula, balancing genetic and geo-
graphic diversity. To facilitate visualization and analysis,
the whole covered area was divided in four geographic
areas: Northwest, Northeast, Southeast, and South, as
shown in Figs. 1 and 5.
DNA extraction and AFLP protocol
Fresh young leaves were immediately desiccated after
collection in the field and stored with silica gel until DNA
was processed. Total genomic DNA was extracted from
Fig. 1 Geographic distribution of Iberian columbines (differently
delineated areas, as shown in legend) and sampled locations (black
dots). Abbreviation of taxa names: Avv Aquilegia vulgaris subsp.
vulgaris; Avd A. v. subsp. dichroa; Avn A. v. subsp. nevadensis; Avp
A. v. subsp. paui; Avh A. v. subsp. hispanica; App A. pyrenaica subsp.
pyrenaica; Apc A. p. subsp. cazorlensis; Apg A. p. subsp guarensis;
Apd A. p. subsp. discolor; and Avi A. viscosa subsp. hirsutissima. To
facilitate visualization, the sampled Iberian Peninsula is divided in
four geographic areas (delimited by white lines and shown in detail in
Fig. 5): Northwest (a), Northeast (b), Southeast (c), and South (d).Taxonomic source: Flora Iberica (Dıaz 1986) and www.anthos.es.
Base map source: ESRI
Geographic genetic structure of Iberian columbines (gen. Aquilegia) 1147
123
Author's personal copy

Table 1 Localities details including names, specific locations, mountain systems, and geographic coordinates of the 62 Iberian Aquilegia
sampling points studied
ID Locality name Location (province) Mountain system (geographic area) Lat/long Taxa N
A00 Barranco de La Charca Sierra del Pozo (Jaen) Prebetic range (SE) 37.9419/-2.8633 Apc? 5
AC1 Barranco de La Canal Sierra del Pozo (Jaen) Prebetic range (SE) 37.7855/-2.9557 Apc 5
AC2 Cerrada del Pintor Sierra del Pozo (Jaen) Prebetic range (SE) 37.8633/-2.9308 Apc 5
AC3 Cerrada del Pintor (D.) Sierra del Pozo (Jaen) Prebetic range (SE) 37.8716/-2.9115 Apc 5
AC4 Cerro Cabanas Sierra del Pozo (Jaen) Prebetic range (SE) 37.8076/-2.9557 Apc 5
AC5 Cerro Cabanas (Norte) Sierra del Pozo (Jaen) Prebetic range (SE) 37.8129/-2.9554 Apc 5
AC6 La Canaliega Sierra del Pozo (Jaen) Prebetic range (SE) 37.8718/-2.9103 Apc 5
AC7 Arroyo de La Mesa Sierra del Pozo (Jaen) Prebetic range (SE) 37.8992/-2.913 Apc 3
ACB Cuevas Bermejas (Pared) Sierra del Pozo (Jaen) Prebetic range (SE) 37.9632/-2.8489 Apc? 5
ACN Charca Norte Sierra del Pozo (Jaen) Prebetic range (SE) 37.9482/-2.8616 Apc? 1
ACS Charca Sur Sierra del Pozo (Jaen) Prebetic range (SE) 37.9431/-2.8627 Apc? 5
AMA Circo del Mampodre Macizo del Mampodre (Leon) Cantabrian range (NW) 43.0285/-5.1883 App 4
AN1 La Cortijuela I Sierra Nevada (Granada) Penibetic range (S) 37.0744/-3.4736 Avn 5
AN2 La Cortijuela II Sierra Nevada (Granada) Penibetic range (S) 37.0816/-3.4684 Avn 5
AN3 Pradollano Sierra Nevada (Granada) Penibetic range (S) 37.0978/-3.4012 Avn 5
AN4 Fuente Frıa Sierra Nevada (Granada) Penibetic range (S) 37.0184/-3.4901 Avn 5
AN5 Aguas Blanquillas Sierra Nevada (Granada) Penibetic range (S) 37.07/-3.4824 Avn 5
AN6 La Maroma Sierra de Tejeda (Malaga) Penibetic range (S) 36.8977/-4.047 Avn 5
AP1 Collado Tortiellas Central Pyrenean range (Huesca) Pyrenean range (NE) 42.7784/-0.5407 App 4
AP2 Candanchu Central Pyrenean range (Huesca) Pyrenean range (NE) 42.7737/-0.5304 App 5
AP3 El Tobazo Central Pyrenean range (Huesca) Pyrenean range (NE) 42.7798/-0.5232 App 5
AP4 Larra Macizo de Larra-Belagua (Navarra) Pyrenean range (NE) 42.9681/-0.7677 App 5
AP5 Las Blancas Central Pyrenean range (Huesca) Pyrenean range (NE) 42.7157/-0.5619 App 4
APG Guara I Sierra de Guara (Huesca) Pyrenean range (NE) 42.2993/-0.2223 Apg 5
AV1 Barranco de los Jabalises Sierra de Segura (Jaen) Prebetic range (SE) 38.2071/-2.5849 Avv 5
AV2 Cascada de ‘El Saltador’ Sierra de Segura (Jaen) Prebetic range (SE) 38.3234/-2.5418 Avh? 5
AV3 Rio Tus Sierra de Segura (Jaen) Prebetic range (SE) 38.3551/-2.5031 Avh? 5
AV4 Cueva del Peinero Sierra de Las Villas (Jaen) Prebetic range (SE) 38.1026/-2.8684 Avv 5
AV5 Barranco del Guadalentın Sierra del Pozo (Jaen) Prebetic range (SE) 37.898/-2.8378 Avv 5
AV6 Embalse del Aguascebas Sierra de Las Villas (Jaen) Prebetic range (SE) 38.0763/-2.8953 Avv 5
AV7 La Cabrilla Sierra de Segura (Jaen) Prebetic range (SE) 37.9261/-2.7867 Avv 5
AV8 Fuente de la Reina Sierra del Pozo (Jaen) Prebetic range (SE) 37.9436/-2.8327 Avv 5
AV9 Covacho del Aire Sierra del Pozo (Jaen) Prebetic range (SE) 37.9514/-2.8602 Apc 5
AVA Valle Aisa Central Pyrenean range (Huesca) Pyrenean range (NE) 42.7375/-0.5885 Avv 4
AZ1 Cuevas de La Mesa Sierra del Pozo (Jaen) Prebetic range (SE) 37.8968/-2.9185 Apc 3
CCB Cuevas Bermejas (Cer.) Sierra del Pozo (Jaen) Prebetic range (SE) 37.9631/-2.8534 Avv 5
CSC Charca Sur (Cer.) Sierra del Pozo (Jaen) Prebetic range (SE) 37.9453/-2.8619 Apc 5
D01 Puerto de Vegarada Macizo Asturleones (Leon) Cantabrian range (NW) 43.039/-5.4694 Avd 5
D02 Aula de la Natulareza Sierra de O Courel (Lugo) Macizo Galaico-Leones (NW) 42.558/-7.1125 Avd 5
D03 La Una Macizo Asturleones (Leon) Cantabrian range (NW) 43.055/-5.1319 Avd 5
D04 Puerto de Ventana Macizo Asturleones (Leon) Cantabrian range (NW) 43.0641/-6.0058 Avd 5
D05 Cabana Arce (Moreda) Sierra de O Courel (Lugo) Macizo Galaico-Leones (NW) 42.6254/-7.1102 Avd 5
D06 Isoba San Isidro (Leon) Cantabrian range (NW) 43.049/-5.319 Avd 5
D07 Penalba de Santiago Montes de Leon (Leon) Macizo Galaico-Leones (NW) 42.4387/-6.5516 Avd 5
D08 La Aquiana Montes de Leon (Leon) Macizo Galaico-Leones (NW) 42.4479/-6.5991 Avd 5
D09 San Adrian de Valdueza Montes de Leon (Leon) Macizo Galaico-Leones (NW) 42.468/-6.6011 Avd 5
D10 Souto de Moreda Sierra de O Courel (Lugo) Macizo Galaico-Leones (NW) 42.5936/-7.1102 Avd 5
D11 Redipuertas Macizo Asturleones (Leon) Cantabrian range (NW) 43.0118/-5.4679 Avd 5
1148 J. L. Garrido et al.
123
Author's personal copy

approximately 30 mg of dried leaf material (previously
homogenized with a Retsch MM 200 mill) by means of the
DNeasy Plant Mini Kit (Qiagen, Valencia, CA, USA) and
using Qiacube extraction robot (Qiagen, Valencia, CA,
USA). Amplified fragments were obtained following the
protocol by Vos et al. (1995) with some modifications
related to the use of fluorescent dye-labeled selective pri-
mers. EcoRI and MseI were used as rare and frequent cutter
enzymes, respectively. Digested DNA was ligated to the
EcoRI and MseI adapters. Fragments were selectively
amplified with EcoRI and MseI primers, bearing one
selective nucleotide. Final selective amplifications were
carried out using EcoRI and MseI primers with three
selective nucleotides (see table in Online Resource 1).
Twenty-four primer combinations were preliminarily
assayed for selective amplification on a random subsample
of 16 individuals. Eight primer combinations were finally
selected based on fragment abundance and polymorphism.
Fragment detection was performed by means of an ABI
PRISM 3100 DNA automatic sequencer (Life Technolo-
gies, Carlsbad, CA, USA). Fragments presence on each
individual was manually scored with GENEMAPPER v.4
(Life Technologies, Carlsbad, CA, USA).
Reproducibility and reliability of AFLP fragments were
assessed by replicating 16 individuals. The replication
procedure was carried out including DNA isolations, since
repeating just the process of AFLP production does not
generate true replicates (Bonin et al. 2007; Holland et al.
2008). The scoring error rate was very low and ranged,
among primer combinations, between 0.54 and 1.90%
(mean 1.34%, Online Resource 1) indicating the suitability
and repeatability of our dataset.
AFLP data analyses
To avoid possible fragment size homoplasy, only
150–500 bp size fragments were finally considered since
preliminary assays indicated that smaller fragments were
prone to it (Vekemans 2002; Herrera and Bazaga 2009;
Garrido et al. 2012).
Genetic diversity was assessed by the percentage of
polymorphic loci (PPL), the expected heterozygosity (He;
Nei 1987), and the unbiased He for small sample sizes (Nei
1978). Since in dominant markers band presence may
reflect either homozygosity or heterozygosity, the null
allele frequency has always to be estimated. Thus, genetic
parameters based on allelic frequencies, like He, are diffi-
cult to assess, existing different methods to estimate them
(Bonin et al. 2007; Meudt and Clarke 2007). Here, we have
used a Bayesian method with non-uniform prior distribu-
tion of allelic frequencies, assuming Hardy–Weinberg
Equilibrium, as implemented in AFLPSurv v.1.0 (Veke-
mans 2002). Calculations were performed on 4–5 individ-
uals with complete genotypic profiles for each location.
Long-term isolated populations accumulate rare markers
by mutations, thus, in order to provide indirect estimates of
location divergence and isolation, we further calculate
three parameters of markers rarity: the number private
markers (markers present in only one population, NPM),
the number of diagnostic markers (private markers present
Table 1 continued
ID Locality name Location (province) Mountain system (geographic area) Lat/long Taxa N
EU1 Eume I Fragas do Eume (A Coruna) Cantabrian range (NW) 43.4051/-8.0376 Avd 4
EU2 Eume II Fragas do Eume (A Coruna) Cantabrian range (NW) 43.4137/-8.0546 Avd 5
LHA Las Huelgas (Arroyo) Sierra de Segura (Jaen) Prebetic range (SE) 38.102/-2.7175 ND 5
LHC Las Huelgas (Covarron) Sierra de Segura (Jaen) Prebetic range (SE) 38.1029/-2.7154 ND 5
PAU Port de Beceite Ports de Tortosa-Beceite (Tarragona) Iberian system (NE) 40.8254/0.3675 Avp* 5
PC1 Poyos de La Carilarga 1 Sierra del Pozo (Jaen) Prebetic range (SE) 37.8949/-2.8315 ND 5
PC2 Poyos de La Carilarga 2 Sierra del Pozo (Jaen) Prebetic range (SE) 37.8947/-2.8336 ND 5
PD1 Pico Huevo Macizo Asturleones (Leon) Cantabrian range (NW) 43.0086/-5.4844 Apd 5
PD2 Cueto de Juan Toribio Picos de Europa (Cantabria) Cantabrian range (NW) 43.0096/-5.4831 Apd 5
PXV Port de Beceite 2 Ports de Tortosa-Beceite (Tarragona) Iberian system (NE) 40.8254/0.3675 Avp*? 2
SIL Puente de Silvao Serra da Faladoira (A Coruna) Cantabrian range (NW) 43.5564/-7.8397 Avv 5
VLB Las Blancas Central Pyrenean range (Huesca) Pyrenean range (NE) 42.7157/-0.5619 Avi? 1
VLM La Molina Eastern Pyrenean range (Lleida) Pyrenean range (NE) 42.3366/1.929 Avi 3
VRG Guara II Sierra de Guara (Huesca) Pyrenean range (NE) 42.2993/-0.2223 Avi? 2
For each locality, an acronym (ID), the number of individuals collected (N), and the currently attributed taxa are also provided. Iberian
geographic areas (NE, NW, SE, and S) where we have focused our study (according to Figs. 1 and 5) are also indicated. ? undefined
determination, ND not previously cited, * populatiom PXV collected by MCM (see Acknowledgements) as a Avv x Avp hybrid. See Fig. 1 for
taxa abbreviations
Geographic genetic structure of Iberian columbines (gen. Aquilegia) 1149
123
Author's personal copy

in every individual in a population, D), and the frequency-
down-weighted marker values (DW), which may be used
as a standardized measure of divergence and long-term
isolation (Schonswetter and Tribsch 2005). At each loca-
tion, the average number of markers per individual (NMI)
and the number of fixed markers (NFM) were also calcu-
lated. Excepting DW, obtained with AFLPdat (Ehrich
2006), these parameters were calculated with FAMD
v.1.31 (Schluter and Harris 2006).
The underlying genetic structure among individuals and
locations was analyzed under three different approaches.
We firstly use a Bayesian method to group individuals into
natural genetic groups (K) based on their individual mul-
tilocus profiles, as implemented in the software STRUC-
TURE v.2.3.3 (Pritchard et al. 2000; Falush et al.
2003, 2007; Hubisz et al. 2009). By means of Markov
chain Monte Carlo algorithms, it calculates the posterior
probability of membership of an individual to a number of
K groups without prior information on their taxonomic
identity and population origin. Analyses were performed
using an admixture ancestry model with recessive alleles
and correlated allele frequencies among populations. Thirty
independent runs were performed for each K value (from 1
to 21), each with a 105 MCMC iterations length after a
burn-in period of 5�104 steps. To evaluate the similarity
among runs and whether clustering solutions for each K
value were consistent, we calculated their similarity coef-
ficients using the R-script STRUCTURE-SUM-2009
(Ehrich et al. 2007). To detect the true number of genetic
groups we used the modal DK parameter, proposed by
Evanno et al. (2005). Extraction of key results, integration
of the outcomes from different runs, and representation of
STRUCTURE outputs were performed by using, respec-
tively, STRUCTURE HARVESTER (Earl and vonHoldt
2012), CLUMPP v.1.1.2 with Greedy algorithm (Jakobsson
and Rosenberg 2007), and DISTRUCT v.1.1 (Rosenberg
2004).
To confirm the distribution of individuals among genetic
groups and verify the adscription of individuals to the
clusters revealed by STRUCTURE, we further performed
another different Bayesian clustering analysis by means of
BAPS v.6.0 (Corander et al. 2003; Corander and Marttinen
2006). It consisted of an initial individual mixture analysis
with fixed K = 5, iterated 20 times to assess the consis-
tency among simulations. And then, an admixture analysis
with 100 iterations to estimate the overall admixture
coefficients, estimating with 100 replicates the admixture
of 200 reference individuals.
We also explored the genetic structure without the
population genetics assumptions underlying the former
Bayesian approach by means of a principal coordinates
analysis (PCoA; Krzanowski 1990) using FAMD v.1.31
(Schluter and Harris 2006). This analysis was based on
Jaccard distances among individuals, since in AFLP
markers, shared absences (null alleles) are particularly
susceptible to homoplasy, being thus dissimilarity mea-
sures that do not take into account them (like Jaccard and
Nei-Li distances) the most appropriate (Meudt and Clarke
2007).
A third approach was to depict genetic relationships
among locations and individuals by constructing an
unrooted neighbor-joining (NJ) phenogram based on the
Nei-Li distances among individuals (Nei and Li 1979). A
total of 2000 bootstrap replicates, and their corresponding
Nei-Li distance matrices and NJ trees, were obtained by
using, respectively, the SEQBOOT, RESTDIST, and
NEIGHBOR modules of PHYLIP v.3.6. software (Felsen-
stein 2005). Finally, a 50% majority rule consensus tree
was constructed with PAUP* v.4.0a152 (Swofford 2002).
Results
We consistently and unambiguously scored 474 loci (453
polymorphic) for 285 individuals from 62 Aquilegia loca-
tions sampled across the Iberian Peninsula. Each primer
combination resolved 59.37 loci on average (see table in
Online Resource 1).
Genetic diversity and markers rarity
across locations
Estimates of genetic diversity across locations, even the
unbiased estimate for low sample sizes, revealed overall
low values, with PPL, He, and uHe averaging 26.09
(±2.54), 0.0705 (±0.0062), and 0.0787 (±0.0069),
respectively (Table 2). Genetic diversity ranged from
lowest values at PD2 (PPL: 21.3), AP3 (He: 0.0500), and
AP4 (uHe: 0.0562), to highest values at AVA (PPL: 32.7,
He: 0.1115, uHe: 0.1274). Parameters of markers rarity
revealed that APG, specially, but also PAU, AC4, and PD2
showed highest values of divergence and long-term isola-
tion (Table 2). They exhibited highest numbers of private
and diagnostic markers (NPM(D): 4(4), 3(1), 6(2), and
2(1), respectively) and the highest DW estimates (35.99,
25.75, 25.41, and 24.61, respectively).
Geographic structure of genetic variation
The most likely STRUCTURE partition involved the
existence of five genetic lineages (DK = 12.96, Pr|ln
L = -28,366.59; Online Resource 2) in the Iberian
Peninsula (Fig. 2), which will be hereafter referred to as
colors red, green, purple, blue, and orange. All 30 runs
gave consistent similarity results, and individuals were
clearly assigned to nonempty groups. Lineages hosted
1150 J. L. Garrido et al.
123
Author's personal copy

Table 2 Parameters of genetic diversity for localities in each genetic
group obtained from allelic frequencies (see ‘‘Methods’’). Localities
acronyms follow Table 1. Genetic groups averages are also shown. It
is to be advised that, the table anticipates the genetic groups later
defined. ACB and VLB, single-sampled locations, were excluded
since estimates could not be computed
Genetic group Locality PPL He ± SE UHe ± SE NMI NFM NPM (D) DW N
Blue AP1 21.5 0.0623 ± 0.0060 0.0748 ± 0.0072 81.25 79 0 8.86 3
AP2 23.8 0.0584 ± 0.0055 0.0667 ± 0.0063 91.00 76 1 24.76 4
AP3 23.4 0.0500 ± 0.0047 0.0571 ± 0.0054 97.00 93 1 10.65 4
AP4 23.4 0.0506 ± 0.0049 0.0562 ± 0.0054 102.80 92 0 13.40 5
AP5 22.4 0.0543 ± 0.0051 0.0621 ± 0.0058 95.25 87 0 7.44 4
PD2 21.3 0.0508 ± 0.0052 0.0581 ± 0.0059 77.20 74 2 (1) 24.61 4
APG 24.3 0.0638 ± 0.0059 0.0766 ± 0.0071 100.25 93 4 (4) 35.99 3
Average 22.8 0.0557 ± 0.0053 0.0645 ± 0.0062 92.11 84.57 1.14 (0.71) 17.96
Purple PAU 26.2 0.0768 ± 0.0068 0.0878 ± 0.0078 99.00 77 6 (2) 25.41 4
AC1 25.5 0.0565 ± 0.0052 0.0628 ± 0.0058 112.80 101 1 11.72 5
AC2 26.4 0.0679 ± 0.0059 0.0776 ± 0.0067 112.00 100 0 5.22 4
AC3 23.8 0.0507 ± 0.0048 0.0563 ± 0.0053 105.20 96 0 4.76 5
AC4 31.4 0.0952 ± 0.0074 0.1088 ± 0.0085 128.25 102 3 (1) 25.75 4
AC5 26.2 0.0680 ± 0.0061 0.0756 ± 0.0068 106.00 87 0 7.19 5
AC6 30.4 0.0823 ± 0.0066 0.0914 ± 0.0073 116.20 92 0 14.56 5
AC7 22.8 0.0510 ± 0.0043 0.0612 ± 0.0052 107.33 107 0 3.04 3
AZ1 24.9 0.0718 ± 0.0063 0.0862 ± 0.0076 109.00 99 0 3.66 3
Average 26.4 0.0689 ± 0.0059 0.0786 ± 0.0068 110.64 95.66 1.11 (0.33) 11.26
Green A00 24.5 0.0639 ± 0.0059 0.0730 ± 0.0067 93.00 74 0 19.48 4
AV9 27.6 0.0754 ± 0.0065 0.0862 ± 0.0074 99.40 91 1 15.81 4
CSC 24.5 0.0549 ± 0.0052 0.0610 ± 0.0058 106.20 95 1 6.12 5
CCB 24.7 0.0564 ± 0.0052 0.0627 ± 0.0058 103.20 91 3 12.81 5
PC1 24.5 0.0573 ± 0.0053 0.0637 ± 0.0059 100.60 88 3 8.76 5
PC2 28.3 0.0654 ± 0.0055 0.0727 ± 0.0061 112.20 98 4 13.36 5
ACB 26.2 0.0597 ± 0.0053 0.0663 ± 0.0059 108.40 96 0 6.54 5
ACS 27.6 0.0851 ± 0.0072 0.0946 ± 0.0080 99.60 68 2 7.87 5
AV1 27.2 0.0761 ± 0.0066 0.0870 ± 0.0075 114.00 96 2 11.64 4
AV2 26.6 0.0640 ± 0.0056 0.0731 ± 0.0064 107.00 96 0 9.03 4
AV3 27.2 0.0921 ± 0.0076 0.1105 ± 0.0091 95.50 74 0 8.65 3
AV4 30 0.0853 ± 0.0068 0.0948 ± 0.0076 103.20 78 2 8.00 5
AV5 29.1 0.0798 ± 0.0066 0.0887 ± 0.0073 112.20 89 0 6.74 5
AV6 28.7 0.0723 ± 0.0060 0.0803 ± 0.0067 110.20 92 1 6.64 5
AV7 27.6 0.0680 ± 0.0059 0.0756 ± 0.0066 112.00 97 0 5.44 5
AV8 26.8 0.0919 ± 0.0079 0.1050 ± 0.0090 97.00 58 5 13.28 4
LHA 26.8 0.0687 ± 0.0061 0.0763 ± 0.0068 109.00 88 3 8.81 5
LHC 26.4 0.0697 ± 0.0062 0.0774 ± 0.0069 104.00 82 3 10.41 5
Average 26.9 0.0714 ± 0.0062 0.0805 ± 0.0070 104.88 86.16 1.57 (0) 9.97
Orange AN1 31.4 0.0884 ± 0.0068 0.1010 ± 0.0078 121.50 78 4 8.73 4
AN3 24.1 0.0577 ± 0.0055 0.0641 ± 0.0061 98.60 81 3 8.68 5
AN2 27 0.0773 ± 0.0067 0.0859 ± 0.0074 105.00 85 3 11.26 5
AN4 26.4 0.0962 ± 0.0081 0.1154 ± 0.0097 89.00 59 0 16.60 3
AN5 23.8 0.0597 ± 0.0057 0.0682 ± 0.0065 95.20 88 0 14.10 4
AN6 24.3 0.0582 ± 0.0056 0.0647 ± 0.0062 103.80 91 0 8.10 5
Average 26.1 0.0729 ± 0.0064 0.0832 ± 0.0073 102.18 80.33 1.66 (0) 11.25
Red AVA 32.7 0.1115 ± 0.0080 0.1274 ± 0.0091 114.50 83 5 15.29 4
PXV 21.5 0.0918 ± 0.0084 0.1224 ± 0.0112 86.00 70 1 (1) 5.14 2
VRG 24.7 0.0957 ± 0.0081 0.1276 ± 0.0108 104.00 91 1 3.94 2
Geographic genetic structure of Iberian columbines (gen. Aquilegia) 1151
123
Author's personal copy
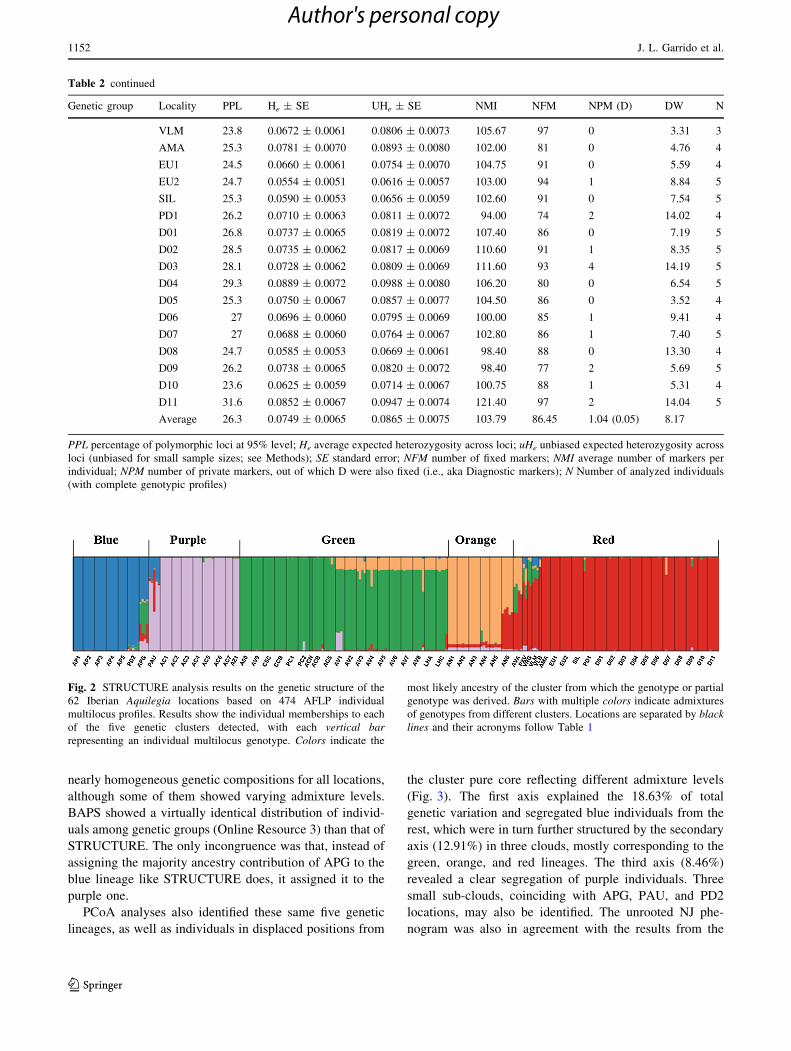
nearly homogeneous genetic compositions for all locations,
although some of them showed varying admixture levels.
BAPS showed a virtually identical distribution of individ-
uals among genetic groups (Online Resource 3) than that of
STRUCTURE. The only incongruence was that, instead of
assigning the majority ancestry contribution of APG to the
blue lineage like STRUCTURE does, it assigned it to the
purple one.
PCoA analyses also identified these same five genetic
lineages, as well as individuals in displaced positions from
the cluster pure core reflecting different admixture levels
(Fig. 3). The first axis explained the 18.63% of total
genetic variation and segregated blue individuals from the
rest, which were in turn further structured by the secondary
axis (12.91%) in three clouds, mostly corresponding to the
green, orange, and red lineages. The third axis (8.46%)
revealed a clear segregation of purple individuals. Three
small sub-clouds, coinciding with APG, PAU, and PD2
locations, may also be identified. The unrooted NJ phe-
nogram was also in agreement with the results from the
Table 2 continued
Genetic group Locality PPL He ± SE UHe ± SE NMI NFM NPM (D) DW N
VLM 23.8 0.0672 ± 0.0061 0.0806 ± 0.0073 105.67 97 0 3.31 3
AMA 25.3 0.0781 ± 0.0070 0.0893 ± 0.0080 102.00 81 0 4.76 4
EU1 24.5 0.0660 ± 0.0061 0.0754 ± 0.0070 104.75 91 0 5.59 4
EU2 24.7 0.0554 ± 0.0051 0.0616 ± 0.0057 103.00 94 1 8.84 5
SIL 25.3 0.0590 ± 0.0053 0.0656 ± 0.0059 102.60 91 0 7.54 5
PD1 26.2 0.0710 ± 0.0063 0.0811 ± 0.0072 94.00 74 2 14.02 4
D01 26.8 0.0737 ± 0.0065 0.0819 ± 0.0072 107.40 86 0 7.19 5
D02 28.5 0.0735 ± 0.0062 0.0817 ± 0.0069 110.60 91 1 8.35 5
D03 28.1 0.0728 ± 0.0062 0.0809 ± 0.0069 111.60 93 4 14.19 5
D04 29.3 0.0889 ± 0.0072 0.0988 ± 0.0080 106.20 80 0 6.54 5
D05 25.3 0.0750 ± 0.0067 0.0857 ± 0.0077 104.50 86 0 3.52 4
D06 27 0.0696 ± 0.0060 0.0795 ± 0.0069 100.00 85 1 9.41 4
D07 27 0.0688 ± 0.0060 0.0764 ± 0.0067 102.80 86 1 7.40 5
D08 24.7 0.0585 ± 0.0053 0.0669 ± 0.0061 98.40 88 0 13.30 4
D09 26.2 0.0738 ± 0.0065 0.0820 ± 0.0072 98.40 77 2 5.69 5
D10 23.6 0.0625 ± 0.0059 0.0714 ± 0.0067 100.75 88 1 5.31 4
D11 31.6 0.0852 ± 0.0067 0.0947 ± 0.0074 121.40 97 2 14.04 5
Average 26.3 0.0749 ± 0.0065 0.0865 ± 0.0075 103.79 86.45 1.04 (0.05) 8.17
PPL percentage of polymorphic loci at 95% level; He average expected heterozygosity across loci; uHe unbiased expected heterozygosity across
loci (unbiased for small sample sizes; see Methods); SE standard error; NFM number of fixed markers; NMI average number of markers per
individual; NPM number of private markers, out of which D were also fixed (i.e., aka Diagnostic markers); N Number of analyzed individuals
(with complete genotypic profiles)
Fig. 2 STRUCTURE analysis results on the genetic structure of the
62 Iberian Aquilegia locations based on 474 AFLP individual
multilocus profiles. Results show the individual memberships to each
of the five genetic clusters detected, with each vertical bar
representing an individual multilocus genotype. Colors indicate the
most likely ancestry of the cluster from which the genotype or partial
genotype was derived. Bars with multiple colors indicate admixtures
of genotypes from different clusters. Locations are separated by black
lines and their acronyms follow Table 1
1152 J. L. Garrido et al.
123
Author's personal copy

Bayesian and PCoA approaches (Fig. 4). It resolved with a
high bootstrap support (95.35%) two major clades, one
with the locations from the blue and purple lineages (BP
clade) and other with the locations from the green, red, and
orange lineages (GRO clade). Further, the clades corre-
sponding to the five lineages were also well supported
(blue: 100%, purple: 84.25%, green: 76.20%, and orange:
75.25%), although the clade matching to the red cluster
received a lower support (66.90%).
Complex admixture patterns could also be detected
here with PXV, AVA, VLM, VRG, and VLB presenting
undefined positions within the GRO clade. Additionally,
PAU and APG represented independent subclades within
the BP clade. Interestingly, both locations, together with
PD2 which represents an independent blue subclade, also
represent separated sub-clouds in the PCoA and are
highlighted as highly diverged and long-term isolated
localities.
Geographically, the green, red, and orange lineages
occur in all explored areas, while purple occurs only in the
East (Fig. 5b, c) and blue only in the North (Fig. 5a, b).
Pure red locations dominate in the Northwest (Cantabrian
range, Galaico-Leones Massif, and pre-coastal mountains;
Fig. 5a). The red lineage also occurs in some northeastern
locations, although exhibiting varying admixture levels
(Fig. 5b). Purely or predominantly green locations occur in
the Southeast (Sierras de Cazorla, Segura y Las Villas,
Fig. 5c), while the orange lineage predominates in the
South (Sierra Nevada and Sierra de Tejeda, Fig. 5d).
Purely or predominantly blue locations mainly occur in the
Northeast (Pyrenean range, Fig. 5b), but this lineage also
appears in the Northwest (central Cantabrian range,
Fig. 5a). Finally, purely purple locations occur in a small
southeastern area (Fig. 5c), and beyond this, purple lineage
abounds in two locations far separated to the north
(Fig. 5b): PAU in the eastern Iberian system and APG in
the southern Pyrenean range, both also segregated in the
PCoA and NJ ordinations and highlighted as long-term
isolated locations. Interestingly, BAPS highlighted the high
purple contributions of both locations (Online resource 3).
Although different levels of lineages admixture occur
throughout, all analytical approaches reflected that loca-
tions at the Iberian Northeast host the most remarkable
levels. PXV, VLM, APG, AVA, and VRG presented
admixtures of up to five lineages (Fig. 2).
Genetic diversity, markers rarity,
and differentiation among lineages
Estimates of genetic diversity and markers rarity supported
and complemented the genetic structure here defined.
Lineages differed significantly in genetic diversity (PPL:
F4,55 = 0.03, p = 0.0061; He: F4,55 = 2.91, p = 0.0294)
and markers rarity (NFM: F4,55 = 2.68, p = 0.0404; DW:
F4,55 = 3.66, p = 0.0102), with blue lineage hosting the
less genetically diverse and most long-term isolated loca-
tions. PPL and He in the blue lineage (22.8 and 0.0557,
respectively) were lower than those in the red (26.3 and
0.0714; Tukey’s Test: p = 0.0056 and p = 0.0070) and
green ones (26.9 and 0.0749; p\ 0.0001 and p = 0.0517).
PPL in the blue lineage was also lower than in the purple
one (26.4, p = 0.0202). Similarly, DW of the blue lineage
AP1-AP5
PD2
APG
AC1-AC7 AZ1
PAU A00 AV9 CSC CCB PC1 PC2 ACN ACS ACB
AV1-AV8 LHA LHC
AN1-AN5
AN6
D01-D11 EU1 EU2 SIL PD1 AMA VLM
VGR
PXV
VLB
AVA
PC1 (18.63 %)
-0.4 -0.3 -0.2 -0.1 0.0 0.1
PC
2 (1
2.91
%)
-0.2
-0.1
0.0
0.1
0.2
PC1 (18.63 %)
-0.4 -0.3 -0.2 -0.1 0.0 0.1
PC
3 (8
.46
%)
-0.2
-0.1
0.0
0.1
0.2
Fig. 3 PCoA ordination based on the Jaccard genetic distances
among the 276 Aquilegia individuals from 62 locations sampled
across the Iberian Peninsula. The upper plane is defined by PC1 and
PC2 factors and segregated individuals mostly corresponding to the
five genetic clusters defined by STRUCTURE (blue, purple, green,
orange, and red). The lower plane, defined by PC1 and PC3,
segregated blue and purple individuals. Symbols color refers to the
lineages detected by STRUCTURE analyses. Symbols shape indi-
cates different groups of locations as indicated in the legend
Geographic genetic structure of Iberian columbines (gen. Aquilegia) 1153
123
Author's personal copy

(17.96) was significantly lower than that of green (9.97;
p = 0.01924) and red (8.17; p = 0.0014). In addition, the
genetic structure model defined by STRUCTURE revealed
overall high FST values for all lineages (Purple: 0.49, Red:
0.50, Green: 0.53, Orange 0.52, Blue: 0.49).
Discussion
The overall genetic diversity of Aquilegia across the Ibe-
rian Peninsula is divided into five geographically structured
lineages that, as will be later detailed, largely agree with
the main Iberian taxonomic entities (Dıaz 1986). This
geographic structuring becomes reinforced by the differ-
ences among lineages in genetic diversity and isolation,
their high FST values, and the low overall levels of genetic
diversity, which further suggest low rates of gene flow for
the whole system.
Strongly spatially structured genetic patterns have been
observed in other Mediterranean species complexes, like
Nigella arvensis (Bittkau and Comes 2005), Viola suavis
(Mereda et al. 2011), and Anthemis secundiramea (Lo
Presti and Oberprieler 2011). Interestingly, strong geo-
graphic isolation and low genetic diversity within popu-
lations seem to be the rule in columbines, as also detected
in North American (Strand et al. 1996) and in the Sar-
dinian species (Garrido et al. 2012). In the northern
Mediterranean Basin, these strong geographic structurings
have been frequently attributed to its complex quaternary
paleographic and paleoclimatic history (Bennett et al.
1991; Medrano and Herrera 2008). Accordingly, the
heterogeneous Iberian topography and climate, together
with the limited dispersal ability of Aquilegia (Hodges
and Arnold 1994; Strand et al. 1996), seem to have
promoted a fragmented distribution, with a concomitant
genetic isolation, which have favored eventual processes
of species diversification through allopatric speciations
(Thompson 2005). Furthermore, and given that the Iberian
Aquilegia radiation started 1.77 my ago (Fior et al. 2013),
thus excluding major paleogeographic events as possible
Fig. 4 Unrooted neighbor-joining, majority rule 50% phenogram
based on the Nei and Li (1979) genetic distances among the 276
Aquilegia individuals sampled across the Iberian Peninsula, calcu-
lated from 476 AFLP loci. Numbers on basal branches indicate[60%
of node bootstrap support, based on 2000 bootstrap replicates. Values
[70% are shown in bold. Clades are colored according to the clusters
defined by STRUCTURE. Locations acronyms follow Table 1
1154 J. L. Garrido et al.
123
Author's personal copy

drivers, quaternary climate oscillations most probably
played the main role by generating secondary contacts
through range expansions and/or retractions of previously
isolated, related taxa (Comes and Kadereit 2003; Kadereit
et al. 2004), something, as will be later discussed, also
suggested by our data.
Before discussing how this pattern is geographically
structured, and far from pretending any kind of taxonomic
assessment (something this work is not specifically
designed to), we describe below how the geographic
genetic structure here found matches current Iberian
Aquilegia taxonomy, since this can support later
discussion.
Correspondence with current Iberian Aquilegia
taxonomy
Each of the five lineages detected corresponded to a single
taxonomic identity. The vast majority of locations grouped
in the green, red, orange, blue, and purple lineages exhib-
ited pure genotypes and are attributed to Avv, Avd, Avn,
App, and Apc, respectively (see Table 1 and Fig. 2). In
addition, the NJ phenogram revealed two major, well-
supported clades that split the localities attributed to A.
pyrenaica and those attributed to A. vulgaris. These major
clades were later divided according to the five lineages
detected (Fig. 4).
Fig. 5 Geographic genetic structure of the Iberian Aquilegia loca-
tions studied. Pie charts indicate the mean proportion of membership
of each local population to the five genetic groups detected by
STRUCTURE. It is represented separately in the four areas with more
coexisting taxa, as indicated in Fig. 1, namely Northwest (a), hosting
mostly pure red locations (red locations, hereafter); Northeast (b),with pure blue locations and highly admixtured, mainly red,
locations; Southeast (c), mainly green and purple locations; and
South (d), mainly orange locations. Note the different scales in panels
a, b and c, d
Geographic genetic structure of Iberian columbines (gen. Aquilegia) 1155
123
Author's personal copy

Apart from these pure locations attributed to the main
Iberian Aquilegia taxa, locations with undifferentiated
(PD2, AV2, and AV3) or complex (VLM, VLB, VRG, and
APG) genotypic profiles are ascribed to the less frequent
taxa (Apd, Apg, Avp, and Avi). But, there still remain a
number of locations (namely, PAU, A00, AV9, CSC, ACN,
ACB, ACS, AMA, SIL, PD1, AVA, and PXV) attributed to
taxa whose associated lineages do not correspond with
those suggested here by their genotypic profiles. This
generates an uncoupling between genetic and taxonomic
diversity that complicates traditional intra- and interspeci-
fic analyses of genetic variation based on a priori well-
defined populations and species.
PD2 is an almost pure blue (App) location represented
by a blue subgroup in the PCoA and NJ ordinations, and it
is described as Apd, a narrow endemic to the Cantabrian
range. AV2 and AV3 do not differ genetically from the rest
of green locations attributed to Avv and are attributed to
Avh, a currently questioned vulgaris subtaxa (Dıaz 1986).
VLM, VLB, and VRG are characterized by complex
admixtures and undefined positions among the vulgaris
groups in the PCoA and NJ ordinations. They are attributed
to Avi, the third, less frequent Iberian species, endemic to
the Iberian Northeast.
APG and PAU, although also host vulgaris genotypes,
are characterized by the admixture of blue (App) and,
particularly of purple (Apc) lineages. PCoA and NJ phe-
nogram place them as well-differentiated pyrenaica loca-
tions, next to Apc. APG is described as Apg, a narrow
endemic to the southern Pyrenean range, and PAU is
described as Avp, an extremely narrow endemic to the
eastern Iberian system. Its adscription as a vulgaris taxa,
given also its marked morphological differences with vul-
garis (Dıaz 1986, Martinell et al. 2011), does not agree
with our data, in the light of which, it could represent an
independent pyrenaica taxa, like APG. Its vulgaris
ascription has been attributed to a possible herbarium
confusion when firstly described by Font Quer in 1920
(Martinell et al. 2011).
A00, AV9, CSC, ACN, ACB, and ACS do not differ
genetically from the green locations attributed to Avv and
are ascribed to Apc. Their frequent intermediate morpho-
logical traits (M. Medrano and C. Herrera, personal obser-
vation), something coinciding with a minor but consistent
purple contribution (Online Resource 4), are probably
beneath this apparent misleading affiliation. AMA, SIL, and
PD1 do not differ genetically from pure red locations
attributed to Avd, which seems to mismatch with their
ascriptions as App, Avv, and Apd, respectively. At PD1, the
small individual size may have misled its classification as
Apd, the smallest Iberian Aquilegia taxa together with Avp.
As earlier commented for other northeastern locations,
AVA and PXV are characterized by complex admixtures
and undefined positions among the vulgaris groups in the
PCoA and NJ ordinations. AVA is described as Avv,
although genetically different from locations attributed to
Avv; and PXV is an undetermined location very similar
genotypically to VLM, described as Avi.
This uncoupling between genetic and taxonomic struc-
ture, eventually leading to numerous gene trees/species
trees incongruences, is common in rapidly radiating plants
(e.g., Wang et al. 2005, Whitfield and Lockhart 2007, Parks
et al. 2009, Rymer et al. 2010) and reflects the recent and
rapid nature of the Aquilegia radiation, particularly in
Southern Europe (Bastida et al. 2010, Fior et al. 2013).
Both in North America (Hodges and Arnold 1994, Ro and
McPheron 1997, Whittal et al. 2006, Whittal and Hodges
2007, Fior et al. 2013) and Eurasia (Bastida et al. 2010,
Fior et al. 2013), Aquilegia diversification has led to a high
number of low genetically divergent or hybrid taxa that
exhibit marked morphological differences.
Differentiation among lineages
Regarding how this pattern is geographically structured,
the mosaic of complex genetic profiles (i.e., complex
admixture patterns and undefined positions in PCoA and
NJ ordinations) represented by the northeastern locations
contrasts with the numerous genetically defined south-
ern/southeastern and northwestern locations. This depicts a
whole Iberian diversification scenario where lineages
remain highly undefined at the Northeast (a hotchpotch of
all Iberian lineages) and seem more differentiated both to
the South/Southeast and, particularly, to the Northwest.
Hence, our data point to the Iberian Northeast as a par-
ticularly active area in the Iberian Aquilegia diversification,
while toward southern and northwestern mountain systems
the process turns less active. Not in vain, some genetically
complex northeastern locations define different narrow
endemic taxa (Avi at VLM, Apg at APG, and Avp at PAU),
which in turn, further coexist with some genetically defined
taxa like App. Differently, the other areas are dominated by
fewer and better defined taxa (Avd, at Northwest; Avv and
Apc, at Southeast; and Avn, at South). The Iberian North-
east has also been highlighted as a particularly diverse area
for other plants which has been attributed to its role as a
contact zone with taxa from the other side of the Pyrenean
range due to postglacial migrations and to its role as qua-
ternary glacial refugium (see e.g.,: Olalde et al. 2002, on
white oaks; Magri et al. 2006, on European beeches; and
Cottrell et al. 2005, on black poplars).
Out of all different links among Iberian lineages, those
among green, red, and orange ones (Avv, Avd, and Avn,
respectively) are particularly frequent and can be detected
throughout the Iberian Peninsula, especially in the North-
east. These lineages (regarded as subspecies of A. vulgaris)
1156 J. L. Garrido et al.
123
Author's personal copy

are older than blue and purple (regarded as subspecies of A.
pyrenaica), since A. pyrenaica is a more recently derived
taxon (Bastida et al. 2010). This, together with their
ubiquity, may reflect a certain degree of incomplete lineage
sorting (ILS, hereafter) among them. Which may be also
supported by the southern orange/red and southeastern
green/orange links, where distances and habitats separating
both lineages make hybridization highly difficult. Given
the recent and rapid nature of Aquilegia diversification
(particularly of its southern European clade; Bastida et al.
2010, Fior et al. 2013), high ILS levels would imply that
genetic drift is unlikely to have had time, even dealing with
these oldest lineages, to bring loci to fixation before sub-
sequent divergence episodes (Pamilo and Nei 1988; Mad-
dison and Knowles 2006). Interestingly, localities with
admixtures exclusively involving these lineages hosted less
fixed loci than the rest (82.43 ± 11.34 vs. 88.59 ± 9.13;
F1,58 = 4.68, p = 0.0345). Despite this, since ILS effects
are difficult to distinguish from those of hybridization
events, these admixtures may also reflect hybridization, as
will be discussed later.
Links involving blue and purple lineages, although less
frequent, also reveal interesting cues on the Iberian diver-
sification of Aquilegia, probably related to quaternary
range shifts. The blue lineage (App) is limited to some
areas across northern ranges, while the purple one (Apc) is
restricted to a small southeastern area. Thus, their co-oc-
currence at some northeastern locations, particularly rele-
vant at PAU and APG, makes them stand as possible
footprints of a past coexistence of blue and purple lineages
at northeastern mountain systems. Interestingly both are
highly isolated and genetically differentiated locations
defining the potentially hybrid taxa Avp and Apg, respec-
tively. Purple lineage would thus have been distributed
northwards, across eastern mountain systems, and later
retracted to its current restricted southeastern Prebetic
distribution (not in vain, a putative quaternary refugium for
many plants; Medail and Diadema 2009). And, on the other
hand, blue lineage would have reached eastern mountains
systems, facing southwards the strong barrier represented
by the Ebro river depression. These kinds of range shifts
are well known to influence current geographic genetic
patterns of many western European floras (Martın-Bravo
et al. 2010; Nieto Feliner 2014), particularly of endemic
mountain species (Kropf et al. 2003). They were generated
by climate oscillations that became particularly pro-
nounced in the last 0.7 my (Taberlet et al. 1998; Kadereit
et al. 2004). Therefore, given that European Aquilegia have
diversified in the last 1.7 my (Bastida et al. 2010), they
have surely exerted an exceeding influence due to their
coincidence along a large part of the Iberian Aquilegia
divergence time.
Apart from these links among vulgaris and among
pyrenaica lineages, admixtures of both were also detected
at the Northeast and Southeast, probably indicating inter-
specific processes of hybridization. Northeastern APG,
VLM, PAU, and PXV locations consist of varying geno-
typic contributions of different pyrenaica and vulgaris
lineages and define the potentially hybrid taxa Apg, Avi,
and Avp, respectively (PXV was undetermined). Given that
gene flow increases the sharing of ancestral polymorphisms
(Wang et al. 1997; Machado et al. 2002, Maddison and
Knowles 2006), like those retained by ILS, these north-
eastern hybridizations could explain why in this area the
process of lineage sorting seems in more incomplete stages
and is more persistent than at other Iberian areas. In the
southeast, green (Avv) and purple (Apc) groups are parap-
atrically distributed with a clear contact zone where
potentially introgressive hybridization may be taking place.
Not in vain, when this area was analytically focused, green
localities closer to purple group revealed minor but con-
sistent purple contributions (Online Resource 4). Interest-
ingly, these locations exhibited intermediate morphological
traits between both species (see discussion on correspon-
dence with taxonomy).
Conclusions
This highly geographically structured pattern is consistent
with the current knowledge on European and Iberian
Aquilegia taxa. Recent studies on the whole genus (Fior
et al. 2013) and, specifically, on Euroasiatic taxa (Bastida
et al. 2010) suggest that divergence of southern European
lineages is initially shaped by geographic isolation and
habitat partitioning. Further, given that the limited disper-
sal ability of the genus (Hodges and Arnold 1994; Strand
et al. 1996) makes long distance dispersal events unlikely
(but see Garrido et al. 2012; Lega et al. 2014), allopatric
speciation is proposed to have played a key role in the
European Aquilegia divergence, particularly, in geograph-
ically restricted contexts (Fior et al. 2013) like those cor-
responding here to the numerous endemic (Avd, Avi, Avn)
and narrow endemic (App, Apc, Apd, Avp, and Apg) taxa
inhabiting the Iberian Peninsula.
Regarding the underlying evolutionary drivers of the
Iberian Aquilegia diversification, several studies have
found evidence of how different environmental habitat
parameters impose divergent selection patterns on pheno-
typic divergence and ecotypic differentiation (Alcantara
et al. 2010; Jaime et al. 2013; Bastida et al. 2014). Green
(Avv), purple (App), and orange (Avn) lineages coexist in
the same area, thus surely having experienced the same
climate changes over the last millennia. However, their
Geographic genetic structure of Iberian columbines (gen. Aquilegia) 1157
123
Author's personal copy

different environmental requirements may have determined
different effects of climate oscillations on each one,
eventually entailing different evolutionary consequences.
The widely distributed Avv inhabits permanent water
courses at lower altitudes, while Apc and Avn mainly
occupy springs in the higher parts of the mountains (Jaime
et al. 2013; Bastida et al. 2014). Thus, Apc and Avn pop-
ulations may be intrinsically small and isolated regardless
of the climatic scenario, while Avv can expand and/or
retract along the river network according to climatic
oscillations.
The pattern here proposed has revealed the effects of
quaternary range shifts, strongly influenced by the high
interfertility of these taxa (Prazmo 1965; Taylor 1967).
Postglacial migrations and geographic isolations would
have occurred over very short time periods thus not giving
enough time for the genetic drift to act, which further, may
be beneath the ILS detected. These circumstances are
responsible of the morphological/genetic uncoupling found
and entangle the Iberian Aquilegia diversification, partic-
ularly in the Northeast, where many cases of hybridized
identities, likely incipient taxa, appear defined as separate
species (Avi) or subspecies (Avp, Apg).
Acknowledgements Authors thank D. Guzman and A.R. Larrinaga
for his invaluable aid while sampling at Pyrenees. At Sierras de
Segura y Cazorla, A. Benavente helped us finding locations and S.
Arenas assisted in the field. We also benefited from the helpful advice
of P. Bazaga on laboratory procedures. M.C. Martinell provided DNA
extract from Avp. We also thank the Remote Sensing and Geographic
Information Systems Laboratory of EBD (LAST-EBD). Bioinfor-
matic STRUCTURE analyses were carried out on the (earlier times)
freely available Bioportal (www.bioportal.uio.no). This work was
partly supported by Grant BOS2003-03979-C02-01, BOS2003-
03979-C02-02, and CGL2006-01355/BOS from Ministerio Ciencia y
Tecnologıa. During part of this work JLG was granted by the post-
doctoral program (EX2003-0376) of Ministerio Educacion, Cultura y
Deporte, and by the Severo Ochoa Program for Centres of Excellence
in R?D?I (SEV-2012-0262) of Ministerio de Economıa y
Competitividad.
Compliance with Ethical Standards
Human and animal rights The authors declare that the research
included in this article accomplishes with the ethical standards of the
journal and with all legal requirements regarding samples collection.
All authors have been informed and consent with this submission.
Founding sources have been declared both in Acknowledgements
section as well as in the online submission form. The research does
not involve human participants and/or animals.
Conflict of interest The authors declare that they have no conflict of
interest.
Information on Electronic Supplementary Material
Online Resource 1. Details on primers combinations used.
Online Resource 2. Variation in DK parameter for the STRUCTURE
analysis.
Online Resource 3. Admixture analysis performed with BAPS.
Online Resource 4. STRUCTURE analysis specifically performed on
Prebetic locations.
References
Alcantara JM, Bastida JM, Rey PJ (2010) Linking divergent selection
on vegetative traits to environmental variation and phenotypic
diversification in the Iberian columbines (Aquilegia). J Evol Biol
23:1218–1233. doi:10.1111/j.1420-9101.2010.01981.x
Alcantara JM, Jaime R, Bastida JM, Rey PJ (2014) The role of genetic
constraints on the diversification of Iberian taxa of the genus
Aquilegia (Ranunculaceae). Biol J Linn Soc 111:252–261.
doi:10.1111/bij.12215
Bastida JM, Alcantara JM, Rey PJ, Vargas P, Herrera CM (2010)
Extended phylogeny of Aquilegia: the biogeographical and
ecological patterns of two simultaneous but contrasting radiations.
Pl Syst Evol 284:171–185. doi:10.1007/s00606-009-0243-z
Bastida JM, Rey PJ, Alcantara JM (2014) Plant performance and
morpho-functional differentiation in response to edaphic varia-
tion in Iberian columbines: cues for range distribution? J Pl Ecol
7:403–412. doi:10.1093/jpe/rtt046
Bennett KD, Tzedakis PC,Willis KJ (1991) Quaternary refugia of North
European trees. J Biogeogr 18:103–115. doi:10.2307/2845248
Bittkau C, Comes HP (2005) Evolutionary processes in a continental
island system: molecular phylogeography of the Aegean Nigella
arvensis alliance (Ranunculaceae) inferred from chloroplast
DNA. Molec Ecol 14:4065–4083. doi:10.1111/j.1365-294X.
2005.02725.x
Bonin A, Ehrich D, Manel S (2007) Statistical analysis of amplified
fragment length polymorphism data: a toolbox for molecular
ecologists and evolutionists. Molec Ecol 16:3737–3758. doi:10.
1111/j.1365-294X.2007.03435.x
Castellanos MC, Alcantara JM, Rey PJ, Bastida JM (2011) Intra-
population comparison of vegetative and floral trait heritabilities
estimated from molecular markers in wild Aquilegia populations.
Molec Ecol 20:3513–3524. doi:10.1111/j.1365-294X.2011.
05094.x
Comes HP, Kadereit JW (2003) Spatial and temporal patterns in the
evolution of the flora of the European Alpine System. Taxon
52:451–462
Corander J, Marttinen P (2006) Bayesian identification of admixture
events using multi-locus molecular markers. Molec Ecol
15:2833–2843. doi:10.1111/j.1365-294X.2006.02994.x
Corander J, Waldmann P, Sillanpaa MJ (2003) Bayesian analysis of
genetic differentiation between populations. Genetics
163:367–374
Cottrell JE, Krystufek V, Tabbener HE,Milner AD, Connolly T, Sing L,
Fluch S, Burg K, Lefevre F, Achard P, Bordacs S, Gebhardt K,
Vornam B, Smulders MJM, Broeck AHV, Slycken JV, Storme V,
Boerjan W, Castiglione S, Fossati T, Alba N, Agundez D, Maestro
C, Notivol E, Bovenschen J, Dam BC (2005) Postglacial migration
of Populus nigra L.: lessons learnt from chloroplast DNA. Forest
Ecol Managem 206:71–90. doi:10.1016/j.foreco.2004.10.052
Cullen J, Heywood VH (1964) Aquilegia. In: Tutin TG, Heywood
VH, Burges NA, Moore DM, Valentine DH, Walters SM, Webb
DA (eds) Flora Europea 1, Cambridge University Press,
Cambridge, pp 238–240
Dıaz T (1986) Aquilegia L. In: Castroviejo S (ed) Flora iberica:
plantas vasculares de la Penınsula Iberica e Islas Baleares. Real
Jardın Botanico de Madrid (CSIC), Madrid, pp 376–387
1158 J. L. Garrido et al.
123
Author's personal copy

Earl DA, vonHoldt BM (2012) STRUCTURE HARVESTER: a
website and program for visualizing STRUCTURE output and
implementing the Evanno method. Conservation Genet
Resources 4:359–361
Edh K, Widen B, Ceplitis A (2007) Nuclear and chloroplast
microsatellites reveal extreme population differentiation and
limited gene flow in the Aegean endemic Brassica cretica
(Brassicaceae). Molec Ecol 16:4972–4983. doi:10.1111/j.1365-
294X.2007.03585.x
Ehrich D (2006) AFLPdat: a collection of R functions for convenient
handling of AFLP data. Molec Ecol Notes 6:603–604. doi:10.
1111/j.1471-8286.2006.01380.x
Ehrich D, Gaudeul M, Assefa A, Koch MA, Mummenhoff K,
Nemomissa S, Consortium I, Brochmann C (2007) Genetic
consequences of Pleistocene range shifts: contrast between the
Arctic, the Alps and the East African mountains. Molec Ecol
16:2542–2559. doi:10.1111/j.1365-294X.2007.03299.x
Evanno G, Regnaut S, Goudet J (2005) Detecting the number of
clusters of individuals using the software STRUCTURE: a
simulation study. Molec Ecol 14:2611–2620. doi:10.1111/j.
1365-294X.2005.02553.x
Falush D, Stephens M, Pritchard JK (2003) Inference of population
structure using multilocus genotype data: linked loci and
correlated allele frequencies. Genetics 164:1567–1587
Falush D, Stephens M, Pritchard JK (2007) Inference of population
structure using multilocus genotype data: dominant markers and
null alleles. Molec Ecol Notes 7:574–578. doi:10.1111/j.1471-
8286.2007.01758.x
Felsenstein J (2005) PHYLIP (phylogeny inference package) version
3.6. Distributed by the author. Department of Genome Sciences,
University of Washington, Seattle
Fior S, Li MG, Oxelman B, Viola R, Hodges SA, Ometto L, Varotto C
(2013) Spatiotemporal reconstruction of the Aquilegia rapid
radiation through next-generation sequencing of rapidly evolving
cpDNA regions. New Phytol 198:579–592. doi:10.1111/nph.12163
Garrido JL, Fenu G, Mattana E, Bacchetta G (2012) Spatial genetic
structure of Aquilegia taxa endemic to the island of Sardinia.
Ann Bot (Oxford) 109:953–964. doi:10.1093/aob/mcs011
Herrera CM, Bazaga P (2009) Quantifying the genetic component of
phenotypic variation in unpedigreed wild plants: tailoring
genomic scan for within-population use. Molec Ecol
18:2602–2614. doi:10.1111/j.1365-294X.2009.04229.x
Hodges SA (1997) Floral nectar spurs and diversification. Int J Pl Sci
158:81–88
Hodges SA, Arnold ML (1994) Columbines - a geographically
widespread species flock. Proc Natl Acad Sci USA
91:5129–5132
Hodges SA, Derieg NJ (2009) Adaptive radiations: from field to
genomic studies. Proc Nat Acad Sci USA 106:9947–9954
Holland BR, Clarke AC, Meudt HM (2008) Optimizing automated
AFLP scoring parameters to improve phylogenetic resolution.
Syst Biol 57:347–366. doi:10.1080/10635150802044037
Hubisz MJ, Falush D, Stephens M, Pritchard JK (2009) Inferring
weak population structure with the assistance of sample group
information. Molec Ecol Res 9:1322–1332. doi:10.1111/j.1755-
0998.2009.02591.x
Jaime R, Rey PJ, Alcantara JM, Bastida JM (2013) Glandular
trichomes as an inflorescence defence mechanism against insect
herbivores in Iberian columbines. Oecologia 172:1051–1060.
doi:10.1007/s00442-012-2553-z
Jaime R, Serichol C, Alcantara JM, Rey PJ (2014) Differences in gas
exchange contribute to habitat differentiation in Iberian columbi-
nes from contrasting light and water environments. Pl Biol
16:354–364. doi:10.1111/plb.12064
Jakobsson M, Rosenberg NA (2007) CLUMPP: a cluster matching
and permutation program for dealing with label switching and
multimodality in analysis of population structure. Bioinformatics
23:1801–1806. doi:10.1093/bioinformatics/btm233
Joly S, McLenachan PA, Lockhart PJ (2009) A Statistical approach
for distinguishing hybridization and incomplete lineage sorting.
Amer Naturalist 174:E54–E70
Kadereit JW, Griebeler EM, Comes HP (2004) Quaternary diversi-
fication in European alpine plants: pattern and process. Philos
Trans Ser B 359:265–274. doi:10.1098/rstb.2003.1389
Kropf M, Kadereit JW, Comes HP (2003) Differential cycles of range
contraction and expansion in European high mountain plants
during the Late Quaternary: insights from Pritzelago alpina (L.)
O. Kuntze (Brassicaceae). Molec Ecol 12:931–949. doi:10.1046/
j.1365-294X.2003.01781.x
Krzanowski WJ (1990) Principles of multivariate analysis. Clarendon,
Oxford
LegaM, Fior S, Li M, Leonardi S, Varotto C (2014) Genetic drift linked
to heterogeneous landscape and ecological specialization drives
diversification in the alpine endemic columbine Aquilegia thalic-
trifolia. J Heredity 105:542–554. doi:10.1093/jhered/esu028
Lo Presti RM, Oberprieler C (2011) The central Mediterranean as a
phytodiversity hotchpotch: phylogeographical patterns of the
Anthemis secundiramea group (Compositae, Anthemideae)
across the Sicilian Channel. J Biogeogr 38:1109–1124. doi:10.
1111/j.1365-2699.2010.02464.x
Machado CA, Kliman RM, Markert JA, Hey J (2002) Inferring the
history of speciation from multilocus DNA sequence data: the
case of Drosophila pseudoobscura and close relatives. Molec
Biol Evol 19:472–488. doi:10.1093/oxfordjournals.molbev.
a004103
Maddison WP, Knowles LL (2006) Inferring phylogeny despite
incomplete lineage sorting. Syst Biol 55:21–30. doi:10.1080/
10635150500354928
Magri D, Vendramin GG, Comps B, Dupanloup I, Geburek T,
Gomory D, Latalowa M, Litt T, Paule L, Roure JM, Tantau I,
van der Knaap OW, Petit RJ, de Beaulieu JL (2006) A new
scenario for the Quaternary history of European beech popula-
tions: palaeobotanical evidence and genetic consequences. New
Phytol 171:199–221. doi:10.1111/j.1469-8137.2006.01740.x
Martın-Bravo S, Valcarcel V, Vargas P, Luceno M (2010) Geo-
graphical speciation related to Pleistocene range shifts in the
western Mediterranean mountains (Reseda sect. Glaucoreseda,
Resedaceae). Taxon 59:466–482
Martinell MC, Rovira A, Blanche C, Bosch M (2011) Shift towards
autogamy in the extremely narrow endemic Aquilegia paui and
comparison with its widespread close relative A. vulgaris
(Ranunculaceae). Pl Syst Evol 295:73–82. doi:10.1007/s00606-
011-0463-x
Medail F, Diadema K (2009) Glacial refugia influence plant diversity
patterns in the Mediterranean Basin. J Biogeogr 36:1333–1345.
doi:10.1111/j.1365-2699.2008.02051.x
Medrano M, Herrera CM (2008) Geographical structuring of genetic
diversity across the whole distribution range of Narcissus
longispathus, a habitat-specialist, Mediterranean narrow ende-
mic. Ann Bot (Oxford) 102:183–194. doi:10.1093/aob/mcn086
Medrano M, Castellanos C, Herrera CM (2006) Comparative floral
and vegetative differentiation between two European Aquilegia
taxa along a narrow contact zone. Pl Syst Evol 262:209–224.
doi:10.1007/s00606-006-0473-2
Mereda P, Hodalova I, Kucera J, Zozomova-Lihova J, Letz DR,
Slovak M (2011) Genetic and morphological variation in Viola
suavis s.l. (Violaceae) in the western Balkan Peninsula: two
endemic subspecies revealed. Syst Biodivers 9:211–231. doi:10.
1080/14772000.2011.603903
Meudt HM, Clarke AC (2007) Almost forgotten or latest practice?
AFLP applications, analyses and advances. Trends Pl Sci
12:106–117. doi:10.1016/j.tplants.2007.02.001
Geographic genetic structure of Iberian columbines (gen. Aquilegia) 1159
123
Author's personal copy

Nei M (1978) Estimation of average heterozygosity and genetic
distance from a small number of individuals. Genetics
89:583–590
Nei M (1987) Molecular Evolutionary Genetics. Columbia University
Press, New York
Nei M, Li WH (1979) Mathematical model for studying genetic
variation in terms of restriction endonucleases. Proc Natl Acad
Sci USA 76:5269–5273
Nieto Feliner G (2014) Patterns and processes in plant phylogeog-
raphy in the Mediterranean Basin. A review. Perspect Pl Ecol
Evol Syst 16:265–278. doi:10.1016/j.ppees.2014.07.002
Nold R (2003) Columbines. Aquilegia, Paraquilegia and Semiaqui-
legia. Timber Press, Cambridge
Olalde M, Herran A, Espinel S, Goicoechea PG (2002) White oaks
phylogeography in the Iberian Peninsula. Forest Ecol Managem
156:89–102. doi:10.1016/S0378-1127(01)00636-3
Pamilo P, Nei M (1988) Relationships between gene trees and species
trees. Molec Biol Evol 5:568–583. doi:10.1093/oxfordjournals.
molbev.a040517
Parks M, Cronn R, Liston A (2009) Increasing phylogenetic
resolution at low taxonomic levels using massively parallel
sequencing of chloroplast genomes. BMC Biol 7:84. doi:10.
1186/1741-7007-7-84
Prazmo W (1965) Cytogenetic studies on the genus Aquilegia. III.
Inheritance of the traits distinguishing different complexes in the
genus Aquilegia. Acta Soc Bot Poloniae 34:403–437. doi:10.
5586/asbp.1965.031
Pritchard JK, Stephens M, Donnelly P (2000) Inference of population
structure using multilocus genotype data. Genetics 155:945–959
Ro KE, McPheron BA (1997) Molecular phylogeny of the Aquilegia
group (Ranunculaceae) based on internal transcribed spacers and
5.8S nuclear ribosomal DNA. Biochem Syst Ecol 25:445–461.
doi:10.1016/S0305-1978(97)00029-X
Rosenberg NA (2004) DISTRUCT: a program for the graphical
display of population structure. Molec Ecol Notes 4:137–138.
doi:10.1046/j.1471-8286.2003.00566.x
Rymer PD, Manning JC, Goldblatt P, Powell MP, Savolainen V
(2010) Evidence of recent and continuous speciation in a
biodiversity hotspot: a population genetic approach in southern
African gladioli (Gladiolus; Iridaceae). Molec Ecol
19:4765–4782. 10.1111/j.1365-294X.2010.04794.x
Schluter PM, Harris SA (2006) Analysis of multilocus fingerprinting
data sets containing missing data. Molec Ecol Notes 6:569–572.
doi:10.1111/j.1471-8286.2006.01225.x
Schonswetter P, Tribsch A (2005) Vicariance and dispersal in the
alpine perennial Bupleurum stellatum L. (Apiaceae). Taxon
54:725–732
Strand AE, Milligan BG, Pruitt CM (1996) Are populations islands?
Analysis of chloroplast DNA variation in Aquilegia. Evolution
50:1822–1829. doi:10.2307/2410739
Swofford DL (2002) PAUP*. Phylogenetic analysis using parsimony
(*and other methods).Version 4. Sinauer Associates, Sunderland,
Massachusetts
Taberlet P, Fumagalli L, Wust-Saucy AG, Cosson JF (1998) Compar-
ativephylogeographyandpostglacial colonization routes inEurope.
Molec Ecol 7:453–464. doi:10.1046/j.1365-294x.1998.00289.x
Taylor RJ (1967) Interspecific hybridization and its evolutionary
significance in genus Aquilegia. Brittonia 19:374–390. doi:10.
2307/2805535
Thompson JD (2005) Plant Evolution in the Mediterranean. Oxford
University Press, New York
Vekemans X (2002) AFLP-SURV version 1.0. Distributed by the
author, Laboratoire de Genetique et Ecologie Vegetale, Univer-
site Libre de Bruxelles, Bruxelles
Vos P, Hogers R, Bleeker M, Reijans M, Vandelee T, Hornes M,
Frijters A, Pot J, Peleman J, Kuiper M, Zabeau M (1995) AFLP -
a New Technique for DNA-Fingerprinting. Nucl Acids Res
23:4407–4414. doi:10.1093/nar/23.21.4407
Wang RL, Wakeley J, Hey J (1997) Gene flow and natural selection
in the origin of Drosophila pseudoobscura and close relatives.
Genetics 147:1091–1106
Wang AL, Yang MH, Liu JQ (2005) Molecular phylogeny, recent
radiation and evolution of gross morphology of the rhubarb
genus Rheum (Polygonaceae) inferred from chloroplast DNA
trnL-F sequences. Ann Bot (Oxford) 96:489–498. doi:10.1093/
aob/mci201
Whitfield JB, Lockhart PJ (2007) Deciphering ancient rapid radia-
tions. Trends Ecol Evol 22:258–265. doi:10.1016/j.tree.2007.01.
012
Whittall JB, Hodges SA (2007) Pollinator shifts drive increasingly
long nectar spurs in columbine flowers. Nature 447:U706–U712
Whittall JB, Medina-Marino A, Zimmer EA, Hodges SA (2006)
Generating single-copy nuclear gene data for a recent adaptive
radiation. Molec Phylogen Evol 39:124–134. doi:10.1016/j.
ympev.2005.10.010
Whittemore AT (1997) Aquilegia. In: Morin NR (ed) Flora of North
America. Oxford University Press, New York
1160 J. L. Garrido et al.
123
Author's personal copy