Embed Size (px)
Citation preview
This article appeared in a journal published by Elsevier. The attachedcopy is furnished to the author for internal non-commercial researchand education use, including for instruction at the authors institution
and sharing with colleagues.
Other uses, including reproduction and distribution, or selling orlicensing copies, or posting to personal, institutional or third party
websites are prohibited.
In most cases authors are permitted to post their version of thearticle (e.g. in Word or Tex form) to their personal website orinstitutional repository. Authors requiring further information
regarding Elsevier’s archiving and manuscript policies areencouraged to visit:
http://www.elsevier.com/copyright
Author's personal copy
Late glacial and Holocene sedimentation, vegetation, and climate history fromeasternmost Beringia (northern Yukon Territory, Canada)
Michael Fritz a,⁎, Ulrike Herzschuh a,b, Sebastian Wetterich a, Hugues Lantuit a, Gregory P. De Pascale c,Wayne H. Pollard d, Lutz Schirrmeister a
a Alfred Wegener Institute for Polar and Marine Research, Department of Periglacial Research, Telegrafenberg A43, 14473 Potsdam, Germanyb Potsdam University, Institute of Earth and Environmental Sciences, Karl-Liebknecht-Str. 24–25, 14476 Potsdam-Golm, Germanyc University of Canterbury, Department of Geological Sciences, Private Bag 4800, Christchurch 8140, New Zealandd McGill University, Department of Geography, 805 Sherbrooke St. West, H3A2K6 Montreal, Quebec, Canada
a b s t r a c ta r t i c l e i n f o
Article history:Received 5 August 2011Available online 11 August 2012
Keywords:Trout LakeLaurentide Ice SheetYounger DryasHolocene thermal maximumLake sedimentsPollenTemperature reconstructionPrecipitation reconstructionWAPLSModern analogue technique
Beringian climate and environmental history are poorly characterized at its easternmost edge. Lake sedi-ments from the northern Yukon Territory have recorded sedimentation, vegetation, summer temperatureand precipitation changes since ~16 cal ka BP. Herb-dominated tundra persisted until ~14.7 cal ka BP withmean July air temperatures ≤5°C colder and annual precipitation 50 to 120 mm lower than today. Temper-atures rapidly increased during the Bølling/Allerød interstadial towards modern conditions, favoring estab-lishment of Betula-Salix shrub tundra. Pollen-inferred temperature reconstructions recorded a pronouncedYounger Dryas stadial in east Beringia with a temperature drop of ~1.5°C (~2.5 to 3.0°C below modernconditions) and low net precipitation (90 to 170 mm) but show little evidence of an early Holocene thermalmaximum in the pollen record. Sustained low net precipitation and increased evaporation during early Holocenewarming suggest a moisture-limited spread of vegetation and an obscured summer temperature maximum.Northern Yukon Holocene moisture availability increased in response to a retreating Laurentide Ice Sheet,postglacial sea level rise, and decreasing summer insolation that in turn led to establishment of Alnus-Betulashrub tundra from ~5 cal ka BP until present, and conversion of a continental climate into a coastal-maritime cli-mate near the Beaufort Sea.
© 2012 University of Washington. Published by Elsevier Inc. All rights reserved.
Introduction
During the late Wisconsin glacial episode (28–10 cal ka BP), theBering land bridge connected the unglaciated parts of Alaska andthe Yukon Territory with eastern Siberia to form an extensive contin-uous landmass known as Beringia (Hopkins, 1982). Beringian envi-ronments are of particular interest because they served as glacialrefugia for various taxa (Hultén, 1937; Guthrie, 2001) and enabledthe migration of plants, animals, and early humans between Eurasiaand North America (Morlan and Cinq-Mars, 1982; Mason et al., 2001).The northern Yukon was the easternmost boundary of Beringia andin close vicinity to the Laurentide Ice Sheet (LIS). It has undergone dis-tinct changes in climate, landscape, and ecology after the late glacial−Holocene transition that includes the latest part of the full glacial, thelate glacial warming known as the Bølling/Allerød (B/A) interstadial,the Younger Dryas (YD) stadial, and the early Holocene thermal maxi-mum (HTM). Paleoenvironmental evidence for the YD is found in
terrestrial and lake sediment records (e.g., Elias, 2000; Brubaker et al.,2001; Briner et al., 2002; Hu et al., 2002; Yu et al., 2008) as well as inground ice from Alaska (Meyer et al., 2010). However, the regionalpaleoclimate dynamics during the late glacial–Holocene transition andthe YD in general–and in east Beringia in particular–are still notcompletely understood (Hu et al., 2006; Viau et al., 2008).
Although a number of paleoenvironmental investigations have beenundertaken in eastern Beringia, hitherto only one lake sediment recordhas been available from the northern Yukon that provides a continuousrecord of vegetation change (Hanging Lake; Cwynar, 1982). The HangingLake recordwas thought to cover a timeperiod from~33 14C ka BP to thepresent (Cwynar, 1982). However, this lake record was recently revisedto infer a maximum-limiting age of ~17 cal ka BP (Kurek et al., 2009).
Even though there is a general consensus that unglaciated late gla-cial landscapeswere a heterogeneousmosaic of vegetation communities(Kurek et al., 2009), little is known about vegetation and temperaturedynamics northwest of the collapsing LIS close to the Arctic Ocean.Several studies have focused onbiological proxies suchaspollen, chiron-omids, and ostracods to reconstruct air temperatures (Bunbury andGajewski, 2009; Kurek et al., 2009), vegetation history (e.g., Rampton,
Quaternary Research 78 (2012) 549–560
⁎ Corresponding author. Fax: +49 331 288 2188.E-mail address: [email protected] (M. Fritz).
0033-5894/$ – see front matter © 2012 University of Washington. Published by Elsevier Inc. All rights reserved.http://dx.doi.org/10.1016/j.yqres.2012.07.007
Contents lists available at SciVerse ScienceDirect
Quaternary Research
j ourna l homepage: www.e lsev ie r .com/ locate /yqres
Author's personal copy
1971; Cwynar, 1982; Ritchie, 1984; Cwynar and Spear, 1995; Lacourseand Gajewski, 2000; Vermaire and Cwynar, 2010), and changes in avail-able moisture and lake level (Pienitz et al., 2000; Kurek et al., 2009).However, only a few studies have investigated the late Pleistoceneand Holocene sedimentation history or have taken into accountlake-basin evolution and limnogeological succession (Engstromet al., 2000). Nevertheless, such studies are important because thedevelopment of lakes in easternmost Beringia in close vicinity tothe former LIS margin is still understudied, though such lakes oftencontain continuous paleoenvironmental archives.
The aim of this study was, therefore, to gain a comprehensive un-derstanding of the timing of landscape and environmental changesin the unglaciated northern Yukon since the late Wisconsin usinglake sediments from Trout Lake to address the following specificquestions:
1. How did lake sedimentation respond to the late glacial–Holoceneclimate transition in close vicinity to the collapsing LIS?
2. What were the mean July air temperatures in ice-marginal easternBeringia since the late glacial–Holocene transition?
3. Was there a pronounced YD stadial in east Beringia far apart froman Atlantic and Pacific influence, and if so, what were the climaticmagnitudes?
4. How did pollen-inferred moisture patterns correspond to LIS re-treat, postglacial sea-level rise and Holocene warming?
Study site and regional setting
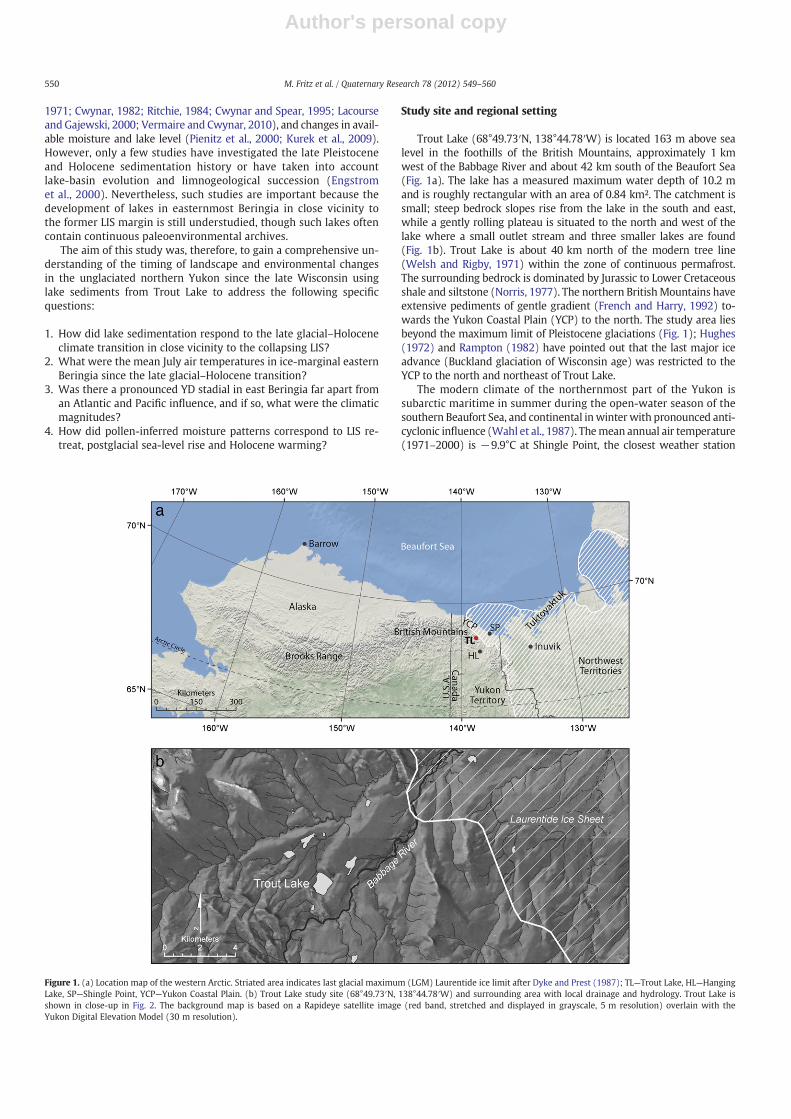
Trout Lake (68°49.73′N, 138°44.78′W) is located 163 m above sealevel in the foothills of the British Mountains, approximately 1 kmwest of the Babbage River and about 42 km south of the Beaufort Sea(Fig. 1a). The lake has a measured maximum water depth of 10.2 mand is roughly rectangular with an area of 0.84 km². The catchment issmall; steep bedrock slopes rise from the lake in the south and east,while a gently rolling plateau is situated to the north and west of thelake where a small outlet stream and three smaller lakes are found(Fig. 1b). Trout Lake is about 40 km north of the modern tree line(Welsh and Rigby, 1971) within the zone of continuous permafrost.The surrounding bedrock is dominated by Jurassic to Lower Cretaceousshale and siltstone (Norris, 1977). The northern BritishMountains haveextensive pediments of gentle gradient (French and Harry, 1992) to-wards the Yukon Coastal Plain (YCP) to the north. The study area liesbeyond the maximum limit of Pleistocene glaciations (Fig. 1); Hughes(1972) and Rampton (1982) have pointed out that the last major iceadvance (Buckland glaciation of Wisconsin age) was restricted to theYCP to the north and northeast of Trout Lake.
The modern climate of the northernmost part of the Yukon issubarctic maritime in summer during the open-water season of thesouthern Beaufort Sea, and continental in winter with pronounced anti-cyclonic influence (Wahl et al., 1987). Themean annual air temperature(1971–2000) is −9.9°C at Shingle Point, the closest weather station
Figure 1. (a) Location map of the western Arctic. Striated area indicates last glacial maximum (LGM) Laurentide ice limit after Dyke and Prest (1987); TL—Trout Lake, HL—HangingLake, SP—Shingle Point, YCP—Yukon Coastal Plain. (b) Trout Lake study site (68°49.73′N, 138°44.78′W) and surrounding area with local drainage and hydrology. Trout Lake isshown in close-up in Fig. 2. The background map is based on a Rapideye satellite image (red band, stretched and displayed in grayscale, 5 m resolution) overlain with theYukon Digital Elevation Model (30 m resolution).
550 M. Fritz et al. / Quaternary Research 78 (2012) 549–560
Author's personal copy
~50 km northeast of Trout Lake, with an average July maximum of11.2°C (Environment Canada, 2000). Mean annual precipitation is254 mm/yr and is almost equally shared between rain and snow(Environment Canada, 2000). The modern catchment vegetation isdominated by heath tundra and fellfield communities, including borealtaxa such as Alnus crispa, Betula glandulosa and Salix, and herbs such asEmpetrum nigrum, Vaccinium uliginosum, Vaccinium vitis-idaea, Arctousalpina and Anemone sp. (Welsh and Rigby, 1971; Kienast, F., personalcommunication, 2011).
Material and methods
Coring and on-site sampling
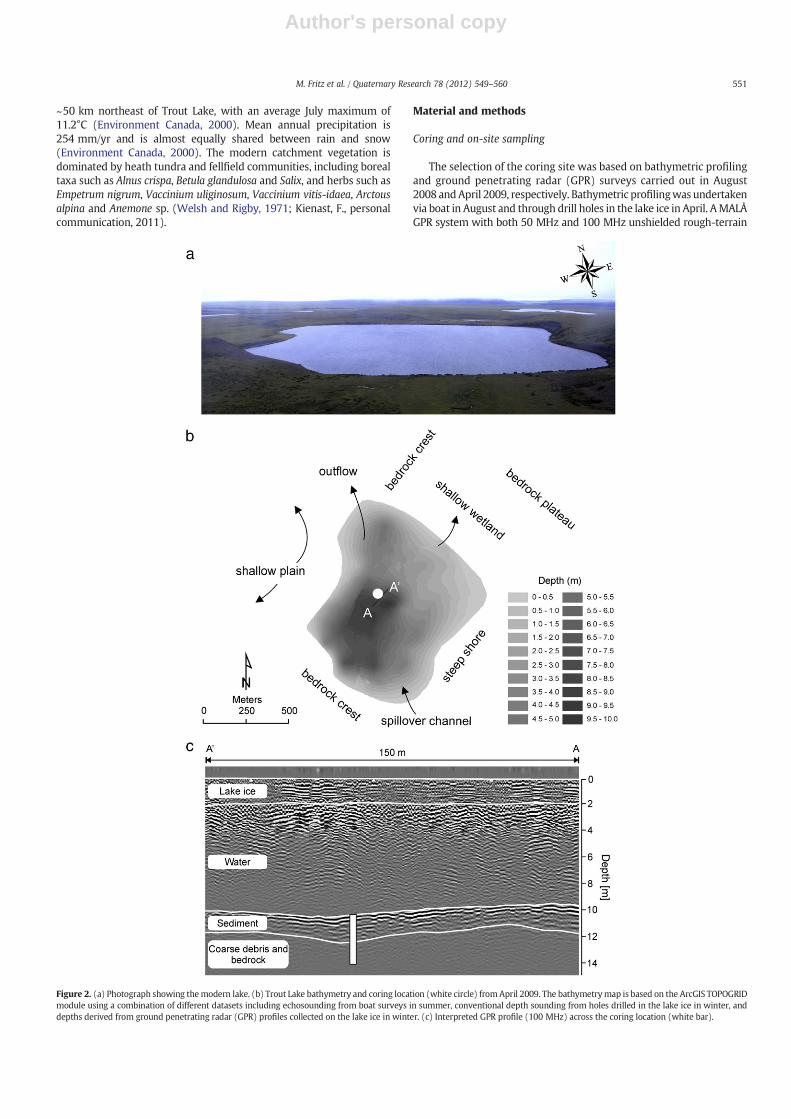
The selection of the coring site was based on bathymetric profilingand ground penetrating radar (GPR) surveys carried out in August2008 andApril 2009, respectively. Bathymetric profilingwas undertakenvia boat in August and through drill holes in the lake ice in April. AMALÅGPR system with both 50 MHz and 100 MHz unshielded rough-terrain
Figure 2. (a) Photograph showing themodern lake. (b) Trout Lake bathymetry and coring location (white circle) fromApril 2009. The bathymetrymap is based on the ArcGIS TOPOGRIDmodule using a combination of different datasets including echosounding from boat surveys in summer, conventional depth sounding from holes drilled in the lake ice in winter, anddepths derived from ground penetrating radar (GPR) profiles collected on the lake ice in winter. (c) Interpreted GPR profile (100 MHz) across the coring location (white bar).
551M. Fritz et al. / Quaternary Research 78 (2012) 549–560
Author's personal copy
antennas (RTA) was used on the frozen lake surface to map the lake ba-thymetry, lake-bed sediments (Fig. 2), and surrounding stratigraphy ofTrout Lake during April 2009. GPR data were processed with REFLEXWsoftware using direct-coupling wave horizontal filtering to removenoise. These results were used to locate a coring site with the thickestsediment sequence. A 405 cm-long sediment core was retrieved fromthe deepest part of the lake at a water depth of 8.70 m. Coring was car-ried out from a tripod mounted on the 2-m-thick lake ice using aUWITEC piston corer. Bedrock at the base of the sediments preventedfurther penetration of the corer. Upon recovery, the overlapping sedi-ment cores were cut into segments up to 100 cm in length, whichwere stored cool (but above freezing) in dark conditions. In the labora-tory sediment cores were split in half, photographed, and described,and 1-cm slices were sampled at 5-cm intervals for further analyses.For description of the recent limnology, surface and bottom-water sam-ples were taken during both field seasons for determination of stablewater isotopes (δ18O, δD), electrical conductivity, pH, O2, and the majoranion and cation composition.
Geochronology
Core samples were wet-sieved (>250 μm) to isolate plant macro-fossils, which were then cleaned and hand-picked for AMS (acceleratormass spectrometry) radiocarbon dating at the PoznanRadiocarbon Lab-oratory (AdamMickiewicz University, Poznan, Poland). Six radiocarbonages obtained by AMS dating on predominantly terrestrial moss re-mains are the basis of the core chronology (Table 1). Ageswere calibrat-ed using “CALIB 6.0” (Stuiver and Reimer, 1993; Data set: IntCal09:Reimer et al., 2009) and are denoted as calibrated thousand years beforepresent (cal ka BP). We report the median of the 2-sigma probabilitydistribution.
Sediment properties
The magnetic susceptibility (MS, 10−5 SI units) was measured forfacies change detection on the halved core with a multi-sensor corelogger (MSCL, GEOTEK) at 1-cm increments and is displayed using a5-point running average. Core lithology was determined by detailedmanual core logging including descriptions of sediment texture andstructures, color, and biogenic features. The laboratory measurementsand detailed core descriptions were used to characterize sedimentunits and transitions.
Freeze-drying of the samples yielded estimates of water content.A laser particle analyzer (Coulter LS 200) was used for grain-size anal-yses on organic-free (treatedwith 30%H2O2) subsamples of the b2-mmfraction. Sodium pyrophosphate (decahydrate) was used as dispersant.The remaining particles greater than 2 mm were reintegrated intothe grain-size statistics using the SediVision 2.0 software. Total carbon(TC), total organic carbon (TOC), total nitrogen (TN), and total sulfur(TS) contents were measured with a carbon–nitrogen–sulfur (CNS)analyzer (Elementar Vario EL III), and are given as weight percent(wt.%). The C/N ratio (C/S ratio) is expressed as the quotient of TOCand TN (TS) values. Stable carbon isotope ratios (δ13C) of TOC were
measured on carbonate-free (treated with 10% HCl) samples with acombination of a mass spectrometer (DELTAplusXL, Finnigan) and anelemental analyzer (Carlo-Erba CN2500) at the German ResearchCentre of Geosciences (GFZ) in Potsdam, Germany. The values areexpressed in delta per mil notation (δ, ‰) relative to the Vienna PeeDee Belemnite (VPDB) standard.
Pollen treatment and numerical methods
Preparation of the pollen samples included treatment with HCl,KOH, HF, acetolysis, sieving, and mounting in glycerin (Faegri andIversen, 1989). Two tablets of Lycopodium spores were added to cal-culate the pollen concentration. The sediment core was analyzed at27 intervals in which at least 300 terrestrial pollen grains (excludingspores and aquatic taxa) were counted at each level. In the basal coresample, where pollen concentration was very low (2290 grains/cm³),182 grains were counted. Pollen identifications were based on the rel-evant literature (McAndrews et al., 1973; Moore et al., 1991; Beug,2004). Pollen percentages were square-root transformed prior to allstatistical analyses, and only pollen taxa that were present with anabundance of≥0.5% in at least three samples were included in furtheranalyses.
The definition of local pollen zone (PZ) boundaries within the pol-len percentage diagram was based on a Constrained Incremental Sumof Squares cluster analysis (CONISS) using the Edwards and Cavalli-Sforza's chord distance measure with TILIA software (Grimm, 1991).The number of zones was confirmed by a broken stick model im-plemented in R package ‘rioja’. The main gradients of floristic variationwere first assessed by using detrended correspondence analysis. Be-cause the maximum gradient length of the first axis was 1.81 standarddeviation units, the linear ordination technique principal componentsanalysis (PCA) was chosen for subsequent statistical analysis (Lepšand Šmilauer, 2003). PCA focused on inter-species distances. All multi-variate ordinations were performed using the CANOCO 4.5 programfor Windows (ter Braak and Šmilauer, 2002).
In order to gain quantitative information about mean July air tem-perature (TJul) and annual precipitation (Pann) in the past, pollen–climate transfer functions were applied to the fossil pollen spectrafrom Trout Lake. The modern pollen data set consists of 623 modernsurface samples that we extracted from the North American Pollen Da-tabase (Grimm, 2000;Whitmore et al., 2005, Version 1.7, updated until2008) including sites located north of 50°N and west of 110°W. Siteswith less than 150 terrestrial pollen grains and spores were excluded.Modern pollen spectra cover a wide range of TJul (2.9 to 16.7°C) andPann (42 to1481 mm). Those eight samples that had annual precipita-tion values >700 mm have been excluded from the development ofthe transfer functions for Pann because of low coverage in the high pre-cipitation range. Transfer functions were developed with weighted av-eraging partial least squares (WAPLS) regression (second-componentmodel was chosen). Furthermore, modern analogue technique (MAT)with squared chord-distance as similarity measure was applied; thereconstructed TJul (Pann) represents the average of the k=4 (4) closestanalogues. That k has been chosen that in a sequence of models with
Table 1Summary of accelerator mass spectrometer (AMS) 14C results and calibrated ages from Trout Lake, northern Yukon.
Core depth[cm]
Material Mass[mg C]
δ13C[‰]
Uncalibrated 14C age[yr BP]
Calibrated2σ-age range[cal yr BP]
Median2σ-age[cal yr BP]
Lab no.a
3 Bryum sp., Amblystegiaceae 0.63 −35.8 930±30 925–782 852 Poz-3644266 Meesia sp., Calliergon giganteum 1.40 −35.1 5760±40 6659–6465 6561 Poz-36443176 Warnstorfia exannulatus 1.72 −27.0 9550±50 11,101–10,704 10,917 Poz-36455225 Drepanocladus sp., Scorpidium sp., Calliergon sp. 1.58 −32.9 12,770±70 15,641–14,714 15,164 Poz-36456352 Amblystegiaceae 0.56 −35.7 12,880±80 16,093–14,980 15,397 Poz-36445373 Undefined moss fragments 0.92 −32.8 13,140±80 16,533–15,242 15,961 Poz-36458
a Poz = Poznan Radiocarbon Laboratory.
552 M. Fritz et al. / Quaternary Research 78 (2012) 549–560
Author's personal copy
increasing k produced a first minimum in the root mean square errorof the difference between the predicted and observed values for thetraining set samples. Model performance was tested by leave-one-out cross-validation. The root mean square error of prediction (RMSEP)and the coefficient of determination (r2) are ±1.63°C (78 mm) and0.71 (0.54) for WAPLS and ±1.35°C (77 mm) and 0.80 (0.54) for MAT,respectively, and thus indicate that the modern data set is suitablefor quantitative reconstructions. Calibrations were performed using C2software (Juggins, 2003).
Results
Modern limnology
The oligotrophic Trout Lake is very weakly alkaline (pH 7.4 to 7.9)and its dissolved oxygen content is high (>20 mg/l). The lake waterhas a low electrical conductivity, between 82 μS cm−1 in August and138 μS/cm in April (Table 2). With δ18O values of approximately −17‰ and a deuterium excess (d-excess=δD−8δ18O) that rangesfrom −5.8‰ in April to −7.4‰ in August, the hydrological system issemi-closed; evaporation effects lead to enriched δ-values anda reducedd-excess compared to modern precipitation data derived from Inuvik(68°18'N, 133°37′W; IAEA, 2006), which is located about 150 km eastof Trout Lake.
Chronostratigraphy and sediment properties
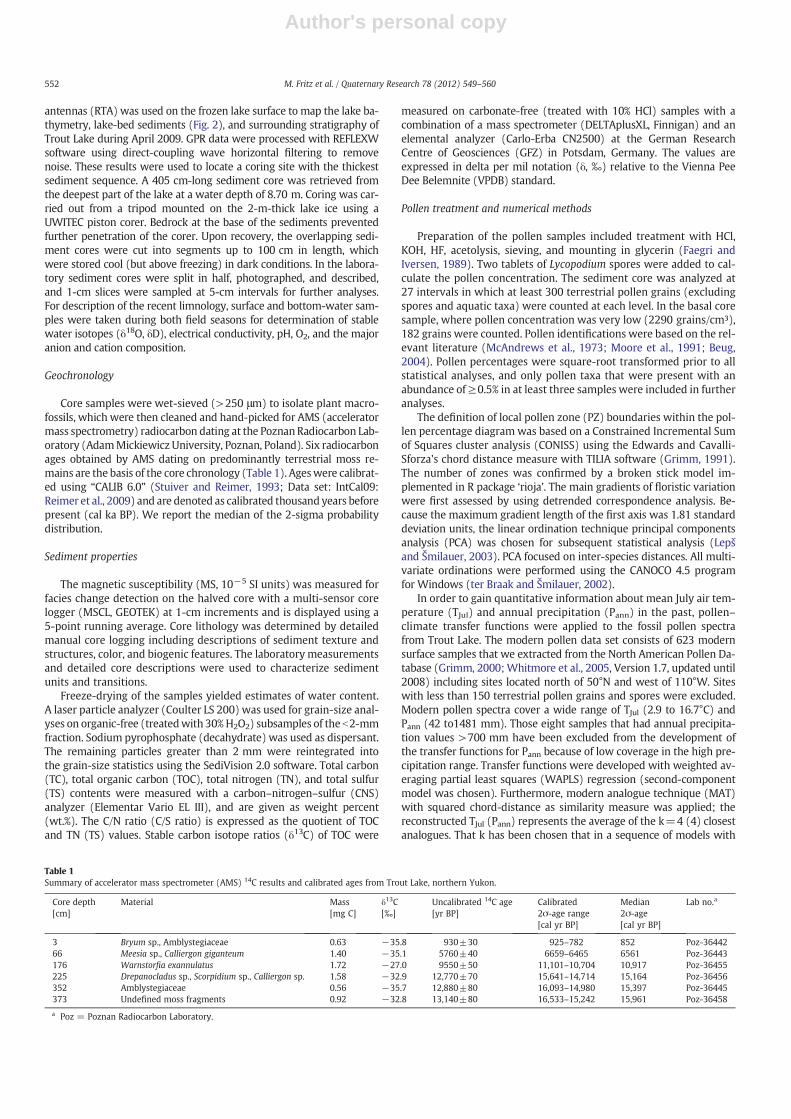
The age–depth model was constructed by linear interpolation be-tween the oldest three dates because these dates fall within anoverlapping and narrow age range (Table 1). Age extrapolation to thebottomof the sediment corewas done accordingly. A squared regressionmodel was used between the youngest four dated samples. Transferringthe established age–depth relationship onto the lithostratigraphic units(Fig. 3), which are described in detail in the following, yields fourchronostratigraphic periods (Fig. 3) that are discussed in the course ofthis study.We do not consider an appreciable hardwater reservoir effectbecause carbonates are absent in Trout Lake sediments and its catch-ment rocks (Norris, 1977). Moreover, the low electrical conductivity ofthe lake water and the lake's physical characteristics (i.e., small, mixed,
and with an existing outflow) probably lead to a short water-residencetime, where hardwater effects are unlikely to exist (e.g., Abbott andStafford, 1996; Fallu et al., 2004).
Basement (>16 cal ka BP; 405–386 cm)The lowermost 20 cm of the core are composed of bedrock debris.
Black shale and siltstone, typical of the Jurassic catchment rocks, showedshattered structures due to the coring process. Geochemical parametersmeasured within ground bedrock samples serve as background valuesfor interpreting soft sediment values and their relationship to primaryproduction within the lake or its catchment versus bedrock-derivedcomponents. The bedrock contains 1.6 to 2.0% TOCwith a δ13C signatureof −24.2‰, moderate inorganic carbon (0.1 to 1.5%), and high sulphurcontents (0.4 to 8.7%) leading to low C/S ratios (0.2 to 5.3; Fig. 3). Bed-rock debris together with overlying coarse-grained material of unit 1was mapped as a reflector in the GPR data (Fig. 2c) and provides insightinto the basinmorphology. This unit represents the bottom of the basin;therefore, we document the complete sediment record since the onsetof sediment accumulation in the basin.
Unit 1 (16.0 to 14.8 cal ka BP; 385–225 cm)Black unbedded sand, gravel, and minor amounts of silt and clay
make up this unit that covers the latest part of the full-glacial period.Sedimentological properties are homogenous throughout the entireunit and are comparable to the background values of the underlyingbedrock in terms of TOC, δ13C, and C/S ratios, and therefore implylow organic-matter production or preservation. At 381–366 cm and347–330 cm greenish-gray silty clay lenses were visible. In both inter-vals the clay lenses can be recognized by a clay peak in the grain-size di-agram and a MSminimum (Fig. 3). The MS varies between 13 and 68 SIand the grain-size spectrum is dominated by a high and variable sandcontent (up to 81%) with gravel admixtures. This together indicates afrequently changing depositional environment during the rapid deposi-tion of the lowermost 160 cmof sediment in a fluvial environment, or atleast in a basin episodically traversed by running water. From 231 cmupwards, unit 1 grades into fine-clastic and compact material of unit 2.
Unit 2 (14.7 to 10.7 ka; 224–150 cm)Unit 2 encompasses the period of the late glacial–Holocene transi-
tion. The material is silty and clastic-dominated at the bottom. It be-comes slightly finer grained and more organic-rich upward, wherecompact and massive clayey silt with some sand is encountered. Par-allel bedding structures are visible in the upper part, and several mossand organic-rich layers are intercalated at 180–176, 172–171, and160 cm. Sediments at the top of unit 2 are clayey, black, structureless,sticky, and greasy, and with a gradational contact with unit 3. Watercontent rises sharply by 15% at the transition between units 1 and2, where most sedimentological parameters including sedimentationrate change strongly. MS decreases to minimal values of 4 SI before itrises again with secondary minima at organic-rich layers. TOC is con-sistently present above 3.5%withmaximumvalues of ca. 8%wheremosslayers occur. Low C/N ratios (10 to 12) together with low C/S ratios (dueto high sulfur contents, up to 3.7%) and a δ13C below −25‰ (Fig. 3),which is typical of terrestrial organic matter input, could point towardsa preferential loss of organic carbon due to strong organic-matter de-composition. At organic-rich layers, MS drops; moisture, TOC, and C/Nratios peak (Fig. 3), with concurrent minima in δ13C (−28 to −27‰).This is typical of a dominance of terrestrial C3 plants (Meyers, 1994).
The sedimentary record between 14.7 and 10.7 cal ka BP is char-acterized by episodically changing sedimentological parameters, andtherefore indicates several shifts in the driving forces of depositionand organic-matter accumulation. In contrast to unit 1, which is attrib-uted to full-glacial conditions with a dominance of grain-size variabilityand high noise in the data, the variability within unit 2 is instead drivenby changes in the biogeochemical parameters of Trout Lake and is pos-sible related to climate forcing and fluctuating lake levels.
Table 2Modern limnological, hydrochemical, and stable water isotope characteristics fromTrout Lake, northern Yukon.
Parameter Unit August 2008 April 2009
Max water depth m 10.2Surface water temperature °C 11.0 0.7Bottom water temperature °C 11.1 2.8O2 mg/L n.a. 21.9pH 7.4 7.9Electrical conductivity μS/cm 82.1 138Ca2+ mg/L 9.65 15.3K+ mg/L 0.69 1.12Mg2+ mg/L 3.40 5.19Na+ mg/L 1.11 1.74Cl− mg/L 0.67 1.17SO4
2− mg/L 16.8 27.2HCO3
− mg/L 24.9 37.8δ18O ‰ VSMOW −17.0 −17.7δD ‰ VSMOW −144 −147d-excess ‰ VSMOW −7.4 −5.8
Note:Cation and anion contents were determined by inductively coupled plasma–opticalemission spectrometry (ICP–OES, Perkin-Elmer Optima 3000 XL) and ion chromatogra-phy (IC, Dionex DX-320), respectively. Hydrogen carbonate concentrations were mea-sured by titration (Metrohm 794 Basic Titrino). δ18O and δD ratios were determinedwith a Finnigan MAT Delta-S mass spectrometer, using the equilibration technique(Horita et al., 1989). Deuterium excess (d-excess=δD−8δ18O; Dansgaard, 1964)was calculated and provides insight into (i) the water source of the initial precipitation,and (ii) the presence or absence of secondary non-equilibrium fractionation processes.
553M. Fritz et al. / Quaternary Research 78 (2012) 549–560
Author's personal copy
Unit 3 (10.6 cal ka BP to present; 149–0 cm)Deposits fromunit 3 represent the entire Holocene and appear black,
structureless, water-saturated (46 to 59% water content), and very soft.Most sedimentological properties are almost homogeneous throughoutthis segment (Fig. 3) as indicated by a constant lowMS (0 to 9 SI). Veryfined-grained and clayey to silty deposits with usually less than 5% sanddominate, although single scattered clasts up to 0.5 cm in diameter arepresent at 58 and54 cm. These clasts are perhaps due to eoliandispersalof lake-proximal sediments on the ice during winter and are depositedon the lake floor during ice melt. Thin organic-rich layers are visible at135, 128, 111.5, 91, 87, 83, and 67 cm. A thin layer of peat moss coversthe sediment surface. Carbonate shells are absent throughout the coreexcept for one small fragment found at 142 cm. Values of inorganiccarbon, calculated as the difference between measured TC and TOC,never exceed 0.4%. Therefore, lake sediments are regarded as largelycarbonate-free. TOC is only present at less than 2% above the back-ground value of the underlying bedrock, and shows a terrestrial C3 car-bon isotopic signature of−26.6 to−24.7‰ for δ13C. Low C/N ratios riseslightly, togetherwith TOC contents, towards the surface (Fig. 3), and in-dicate strong decomposition of organic carbon and nitrogen fixation.
Sedimentation rates were very low during the Holocene(≤0.17 mm/yr) and partly explain the lack of variability in biogeo-chemical parameters. Well-aerated surface deposits exposed for along time due to slow sedimentation rates in oxygen-rich lake watermay lead to nearly complete oxidation of organic matter and unfavor-able conditions for carbonate preservation in ion-poor lake water(e.g., HCO3
− depleted). Based on the homogeneity of sediment proper-ties throughout the Holocene, we infer few changes in sediment input,sedimentation rate, or lake level; however, any such changes mightbe concealed because the sampling resolution, especially throughoutthe Holocene, is rather low, with a 300-to-400 year inter-sampleresolution.
Pollen
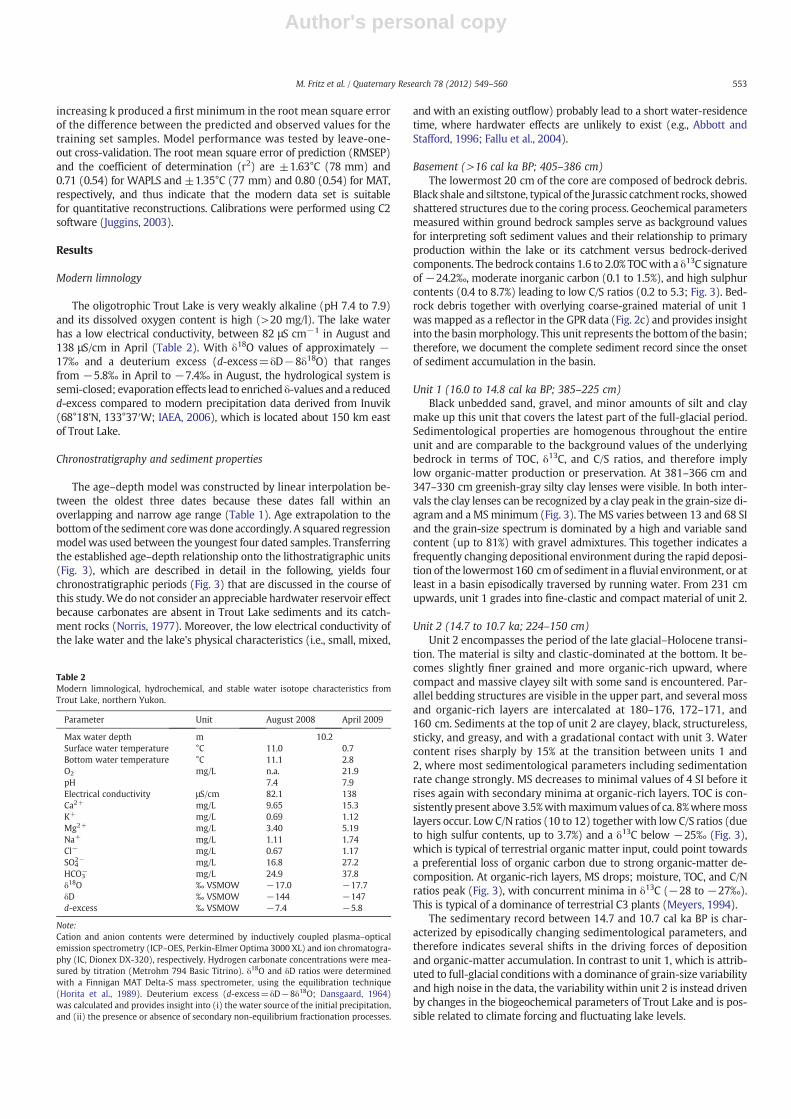
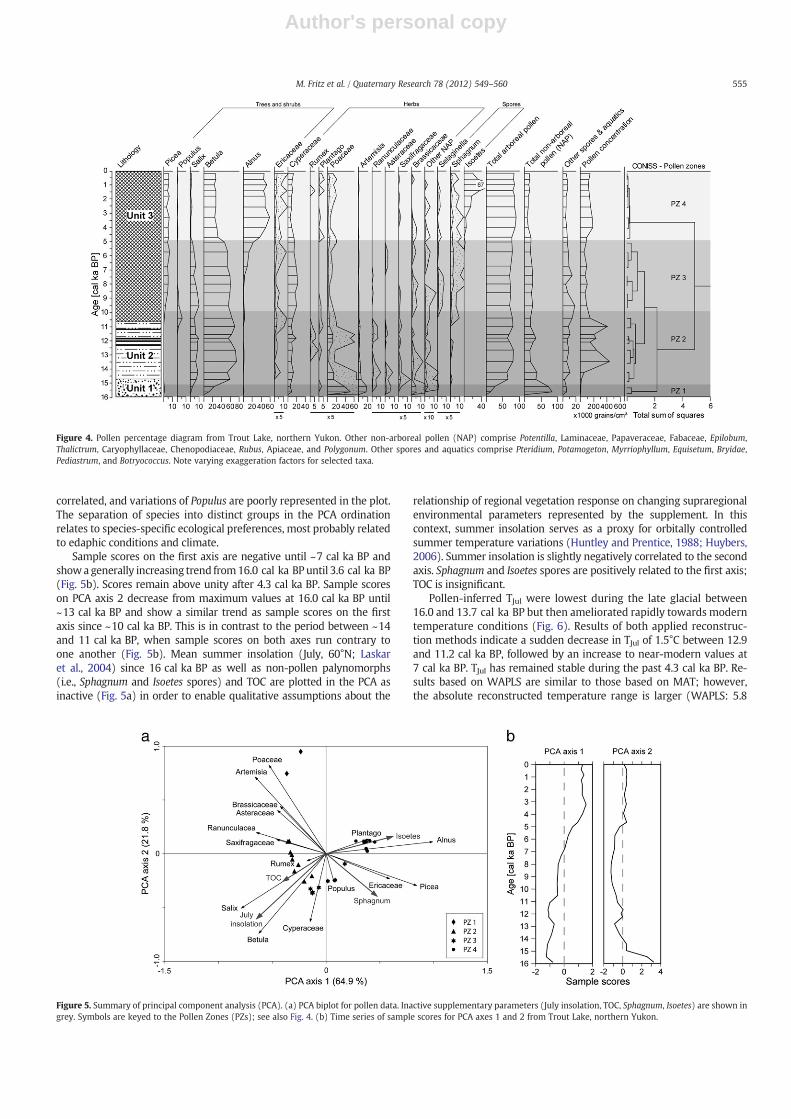
Pollen zonationThe Trout Lake pollen percentage diagram is divided into four pol-
len zones (PZ) based on the information from CONISS (Fig. 4).PZ 1 (16 to 15.1 cal ka BP): the pollen assemblages prior to
~15 cal ka BP indicates a dry herbaceous tundra as they are dominat-ed by Poaceae (>37%), Artemisia (~17%), and Cyperaceae (5 to 9%),
high percentages of Brassicaceae (~4.5%), and increasing values ofBetula (10 to 24%) towards zone 2. PZ 1 exhibits the lowest pollenconcentration, and low percentages of arboreal pollen, aquatic taxa,and spores.
PZ 2 (15.0 to 10.7 cal ka BP): In this zone Betula rises sharply,reaching maximum values of >70% between ~14.0 and 12.9 cal ka BP.Salix is consistently present above 5%while Cyperaceae slightly increases(8 to 20%) and Poaceae drops to less than 15%. Taxa that indicate dis-turbed ground or dry edaphic conditions such as Artemisia, Brassicaceae,Asteraceae, Ranunculaceae, and Saxifragaceae are consistently present.A notable drop in Betula percentages with a parallel increase in Poaceaeand Cyperaceae characterizes PZ 2 between 12.6 and 11.5 cal ka BP,which may be coeval with the YD stadial (Fig. 4). By the end of PZ 2 to-wards the early Holocene at ~11.2 cal ka BP Populus occurs for the firsttime, although in small amounts.
PZ 3 (10.6 to 5.0 cal ka BP): Betula is still dominant with secondaryinfluences of Cyperaceae, Salix, Ericaceae, and spores of Sellaginellaand Sphagnum. Populus reaches its maximum of slightly more than 5%and slowly decreases afterwards. Picea starts to occur at frequencies>1% at 9.8 cal ka BP and exhibits constant values above 4% after8.9 cal ka BP, but never exceeds 7% throughout the record. Towardsthe end of zone 3 Alnus occurs for the first time with values above 5%at ~7.3 cal ka BP, followed by a rapid increase.
PZ 4 (4.9 cal ka BP to present): In this zone Betula and Salix de-crease until ~4 cal ka BP and then remain constant at about 25 to 30%and around 1%, respectively. Alnus becomes dominant by ~5 cal ka BP,reaching maximum values of around 50% after 4.3 cal ka BP. Ericaceaeshow a minor maximum in the past 3.0 cal ka BP. Isoetes spores beginto occur in PZ 3 at ~5.3 cal ka BP and remain the dominant aquatictaxon until present.
Principal component analysis, temperature and precipitationreconstruction
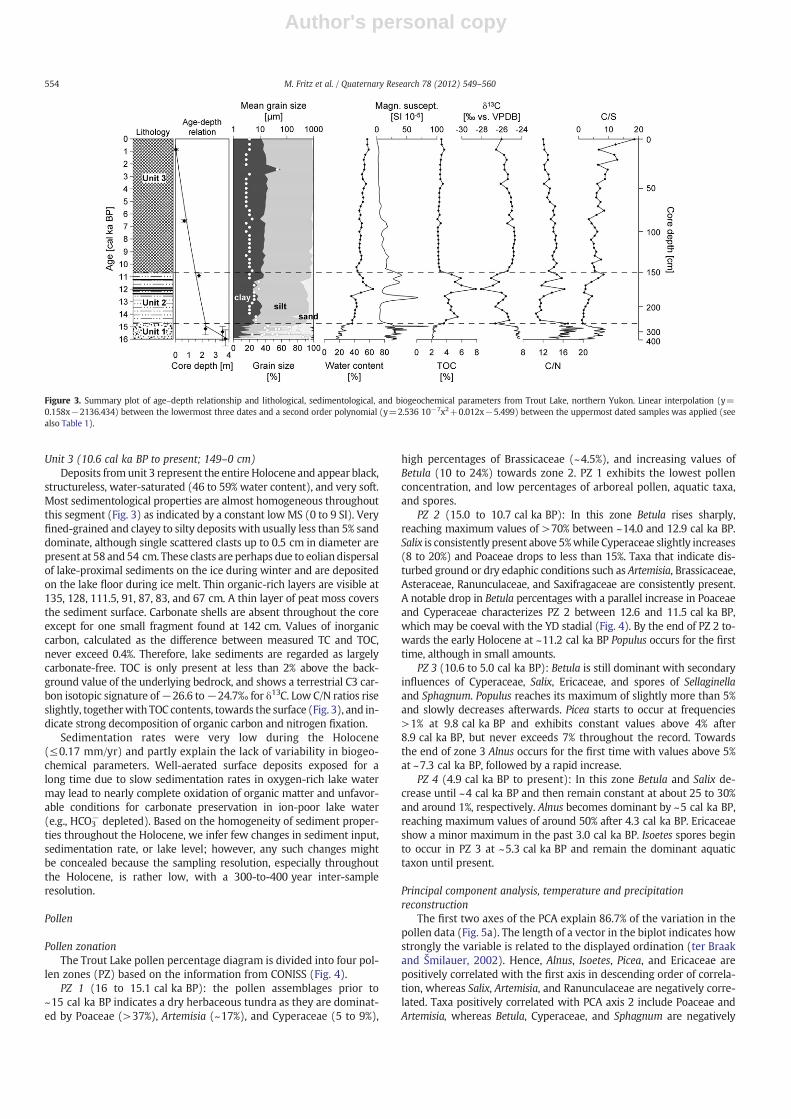
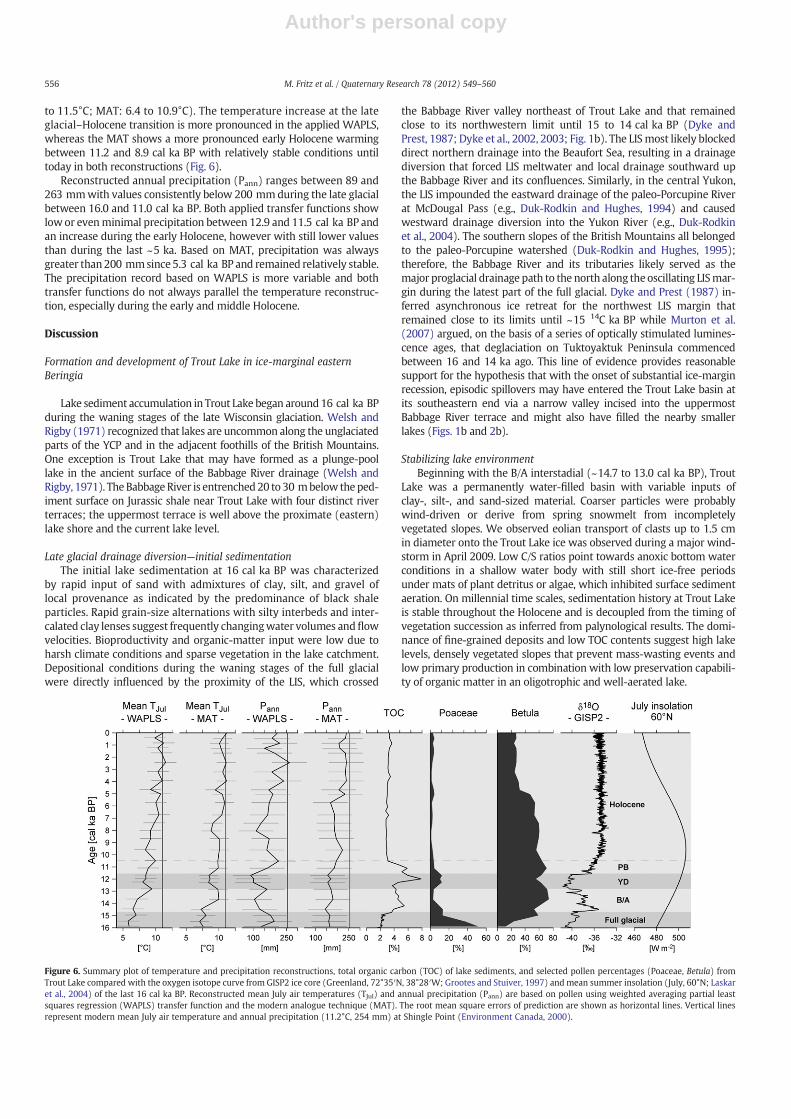
The first two axes of the PCA explain 86.7% of the variation in thepollen data (Fig. 5a). The length of a vector in the biplot indicates howstrongly the variable is related to the displayed ordination (ter Braakand Šmilauer, 2002). Hence, Alnus, Isoetes, Picea, and Ericaceae arepositively correlated with the first axis in descending order of correla-tion, whereas Salix, Artemisia, and Ranunculaceae are negatively corre-lated. Taxa positively correlated with PCA axis 2 include Poaceae andArtemisia, whereas Betula, Cyperaceae, and Sphagnum are negatively
Figure 3. Summary plot of age–depth relationship and lithological, sedimentological, and biogeochemical parameters from Trout Lake, northern Yukon. Linear interpolation (y=0.158x−2136.434) between the lowermost three dates and a second order polynomial (y=2.536 10−7x2+0.012x−5.499) between the uppermost dated samples was applied (seealso Table 1).
554 M. Fritz et al. / Quaternary Research 78 (2012) 549–560
Author's personal copy
correlated, and variations of Populus are poorly represented in the plot.The separation of species into distinct groups in the PCA ordinationrelates to species-specific ecological preferences, most probably relatedto edaphic conditions and climate.
Sample scores on the first axis are negative until ~7 cal ka BP andshowa generally increasing trend from16.0 cal ka BPuntil 3.6 cal ka BP(Fig. 5b). Scores remain above unity after 4.3 cal ka BP. Sample scoreson PCA axis 2 decrease from maximum values at 16.0 cal ka BP until~13 cal ka BP and show a similar trend as sample scores on the firstaxis since ~10 cal ka BP. This is in contrast to the period between ~14and 11 cal ka BP, when sample scores on both axes run contrary toone another (Fig. 5b). Mean summer insolation (July, 60°N; Laskaret al., 2004) since 16 cal ka BP as well as non-pollen palynomorphs(i.e., Sphagnum and Isoetes spores) and TOC are plotted in the PCA asinactive (Fig. 5a) in order to enable qualitative assumptions about the
relationship of regional vegetation response on changing supraregionalenvironmental parameters represented by the supplement. In thiscontext, summer insolation serves as a proxy for orbitally controlledsummer temperature variations (Huntley and Prentice, 1988; Huybers,2006). Summer insolation is slightly negatively correlated to the secondaxis. Sphagnum and Isoetes spores are positively related to the first axis;TOC is insignificant.
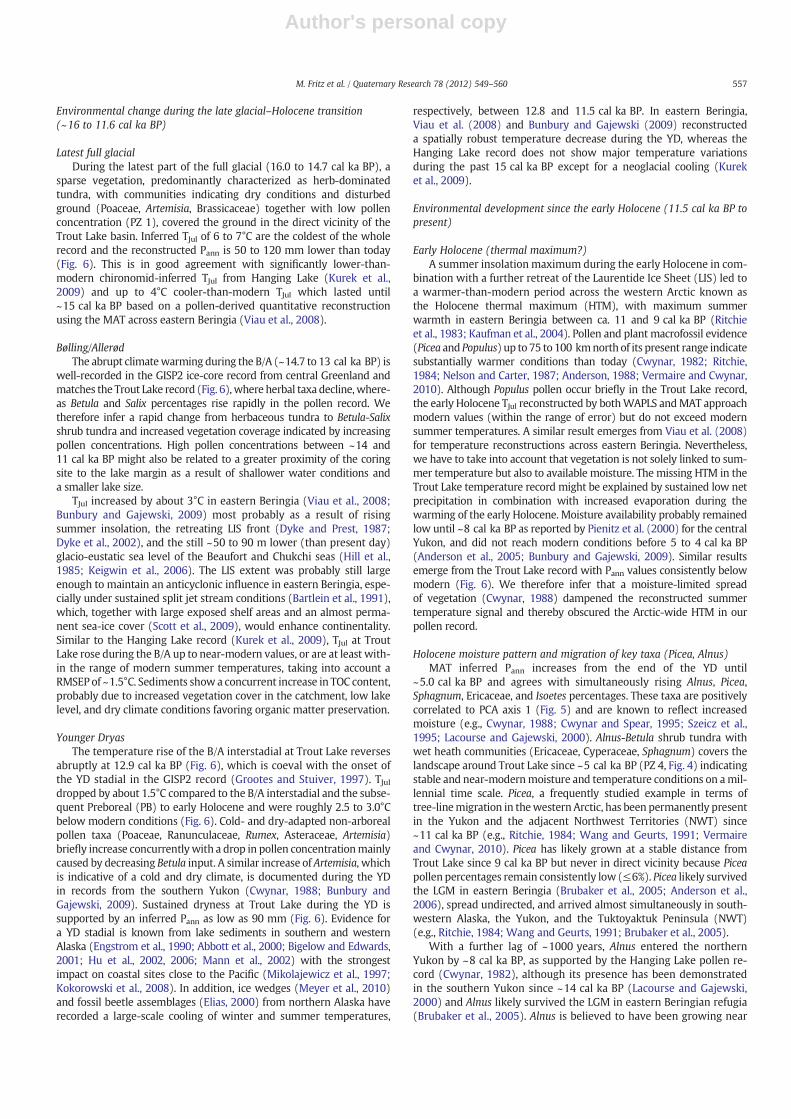
Pollen-inferred TJul were lowest during the late glacial between16.0 and 13.7 cal ka BP but then ameliorated rapidly towards moderntemperature conditions (Fig. 6). Results of both applied reconstruc-tion methods indicate a sudden decrease in TJul of 1.5°C between 12.9and 11.2 cal ka BP, followed by an increase to near-modern values at7 cal ka BP. TJul has remained stable during the past 4.3 cal ka BP. Re-sults based on WAPLS are similar to those based on MAT; however,the absolute reconstructed temperature range is larger (WAPLS: 5.8
Figure 4. Pollen percentage diagram from Trout Lake, northern Yukon. Other non-arboreal pollen (NAP) comprise Potentilla, Laminaceae, Papaveraceae, Fabaceae, Epilobum,Thalictrum, Caryophyllaceae, Chenopodiaceae, Rubus, Apiaceae, and Polygonum. Other spores and aquatics comprise Pteridium, Potamogeton, Myrriophyllum, Equisetum, Bryidae,Pediastrum, and Botryococcus. Note varying exaggeration factors for selected taxa.
Figure 5. Summary of principal component analysis (PCA). (a) PCA biplot for pollen data. Inactive supplementary parameters (July insolation, TOC, Sphagnum, Isoetes) are shown ingrey. Symbols are keyed to the Pollen Zones (PZs); see also Fig. 4. (b) Time series of sample scores for PCA axes 1 and 2 from Trout Lake, northern Yukon.
555M. Fritz et al. / Quaternary Research 78 (2012) 549–560
Author's personal copy
to 11.5°C; MAT: 6.4 to 10.9°C). The temperature increase at the lateglacial–Holocene transition is more pronounced in the applied WAPLS,whereas the MAT shows a more pronounced early Holocene warmingbetween 11.2 and 8.9 cal ka BP with relatively stable conditions untiltoday in both reconstructions (Fig. 6).
Reconstructed annual precipitation (Pann) ranges between 89 and263 mmwith values consistently below 200 mmduring the late glacialbetween 16.0 and 11.0 cal ka BP. Both applied transfer functions showlowor evenminimal precipitation between 12.9 and 11.5 cal ka BP andan increase during the early Holocene, however with still lower valuesthan during the last ~5 ka. Based on MAT, precipitation was alwaysgreater than200 mmsince 5.3 cal ka BP and remained relatively stable.The precipitation record based on WAPLS is more variable and bothtransfer functions do not always parallel the temperature reconstruc-tion, especially during the early and middle Holocene.
Discussion
Formation and development of Trout Lake in ice-marginal easternBeringia
Lake sediment accumulation in Trout Lake began around 16 cal ka BPduring the waning stages of the late Wisconsin glaciation. Welsh andRigby (1971) recognized that lakes are uncommon along the unglaciatedparts of the YCP and in the adjacent foothills of the British Mountains.One exception is Trout Lake that may have formed as a plunge-poollake in the ancient surface of the Babbage River drainage (Welsh andRigby, 1971). The BabbageRiver is entrenched20 to 30 mbelow theped-iment surface on Jurassic shale near Trout Lake with four distinct riverterraces; the uppermost terrace is well above the proximate (eastern)lake shore and the current lake level.
Late glacial drainage diversion—initial sedimentationThe initial lake sedimentation at 16 cal ka BP was characterized
by rapid input of sand with admixtures of clay, silt, and gravel oflocal provenance as indicated by the predominance of black shaleparticles. Rapid grain-size alternations with silty interbeds and inter-calated clay lenses suggest frequently changingwater volumes andflowvelocities. Bioproductivity and organic-matter input were low due toharsh climate conditions and sparse vegetation in the lake catchment.Depositional conditions during the waning stages of the full glacialwere directly influenced by the proximity of the LIS, which crossed
the Babbage River valley northeast of Trout Lake and that remainedclose to its northwestern limit until 15 to 14 cal ka BP (Dyke andPrest, 1987; Dyke et al., 2002, 2003; Fig. 1b). The LISmost likely blockeddirect northern drainage into the Beaufort Sea, resulting in a drainagediversion that forced LIS meltwater and local drainage southward upthe Babbage River and its confluences. Similarly, in the central Yukon,the LIS impounded the eastward drainage of the paleo-Porcupine Riverat McDougal Pass (e.g., Duk-Rodkin and Hughes, 1994) and causedwestward drainage diversion into the Yukon River (e.g., Duk-Rodkinet al., 2004). The southern slopes of the British Mountains all belongedto the paleo-Porcupine watershed (Duk-Rodkin and Hughes, 1995);therefore, the Babbage River and its tributaries likely served as themajor proglacial drainage path to the north along the oscillating LISmar-gin during the latest part of the full glacial. Dyke and Prest (1987) in-ferred asynchronous ice retreat for the northwest LIS margin thatremained close to its limits until ~15 14C ka BP while Murton et al.(2007) argued, on the basis of a series of optically stimulated lumines-cence ages, that deglaciation on Tuktoyaktuk Peninsula commencedbetween 16 and 14 ka ago. This line of evidence provides reasonablesupport for the hypothesis that with the onset of substantial ice-marginrecession, episodic spillovers may have entered the Trout Lake basin atits southeastern end via a narrow valley incised into the uppermostBabbage River terrace and might also have filled the nearby smallerlakes (Figs. 1b and 2b).
Stabilizing lake environmentBeginning with the B/A interstadial (~14.7 to 13.0 cal ka BP), Trout
Lake was a permanently water-filled basin with variable inputs ofclay-, silt-, and sand-sized material. Coarser particles were probablywind-driven or derive from spring snowmelt from incompletelyvegetated slopes. We observed eolian transport of clasts up to 1.5 cmin diameter onto the Trout Lake ice was observed during a major wind-storm in April 2009. Low C/S ratios point towards anoxic bottom waterconditions in a shallow water body with still short ice-free periodsunder mats of plant detritus or algae, which inhibited surface sedimentaeration. On millennial time scales, sedimentation history at Trout Lakeis stable throughout the Holocene and is decoupled from the timing ofvegetation succession as inferred from palynological results. The domi-nance of fine-grained deposits and low TOC contents suggest high lakelevels, densely vegetated slopes that prevent mass-wasting events andlow primary production in combination with low preservation capabili-ty of organic matter in an oligotrophic and well-aerated lake.
Figure 6. Summary plot of temperature and precipitation reconstructions, total organic carbon (TOC) of lake sediments, and selected pollen percentages (Poaceae, Betula) fromTrout Lake compared with the oxygen isotope curve from GISP2 ice core (Greenland, 72°35′N, 38°28′W; Grootes and Stuiver, 1997) andmean summer insolation (July, 60°N; Laskaret al., 2004) of the last 16 cal ka BP. Reconstructed mean July air temperatures (TJul) and annual precipitation (Pann) are based on pollen using weighted averaging partial leastsquares regression (WAPLS) transfer function and the modern analogue technique (MAT). The root mean square errors of prediction are shown as horizontal lines. Vertical linesrepresent modern mean July air temperature and annual precipitation (11.2°C, 254 mm) at Shingle Point (Environment Canada, 2000).
556 M. Fritz et al. / Quaternary Research 78 (2012) 549–560
Author's personal copy
Environmental change during the late glacial–Holocene transition(~16 to 11.6 cal ka BP)
Latest full glacialDuring the latest part of the full glacial (16.0 to 14.7 cal ka BP), a
sparse vegetation, predominantly characterized as herb-dominatedtundra, with communities indicating dry conditions and disturbedground (Poaceae, Artemisia, Brassicaceae) together with low pollenconcentration (PZ 1), covered the ground in the direct vicinity of theTrout Lake basin. Inferred TJul of 6 to 7°C are the coldest of the wholerecord and the reconstructed Pann is 50 to 120 mm lower than today(Fig. 6). This is in good agreement with significantly lower-than-modern chironomid-inferred TJul from Hanging Lake (Kurek et al.,2009) and up to 4°C cooler-than-modern TJul which lasted until~15 cal ka BP based on a pollen-derived quantitative reconstructionusing the MAT across eastern Beringia (Viau et al., 2008).
Bølling/AllerødThe abrupt climatewarming during the B/A (~14.7 to 13 cal ka BP) is
well-recorded in the GISP2 ice-core record from central Greenland andmatches the Trout Lake record (Fig. 6),where herbal taxa decline,where-as Betula and Salix percentages rise rapidly in the pollen record. Wetherefore infer a rapid change from herbaceous tundra to Betula-Salixshrub tundra and increased vegetation coverage indicated by increasingpollen concentrations. High pollen concentrations between ~14 and11 cal ka BP might also be related to a greater proximity of the coringsite to the lake margin as a result of shallower water conditions anda smaller lake size.
TJul increased by about 3°C in eastern Beringia (Viau et al., 2008;Bunbury and Gajewski, 2009) most probably as a result of risingsummer insolation, the retreating LIS front (Dyke and Prest, 1987;Dyke et al., 2002), and the still ~50 to 90 m lower (than present day)glacio-eustatic sea level of the Beaufort and Chukchi seas (Hill et al.,1985; Keigwin et al., 2006). The LIS extent was probably still largeenough to maintain an anticyclonic influence in eastern Beringia, espe-cially under sustained split jet stream conditions (Bartlein et al., 1991),which, together with large exposed shelf areas and an almost perma-nent sea-ice cover (Scott et al., 2009), would enhance continentality.Similar to the Hanging Lake record (Kurek et al., 2009), TJul at TroutLake rose during the B/A up to near-modern values, or are at least with-in the range of modern summer temperatures, taking into account aRMSEP of ~1.5°C. Sediments show a concurrent increase in TOC content,probably due to increased vegetation cover in the catchment, low lakelevel, and dry climate conditions favoring organic matter preservation.
Younger DryasThe temperature rise of the B/A interstadial at Trout Lake reverses
abruptly at 12.9 cal ka BP (Fig. 6), which is coeval with the onset ofthe YD stadial in the GISP2 record (Grootes and Stuiver, 1997). TJuldropped by about 1.5°C compared to the B/A interstadial and the subse-quent Preboreal (PB) to early Holocene and were roughly 2.5 to 3.0°Cbelow modern conditions (Fig. 6). Cold- and dry-adapted non-arborealpollen taxa (Poaceae, Ranunculaceae, Rumex, Asteraceae, Artemisia)briefly increase concurrentlywith a drop in pollen concentrationmainlycaused by decreasing Betula input. A similar increase of Artemisia, whichis indicative of a cold and dry climate, is documented during the YDin records from the southern Yukon (Cwynar, 1988; Bunbury andGajewski, 2009). Sustained dryness at Trout Lake during the YD issupported by an inferred Pann as low as 90 mm (Fig. 6). Evidence fora YD stadial is known from lake sediments in southern and westernAlaska (Engstrom et al., 1990; Abbott et al., 2000; Bigelow and Edwards,2001; Hu et al., 2002, 2006; Mann et al., 2002) with the strongestimpact on coastal sites close to the Pacific (Mikolajewicz et al., 1997;Kokorowski et al., 2008). In addition, ice wedges (Meyer et al., 2010)and fossil beetle assemblages (Elias, 2000) from northern Alaska haverecorded a large-scale cooling of winter and summer temperatures,
respectively, between 12.8 and 11.5 cal ka BP. In eastern Beringia,Viau et al. (2008) and Bunbury and Gajewski (2009) reconstructeda spatially robust temperature decrease during the YD, whereas theHanging Lake record does not show major temperature variationsduring the past 15 cal ka BP except for a neoglacial cooling (Kureket al., 2009).
Environmental development since the early Holocene (11.5 cal ka BP topresent)
Early Holocene (thermal maximum?)A summer insolation maximum during the early Holocene in com-
bination with a further retreat of the Laurentide Ice Sheet (LIS) led toa warmer-than-modern period across the western Arctic known asthe Holocene thermal maximum (HTM), with maximum summerwarmth in eastern Beringia between ca. 11 and 9 cal ka BP (Ritchieet al., 1983; Kaufman et al., 2004). Pollen and plant macrofossil evidence(Picea and Populus) up to 75 to 100 kmnorth of its present range indicatesubstantially warmer conditions than today (Cwynar, 1982; Ritchie,1984; Nelson and Carter, 1987; Anderson, 1988; Vermaire and Cwynar,2010). Although Populus pollen occur briefly in the Trout Lake record,the early Holocene TJul reconstructed by bothWAPLS andMAT approachmodern values (within the range of error) but do not exceed modernsummer temperatures. A similar result emerges from Viau et al. (2008)for temperature reconstructions across eastern Beringia. Nevertheless,we have to take into account that vegetation is not solely linked to sum-mer temperature but also to available moisture. The missing HTM in theTrout Lake temperature record might be explained by sustained low netprecipitation in combination with increased evaporation during thewarming of the early Holocene. Moisture availability probably remainedlow until ~8 cal ka BP as reported by Pienitz et al. (2000) for the centralYukon, and did not reach modern conditions before 5 to 4 cal ka BP(Anderson et al., 2005; Bunbury and Gajewski, 2009). Similar resultsemerge from the Trout Lake record with Pann values consistently belowmodern (Fig. 6). We therefore infer that a moisture-limited spreadof vegetation (Cwynar, 1988) dampened the reconstructed summertemperature signal and thereby obscured the Arctic-wide HTM in ourpollen record.
Holocene moisture pattern and migration of key taxa (Picea, Alnus)MAT inferred Pann increases from the end of the YD until
~5.0 cal ka BP and agrees with simultaneously rising Alnus, Picea,Sphagnum, Ericaceae, and Isoetes percentages. These taxa are positivelycorrelated to PCA axis 1 (Fig. 5) and are known to reflect increasedmoisture (e.g., Cwynar, 1988; Cwynar and Spear, 1995; Szeicz et al.,1995; Lacourse and Gajewski, 2000). Alnus-Betula shrub tundra withwet heath communities (Ericaceae, Cyperaceae, Sphagnum) covers thelandscape around Trout Lake since ~5 cal ka BP (PZ 4, Fig. 4) indicatingstable and near-modernmoisture and temperature conditions on amil-lennial time scale. Picea, a frequently studied example in terms oftree-linemigration in thewestern Arctic, has been permanently presentin the Yukon and the adjacent Northwest Territories (NWT) since~11 cal ka BP (e.g., Ritchie, 1984; Wang and Geurts, 1991; Vermaireand Cwynar, 2010). Picea has likely grown at a stable distance fromTrout Lake since 9 cal ka BP but never in direct vicinity because Piceapollen percentages remain consistently low (≤6%). Picea likely survivedthe LGM in eastern Beringia (Brubaker et al., 2005; Anderson et al.,2006), spread undirected, and arrived almost simultaneously in south-western Alaska, the Yukon, and the Tuktoyaktuk Peninsula (NWT)(e.g., Ritchie, 1984; Wang and Geurts, 1991; Brubaker et al., 2005).
With a further lag of ~1000 years, Alnus entered the northernYukon by ~8 cal ka BP, as supported by the Hanging Lake pollen re-cord (Cwynar, 1982), although its presence has been demonstratedin the southern Yukon since ~14 cal ka BP (Lacourse and Gajewski,2000) and Alnus likely survived the LGM in eastern Beringian refugia(Brubaker et al., 2005). Alnus is believed to have been growing near
557M. Fritz et al. / Quaternary Research 78 (2012) 549–560
Author's personal copy
Trout Lake by ~7 cal ka BP, and it has been the dominant pollen pro-ducer since ~5 cal ka BP. Picea, Alnus, and Ericaceae together withSphagnum and Isoetes spores indicate substantially increasing moistureavailability since themiddle Holocene. Slowly decreasing temperaturessince the termination of the HTM (Ritchie, 1984; Kaufman et al., 2004)in combination with increasing Pann may have led to paludificationand a higher water table, also in response to increased permafrost ag-gradation that culminated in the middle Holocene (Cwynar and Spear,1995; Vardy et al., 1997). Declining Beaufort Sea sea-ice coveragesince ~9 cal ka BP (Schell et al., 2008) in combination with a risingglacio-eustatic sea level approaching the modern coastline are likelyto have allowed enhanced moisture supply to the northern Yukon insummer. The area became increasingly proximate to an oceanic mois-ture source, and thus evolved from a continental site during the late gla-cial and early Holocene into a maritime environment (Burn, 1997;Kaufman et al., 2004; Fritz et al., 2012).
Comparison of the two existing paleoenvironmental records from TroutLake
The midge-inferred temperature reconstructions based on lakesediments from Trout Lake by Irvine et al. (2012) provide excellentcontrol for our record and an important opportunity for comparisonsfrom a data-poor region. Both chronologies fit very well and the twoquantitative paleoclimate reconstructions based on independent proxydata (chironomids in Irvine et al., 2012; pollen in this study) allows toconclude the following: (1) Bothmean TJul records indicate significantlycolder-than-modern climate conditions during the latest part of the fullglacial. (2) Late glacial warming with similar temperature amplitudesandmagnitudes, as shown in both records, began around 14.4 cal ka BP.(3) A temperature minimum occurred during a period that is coevalwith the Younger Dryas stadial, with similar temperature amplitudesbetween 1.0 and 1.5°C. Notably, Irvine et al. (2012) do not see a vegeta-tion response to YD cooling in their pollen spectrum, though they recog-nize a decrease in pollen influx and infer reduced productivity on thelandscape. In contrast, our pollen spectrum clearly shows an increasein cold- and dry-adapted non-arboreal pollen taxa and a decreasein Betula during the same interval. (4) Chironomid-inferred summertemperatures reveal a period of consistently warmer-than-modernconditions from about 10.8 to 9.8 cal ka BP, representing the Holocenethermal maximum, with maximum temperatures of 12.6°C, about2.2°C above modern (Irvine et al., 2012). The pollen spectra from bothstudies and our pollen-derived temperature reconstructions, however,do not clearly show a vegetation response to early Holocene warming,except for a brief increase in Populus pollen. This once more highlightsthe importance of precipitation when considering a vegetation responseto climate change. Based on our precipitation reconstructions,we suggestthat vegetation was unable to respond adequately to an early Holocenethermalmaximumbecause of limitedmoisture availability.We concludethat the combined perception of the results presented in both studiesprovide excellent and independent control on the paleoclimate develop-ment in the northern Yukon Territory.
Conclusions
Sedimentological and palynological studies together with multivar-iate statistics provide a detailed view on the sedimentation, vegetation,and temperature history from the northern Yukon Territory during thepast ~16 cal ka BP. Using this approach, we discovered the following:
1. As final deglaciation of the northwestern margin of the LIS com-menced, drainage diversion caused spillover of glacial meltwaterto feed the bedrock basins close to the Babbage River and initiatedlake sedimentation in unglaciated northeastern Beringia.
2. Quantitative July air temperature reconstructions indicate a rapidclimate warming by ~4°C, from cold full-glacial conditions towards
the B/A interstadial, followed by a distinct YD stadial, which hadnot previously been reported for the northern Yukon.
3. The YD in continental easternmost Beringia was characterized by~2.5 to 3.0°C lower-than-modern July air temperatures and lowannual net precipitation of 90 to 170 mm.
4. Limitedmoisture availability in the northern Yukon during increasingtemperatures across the western Arctic in the early Holocene mayhave been responsible for a concealedHTM.Amiddle to lateHolocenemoisture increase throughout eastern Beringia with near-moderntemperatures andprecipitation supported theestablishmentof an ex-tensive alder/birch shrub tundra north of the current arctic tree line.
Acknowledgments
We thank the Parks Canada office (Ivvavik National Park) and theAurora Research Institute–Aurora College (ARI) in Inuvik, NWT for ad-ministrative and logistical support. This study was partly funded bythe German Science Foundation (DFG; Project No. LA 2399/3-1), theInternational Bureau of the German Federal Ministry of Education andResearch (BMBF; Project No. CAN 08/A07, CAN 09/001), and by a doc-toral fellowship awarded to M. Fritz by the German Federal Environ-mental Foundation (DBU). Analytical work at AWI received great helpfrom Catalina Gebhardt, Ute Bastian, Antje Eulenburg, Christiane Funk,Hanno Meyer, Frank Günther, and Juliane Klemm as well as from BirgitPlessen (GeoForschungsZentrum Potsdam, Germany). Gerald Müllerand Samuel McLeod assisted in the field. We thank Frank Kienast(Senckenberg Research Institute,Weimar, Germany) andRomyZibulski(AWI) for plant identification and Candace O'Connor (University ofAlaska, Fairbanks, Alaska) for language revision. Both anonymous re-viewers are thanked for their critical discussion of the manuscript. Fi-nally, we appreciate the valuable comments of the editorial board ofthe journal (Derek Booth, Dan R. Muhs, and Michael A. O'Neal) that im-proved the paper.
Appendix A. Supplementary data
Supplementary data associatedwith this article can be found in the on-lineversion, athttp://dx.doi.org/10.1016/j.yqres.2012.07.007. Thesedata in-clude Google maps of the most important areas described in this article.
References
Abbott, M.B., Stafford Jr., T.W., 1996. Radiocarbon geochemistry of modern and ancientarctic lake systems, Baffin Island, Canada. Quaternary Research 45, 300–311.
Abbott, M.B., Finney, B.P., Edwards, M.E., Kelts, K.R., 2000. Lake-level reconstructionand paleohydrology of Birch Lake, central Alaska, based on seismic reflection pro-files and core transects. Quaternary Research 53, 154–166.
Anderson, P.M., 1988. Late quaternary pollen records from the Kobuk and Noatak riverdrainages, northwestern Alaska. Quaternary Research 29, 263–276.
Anderson, L., Abbott, M.B., Finney, B.P., Edwards, M.E., 2005. Palaeohydrology ofthe southwest Yukon Territory, Canada, based on multiproxy analyses of lakesediment cores from a depth transect. The Holocene 15, 1172–1183.
Anderson, L.L., Hu, F.S., Nelson, D.M., Petit, R.J., Paige, K.N., 2006. Ice-age endurance:DNA evidence of a white spruce refugium in Alaska. Proceedings of the NationalAcademy of Sciences 103, 12447–12450.
Bartlein, P.J., Anderson, P.M., Edwards, M.E., McDowell, P.F., 1991. A framework forinterpreting paleoclimatic variations in Eastern Beringia. Quaternary International10–12, 73–83.
Beug, H.-J., 2004. Leitfaden der Pollenbestimmung für Mitteleuropa und angrenzendeGebiete. Dr. Friedrich Pfeil Verlag, Munich. (in German).
Bigelow, N.H., Edwards, M.E., 2001. A 14,000 yr paleoenvironmental record fromWindmill Lake, Central Alaska: Late glacial and Holocene vegetation in the Alaskarange. Quaternary Science Reviews 20, 203–215.
Briner, J.P., Kaufman, D.S., Werner, A., Caffee, M., Levy, L., Manley, W.F., Kaplan, M.R.,Finkel, R.C., 2002. Glacier readvance during the late glacial (Younger Dryas?) inthe Ahklun Mountains, southwestern Alaska. Geology 30, 679–682.
Brubaker, L.B., Anderson, P.M., Hu, F.S., 2001. Vegetation ecotone dynamics in south-west Alaska during the Late Quaternary. Quaternary Science Reviews 20, 175–188.
Brubaker, L.B., Anderson, P.M., Edwards, M.E., Lozhkin, A.V., 2005. Beringia as a glacialrefugium for boreal trees and shrubs: new perspectives from mapped pollen data.Journal of Biogeography 32, 833–848.
Bunbury, J., Gajewski, K., 2009. Postglacial climates inferred from a lake at treeline,southwest Yukon Territory, Canada. Quaternary Science Reviews 28, 354–369.
558 M. Fritz et al. / Quaternary Research 78 (2012) 549–560
Author's personal copy
Burn, C.R., 1997. Cryostratigraphy, paleogeography, and climate change during theearly Holocene warm interval, western Arctic coast, Canada. Canadian Journal ofEarth Sciences 34, 912–925.
Cwynar, L.C., 1982. A Late-Quaternary vegetation history from Hanging Lake, northernYukon. Ecological Monographs 52, 1–24.
Cwynar, L.C., 1988. Late Quaternary vegetation history of Kettlehole Pond, southwesternYukon. Canadian Journal of Forest Research 18, 1270–1279.
Cwynar, L.C., Spear, R.W., 1995. Paleovegetation and paleoclimatic changes in the Yukonat 6 ka BP. Géographie Physique et Quaternaire 49, 29–35.
Dansgaard, W., 1964. Stable isotopes in precipitation. Tellus 16, 436–468.Duk-Rodkin, A., Hughes, O.L., 1994. Tertiary-quaternary drainage of the pre-glacial
Mackenzie basin. Quaternary International 22–23, 221–241.Duk-Rodkin, A., Hughes, O.L., 1995. Quaternary geology of the northwest part of the cen-
tral Mackenzie Valley corridor, Northwest Territories. Geological Survey of CanadaBulletin 458, 45p.
Duk-Rodkin, A., Barendregt, R.W., Froese, D.G., Weber, F., Enkin, R., Smith, I., Zazula,G.D., Waters, P., Klassen, R., 2004. Timing and extent of Plio-Pleistocene glaciationsin northwestern Canada and east-central Alaska. In: Ehlers, J., Gibbard, P.L. (Eds.),Quaternary Glaciations—Extent and Chronology, Part II: North America. Elsevier,Amsterdam, pp. 313–345.
Dyke, A.S., Prest, V.K., 1987. Late Wisconsinan and Holocene history of the LaurentideIce Sheet. Géographie Physique et Quaternaire 41, 237–263.
Dyke, A.S., Andrews, J.T., Clark, P.U., England, J.H., Miller, G.H., Shaw, J., Veillette, J.J.,2002. The Laurentide and Innuitian ice sheets during the Last Glacial Maximum.Quaternary Science Reviews 21, 9–31.
Dyke, A.S., Moore, A., Robertson, L., 2003. Deglaciation of North America. GeologicalSurvey of Canada Open File 1574.
Elias, S.A., 2000. Late Pleistocene climates of Beringia, based on analysis of fossil beetles.Quaternary Research 53, 229–235.
Engstrom, D.R., Hansen, B.C.S., Wright Jr., H.E., 1990. A possible Younger Dryas recordin southeastern Alaska. Science 250, 1383–1385.
Engstrom, D.R., Fritz, S.C., Almendinger, J.E., Juggins, S., 2000. Chemical and biologicaltrends during lake evolution in recently deglaciated terrain. Nature 408, 161–166.
Environment Canada, 2000. http://climate.weatheroffice.ec.gc.ca//index_e.html(accessed June 2011).
Fægri, K., Iversen, J., 1989. Textbook of Pollen Analysis. The Blackwell Press, New Jersey.Fallu, M.-A., Pienitz, R., Walker, I.R., Overpeck, J., 2004. AMS 14C dating of tundra
lake sediments using chironomid head capsules. Journal of Paleolimnology 31,11–22.
French, H.M., Harry, D.G., 1992. Pediments and cold-climate conditions, Barn Moun-tains, unglaciated northern Yukon, Canada. Gegrafiska Annaler, Series A, PhysicalGeography 74, 145–157.
Fritz, M., Wetterich, S., Schirrmeister, L., Meyer, H., Lantuit, H., Preusser, F., Pollard,W.H., 2012. Eastern Beringia and beyond: Late Wisconsinan and Holocene land-scape dynamics along the Yukon Coastal Plain, Canada. Palaeogeography,Palaeoclimatology, Palaeoecology 319–320, 28–45.
Grimm, E.C., 1991. TILIA and TILIAGRAPH Software. Illinois State Museum, Springfield.Grimm, E.C., 2000. North American Pollen Database. IGBP PAGES/World Data Centre for
Paleoclimatology. NOAA/NGDC Paleoclimatology Program, Boulder, USA. http://www.ngdc.noaa.gov/paleo/pollen.html (accessed June 2011).
Grootes, P.M., Stuiver, M., 1997. Oxygen 18/16 variability in Greenland snow andice with 10-3- to 10-5-year time resolution. Journal of Geophysical Research 102,26455–26470.
Guthrie, R.D., 2001. Origin and causes of the mammoth steppe: a story of cloud cover,woolly mammal tooth pits, buckles, and inside-out Beringia. Quaternary ScienceReviews 20, 549–574.
Hill, P.R., Mudie, P.J., Moran, K., Blasco, S.M., 1985. A sea-level curve for the CanadianBeaufort Shelf. Canadian Journal of Earth Sciences 22, 1383–1393.
Hopkins, D.M., 1982. Aspects of the paleogeography of Beringia during the Late Pleisto-cene. In: Hopkins, D.M., Matthews Jr., J.V., Schweger, Ch.E., Young, S.B. (Eds.),Paleoecology of Beringia. Academic Press, New York, pp. 3–28.
Horita, J., Ueda, A., Mizukami, K., Takaton, I., 1989. Automatic δD and δ18O analyses ofmulti-water samples using H2- and CO2–water equilibration methods with a com-mon equilibration set-up. Applied Radiation and Isotopes 40, 801–805.
Hu, F.S., Lee, B.Y., Kaufman, D.S., Yoneji, S., Nelson, D.M., Henne, P.D., 2002. Response oftundra ecosystem in southwestern Alaska to Younger-Dryas climatic oscillation.Global Change Biology 8, 1156–1163.
Hu, F.S., Nelson, D.M., Clarke, G.H., Rühland, K.M., Huang, Y., Kaufman, D.S., Smol, J.P.,2006. Abrupt climatic events during the last glacial–interglacial transition in Alaska.Geophysical Research Letters 33, L18708.
Hughes, O., 1972. Surficial geology of northern Yukon Territory and northwesternDistrict of Mackenzie, Northwest Territories, Geological Survey of Canada, Paper69–36. Map 1319 A.
Hultén, E., 1937. Outline of the History of Arctic and Boreal Biota during the QuaternaryPeriod. Bokförlags Aktiebolaget Thule, Stockholm.
Huntley, B., Prentice, I.C., 1988. July temperatures in Europe from pollen data, 6000 yearsbefore present. Science 241, 687–690.
Huybers, P., 2006. Early Pleistocene glacial cycles and the integrated summer insolationforcing. Science 313, 508–511.
IAEA (International Atomic Energy Agency), 2006. Isotope Hydrology Information Sys-tem. The ISOHIS Database. http://www.iaea.org/water. (accessed June 2011).
Irvine, F., Cwynar, L., Vermaire, J., Rees, A.H., 2012. Midge-inferred temperature recon-structions and vegetation change over the last 15,000 years from Trout Lake, north-ern Yukon Territory, eastern Beringia. Journal of Paleolimnology 48, 133–146.
Juggins, S., 2003. C2 User Guide. Software for Ecological and Palaeoecological DataAnalysis and Visualisation. University of Newcastle, Newcastle upon Tyne, UK.
Kaufman, D.S., Ager, T.A., Anderson, N.J., Anderson, P.M., Andrews, J.T., Bartlein, P.J.,Brubaker, L.B., Coats, L.L., Cwynar, L.C., Duvall, M.L., Dyke, A.S., Edwards, M.E.,Eisner, W.R., Gajewski, K., Geirsdottir, A., Hu, F.S., Jennings, A.E., Kaplan, M.R.,Kerwin, M.W., Lozhkin, A.V., MacDonald, G.M., Miller, G.H., Mock, C.J., Oswald,W.W., Otto-Bliesner, B.L., Porinchu, D.F., Rühland, K., Smol, J.P., Steig, E.J., Wolfe,B.B., 2004. Holocene thermal maximum in the western Arctic (0–180°W). Quater-nary Science Reviews 23, 529–560.
Keigwin, L., Donnelly, J.P., Cook, M.S., Driscoll, N.W., Brigham-Grette, J., 2006. Rapidsea-level rise and Holocene climate in the Chukchi Sea. Geology 34, 861–864.
Kokorowski, H.D., Anderson, P.M., Mock, C.J., Lozhkin, A.V., 2008. A re-evaluation andspatial analysis of evidence for a Younger Dryas climatic reversal in Beringia. Qua-ternary Science Reviews 27, 1710–1722.
Kurek, J., Cwynar, L.C., Vermaire, J.C., 2009. A late Quaternary paleotemperature recordfrom Hanging Lake, northern Yukon Territory, eastern Beringia. Quaternary Re-search 72, 246–257.
Lacourse, T., Gajewski, K., 2000. Late Quaternary vegetation history of Sulphur Lake,southwest Yukon Territory, Canada. Arctic 63, 27–35.
Laskar, J., Robutel, P., Joutel, F., Gastineau, M., Correia, A.C.M., Levrard, B., 2004. A long-term numerical solution for the insolation quantities of the Earth. Astronomy andAstrophysics 428, 261–285.
Lepš, J., Šmilauer, P., 2003. Multivariate analysis of ecological data using CANOCO. CambridgeUniversity Press, Cambridge.
Mann, D.H., Peteet, D.M., Reanier, R.E., Kunz, M.L., 2002. Responses of an arctic land-scape to Lateglacial and early Holocene climatic changes: The importance of mois-ture. Quaternary Science Reviews 21, 997–1021.
Mason, O.K., Bowers, P.M., Hopkins, D.M., 2001. The early Holocene Milankovitch ther-mal maximum and humans: Adverse conditions for the Denali complex of easternBeringia. Quaternary Science Reviews 20, 525–548.
McAndrews, J.H., Berti, A.A., Norris, G., 1973. Key to the Quaternary pollen and sporesof the Great Lakes region. The University of Toronto Press, Toronto.
Meyer, H., Schirrmeister, L., Yoshikawa, K., Opel, T., Wetterich, S., Hubberten, H.-W.,Brown, J., 2010. Permafrost evidence for severe winter cooling during the YoungerDryas in northern Alaska. Geophysical Research Letters 37, L03501.
Meyers, P.A., 1994. Preservation of elemental and isotopic source identification of sed-imentary organic matter. Chemical Geology 114, 289–300.
Mikolajewicz, U., Crowley, T.J., Schiller, A., Voss, R., 1997. Modelling teleconnectionsbetween the North Atlantic and North Pacific during the Younger Dryas. Nature387, 384–387.
Moore, P.D., Webb, J.A., Collinson, M.E., 1991. Pollen Analysis. Blackwell Science,Oxford.
Morlan, R.E., Cinq-Mars, J., 1982. Ancient Beringians: Human occupation in the LatePleistocene of Alaska and the Yukon Territory. In: Hopkins, D.M., Matthews Jr.,J.V., Schweger, Ch.E., Young, S.B. (Eds.), Paleoecology of Beringia. Academic Press,New York, pp. 353–381.
Murton, J.B., Frechen, M., Maddy, D., 2007. Luminescence dating of mid- to LateWisconsinan aeolian sand as a constraint on the last advance of the LaurentideIce Sheet across the Tuktoyaktuk Coastlands, western Arctic Canada. CanadianJournal of Earth Sciences 44, 857–869.
Nelson, R.E., Carter, L.D., 1987. Paleoenvironmental analysis of insects and extralimitalPopulus from an early Holocene site on the Arctic slope of Alaska, U.S.A. Arctic andAlpine Research 19, 230–241.
Norris, K., 1977. Blow River and Davidson Mountains, Yukon Territory–District ofMackenzie. Geological Survey of Canada, Map 1516A.
Pienitz, R., Smol, J.P., Last, W.M., Leavitt, P.R., Cumming, B.F., 2000. Multi-proxy Holocenepalaeoclimatic record from a saline lake in the Canadian subarctic. The Holocene 10,673–686.
Rampton, V.N., 1971. Late Quaternary vegetational and climatic history of the Snag-Klutlan area, southwest Yukon Territory, Canada. Geological Society of AmericaBulletin 82, 959–978.
Rampton, V.N., 1982. Quaternary geology of the Yukon Coastal Plain. Geological Surveyof Canada Bulletin 317 (49 pp.).
Reimer, P.J., Baillie, M.G., Bard, E., Bayliss, A., Beck, J.W., Blackwell, P.G., Bronk Ramsey,C., Buck, C.E., Burr, G.S., Edwards, R.L., Friedrich, M., Grootes, P.M., Guilderson, T.P.,Hajdas, I., Heaton, T.J., Hogg, A.G., Hughen, K.A., Kaiser, K.F., Kromer, B., McCormac,F.G., Manning, S.W., Reimer, R.W., Richards, D.A., Southon, J.R., Talamo, S., Turney,C.S.M., van der Plicht, J., Weyhenmeyer, C.E., 2009. Intcal09 andmarine09 radiocar-bon age calibration curves, 0–50,000 years cal BP. Radiocarbon 51, 1111–1150.
Ritchie, J.C., 1984. Past and Present Vegetation of the Far Northwest of Canada. Universityof Toronto Press, Toronto.
Ritchie, J.C., Cwynar, L.C., Spear, R.W., 1983. Evidence from north-west Canada for anearly Holocene Milankovitch thermal maximum. Nature 305, 126–128.
Schell, T.M., Scott, D.B., Rochon, A., Blasco, S., 2008. Late Quaternary paleoceanographyand paleo-sea ice conditions in the Mackenzie Trough and Canyon, Beaufort Sea.Canadian Journal of Earth Sciences 45, 1399–1415.
Scott, D.B., Schell, T., St-Onge, G., Rochon, A., Blasco, S., 2009. Foraminiferal assemblagechanges over the last 15,000 years on the Mackenzie-Beaufort Sea Slope and Amund-sen Gulf, Canada: Implications for past sea ice conditions. Paleoceanography 24,PA2219.
Stuiver, M., Reimer, P.J., 1993. Extended 14C data base and revised CALIB 3.0 14C agecalibration program. Radiocarbon 35, 215–230.
Szeicz, J.M., MacDonald, G.M., Duk-Rodkin, A., 1995. Late Quaternary vegetation history ofthe central Mackenzie Mountains, Northwest Territories, Canada. Palaeogeography,Palaeoclimatology, Palaeoecology 113, 351–371.
ter Braak, C.J.F., Šmilauer, P., 2002. CANOCO Reference Manual and CANODRAWfor Windows User's Guide: Software for Canonical Community Ordination(Version 4.5). Microcomputer Power, New York.
559M. Fritz et al. / Quaternary Research 78 (2012) 549–560

Author's personal copy
Vardy, S.R., Warner, B.G., Aravena, R., 1997. Holocene climate effects on the develop-ment of a peatland on the Tuktoyaktuk Peninsula, Northwest Territories. Quater-nary Research 47, 90–104.
Vermaire, J.C., Cwynar, L.C., 2010. A revised late-Quaternary vegetation history of theunglaciated southwestern Yukon Territory, Canada, from Antifreeze and Eiklandponds. Canadian Journal of Earth Sciences 47, 75–88.
Viau, A.E., Gajewski, K., Sawada, M.C., Bunbury, J., 2008. Low- and high-frequency cli-mate variability in eastern Beringia during the past 25000 years. Canadian Journalof Earth Sciences 45, 1435–1453.
Wahl, H.E., Fraser, D.B., Harvey, R.C., Maxwell, J.B., 1987. Climate of Yukon. EnvironmentCanada, Atmospheric Environment Service, Climatological Studies 40, 1–323.
Wang, X.-C., Geurts,M.-A., 1991. Late Quaternary pollen records and vegetation history of thesouthwest Yukon Territory: A review. Géographie Physique et Quaternaire 45, 175–193.
Welsh, S.L., Rigby, J.K., 1971. Botanical and physiographic reconnaissance of northernYukon. Biological Series 14 (64 pp.).
Whitmore, J., Gajewski, K., Sawada, M., Williams, J.W., Minckley, T., Shuman, B.,Bartlein, P.J., Webb III, T., Viau, A.E., Shafer, S., Anderson, P., Brubaker, L.B., 2005.A North American modern pollen database for multi-scale paleoecological andpaleoclimatic applications. Quaternary Science Reviews 24, 1828–1848.
Yu, Z., Walker, K.N., Evenson, E.B., Hajdas, I., 2008. Lateglacial and early Holoceneclimate oscillations in the Matanuska Valley, south-central Alaska. QuaternaryScience Reviews 27, 148–161.
560 M. Fritz et al. / Quaternary Research 78 (2012) 549–560