Embed Size (px)
Citation preview
Author(s): Kinder, Donald R., Robert P. Abelson, and Susan T. Fiske Title: Developmental Research on Candidate Instrumentation Date: August, 1979 Dataset(s): 1979 Pilot Study, New Haven Study
Abstract
This paper describes the development and testing of a number of survey instruments designed to assess the public's perception of its national political leaders. The five measures examined by Kinder et al. and the authors' findings, based on an analysis of the 1979 Pilot Study, are as follows: (1) Trait based evaluation of leaders. The authors find that positive traits typically have a larger impact than negative traits on evaluations of candidates. In addition, trait evaluations appear to be somewhat candidate specific; a factor analysis of trait ratings uncovers both an underlying generic structure to those ratings and a dimension unique to each particular candidate. (2) Affective response to leaders. Affect scores are useful predictors of thermometer and preference ratings. These measures are not redundant with either trait and behavioral scores or with party identification categories. (3) Behavior-based evaluation of leaders. Respondents disclose predictions of candidate conduct, but these behavior-based measures are redundant with the trait inventory measures. (4) Conceptions of an ideal President. In theory this measure would provide a normative standard for comparisons among candidates, but in practice the measure does not behave this way. Attributes deemed important for an ideal President by the 1979 Pilot Study sample did not figure more heavily into respondents' evaluation of, or preferences for, specific candidates. (5) Spontaneous images of leaders. The standard open-ended candidate evaluation questions yield a wider range of responses than the experimental questions. Affect questions, however, appear to be a more effective way to elicit qualitative candidate impressions than the standard questions because the affect measures curtail the respondents' impulse to rationalize their responses.
I iNOT FOR CITATION OR QUOTATION
WITHOUT DIRECT PERMISSION OF THE AUTHOR
Developmental Research on Candidate Instrumentation:
Results and Recommendations
Donald R. Kinder
Robert P. Abelson
Susan T. Fiskec
Report Submitted to:
Board of OverseersNational Election Studies
Center for Political StudiesInstitute for Social Research
The University of MichiganAnn Arbor, Michigan
-. . August, 1979
1. Introduction
This report describes the development of an ensemble of survey in
strumentation designed to assess the American public's perceptions of
its national political leaders. It is about political leadership from
the perspective of the ordinary citizen.
Defined in this way, the leadership literature is in disarray. It
is unsystematic and fragmented, with isolated pockets of understanding
here and there. Research has been dominated by descriptively-oriented
case studies: e.g., on the special appeal of a particular national leader
(Campbell et al., 1960; Converse & Dupeux, 1966; Hyman & Sheatsley, 1953);
on the public's response to President Kennedy's assassination (Greenberg &
Parker, 1969; Wolfenstein & Kliman, 1965); on the Nixon-Kennedy and Carter
Ford debates (Kraus, 1962; Sears & Chaffee, 1979); and so forth. Coexist
ing with this empirical literature--and autonomous from it--are both
scholarly, speculative essays on political leadership and its meaning for
the general public (Burns, 1978; Edelman, 1964; Greenstein; 1965) as well
as popularized accounts, usually from an insider's perspective, on the
merchandising of a political candidate (e.g., Agranoff, 1972; McGinnis,
1968; Nimmo, 1970; Wyckoff, 1968). The literature is hardly cumulative.
Ironically, research is more systematic and the evidence much
stronger, on the need for concerted systematic work on political leader
ship. The problem of leadership addressed here intersects with a set of
enduring general questions in the behavioral analysis of politics: among
them, models of individual vote choice, the analysis of electoral change,
studies of Presidential power, and theories of political socialization.
Our major objective here is to argue successfully for equipping the
l
2
1980 National Election Study with tried and tested instrumentation that
will enable--really for the first time--systematic research on political
leadership. As we shall see, some of our original hunches about the
measurement of public response to national leaders have proved mis
guided; some, fortunately, have been richly borne out.
The remainder of the report itself comes in six sections. The
first five correspond to different facets of leadership, or at least
different ways of measuring response to leadership. We shall take up in
turn: trait-based evaluation of leaders, the personality characteristics
citizens ascribe to leaders; affective response to leaders, the pattern
of emotional responses that leaders elicit; behavior-based evaluation of
leaders, the behavioral expectations citizens hold about candidates once
in office; conceptions of an ideal president, what an ideal president
should be and do; and finally, spontaneous images of leaders, which re
ports our experimentation with three open-ended modes of eliciting leader
impressions. Each section contains a description of the development of
the relevant measures, an argument about their theoretical status, evi
dence on their empirical successes and failures, and closes with recommen
dations for the 1980 National Election Study. The final section then
assembles the recommendations from the preceding parts, presenting a com
plete package of candidate instrumentation for 1980.
Before turning to the various sections, a few preliminary comments
are in order. First, the new candidate instrumentation tried out in the
CPS survey used as targets Carter, Ford, Kennedy, and Reagan. This group
came to be called, affectionately, the gang-of-four. We will often refer
to them in that way here.
3
Second, much of our analysis of the CPS survey explored the rela
tionships between the new candidate instrumentation and other relevant
political judgments. We made special use of a pair of criterion vari
ables in particular. The first is preference. All CPS respondents were
taken through a series of questions to determine their rank order pref
erence among five would-be presidents: Carter, Ford, Kennedy, Reagan,
and Brown (referring ·to Carter as a would-be president is not intended
as a comment on his acbninistration, but rather looks ahead to his prob
able status in the 1980 campaign). This permits the construction of
preference measures for each of the candidates separately, which are
displayed in Table 1.1. As shown there, Ford enjoys a narrow advantage
over his counterparts, at least in terms of average number of opponents
outranked (2.31 01A- of 5). Ford's edge reflects not so much enthusiasm
for his candidacy (only 23% prefer Ford above all others) as it does his
capacity to avoid irretrievably alienating large segments of the citizenry
(just 14% ranked Ford last among the five). Kennedy makes a nice con
trast here. Kennedy evidently polarizes people: 29% pref er him most of
all; 28% ranked Kennedy last.
These same contrasts show up in our second criterion variable:
evaluation, assessed in terms of the familiar CPS thermometer rating
scale. This measure is in fact the unfamiliar CPS thermometer scale.
Two forms of the thermometer measure were included in the spring survey:
the standard measure, and an experimental version, identical in all re
spects except that only three points were labelled (0°, 50°, 100°). We
relied upon this new version, since it was administered to all respondents,
·and in the same wave. The marginals are shown in Table 1.2. Ford is
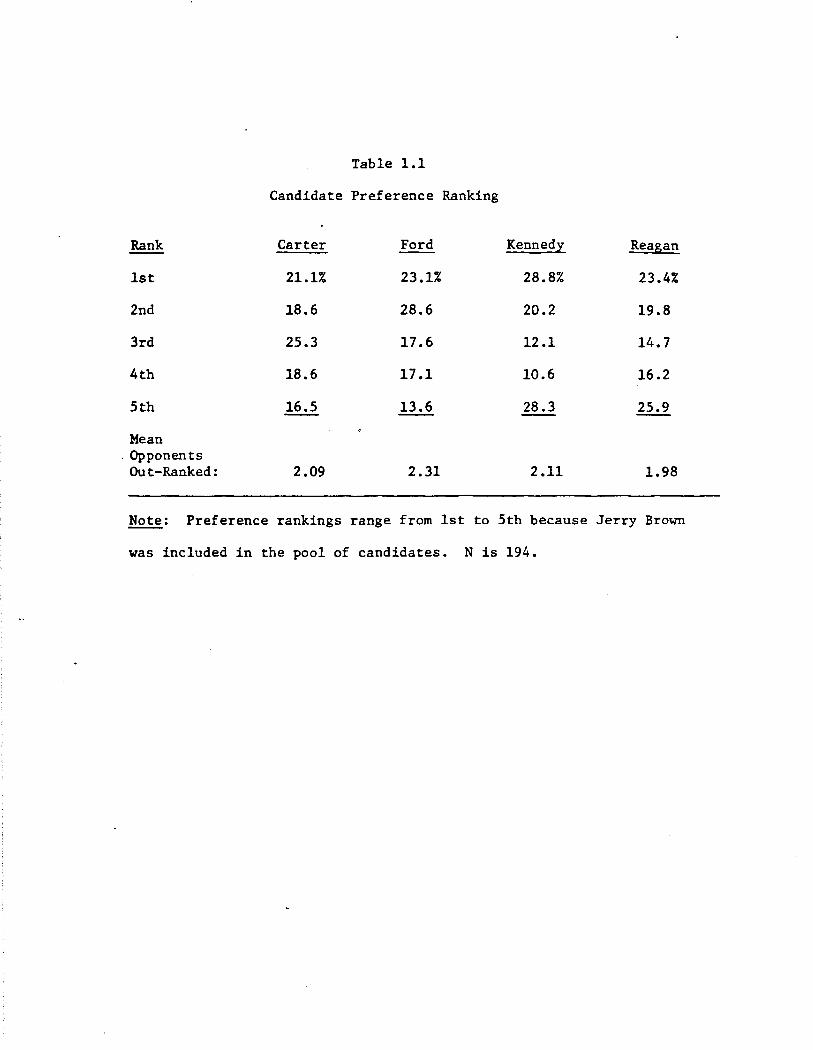
Table 1.1
Candidate Preference Ranking
Rank Carter Ford Kennedy Reagan
1st 21.1% 23.1% 28.8% 23.4%
2nd 18.6 28.6 20.2 19.8
3rd 25.3 17.6 12.1 14.7
4th 18.6 17.1 10.6 16.2
5th 16.5 13.6 28.3 25.9
Mean . Opponents
Out-Ranked: 2.09 2.31 2.11 1.98
Note: Preference rankings range from 1st to 5th because Jerry Brown
was included in the pool of candidates. N is 194.
4
again the leader, though his margin seems to have diminished. And once
again, Ford's ''victory" is achieved by avoiding black marks rather than
any special talent for stirring up support: only about 7% of the CPS
sample evaluated Ford unfavorably (20° or less), about half the total
provoked by the other three candidates. Kennedy again provides the
sharpest counterpoint: among the gang-of-four, evaluations of Kennedy
are the most extreme (compare the standard deviations across the bottom
of Table 1.2). Not surprisingly, evaluation and preference are closely
related. The Pearson correlation between the two is .55 for Ford, .61
for Carter, .63 for Reagan, and .64 for Kennedy. The analysis that fol
lows makes extensive--and equal--use of these two measures.
One final point: our report of course draws heavily on the CPS
spring survey. But at various points it will prove useful to draw com
parisons between the results from the CPS spring survey and those from
our own more modest study undertaken in November and December in New
Haven. In anticipation of those comparisons, we should note now the ways
in which the two samples are comparable and the ways in which they differ.
The New Haven sample was drawn by selecting names from the city
directory. We contacted potential respondents first by letter and then
by telephone to invite their participation and schedule an interview.
Face-to-face personal interviews were eventually completed with 135 New
Haven residents. We offer no assurance that this sample represents even
New Haven faithfully, but in demographic and political terms, the sample
did in fact match up well with population figures. More pointedly, the
New Haven sample appears comparable to the CPS spring study sample on
most demographic variables. There were essentially no differences
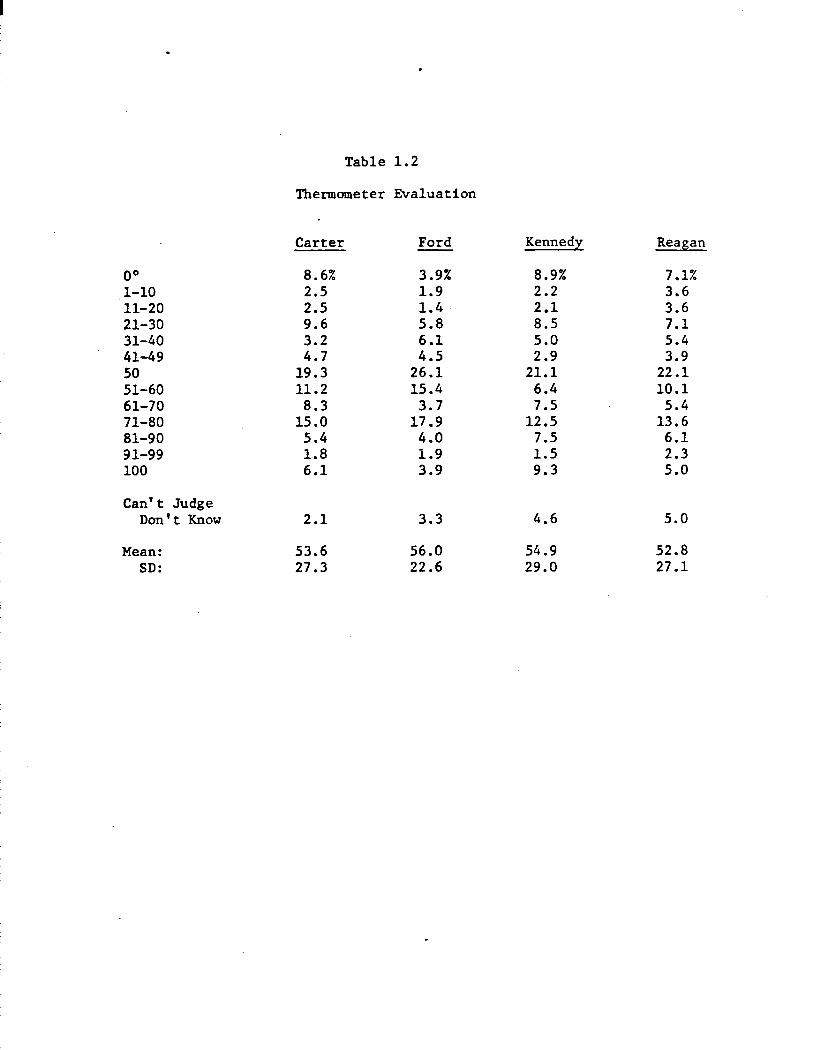
Table 1.2
11lermometer Evaluation
· Carter Ford Kennedy Reagan
oo 8.6% 3.9% 8.9% 7.1% 1-10 2.5 1.9 2.2 3.6 11-20 2.5 1.4. 2.1 3.6 21-30 9.6 5.8 8.5 7.1 31-40 3.2 6.1 5.0 5.4 41-49 4.7 4.5 2.9 3.9 50 19.3 26.1 21.1 22.1 51-60 11.2 15.4 6.4 10.1 61-70 8.3 3.7 7.5 5.4 71-80 15.0 17.9 12.5 13.6 81-90 5.4 4.0 7.5 6.1 91-99 1.8 1.9 1.5 2.3 100 6.1 3.9 9.3 5.0
Can't Judge Don't Know 2.1 3.3 4.6 5.0
Mean: 53.6 56.0 54.9 52.8 SD: 27.3 22.6 29.0 27.1
5
between the two in the dis~ribution of age, race, sex, or marit~l status,
and the New Haven sample _was only slightly better educated on the average
than was the CPS sample. (Such comparabilities do not necessarily re
assure us about the national sample, of course). Tile single appreciable
difference was in partisanship: except for the faculty attracted by
Yale's new School of Organization and Management, there are virtually no
Republicans in New Haven. Self-identified Democrats outnumbered Republi
cans in our New Haven sample by more than six to one, a ratio that cor
responds roughly to city registration figures. By contrast, Democrats
enjoy a much narrower advantage in the CPS spring survey, about three to
two. Tile difference is important. It means that the two samples offer
sharply different environments in which to explore candidate instrumenta
tion. To the extent findings from the two samples converge in spite of
differences in partisanship, to that extent we should find them more
compelling.
2. Trait-Based Evaluation of Leaders
Whenever Americans have been asked what they like and dislike about
major party presidential candidates, a substantial proportion have re
sponded with references to the candidates' personal characteristics. From
Eisenhower to Carter, such personalizing has been a significant and quite
stable part of candidate imagery (Nimmo and Savage, 1976, summarize much
of this evidence). In an analysis of the 1972 and 1976 open-ended candi
date questions, for example, Miller and Miller (1976, 1977) identified
five general categories of personal references: competence (including
references to the candidates' experience and ability); trust (statements
pertaining to the candidate's honesty and integrity); reliability
6
(references to the candidate's responsiveness, decisiveness, and stabil
ity); leadership (references to the candidate as inspiring, communica
tive, warm and likable); and finally personal attributes (the candidate's
demographic characterist~cs--e.g., in 1976, Carter's Southern origins).
Such qualities were cited by roughly 30% of the national sample inter
viewed in 1972, and by about the same proportion in 1976, with competence,
trust, and reliability mentioned most frequently. Moreover, judgments
expressed in these terms were sharply related to overall evaluation (as
indexed by the thermometer rating scale; Miller & Miller, 1976, p. 843;
1977, Table II). All this evidence suggests that candidates are evaluated
partly in terms of the traits they exemplify--or better, traits they appear
to exemplify.
For guidance in understanding trait-based candidate evaluation, we
turned first to social psychology. Remarkably enough, four autonomous
lines of social psychological research in fact converged in their implicit
recommendations: first, that trait-based evaluation of candidates should
be multi-dimensional» and second and more precisely, that such evaluations
should fall roughly along the largely independent dimensions of com
petence and sociability. These two dimensions emerge in investigations
of leadership in small groups (task versus socio-emotional leadership;
Cartwright & Zander, 1968); in attitude change research on source credi
bility (expertise versus trust; McGuire, 1969); in research on inter-
. personal attraction (respect versus affection; Rubin, 1973); and in
person perception research indicating that people's evaluations of others
can be represented in terms of two distinct though related dimensions
·(intellectual competence versus affection; Rosenberg & Sedlak, 1972;
7
Rosenberg, 1977).
When we turn back from social psychological investigations to con
sider candidate evaluations per se, relevant evidence becomes difficult
to find. Certainly one precursor.of our current activities is a com
munity panel study of voter reaction to the 1976 Vice-Presidential Debate
(Kinder, Denney, & Wagner, 1977). By factor analyzing a trait inventory
included in both our pre-debate and post-debate interview schedules, we
expected to find two correlated but conceptually distinct components to
candidate evaluation: a competence dimension ("intelligent, "experienced,"
''hardworking") and an integrity dimension ("trustworthy," ''misleading,"
''honest"). Evaluations of both Dole and Mondale did indeed fall along
the two predicted dimensions--particularly in the post-debate interview
and especially for respondents who had watched the Vice Presidential
Debate.
These results suggest the promise of a multi-dimensional approach
to trait-based evaluation. A preliminary step in developing measures
that adequately reflect this was taken in our New Haven survey. New
Haven respondents were instructed_ to think about a specific politician,
and then asked how well each of 48 traits characterized him. (These 48
are essentially an elaboration of a briefer inventory that was part of
our Vice-Presidential Debate study.) The sample was split at this point:
half were asked about Carter and then Ford; half were asked about Kennedy
and then Reagan.
Factor analysis of these lengthy inventories did in fact reveal
dimensions of competence and integrity, though they emerged in somewhat
different ways for each of the gang-of-four. For each, competence and
8
integrity did constitute the first two, dominant and weakly correlated
factors (Pearson.!. between them was around .2). But overlaid on this
structure, the separate factor analyses also identified idiosyncratic
themes. For example, traits that defined Kennedy's competence factor
included knowledgeable, hard-working, inspiring, and smart. His in
tegrity factor was defined by ruthless, reckless, sneaky, greedy, power
hungry, unstable. Competence and integrity are clearly represented
here, but the specific content of the factors seems to bear Kennedy's
particular imprint.
Based on these results, we drew up a trait inventory to be included
in the 1979 CPS Pilot Survey. Our objective here was to assure coverage
of the themes of competence and integrity, but also to attempt to autici
pate the idiosyncratic meaning that candidates might contribute to these
themes. As in the New Haven survey, respondents were instructed to think
about a particular politician (one of the gang-of-four) and then asked
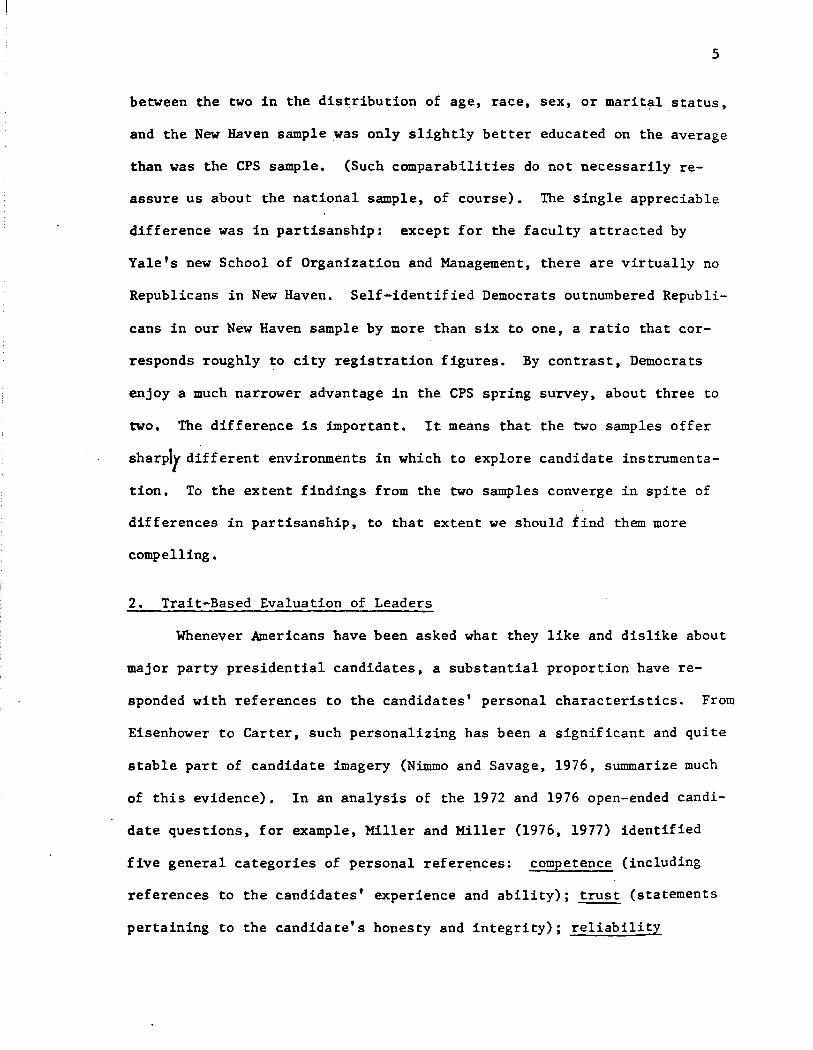
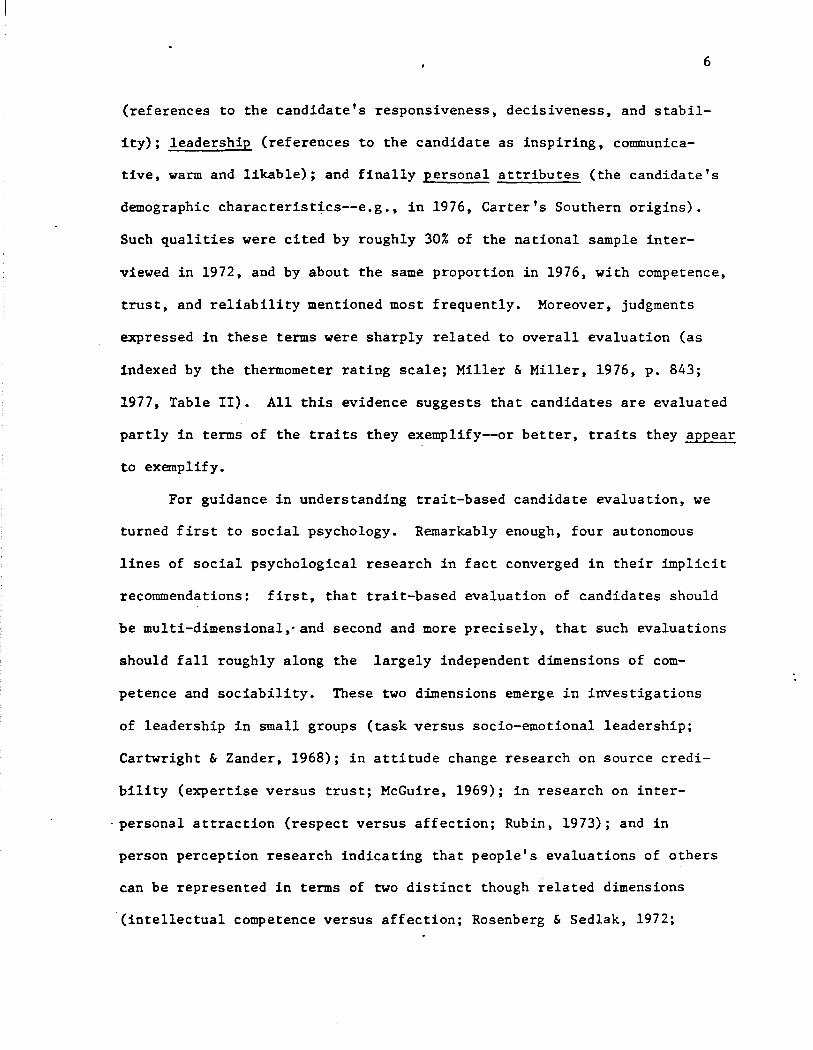
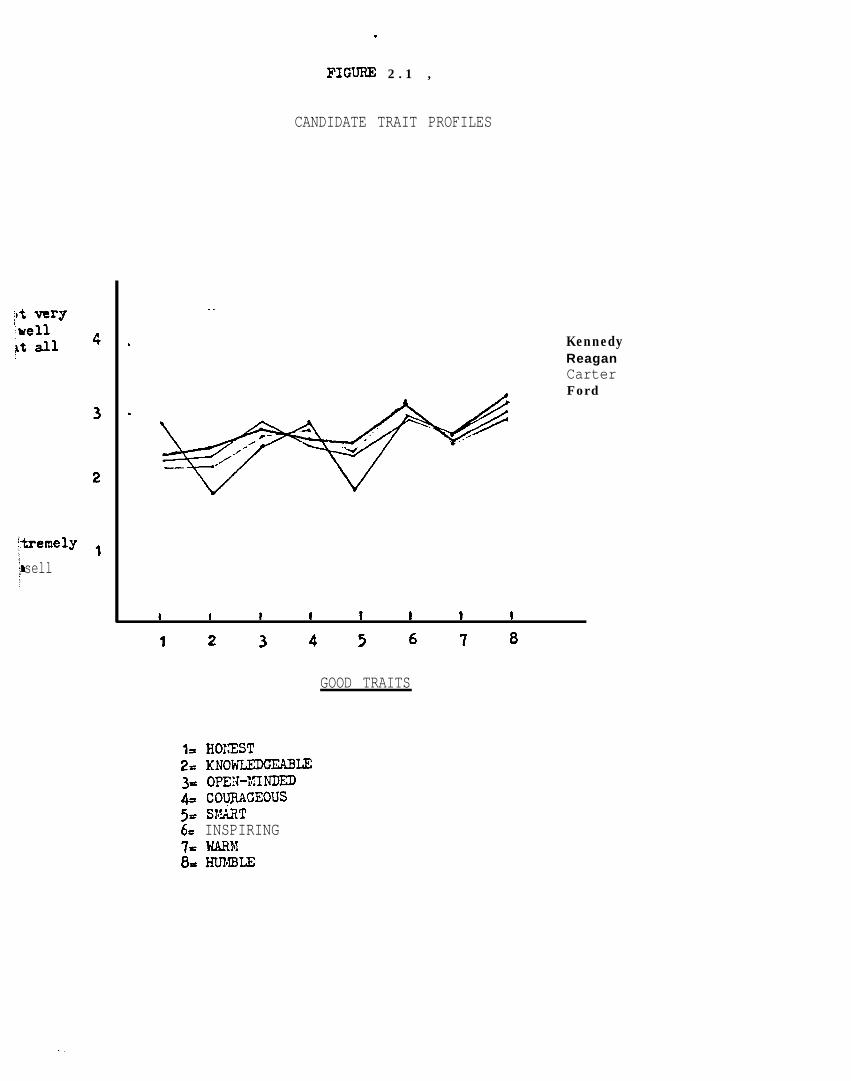
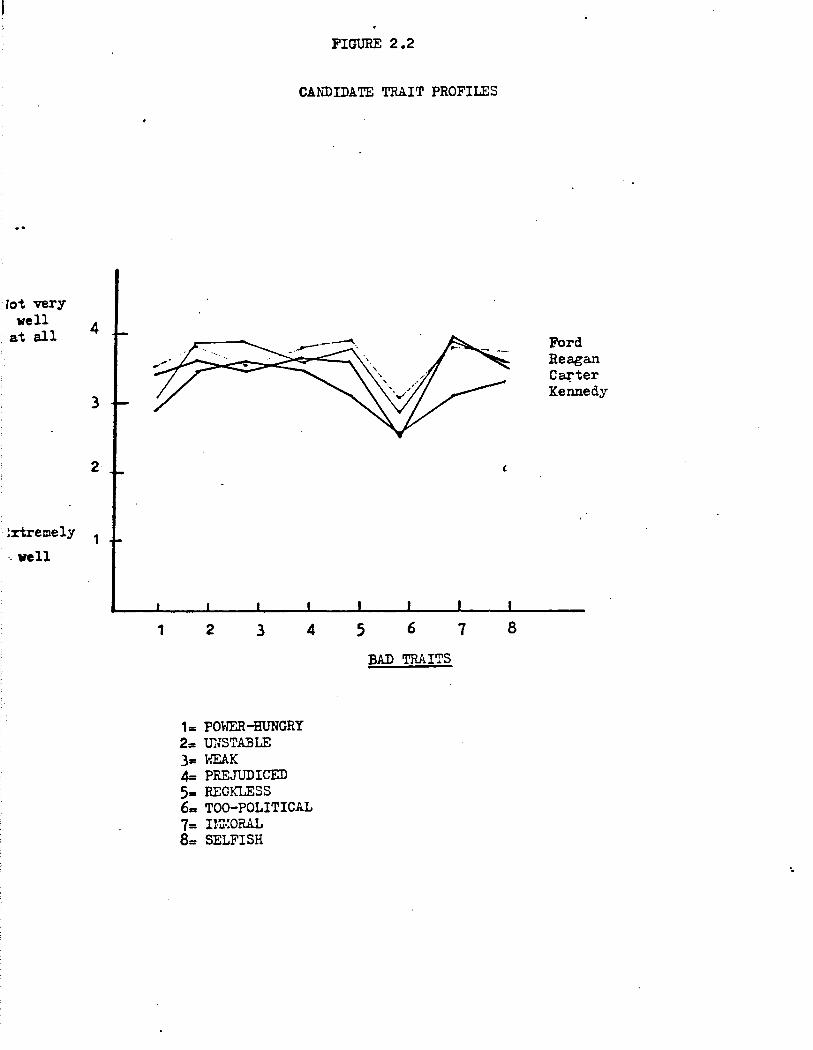
how well each of sixteen traits (8 good, 8 bad) characterized him. The
complete trait inventory is presented in Appendix A. It appears in ab
breviated form in Figures 2.1 (good traits) and 2.2 (bad traits), along
with the corresponding marginals.
Candidates Trait Profiles
These data indicate first of all that there are strong resemblances
among the trait profiles associated with each member of our illustrious
gang-of-four. Carter, Ford, Kennedy, and Reagan were all thought to be
somewhat warm (lukewarm?), none was thought prejudiced, all were judged
to be not very inspiring, and so on. Such similarities suggest that citi
zens may possess evaluatively-laden conceptions of political leaders in
; veryrelldll
tremely
sell
4
3
2
1
.
FIGURE 2 . 1 ,
CANDIDATE TRAIT PROFILES
. .
KennedyReaganCarterFord
I I 1 I 1 I 1 1
1 2 3 4 3 6 7 8
GOOD TRAITS
1s HOXEZT2s KNO-Z;E3s OPE+IiIIND~4-_ COLJFLAGEOUS5s S?.'?T6s INSPIRING7s HARM8smlRL;E
. .
lot very well
at all 4
3
2
!rlremely 1 -. well
1
FIGURE 2.2
CANDIDATE TRAIT PROFILES
2 3
1= POWER-HUNGRY 2= UNSTABLE 3• WEAK 4= PREJUDICED 5= RECKLESS
4
6a TOO-POLITICAL 7= n:wRAL 8= SELFISH
5 6 7
BAD TRAITS
{
8
Ford Reagan Ca;-ter Kennedy
..
·.
9
the abstract, which they then apply to specific cases. Thus merely ap
preciating Reagan's status as a prominent political actor may be suffici
ent to generate inferences about his courage, intelligence, stability,
and so forth. To invoke a more expressly psychological vocabulary, cit
izens may hold implicit personality theories about politicians as they
appear to do about others--in this case, about would-be presidents.
To be slightly more precise, contingent upon their own partisan
identification, citizens may hold one implicit theory about Democratic
would-be presidents, and another about Republican would-be Presidents. It
should come as no surprise that trait ratings, heavily evaluative as they
are, are influenced by citizens' partisanship. Self-identified Democrats
tend to attribute favorable traits with greater assurance to Democratic
candidates than to Republican candidates, while showing the opposite
tendency for negative traits. Republican respondents are no less parti
san, manifesting the complementary pattern. These partisan effects are
summarized in Table 2.1. As indicated there, Democrats and Republicans
generally diff er--though not enormously--in their trait-based images of
the various candidates. This suggests in turn that they may hold differ
ent implicit personality theories about Republican and Democratic
candidates.
There is surely more to political trait ascriptions than this, how
ever. Citizens do not merely generate inferences from some abstract
. prototype they hold about Republican and Democratic leaders. This can
be demonstrated most clearly by returning to Figures 2.1 and 2.2. Al
though the general pattern displayed there is one of strong family re
semblances, there are also occasional deviations, most of which are
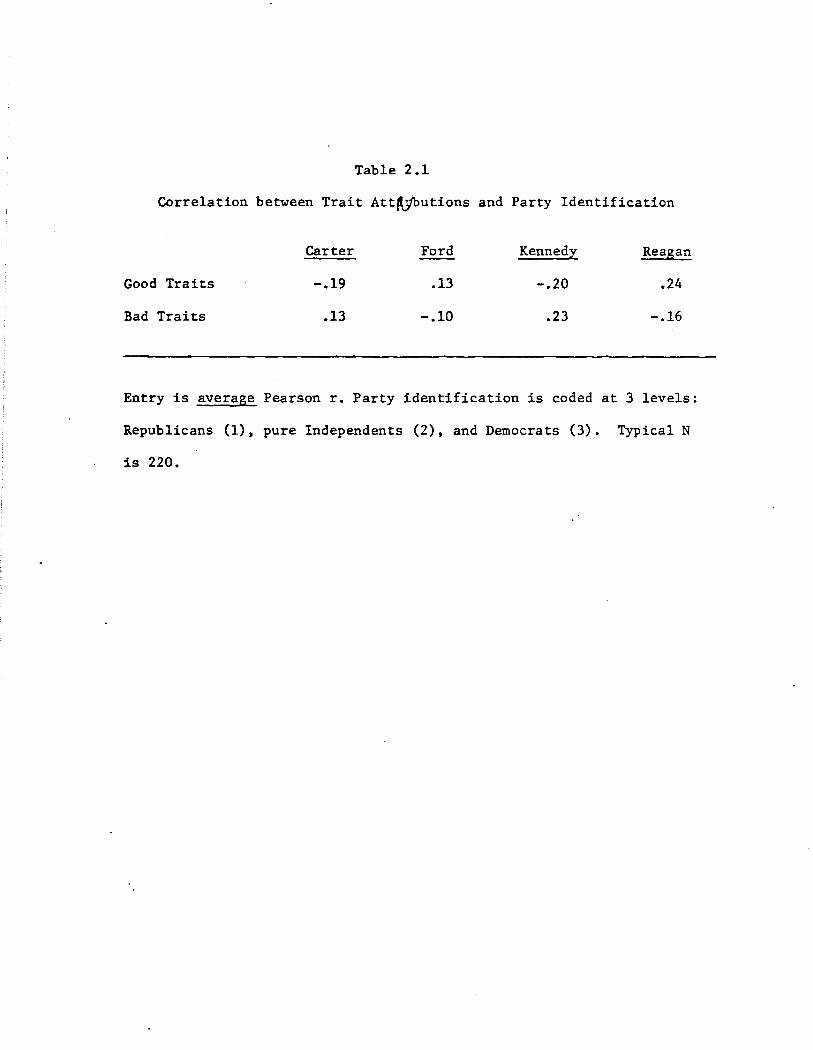
Table 2 .1
Correlation between Trait Att~utions and Party Identification
Good Traits
Bad Traits
Carter
-.19
.13
Ford
.13
-.10
Kennedy
-.20
.23
Reagan
.24
-.16
Entry is average Pearson r. Party identification is coded at 3 levels:
Republicans (1), pure Independents (2), and Democrats (3). Typical N
is 220.
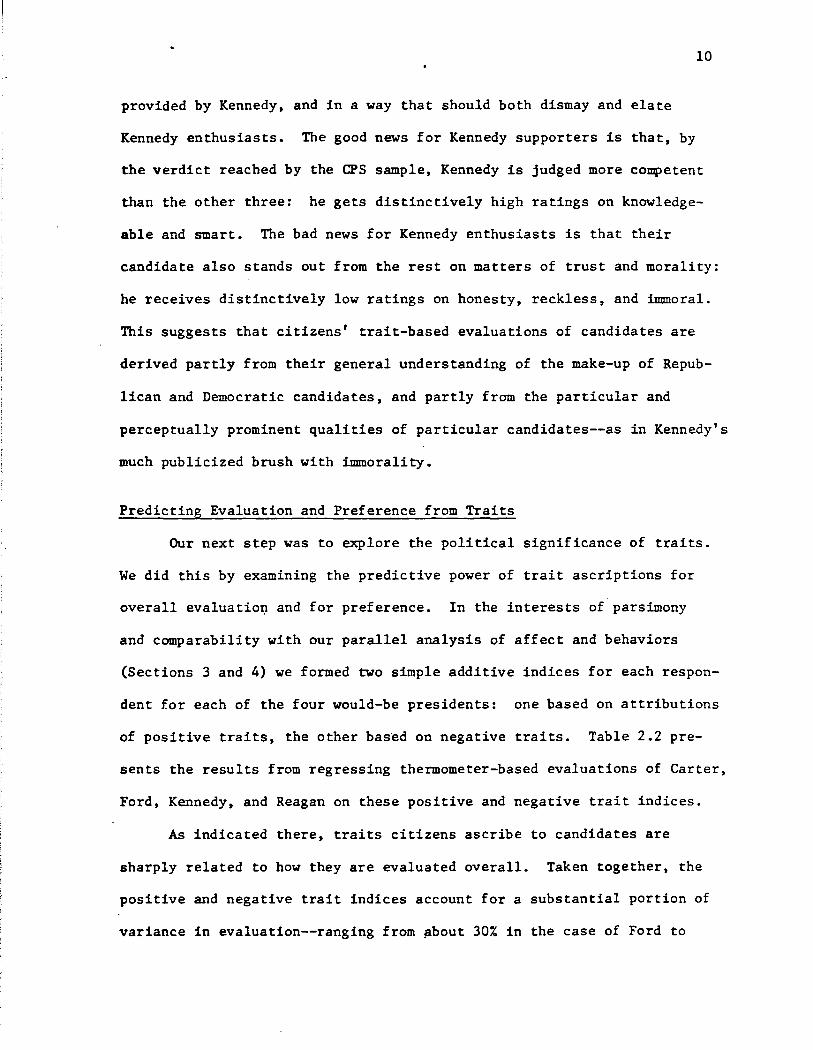
provided by Kennedy, and in a way that should both dismay and elate
Kennedy enthusiasts. The good news for Kennedy supporters is that, by
10
the verdict reached by the CPS sample, Kennedy is judged more competent
than the other three: he gets distinctively high ratings on knowledge
able and smart. The bad news for Kennedy enthusiasts is that their
candidate also stands out from the rest on matters of trust and morality:
he receives distinctively low ratings on honesty, reckless, and immoral.
This suggests that citizens' trait-based evaluations of candidates are
derived partly from their general understanding of the make-up of Repub
lican and Democratic candidates, and partly from the particular and
perceptually prominent qualities of particular candidates--as in Kennedy's
much publicized brush with immorality.
Predicting Evaluation and Preference from Traits
Our next step was to explore the political significance of traits.
We did this by examining the predictive power of trait ascriptions for
overall evaluatio~ and for preference. In the interests of parsimony
and comparability with our parallel analysis of affect and behaviors
(Sections 3 and 4) we formed two simple additive indices for each respon
dent for each of the four would-be presidents: one based on attributions
of positive traits, the other based on negative traits. Table 2.2 pre
sents the results from regressing thermometer-based evaluations of Carter,
Ford, Kennedy, and Reagan on these positive and negative trait indices.
As indicated there, traits citizens ascribe to candidates are
sharply related to how they are evaluated overall. Taken together, the
positive and negative trait indices account for a substantial portion of
variance in evaluation--ranging from ~bout 30% in the case of Ford to
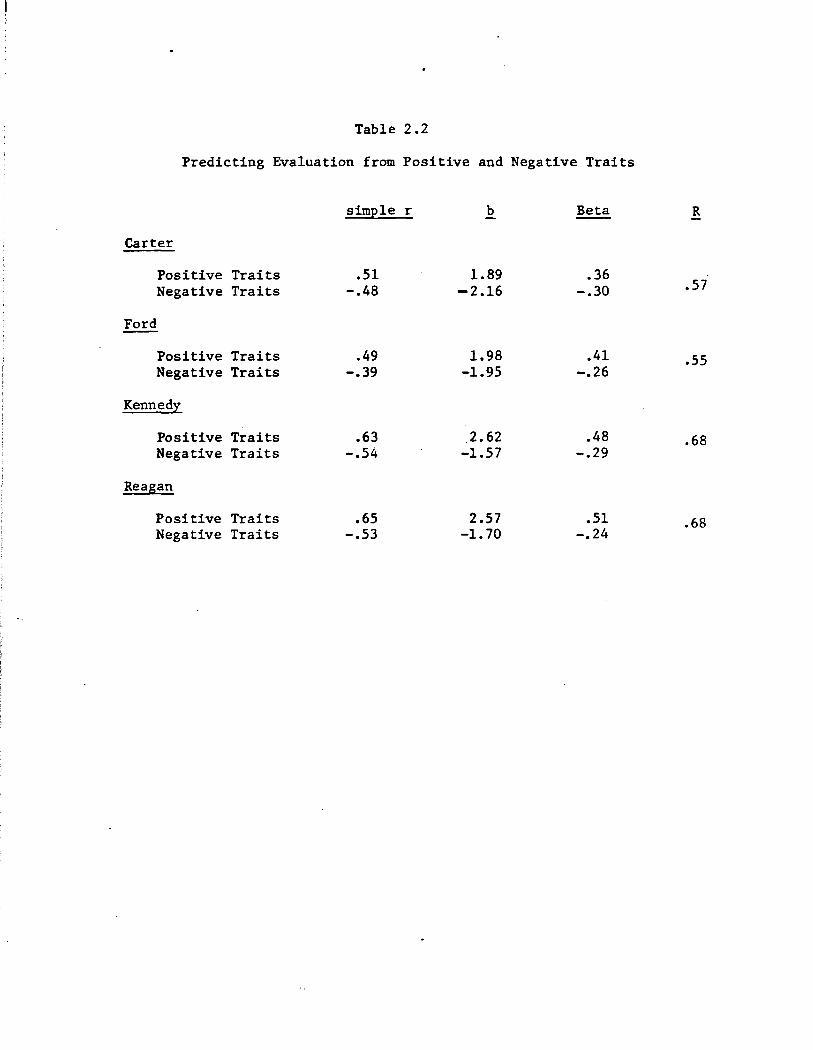
Table 2 .2
Predicting Evaluation from Positive and Negative Traits
simple r b Beta R
Carter
Positive Traits .51 1.89 .36 Negative Traits -.48 -2.16 -.30 .57
Ford
Positive Traits .49 1.98 .41 .55 Negative Traits -.39 -1.95 -.26
Kennedy
Positive Traits .63 2.62 .48 .68 Negative Traits -.54 .:.i.57 -.29
Reagan
Positive Traits .65 2.57 .51 .68 Negative Traits -.53 -1. 70 -.24
11
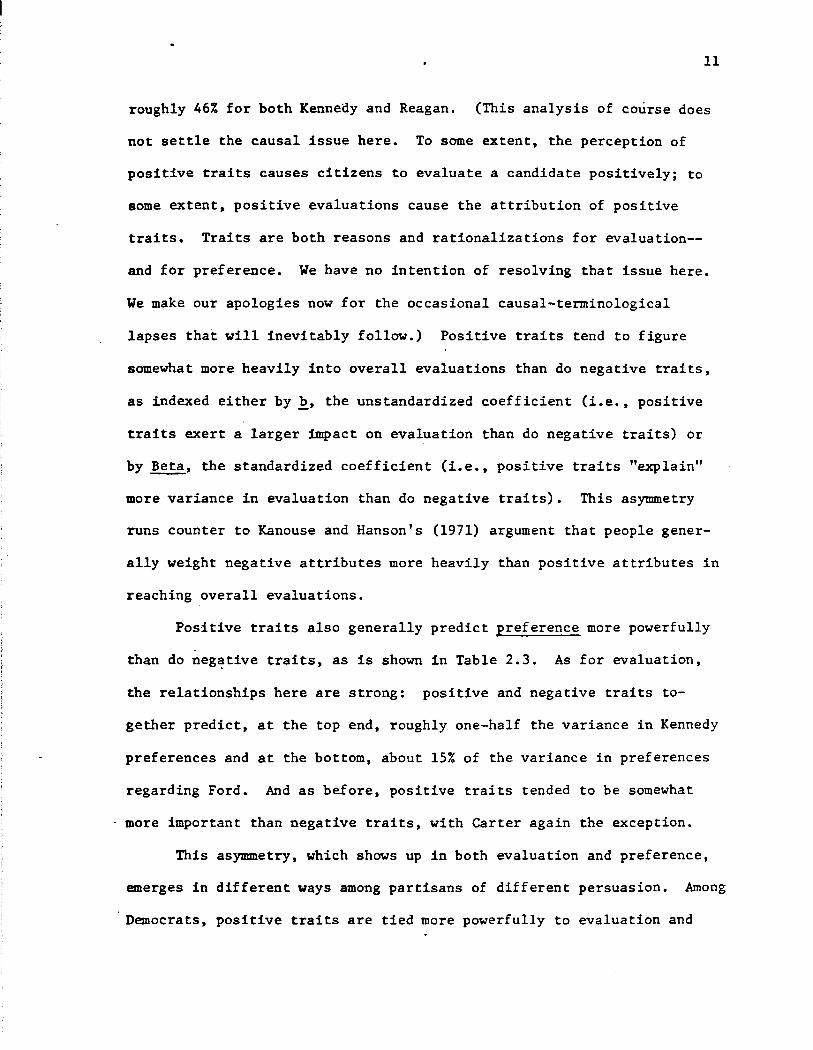
roughly 46% for both Kennedy and Reagan. (This analysis of course does
not settle the causal issue here. To some extent, the perception of
positive traits causes citizens to evaluate a candidate positively; to
some extent, positive evaluations cause the attribution of positive
traits. Traits are both reasons and rationalizations for evaluation-
and for preference. We have no intention of resolving that issue here.
We make our apologies now for the occasional causal-terminological
lapses that will inevitably follow.) Positive traits tend to figure
somewhat more heavily into overall evaluations than do negative traits,
as indexed either by b, the unstandardized coefficient (i.e., positive
traits exert a larger impact on evaluation than do negative traits) or
by ~, the standardized coefficient (i.e., positive traits "explain"
more variance in evaluation than do negative traits). This asymmetry
runs counter to Kanouse and Hanson's (1971) argument that people gener
ally weight negative attributes more heavily than positive attributes in
reaching overall evaluations.
Positive traits also generally predict preference more powerfully
than do neg~tive traits, as is shown in Table 2.3. As for evaluation,
the relationships here are strong: positive and negative traits to
gether predict, at the top end, roughly one-half the variance in Kennedy
preferences and at the bottom, about 15% of the variance in preferences
regarding Ford. And as before, positive traits tended to be somewhat
more important than negative traits, with Carter again the exception.
This asymmetry, which shows up in both evaluation and preference,
emerges in different ways among partisans of different persuasion. Among
Democrats, positive traits are tied more powerfully to evaluation and
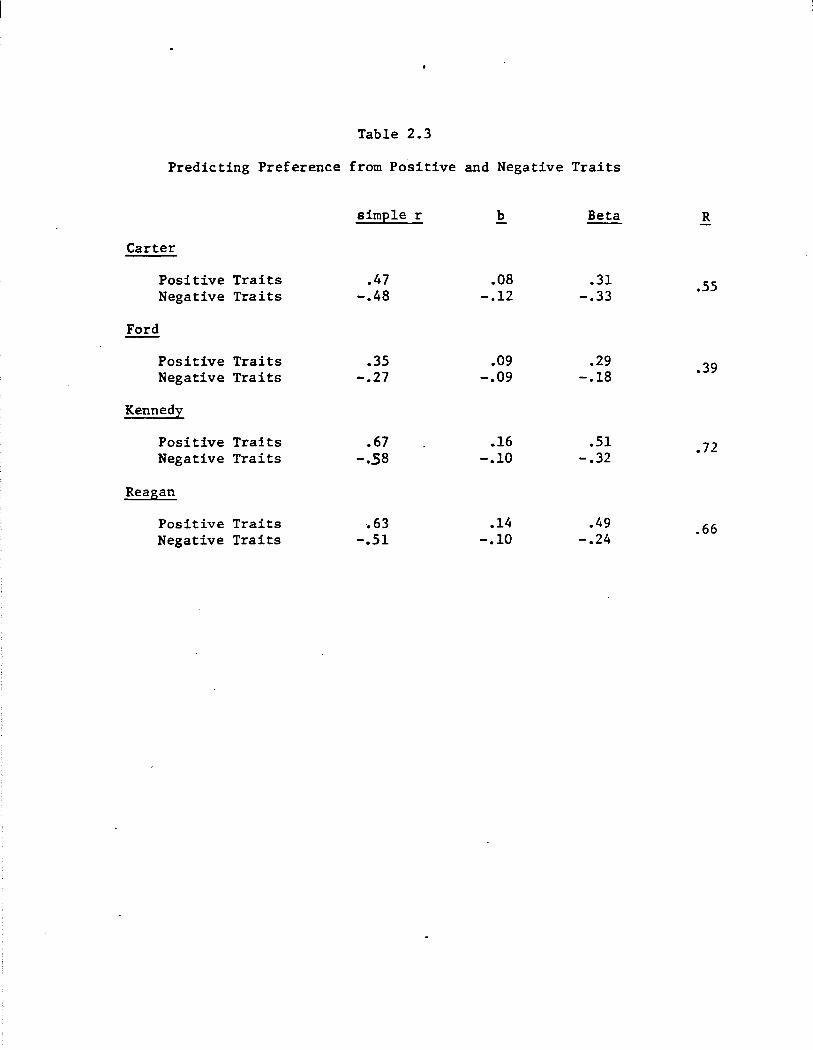
Table 2.3
Predicting Preference from Positive and Negative Traits
simple r b Beta R
Carter
Positive Traits .47 .08 .31 .55 Negative Traits -.48 -.12 -.33
Ford
Positive Traits .35 .09 .29 .39 Negative Traits -.27 -.09 -.18
Kennedy
Positive Traits .67 .16 .51 • 72 Negative Traits -.58 -.10 -.32
Reagan
Positive Traits ·.63 .14 .49 .66 Negative Traits -.51 -.10 -.24
12
preference than are negativ~ traits, but really only for Republican
would-be presidents. The tendency in fact reverses in Democrats'
evaluations of and preferences toward Democratic candidates. There
negative traits seem to count for more. This same interaction shows up
among Republicans: positive traits tend to overshadow negative traits
when it comes to judging Democratic candidates; the opposit~ holds for
Republican candidates, for evaluation and preference alike. (Among
Independents, evaluation and preference are affected about equally by
positive and negative traits.) Thus unfavorable personality characteris
tics become especially significant--especially troublesome--when they
appear in candidates' representing one's own party. It is one thing
for a Republican to think Edward Kennedy power-hungry; it may be another
and more serious matter to recognize the same attribute in Ronald Reagan.
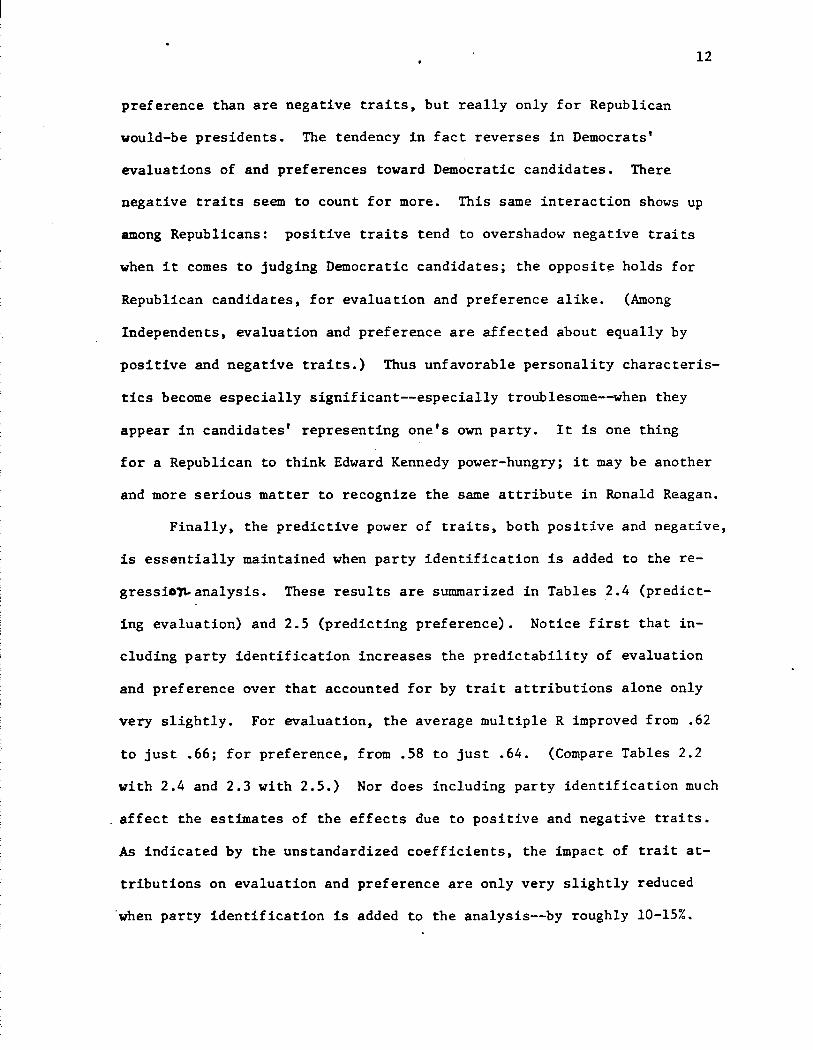
Finally, the predictive power of traits, both positive and negative,
is essentially maintained when party identification is added to the re
gressiOl\- analysis. These results are summarized in Tables 2.4 (predict
ing evaluation) and 2.5 (predicting preference). Notice first that in
cluding party identification increases the predictability of evaluation
and preference over that accounted for by trait attributions alone only
very slightly. For evaluation, the average multiple R improved from .62
to just .66; for preference, from .58 to just .64. (Compare Tables 2.2
with 2.4 and 2.3 with 2.5.) Nor does including party identification much
. affect the estimates of the effects due to positive and negative traits.
As indicated by the unstandardized coefficients, the impact of trait at
tributions on evaluation and preference are only very slightly reduced
·when party identification is added to the analysis--by roughly 10-15%.
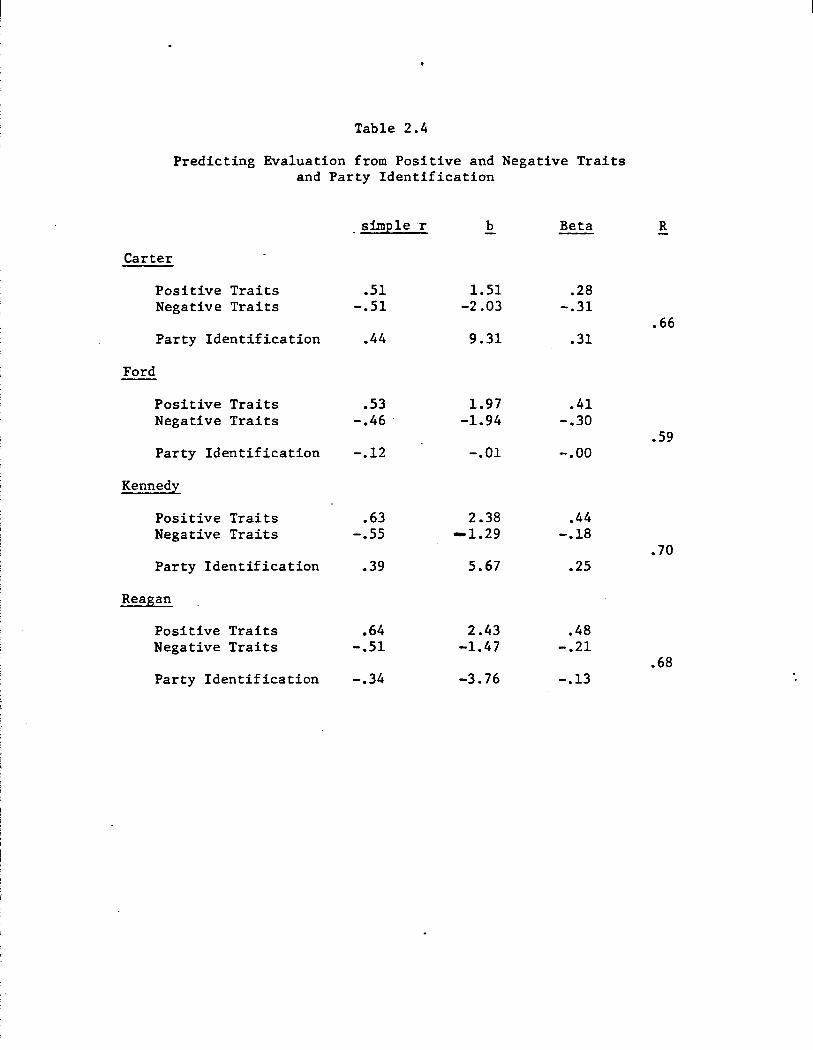
Table 2.4
Predicting Evaluation from Positive and Negative Traits and Party Identification
simple r b Beta R
Carter
Positive Traits .51 1.51 .28 Negative Traits -.51 -2.03 -.31
.66 Party Identification .44 9.31 .31
Ford
Positive Traits .53 1.97 .41 Negative Traits -.46 . -1.94 -.30
.59 Party Identification -.12 -.01 -.oo
Kennedy
Positive Traits .63 2.38 .44 Negative Traits -.55 -1.29 -.18
.70 Party Iden tif ica tion .39 5.67 .25
Reagan
Positive Traits .64 2.43 .48 Negative Traits -.51 -1.47 -.21
.68 Party Identification -.34 -3.76 -.13
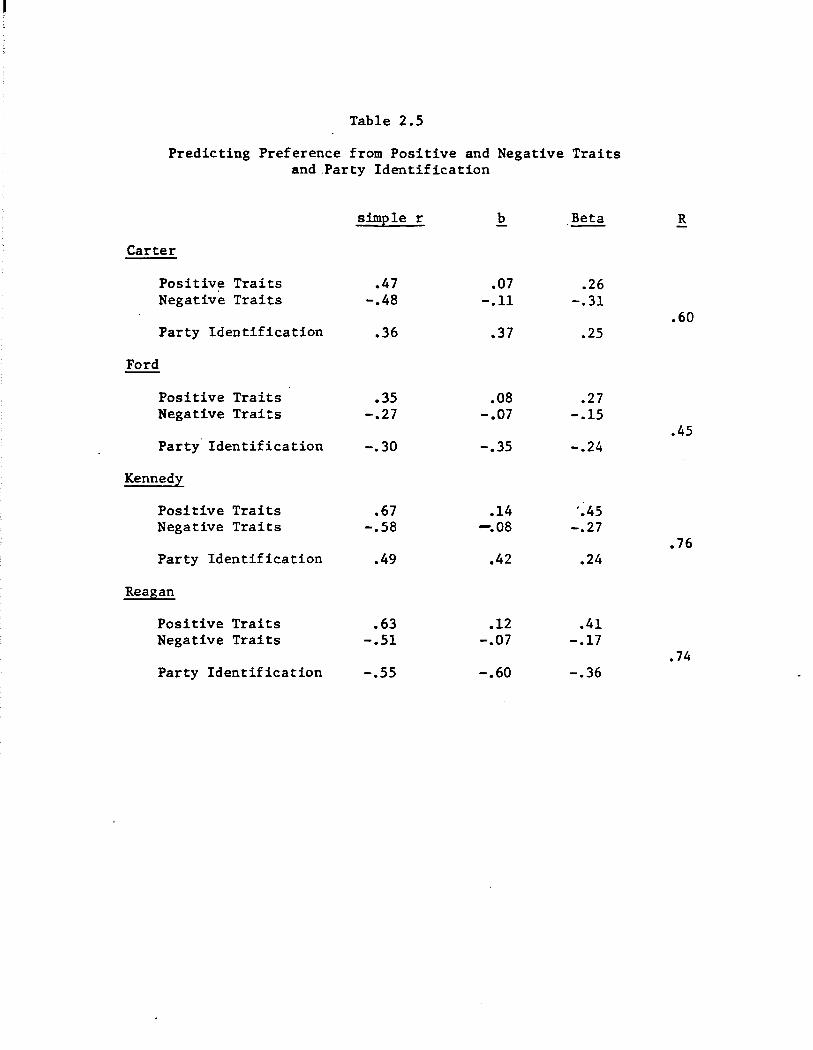
Table 2.5
Predicting Preference from Positive and Negative Traits and.Party Identification
simple r b Beta R
Carter
Positive Traits .47 .07 .26 Negative Traits -.48 -.11 -.31
.60 Party Identification .36 .37 .25
Ford
Positive Traits .35 .08 .27 Negative Traits -.27 -.07 -.15
.45 Party Identification -.30 -.35 -.24
Kennedy
Positive Traits .67 .14 '.45 Negative Traits -.58 -.08 -.27
.76 Party Identification .49 .42 .24
Reagan
Positive Traits .63 .12 .41 Negative Traits -.51 -.07 -.17
.74 Party Identification -.55 -.60 -.36
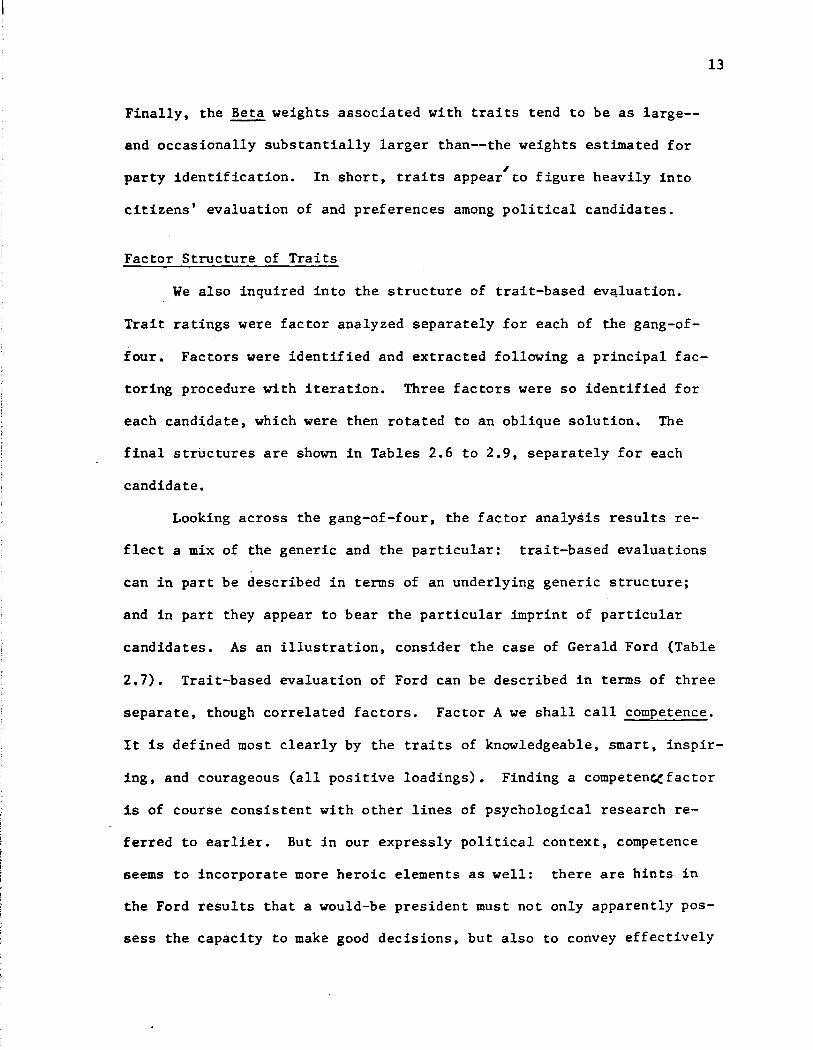
13
Finally, the Beta weights associated with traits tend to be as large--
and occasionally substantially larger than--the weights estimated for
party identification. ,
In short, traits appear to figure heavily into
citizens' evaluation of and preferences among political candidates.
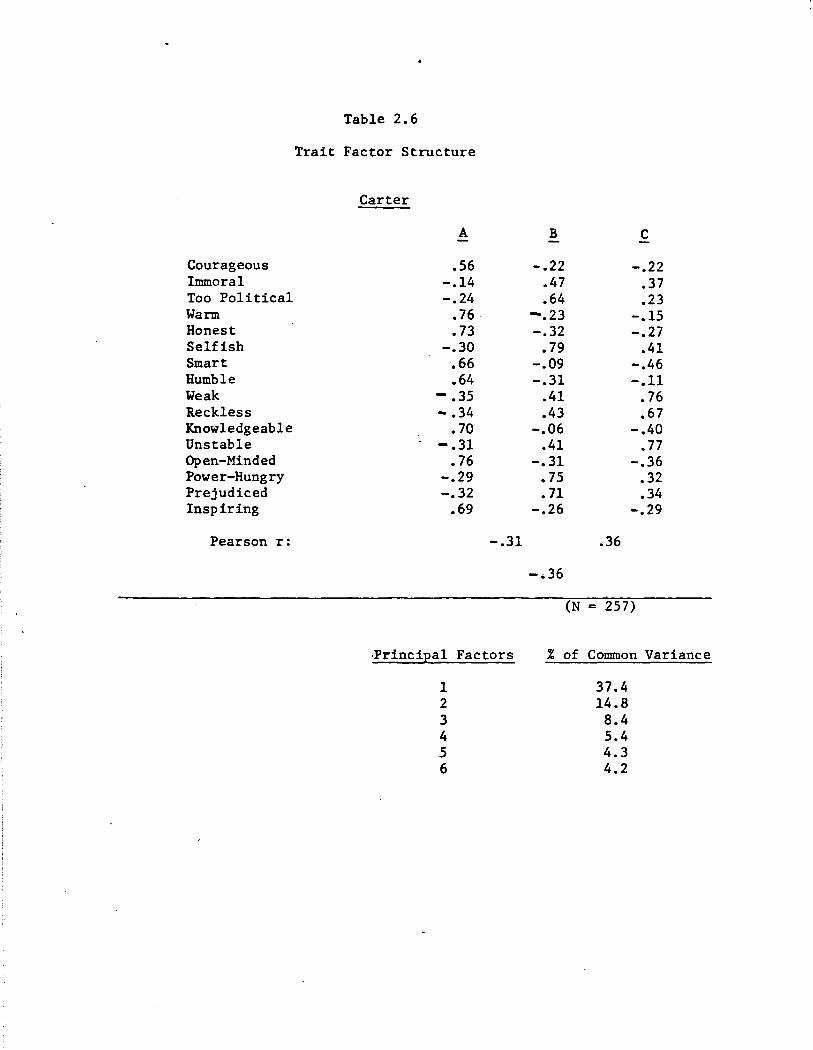
Factor Structure of Traits
We also inquired into the structure of trait-based evqluation.
Trait ratings were factor analyzed separately for each of the gang-of-
four. Factors were identified and extracted following a principal fac-
taring procedure with iteration. Three factors were so identified for
each candidate, which were then rotated to an oblique solution. The
final structures are shown in Tables 2.6 to 2.9, separately for each
candidate.
Looking across the gang-of-four, the factor analysis results re-
fleet a mix of the generic and the particular: trait-based evaluations
can in part be described in terms of an underlying generic structure;
and in part they appear to bear the particular imprint of particular
candidates. As an illustration, consider the case of Gerald Ford (Table
2.7). Trait-based evaluation of Ford can be described in terms of three
separate, though correlated factors. Factor A we shall call competence.
It is defined most clearly by the traits of knowledgeable, smart, inspir-
ing, and courageous (all positive loadings). Finding a competene(factor
is of course consistent with other lines of psychological research re-
ferred to earlier. But in our expressly political context, competence
seems to incorporate more heroic elements as well: there are hints in
the Ford results that a would-be president must not only apparently pas-
sess the capacity to make good decisions, but also to convey effectively
Courageous Immoral Too Political Warm Honest Selfish Smart Humble Weak Reckless Knowledgeable Unstable Open-Minded Power-Hungry Prejudiced Inspiring
Pearson r:
Trait
Table 2.6
Factor Structure
Carter
A
.56 -.14 -.24
.76
.73 -.30
.66
.64 - .35 - .34
• 70 -.31
.76 -.29 -.32
.69
-.31
·Principal Fae tors
1 2 3 4 5 6
B c
-.22 -.22 .47 .37 .64 .23
-.23 -.15 -.32 -.27
.79 .41 -.09 -.46 -.31 -.11
.41 .76
.43 .67 -.06 -.40
.41 • 77 -.31 -.36
.75 .32 • 71 .34
-.26 -.29
.36
-.36
(N = 257)
% of Common Variance
37.4 14.8 8.4 5.4 4.3 4.2
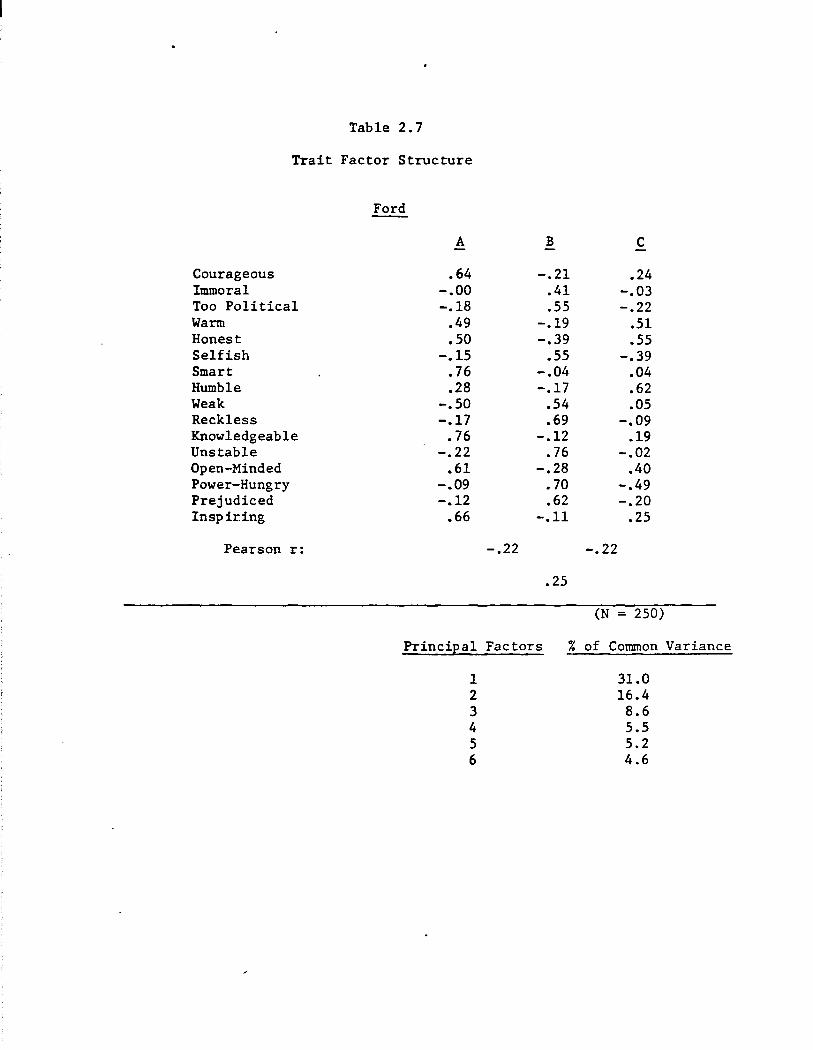
Table 2. 7
Trait Factor Structure
Courageous Immoral Too Political Warm Honest Selfish Smart Humble Weak Reckless Knowledgeable Unstable Open-Minded Power-Hungry Prejudiced Inspiring
Pearson r:
Ford
A
.64 -.00 -.18
.49
.so -.15
.76
.28 -.50 -.17
.76 -.22
.61 -.09 -.12
.66
Principal
1 2 3 4 5 6
B c
-.21 .24 .41 -.03 .55 -.22
-.19 .51 -.39 .55
.55 -.39 -.04 .04 -.17 .62
.54 .05
.69 -.09 -.12 .19
.76 -.02 -.28 .40
• 70 -.49 .62 -.20
-.11 .25
-.22 -.22
.25
(N = 250)
Factors % of Common Variance
31.0 16.4 8.6 5.5 5.2 4.6
Courageous Immoral Too Political Warm Honest Selfish Smart Humble Weak Rekcless Knowledgeable Unstable Open-Minded Power-Hungry Prejudiced Inspiring
Pearson r:
Table 2.8
Trait Factor Structure
Kennedy
A B c
-.52 .59 .30 .66 -.20 -.24 .57 -.15 -.32
-.43 .66 .34 -.60 .61 .42
.73 -.36 -.31 -.13 .74 -.26 -.42 .57 .54
.67 -.37 .09
.79 -.30 -.20 -.19 .69 -.07
.68 -.37 .12 . -.40 .64 .32
.71 -.29 -.48
.65 -.27 -.12 -.42 .68 .35
-.40 .11
-.27
(N = 241)
Principal Factors % of Common Variance
1 41.3 2 13.5 3 7.6 4 4.7 5 4.3 6 3. 7
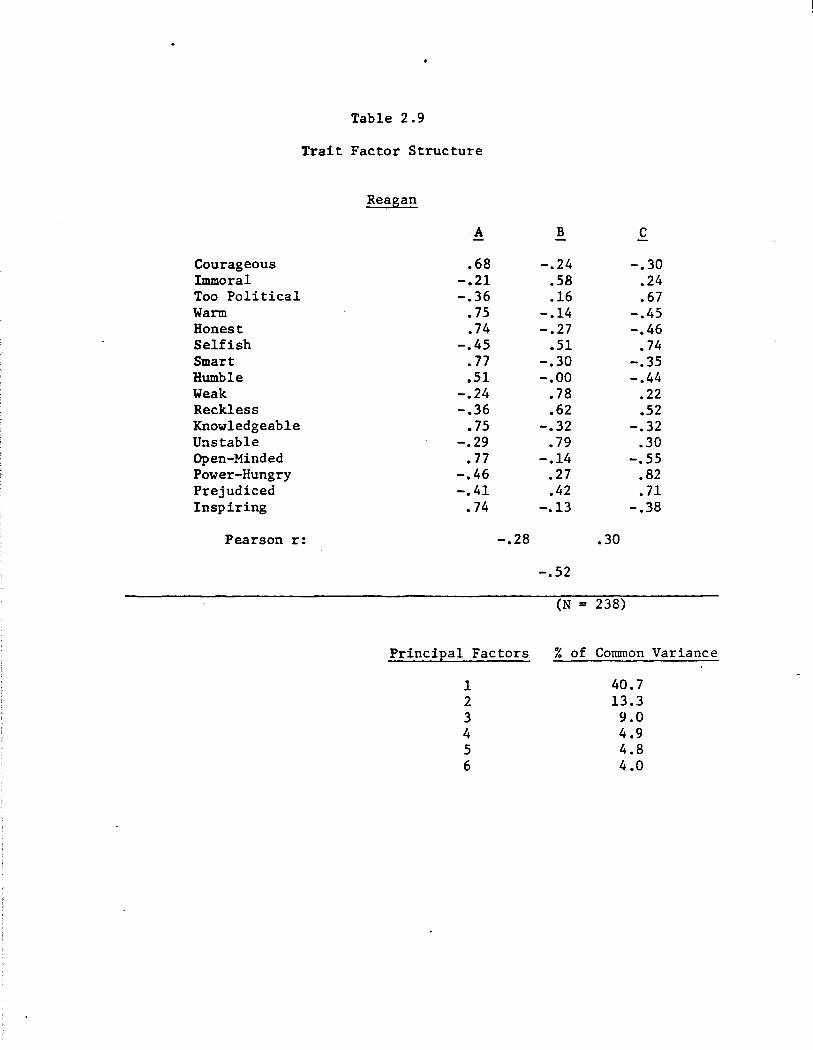
Table 2.9
Trait Factor Structure
Courageous Immoral Too Political Warm Honest Selfish Smart Humble Weak Reckless Knowledgeable Unstable Open-Minded Power-Hungry Prejudiced Inspiring
Pearson r:
Reagan
A B c
.68 -.24 -.30 -.21 .SB .24 -.36 .16 .67
.75 -.14 -.45
.74 -.27 -.46 -.45 .51 .74
• 77 -.30 -.35 .51 -.00 -.44
-.24 .78 .22 -.36 .62 .52
• 75 -.32 -.32 -.29 .79 .30
• 77 -.14 -.55 -.46 .27 .82 -.41 .42 .71
• 74 -.13 -.38
-.28 .30
-.52
(N = 238)
Principal Factors % of Common Variance
1 40. 7 2 13.3 3 9.0 4 4.9 5 4.8 6 4.0
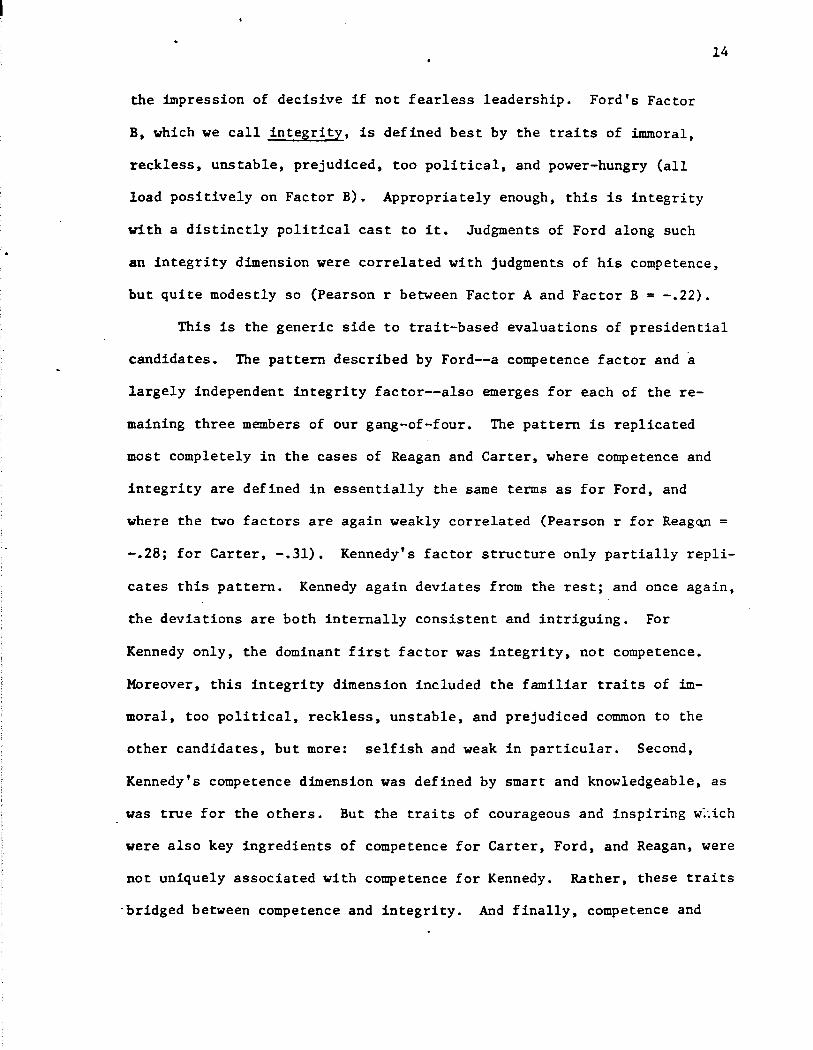
14
the impression of decisive if not fearless leadership. Ford's Factor
B, which we call integrity, is defined best by the traits of immoral,
reckless, unstable, prejudiced, too political, and power-hungry (all
load positively on Factor B). Appropriately enough, this is integrity
with a distinctly political cast to it. Judgments of Ford along such
an integrity dimension were correlated with judgments of his competence,
but quite modestly so (Pearson r between Factor A and Factor B = -.22).
This is the generic side to trait-based evaluations of presidential
candidates. The pattern described by Ford--a competence factor and a largely independent integrity factor--also emerges for each of the re
maining three members of our gang-of-four. The pattern is replicated
most completely in the cases of Reagan and Carter, where competence and
integrity are defined in essentially the same terms as for Ford, and
where the two factors are again weakly correlated (Pearson r for Reagqn =
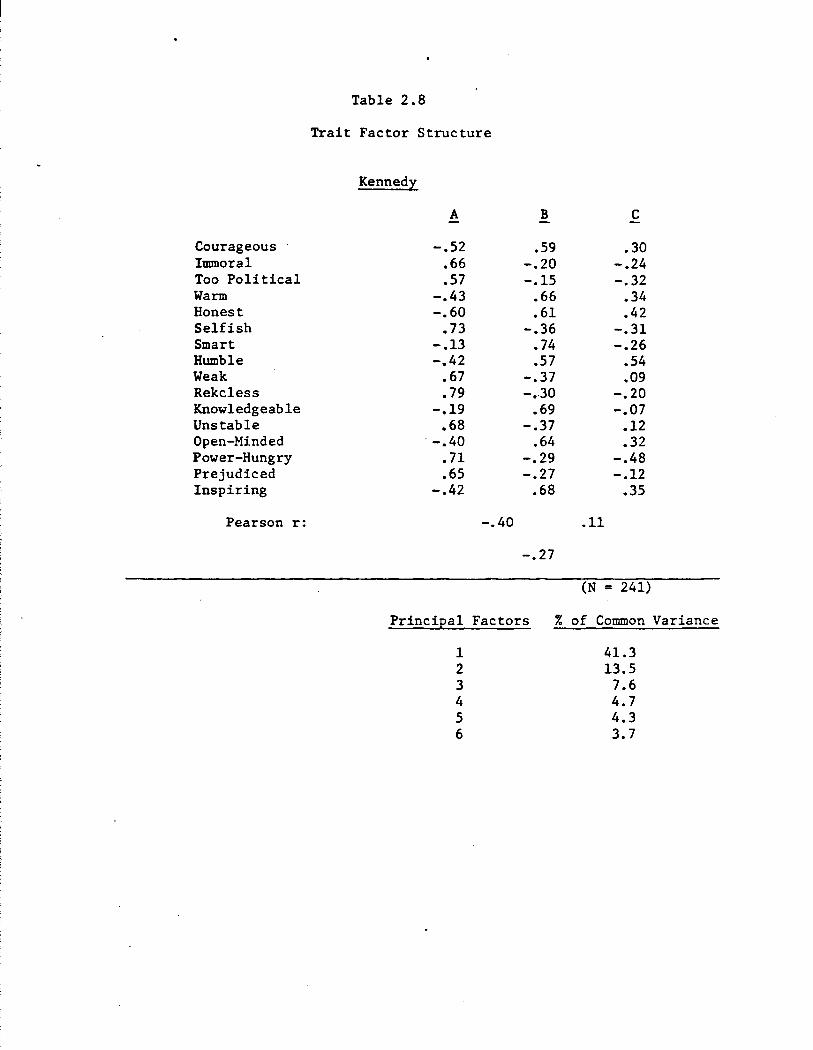
-.28; for Carter, -.31). Kennedy's factor structure only partially repli
cates this pattern. Kennedy again deviates from the rest; and once again,
the deviations are both internally consistent and intriguing. For
Kennedy only, the dominant first factor was integrity, not competence.
Moreover, this integrity dimension included the familiar traits of im
moral, too political, reckless, unstable, and prejudiced common to the
other candidates, but more: selfish and weak in particular. Second,
Kennedy's competence dimension was defined by smart and knowledgeable, as
was true for the others. But the traits of courageous and inspiring w::ich
were also key ingredients of competence for Carter, Ford, and Reagan, were
not uniquely associated with competence for Kennedy. Rather, these traits
·bridged between competence and integrity. And finally, competence and
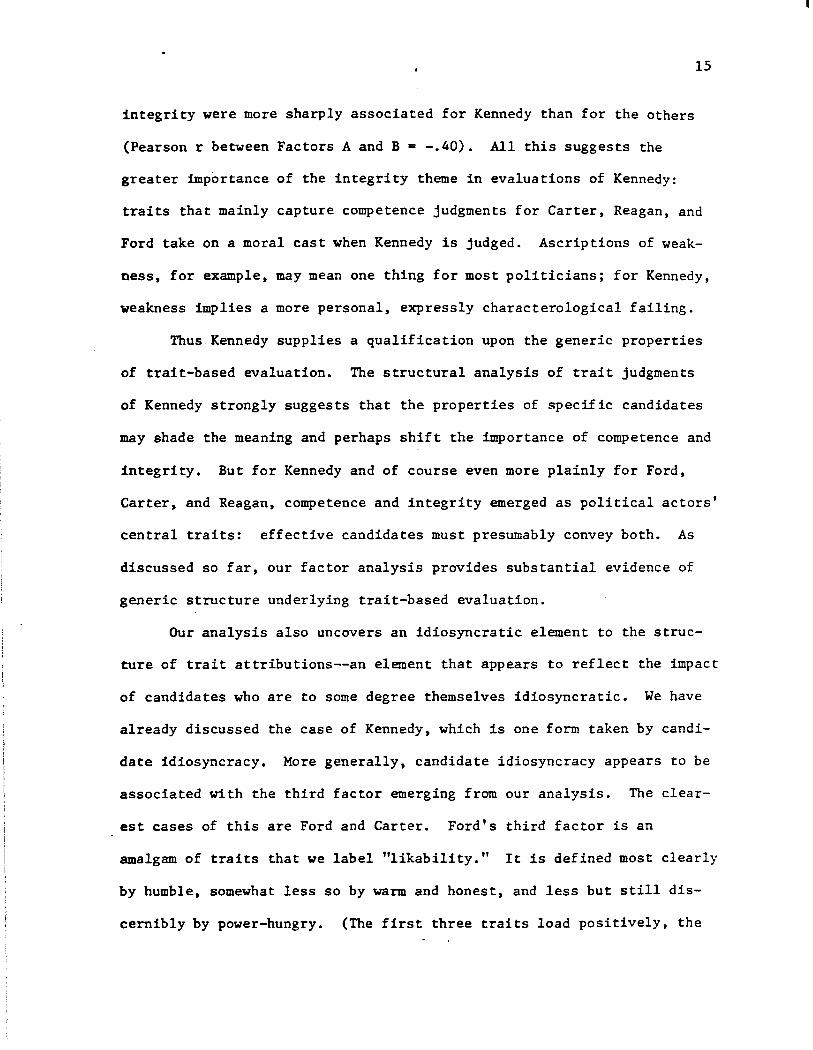
15
integrity were more sharply associated for Kennedy than for the others
(Pearson r between Factors A and B = -.40). All this suggests the
greater importance of the integrity theme in evaluations of Kennedy:
traits that mainly capture competence judgments for Carter, Reagan, and
Ford take on a moral cast when Kennedy is judged. Ascriptions of weak
ness, for example, may mean one thing for most politicians; for Kennedy,
weakness implies a more personal, expressly characterological failing.
Thus Kennedy supplies a qualification upon the generic properties
of trait-based evaluation. The structural analysis of trait judgments
of Kennedy strongly suggests that the properties of specific candidates
may shade the meaning and perhaps shift the importance of competence and
integrity. But for Kennedy and of course even more plainly for Ford,
Carter, and Reagan, competence and integrity emerged as political actors'
central traits: effective candidates must presumably convey both. As
discussed so far, our factor analysis provides substantial evidence of
generic structure underlying trait-based evaluation.
Our analysis also uncovers an idiosyncratic element to the struc
ture of trait attributions--an element that appears to reflect the impact
of candidates who are to some degree themselves idiosyncratic. We have
already discussed the case of Kennedy, which is one form taken by candi
date idiosyncracy. More generally, candidate idiosyncracy appears to be
associated with the third factor emerging from our analysis. The clear
est cases of this are Ford and Carter. Ford's third factor is an
amalgam of traits that we label "likability." It is defined most clearly
by humble, somewhat less so by warm and honest, and less but still dis
cernibly by power-hungry. (The first three traits load positively, the
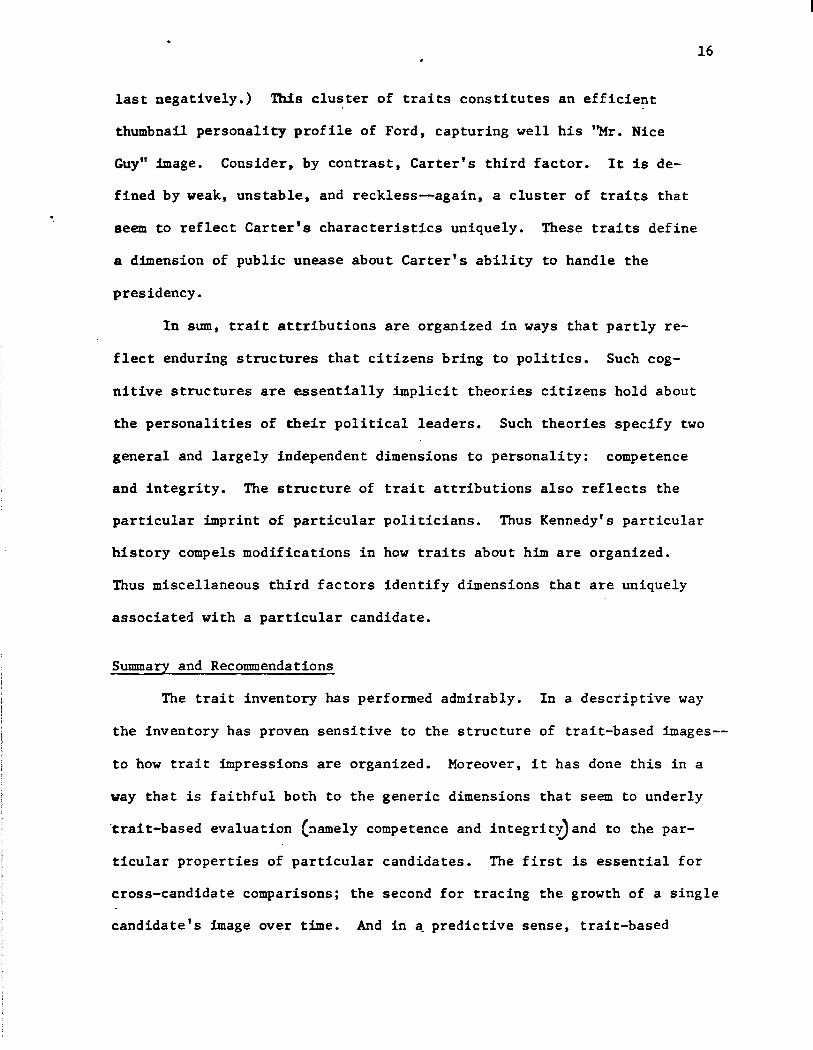
last negatively.) This cluster of traits constitutes an efficient
thumbnail personality profile of Ford, capturing well his ''Mr. Nice
Guy" image. Consider, by contrast, Carter's third factor. It is de
fined by weak, unstable, and reckless~again, a cluster of traits that
seem to reflect Carter's characteristics uniquely. These traits define
a dimension of public unease about Carter's ability to handle the
presidency.
16
In sum, trait attributions are organized in ways that partly re
flect enduring structures that citizens bring to politics. Such cog
nitive structures are essentially implicit theories citizens hold about
the personalities of their political leaders. Such theories specify two
general and largely independent dimensions to personality: competence
and integrity. The structure of trait attributions also reflects the
particular imprint of particular politicians. Thus Kennedy's particular
history compels modifications in how traits about him are organized.
Thus miscellaneous third factors identify dimensions that are uniquely
associated with a particular candidate.
Summary and RecoIIUDendations
The trait inventory has performed admirably. In a descriptive way
the inventory has proven sensitive to the structure of trait-based images-
to how trait impressions are organized. Moreover, it has done this in a
way that is faithful both to the generic dimensions that seem to underly
"trait-based evaluation c~amely competence and integrit>Jand to the par
ticular properties of particular candidates. The first is essential for
cross-candidate comparisons; the second for tracing the growth of a single
candidate's image over time. And in ~predictive sense, trait-based
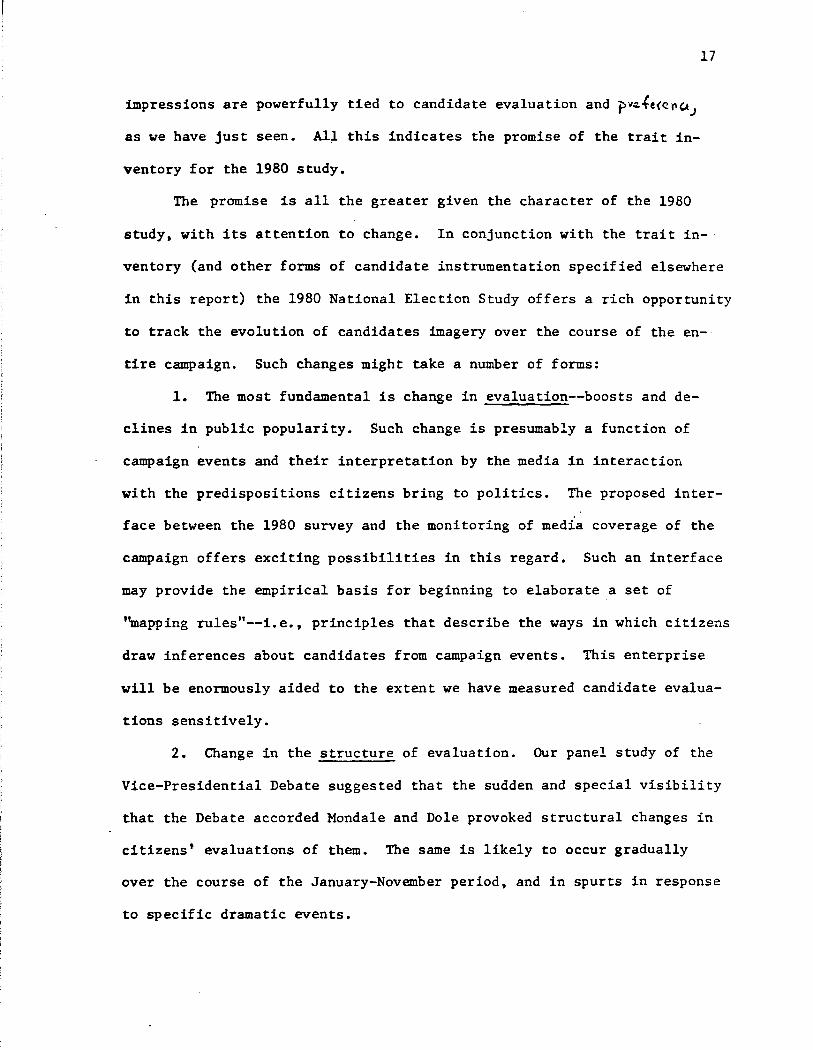
impressions are powerfully tied to candidate evaluation and fv~fe(e~~J
as we have just seen. All this indicates the promise of the trait in
ventory for the 1980 study.
17
The promise is all the greater given the character of the 1980
study, with its attention to change. In conjunction with the trait in
ventory (and other forms of candidate instrumentation specified elsewhere
in this report) the 1980 National Election Study offers a rich opportunity
to track the evolution of candidates imagery over the course of the en
tire campaign. Such changes might take a number of forms:
1. The most fundamental is change in evaluation--boosts and de
clines in public popularity. Such change is presumably a function of
campaign events and their interpretation by the media in interaction
with the predispositions citizens bring to politics. The proposed inter
face between the 1980 survey and the monitoring of media coverage of the
campaign offers exciting possibilities in this regard. Such an interface
may provide the empirical basis for beginning to elaborate a set of
''mapping rules"--i.e., principles that describe the ways in which citizens
draw inferences about candidates from campaign events. This enterprise
will be enormously aided to the extent we have measured candidate evalua
tions sensitively.
2. Change in the structure of evaluation. Our panel study of the
Vice-Presidential Debate suggested that the sudden and special visibility
that the Debate accorded Mondale and Dole provoked structural changes in
citizens' evaluations of them. The same is likely to occur gradually
over the course of the January-November period, and in spurts in response
to specific dramatic events.
18
3. Changes in the st~re of information about candidates.· Cer
tainly one thing that occurs over the January-November period is that
presidential candidates become better known. (This is of course more
true in the case when the incumbent President declines to run or is
legally prevented from doing so.) Little is known about this process,
although considerable importance is commonly ascribed to the media in
this regard, and to its purported "agenda setting" function of defining
which issues are important and which candidates legitimate, especially
early in an election year. The trait inventory should prove to be a
sensitive though indirect measure of this process as well. Media atten
tion directed to a particular candidate should be reflected in less re
luctance on the part of survey respondents to attribute traits to the
candidate. Thus in addition to change in evaluation, and change in the
structure of evaluation, the January-November period will also witness
change in the confidence with which candidates are evaluated.
For these reasons--for its demonstrated utility and for the promise
afforded by the upcoming election study--we strongly urge including the
trait inventory at all interviewing points during 1980.
3. Affective Response to Leaders
One set of new measures, easy to administer and potentially rich in
information, arose from our conviction that emotional responses to politi
cal leaders might behave differently from the more usual semantically
mediated types of survey items.
For each politician in question, we provided the respondent with
an "affect check-list." Respondents were asked whether that politician
had ever made them feel any of a number of ways: e.g., whether "Jirm:ny
Carter--because of the kind of person he is or because of something he
has done--ever made you feel angry? ••• Ashamed?. Happy? •••
Etc." (See Appendix A for the full measure.)
This question format was pretested on our New Haven sample using
four political figures (Carter, Ford, Kennedy, Reagan) and 15 affect
terms. Respondents were also asked which of their feelings toward each
man was the most important, and why they felt this way. Initially we
19
had not known what to expect when eliciting affective responses. Perhaps,
we thought, the public is so "tuned out" of politics that rarely would a
respondent indicate havinti felt anything about a candidate. This ttJrned
out not to be the case. Nearly half the time, respondents said yes to
feeling items.
In the New Haven sample, the four political figures differed sys
tematically in the profiles of how often they elicited different af
fects. Carter was high on hope and unease, for example, and Kennedy on
sadness and shame. We also looked within respondents for generic affect
dimensions by factor analyzing the affect inventory, separately for each
politician. For each of the four leaders, factoring produced two domi
nant factors. Oblique rotation yielded in each case a clear positive
affect factor and a clear negative affect factor. Rather surprisingly,
these two factors were essentially independent. That is, feeling good
things about say, Jimmy Carter, does not imply the absence of bad feelings.
Candidate Affect Profiles
These same measures and analyses were repeated in the national CPS
sample, each candidate being assessed by half the sample. Table 3.1
shows the percent of respondents saying they have felt each particular
affect toward each of the four candidates. Several things are note
worthy about this table:
20
Carter provokes an extraordinary relative frequency of mention of
feeling frustrated and uneasy, but also evokes a high relative number
of hopeful and sympathetic mentions. This pattern well reflects popular
ambivalence toward Carter. Ford is high on all the positive affects,
low on all the negative affects. Perhaps he is the beneficiary of the
retrospective impulse that in light of Carter's troubles, Ford wasn't
really so bad after all. And Ford was always well liked personally in
any case.
Kennedy's profile is relatively prominent on certain of the nega
tive affects such as Anger and Sadness. Reagan evokes many fewer affec
tive responses overall, presumably due to his relative unfamiliarity, but
in relative terms is high on Liking, Proud, and perhaps Afraid.
Averaging over the four candidates, there is a strong general ef
fect for positive affect references to occur more often than negative
ones. This tendency is consistent with the "positivity bias" documented
by Sears (1969) and others, for the public to think well of most specific
political leaders at the same time that there is widespread negative
evaluation of politicians as an abstract category. Here we find that,
if we take the responses at face value, respondents not only think well
of particular political figures, but also have good feelings evoked by
them.
There is obviously always the potential, however, for a given figure
. to evoke widespread negative feelings as the result of a given
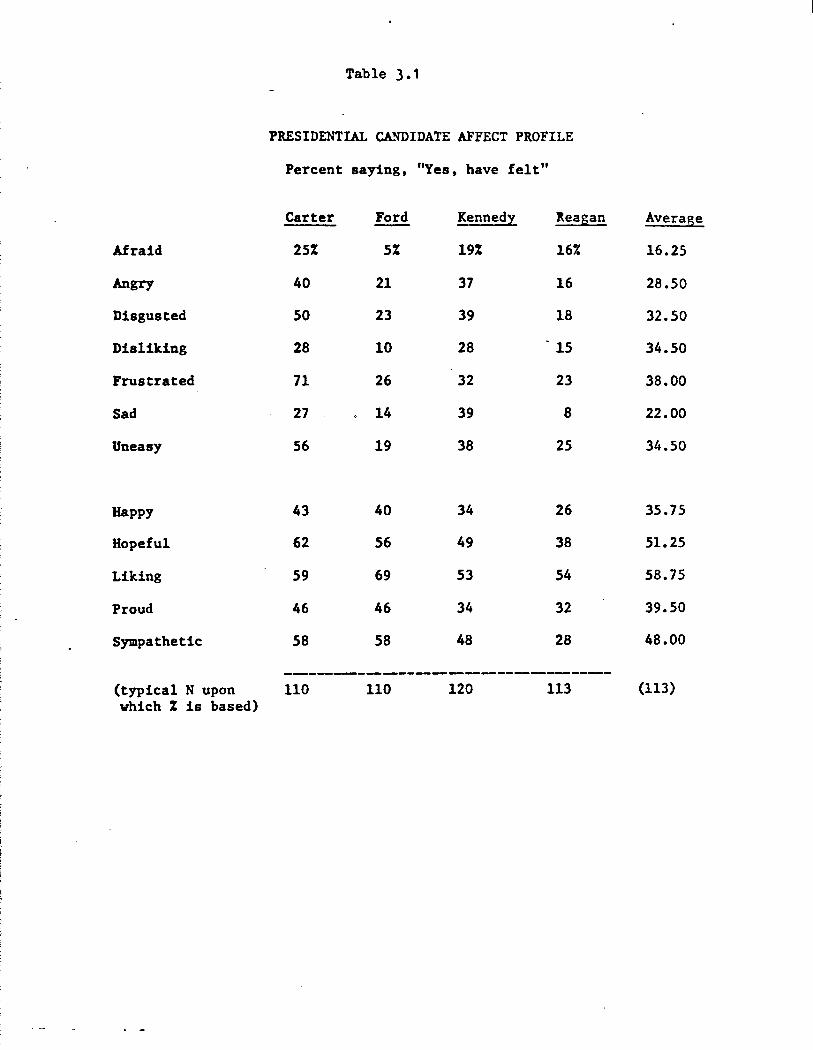
Table ).1
PRESIDENTIAL CA.~IDATE AFFECT PROFILE
Percent saying, "Yes, have felt"
Carter Ford Kennedy lteagan Average
Afraid 25% 5% 19% 16% 16.25
Angry 40 21 37 16 28.50
Disgusted 50 23 39 18 32.50
Disliking 28 10 28 - 15 34.50
Frustrated 71 26 32 23 38.00
Sad 27 14 39 8 22.00
Uneasy 56 19 38 25 34.50
Happy 43 40 34 26 35.75
Hopeful 62 56 49 38 51.25
Liking 59 69 53 54 58.75
Proud 46 46 34 32 39.50
Sympathetic 58 58 48 28 48.00
--------------------------(typical N upon 110 110 120 113 (113) which % is based)
21
transgression such as Chappaquiddick or Watergate. We do not now have
data that register affect mentions in direct response to ongoing public
events, but the 1980 CPS studies will provide such an opportunity.
Reasons given for the respondent's most important affect toward
each candidate were widely variable, but there were noticeable clusters
of mentions of highly salient events such as the MidEast peace initia
tives or Chappaquiddick. (This "reasons for feelings" question is simi
lar in format to the CPS standard open-ended "reasons for voting" ques
tion. The two are compared in Section 6.)
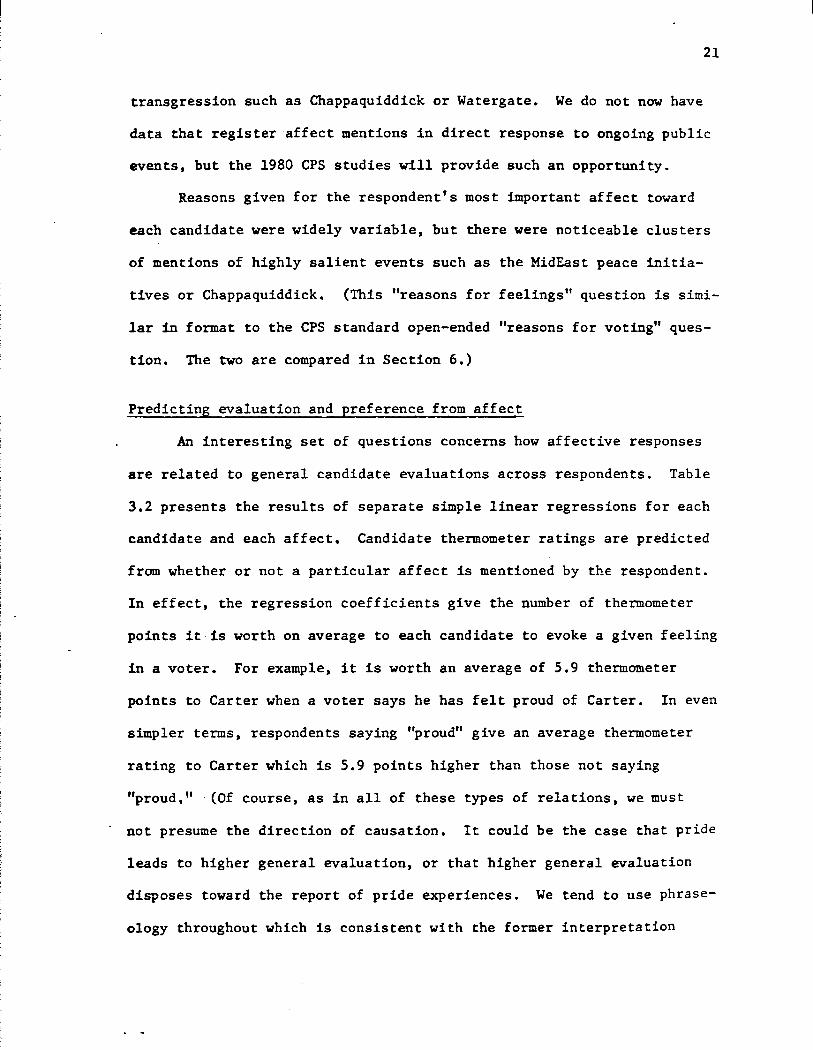
Predicting evaluation and preference from affect
An interesting set of questions concerns how affective responses
are related to general candidate evaluations across respondents. Table
3.2 presents the results of separate simple linear regressions for each
candidate and each affect. Candidate thermometer ratings are predicted
from whether or not a particular affect is mentioned by the respondent.
In effect, the regression coefficients give the number of thermometer
points it is worth on average to each candidate to evoke a given feeling
in a voter. For example, it is worth an average of 5.9 thermometer
points to Carter when a voter says he has felt proud of Carter. In even
simpler terms, respondents saying "proud" give an average thermometer
rating to Carter which is 5.9 points higher than those not saying
"proud.'' ·(Of course, as in all of these types of relations, we must
not presume the direction of causation. It could be the case that pride
leads to higher general evaluation, or that higher general evaluation
disposes toward the report of pride experiences. We tend to use phrase
ology throughout which is consistent with the former interpretation
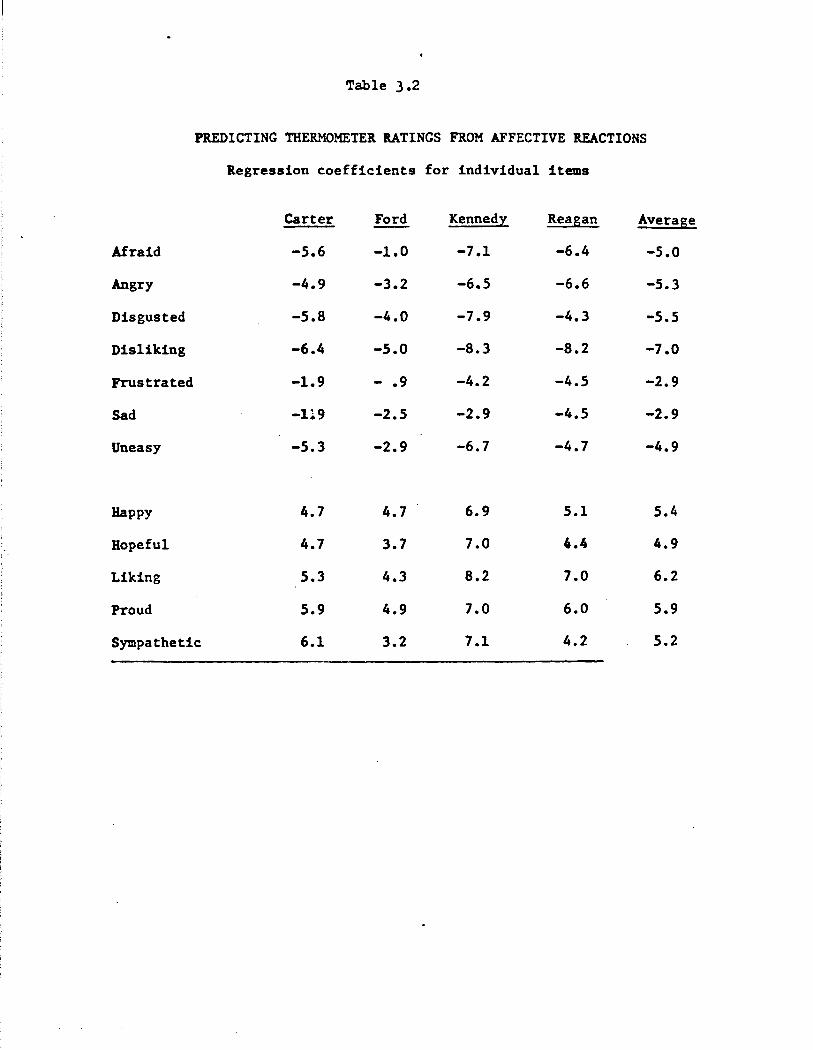
Table 3.2
PREDICTING THERMOMETER ltATINGS FROM AFFECTIVE REACTIONS
Regression coefficients for individual items
Carter Ford Kennedy Reagan Average
Afraid -5.6 -1.0 -7.1 -6.4 -s.o Angry -4.9 -3.2 -6.5 -6.6 -5.3
Disgusted -5.8 -4.0 -7.9 -4.3 -5.5
Disliking -6.4 -5.0 -8.3 -8.2 -1.0
Frustrated -1.9 - .9 -4.2 -4.5 -2.9
Sad -119 -2.5 -2.9 -4.5 -2.9
Uneasy -5.3 -2.9 -6.7 -4.7 -4.9
Happy 4.7 4.7 6.9 5.1 5.4
Hopeful 4.7 3.7 7.0 4.4 4.9
Liking 5.3 4.3 8.2 7.0 6.2
Proud 5.9 4.9 7.0 6.0 5.9
Sympathetic 6.1 3.2 7.1 4.2 5.2
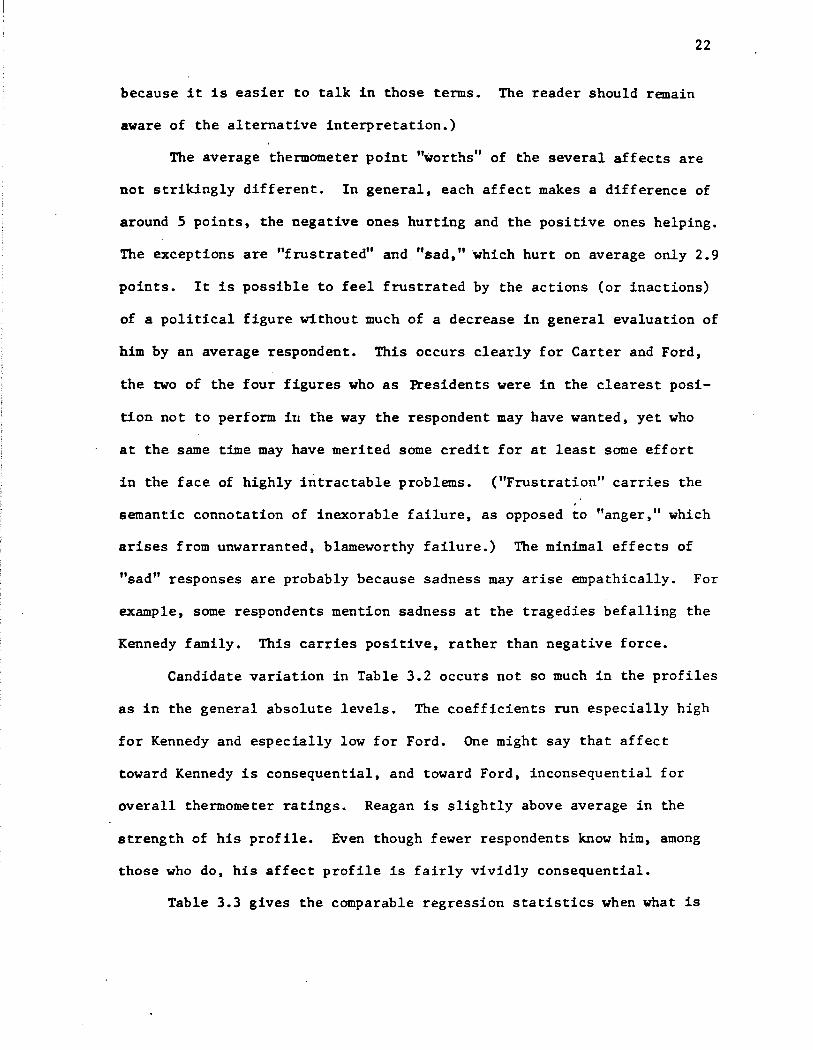
because it is easier to talk in those terms. The reader should remain
aware of the alternative interpretation.)
22
The average thermometer point "worths" of the several affects are
not strikingly different. In general, each affect makes a difference of
around 5 points, the negative ones hurting and the positive ones helping.
The exceptions are "frustrated" and. "sad," which hurt on average only 2. 9
points. It is possible to feel frustrated by the actions (or inactions)
of a political figure without much of a decrease in general evaluation of
him by an average respondent. This occurs clearly for Carter and Ford,
the two of the four figures who as Presidents were in the clearest posi
tion not to perform iu the way the respondent may have wanted, yet who
at the same time may have merited some credit for at least some effort
in the face of highly intractable problems. ("Frustration" carries the
semantic connotation of inexorable failure, as opposed to "anger," which
arises from unwarranted, blameworthy failure.) The minimal effects of
"sad" responses are probably because sadness may arise empathically. For
example, some respondents mention sadness at the tragedies befalling the
Kennedy family. This carries positive, rather than negative force.
Candidate variation in Table 3.2 occurs not so much in the profiles
as in the general absolute levels. The coefficients run especially high
for Kennedy and especially low for Ford. One might say that affect
toward Kennedy is consequential, and toward Ford, inconsequential for
overall thermometer ratings. Reagan is slightly above average in the
strength of his profile. Even though fewer respondents know him, among
those who do, his affect profile is fairly vividly consequential.
Table 3.3 gives the comparable regression statistics when what is
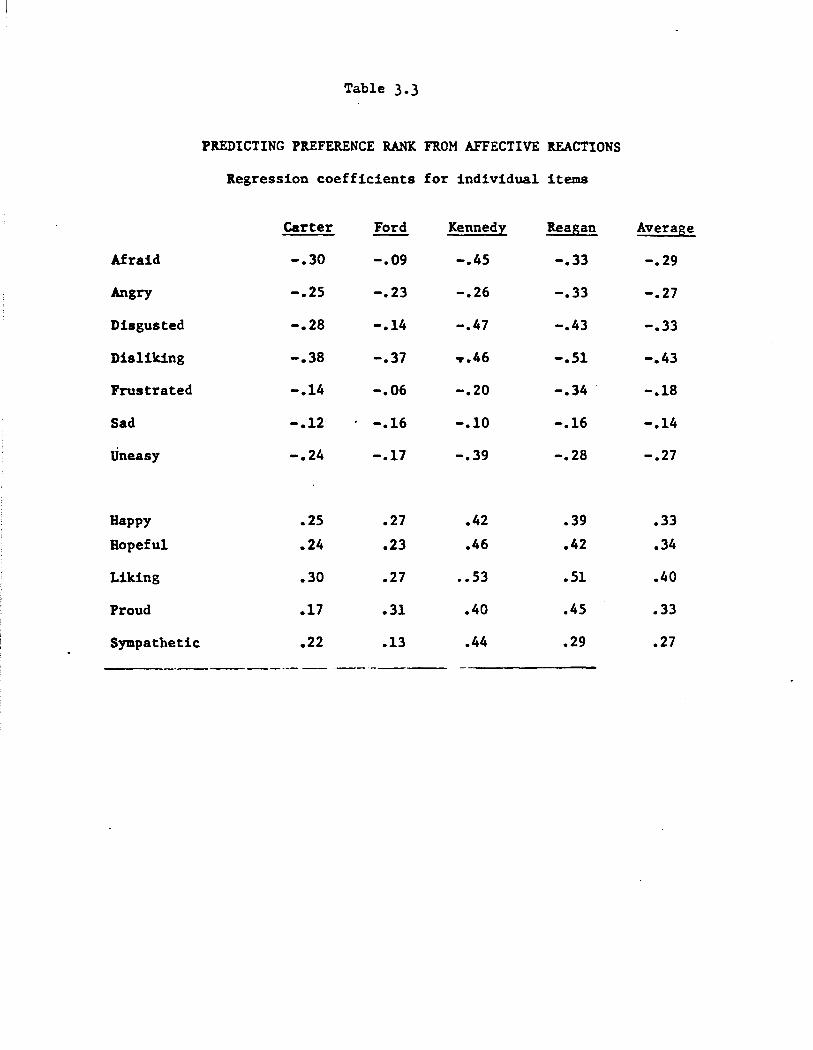
Table 3.3
PREDICTING PllEFERENCE RANK FROM AFFECTIVE ltEACTIONS
Regression coefficients for individual items
Carter Ford Kennedy Reagan Average
Afraid -.30 -.09 -.45 -.33 -.29
Angry -.25 -.23 -.26 -.33 -.27
Disgusted -.28 -.14 -.47 -.43 -.33
Disliking -.38 -.37 T.46 -.51 -.43
Frustrated -.14 -.06 -.20 -.34 . -.18
Sad -.12 . -.16 -.10 -.16 -.14
Uneasy -.24 -.17 -.39 -.28 -.27
Happy .25 .27 .42 .39 .33
Bopef ul .24 .23 .46 .42 .34
Liking .30 .27 •• 53 .51 .40
Proud .17 .31 .40 .45 .33
Sympathetic .22 .13 .44 .29 .27
----- -------
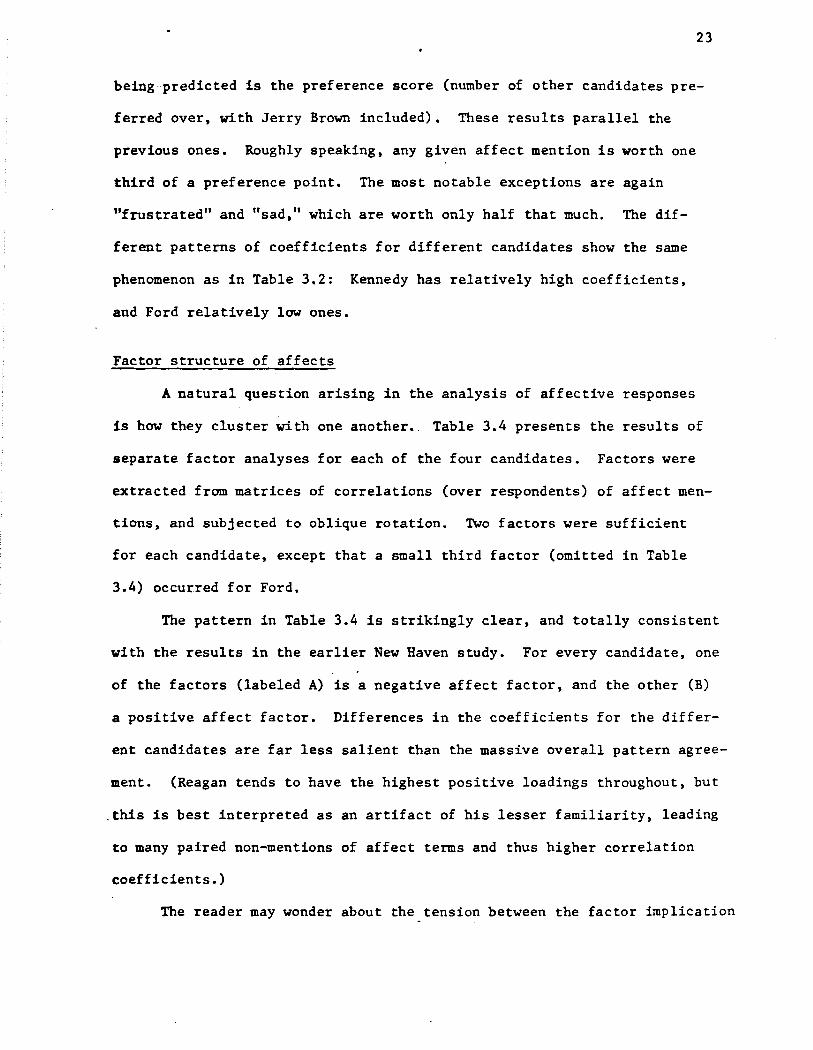
23
being predicted is the preference score (number of other candidates pre
f erred over, with Jerry Brown included). These results parallel the
previous ones. Roughly speaking, any given affect mention is worth one
third of a preference point. The most notable exceptions are again
"frustrated" and "sad," which are worth only half that much. The dif
ferent patterns of coefficients for different candidates show the same
phenomenon as in Table 3.2: Kennedy has relatively high coefficients,
and Ford relatively low ones.
Factor structure of affects
A natural question arising in the analysis of affective responses
is how they cluster with one another. Table 3.4 presents the results of
separate factor analyses for each of the four candidates. Factors were
extracted from matrices of correlations (over respondents) of affect men
tions, and subjected to oblique rotation. Two factors were sufficient
for each candidate, except that a small third factor (omitted in Table
3.4) occurred for Ford.
The pattern in Table 3.4 is strikingly clear, and totally consistent
with the results in the earlier New Haven study. For every candidate, one
of the factors (labeled A) is a negative affect factor, and the other (B)
a positive affect factor. Differences in the coefficients for the differ
ent candidates are far less salient than the massive overall pattern agree
ment. (Reagan tends to have the highest positive loadings throughout, but
.this is best interpreted as an artifact of his lesser familiarity, leading
to many paired non-mentions of affect terms and thus higher correlation
coefficients.)
The reader may wonder about the tension between the factor implication
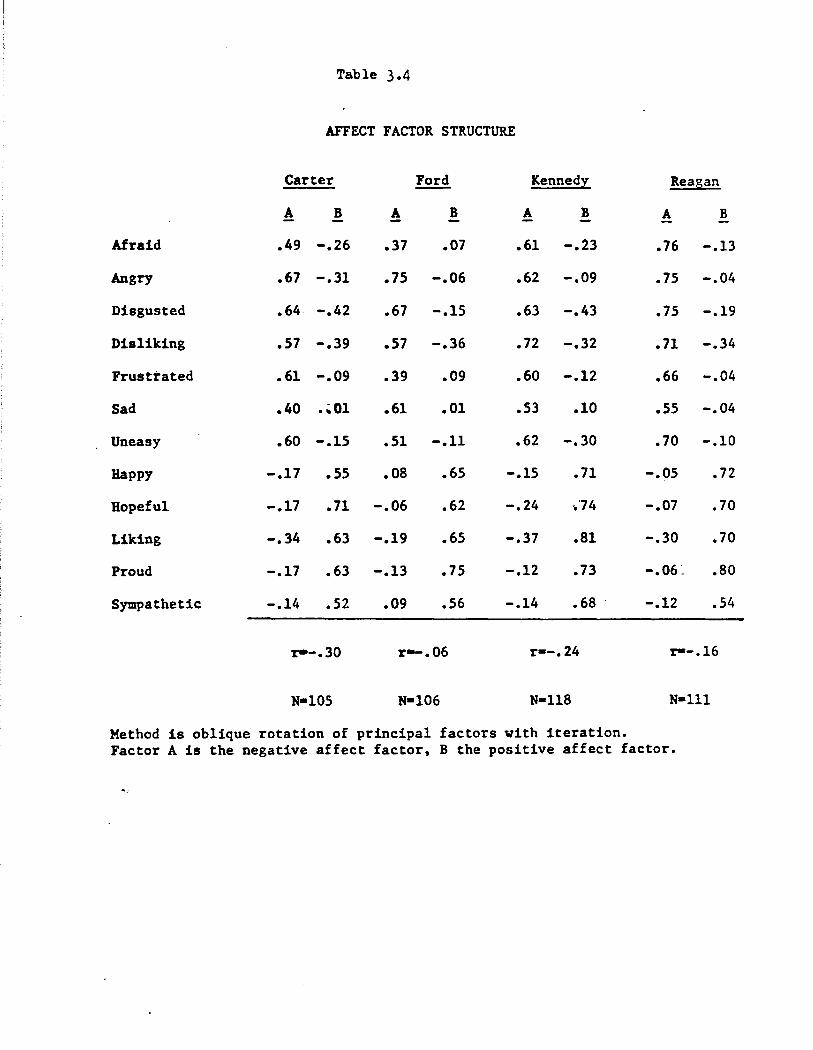
Table 3.4
AFFECT FACTOR STRUCTURE
Carter Ford Kennedy Reagan
A B A B A B A B
Afraid .49 -.26 .37 .07 .61 -.23 .76 -.13
Angry .67 -.31 .75 -.06 .62 -.09 .75 -.04
Disgusted .64 -.42 .67 -.15 .63 -.43 .75 -.19
Disliking .57 -.39 .57 -.36 .72 -.32 .71 -.34
Frustrated • 61 -.09 .39 .09 .60 -.12 .66 -.04
Sad .40 • ;01 .61 .01 .53 .10 .55 -.04
Uneasy .60 -.15 .51 -.11 .62 -.30 .70 -.10
Happy -.17 .55 .08 .65 -.15 .71 -.05 .72
Hopeful -.17 .71 -.06 .62 -.24 .. 74 -.07 .70
Liking -.34 .63 -.19 .65 -.37 .81 -.30 .70
Proud -.17 .63 -.13 .15 -.12 .73 -.06~ .so
Sympathetic -.14 .52 .09 .56 -.14 .68 . -.12 .54
r--.30 r-.06 r•-.24 r--.16
N•l05 N•106 N•ll8 N•lll
Method is oblique rotation of principal factors with iteration. Factor A is the negative affect factor, B the positive affect factor.
-..
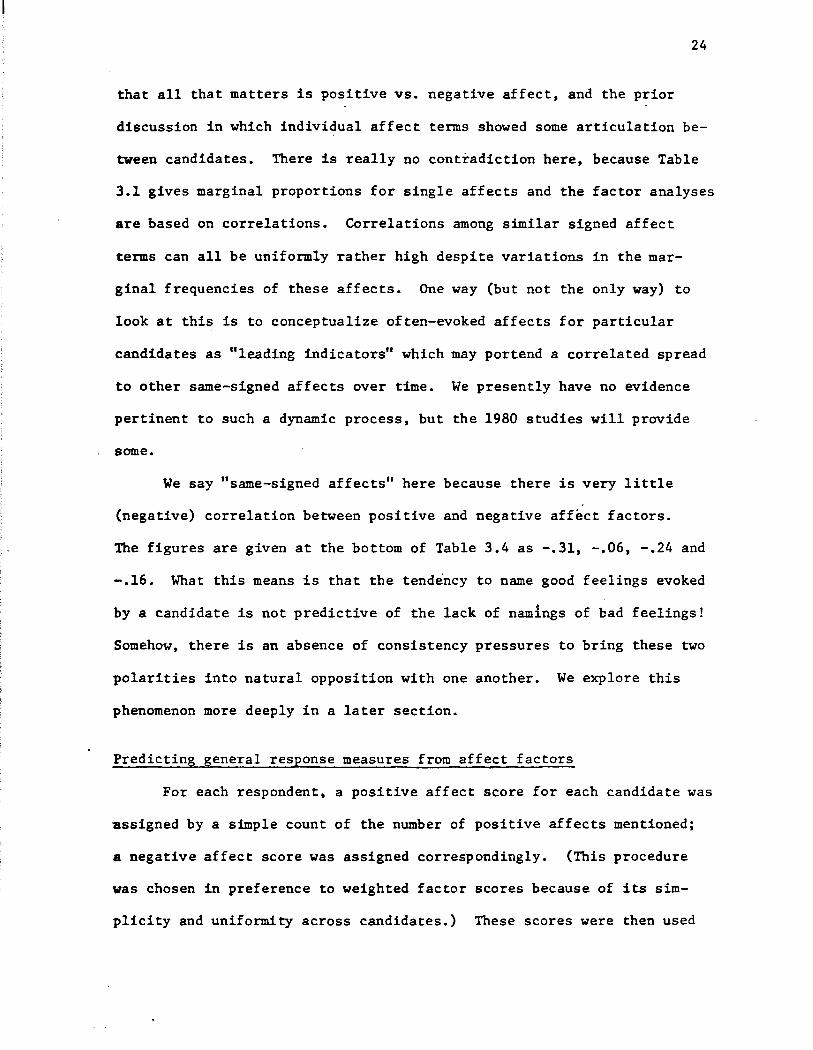
24
that all that matters is positive vs. negative affect, and the prior
discussion in which individual affect terms showed some articulation be
tween candidates. There is really no contradiction here, because Table
3.1 gives marginal proportions for single affects and the factor analyses
are based on correlations. Correlations among similar signed affect
terms can all be uniformly rather high despite variations in the mar
ginal frequencies of these affects. One way {but not the only way) to
look at this is to conceptualize of ten-evoked affects for particular
candidates as "leading indicators" which may portend a correlated spread
to other same-signed affects over time. We presently have no evidence
pertinent to such a dynamic process, but the 1980 studies will provide
some.
We say "same-signed affects" here because there is very little
(negative) correlation between positive and negative affect factors.
The figures are given at the bottom of Table 3.4 as -.31, -.06, -.24 and
-.16. What this means is that the tendency to name good feelings evoked
by a candidate is not predictive of the lack of nam!ngs of bad feelings!
Somehow, there is an absence of consistency pressures to bring these two
polarities into natural opposition with one another. We explore this
phenomenon more deeply in a later section.
Predicting general response measures from affect factors
For each respondent, a positive affect score for each candidate was
assigned by a simple count of the number of positive affects mentioned;
a negative affect score was assigned correspondingly. (This procedure
was chosen in preference to weighted factor scores because of its sim
plicity and uniformity across candidates.) These scores were then used
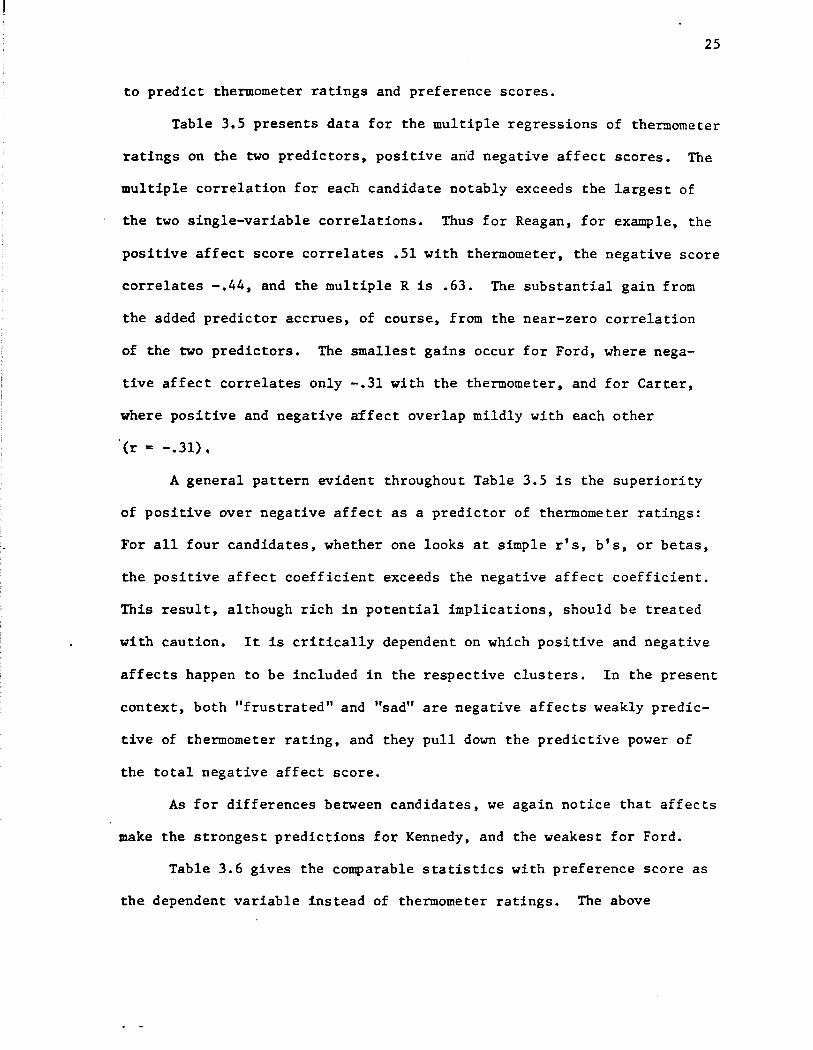
25
to predict thermometer ratings and preference scores.
Table 3.5 presents data for the multiple regressions of ther:norneter
ratings on the two predictors, positive an·d negative affect scores. The
multiple correlation for each candidate notably exceeds the largest of
the two single-variable correlations. Thus for Reagan, for example, the
positive affect score correlates .51 with thermometer, the negative score
correlates -.44, and the multiple R is .63. The substantial gain from
the added predictor accrues, of course, from the near-zero correlation
of the two predictors. The smallest gains occur for Ford, where nega
tive affect correlates only -.31 with the thermometer, and for Carter,
where positive and negative affect overlap mildly with each other
(r = -.31).
A general pattern evident throughout Table 3.5 is the superiority
of positive over negative affect as a predictor of thermometer ratings:
For all four candidates, whether one looks at simple r's, b's, or betas,
the positive affect coefficient exceeds the negative affect coefficient.
This result, although rich in potential implications, should be treated
with caution. It is critically dependent on which positive and negative
affects happen to be included in the respective clusters. In the present
context, both "frustrated" and "sad" are negative affects weakly predic
tive of thermometer rating, and they pull down the predictive power of
the total negative affect score.
As for differences between candidates, we again notice that affects
make the strongest predictions for Kennedy, and the weakest for Ford.
Table 3.6 gives the comparable statistics with preference score as
the dependent variable instead of thermometer ratings. The above
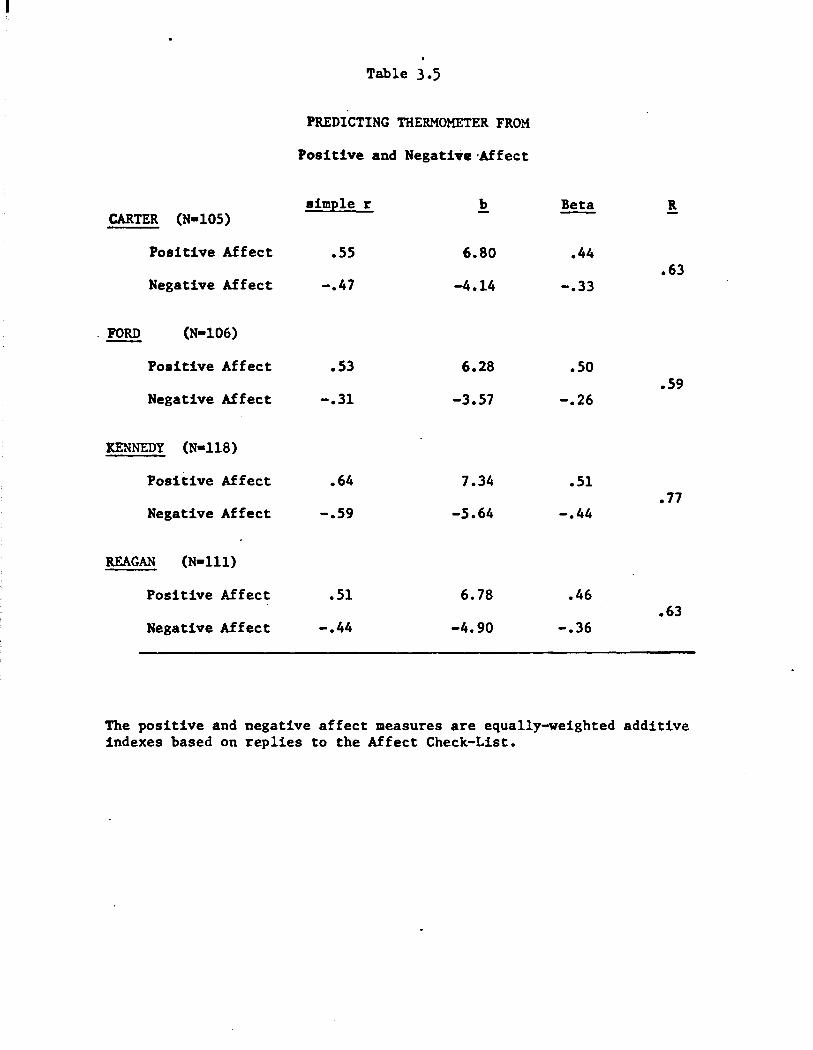
Table 3.5
PREDICTING THERMOMETER FROM
Positive and Negative·Affect
aim:ele r b Beta R CARTER (N•l05)
Positive Affect .55 6.80 .44 .63
Negative Affect -.47 -4.14 -.33
. FORD (N•l06)
Positive Affect .53 6.28 .so .59
Negative Affect -.31 -3.57 -.26
KENNEDY (N•ll8)
Positive Affect .64 7.34 .51 .77
Negative Affect -.59 -5.64 -.44
REAGAN (N•lll)
Positive Affect .51 6.78 .46 .63
Negative Affect -.44 -4.90 -.36
The positive and negative affect measures are equally-weighted additive indexes based on replies to the Affect Check-List.
26
conclusions are substantially unaltered. Again, there are notable pre
dictive gains in using both affect scores rather than one alone. There
are slight exceptions (for Carter) to the generalization that positive
affect is more predictive than negative. Again, Kennedy shows the
strongest prediction and Ford the weakest. Reagan is here almost as
predictable (R ~ .76) as Kennedy (R = .81). In comparing Table 3.6 with
Table 3.5, it can be seen that for Reagan, the positive affect score pre
dicts preference score rather better than it predicts thermometer rating.
We have no ready explanation. For the three other candidates, the pre
dictability of preference is roughly comparable to the predictability of
thermometer.
In summarizing this section of results, we may put it this way: If
all that candidates could do to voters were to activate various feeling
states, there would be two modes of achieving high preference or thennom
eter ratings: making the voters feel good, or avoiding making them feel
bad. (The specific positive or negative affects involved do not seem to
be differentially consequential.) These two modes are largely independent.
The "feel good" mode is at least as powerful as the "not feel bad" mode
for the set of affects tested in the present project. This result is con
sistent with other "positivity" biases in political perception, and is
contrary to the folklore that people vote "ag'in" politicians rather than
for them. It is also apparently contradictory to a frequent psychological
result (Kanouse and Hanson, 1971) that negative attributes have more weight
in judgments of people than positive attributes do.
All of this would be much less interesting if the affect responses
were themselves highly predictable manifestations of some more standard
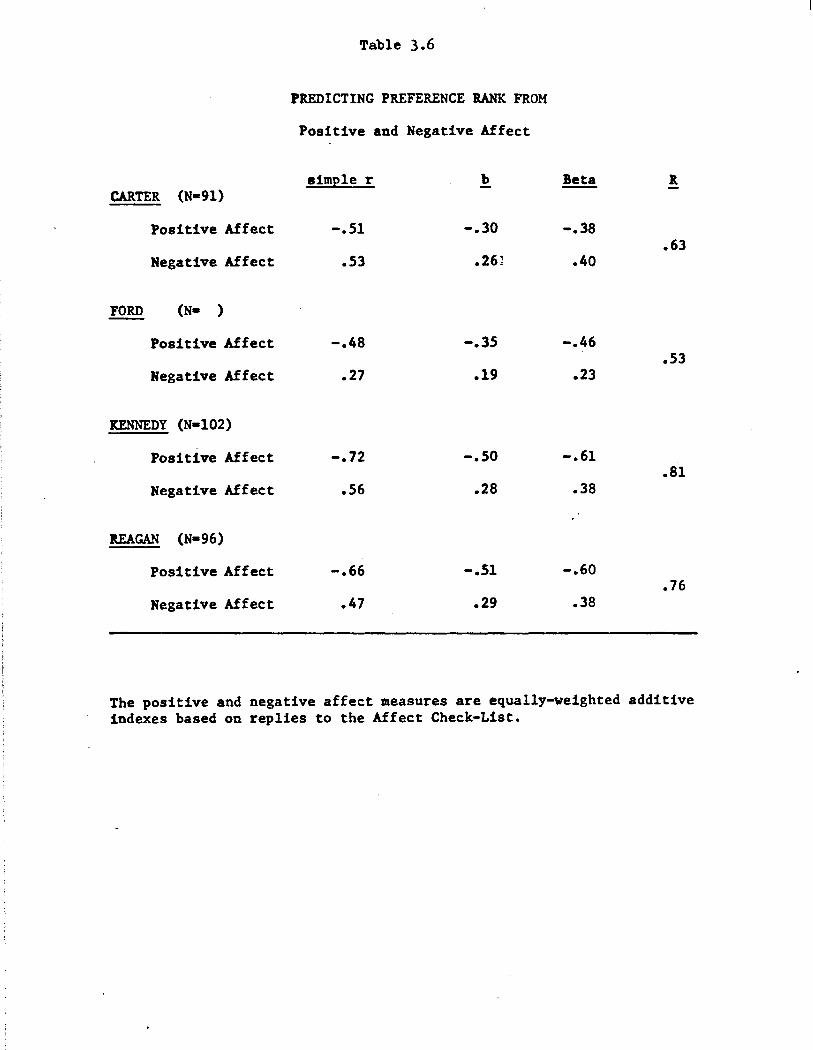
Table 3.6
PREDICTING PREFERENCE RANK FROM
Positive and Negative Affect
sim2le r b Beta It CARTER (N•91)
Positive Affect -.51 -.30 -.38 .63
Negative Affect .53 .261 .40
FORD (N• )
Positive Affect -.48 -.35 -.46 .53
Negative Affect .27 .19 .23
KENNEDY (N•l02)
Positive Affect -.72 -.so -.61 .81
Negative Affect .56 .28 .38
ltEAGAN (N•96)
Positive Affect -.66 -.51 -.60 .76
Negative Affect .47 .29 .38
The positive and negative affect measures are equally-weighted additive indexes based on replies to the Affect Check-List.
27
political factor such as party identification. It is conceivable that
the tendency to report good. (bad) feelings about Democrats (Rep~blicans)
is rampant among Democrats and virtually absent among Republicans, for
example.
Table 3.7 repeats the analysis for Table 3.5, separately for each
partisan politican identification. Independents are less critical to the
analysis than Republicans or Democrats, and for simplicity are omitted.
If selective affect mention is merely a consequence of partisanship, then
we should find small within-party predictive power of affect scores for
thermometer ratings. Table 3.7, however, completely contradicts such an
expectation. For each of the four candidates, the multiple R's within
party are virtually as high as the multiple R's for the entire sample.
Thus, the high predictive power of affect scores for thermometer ratings
is not at all a consequence of party identification.
A sidelight in Table 3.7 is the set of three instances in which
negative affect is more predictive than positive affect, contrary to the
general trend of Table 3.5. The two strongest of these three instances
are: affect toward Kennedy among Republicans, and toward Reagan among
Democrats. These cases both represent sharp, natural antagonisms.
"Anathema" might aptly describe the status of each among rabid opposition
•partisans. Susceptibility vs. non-susceptibility to the accompanying or
ganized hatred would be highly predictive of overall thermometer rating.
The third case, Ford among Republicans, is less clear. The subsample N's
for all three of these comparisons, however, are too small to bestow statis
tical significance on them.
Table 3.8 presents the comparable subsample analysis, with preference
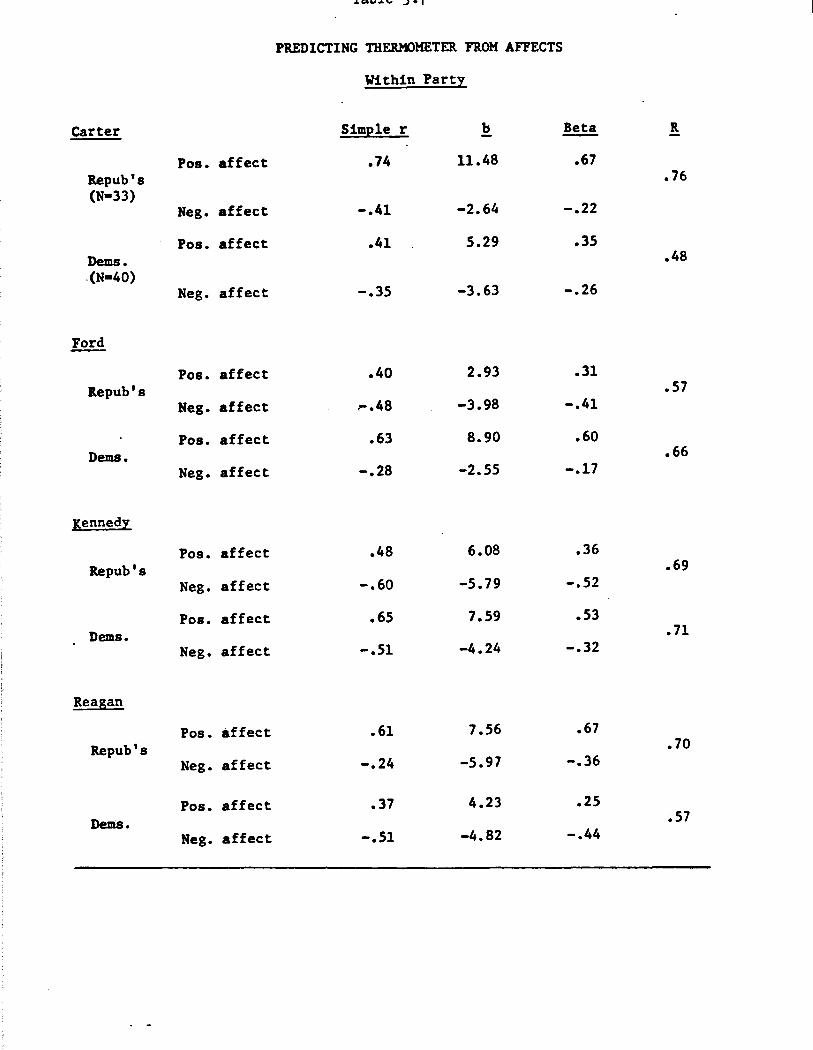
...... ., ... ~ J•I
PREDICTING THERMOMETER. FROM AFFECTS
Within Party
Carter Simple r b Beta ll
Pos. affect .74 11.48 .67 Repub's .76 (N•33)
Neg. affect -.41 -2.64 -.22
Pos. affect .41 5.29 .35 Dems. .48 -(N•40)
Neg. affect -.35 -3.63 -.26
Ford
Pos. affect .40 2.93 .31 l.epub's .57
Neg. affect :-.48 -3.98 -.41
Pos. affect .63 8.90 .60 Dems. .66
Neg. affect -.28 -2.55 -.17
Kennedy
Pos. affect .48 6.08 .36 Repub's .69
Neg. affect -.60 -5.79 -.52
Pos. affect .65 7.59 .53 Dems. .71
Neg. affect -.51 -4.24 -.32
Reagan
Pos. affect .61 7.56 .67 Repub's .70
Neg. affect -.24 -5.97 -.36
Pos. affect .37 4.23 .25
Dems. .57 Neg. affect -.51 -4.82 -.44
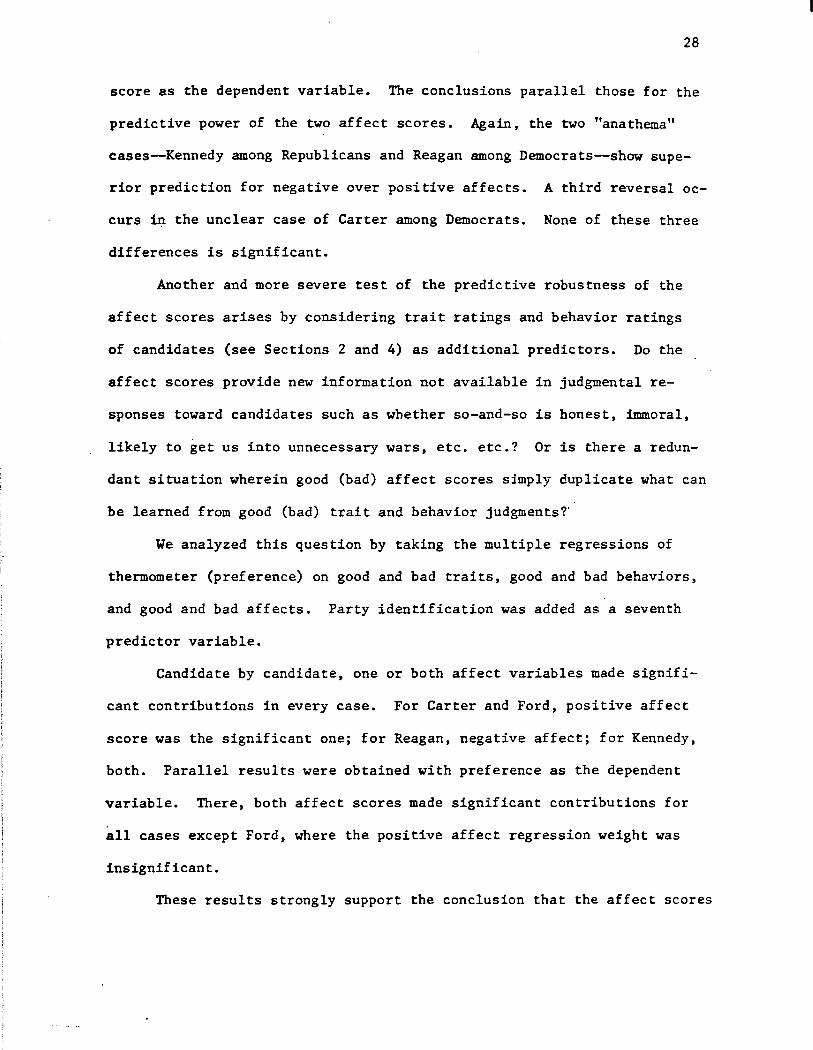
28
score as the dependent variable. The conclusions parallel those for the
predictive power of the two affect scores. Again, the two "anathema"
cases~Kennedy among Republicans and Reagan among Democrats--show supe
rior prediction for negative over positive affects. A third reversal oc
curs in the unclear case of Carter among Democrats. None of these three
differences is significant.
Another and more severe test of the predictive robustness of the
affect scores arises by considering trait ratings and behavior ratings
of candidates (see Sections 2 and 4) as additional predictors. Do the
affect scores provide new information not available in judgmental re
sponses toward candidates such as whether so-and-so is honest, immoral,
likely to get us into unnecessary wars, etc. etc.? Or is there a redun
dant situation wherein good (bad) affect scores simply duplicate what can
be learned from good (bad) trait and behavior judgments?'
We analyzed this question by taking the multiple regressions of
thermometer (preference) on good and bad traits, good and bad behaviors,
and good and bad affects. Party identification was added as a seventh
predictor variable.
Candidate by candidate, one or both affect variables made signifi
cant contributions in every case. For Carter and Ford, positive affect
score was the significant one; for Reagan, negative affect; for Kennedy,
both. Parallel results were obtained with preference as the dependent
variable. There, both affect scores made significant contributions for
all cases except Ford, where the positive affect regression weight was
insignificant.
These results strongly support the conclusion that the affect scores
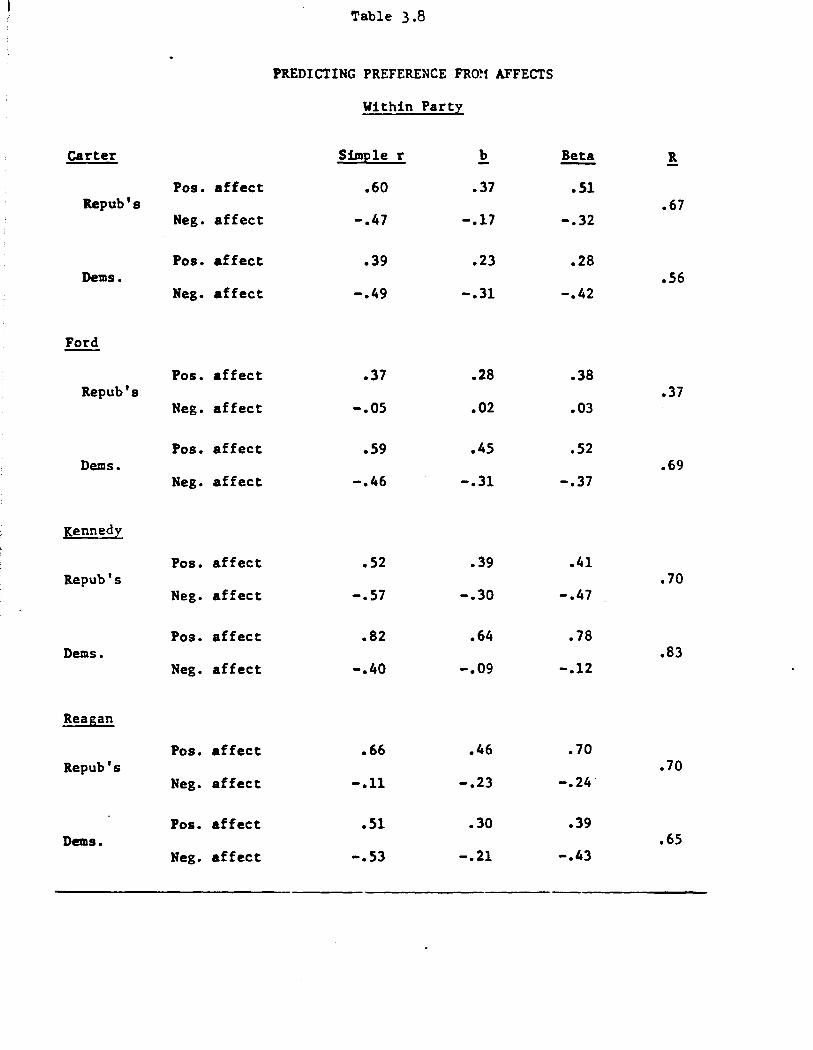
Table 3.8
PREDICTING PREFERENCE FRO~f AFFECTS
Within Party
Carter Simple r b ~ R
Pos. affect .60 .37 .Sl llepub's .67
Neg. affect -.47 -.17 -.32
Pos. affect .39 .23 .28 Dems. .56
Neg. affect -.49 -.31 -.42
Ford
Pos. affect .37 .28 .38 Repub's .37
Neg. affect -.OS .02 .03
Pos. affect .59 .45 .52 Dems. .69
Neg. affect -.46 -.31 -.37
Kennedy
Pos. affect .52 .39 .41 Repub's .70
Neg. affect -.57 -.30 -.47
Pos. affect .82 .64 .78 Dems. .83
Neg. affect -.40 -.09 -.12
Reagan
Pos. affect .66 .46 .70 Repub's .70
Neg. affect -.11 -.23 -.24
Pos. affect .51 .30 .39 Dems. .65
Neg. affect -.53 -.21 -.43
29
are useful predictors of thermometer and preference ratings. They are
not redundant with trait and behavior scores, or with party identification.
The Independence of Positive and Negative Affect Scores
We have previously noted that the positive and negative affect fac
tors correlated surprisingly little with each other. This is in large
measure the secret of their success as predictors of summary responses
to candidates. Here we explore further the nature of the near independence
of the affect scores. (Note that the scores are simple affect sums,
whereas the affect factors were vectors in a factor space. These are
not equivalent, so that we must reinspect their intercorrelation.)
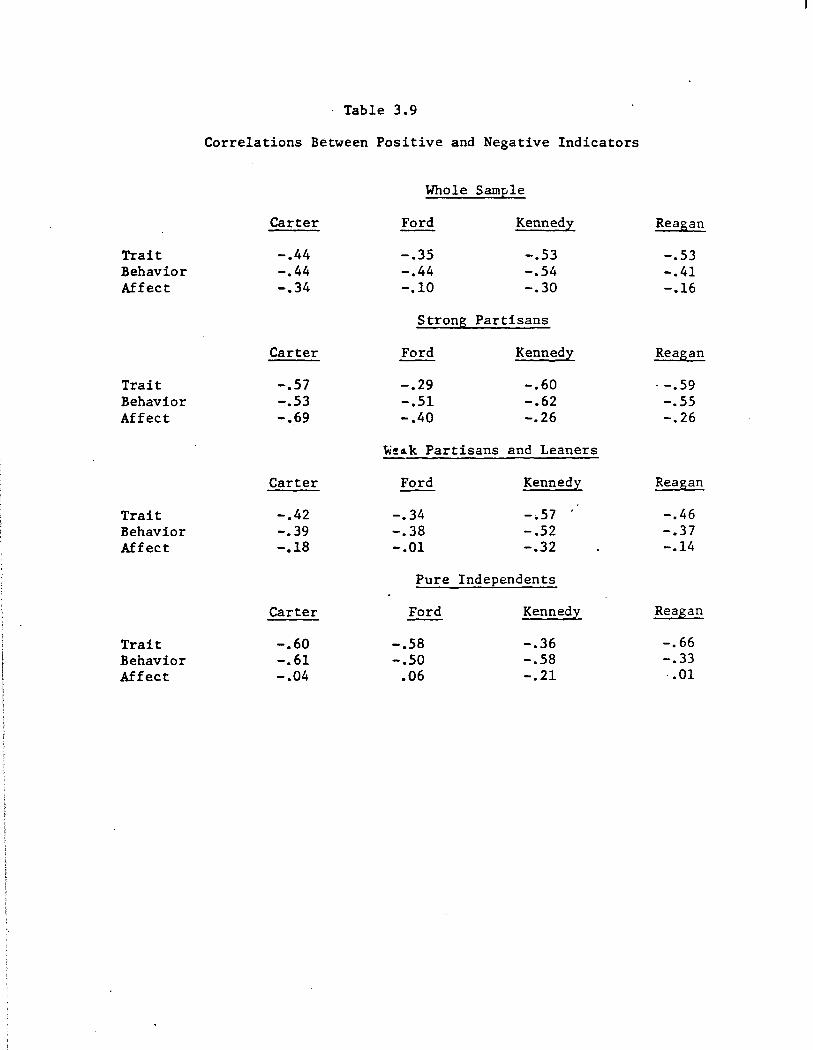
One question is whether good and bad traits (behaviors) are indeed
more redundant with each other than good and bad affects. The top panel
of Table 3.9 shows this comparison. For every candidate, the two affect
scores have a smaller intercorrelation than do either the trait or be
havior scores. An the average, the affects intercorrelate .23 less than
do the traits and behaviors.
However, it seemed likely to us that in particular segments of the
population, positive and negative feelings toward particular candidates
would be fairly strongly inversely linked. We looked within several sub
samples, and the clearest results emerged when the sample was sectioned
by party identification. Within one subsample we grouped strong parti
sans from both parties, within a second subsample the weak identifiers
and leaners, and within a third the "true" Independents. The remaining
three panels of Table 3.9 show what happened when positive and negative
scores for traits, behaviors, and affects respectively were intercorrelated
within each subsample.
30
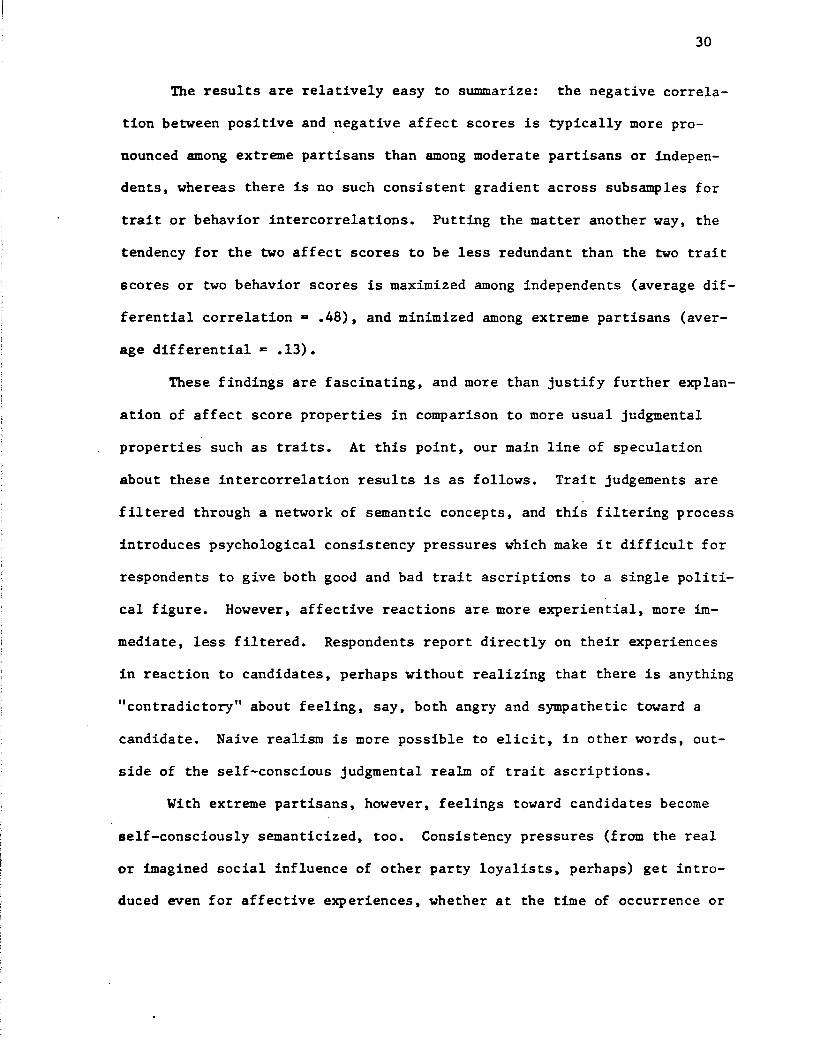
The results are relatively easy to summarize: the negative correla
tion between positive and .negative affect scores is typically more pro
nounced among extreme partisans than among moderate partisans or indepen
dents, whereas there is no such consistent gradient across subsamples for
trait or behavior intercorrelations. Putting the matter another way, the
tendency for the two affect scores to be less redundant than the two trait
scores or two behavior scores is maximized among independents (average dif
ferential correlation• .48), and minimized among extreme partisans (aver
age differential• .13).
These findings are fascinating, and more than justify further explan
ation of affect score properties in comparison to more usual judgmental
properties such as traits. At this point, our main line of speculation
about these intercorrelation results is as follows. Trait judgements are
filtered through a network of semantic concepts, and this filtering process
introduces psychological consistency pressures which make it difficult for
respondents to give both good and bad trait ascriptions to a single politi
cal figure. However, affective reactions are more experiential, more im
mediate, less filtered. Respondents report directly on their experiences
in reaction to candidates, perhaps without realizing that there is anything
"contradictory" about feeling, say, both angry and sympathetic toward a
candidate. Naive realism is more possible to elicit, in other words, out
side of the self-conscious judgmental realm of trait ascriptions.
With extreme partisans, however, feelings toward candidates become
self-consciously semanticized, too. Consistency pressures (from the real
or imagined social influence of other party loyalists, perhaps) get intro
duced even for affective experiences, whether at the time of occurrence or
Trait Behavior Affect
Trait Behavior Affect
Trait Behavior Affect
Trait Behavior Affect
· Table 3.9
Correlations Between Positive and Negative Indicators
Whole Sample
Carter Ford Kennedy
-.44 -.35 -.53 -.44 -.44 -.54 -.34 -.10 -.30
Strong Partisans
Carter Ford Kennedy
-.57 -.29 -.60 -.53 -.51 -.62 -.69 -.40 -.26
weo.k Partisans and Leaners
Carter Ford Kennedy
-.42 -.34 -.57 -.39 -.38 -.52 -.18 -.01 -.32
Pure Independents
Carter Ford Kennedy
-.60 -.58 -.36 -.61 -.50 -.58 -.04 .06 -.21
Reagan
-.53 -.41 -.16
Reagan
- -.59 -.55 -.26
Reagan
-.46 -.37 -.14
Reagan
-.66 -.33
.01
31
at the time of reporting. In either case, there is less independence of
the positive and negative sides than there is for the non-extreme party
identifiers who live more outside of the nexus of pressures to line up
political experiences coherently.
That affective and trait responses should behave differently is
consistent with the recent provocative arguments by social psychologist
Robert Zajonc (1979), who claims that affective and cognitive judgment
systems about objects in the social world are rather independent, and are
based on different operating principles.
Recommendations
The affect battery was our most successful new measure. It is so
rich in interesting results that in the ideal world one would want to
expand its coverage. In particular, one could include more specific af
fect terms for each candidate, as well as questions on affect toward the
political system in general. Since there are severe time limitations,
however, more modest aspirations may be forced on us.
The complete affect inventory should be asked of each viable candi
date. If this is deemed impractical, then the first affects to sacrifice
are "frustrated" and "sad," since they are the least consequential in the
prediction of evaluation and preference. If further self-denial must be
practiced, our bare-bones minimum set is made up of, on the positive side,
"hopeful," "sympathetic," "liking" and "proud"; on the negative, "disgusted,"
. "uneasy," "angry," and "disliking." (In addition to knowing what af fee ts
every viable candidate elicits, it may also be useful and interesting to
know to what affects each respondent is individually prone, in relation
to political stimuli. This measure will be discussed further in Kinder's
memorandum to the 1980 study committee in anticipation of the Phila
delphia meeting.)
4. Behavior-Based Evaluation of Candidates
32
Just as people think about candidates at least partly in terms of
traits, so may candidate imagery incorporate behavioral elements. Citi
zens may react to would-be presidents in terms of what they are expected
to do if elected. For example, it may be essential for candidates to
create the impression that as president, they would stand up to the Soviet
Union, that they would never buckle under to external pressures and
threats. A candidate can overdo this, of course. Goldwater in 1964 was
perhaps understood by large numbers of the American public to be the kind
of President who in standing up to the Communists would all too readily
risk nuclear war. To some extent, this element of Goldwater's image is
captured by thinking of him as reckless. But an edge is taken off the
image when we move from the behavioral-based impression to the trait.
Expectations of behaviors may have a life of their own in people's images
of candidates.
What expectations do citizens hold regarding Presidential behavior?
Our initial speculations about this were guided by a dramaturgical model-
that what the public demands of a president is mythic action and heroic
authority. "Real" performance is less important by this scheme than
creating the impression of an active, effective presidency. More specifi
cally, the president is expected by the American public to: (1) tell
people what to do; (2) take bold initiatives; (3) stir and inspire;
(4) win against odds; (5) make wise decisions; (6) protect us from
danger; and (7) set a good example. This list of cliches served as the
33
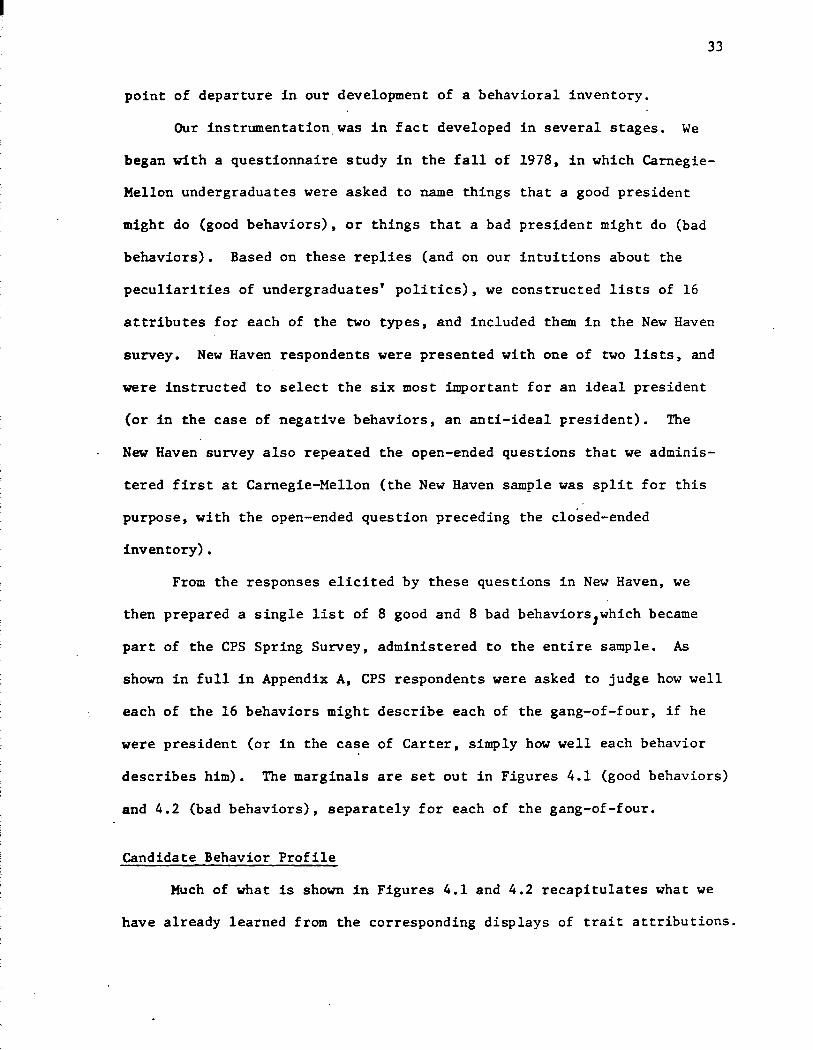
point of departure in our development of a behavioral inventory.
Our instrumentation.was in fact developed in several stages. We
began with a questionnaire study in the fall of 1978, in which Carnegie
Mellon undergraduates were asked to name things that a good president
might do (good behaviors), or things that a bad president might do (bad
behaviors). Based on these replies (and on our intuitions about the
peculiarities of undergraduates' politics), we constructed lists of 16
attributes for each of the two types, and included them in the New Haven
survey. New Haven respondents were presented with one of two lists, and
were instructed to select the six most important for an ideal president
(or in the case of negative behaviors, an anti-ideal president). The
New Haven survey also repeated the open-ended questions that we adminis
tered first at Carnegie-Mellon (the New Haven sample was split for this
purpose, with the open-ended question preceding the closed-ended
inventory).
From the responses elicited by these questions in New Haven, we
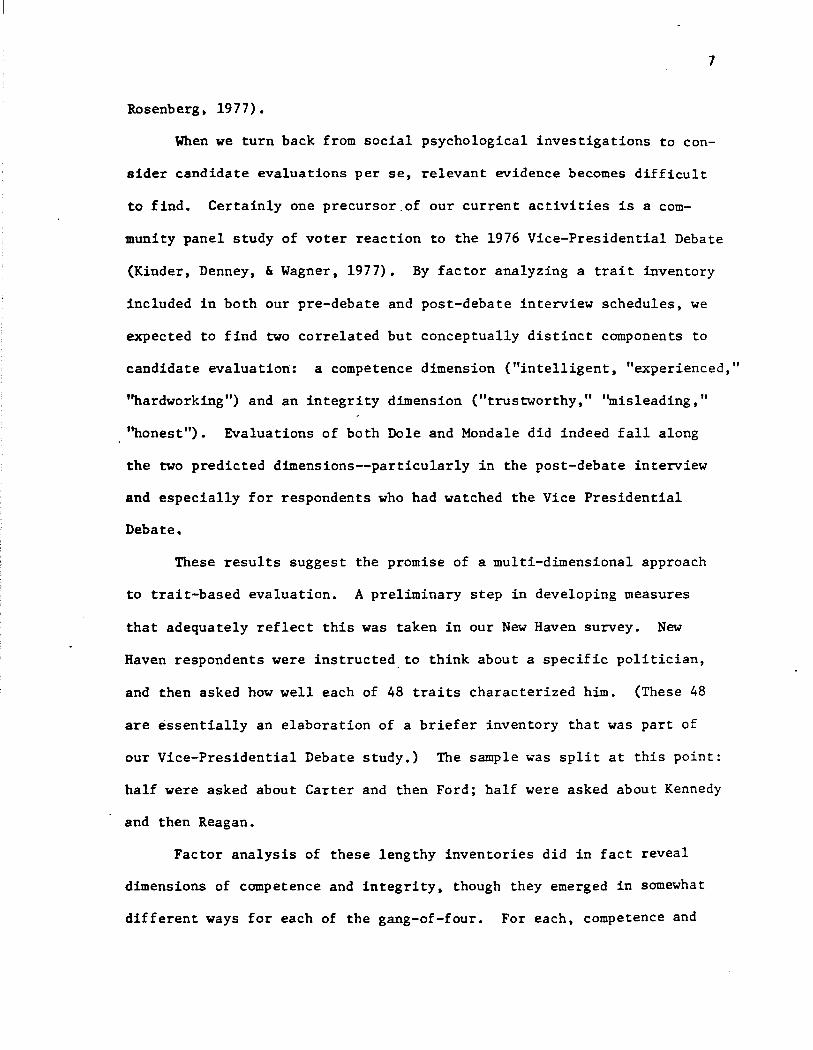
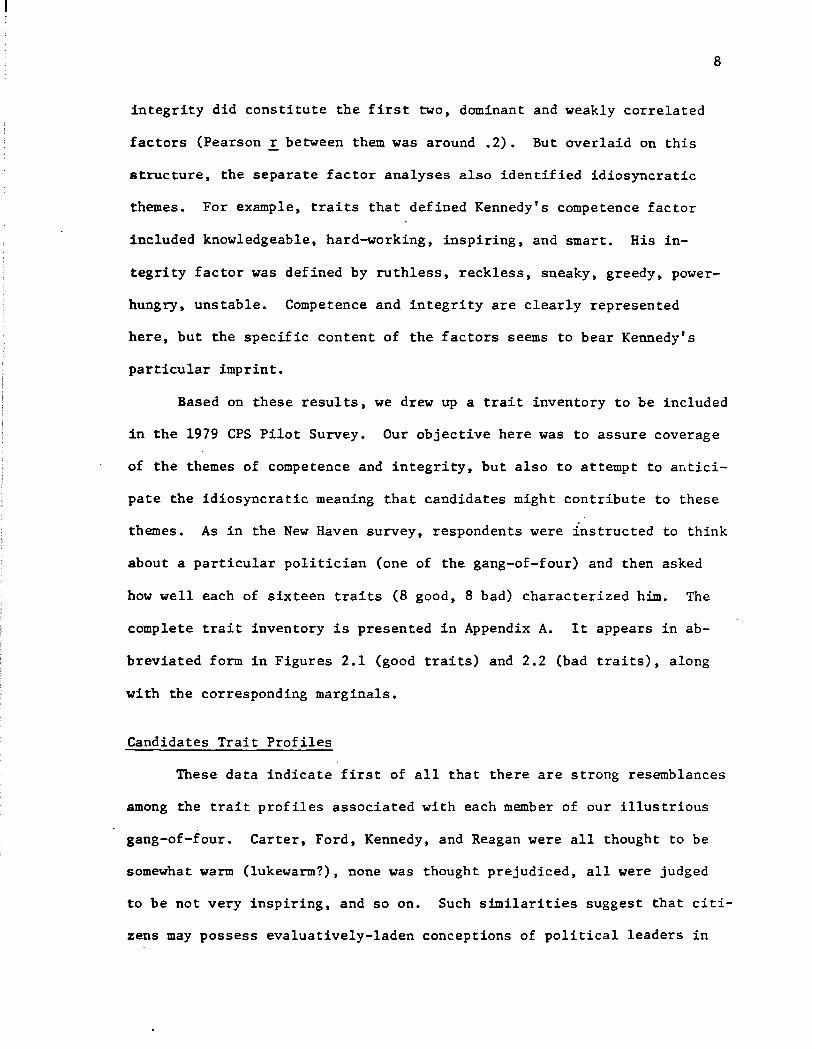
then prepared a single list of 8 good and 8 bad behaviors1which became
part of the CPS Spring Survey, administered to the entire sample. As
shown in full in Appendix A, CPS respondents were asked to judge how well
each of the 16 behaviors might describe each of the gang-of-four, if he
were president (or in the case of Carter, simply how well each behavior
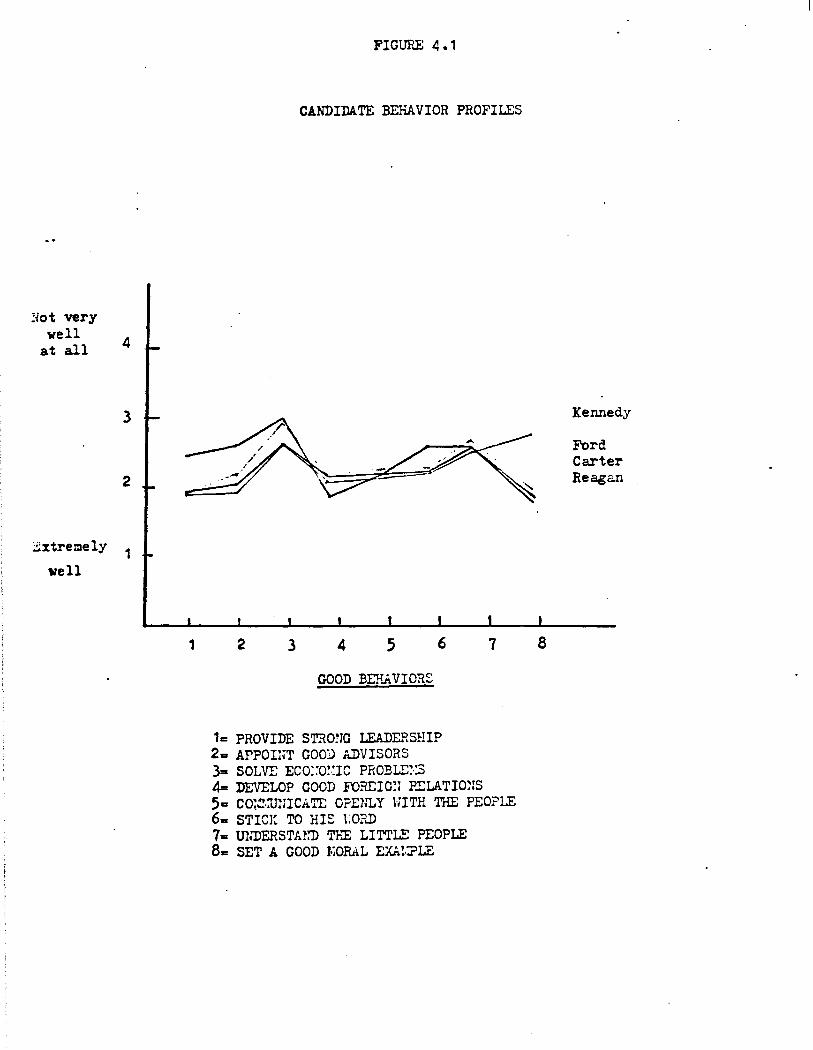
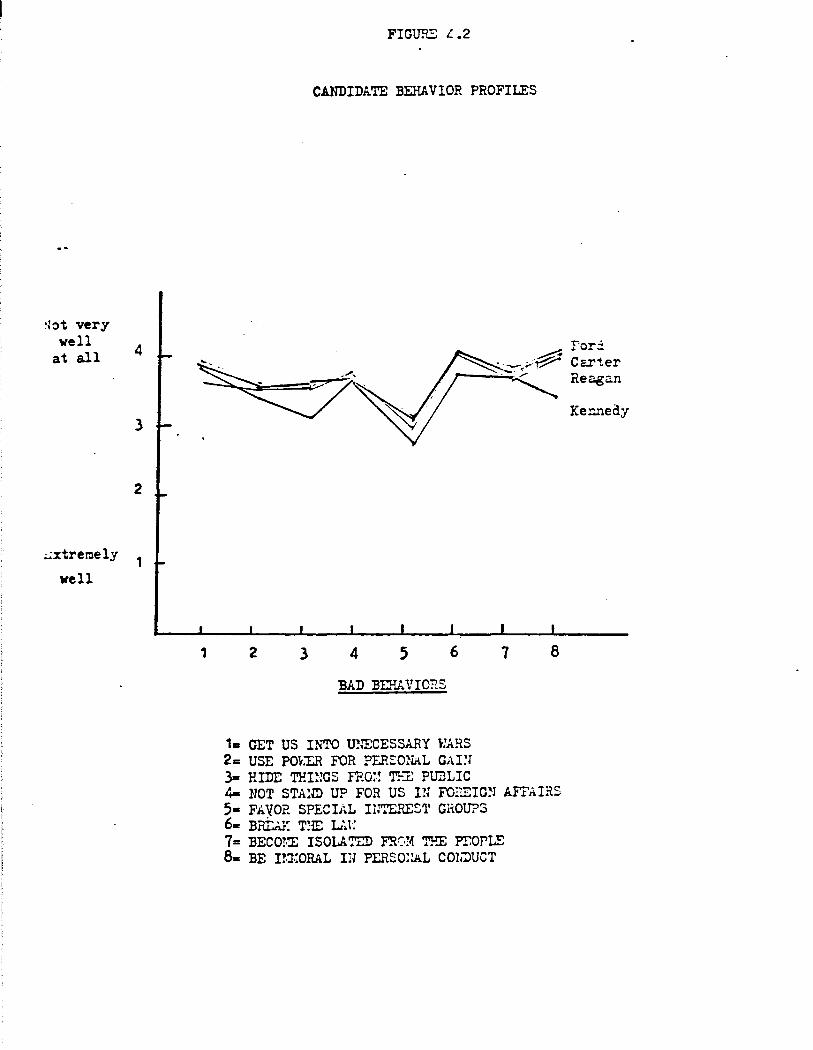
describes him). The marginals are set out in Figures 4.1 (good behaviors)
and 4.2 (bad behaviors), separately for each of the gang-of-four.
Candidate Behavior Profile
Much of what is shown in Figures 4.1 and 4.2 recapitulates what we
have already learned from the corresponding displays of trait attributions.
!iot very well
at all 4
3
2
:.±!xtreme ly 1 well
1
FIGURE 4.1
CANDIDATE BEHAVIOR PROFILES
2 3 4 5 6
GOOD BEHAVIORS
1= PROVIDE STR0!1G LEADERSHIP 2 .. APPOI!;T GOOD ADVISORS 3= SOLVE ECO::o~.:Ic PROBLE~:S 4= DEVELOP GOOD F'OREIG~: P~LATimrs
7
5• CO!.:!·lHHCATE O?ENLY HITH THE PEOPLE 6= STICK TO HIS tO?J) 7= mmERSTA?J) TEE LITTLE PEOPLE 8= SET A GOOD l·iORAL EXA!·:?LE
8
Kennedy
Ford Carter Reagan
·{ot very well
at all
~xtrerne ly
well
4
3
2
1
1
FIGURE L.2
CANDIDATE BEHAVIOR PROFILES
2 3 4 5 6
BAD 13EP.A VIORS
1• GET US INTO U!IBCESSARY r:ARS 2= USE PO\-:ER FOR PERSONAL GAI:I 3= HIDE TP.I!;cs nm=! TEE PU3LIC
7 8
4= lIOT STA!ID U? FOR US IN FO~IC~l AFF.ri.IRS 5• F.A'VO?. SPECIAL I!rl'ERES'l' GHOU?S 6., BRtn.i: T:!lE L~ t·: 7= BECO!·:E ISOLA TED FRC·!~ T?.E Fr.OPLE 8= BE UJ.:ORAL 111 PER!:;O!!AL COliDUCT
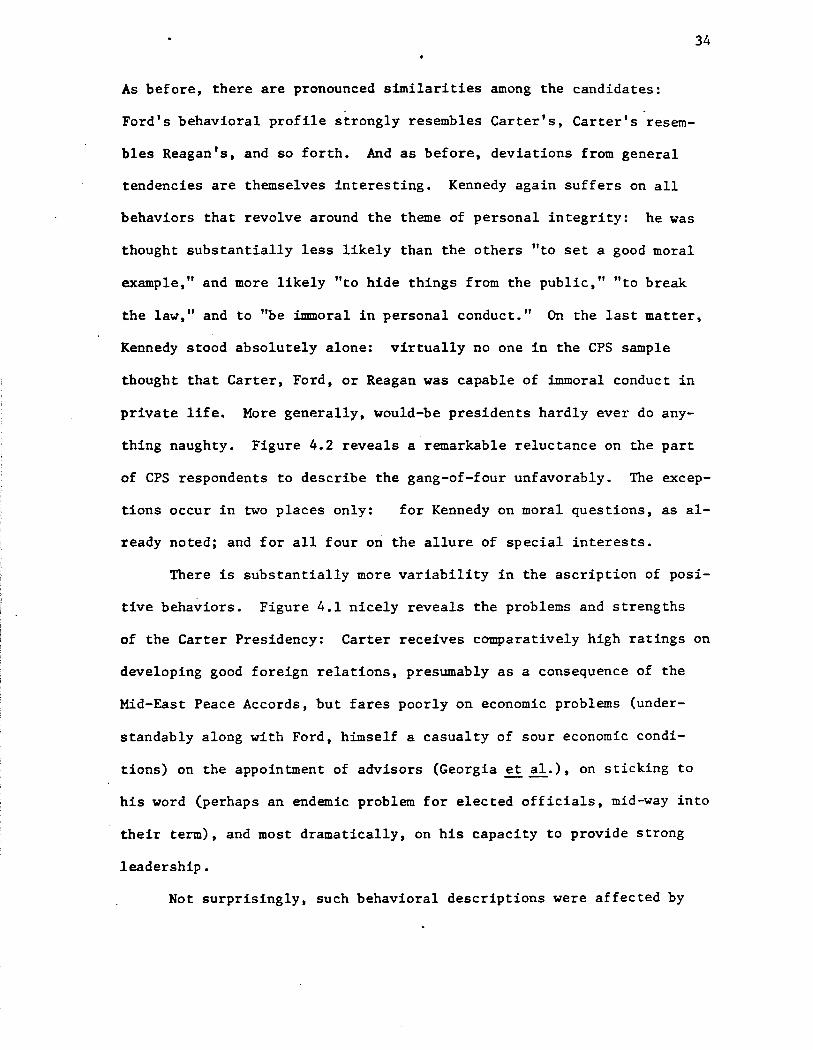
As before, there are pronounced similarities among the candidates:
Ford's behavioral profile strongly resembles Carter's, Carter's resem-
bles Reagan's, and so forth. And as before, deviations from general
tendencies are themselves interesting. Kennedy again suffers on all
behaviors that revolve around the theme of personal integrity: he was
thought substantially less likely than the others "to set a good moral
example," and more likely "to hide things from the public," "to break
34
the law," and to "be immoral in personal conduct." On the last matter,
Kennedy stood absolutely alone: virtually no one in the CPS sample
thought that Carter, Ford, or Reagan was capable of immoral conduct in
private life. More generally, would-be presidents hardly ever do any-
thing naughty. Figure 4.2 reveals a remarkable reluctance on the part
of CPS respondents to describe the gang-of-four unfavorably. The excep-
tions occur in two places only: for Kennedy on moral questions, as al-
ready noted; and for all four on the allure of special interests.
There is substantially more variability in the ascription of posi
tive behaviors. Figure 4.1 nicely reveals the problems and strengths
of the Carter Presidency: Carter receives comparatively high ratings on
developing good foreign relations, presumably as a consequence of the
Mid-East Peace Accords, but fares poorly on economic problems (under-
standably along with Ford, himself a casualty of sour economic condi
tions) on the appointment of advisors (Georgia et al.), on sticking to --his word (perhaps an endemic problem for elected officials, mid-way into
their term), and most dramatically, on his capacity to provide strong
leadership.
Not surprisingly, such behavioral descriptions were affected by
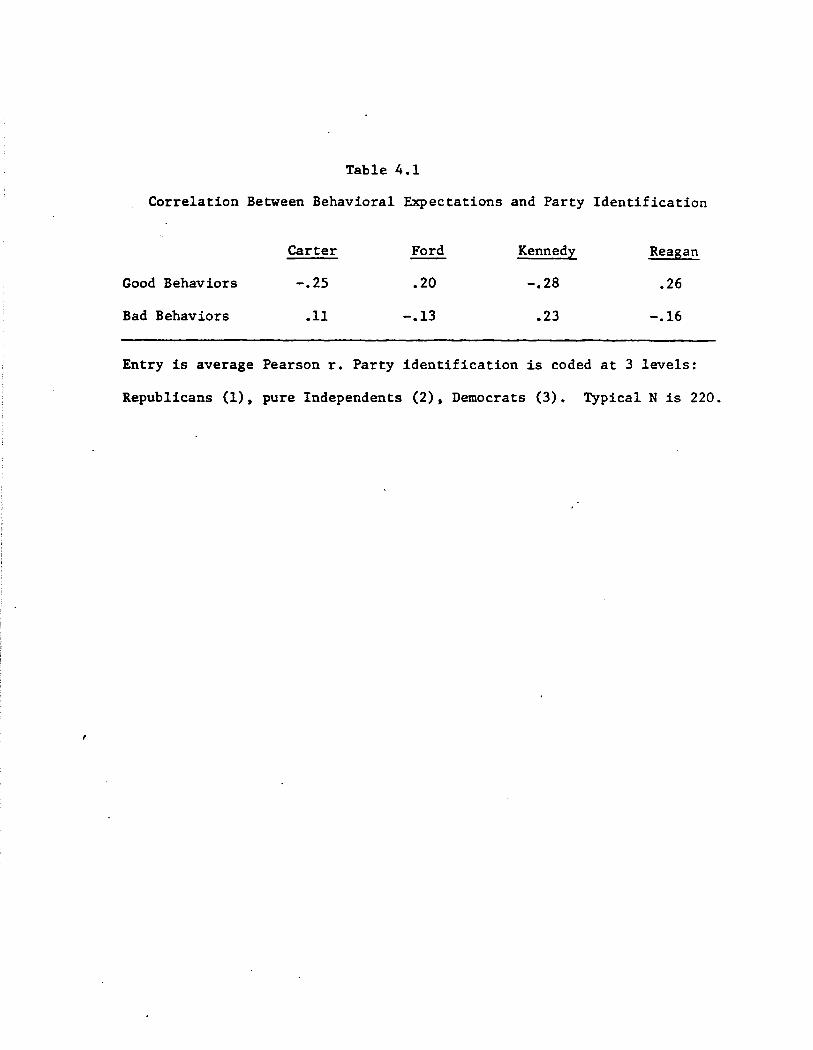
Table 4.1
Correlation Between Behavioral Expectations and Party Identification
Good Behaviors
Bad Behaviors
Carter
-.25
.11
Ford
.20
-.13
Kennedy
-.28
.23
Reagan
.26
-.16
Entry is average Pearson r. Party identification is coded at 3 levels:
Republicans (1), pure Independents (2), Democrats (3). Typical N is 220.
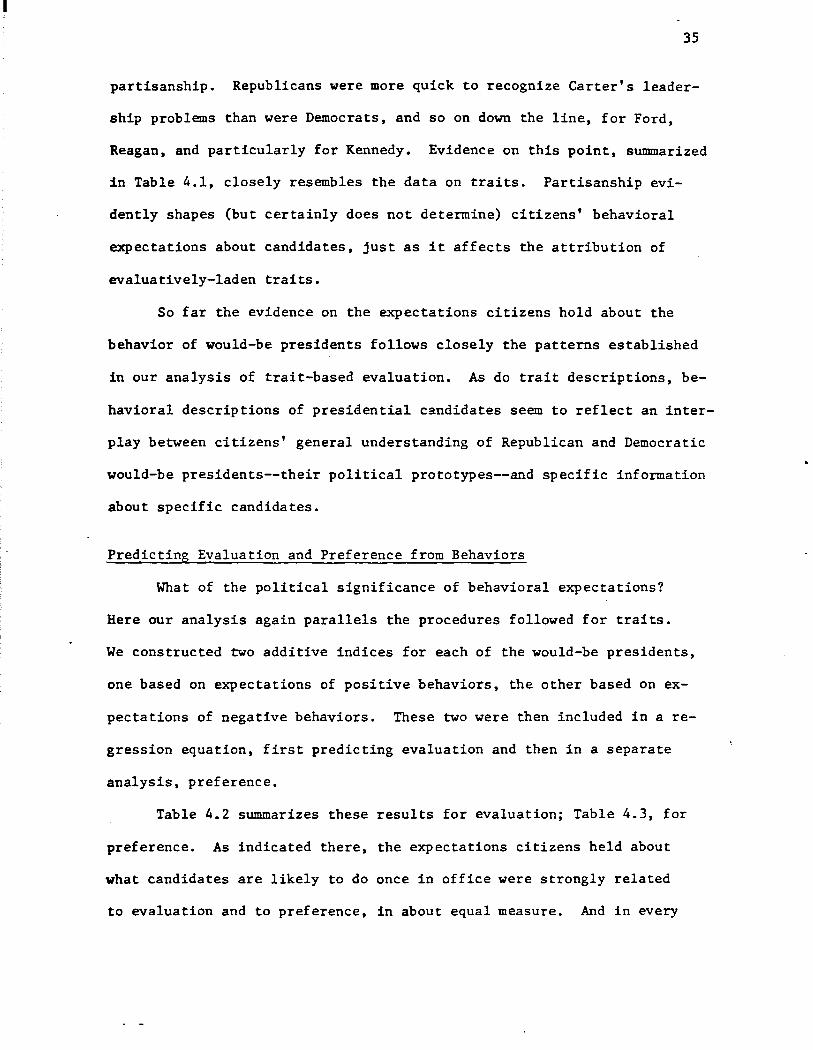
35
partisanship. Republicans were more quick to recognize Carter's leader
ship problems than were Democrats, and so on down the line, for Ford,
Reagan, and particularly for Kennedy. Evidence on this point, summarized
in Table 4.1, closely resembles the data on traits. Partisanship evi
dently shapes (but certainly does not determine) citizens' behavioral
expectations about candidates, just as it affects the attribution of
evaluatively-laden traits.
So far the evidence on the expectations citizens hold about the
behavior of would-be presidents follows closely the patterns established
in our analysis of trait-based evaluation. As do trait descriptions, be
havioral descriptions of presidential candidates seem to reflect an inter
play between citizens' general understanding of Republican and Democratic
would-be presidents--their political prototypes--and specific information
about specific candidates.
Predicting Evaluation and Preference from Behaviors
What of the political significance of behavioral expectations?
Here our analysis again parallels the procedures followed for traits.
We constructed two additive indices for each of the would-be presidents,
one based on expectations of positive behaviors, the other based on ex
pectations of negative behaviors. These two were then included in a re
gression equation, first predicting evaluation and then in a separate
analysis, preference.
Table 4.2 summarizes these results for evaluation; Table 4.3, for
preference. As indicated there, the expectations citizens held about
what candidates are likely to do once in office were strongly related
to evaluation and to preference, in about equal measure. And in every
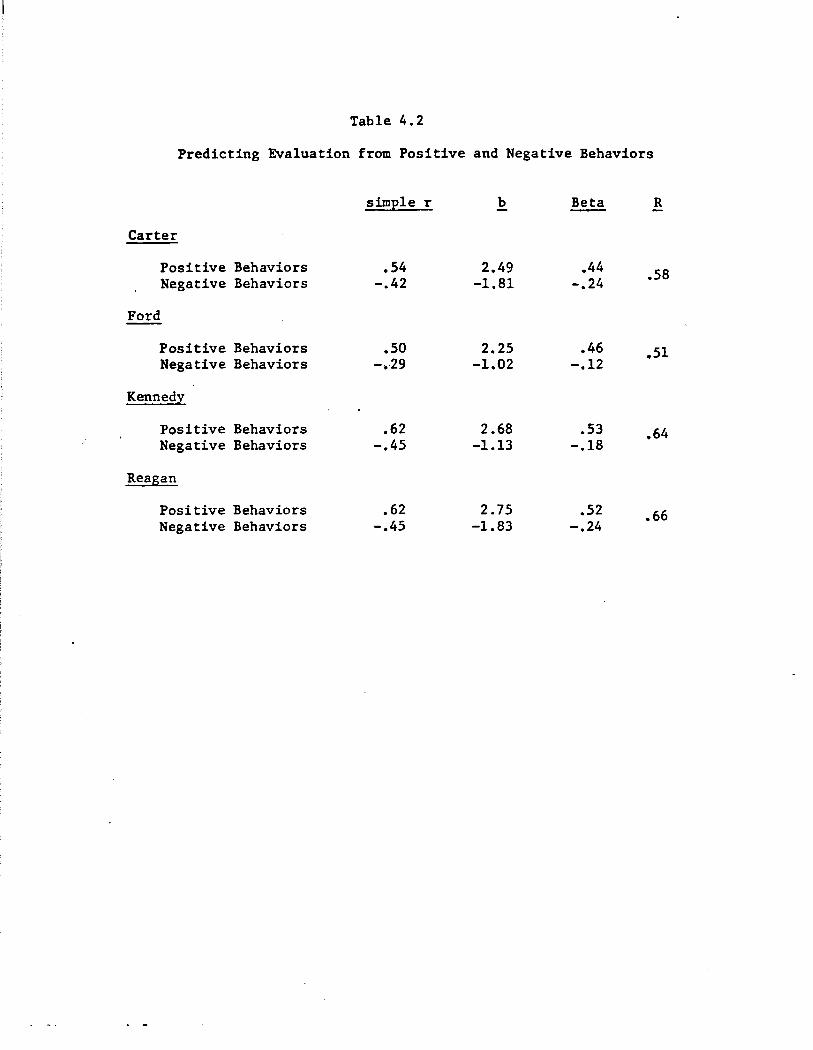
Table 4.2
Predicting Evaluation from Positive and Negative Behaviors
simple r b Beta R
Carter
Positive Behaviors .54 2.49 .44 .58 Negative Behaviors -.42 -1.81 -.24
Ford
Positive Behaviors .so 2.25 .46 .51 Negative Behaviors -.29 -1.02 -.12
Kennedy
Positive Behaviors .62 2.68 .53 .64 Negative Behaviors -.45 -1.13 -.18
Reagan
Positive Behaviors .62 2.75 .52 .66 Negative Behaviors -.45 -1.83 -.24
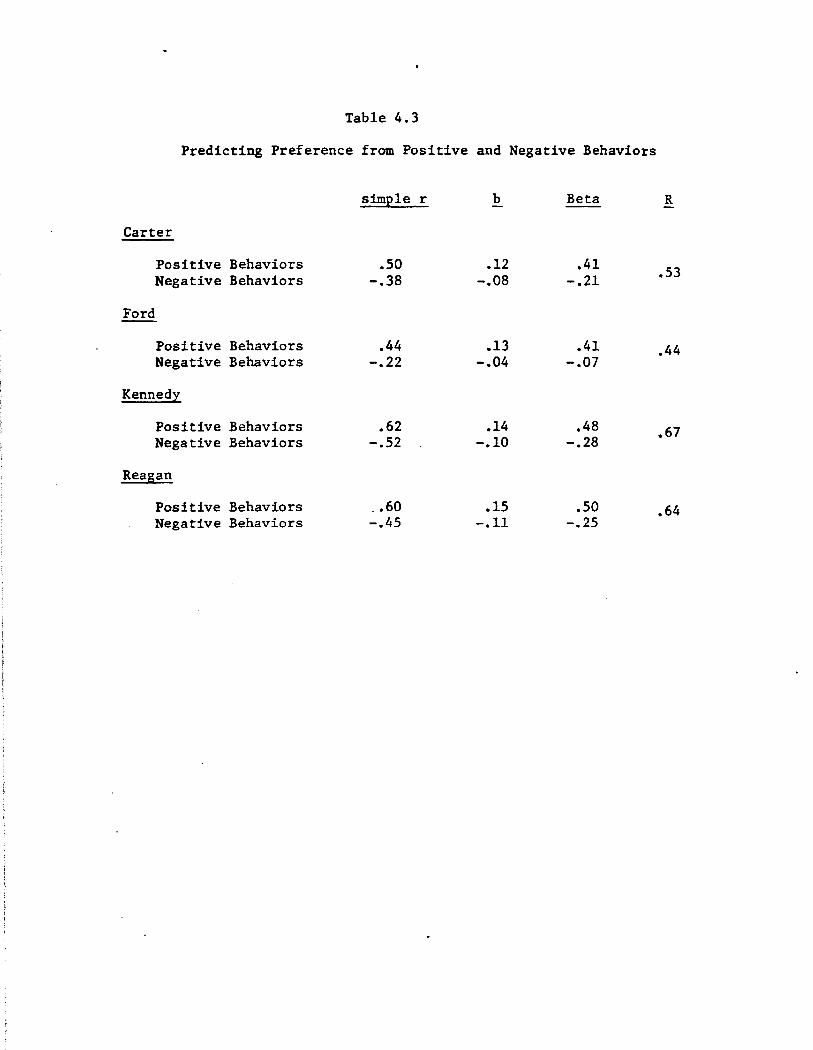
Table 4.3
Predicting Preference from Positive and Negative Behaviors
simple r b Beta R
Carter
Positive Behaviors .so .12 .41 .53 Negative Behaviors -.38 -.08 -.21
Ford
Positive Behaviors .44 .13 .41 .44 Negative Behaviors -.22 -.04 -.07
Kennedy
Positive Behaviors .62 .14 .48 .67 Negative Behaviors -.S2 -.10 -.28
Reagan
Positive Behaviors - .60 .lS .so .64 Negative Behaviors -.4S -.11 -.25
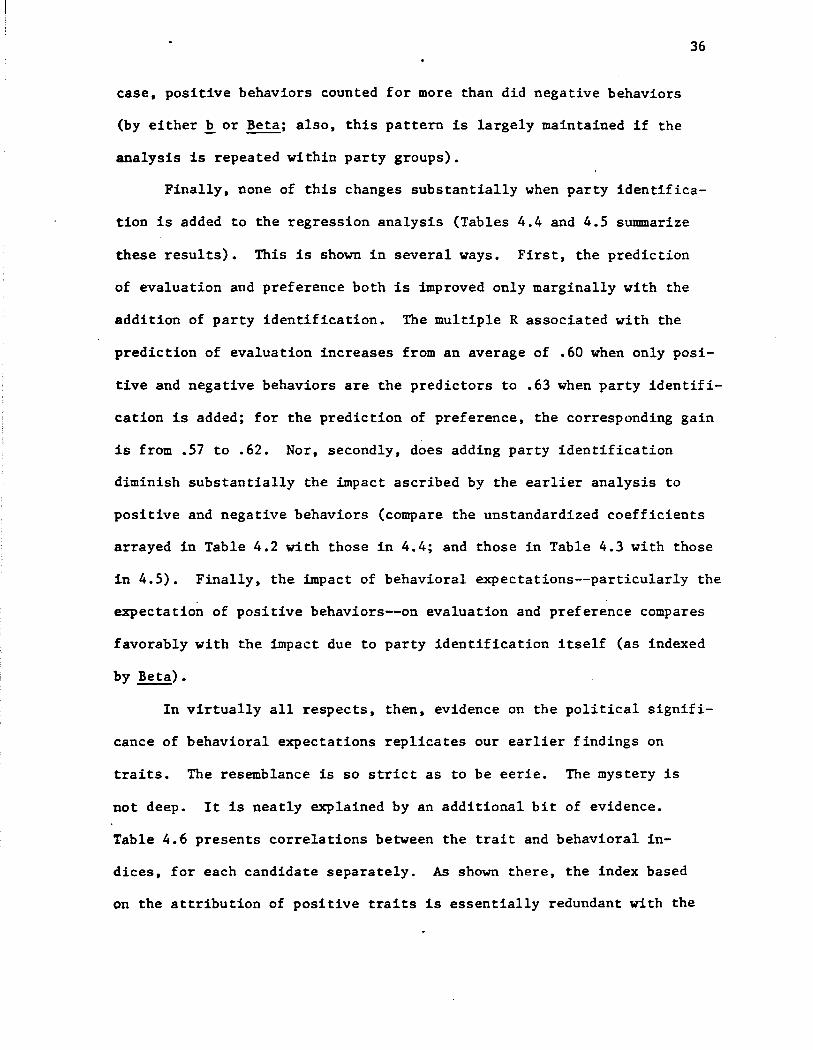
case, positive behaviors counted for more than did negative behaviors
(by either ~ or Beta; also, this pattern is largely maintained if the
analysis is repeated within party groups).
36
Finally, none of this changes substantially when party identifica
tion is added to the regression analysis (Tables 4.4 and 4.5 summarize
these results). This is shown in several ways. First, the prediction
of evaluation and preference both is improved only marginally with the
addition of party identification. The multiple R associated with the
prediction of evaluation increases from an average of .60 when only posi
tive and negative behaviors are the predictors to .63 when party identifi
cation is added; for the prediction of preference, the corresponding gain
is from .57 to .62. Nor, secondly, does adding party identification
diminish substantially the impact ascribed by the earlier analysis to
positive and negative behaviors (compare the unstandardized coefficients
arrayed in Table 4.2 with those in 4.4; and those in Table 4.3 with those
in 4.5). Finally, the impact of behavioral expectations--particularly the
expectation of positive behaviors--on evaluation and preference compares
favorably with the impact due to party identification itself (as indexed
by Beta).
In virtually all respects, then, evidence on the political signifi
cance of behavioral expectations replicates our earlier findings on
traits. The resemblance is so strict as to be eerie. The mystery is
not deep. It is neatly explained by an additional bit of evidence.
Table 4.6 presents correlations between the trait and behavioral in
dices, for each candidate separately. As shown there, the index based
on the attribution of positive traits is essentially redundant with the
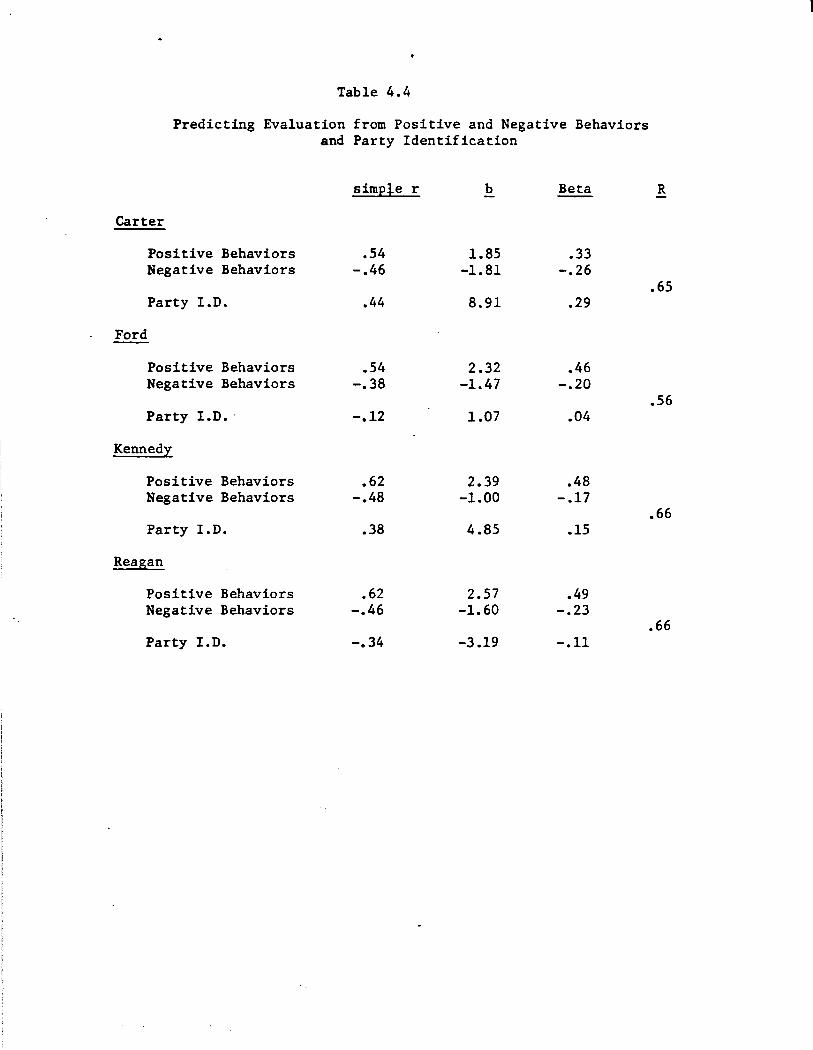
Table 4.4
Predicting Evaluation from Positive and Negative Behaviors and Party Identification
simple r b Beta R
Carter
Positive Behaviors .54 1.85 .33 Negative Behaviors -.46 -1.81 -.26
.65 Party I.D. .44 8.91 .29
Ford
Positive Behaviors .54 2.32 .46 Negative Behaviors -.38 -1.47 -.20
.56 Party I.D •. -.12 1.07 .04
Kennedy
Positive Behaviors .62 2.39 .48 Negative Behaviors -.48 -1.00 -.17
.66 Party I.D. .38 4.85 .15
Reagan
Positive Behaviors .62 2.57 .49 Negative Behaviors -.46 -1.60 -.23
.66 Party I.D. -.34 -3.19 -.11
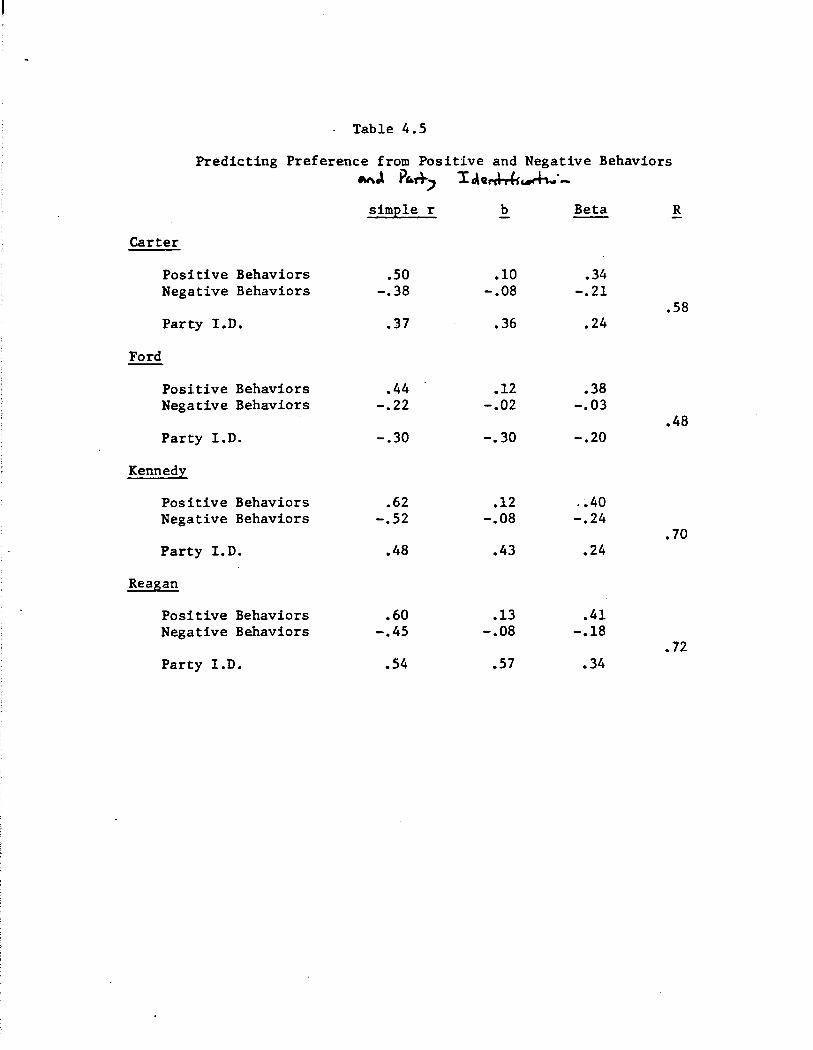
Table 4.5
Predicting Preference from Positive and Negative Behaviors ~J Pc...+, I<Ae~~ .. ;-
simple r b Beta R
Carter
Positive Behaviors .50 .10 .34 Negative Behaviors -.38 -.08 -.21
.58 Party I.D. .37 .36 .24
Ford
Positive Behaviors .44 .12 .38 Negative Behaviors -.22 -.02 -.03
.48 Party I.D. -.30 -.30 -.20
Kennedy
Positive Behaviors .62 .12 . ·.40 Negative Behaviors -.52 -.08 -.24
.70 Party I.D. .48 .43 .24
Reagan
Positive Behaviors .60 .13 .41 Negative Behaviors -.45 -.08 -.18
• 72 Party I.D. .54 .57 .34
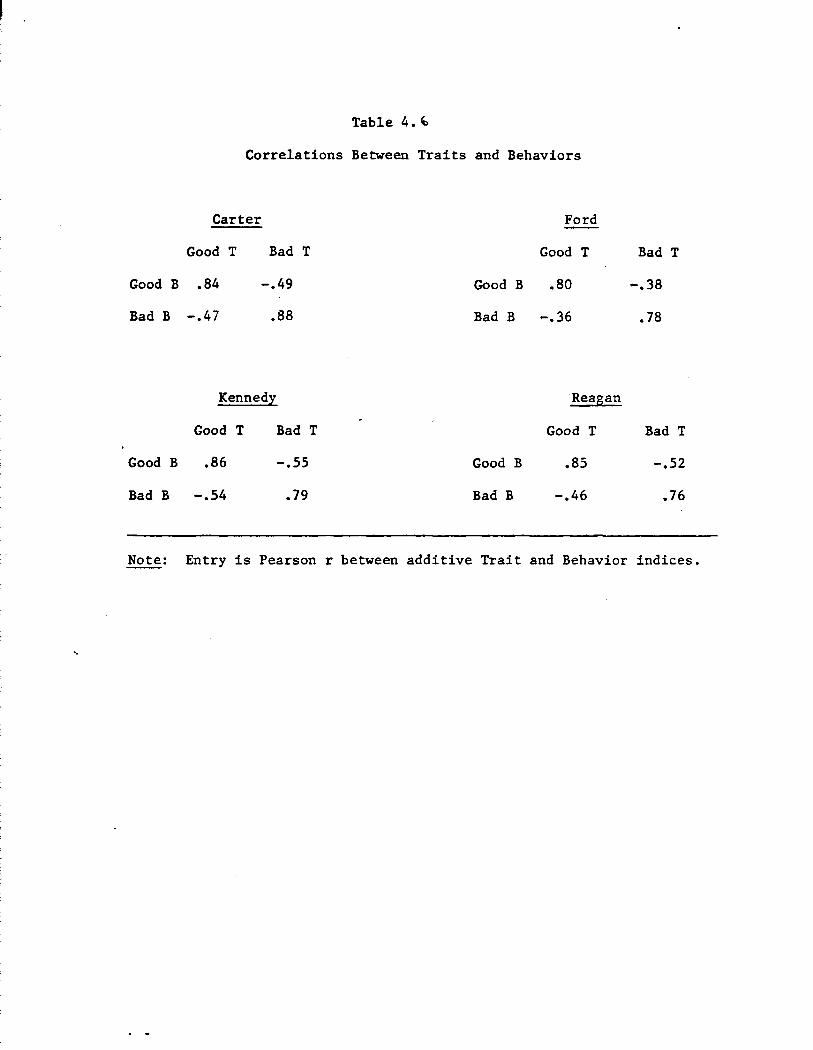
Table 4. ~
Correlations Between Traits and Behaviors
Carter
Good T
Good B .84
Bad B -.47
Bad T
-.49
.88
Kennedy
Good T Bad T
Good B .86 -.55
Bad B -.54 .79
Ford
Good T
Good B .80
Bad B -.36
Reagan
Bad T
-.38
.78
Good T Bad T
Good B
Bad B
.85 -.52
-.46 .76
Note: Entry is Pearson r between additive Trait and Behavior indices.
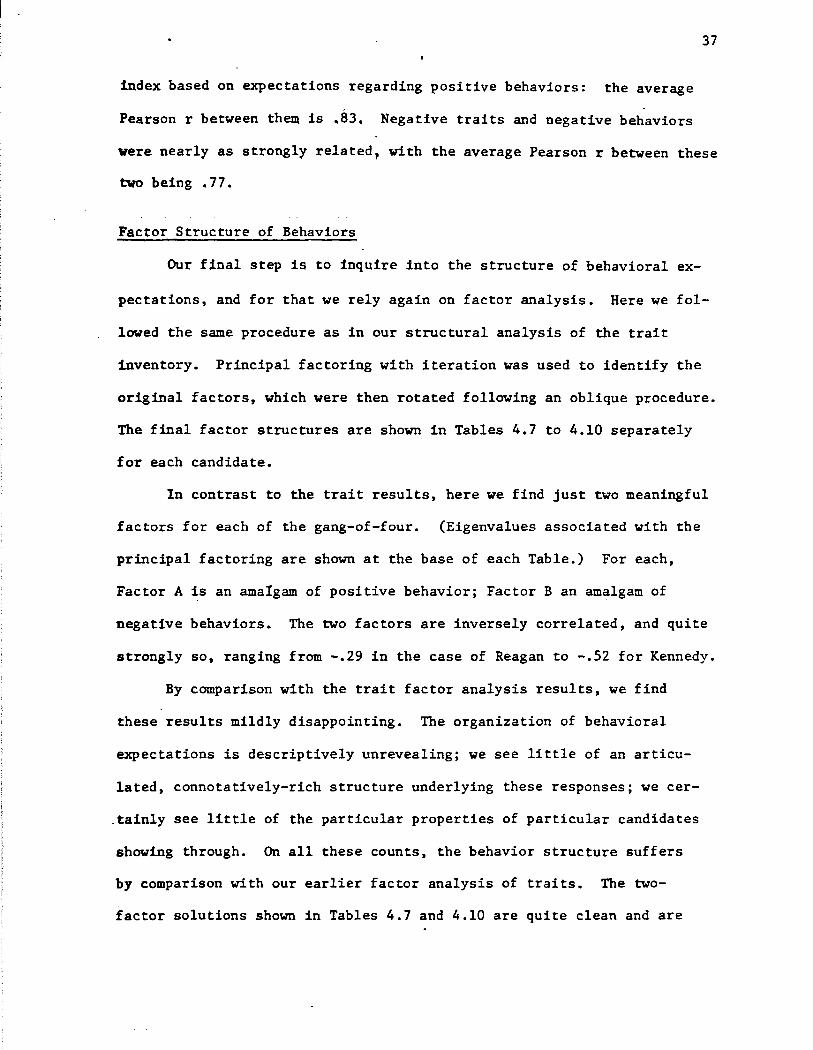
37
index based on expectations regarding positive behaviors: the average
Pearson r between th~ is -B3. Negative traits and negative behaviors
were nearly as strongly related, with the average Pearson r between these
t:wo being .77.
Factor Structure of Behaviors
Our final step is to inquire into the structure of behavioral ex
pectations, and for that we rely again on factor analysis. Here we fol
lowed the same procedure as in our structural analysis of the trait
inventory. Principal factoring with iteration was used to identify the
original factors, which were then rotated following an oblique procedure.
The final factor structures are shown in Tables 4.7 to 4.10 separately
for each candidate.
In contrast to the trait results, here we find just two meaningful
factors for each of the gang-of-four. (Eigenvalues associated with the
principal factoring are shown at the base of each Table.) For each,
Factor A is an amaigam of positive behavior; Factor B an amalgam of
negative behaviors. The two factors are inversely correlated, and quite
strongly so, ranging from -.29 in the case of Reagan to -.52 for Kennedy.
By comparison with the trait factor analysis results, we find
these results mildly disappointing. The organization of behavioral
expectations is descriptively unrevealing; we see little of an articu
lated, connotatively-rich structure underlying these responses; we cer-
.tainly see little of the particular properties of particular candidates
showing through. On all these counts, the behavior structure suffers
by comparison with our earlier factor analysis of traits. The two
factor solutions shown in Tables 4.7 and 4.10 are quite clean and are
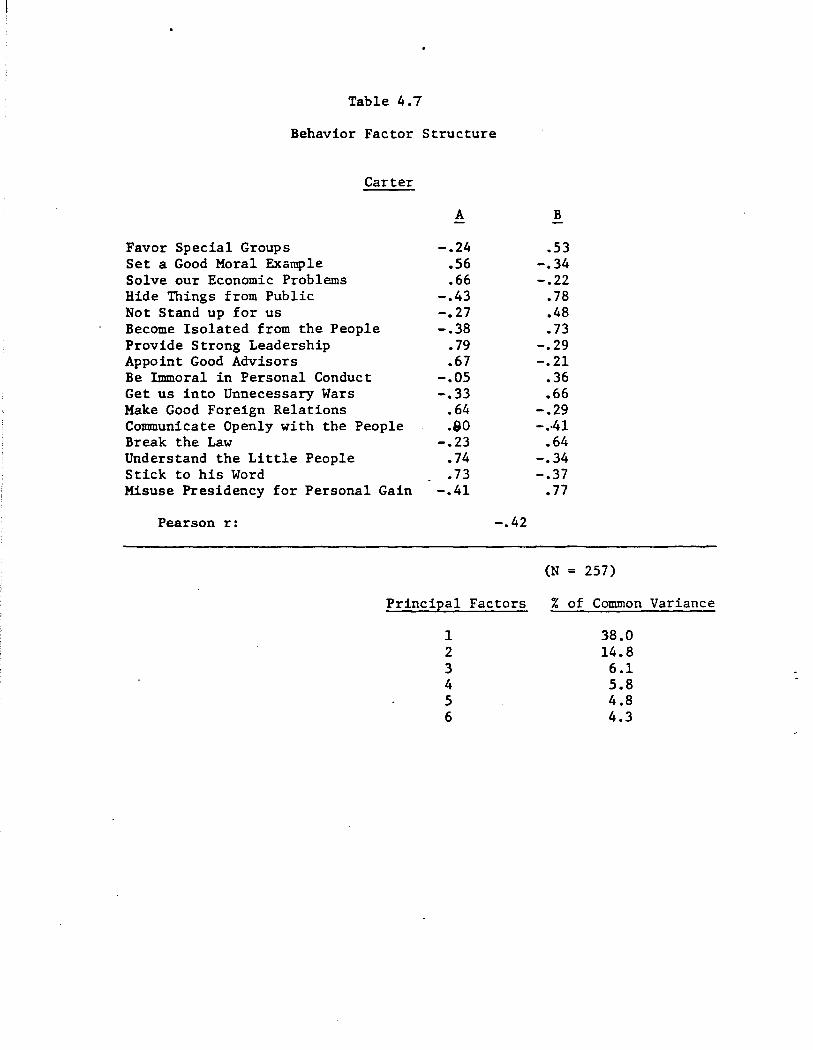
Table 4.7
Behavior Factor Structure
Favor Special Groups Set a Good Moral Example Solve our Economic Problems Hide Tilings from Public Not Stand up for us
Carter
Become Isolated from the People Provide Strong Leadership Appoint Good Advisors Be Immoral in Personal Conduct Get us into Unnecessary Wars Make Good Foreign Relations Communicate Openly with the People Break the Law Understand the Little People Stick to his Word Misuse Presidency for Personal Gain
Pearson r:
A
-.24 .56 .66
-.43 -.27 -.38
.79
.67 -.05 -.33
.64
.90 -.23
.74 • 73
-.41
-.42
Principal Factors
1 2 3 4 5 6
B
.53 -.34 -.22
.78
.48
.73 -.29 -.21
.36
.66 -.29 -.-41
.64 -.34 -.37
• 77
(N = 257)
% of Common Variance
38.0 14.8 6.1 5.8 4.8 4.3

Table 4.B
Behavior Factor Structure
Favor Special Groups Set a Good Moral Example Solve our Economic Problems Hide Things from Public Not Stand up for us
Ford
Become Isolated from the People Provide Strong Leadership Appoint Good Advisors Be Immoral in Personal Conduct Get us into Unnecessary Wars Make Good Foreign Relations Communicate Openly with the People Break the Law Understsand the Little People Stick to his Word Misuse Presidency for Personal Gain
Pearson r:
A
-.22 .so .65
-.41 -.16 -.43
.76
.76 -.15 -.28
.68
.70 -.28
.73
.64 -.29
-.44
B
.4+ -.30 -.21
.65
.45
.62 -.32 -.31
.46
.49 -.23 -.JS
.71 -.40 -.40
.63
(N = 250)
Principal Factors % of Common Variance
1 34. 7 2 13.4 3 7 .4 4 5.9 5 5.3 6 4.6
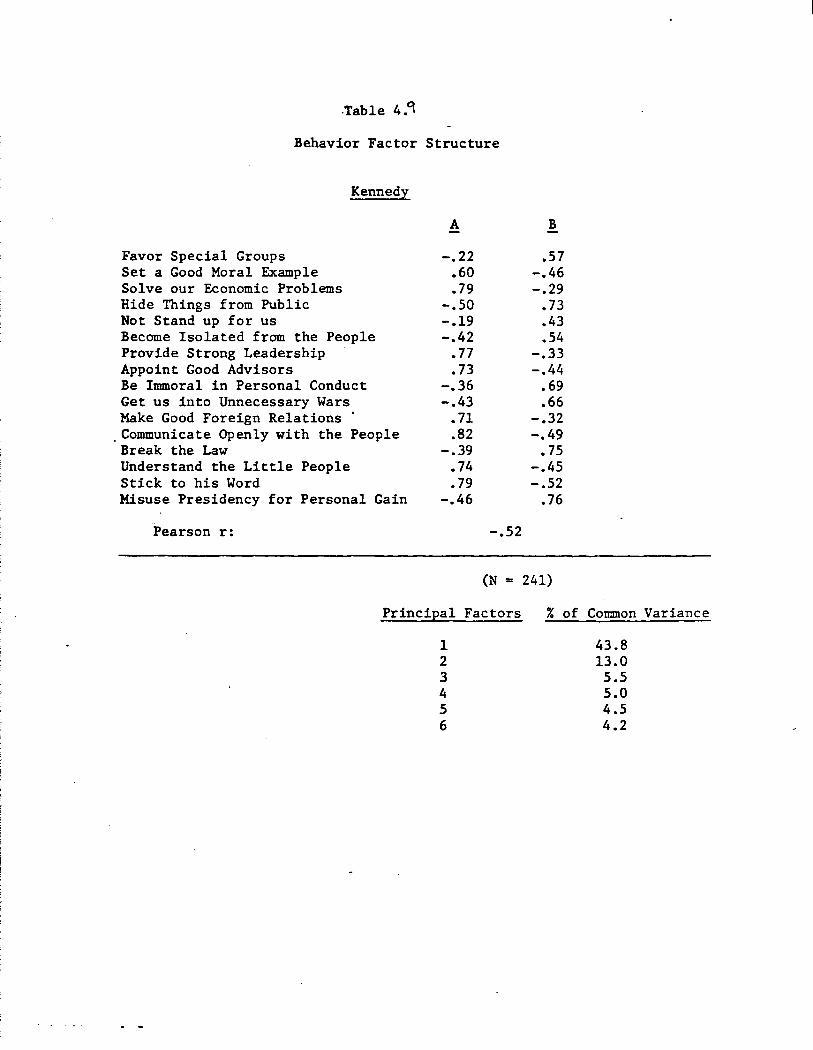
.Table 4.«::\
Behavior Factor Structure
Favor Special Groups Set a Good Moral Example Solve our Economic Problems Hide Things from Public Not Stand up for us
Kennedy
Become Isolated from the People Provide Strong Leadership Appoint Good Advisors Be Immoral in Personal Conduct Get us into Unnecessary Wars Make Good Foreign Relations
. Communicate Openly with the People Break the Law Understand the Little People Stick to his Word Misuse Presidency for Personal Gain
Pearson r:
A
-.22 .60 .79
-.50 -.19 -.42
.77
.73 -.36 -.43
• 71 .82
-.39 • 74 .79
-.46
-.52
B
.57 -.46 -.29
.73
.43
.54 -.33 -.44
.69
.66 -.32 -.49
.75 -.45 -.52
.76
(N = 241)
Principal Factors
1 2 3 4 5 6
% of Common Variance
43.8 13.0 5.5 5.0 4.5 4.2
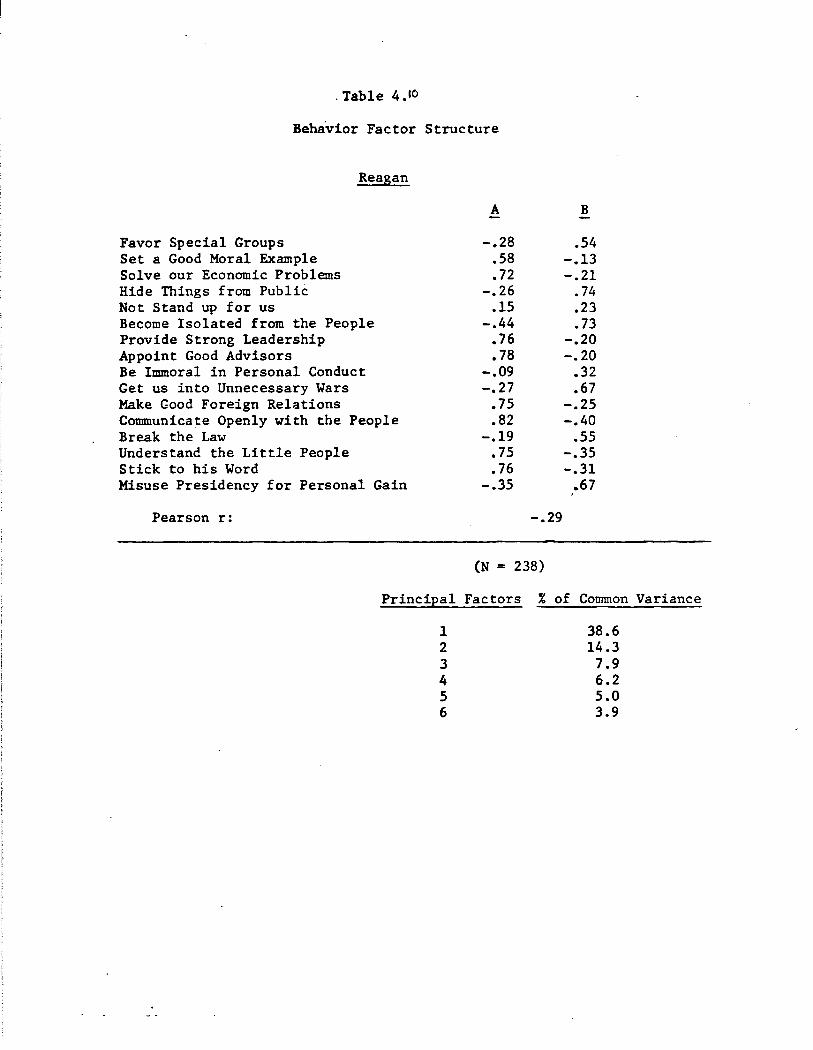
. Table 4.10
Behavior Factor Structure
Favor Special Groups Set a Good Moral Example Solve our Economic Problems Hide Things from Public Not Stand up for us
Reagan
Become Isolated from the People Provide Strong Leadership Appoint Good Advisors Be Immoral in Personal Conduct Get us into Unnecessary Wars Make Good Foreign Relations Communicate Openly with the People Break the Law Understand the Little People Stick to his Word Misuse Presidency for Personal Gain
Pearson r:
A
-.28 .58 • 72
-.26 .15
-.44 .76 .78
-.09 -.27
.75
.82 -.19
.75
.76 -.35
-.29
(N = 238)
B
.54 -.13 -.21
.74
.23
.73 -.20 -.20
.32
.67 -.25 -.40
.55 -.35 -.31
.67
Principal Factors % of Common Variance
1 38.6 2 14.3 3 7.9 4 6.2 5 5.0 6 3.9
38
certainly easy to describe, but in their evaluative simplicity they lose
the richer descriptive power afforded by the trait inventory.
Summary and Recommendations
Our adventure in developing an inventory to map the behavioral ele
ments of candidate imagery has met with mixed success. On the one hand,
people seem to have no trouble revealing their judgments about what would
be presidents would likely do if they were elected. Such judgments,
furthermore, are at least somewhat sensitive to the personal histories
of our gang-of-four. And finally, expectations about presidential be
havior are evaluatively consequential. All of this recommends the assess
ment of behavioral expectations in the 1980 study. On the other hand,
the behavior inventory suffers by comparison at every point with its
companion,, the trait inventory. The case for the full behavioral in
ventory is especially compromised by the finding that behavioral expecta
tions and trait ascriptions are evaluatively redundant. This is particu
larly serious given the ferocious if not homicidal competition anticipated
over 1980 interviewing time. Based on these considerations, and on the
occasionally strong but uneven empirical performance throughout this sec
tion, our recommendation is to include a severely abbreviated form of the
behavior inventory--4 items in all. These four are distinguished from
the remainder of the inventory on two grounds: first, by their demon
strated capacity to discriminate among candidates; and second, by their
_expected relevance for the 1980 campaign. The specific items are:
(1) solve our economic problems
(2) set a good moral example (particularly relevant if Kennedy
enters)
39
(3) provide strong leadership
(4) develop good relations with other countries.
5. Conceptions of an Ideal President
People have little difficulty in cognizing presidential candidates
in terms of traits and behaviors. The instrumentation presented in the
preceding several sections seems to tap natural modes of thinking about
prominent political actors. Our interest in eliciting citizens' concep
tions of an ideal president is related to this work, and has two sources.
The first is theoretical: in the vocabulary of contemporary social
psychology, the assumptions citizens hold about what a president should be
and should do constitute a particular kind of social schema (Taylor and
Crocker, in press; Fiske and Kinder, 1980). Social schemas are abstract
conceptions people maintain about the social world--about persons, roles,
and events. Presidential idealizations in particular (to the extent we
can find them) are normative schemas: i.e., they embody the standards
that people apply (if tacitly) in the evaluation of would-be presidents.
So part of our motivation here was to join the study of response to candi
dates with current theoretical developments in social psychology.
At a more practical level, developing measures to tap citizens' con
ceptions of an ideal president should augment our predictive abilities.
In a reasonable world, traits and behaviors deemed important foF an ideal
president (e.g., honest) should count more heavily in evaluation of real
candidates than should attributes thought less important (e.g., humble).
The development of an ideal president inventory has been already
alluded to in the earlier descriptions of the trait and behavior batteries.
We began by asking Carnegie-Mellon undergraduates what they thought an
40
ideal president should be and do and what an anti-ideal president should
be and do. From their replies we fashioned four lists composed of 16 good
traits, 16 bad traits, 16 good behaviors, and 16 bad behaviors, which
were then included in our New Haven study. Each New Haven respondent
received one such list, and was asked to select the six most important
attributes. This task was accompanied (and preceded) by a companion
open-ended question similar to what we had included in the Carnegie
Mellon study, which also inquired into presidential idealizations.
From the evidence elicited by these questions in New Haven, we
generated, finally, a new and refined list, composed of 8 good traits,
8 bad traits, 8 good behaviors, and 8 bad behaviors. It is this form
of the ideal president inventory that was part of the CPS Spring survey
(wave I, full sample). CPS respondents were presented with each of the
four types of attributes separately, and instructed to'choose those four
among the 8 offered that were the most important for an ideal president.
The lists and accompanying instructions are presented in full in Appendix
A; they are presented in abbreviated form in Table 5.1, along with the
marginal distributions.
Profile of the Ideal President
As shown in Table 5.1, there was widespread agreement that an ideal
president must be honest, knowledgeable, and open-minded, must be neither
power-hungry nor unstable, must provide strong leadership, appoint good
advisors, solve economic problems, and must avoid unnecessary wars, and
never use power for personal gain. Notice that far greater significance
was attached to presidential knowledgeability than to presidential intel
ligence: while ideal presidents must know a lot, there was substantially
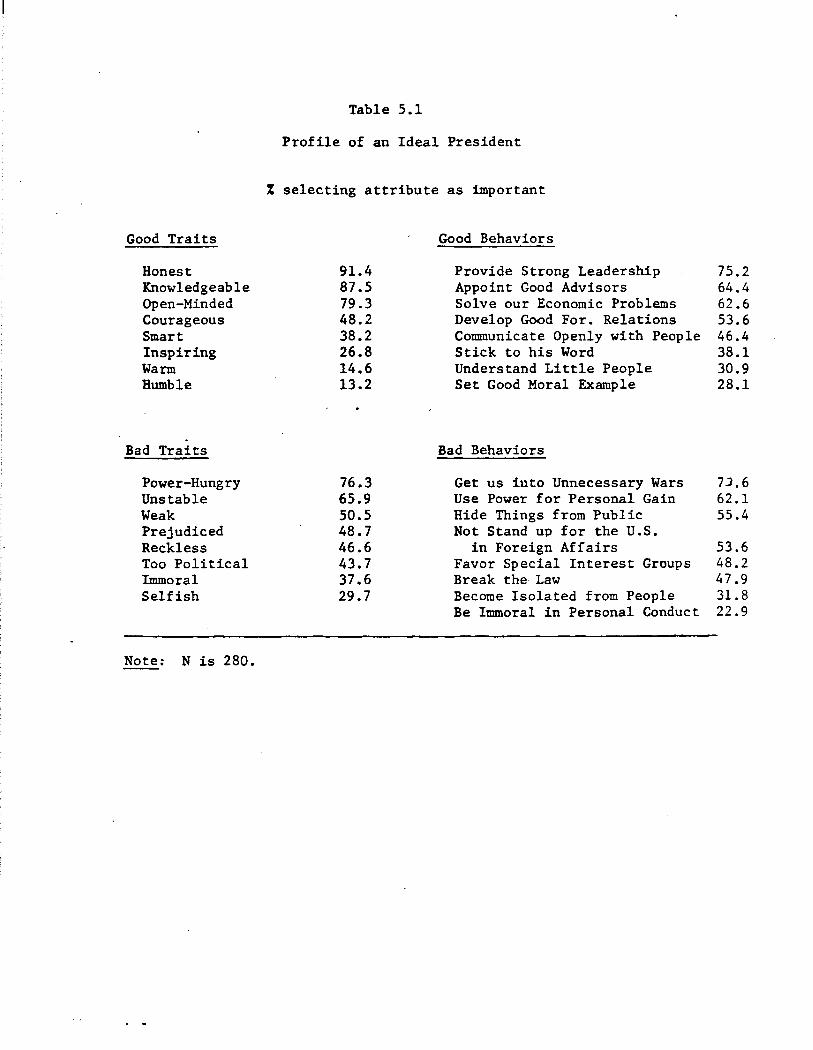
Good Traits
Honest Knowledgeable Open-Minded Courageous Smart Inspiring Warm Humble
Bad Traits
Power-Hungry Unstable Weak Prejudiced Reckless Too Political Immoral Selfish
Note: N is 280.
Table 5.1
Profile of an Ideal President
% selecting attribute as important
91.4 87.5 79.3 48.2 38.2 26.8 14.6 13.2
76.3 65.9 50.5 48.7 46.6 43.7 37.6 29.7
Good Behaviors
Provide Strong Leadership Appoint Good Advisors Solve our Economic Problems Develop Good For. Relations Communicate Openly with People Stick to his Word Understand Little People Set Good Moral Example
Bad Behaviors
Get us iuto Unnecessary Wars Use Power for Personal Gain Hide Things from Public Not Stand up for the U.S.
in Foreign Affairs Favor Special Interest Groups Break the Law Become Isolated from People Be Immoral in Personal Conduct
75.2 64.4 62.6 53.6 46.4 38.1 30.9 28.1
7J.6 62.1 55.4
53.6 48.2 47.9 31.8 22.9
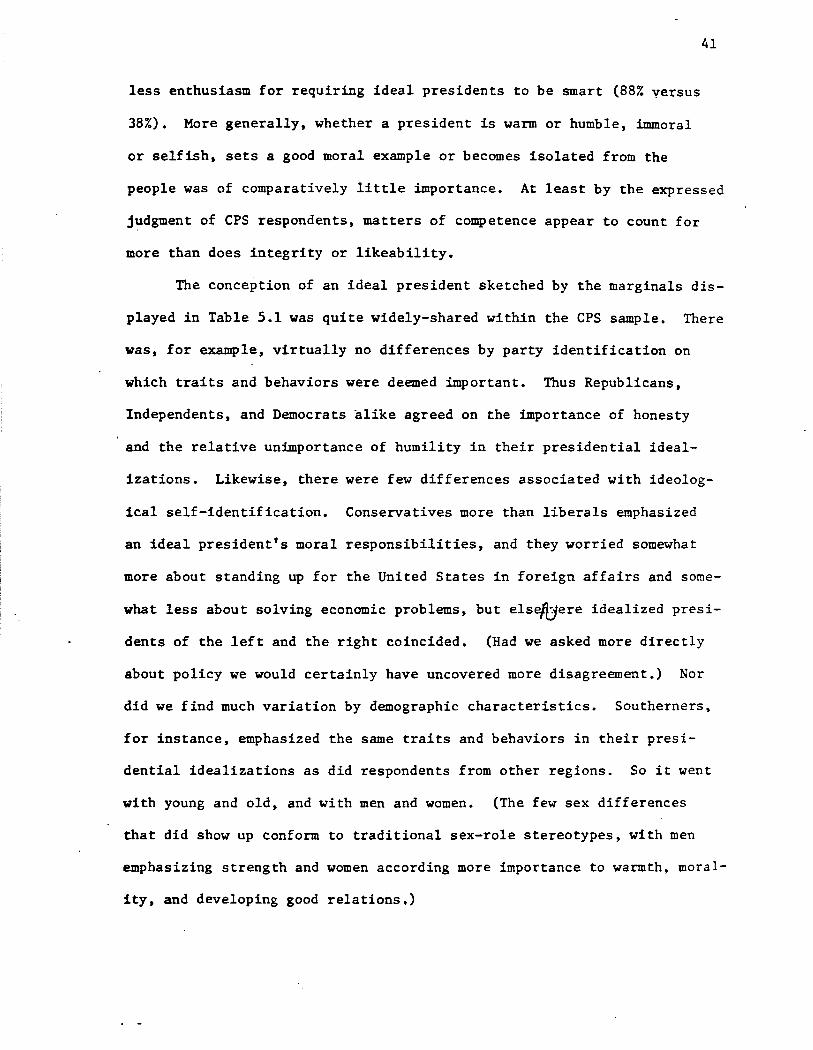
less enthusiasm for requiring ideal presidents to be smart (88% yersus
38%). More generally, whether a president is warm or humble, immoral
or selfish, sets a good moral example or becomes isolated from the
41
people was of comparatively little importance. At least by the expressed
judgment of CPS respondents, matters of competence appear to count for
more than does integrity or likeability.
The conception of an ideal president sketched by the marginals dis
played in Table 5.1 was quite widely-shared within the CPS sample. There
was, for example, virtually no differences by party identification on
which traits and behaviors were deemed important. Thus Republicans,
Independents, and Democrats alike agreed on the importance of honesty
and the relative unimportance of humility in their presidential ideal
izations. Likewise, there were few differences associated with ideolog
ical self-identification. Conservatives more than liberals emphasized
an ideal president's moral responsibilities, and they worried somewhat
more about standing up for the United States in foreign affairs and some
what less about solving economic problems, but elsefrjere idealized presi
dents of the left and the right coincided. (Had we asked more directly
about policy we would certainly have uncovered more disagreement.) Nor
did we find much variation by demographic characteristics. Southerners,
for instance, emphasized the same traits and behaviors in their presi
dential idealizations as did respondents from other regions. So it went
with young and old, and with men and women. {The few sex differences
that did show up conform to traditional sex-role stereotypes, with men
emphasizing strength and women according more importance to warmth, moral
ity, and developing good relations.)
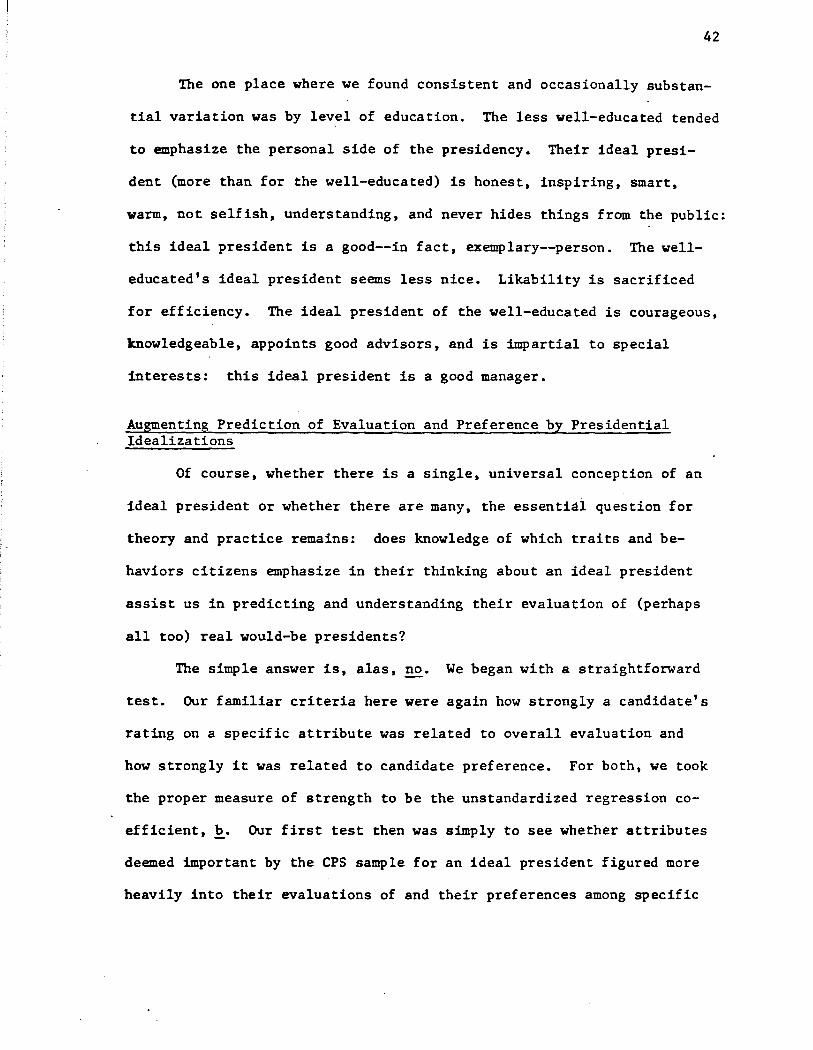
42
The one place where we found consistent and occasionally substan-
tial variation was by level of education. The less well-educated tended
to emphasize the personal side of the presidency. Their ideal presi-
dent (more than for the well-educated) is honest, inspiring, smart,
warm, not selfish, understanding, and never hides things from the public:
this ideal president is a good--in fact, exemplary--person. The well-
educated's ideal president seems less nice. Likability is sacrificed
for efficiency. The ideal president of the well-educated is courageous,
knowledgeable, appoints good advisors, and is impartial to special
interests: this ideal president is a good manager.
Augmenting Prediction of Evaluation and Preference by Presidential Idealizations
Of course, whether there is a single, universal conception of an
ideal president or whether there are many, the essential question for
theory and practice remains: does knowledge of which traits and be-
haviors citizens emphasize in their thinking about an ideal president
assist us in predicting and understanding their evaluation of (perhaps
all too) real would-be presidents?
The simple answer is, alas, ~· We began with a straightforward
test. Our familiar criteria here were again how strongly a candidate's
rating on a specific attribute was related to overall evaluation and
how strongly it was related to candidate preference. For both, we took
the proper measure of strength to be the unstandardized regression co-
efficient, b. Our first test then was simply to see whether attributes
deemed important by the CPS sample for an ideal president figured more
heavily into their evaluations of and their preferences among specific
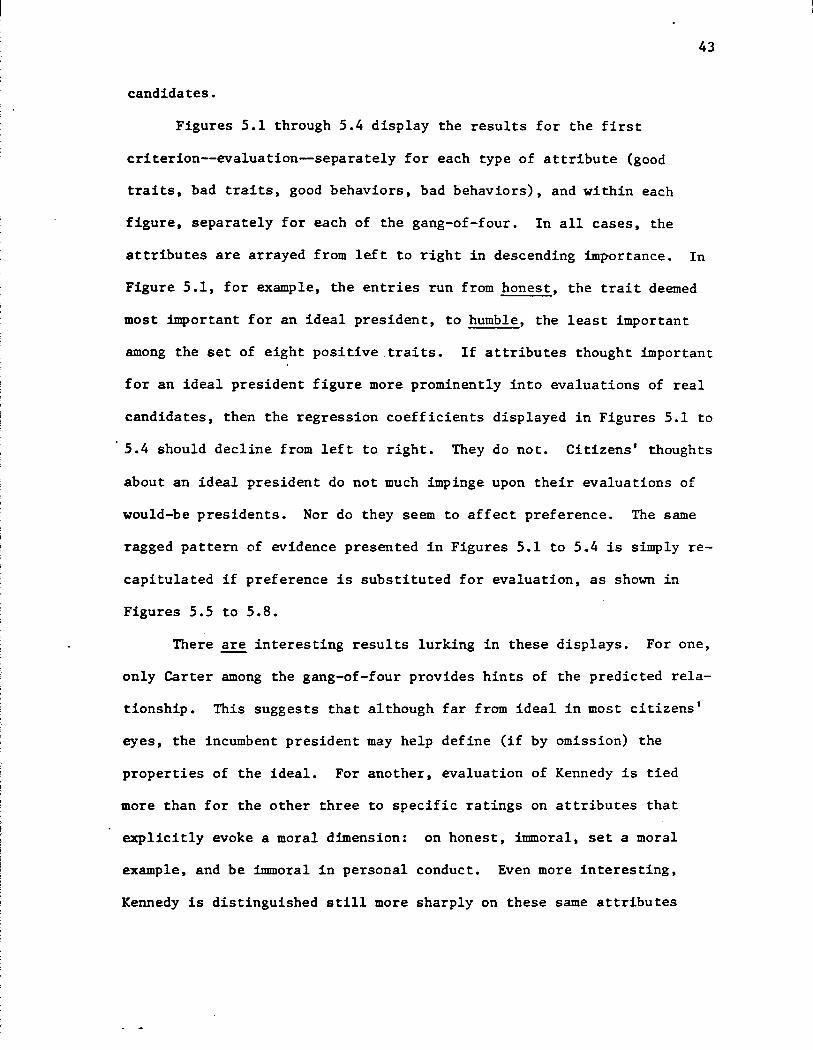
43
candidates.
Figures 5.1 through 5.4 display the results for the first
criterion--evaluation~separately for each type of attribute (good
traits, bad traits, good behaviors, bad behaviors), and within each
figure, separately for each of the gang-of-four. In all cases, the
attributes are arrayed from left to right in descending imp-ortance. In
Figure 5.1, for example, the entries run from honest, the trait deemed
most important for an ideal president, to humble, the least important
among the set of eight positive traits. If attributes thought important
for an ideal president figure more prominently into evaluations of real
candidates, then the regress1on coefficients displayed in Figures 5.1 to
5.4 should decline from left to right. They do not. Citizens' thoughts
about an ideal president do not much impinge upon their evaluations of
would-be presidents. Nor do they seem to affect preference. The same
ragged pattern of evidence presented in Figures 5.1 to 5.4 is simply re
capitulated if preference is substituted for evaluation, as shown in
Figures 5.5 to 5.8.
There ~ interesting results lurking in these displays. For one,
only Carter among the gang-of-four provides hints of the predicted rela
tionship. This suggests that although far from ideal in most citizens'
eyes, the incumbent president may help define (if by omission) the
properties of the ideal. For another, evaluation of Kennedy is tied
more than for the other three to specific ratings on attributes that
explicitly evoke a moral dimension: on honest, immoral, set a moral
example, and be immoral in personal conduct. Even more interesting,
Kennedy is distinguished still more sharply on these same attributes
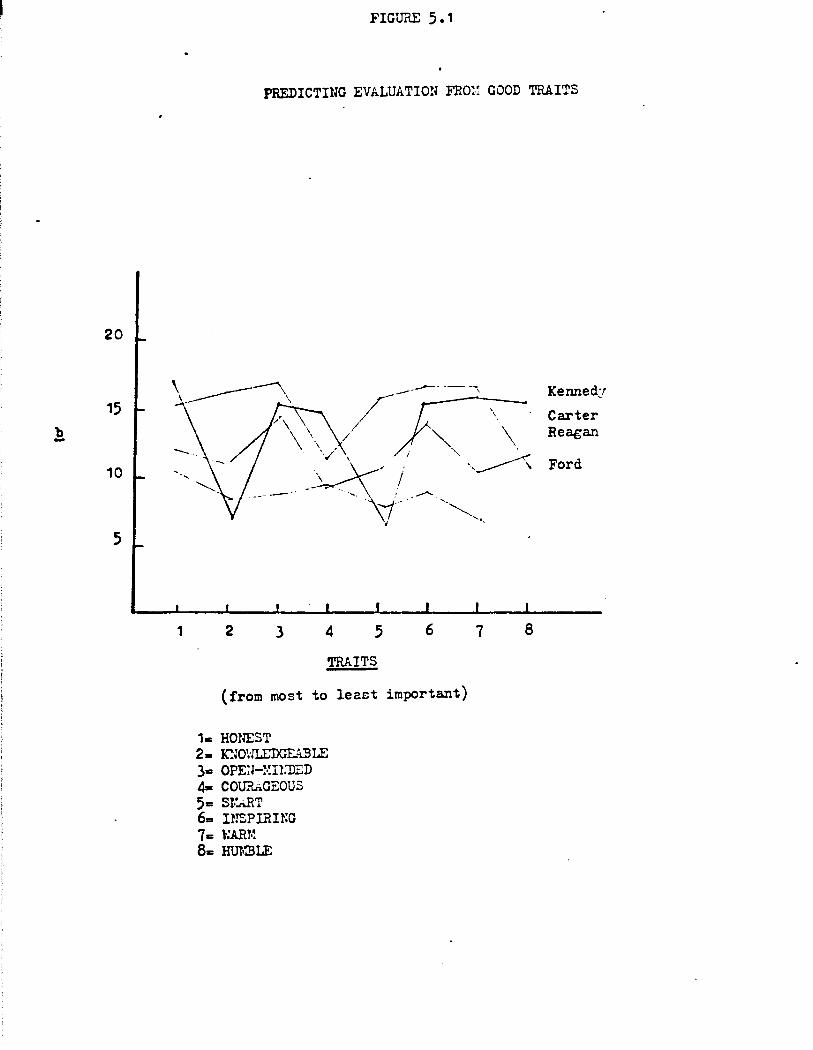
20
15
10
5
1
FIGURE 5.1
PREDICTING EVALUATION FRO!~ GOOD TRAITS
2 3 4 5 6
TRAITS
(from most to leact important)
1= HONEST 2= ICmHLEDGE.~LE 3• OPE;l-!Gl:DED 4- COURAGEOUS 5= sr.~T 6- n~SPIRn:a 7= \-:AR?·! 8 .. HU?·:BLE
7 8
Kenned:r
Carter Reagan
Ford
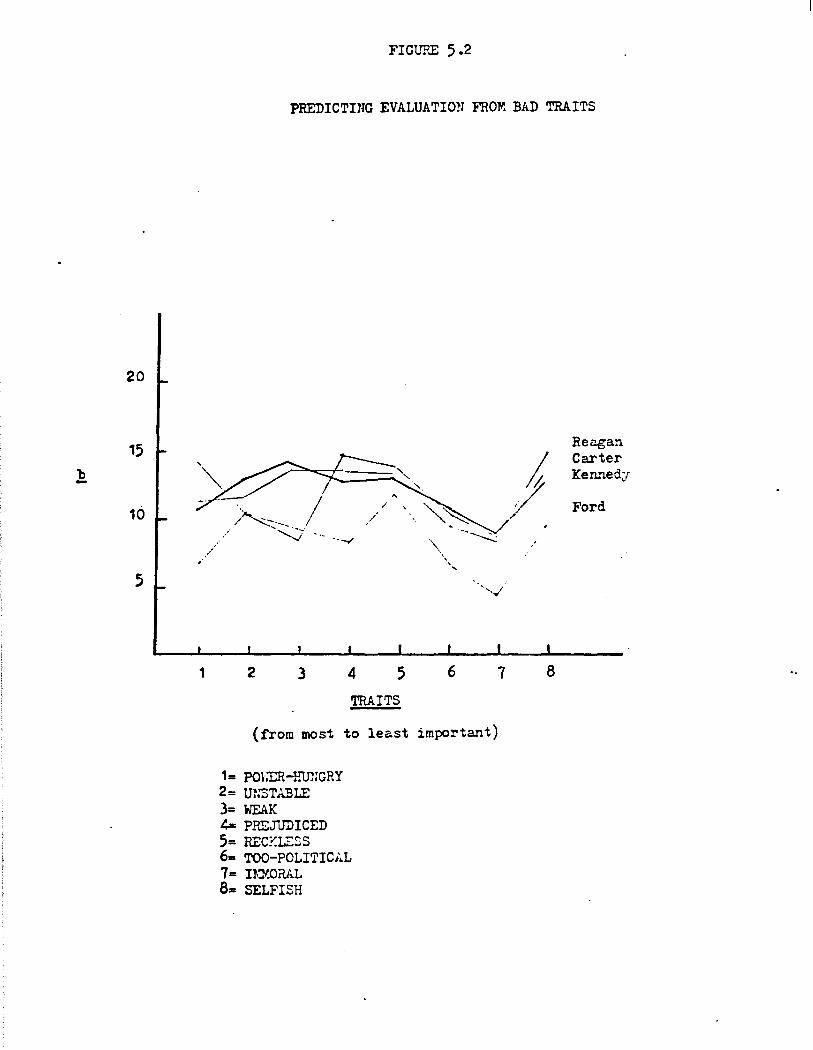
20
15
10
.-5
1
FIGURE 5.2
PREDICTI?JG EVALUATION FROM BAD TRAITS
·.,, I . ..,.
2 3 4 5 6 7
TRAITS
(from most to least important)
1= PO\:ER-mmGRY 2= m:ST.ABLE 3= WEAK ~ PREJUDICED 5= RECY.LESS 6. TOO-POLITIChL 7= UJl.ORAL 8= SELFISH
/
8
Reagan Carter Kennedy
Ford
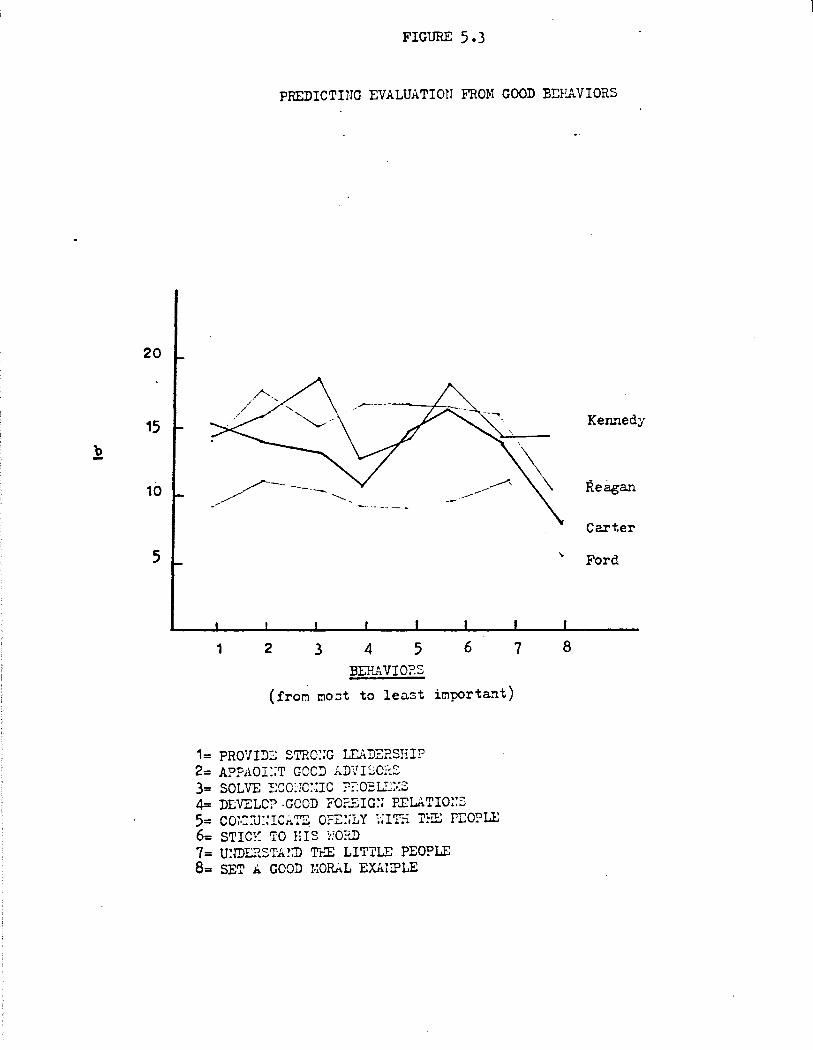
20
15
10
5
FIGURE 5.3
PREDICTDrG EVALUATIO!I FROM GOOD BI;P..AVIORS
_,/"""-- --/ - ............ _,
1 2 3 4 5 6 BEP.AVIo;:s
(fron ~o3t to lea3t important)
1= PRO'IIDE STRO::G IDi.DE?.SEIP 2= APPAOI::T GOCD J:..DVISO~:..s 3= SOLVE i;co::;c:.ac ?:::o::=u::~s 4= DEVELC? -GOOD FO?.EIG:; P.IU TIO::s 5 Co.~"-·!T". rn'T"' oi:~··1y . ·rrrr:· ...,._,""t., p~onLE = J1- .. U ... ,..\J.t'.l...:.. • ~-• ~-, J.l'l .i • ......, ~L ..
6= STIC!-~ TO HIS ~JO?J) 7= U~IDERSTA?:D TEE LIT1'LE PEOPLE 8= SET A GOOD !WR.AL EXli!:PLE
Kennedy
Reagan
Carter
Ford
7 8
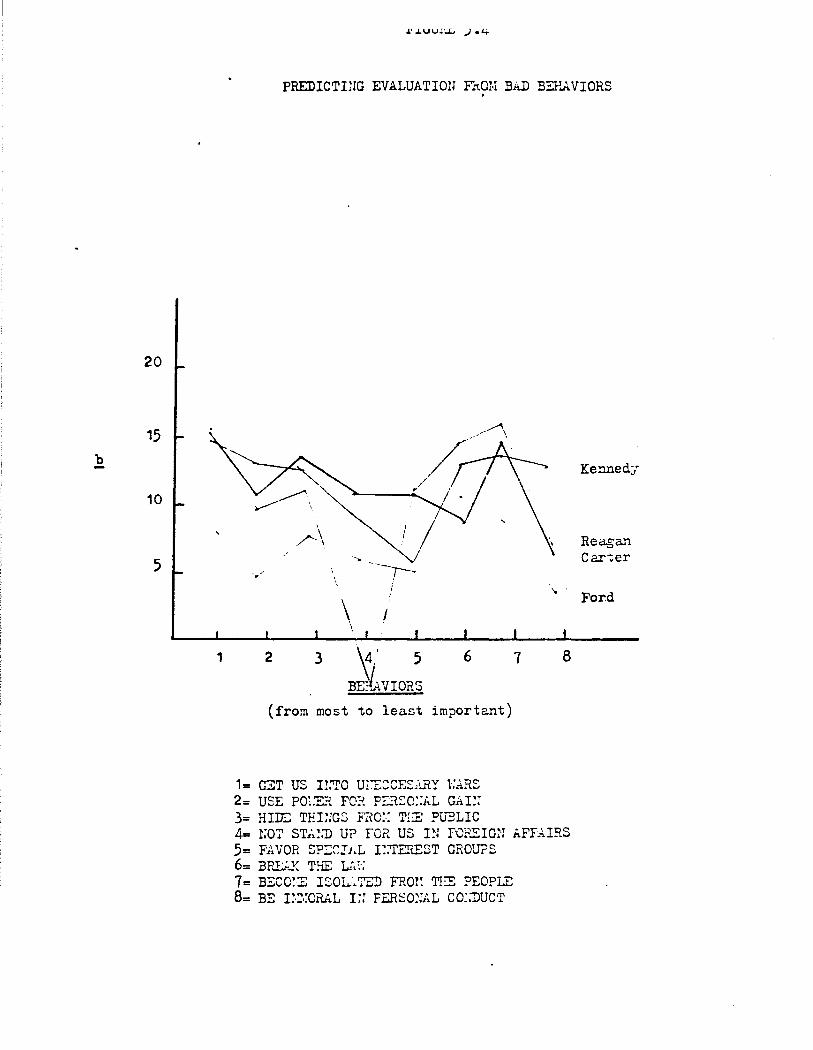
20
15 b -
10
5
1
PREDICTDIG EVALUATIOlI F'.rtO!-i BAD BEF.AVIORS .
r\ -- -----r---
/
\ I \
2 3 ~: 5 6
BE~VIORS (from most to least important)
1= GET US I!:TO UI::ECCES.:"!.RY 1·:.ARS 2= USE po:.'E?. FO~ PDSO::J..L G..ii.I~r 3= HIIT.:: TEI::GS mo:.: TEE Pu3LIC
7 8
4= i;oT STJ..!·:n U? re?. us I~: f'OREimr AFF.U~S 5= F:A VOR SPI::":JJ.L I::TEftEST GROWS 6= :BP.E.r'.-.K T!IB L:'~~·; 7 = BECO::S ISOh .. r:LD FRO?~ TES PEOPLE 8: BE r:.::mRJ..L r:: FER~o::-;;.1 co::DUCT
Kennedy
Reagan C ar"ter
Ford
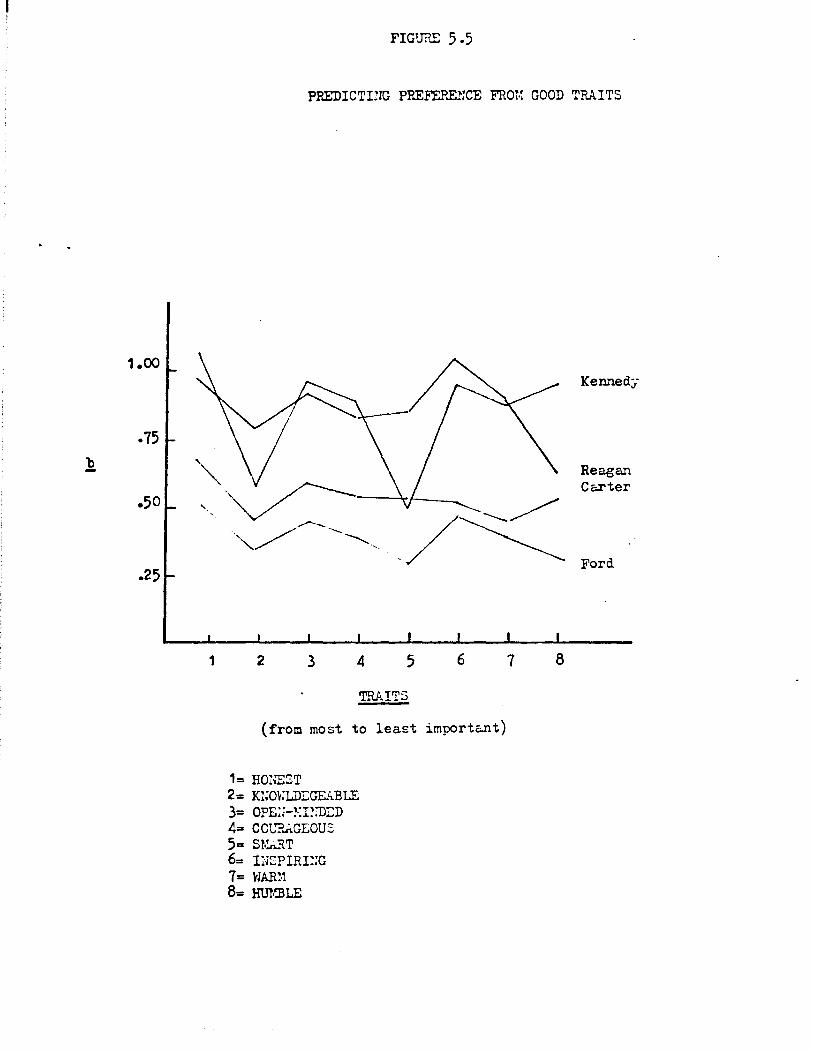
1.00
.75
la
.50
.25
1
FIGU?.E 5 .5
PREDICTIHG PREFEP.E?:CE FRQ!.~ GOOD TRAITS
·,. /~
2 3 4 5 6
TRAITS
(from most to least important)
1= HONEST 2= K!iOKLDI:GEABLE 3= OPE:!-~:n:m:D 4= CO'L?.ii.GEOUS 5= S?·~'t\T 6= INSPIRI~:G 7= WAR~·! 8= HU'?f.BLE
7 8
Kennedy
Reagan Cc.rter
Ford
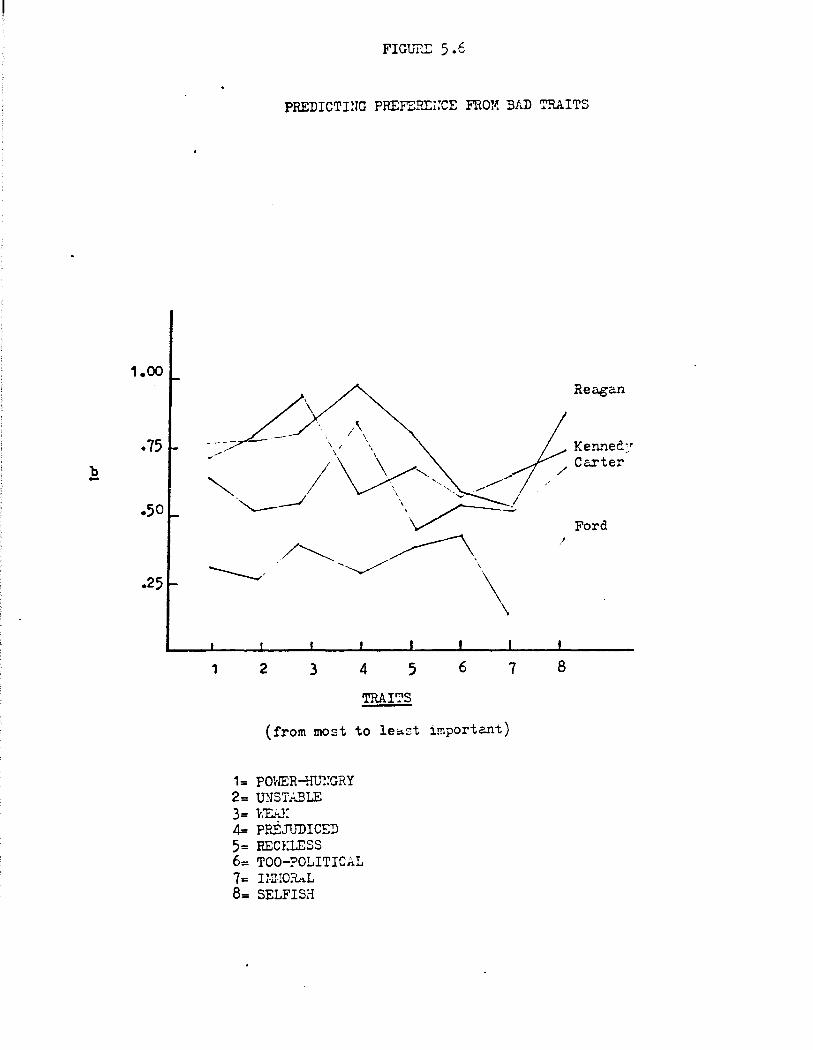
1.00
.75
.25
1
FI GUI'-.I: 5 • 6
PREDICTI!lG PREFEPJ::L;CE FRO!'. BAD TRAITS
2 3 4 5 6
TRAI':'S
(from most to le~st important)
1= POWER-HU!:GRY 2= UNSTABLE 3= viEAJ: 4= PPi:JtIDICED 5= RECl:LESS 6: TOO-POLITICrtL 7= Immru.1 8= SELFISH
7
Reagan
Kenned~·
/ Carter
Ford /
8
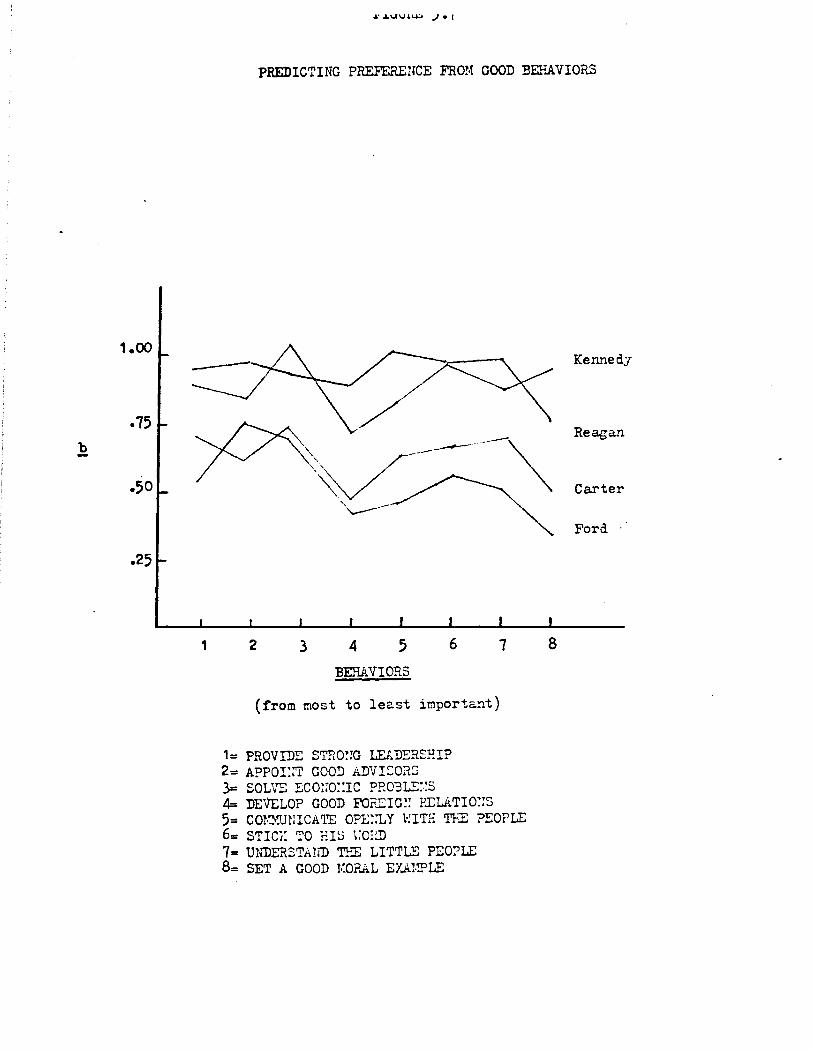
1.00
.75 b -
.25
1
PREDICTING PREFERE!lCE FROM GOOD BEF.AVIORS
2 3 4 5 6
BEHAVIORS
(from most to least important)
1= PROVIDE STRO:IG LEP.DERSP.IP 2= A?POI::T GOO:!) ADVISORS 3= SOLVE ECO~ro::rc PP..03LE::s 4= DE\l'ELO? GOOD FO?.EIG~~ P.EL.ATIO::s
7
5= cm~mt:ICATE OPE::LY \·:ITH TEE PEOPLE 6: STIC!: ~O HIS 1:0;~ 7= Ur.i'DERSTAHD Tl-:E LITTLE PEO?LE 8,,,, SET A GOOD y.:onA.L EY.A!·'!PLE
Kennedy
Reagan
Carter
Ford ··
8
44
when it comes to preference. But all this has little to do with the
major business of this section, which is to ascertain whether presiden
tial idealizations generally influence judgments about various would-be
presidents. On this matter, our first results are discouraging:l?our
second test was to compare the collective predictability of evaluation
and preference achieved by those attributes deemed important for an ideal
president versus the collective predictability achieved by comparatively
unimpJrtant attributes. The results are presented in Table 5.2, again
separately for each of the gang-of-four. Reading across the Table, the
findings represent a remarkable corroboration of the null hypothesis.
Evaluation of Kennedy, for example, is predicted just as well by the 16
attributes thought least important for an ideal president (included as
separate predictors in a regression analysis) as by the 16 most important:
R2 = .51 vs •• 52. And so on for each of the four candidates, for evalua-
tion and preference alike.
Our third and perhaps more lenient test follows the form of its im
mediate predecessor, except that now the comparison is drawn between the
predictability produced by the eight most important and that produced by
the eight least important attributes (thereby excluding the problematic
intermediate group). This analysis, summarized in Table 5.3, offers the
first bright spot in an otherwise morbid tale. Kennedy aside, evaluation
was indeed predicted better by the eight most important attributes (again,
traits and behaviors both) than by the eight attributes thought rela
tively unimportant for an ideal president. These small differences also
held for preference, as is also shown in Table 5.3, with Kennedy again
the exception.
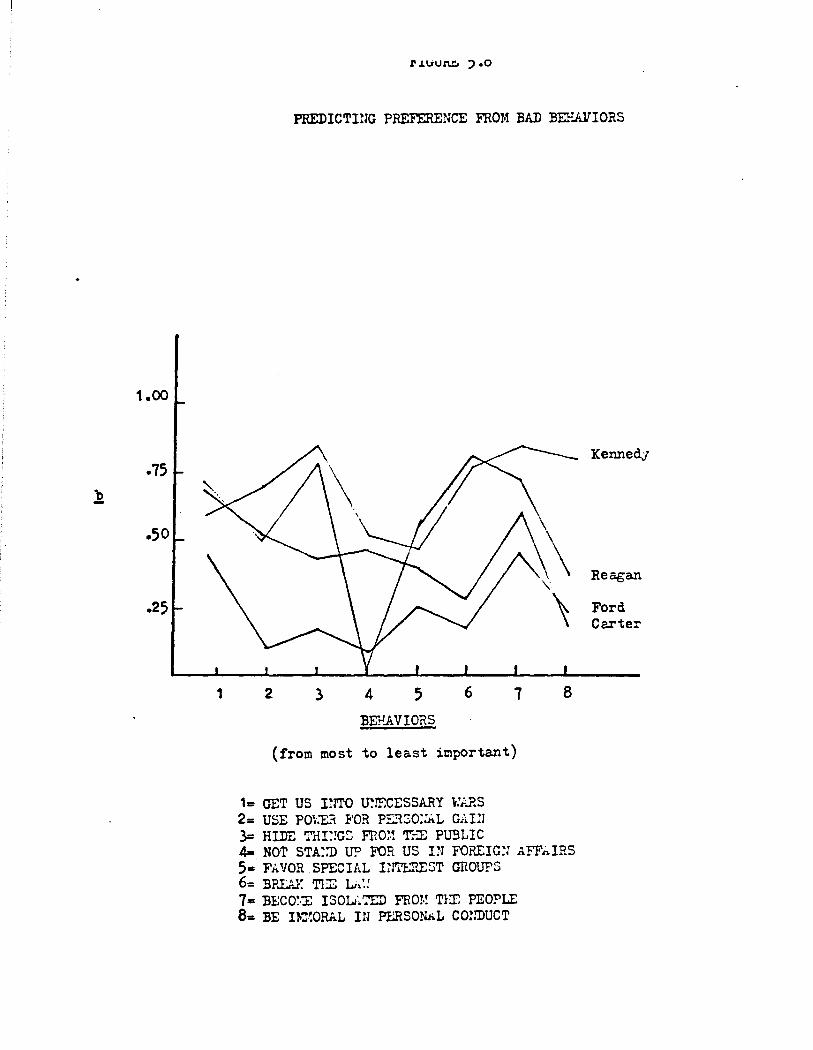
1.00
.75
l?.
.50
.25
1
rJ.VU:U:. JoO
PREDICTIUG PREFERENCE FROM BAD BEP.AVIORS
2 3 4 5 6 7
BE!-1.AVIORS
(from most to least important)
1 = GET us 11rro U~!ECESSARY r.'ARS 2= USE Pm:E..~ F'OR P~'1SO::~L GAI!l 3= HIDE THI:!GS rno:.~ T:-::E PU3LIC
8
4= NO'!' STA~:D U? FOR US I~! FOREIG:l AFF.t.IRS 5= FAVOR SPECIAL r;rn:P.EST GROUPS 6= BID:rJ: TEE L;.:: 7 = BLCO~·".E ISOLi~ ':'ED FRQ!.~ TEE PEOPLE 8= BE !?>:!~ORAL Ill PERSONAL CO!:I>UCT
Kenned.!
Reagan
Ford Carter
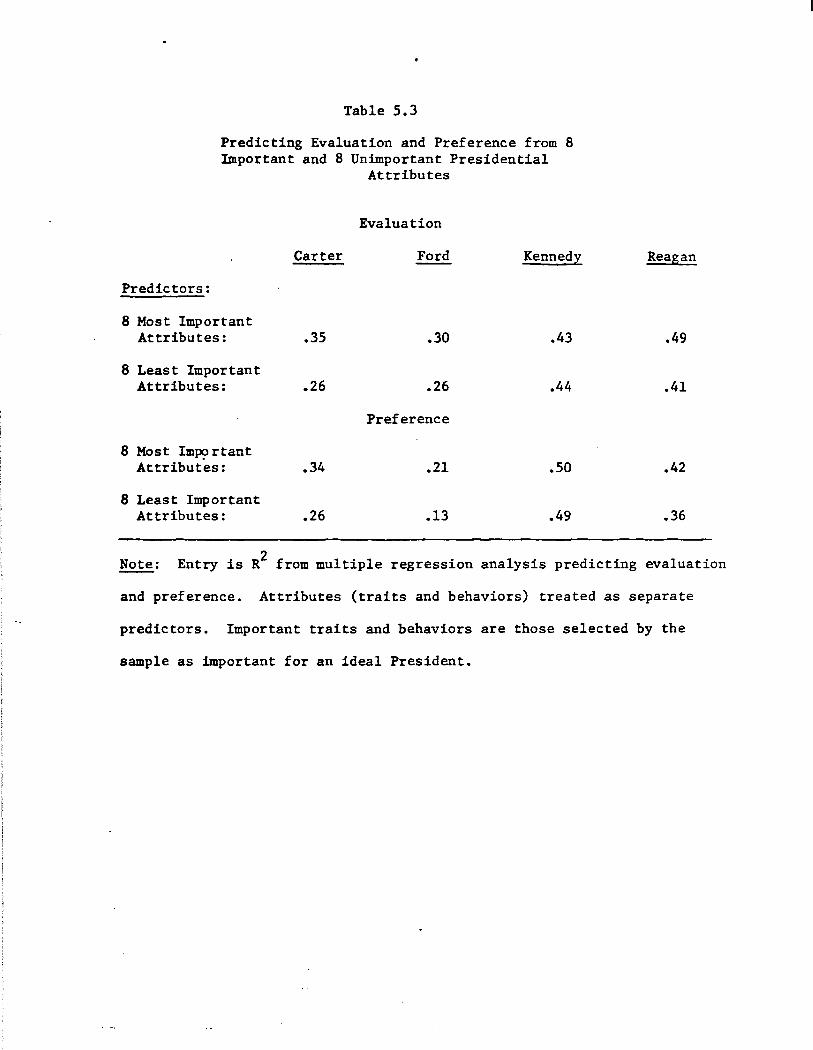
Table 5.3
Predicting Evaluation and Preference from 8 Important and 8 Unimportant Presidential
Attributes
Evaluation
Carter Ford Kennedy Reagan
Predictors:
8 Most Important Attributes: .35 .30 .43 .49
8 Least Important Attributes: .26 .26 .44 .41
Preference
8 Most Im?,? rtant Attributes: .34 .21 .so .42
8 Least Important Attributes: .26 .13 .49 .36
Note: Entry is R2 from multiple regression analysis predicting evaluation
and preference. Attributes (traits and behaviors) treated as separate
predictors. Important traits and behaviors are those selected by the
sample as important for an ideal President.
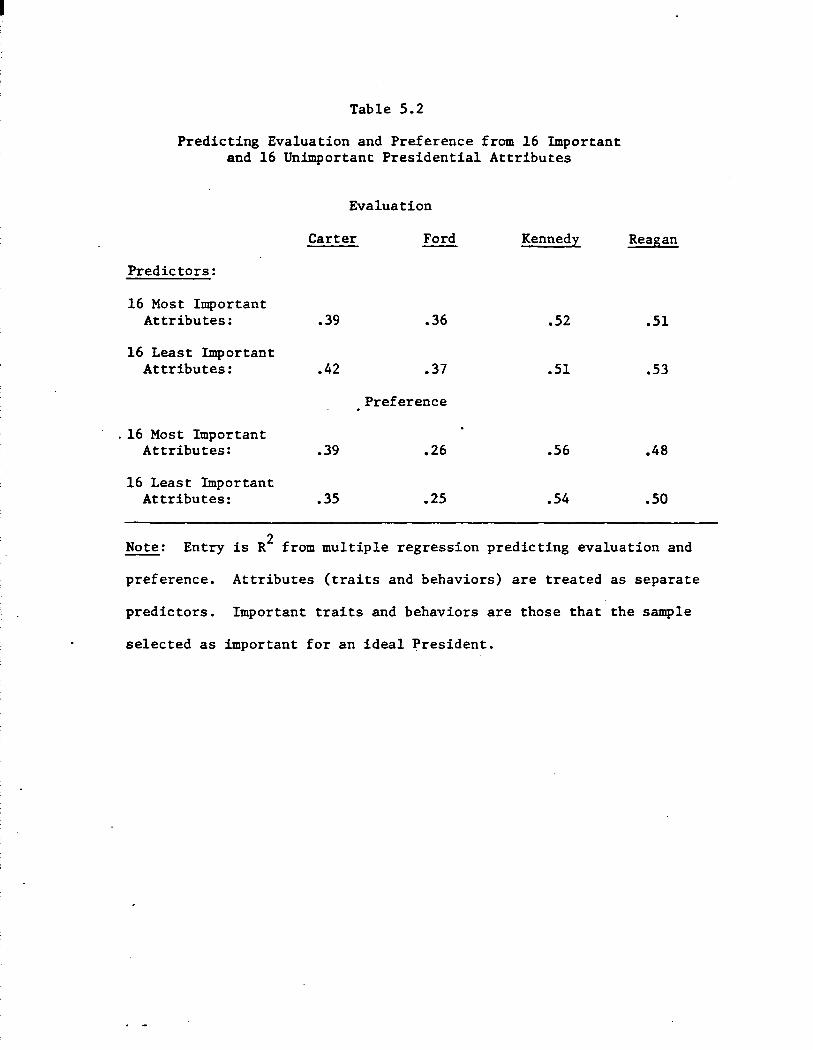
I
Table 5.2
Predicting Evaluation and Preference from 16 Important and 16 Unimportant Presidential Attributes
Evaluation
Carter Ford Kennedy
Predictors:
16 Most Important Attributes: .39 .36 .52
16 Least Important Attributes: .42 .37 .51
Preference
. 16 Most Important Attributes: .39 .26 .56
16 Least Important Attributes: .35 .25 .54
Reagan
.51
.53
.48
.so
Note: Entry is R2 from multiple regression predicting evaluation and
preference. Attributes (traits and behaviors) are treated as separate
predictors. Important traits and behaviors are those that the sample
selected as important for an ideal ~resident.
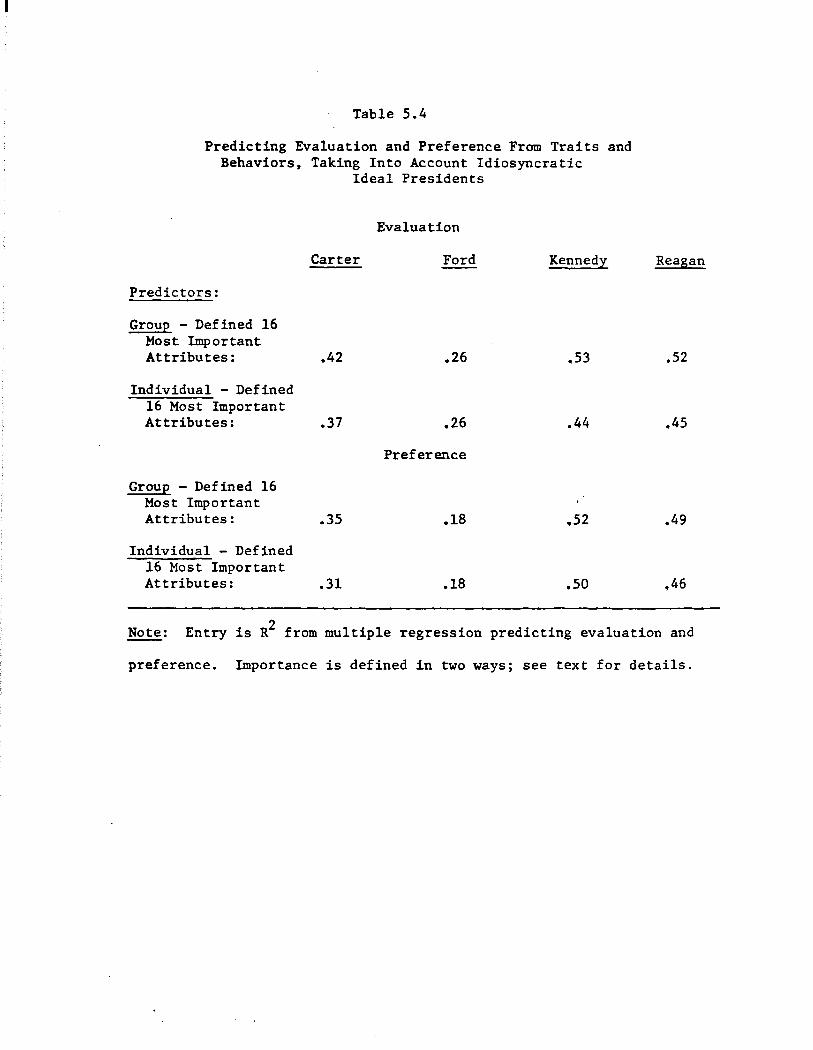
Table 5 .4
Predicting Evaluation and Preference From Traits and Behaviors, Taking Into Account Idiosyncratic
Predictors:
Group - Defined 16 Most Important Attributes:
Individual - Defined 16 Most Important Attributes:
Group - Defined 16 Most Important Attributes:
Individual - Defined 16 Most Important Attributes:
Ideal Presidents
Evaluation
Carter Ford
.42 .26
.37 .26
Preference
.35 .18
.31 .18
Kennedy
.53
.44
.52
.so
Reagan
.52
.45
.49
,46
Note: Entry is R2 from multiple regression predicting evaluation and
preference. Importance is defined in two ways; see text for details.
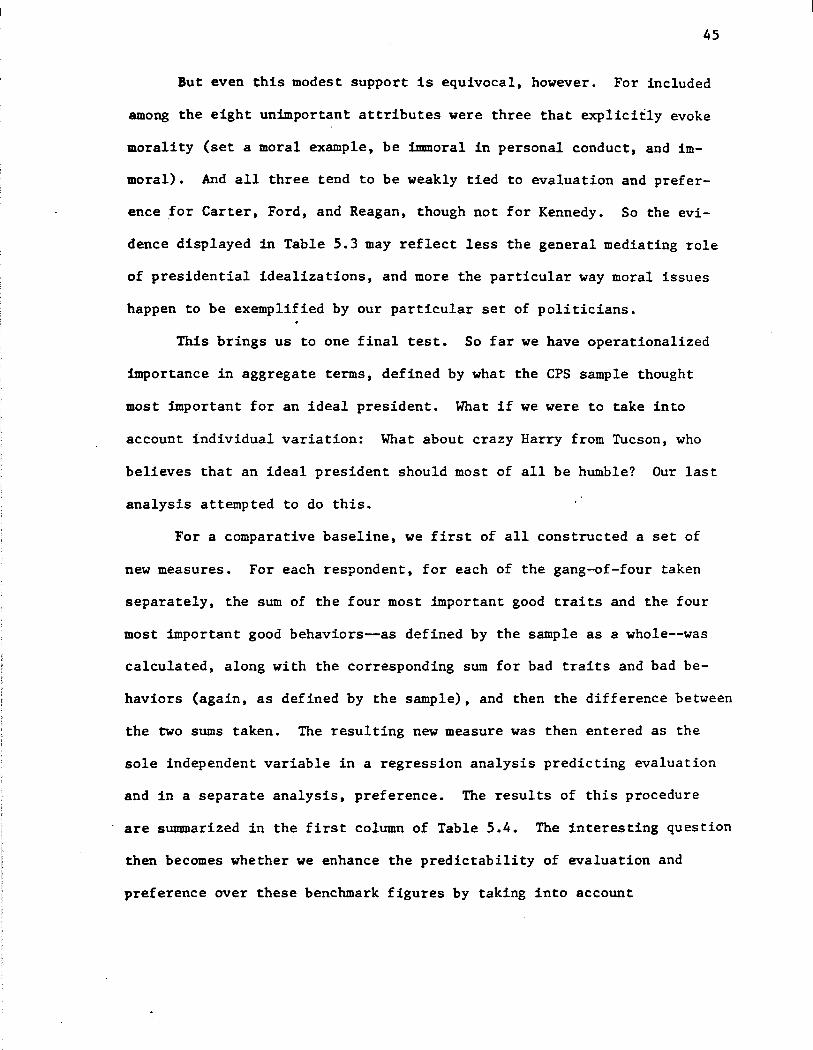
45
But even this modest support is equivocal, however. For included
among the eight unimportant attributes were three that explicitly evoke
morality (set a moral example, be immoral in personal conduct, and im
moral). And all three tend to be weakly tied to evaluation and prefer
ence for Carter, Ford, and Reagan, though not for Kennedy. So the evi
dence displayed in Table 5.3 may reflect less the general mediating role
of presidential idealizations, and more the particular way moral issues
happen to be exemplified by our particular set of politicians.
This brings us to one final test. So far we have operationalized
importance in aggregate terms, defined by what the CPS sample thought
most important for an ideal president. What if we were to take into
account individual variation: What about crazy Harry from Tucson, who
believes that an ideal president should most of all be humble? Our last
analysis attempted to do this.
For a comparative baseline, we first of all constructed a set of
new measures. For each respondent, for each of the gang-of-four taken
separately, the sum of the four most important good traits and the four
most important good behaviors~as defined by the sample as a whole--was
calculated, along with the corresponding sum for bad traits and bad be
haviors (again, as defined by the sample), and then the difference between
the two sums taken. The resulting new measure was then entered as the
sole independent variable in a regression analysis predicting evaluation
and in a separate analysis, preference. The results of this procedure
are sununarized in the first column of Table 5.4. The interesting question
then becomes whether we enhance the predictability of evaluation and
preference over these benchmark figures by taking into account
46
individualized conceptions of the ideal president. New measures are
needed here, too, but this time in a way that tailors them to individual
idiosyncracy. For each respondent, the sum over the eight good traits
and behaviors was taken, this time selecting only those attributes that
the individual respondent had identified as important for the ideal pres-
ident. Then this measure was included as the sole predictor variable in
a separate regression analysis. As shown in column 2 of Table 5.4, tak-
ing into account individualized conceptions of the ideal president re-
sulted in a consistent decrement in the prediction of both evaluation
and preference.
Autopsy
Collectively, this evidence certainly undermines our enthusiasm
for the ideal president inventory. We are less certain about why it
failed. Perhaps the attributes that make up the inventory are all very
important, so that differences between them are trivial. Perhaps ratings
of candidates on specific attributes a~ready incorporate importance, I tw\ , ori?i I\ CJ
thereby subverting our efforts to assesshindependently in terms of an
ideal president. (From evidence not presented here this seems unlikely.)
Perhaps people lack the capacity to discern those attributes that are in
fact important in shaping their judgments of would-be presidents. What-
ever the underlying causes, our recommendation is clear: the ideal presi-
dent inventory should not be included in the 1980 study.
- 6. "Spontaneous" impressions of leaders
We have so far described several fixed-format, close-ended strate-
gies for assessing citizens' impressions of political leaders. We also
47
remain in principle strong advocates of relatively unconstrained ques-
tions about candidates--to allow citizens to describe candidates in their
own terms. Information important to peoples' impressions of leaders not
covered in our close-ended instrumentation will surely emerge in such
replies. Moreover, open-ended questions are uniquely suited to provide
material for inquiries into the structure of information that underlies
candidate evaluation and how this changes over the course of the campaign.
Although we strongly support in principle the importance of col-\
lecting free-response remarks about the candidates, we harbored several
reservations about current CPS practice in this regard. Candidate
evaluation has often been measured by indexes built upon replies to the
standard ·open-ended questions. Such indexes almost certainly reflect
well the voter's evaluation of a candidate. But beyond evaluation, and
that is what is at issue here, it is not obvious what the open-ended
questions are measuring. One interpretation is to accept the questions
at face value--that they in fact identify voters' reasons for their evalua-
tions. At least two other interpretations of these replies may have
greater psychological plausibility, however.
The first takes voters' replies mainly as convenient rationaliza-
tions for evaluations arrived at largely on other grounds. From this per-
spective, replies to the open-ended questions are less reasons that pre-
cede evaluation than they are rationalizations that follow evaluation.
A second interpretation also challenges whether the open-ended
questions tap voters' reasons for their evaluations, but from a different
theoretical perspective, that articulated recently by Nisbett and Wilson
(1977). They argue that people have severely restricted introspective
48
access to their own decision making processes (though not to the deci
sins themselves). At the same time, people believe that they possess
such access, and are therefore altogether willing to report {often in
valid) explanations for their decisions. According to this interpreta
tion, then, voters' answers to the open-ended questions may be revealing
not ~f the factors that actually figured into their evaluations, but of
widely-shared and highly available explanations for candidate evalua
tion (what Nisbett and Wilson call "a apriori causal theories").
The general point here is that responses to the open-ended ques
tions are interpretable from several competing perspectives. We are
not suggesting that the open~ended questions do not measure well voters'
evaluations of the candidates (though there may be more efficient ways
to do this). Rather the question is: how should the qualitative nature
of the replies be understood?
To help resolve this question, we included in the New Haven survey
four different versions of open-ended questions, randomly assigned to
respondents. Each respondent received just one form, directed toward
Carter, Ford, Reagan, and Kennedy in turn. Form I represented our slight
adaptation of the standard CPS question; Form II framed the open-ended
question in a political way, but without encouraging rationalization;
Form III put the question in explicitly personal tenns; Form IV went
further in this direction, placing the question in an explicitly personal
and concrete context.
The way in which the open-ended questions were asked did indeed in
fluence replies. For example, politicians were much more likely to be
described as warm or as cold when they were thought about in a concrete,
49
personal context (Form IV). Decency and immorality became much more
prominent when respondents were asked to think about Jimmy Carter (and
the others) as a person. Other differences emerged but these examples
make the general point: The qualitative character of leader impressions
is a function partly of how the impressions are elicited.
To explore such differences further, three forms of the open-ended
question were included in the spring survey: the standard question
(slightly modified for a non-campaign context), which we think invites
rationalization; a question that asked respondents for their impressions
about candidate X as a person; and a third question that required re
spondents to describe what candidate X would be like in person at an in
formal neighborhood gathering. (These questions are presented in full in
Appendix A.) The standard question was administered to half-sample A
respondents, who were asked about Carter and Ford during the first inter
view and Kennedy and Reagan during the second. Half-sample B respondents
were also asked about Carter and Ford during their first interview, but in
terms of the in person question. In the second interview they were then
asked about their impressions of Kennedy and then Reagan as people.
This design obviously necessitates drawing comparisons between re
sponses offered by the two half-samples. It is therefore imperative that
the two are comparable in other respects. Fortunately, they seem to be:
On demographic characteristics, and on political predispositions, the two
samples are indistinguishable. Thus any differences in the responses to
the various open-ended questions can confidently be attributed to variation
in question format.
Two criteria are appropriate in assessing differences between the
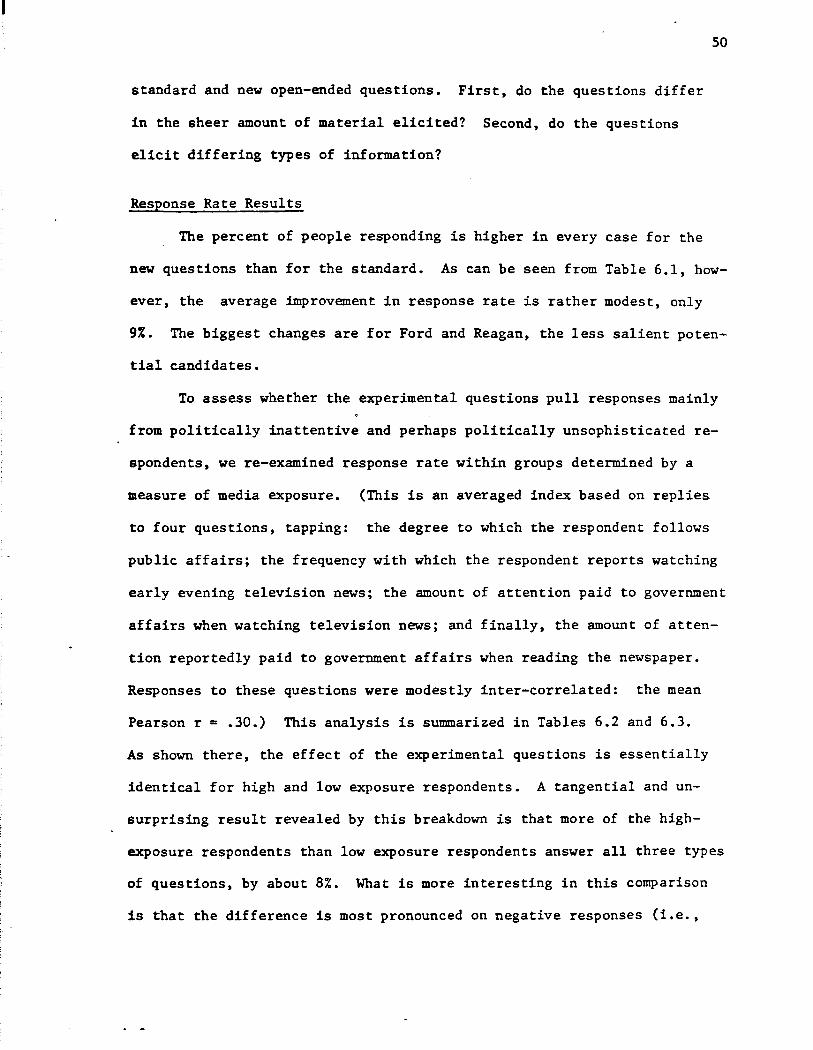
standard and new open-ended questions. First, do the questions differ
in the sheer amount of material elicited? Second, do the questions
elicit differing types of information?
Response Rate Results
50
The percent of people responding is higher in every case for the
new questions than for the standard. As can be seen from Table 6.1, how
ever, the average improvement in response rate is rather modest, only
9%. The biggest changes are for Ford and Reagan, the less salient poten
tial candidates.
To assess whether the experimental questions pull responses mainly
from politically inattentive and perhaps politically unsophisticated re
spondents, we re-examined response rate within groups determined by a
measure of media exposure. (This is an averaged index based on replies
to four questions, tapping: the degree to which the respondent follows
public affairs; the frequency with which the respondent reports watching
early evening television news; the amount of attention paid to government
affairs when watching television news; and finally, the amount of atten
tion reportedly paid to government affairs when reading the newspaper.
Responses to these questions were modestly inter-correlated: the mean
Pearson r = .30.) This analysis is summarized in Tables 6.2 and 6.3.
As shown there, the effect of the experimental questions is essentially
identical for high and low exposure respondents. A tangential and un
surprising result revealed by this breakdown is that more of the high
exposure respondents than low exposure respondents answer all three types
of questions, by about 8%. What is more interesting in this comparison
is that the difference is most pronounced on negative responses (i.e.,
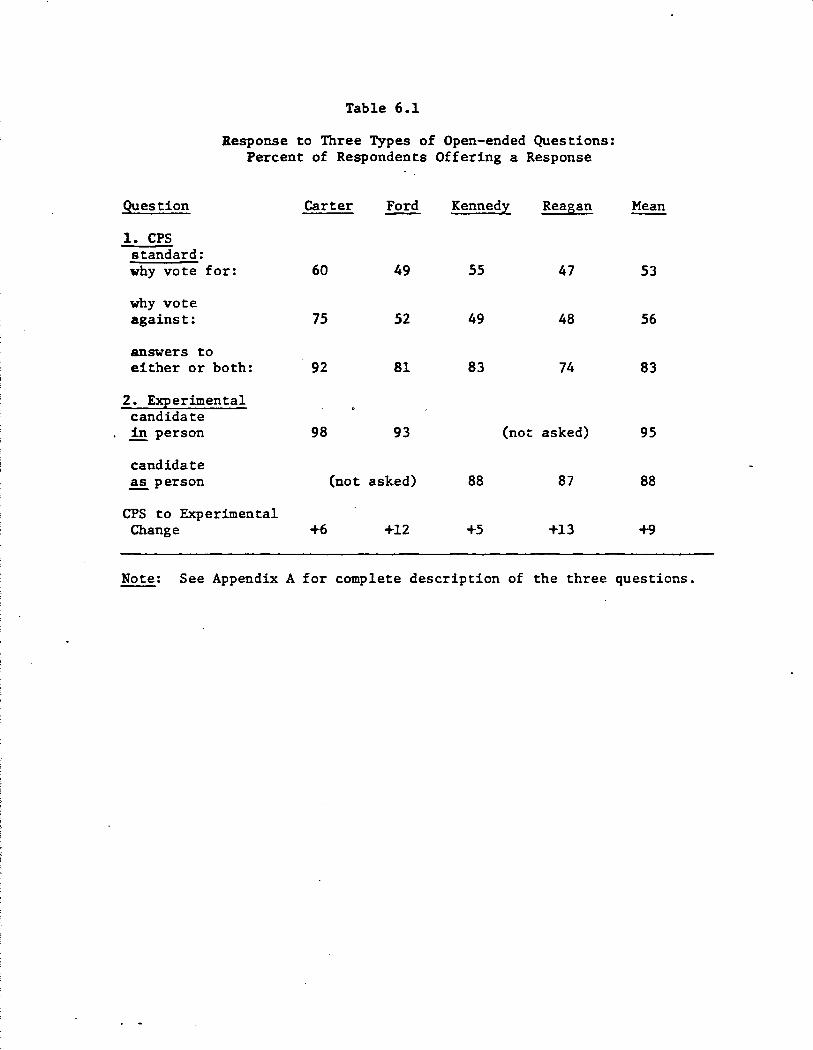
Table 6.1
Response to Three Types of Open-ended Questions: Percent of Respondents Offering a Response
Question Carter Ford Kennedy Reagan Mean
1. CPS standard: why vote for: 60 49 55 47 53
why vote against: 75 52 49 48 56
answers to either or both: 92 81 83 74 83
2. Experimental candidate in person 98 93 (not asked) 95
candidate ~person (not asked) 88 87 88
CPS to Experimental Change +6 +12 +5 +13 +9
Note: See Appendix A for complete description of the three questions.
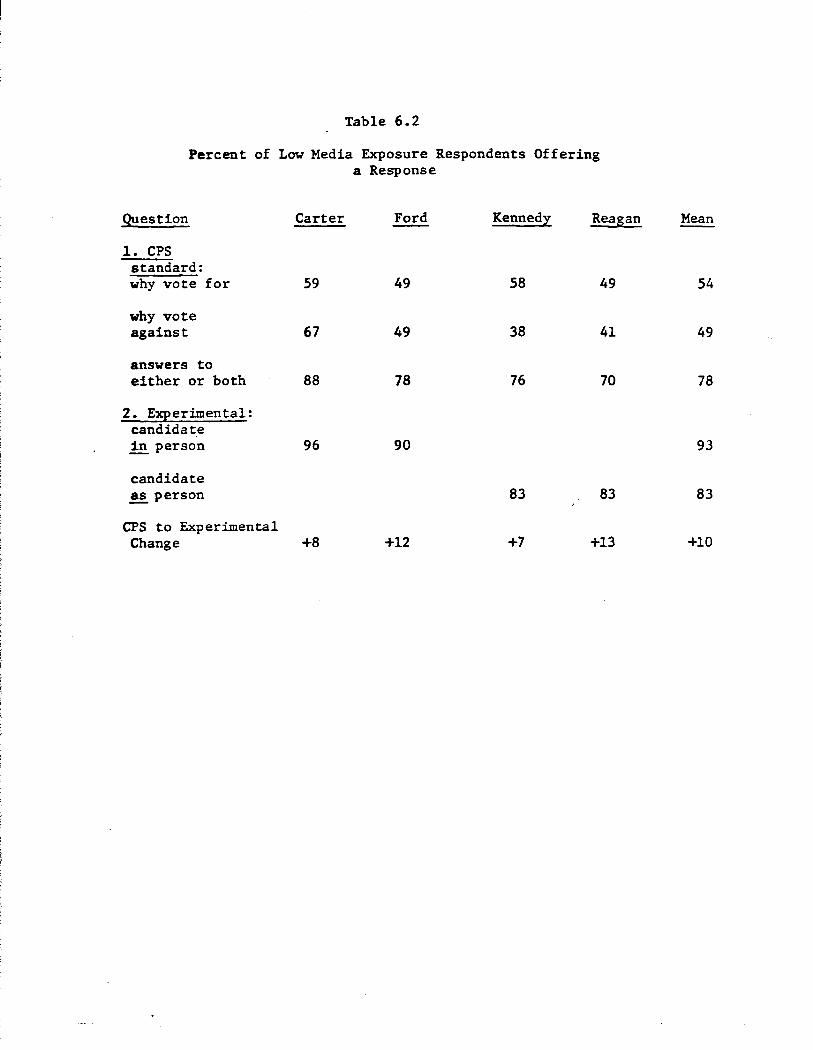
Table 6.2
Percent of Low Media Exposure Respondents Offering a Response
Question Carter Ford Kennedy Reagan Mean
1. CPS standard: why vote for 59 49 58 49 54
why vote against 67 49 38 41 49
answers to either or both 88 78 76 70 78
2. Experimental: candidate in person 96 90 93
candidate ~person 83 83 83
CPS to Experimental Change +8 +12 +7 +13 +10
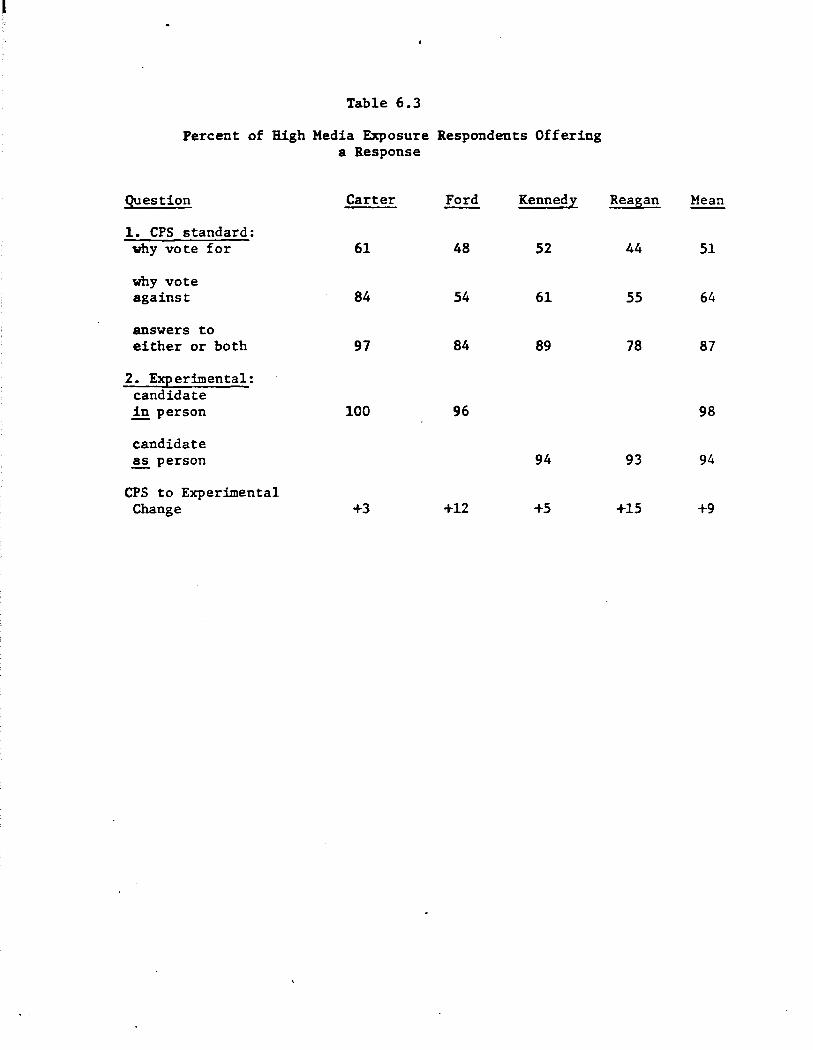
Table 6.3
Percent of High Media Exposure Respondents Offering a Response
Question Carter Ford Kennedy Reagan Mean
1. CPS standard: why vote for 61 48 52 44 51
why vote against 84 54 61 55 64
answers to either or both 97 84 89 78 87
2. Experimental: candidate in person 100 96 98
candidate _!2. person 94 93 94
CPS to Experimental Change +3 +12 +5 +15 +9
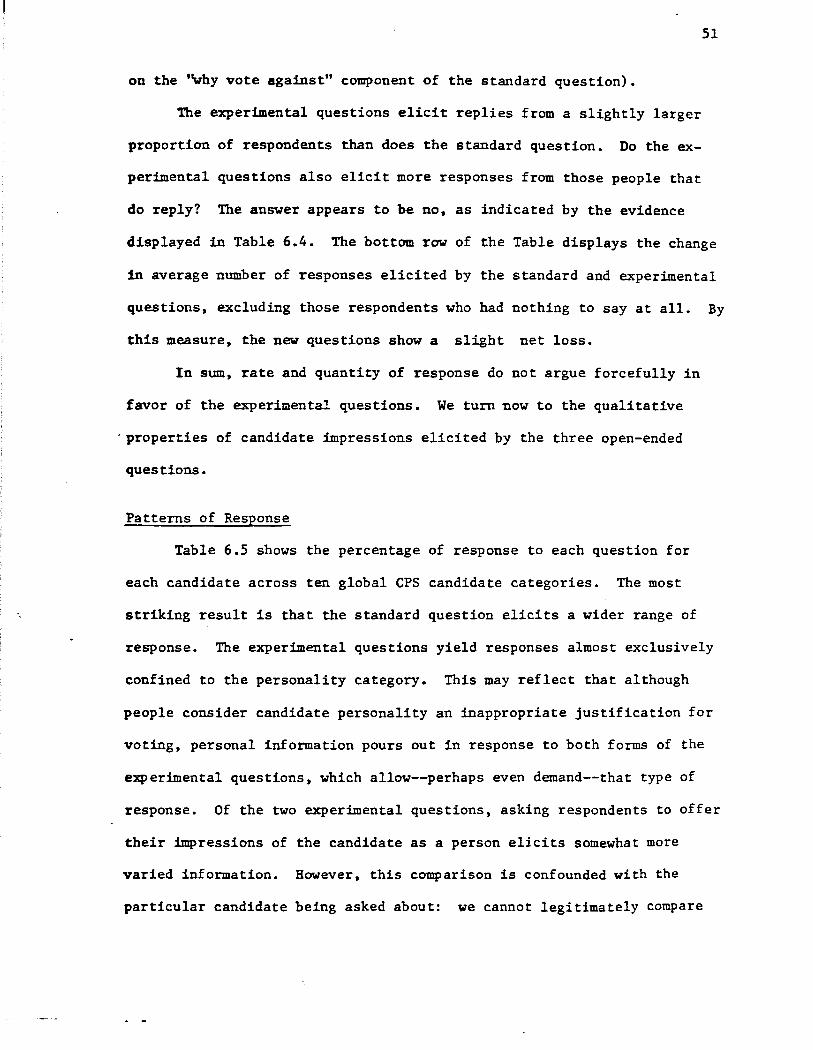
51
on the 'why vote against" component of the standard question).
The experimental questions elicit replies from a slightly larger
proportion of respondents than does the standard question. Do the ex
perimental questions also elicit more responses from those people that
do reply? The answer appears to be no, as indicated by the evidence
displayed in Table 6.4. The bottom row of the Table displays the change
in average number of responses elicited by the standard and experimental
questions, excluding those respondents who had nothing to say at all. By
this measure, the new questions show a slight net loss.
In sum, rate and quantity of response do not argue forcefully in
favor of the experimental questions. We turn now to the qualitative
· properties of candidate impressions elicited by the three open-ended
questions.
Patterns of Response
Table 6.5 shows the percentage of response to each question for
each candidate across ten global CPS candidate categories. The most
striking result is that the standard question elicits a wider range of
response. The experimental questions yield responses almost exclusively
confined to the personality category. This may reflect that although
people consider candidate personality an inappropriate justification for
voting, personal information pours out in response to both forms of the
experimental questions, which allow--perhaps even demand--that type of
response. Of the two experimental questions, asking respondents to offer
their impressions of the candidate as a person elicits somewhat more
varied information. However, this comparison is confounded with the
particular candidate being asked about: we cannot legitimately compare
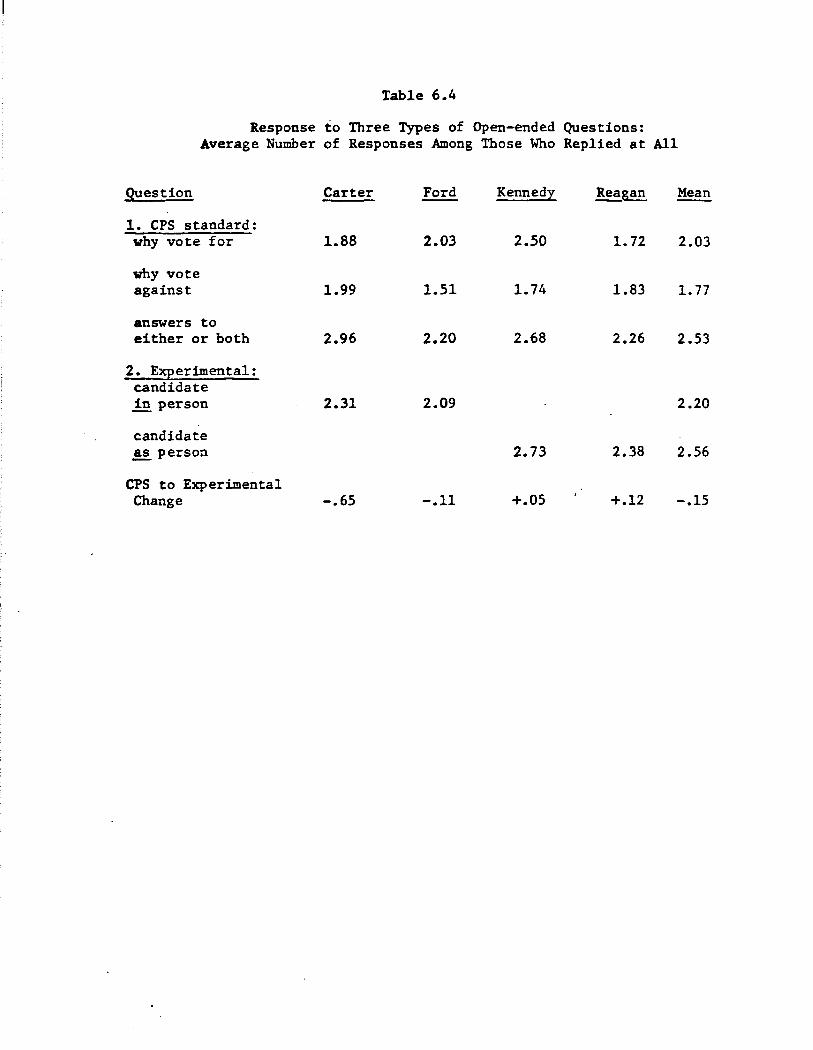
Table 6.4
Response to Three Types of Open-ended Questions: Average Number of Responses Among Those Who Replied at All
Question Carter Ford Kennedy Reagan Mean
1. CPS standard: why vote for 1.88 2.03 2.50 1. 72 2.03
why vote against 1.99 1.51 1. 74 1.83 1. 77
answers to either or both 2.96 2.20 2.68 2.26 2.53
2. Experimental: candidate in person 2.31 2.09 2.20
candidate ~person 2.73 2.38 2.56
CPS to Experimental Change -.65 -.11 +.05 +.12 -.15
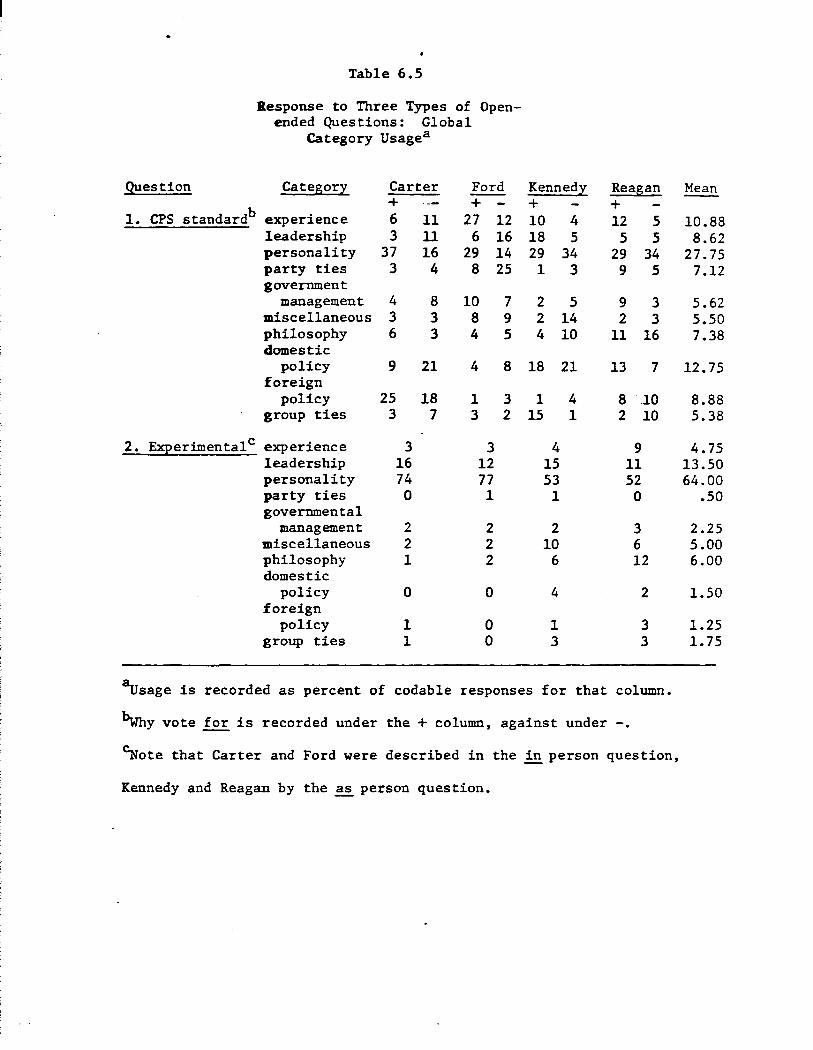
Question
1. CPS standardb
2. E~erimentalc
Table 6.5
Response to Three Types of Openended Questions: Global
Category Usagea
Categor:z: Carter Ford + + -
experience 6 11 27 12 leadership 3 11 6 16 personality 37 16 29 14 party ties 3 4 8 25 government
management 4 8 10 7 miscellaneous 3 3 8 9 philosophy 6 3 4 5 domestic
policy 9 21 4 8 foreign
policy 25 18 1 3 group ties 3 7 3 2
experience 3 3 leadership 16 12 personality 74 77 party ties 0 1 governmental
management 2 2 miscellaneous 2 2 philosophy 1 2 domestic
policy 0 0 foreign
policy 1 0 group ties 1 0
Kenned:z: Reagan + + 10 4 12 5 18 5 5 5 29 34 29 34 1 3 9 5
2 5 9 3 2 14 2 3 4 10 11 16
18 21 13 7
1 4 8 .10 15 1 2 10
4 9 15 11 53 52
1 0
2 3 10 6
6 12
4 2
1 3 3 3
~sage is recorded as percent of codable responses for that column.
l>wby vote for is recorded under the + column, against under -
~ote that Carter and Ford were described in the in person question,
Kennedy and Reagan by the ~ person question.
Mean
10.88 8.62
27. 75 7.12
5.62 5.50 7.38
12.75
8.88 5.38
4.75 13.50 64.00
.so
2.25 5.00 6.00
1.50
1.25 1. 75
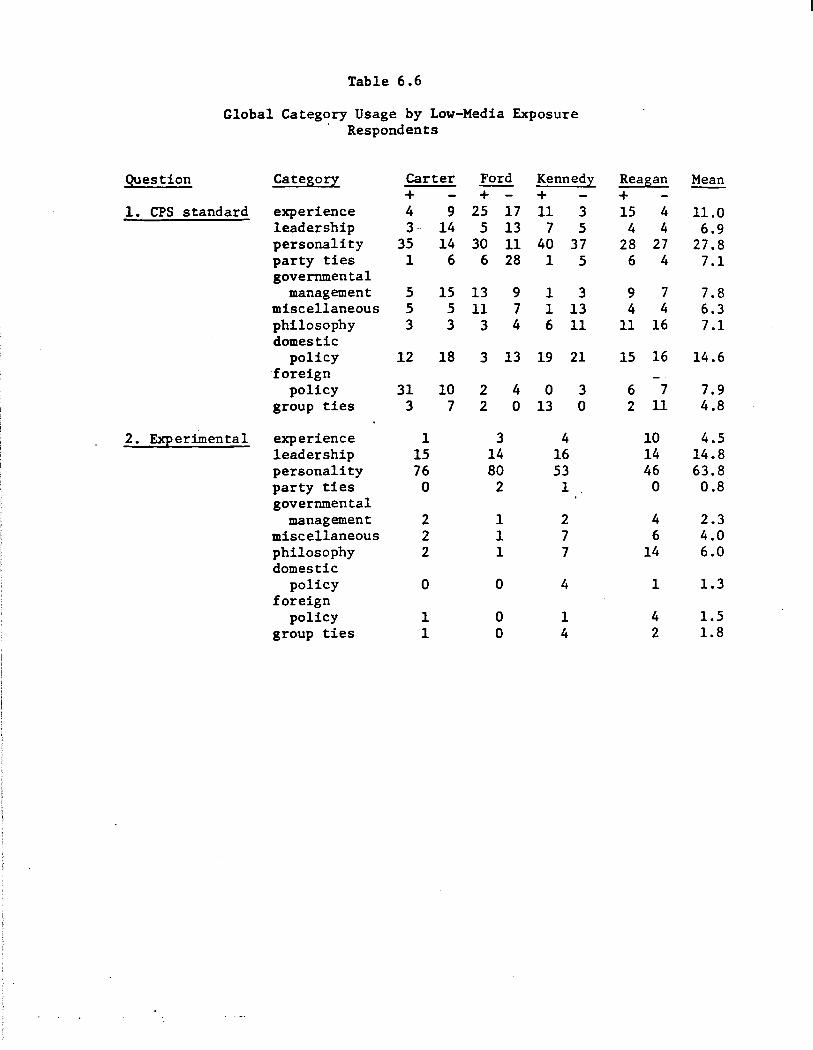
Table 6 .6
Global Category Usage by Low-Media Exposure Respondents
Question Catego!:l Carter Ford Kenned:t: Reagan Mean + + - + +
1. CPS standard experience 4 9 25 17 11 3 15 4 11.0 leadership 3 14 5 13 7 5 4 4 6.9 personality 35 14 30 11 40 37 28 27 27.8 party ties 1 6 6 28 1 5 6 4 7.1 governmental
management 5 15 13 9 1 3 9 7 7.8 miscellaneous 5 5 11 7 1 13 4 4 6.3 philosophy 3 3 3 4 6 11 11 16 7.1 domestic
policy 12 18 3 13 19 21 15 16 14.6 foreign
policy 31 10 2 4 0 3 6 7 7.9 group ties 3 7 2 0 13 0 2 11 4.8
2. Experimental experience 1 3 4 10 4.5 leadership 15 14 16 14 14.8 personality 76 80 53 46 63.8 party ties 0 2 1 0 0.8 governmental
management 2 1 2 4 2.3 miscellaneous 2 1 7 6 4.0 philosophy 2 1 7 14 6.0 domestic
policy 0 0 4 1 1.3 foreign
policy 1 0 1 4 1.5 group ties 1 0 4 2 1.8
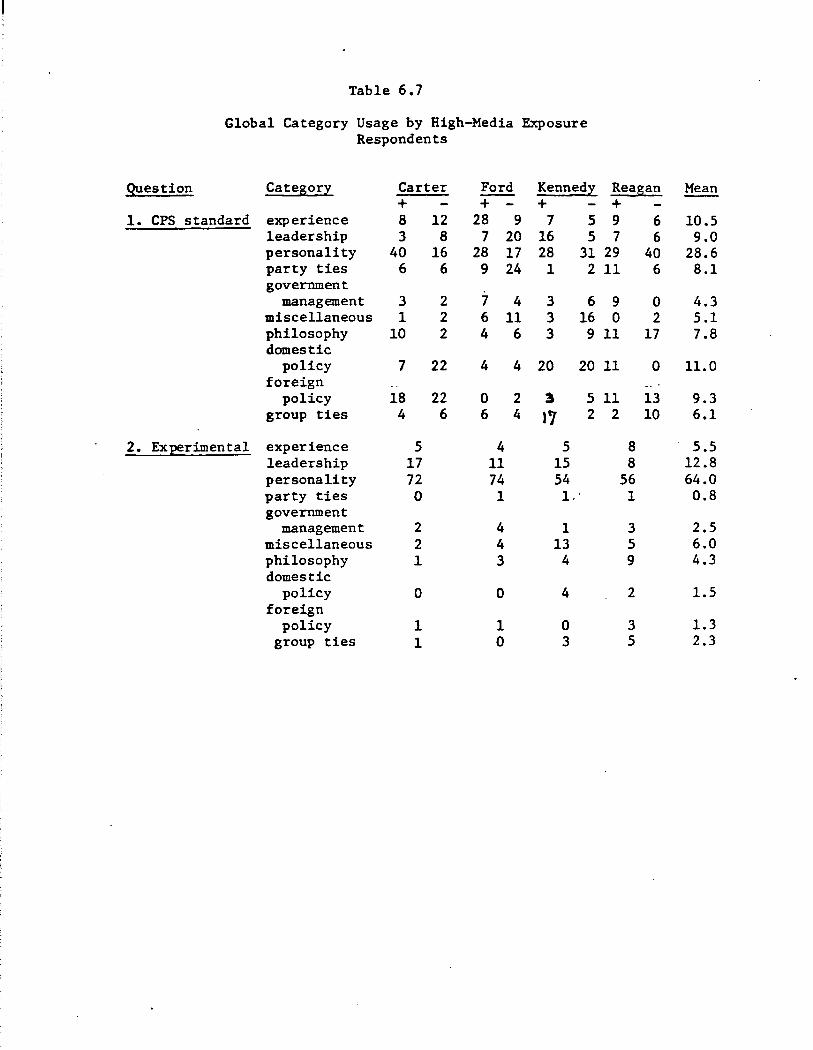
Table 6.7
Global Category Usage by High-Media Exposure Respondents
Question Categori Carter Ford Kenne di Reagan Mean + + - + - +
1. CPS standard experience 8 12 28 9 7 5 9 6 10.5 leadership 3 8 7 20 16 5 7 6 9.0 personality 40 16 28 17 28 31 29 40 28.6 party ties 6 6 9 24 1 2 11 6 8.1 government
management 3 2 7 4 3 6 9 0 4.3 miscellaneous 1 2 6 11 3 16 0 2 5.1 philosophy 10 2 4 6 3 9 11 17 7.8 domestic
policy 7 22 4 4 20 20 11 0 11.0 foreign
policy 18 22 0 2 ~ 5 11 13 9.3 group ties 4 6 6 4 ,., 2 2 10 6.1
2. Experimental experience 5 4 5 8 5.5 leadership 17 11 15 8 12.8 personality 72 74 54 56 64.0 party ties 0 1 1.· 1 0.8 government
management 2 4 1 3 2.5 miscellaneous 2 4 13 5 6.0 philosophy 1 3 4 9 4.3 domestic
policy 0 0 4 2 1.5 foreign
policy 1 1 0 3 1.3 group ties 1 0 3 5 2.3
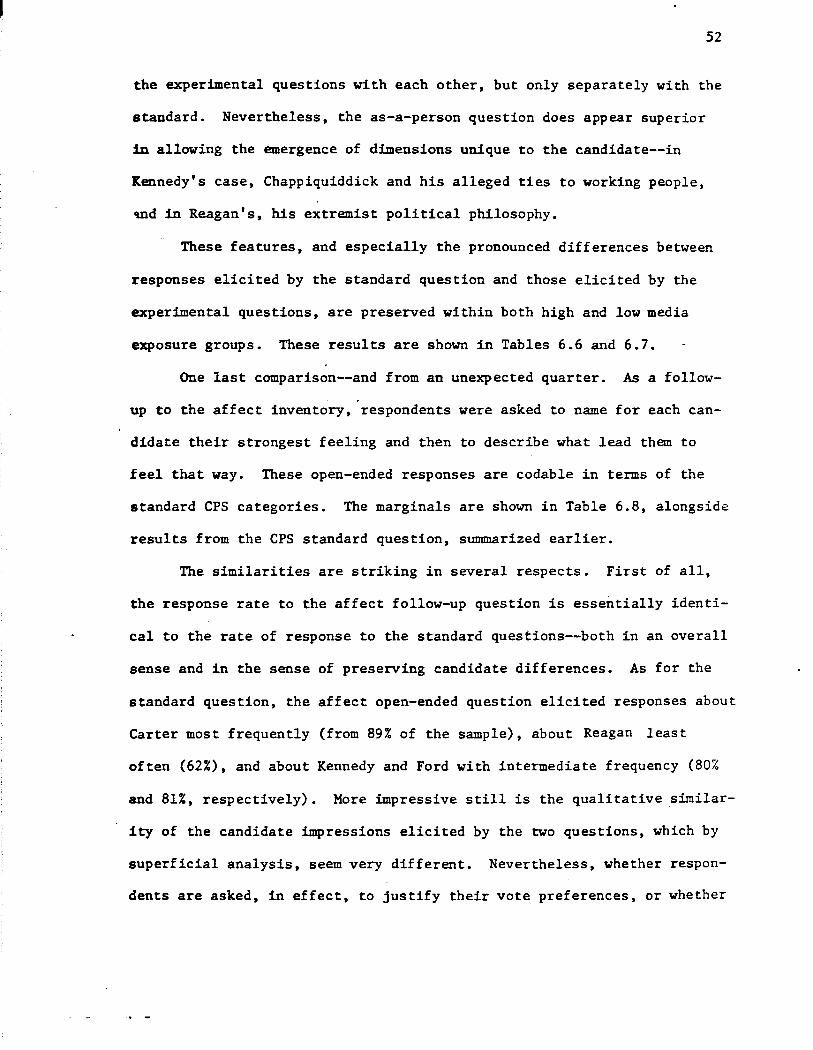
52
the experimental questions with each other, but only separately with the
standard. Nevertheless, the as-a-person question does appear superior
in allowing the emergence of dimensions unique to the candidate--in
Kennedy's case, Chappiquiddick and his alleged ties to working people,
'Uld in Reagan's, his extremist political philosophy.
These features, and especially the pronounced differences between
responses elicited by the standard question and those elicited by the
experimental questions, are preserved within both high and low media
exposure groups. These results are shown in Tables 6.6 and 6.7.
One last comparison--and from an unexpected quarter. As a follow
up to the affect inventory, respondents were asked to name for each can
didate their strongest feeling and then to describe what lead them to
feel that way. These open-ended responses are codable in terms of the
standard CPS categories. The marginals are shown in Table 6.8, alongside
results from the CPS standard question, summarized earlier.
The similarities are striking in several respects. First of all,
the response rate to the affect follow-up question is essentially identi
cal to the rate of response to the standard questions--both in an overall
sense and in the sense of preserving candidate differences. As for the
standard question, the affect open-ended question elicited responses about
Carter most frequently (from 89% of the sample), about Reagan least
often (62%), and about Kennedy and Ford with intermediate frequency (80%
and 81%, respectively). More impressive still is the qualitative similar
ity of the candidate impressions elicited by the two questions, which by
superficial analysis, seem very different. Nevertheless, whether respon
dents are asked, in effect, to justify their vote preferences, or whether
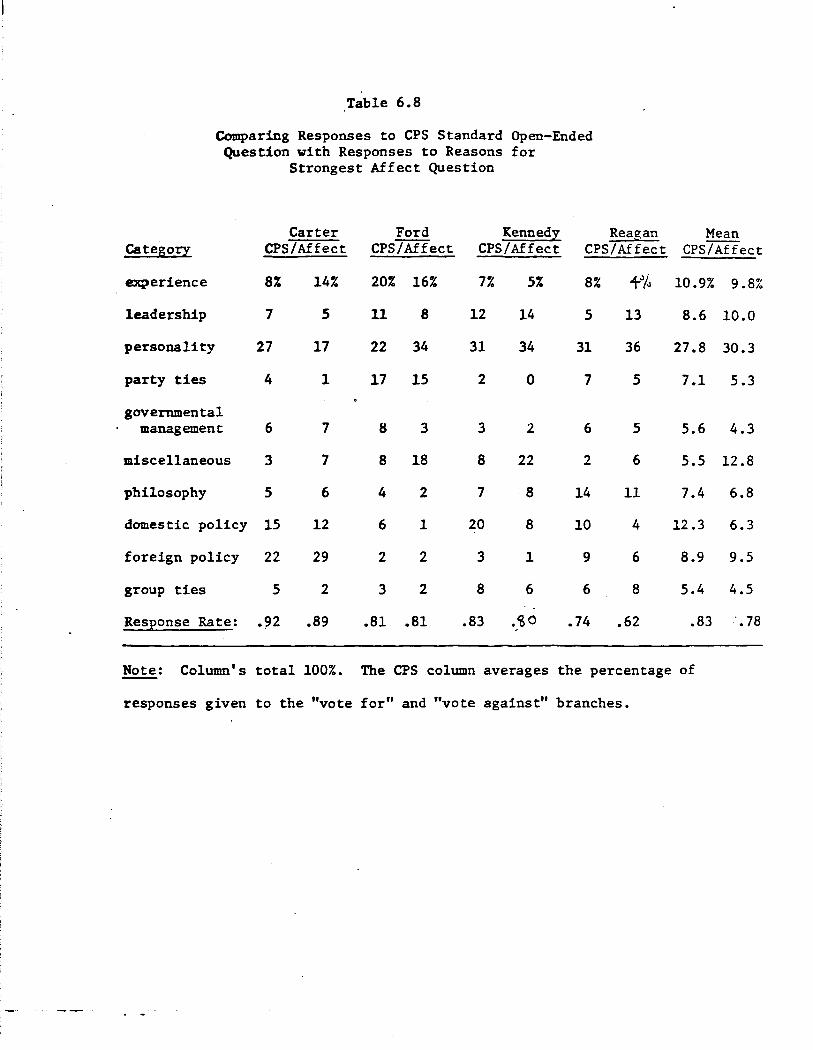
Table 6.8
Comparing Responses to CPS Standard Open-Ended Question with Responses to Reasons for
Strongest Affect Question
Carter Ford Kenned! Reagan Catego!I CPS/Affect CPS/Affect CPS/Affect CPS/Affect
experience 8% 14% 20% 16% 7% 5% 8% +% leadership 7 5 11 8 12 14 5 13
personality 27 17 22 34 31 34 31 36
party ties 4 1 17 15 2 0 7 5
governmental management 6 7 8 3 3 2 6 5
miscellaneous 3 7 8 18 8 22 2 6
philosophy 5 6 4 2 7 8 14 11
domestic policy 15 12 6 1 20 8 10 4
foreign policy 22 29 2 2 3 1 9 6
group ties 5 2 3 2 8 6 6 8
ResEonse Rate: .~n .89 .81 .81 .83 • '60 .74 .62
Note: Column's total 100%. The CPS column averages the percentage
responses given to the "vote for" and "vote against" branches.
Mean CPS/ Affect
10.9% 9.8%
8.6 10.0
27.8 30.3
7.1 5.3
5.6 4.3
5.5 12.8
7.4 6.8
12.3 6.3
8.9 9.5
5.4 4.5
.83 .• 78
of
they are asked for reasons underlying their political affects, they
refer in about the same proportion to experience, to personality, to
group ties, and so forth~
53
One notable difference between the two occurs over the "miscellan
eous" category: The affect question elicits more responses here than
does the standard. This is not necessarily to the detriment of the affect
questions. The differences are sharpest for Kennedy and Ford. And it
turns out that the miscellaneous category is home to replies recalling
Chappaquiddick and Ford's pardon of Nixon.
Recouunendations
Putting aside for a moment considerations of time and money (just
for a moment), there are excellent reasons to include open-ended car..di
date instrumentation in the 1980 study (i.e., in addition to the standard
question that will surely be part of the itmnediate pre~election-post
election-preserve-the-time-series-survey). These include: (1) the im
portance of tracing the evolution of candidate imagery over time, par
ticularly the cognitive or informational elements of images; (2) the
capacity to measure the subjective impact of ongoing events in interface
with the media monitoring project; (3) the ability to ascertain the ex
tent to which a candidate becomes identified in the public mind with a
single, overriding theme (e.g., Kennedy and National Health Insurance).
How then, to measure this (still postponing economic considera
tions)? The competition we have described between the standard CPS ques
tion and our new experimental versions produces a clear winner: namely,
the standard question. The new questions off er little advantage in terms
of response rate. More decisively, the rich, personal candidate images
tha~.we hoped to discover with them proved elusive. There may be no -tnctc, ,. ' there. ,.
This narrows the field to two: the standard question, and the
follow-up question associated with the affect inventory. We prefer the
54
latter on two grounds. First, our experimentation with open-ended ques-
tions was originally prompted by reservations about the standard ques-
tions--that it encourages rationalization. Although the standard emerges
victorious, the victory was achieved on other grotmds: our reservations
remain largely intact. Moreover, the affect open-ended question may
curtail somewhat these rationalization impulses. We believe this partly
because of our speculation that affective responses are less filtered,
less subject to consistency pressures than are semantically-mediated re-
sponses (see section 3 for a fuller discussion); and partly on empir-
ical grounds. As indicated in Table 6.8, the affect question elicits
substantially more references to Chappaquaddick and to the Nixon pardon,
events that may ~ to the respondent as inappropriate or illegitimate
bases for reaching preferences, but which in fact may have a great deal
to do with preference. We pref er the affect follow-up for another reason,
one near and dear to us all: time and money. The affect question appears
to be a more efficient way to elicit qualitative candidate impressions
than the standard question. It is first of all a single question, not
two ("vote for"/"vote against"), and because we also know which affect is
the strongest for any particular respondent, there is no problem in figur-
. ing out the evaluative meaning of the open-ended response. And secondly,
the affect question is less likely to provoke long, rambling answers by
those occasional long-winded respondents, presumably because the question
55
centers attention on a candidate-affect nexus. In short. we recommend
including the affect follow-up question in the 1980 study. in conjunction
with each administration of the affect inventory itself.
7. Recommendations Re-visited
What follows is our complete package of recOtJDnendations regarding
candidate instrumentation. Unless otherwise noted. the measures are to
be asked exactly as they were in the CPS spring survey. as set out in
Appendix A.
* Complete Trait Inventory for each viable candidate.
Early in the January-November period. when the field of candidates
is comparatively large. the trait inventory may necessarily be re
duced. The essential sub-set of items is: smart. courageous.
knowledgeable. inspiring, honest. immoral, reckless, too political,
power-hungry, and weak. Later, as candidates drop out, the trait
lists can correspondingly be expanded back to their original
length, thereby permitting finer measurement of the principal
candidates, and without incurring the costs that would be occasioned
by the introduction of novel instrumentation.
* Complete Affect Inventory for each viable candidate.
At a minimum, the inventory must include: hopeful, sympathetic,
liking, proud, disgusted, uneasy, angry, and disliking. The in
ventory should include at each administration the follow-up open
ended question--reasons for strongest affect.
* Delete the Behavior Inventory, retaining just 4 items.
The four are: solve our economic problems; set a good moral
example; provide strong leadership; develop good relations with
other countries. These items should be incorporated into the
trait inventory, and administered with them at each interviewing
point for each viable candidate.
* Delete the Ideal Presidency Inventory.
56
* Delete the experimental versions of the candidate open-ended question.
* Delete the CPS standard open-ended question (except of course for its
traditional place in the immediate pre-election/post-election phase of
the 1980 study).
llEFER.ENCES
Agranoff, R. The new style in election campaigns. Boston: Holbrook Press, Inc •• 1972.
Brody, R. A., & Page, B. I. Comment: The assessment of policy voting. The American Political Science Review, 1972, 66, 450-458.
Burns, J. M. Leadership. New York; Harper & Row, 1978.
Campbell, A. Converse, P. E •• Miller. W. E., & Stokes, D. E. The American voter. New York: Wiley, 1960.
Cartright, D., & Zander, A. (Eds.), Group dynamics:. Research and theory (3rd edition). New York: Harper & Row, 1968.
Converse, P. E •• Public opinion and voting behavior. In F. I. Greenstein & N. W. Polsby (Eds.), Handbook of political science, Vol. 4. Reading, MA: Addison-Wesley, 1975.
Converse, P. E., & Dupeux, G. DeGaulle and Eisenhower: The public image of the victorious general. In A. Campbell, P. E. Converse, W. E. Miller, & D. E. Stokes (Eds.), Elections and the political order. New York: Wiley, 1966.
Edelman, M. The symbolic uses of politics. Urbana, Illinois: University of Illinois Press, 1964.
Fiske, S. T., & Kinder, D. R. Involvement, expertise, and schema use: Evidence from political cognition. In N. Cantor and J. Kihlstrom (eds.), Cognition, Social Interaction, and Personality. Hillsdale, New Jersey: Erlbann, 1980.
Greenberg, B. S., & Parker, E. B. American public. Stanford:
The Kennedy assassination and the Stanford University Press, 1965.
Greenstein, F. I. Popular images of the President. American Journal of Psychiatry, 1965, 122, 523-529.
Hyman, H. H., & Sheatsley, P. B. The political appeal of President Eisenhower. Public Opinion Quarterly, 1953, 17, 443-460.
Kagy, M. R., & Caleira, G. I. like the looks of his face. Paper presented at American Political Science Association, 1975.
_ Katz, E., & Feldman, J. J. The debates in the light of research: A survey of surveys. In S. Kraus (Ed.), The great debates. Bloomington, IN: Indiana University, 1962.
Kanouse, D. E., & Hanson, L. R. Negativity in evaluations. In E. E. Jones, D. E. Kanouse, H. H. Kelley, R. E. Nisbett, S. Valins, & B. Weiner (Eds.), Attribution: Perceiving the causes of behavior. Morristown, NJ: General Learning Press, 1971.
Kinder, D.R., Denney, W. M., & Wagner, R. G. Media impact on candidate image: Exploring the generality of the law of minimal consequences. Paper delivered at the annual meeting of the American Association for Public Opinion Research, Buck Hill Falls, PA, May, 1977.
McGinnis, J. The selling of the President, 1968. New York: Trident Press, 1969.
McGuire, W. J. The nature of ,..attitude change • In G. Lindze; and E. Aronson (eds.), Handbook of Social Psychology, Vol. 3 (2nd ed.), Reading, MA: Addison-Wesley, 1969.
Miller, A. H., & Miller, W. E. Partisanship and performance: "Rational" choice in the 1976 Presidential election. Paper presented to American Political Science Association, 1977.
Miller, A. H., Miller, W. E., Raine, A. J., & Brown, T. A. A majority party in disarray: Policy polarization in the 1972 election. American Political Science Review, 1976, 1.Q., 753-778.
Nimmo, D. The political persuaders. Englewood Cliffs,_ NJ: PrenticeHall, 1970.
Nimmo, D., & Savage, R. L. Candidates and their images. Pacific Palisades, CA: Goodyear, 1976.
Nisbett, R. E., & Wilson, T. D. Telling more than we can know: Verbal reports on mental processes. Psychological Review, 1977, 84, 231-259.
Popkins, S., Gorman, J. W., Phillips, C., & Smith, J. A. Comment: What have you done for me lately? Toward an investment theory of voting. American Political Science Review, 1976, 70, 779-805.
Rosenberg, S. New approaches to the analysis of personal constructs in person perception. In D. Levine (Ed.), Nebraska Symposium on Motivation, Vol. 24, Lincoln: Nebraska University Press, 1977.
Rosenberg, S., & Sedlak, A. Structural representations of implicit personality theory. In L. Berkowitz (Ed.), Advances in experimental social psychology, New York: Academic Press, 1972.
Rubin, z. Liking and loving: An invitation to social psychology. New York: Holt, Rinehart, & Winston, 1973.
Sears, D. 0. Political behavior. In G. Lindzey & E. Aronson (Eds.), Handbook of social psychology, Vol. 5 (2nd ed.), Reading, MA: Addison-Wesley, 1969.
Sears, D. O., & Chaffee, s. H. Uses and effects of the 1976 debates: An overview of empirical studies. In S. Kraus (Ed.), The great debates 1976: Ford vs. Carter. Bloomington, IN: Indiana University Press, 1979.
Taylor, S. E., & Crocker, J. Schematic bases of social information processing. To appear in E. T. Higgins., C. A. Herman, and M. P. Zanna (Eds.), Social cognition: The Ontario SY'll!Posium on Personality and Social Cognition. Hillsdale, NJ; Erlbaum, in press
Weisberg, H. F., & Rusk, J. G. Dimensions of candidate evaluation. American Politcal Science Review, 1970, 64, 1167-1185.
Wolfenstein, M., & Kliman, G. (Eds.), Children and the death of a President, Garden City, New York: Doubleday, 1965.
Wyckoff, G. The image candidates. New York: The MacMillan Company, 1968.
Zajonc, R. B. Feeling and thinking: Preferences need no inferences. Paper prepared for delivery at the 87th Annual Meeting of the American Psychological Association, New York, New York, September 1-5, 1979.
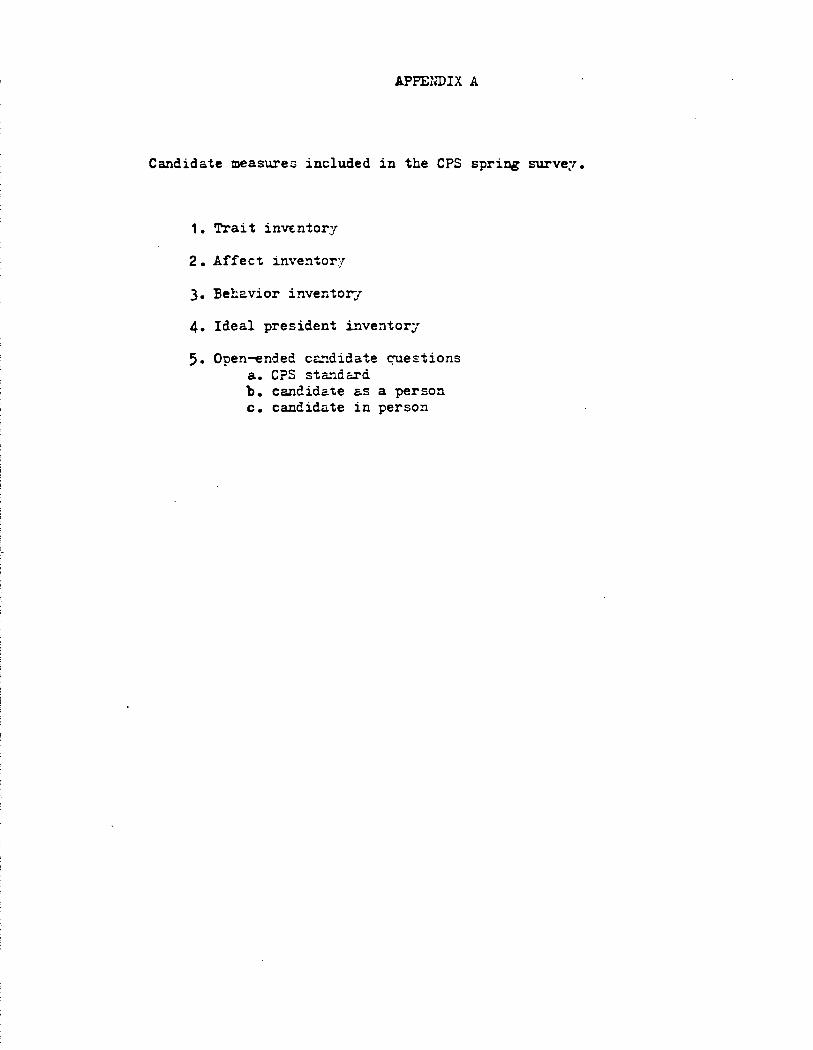
APPENDIX A
Candidate measureG included in the CPS spring surve:r.
1. Trait in~ntor,y
2. Affect. inventory
3. Behavior inventor-J
4. Ideal president inventory
5. Open-ended C"-~didate c:-uestions a. CPS sta."ldcrd b. candidate as a person c. candidate in person