Embed Size (px)
Citation preview

University of East London Institutional Repository: http://roar.uel.ac.uk This paper is made available online in accordance with publisher policies. Please scroll down to view the document itself. Please refer to the repository record for this item and our policy information available from the repository home page for further information. To see the final version of this paper please visit the publisher’s website. Access to the published version may require a subscription. Author(s): Speight, Svetlana; Smith, Ruth; Lloyd, Eva; Coshall, Cathy. Article title: Families Experiencing Multiple Disadvantage: their use of and views on childcare provision Year of publication: 2010 Citation: Speight, S. et al. (2010) Families Experiencing Multiple Disadvantage: their use of and views on childcare provision, London: National Centre for Social Research Link to published version: http://www.dcsf.gov.uk/research/data/uploadfiles/DCSF-RR191.pdf ISBN: 9781847756282
Families ExperiencingMultiple Disadvantage
Their Use of and Views on Childcare
Provision
Research Report DCSF-RR191
Svetlana Speight, Ruth Smith and Eva Lloydwith Cathy Coshall
National Centre for Social Research

Research Report No DCSF-RR191
Families Experiencing Multiple Disadvantage
Their Use of and Views on Childcare Provision
Svetlana Speight, Ruth Smith and Eva Lloyd with Cathy Coshall
National Centre for Social Research
The views expressed in this report are the authors’ and do not necessarily reflect those of the Department for Children, Schools and Families. © National Centre for Social Research 2010 ISBN 978 1 84775 628 2 January 2010


Contents Acknowledgements.................................................................................................. iv Executive summary................................................................................................... 1
Introduction.................................................................................................... 1 Childcare received by pre-school children..................................................... 1 Childcare received by school-age children.................................................... 2 Parents’ views about childcare provision ...................................................... 3 Childcare and maternal employment............................................................. 4 Conclusions................................................................................................... 5
1 Introduction........................................................................................................... 7
1.1 Aims................................................................................................................. 7 1.2 Background...................................................................................................... 7
Policy context ................................................................................................ 7 Childcare and Early Years Survey of Parents series..................................... 8 Multiple disadvantage among families with children...................................... 9 Measuring multiple disadvantage.................................................................. 9
1.3 Creating a score of multiple disadvantage..................................................... 10 1.4 Defining childcare .......................................................................................... 12 1.5 Report outline ................................................................................................ 13 1.6 Interpreting the results ................................................................................... 13
Data............................................................................................................. 13 Weights ....................................................................................................... 13 Bases .......................................................................................................... 13 Percentages ................................................................................................ 14 Statistical significance ................................................................................. 14 Symbols in tables ........................................................................................ 14
2 Childcare received by pre-school children ...................................................... 15
2.1 Introduction .................................................................................................... 15 2.2 Types of childcare children receive ............................................................... 15
Formal and informal childcare received by pre-school children .................. 15 Types of formal childcare received by 0-2 year olds ................................... 17 Types of formal childcare received by 3-4 year olds ................................... 17 Receipt of the free entitlement to early years education by 3 to 4 year old children 18
2.3 Packages of childcare.................................................................................... 19 2.4 Hours of childcare.......................................................................................... 20 2.5 Reasons for receiving childcare..................................................................... 21 2.6 Summary ....................................................................................................... 22
3 Childcare received by school-age children...................................................... 24
3.1 Introduction .................................................................................................... 24 3.2 Types of childcare children receive ............................................................... 24 3.3 Packages of childcare.................................................................................... 26 3.4 Hours of childcare.......................................................................................... 26 3.5 Reasons for receiving childcare..................................................................... 28 3.6 Receipt of childcare during the school holidays............................................. 29 3.7 Summary ....................................................................................................... 30
4 Parents’ views about childcare provision ........................................................ 31
4.1 Introduction .................................................................................................... 31 4.2 Information about childcare ........................................................................... 31 4.3 Perceptions of childcare provision in local area............................................. 34
i

Asking parents about childcare provision.................................................... 34 Perceptions of availability ............................................................................ 35 Perceptions of quality .................................................................................. 35 Perceptions of affordability .......................................................................... 36 Perceptions of childcare provision and multiple disadvantage.................... 37
4.4 Reasons for not using childcare .................................................................... 37 4.5 Reasons for not using early years provision.................................................. 38 4.6 Summary ....................................................................................................... 39
5 Childcare and maternal employment................................................................ 41
5.1 Introduction .................................................................................................... 41 5.2 Maternal employment, family status and multiple disadvantage ................... 41 5.3 Barriers to employment.................................................................................. 44 5.4 Work orientation and other influences on mothers’ decisions to work........... 46 5.5 Childcare arrangements available to studying mothers................................. 49 5.6 Summary ....................................................................................................... 50
6 Conclusions ........................................................................................................ 52 References ............................................................................................................... 55 APPENDIX A Socio-demographic profile........................................................... 59
A.1 Family characteristics..................................................................................... 59
Family type .................................................................................................. 59 Number of children in the household........................................................... 59 Work status ................................................................................................. 59 Household income and receipt of benefits .................................................. 60 Tenure status .............................................................................................. 61 Area deprivation .......................................................................................... 61
A.2 Parent characteristics..................................................................................... 61
Educational level ......................................................................................... 61 Illness and/or disability ................................................................................ 62
A.3 Child characteristics ....................................................................................... 63
Age .............................................................................................................. 63 Special educational needs and disabilities.................................................. 64 Ethnic group ................................................................................................ 64
APPENDIX B Additional tables ........................................................................... 65
ii
iii
Tables Table 1.1 .....................................................................................Level of multiple disadvantage 11 Table 2.1 .........Childcare providers attended by pre-school children, by multiple disadvantage 16 Table 2.2 ...................Childcare providers attended by 0-2 year olds, by multiple disadvantage 17 Table 2.3 ...................Childcare providers attended by 3-4 year olds, by multiple disadvantage 18 Table 2.4 ................................................. Receipt of free entitlement, by multiple disadvantage 19 Table 2.5 ................... Packages of childcare for pre-school children, by multiple disadvantage 20 Table 2.6 Hours of childcare received per week by pre-school children, by multiple disadvantage 21 Table 3.1 ........Childcare providers attended by school-age children, by multiple disadvantage 25 Table 3.2 .................. Packages of childcare for school-age children, by multiple disadvantage 26 Table 3.3 Hours of childcare received per week by school-age children, by multiple disadvantage 27 Table 3.4 Childcare providers attended by school-age children during school holidays, by multiple
disadvantage................................................................................................................ 29 Table 4.1 Sources of information about childcare used in the last year, by multiple disadvantage 32 Table 4.2 ..............Level of information about childcare in local area, by multiple disadvantage 33 Table 4.3 Additional information required about childcare in local area, by multiple disadvantage 34 Table 4.4 ........... Perceptions of availability of local childcare places, by multiple disadvantage 35 Table 4.5 .............................Perceptions of quality of local childcare, by multiple disadvantage 35 Table 4.6 ......... Perceptions of affordability of local childcare places, by multiple disadvantage 37 Table 4.7 ...................... Reasons for not using childcare in last year, by multiple disadvantage 38 Table 4.8 Reasons for not using nursery education for children aged 0-2, by multiple disadvantage 39 Table 5.1 .........................................................Maternal employment, by multiple disadvantage 41 Table 5.2 ..................................................Maternal self-employment, by multiple disadvantage 42 Table 5.3 ........................................................ Maternal shift working, by multiple disadvantage 42 Table 5.4 ............................................................. Mothers who study, by multiple disadvantage 43 Table 5.5 .....................................Mothers’ family status, by their employment / studying status 43 Table 5.6 ......................... Childcare-related reasons for not working, by multiple disadvantage 44 Table 5.7 Whether non-working mothers would prefer to work if good quality, convenient, reliable and
affordable childcare was available, by multiple disadvantage ..................................... 45 Table 5.8 ...........Work-related and financial reasons for not working, by multiple disadvantage 46 Table 5.9 Childcare arrangements that helped mothers to go out to work, by multiple disadvantage 47 Table 5.10 ...............Work-related and financial reasons for working, by multiple disadvantage 48 Table 5.11 Views on ideal working arrangements, by multiple disadvantage............................. 49 Table 5.12 .... Childcare arrangements that helped mothers to study, by multiple disadvantage 50 Table A.1 ........................................................................ Family type, by multiple disadvantage 59 Table A.2 ..................... Number of children aged 0-14 in household, by multiple disadvantage 59 Table A.3 .............................................................Family work status, by multiple disadvantage 60 Table A.4 .........................................................Family yearly income, by multiple disadvantage 60 Table A.5 ................................................Family’s receipt of benefits, by multiple disadvantage 60 Table A.6 ....................................................Type of accommodation, by multiple disadvantage 61 Table A.7 ................................................................ Area deprivation, by multiple disadvantage 61 Table A.8 ........................................Parents’ educational attainment, by multiple disadvantage 62 Table A.9 ................................................... Parents’ illness/disability, by multiple disadvantage 63 Table A.10 ....................................................... Age of selected child, by multiple disadvantage 63 Table A.11 .. Special educational needs and disabilities/illnesses of selected child, by multiple
disadvantage................................................................................................................ 64 Table A.12 ...............................................Ethnicity of selected child , by multiple disadvantage 64 Table B2.1 Reasons for receipt of childcare by pre-school children, by multiple disadvantage 65 Table B3.1 Reasons for receipt of childcare by school-age children, by multiple disadvantage 65 Table B4.1 Logistic regression models for perceptions of poor availability of childcare in local area 66 Table B4.2 Logistic regression models for perceptions of good quality of childcare in local area 67 Table B4.3 Logistic regression models for perceptions of poor affordability of childcare in local area 68 Table B4.4 Parents’ awareness of the free entitlement to early education for 3 and 4 year old children,
by multiple disadvantage.............................................................................................. 68 Table B5.1 ...................Logistic regression models for maternal employment, by family status 68
Figures
Figure 2.1.... Reasons for receipt of childcare by pre-school children, by multiple disadvantage 22 Figure 3.1....Reasons for receipt of childcare by school-age children, by multiple disadvantage 28
Acknowledgements We would like to thank Adele Rowe and her colleagues at the Department for Children, Schools and Families for their support and valuable feedback on this report. Within NatCen our thanks go to Ivana La Valle for her enthusiastic support for this study from the beginning and for her insightful comments on an earlier draft of this report, and to Andrew Scott for his help with report tables and appendices. We are also grateful to Alice Reeves for her thoughtful comments on the report and help with the report production. Last but not least, we would like to thank all parents who took part in the Childcare and Early Years Survey of Parents 2008 for their time and sincere answers. Views expressed in this report, together with any errors that remain, are those of the authors. Anyone wanting further information on the study should contact Ruth Smith ([email protected]) or Svetlana Speight ([email protected]) at NatCen.
iv
Executive summary Introduction The Government’s Every Child Matters programme aims to provide all children with the support they need to meet the five key objectives of being healthy, staying safe, enjoying and achieving, making a positive contribution, and achieving economic well-being. However, this can be a challenge for families that experience multiple disadvantage (including, for example, worklessness, poor skills, material deprivation, poor health, family breakdown), as research suggests that experience of multiple disadvantage can have a compounding effect on families that includes a negative association with a range of Every Child Matters outcomes for children (Cabinet Office 2007, Oroyemi et al. 2009). The many childcare and early education initiatives introduced over the last decade are an important route to achieving success in the Every Child Matters programme. However, it is known that disadvantaged families (such as non-working families and families with a low income) are less likely to use formal childcare than families in better circumstances (Speight et al. 2009, Kazimirski et al. 2008b, Bryson et al. 2006). Less research has been conducted on childcare use by multiply disadvantaged families. This report aims to contribute towards filling this gap, using data from the 2008 Childcare and Early Years Survey of Parents to explore the experience of multiple problems among parents and the relationship between multiple disadvantage and childcare. In this way it hopes to make a contribution to the identification of optimal strategies for helping children in these families access early learning and childcare opportunities and wider family support services. The first stage of this study locates families along a continuum of disadvantage using a specially devised index of multiple disadvantage. The analysis in the report then uses this measure to explore patterns of childcare use, parents’ views on local childcare provision, and how childcare and other issues influence maternal employment decisions, from the point of view of families experiencing multiple disadvantage. The definition of ‘childcare and early years provision’ in the Childcare and Early Years Survey of Parents series is very inclusive. It covers free early education delivered by a range of providers as well as formal and informal provision of non-parental care. The term childcare is used here in respect of both early education and childcare. Childcare received by pre-school children There was a clear association between receipt of childcare by pre-school children and multiple disadvantage, whereby the more disadvantage children experienced the less likely they were to receive childcare. For instance, 60% of pre-school children who experienced the highest level of multiple disadvantage received some form of childcare in the reference term time week, compared with 73% of all pre-school children and 81% of children who were not disadvantaged. The differences in take-up of childcare are largely driven by differences in the take-up of formal childcare. The most multiply disadvantaged children were less likely to receive formal childcare than children in better circumstances (43% compared with 59% of all pre-school children and 70% of children who were not disadvantaged). This was particularly the case for 0-2 year olds where 55% of children who were not disadvantaged received formal childcare compared with 15% of the most disadvantaged (a gap of 40 percentage points). The gap between the most and least disadvantaged children was smaller but still apparent among 3-4 year olds (16 percentage points), and looking specifically at the free entitlement to early
1

years education for 3 and 4 year olds, the more disadvantage children experienced, the less likely they were to receive the free hours or attend an early education setting. The types of formal childcare the most multiply disadvantaged children were less likely to attend were: day nurseries, playgroups and childminders. This may reflect the lower employment rate among families experiencing multiple disadvantage, and the role day nurseries and childminders play in supporting parental employment. The relatively high cost of day nurseries and childminders (Speight et al. 2009) is likely to be an important factor as well. In terms of informal childcare, the most multiply disadvantaged children were less likely to be looked after by their grandparents. Pre-school children experiencing the most disadvantage spent an average (median) of 15.5 hours in childcare in the term time reference week, which was lower than the average amount of time all pre-school children receiving childcare spent with childcare providers (22.0 hours). This difference is largely driven by a difference in the amount of time children spent in formal childcare, for while children who experienced the most disadvantage spent an average of 13.4 hours in formal childcare, children who were not disadvantaged attended for an average of 18.4 hours. It is notable that the number of hours of childcare received by the most disadvantaged children (13.4 hours) is very close to the level of the free entitlement for 3 and 4 year olds (12.5 hours in most areas), which may indicate that these families have more difficulty paying for additional hours than those in better circumstances. Overall, pre-school children most commonly received childcare for reasons related to their development and enjoyment. However, the other reasons pre-school children received childcare strongly reflect the differing work status of families experiencing varying levels of disadvantage. There was a notable trend whereby children experiencing more multiple disadvantage were less likely to receive childcare for economic reasons (i.e. so that parents could work) and were instead more likely to receive childcare for reasons related to parental time (i.e. so that parents could do domestic activities, socialise, or look after other children). Childcare received by school-age children As with pre-school children, there was a notable association between receipt of childcare by school-age children and the level of disadvantage they experienced. While 59% of all school-age children received some form of childcare during the term time reference week, this was the case for only 43% of children who experienced the most multiple disadvantage. Again, this association can largely be attributed to differential receipt of formal childcare - specifically, children experiencing multiple disadvantage were less likely to attend a breakfast or after-school club (either on or off a school site) and were also less likely to go to a childminder than their peers in better circumstances. In addition, children experiencing the highest level of multiple disadvantage were substantially less likely to attend leisure and sport activities than children in better circumstances (four per cent compared with ten per cent of all school-age children and 14% of children who were not disadvantaged). The same pattern as seen for use of formal childcare can also be observed for use of grandparental care. Indeed, the most multiply disadvantaged children were notably less likely to receive care from their grandparents (13% compared with 18% of all school-age children and 21% of children who experienced no disadvantage). Turning to the number of hours that school-age children spent in childcare, those experiencing the most disadvantage received an average (median) of 9.0 hours of childcare compared with 6.4 hours for all school-age children receiving some childcare. It is likely that this difference can be attributed to the time that multiply disadvantaged children spent with their resident parents’ ex-partners (who were likely to be their non-resident parents), since multiply disadvantaged children were more likely to be cared for by ex-partners and other
2
research has demonstrated that children typically spend long periods of time with these carers (Speight et al 2009, Smith et al. 2009a). As with pre-school children, school-age children typically received childcare for reasons related to their development or enjoyment, but reasons also strongly reflected the differing work status of families experiencing different levels of disadvantage. Children in better circumstances were more likely to receive childcare for economic reasons (i.e. so that parents could work), while children who experienced multiple disadvantage were more likely to receive childcare for reasons related to parental time (i.e. so that parents could socialise, attend appointments, look after their other children, etc.). Children from families with the highest level of disadvantage were less likely to receive childcare during school holidays than children with lower levels of disadvantage. This difference can be seen in receipt of both formal and informal childcare. Looking at use of formal childcare, the most multiply disadvantaged children were less likely to attend a holiday club during school holidays than children in better circumstances (four per cent compared with seven per cent of all school-age children). Looking at use of informal childcare, multiply disadvantaged children were less likely to receive care from their grandparents or from their parents’ friends or neighbours during the school holidays. It is likely that these differences in the take-up of holiday care reflect the lower employment levels among multiply disadvantaged families and thus reduced need for non-parental childcare. Parents’ views about childcare provision Families experiencing the highest level of multiple disadvantage tended to receive information about childcare from different sources than families in better circumstances. They were less likely to receive childcare information through word of mouth (31%, compared with 41% of all families and 48% of families with no disadvantage) but more likely to receive it from JobCentres and JobCentres Plus (19%, compared with five per cent of all families). In addition, parents from the most multiply disadvantaged families were more likely than parents from other types of families to say they had too little information about childcare (44%, compared with 37% of all families, and 32% of families with no disadvantage). Where families experiencing the highest level of multiple disadvantage thought they did not have enough information about childcare in their local area, they reported that they would have liked more information about: • cost of childcare - 48% • childcare available during school holidays - 43% • available hours of childcare - 30% • quality of childcare - 29% • childcare before or after the school day - 24%. Parents’ perceptions of childcare provision in their local areas were strongly associated with how much disadvantage they experienced. In particular, those from the most disadvantaged families were somewhat more likely to hold the view that there were not enough childcare places available than those from families in better circumstances; they were also much less likely to believe that the quality of local childcare was good; and they held more negative views about the affordability of local childcare. Furthermore, those who felt that they did not have enough information about local childcare were particularly negative about its availability, quality and affordability.
3
These findings suggest that there need to be more targeted efforts to improve the provision of information about childcare to families experiencing multiple disadvantage, which may well lead to more positive perceptions of childcare. It appears that perceptions of childcare might influence patterns of childcare use by families experiencing multiple disadvantage, although it is likely that the relationship is reciprocal, with parents’ personal experiences of using childcare also affecting their perceptions of it. Those parents who had not used any childcare for their children in the last year were asked why this was the case. The most commonly mentioned reason was that the parents preferred to look after their children themselves (68% of all parents, and 76% of parents in the most disadvantaged families). The affordability of childcare was mentioned by 13% of all parents, and 20% of parents in the most disadvantaged families. While there were substantial differences in the levels of use of formal childcare for pre-school children by families experiencing different levels of disadvantage, there was little variation in the parents’ reasons for not using childcare or early education. However, the awareness of the free entitlement to early education for 3 and 4 year olds among parents in multiply disadvantaged families may be lower than among those in better circumstances (it is difficult to draw a definite conclusion due to a very low number of cases used in this analysis). Childcare and maternal employment There was a strong linear association between the level of disadvantage experienced by the family and maternal employment, with higher levels of disadvantage being associated with lower employment rates. The majority of mothers from families experiencing the highest level of multiple disadvantage were not in paid employment (85%). Those mothers who were working were more likely to work shifts than mothers in other types of families (29%, compared with 18% of all mothers). There were no significant differences in the rates of maternal self-employment by level of disadvantage in the family. A significant proportion of non-working mothers in the most disadvantaged families were satisfied with their non-working status and justified it by reference to their maternal responsibilities. However, for the majority of mothers in this group, being out of paid employment was not so much a deliberate choice as an outcome of various constraints on their choices (and more so than for mothers in better circumstances). Many non-working mothers from families experiencing the highest level of multiple disadvantage held positive views of employment: just under two-thirds said they would prefer to go out to work if they could arrange good quality childcare which was convenient, reliable and affordable. Furthermore, non-working mothers from the most disadvantaged families were less likely than mothers from other types of families to say that they wanted to stay at home with their child(ren) and less likely to say that their children would suffer if they went out to work. The barriers to employment mothers felt they faced included childcare factors, financial concerns and other constraints. In terms of childcare factors, lack of access to appropriate, affordable childcare was a significant barrier to employment for mothers from the most disadvantaged families, with 34% of mothers mentioning childcare-related reasons for why they were not in employment (compared with 20% of mothers from families with no disadvantage and 28% of all non-working mothers). In terms of financial concerns and other constraints: • 29% said they would not earn enough to make working worthwhile
• 17% worried that they would lose their benefits if they went out to work
4
• 27% reported a lack of jobs with suitable hours
• 20% felt they were not sufficiently qualified
• 19% were constrained by their own illnesses or disabilities
• 12% were constrained by their responsibilities to care for an ill or elderly family member.
Key facilitators of paid employment among mothers from the most disadvantaged families included: their children being at school (50%) and relatives helping with childcare (43%). In addition, mothers from the most disadvantaged families were more likely than those from other types of families to mention reliable free or cheap childcare (38%) and childcare support through tax credits (11%) as facilitating factors. However, childcare responsibilities still constrained the employment options of working mothers from the most disadvantaged families, with 30% saying they would work more hours if they could arrange good quality childcare which was convenient, reliable and affordable (this is compared with 18% of all working mothers). Turning to the reasons for being in paid employment, 71% of working mothers from families experiencing the highest level of multiple disadvantage said they worked because they enjoyed working, and 65% said they had to work as they needed the money. These proportions were similar for mothers from different types of families. Working mothers from disadvantaged families were more likely than those from better-off families to mention that they wanted to get out of the house and that they would feel useless without a job, but less likely to say that their career would suffer if they took a break, or that they needed to keep on contributing to their pension. Thirteen per cent of mothers from families experiencing the highest level of multiple disadvantage were studying or undertaking some training towards a qualification (this proportion was not significantly different from the average for all mothers). The main factor that enabled mothers to study was that their children were at school (this was mentioned by 45% of mothers in the most disadvantaged families who were studying). Availability of suitable childcare was mentioned frequently as a factor that facilitated studying by mothers in all types of families. However, mothers from families experiencing the highest level of multiple disadvantage were more likely than mothers from other families to mention that having reliable free or cheap childcare helped them study (35%, compared with 23% of all mothers). Fourteen per cent of mothers from the most disadvantaged families said that their college provided or paid for (all or some) childcare and that this facilitated their studying. Conclusions Findings presented in this report reveal substantial differences in the take-up of childcare, and formal childcare in particular, among families experiencing multiple disadvantage and those with no or less disadvantage. The differences are apparent for all age groups of children but are particularly pronounced for those aged under 3. Low levels of information about childcare and early years provision may contribute to the low level of take-up among disadvantaged families, and it is strongly associated with negative perceptions of the availability, quality and affordability of childcare in parents’ local area. It appears that there may be benefit in more active targeting of disadvantaged families through tailored approaches with the aim of increasing their awareness of local options for using childcare and early years provision for their children and of the benefits of good quality early education. However, the affordability of childcare - in the context of the mixed-economy of childcare - remains a significant challenge for policy makers and a major barrier to enabling
5

more disadvantaged children to benefit from early years provision and supporting more mothers from disadvantaged backgrounds to take up employment. With the exception of the free entitlement to early education for 3 and 4 year olds, most childcare subsidies are linked with parental employment (e.g. tax credits). It may be that provision of early learning and childcare that is free (or very inexpensive) at the point of use, as with the free entitlement for 3 and 4 year olds, is a more effective way of increasing the number of disadvantaged children receiving formal provision and benefiting from it.
6
1 Introduction 1.1 Aims The Government’s Every Child Matters programme aims to provide all children with the support they need to meet the five key objectives of being healthy, staying safe, enjoying and achieving, making a positive contribution, and achieving economic well-being. However, this can be a challenge for families that experience multiple disadvantage (including, for example, worklessness, poor skills, material deprivation, poor health, family breakdown), as research suggests that experience of multiple disadvantage can have a compounding effect on families that includes a negative association with a range of Every Child Matters outcomes for children (Cabinet Office 2007, Oroyemi et al. 2009). The many childcare and early education initiatives introduced over the last decade are an important route to achieving success in the Every Child Matters programme. However, it is known that disadvantaged families (such as non-working families and families with a low income) are less likely to use formal childcare than families in better circumstances (Speight et al. 2009, Kazimirski et al. 2008b, Bryson et al. 2006). Less research has been conducted on childcare use by multiply disadvantaged families. This report aims to contribute towards filling this gap, using data from the 2008 Childcare and Early Years Survey of Parents to explore the experience of multiple problems among parents and the relationship between multiple disadvantage and childcare.1 The first stage of this study locates families along a continuum of disadvantage using a specially devised index of multiple disadvantage. The analysis in the report then uses this measure to explore patterns of childcare use, parents’ views on local childcare provision, and how childcare and other issues influence maternal employment decisions, from the point of view of families experiencing multiple disadvantage. 1.2 Background There is good research evidence that problems with low income, unemployment and area deprivation not only affect parents’ use, views and experience of childcare and early years provision for their youngest children, but that they also have a cumulative effect on all aspects of children’s development and their subsequent life chances (Lloyd 2006, Hansen and Joshi 2007, Johnson and Kosykh 2008). Addressing multiple disadvantage among young children and their families is therefore the driver behind many government childcare initiatives. The present study aims to make a contribution to the identification of optimal strategies for helping these families access childcare, early years provision and wider family support services. Policy context A prominent feature of early years policy under the present Government has been the continuing emphasis on bringing childcare and early years provision within reach of all children and families equally (La Valle and Smith 2009). Given British evidence in particular that disadvantaged children’s development can benefit significantly from good quality childcare and early years provision (Sylva et al. 2004, Coghlan et al. 2009) convergence between the Government’s child poverty and childcare strategies has steadily increased (Lloyd 2008). The Children Act 2004 gave legal force to the Every Child Matters policy agenda, which introduced a programme of children’s services reform aimed at improving
1 For more information about the survey, see Speight et al. (2009).
7
developmental, educational and economic outcomes of all children, while narrowing the gap between the poor and the better-off. Both the provisions of the Child Poverty Review (HM Treasury 2004a) and those of the Ten Year Childcare Strategy (HM Treasury 2004b) confirm this trend in their insistence on the principle of progressive universality. This encapsulates a focus on improving the developmental, educational and economic outcomes of those most in need, with some universal support for other children, to achieve the same aim of narrowing the gap in life chances. Subsequent childcare policy developments have built on these commitments, which were given formal expression at national level in the PSA Delivery Agreement 11: narrow the gap in educational achievement between children from low income and disadvantaged backgrounds and their peers (HM Government 2008). Indeed, a range of area-based initiatives have been rolled out, including the Neighbourhood Nurseries Initiative and the Children’s Centre programme, alongside initiatives focused on disadvantaged children and their families. At Local Authority level, the Childcare Act 2006 imposes a general duty to reduce inequalities between young children in their area in relation to all five outcomes specified in the Children Act 2004: physical and mental health, personal safety, enjoyment and achievement, making a positive contribution to society and economic well-being. In line with these developments, free early education is being extended to the 15% most economically disadvantaged 2 year old children (HM Government 2009). After a successful pilot study in 32 Local Authorities (Kazimirski et al. 2008a, Smith et al. 2009b), from September 2009 onwards this targeted part-time free early learning and childcare for 2 year olds is being rolled out in all Local Authorities coupled with a package of family support for their parents (DCSF 2009). Childcare and Early Years Survey of Parents series In view of the need for evaluative time series data on the impact of its childcare and early years policy interventions, notably on disadvantaged children, the Government initiated a series of childcare surveys soon after taking office. Originating in two separate surveys (Stratford et al. 1997, La Valle et al. 2000), the Childcare and Early Years Survey of Parents series has been undertaken periodically by the National Centre for Social Research since 2004. Just under 7,100 families across England took part in the 2008 survey. This survey, on which the present thematic report is based, once again captures the extent to which provision in England is being taken up by children from families experiencing disadvantage, and any barriers to its use (Speight et al. 2009). While these surveys have identified a steady increase in the use of formal childcare since the introduction of the National Childcare Strategy, a continuing concern, highlighted by the penultimate survey, is:
‘…the concentration of ‘non-users’ of childcare in the lowest income groups, given that a key focus of the Ten Year Childcare Strategy is increasing the use of formal care amongst disadvantaged families, with the ultimate aim of facilitating parents’ move into work and hence alleviating poverty.’ (Kazimirski et al. 2008b: 16)
Once again, the latest survey shows a clear association between family income, employment status, area deprivation and use of childcare and early years provision (Speight et al. 2009). These findings supplement those from other studies of families with dependent children, which have highlighted the challenges of reaching children and families experiencing multiple
8

problems (Ghate and Hazel 2002), despite the introduction of initiatives targeted at disadvantaged areas (Belsky et al. 2007) or at disadvantaged children and their families (Dinos et al. 2006). Multiple disadvantage among families with children The Families and Children Study (FACS) has also identified a small minority of families with dependent children who have not experienced the improvements across a range of outcomes that other families have in the course of the last decade (Lyon et al. 2007). Since 1999, several sweeps of FACS, a panel study of several thousand British families with dependent children, have been conducted by the National Centre for Social Research on behalf of the Department for Work and Pensions. FACS data confirm that a key characteristic of the British families who have not been touched by rising prosperity is their experience of multiple problems. Multiple disadvantage has consequently become a particular focus of concern for the Government, whose research shows that around two per cent of families with children experience five or more disadvantages, a percentage which has remained constant since 2001 (Cabinet Office 2007), and between four and seven per cent of families experience multiple disadvantage persistently (Oroyemi et al. 2009). A joint policy review in this area by HM Treasury and the Department for Children, Schools and Families (HM Treasury and DfES 2007) has informed the Families at Risk review undertaken by the Social Exclusion Task Force (Cabinet Office 2007). This review was based on commissioned research confirming the increased likelihood of poor outcomes at a later age arising from the frequency with which multiple disadvantage is experienced in childhood. A programme for action now aims at improving services with a focus on adults as well as those focusing on children affected by multiple disadvantage (Cabinet Office 2007). Continually improved and appropriate information, and relevant indicators, are required in order to progress these initiatives, and widen the reach of a range of family support, as well as childcare and early years services, to include multiply disadvantaged children and families. However, the challenges of measuring multiple disadvantage remain considerable. Measuring multiple disadvantage Since the present Government took office in 1997, the measurement of what has come to be known as social exclusion has become a key policy issue across Government departments. This was reflected in the establishment of the Social Exclusion Unit (SEU), based in the Cabinet Office, in the same year. From the start, social exclusion has been defined by the SEU, now the Social Exclusion Task Force (SETF), as a multidimensional problem:
‘Social exclusion is a short-hand term for what can happen when people or areas have a combination of problems, such as unemployment, discrimination, poor skills, low incomes, poor housing, high crime and family breakdown. These problems are linked and mutually reinforcing. Social exclusion is an extreme consequence of what happens when people do not get a fair deal throughout their lives and find themselves in difficult situations. This pattern of disadvantage can be transmitted from one generation to the next.’ (SETF 2009)
For some ten years the Government’s own annual poverty survey, Opportunity for All, alongside the Monitoring Poverty and Social Exclusion surveys conducted by the New Policy Institute, has demonstrated trends in social exclusion. Both surveys pay attention to children in the light of the Government’s commitment to the eradication of child poverty by 2020. Since 2004, the English Indices of Deprivation, the Government’s official measure of multiple
9

deprivation at area level, have helped to identify trends better at local level. In a very important development, these local area data have in 2009 been supplemented for the first time by the creation of a small area index exclusively for children in England: the Local Index of Child Well-being (CWI). While not restricted to indices of deprivation, the seven domains include both deprivation indicators as well as others. In respect of such surveys and indices, Levitas et al. (2007) have argued that not only do these forms of measurement tend to rely on single indicators whose interaction cannot be easily measured, but in-depth statistics on multiple disadvantage as experienced by certain sections of the population, including children, have been lacking from most surveys. In order to capture multiple disadvantage better, Levitas and her colleagues recommended adaptations to survey analyses of social exclusion, including FACS, and proposed a new social exclusion index. Certain surveys of children though, notably the Millennium Cohort Study (Hansen and Joshi 2007), the British Household Panel Study (Adelman et al. 2003, Magadi and Middleton 2007) and different waves of the Childcare and Early Years Survey of Parents, form rich sources of information on children’s circumstances and experiences. As such, these surveys are well placed to aid the identification of multiple disadvantage. For the present study, an index of multiple disadvantage has also been specially created on the basis of the survey data (see section 1.3). This enables and enhances the themed analysis of the latest Childcare and Early Years Survey of Parents. In the study of the cumulative effect of multiple disadvantage, models of the interaction of different factors remain contested. Measuring causality with statistical data in analyses of social exclusion indicators should also be approached with caution (Levitas et al. 2006). After exploring six hypotheses about the interaction patterns of multiple disadvantage in employment, Berthoud (2003) concluded that simply adding the independent effects of contributory factors had as much or more explanatory power than other models of their interaction. In the present study, too, the decision has been made to employ a simple additive model for the different factors contributing to multiple disadvantage among the 2008 Childcare and Early Years Survey of Parents sample. In the next section these factors and the study’s methodology are explained further. 1.3 Creating a score of multiple disadvantage Experience of disadvantage can cover a broad range of concepts, which have been explored in a large body of research e.g. Oroyemi et al. (2009), Cabinet Office (2007), Barnes et al. (2005), Barnes et al. (2008) and Brooks-Gunn et al. (1997). In turn, Government initiatives that tackle disadvantage often leave the precise nature of the target groups up to individual Local Authorities. For instance, the autonomy provided to Local Authorities in the Early Education Pilot for Two Year Old Children meant that eligibility for the pilot was determined by many different geographic and economic indicators of disadvantage (Smith et al. 2009b). In section 1.2 we saw that families who experience multiple disadvantage suffer from a combination of linked problems such as unemployment, poor skills, low incomes, poor housing, high crime environments, bad health and family breakdown. An indicator of multiple disadvantage should therefore use a range of these risk factors. Those available in the Childcare and Early Years Survey of Parents data are as follows:2
2 Research also confirms that ethnicity is a key factor predisposing children and their families to poverty (Lloyd 2006, HM Treasury 1999). However, it has not been included as a risk factor in this report because, although information on ethnicity is available in the Childcare and Early Year Survey of Parents, the 2008 data does not distinguish between White British groups and other White groups and as such provides insufficient detail for inclusion in this analysis.
10

1. Lone parent families 2. Non-working families (no parents in paid employment) 3. Families with an annual household income of under £20,000 (or, for families where
income is unknown, being in receipt of Job Seeker’s Allowance, Income Support, Housing Benefit or Council Tax Benefit)
4. Families including three or more children aged 0-143 5. Families living in one of the 20% most disadvantaged areas of the country (as defined
by the Index of Multiple Deprivation) 6. Families where all parents have no or low qualifications (no GCSE/ O Levels at grade
A-C) 7. Families where at least one parent has a long-standing illness or disability 8. Families living in rented accommodation (as a proxy for social housing) 9. Families where at least one child in the household has a special educational need, or
long-standing illness or disability.4 Whilst it is clear that in many cases the factors above do not necessarily indicate that a family is disadvantaged, it is likely that an accumulation of such factors would indicate disadvantage. As such, the analysis in this report uses a sum of these factors as an indicator of families’ level of disadvantage. To create the sum, each factor was given a score of one, which means that the indicator ranges from zero to nine. Since only small numbers of families experience a very high number of disadvantages, the sum was then grouped into quintiles so that the indicator could be used throughout the report to explore differences in childcare use. The profile distribution of children in the Childcare and Early Years Survey across this indicator can be seen in Table 1.1.
Table 1.1 - Level of multiple disadvantage
Base: All children
Number of disadvantages %1st group (no) 0 26 2nd group 1 22 3rd group 2 15 4th group 3 104 9 5th group (high) 5 76 67 38 19 +Unweighted base 7076Weighted base 7076 3 Since this report uses non-equivalised income, number of children has been included to capture the need for household income to spread further in larger families. 4 While it would have been advantageous to have included some measures of bad housing and necessities deprivation, these variables are not available in the Childcare and Early Years Survey. We could not look at children in care because the Childcare and Early Years Survey doesn’t sample institutions.
11

1.4 Defining childcare The definition of ‘childcare and early years provision’ in the Childcare and Early Years Survey of Parents series is very inclusive. Parents were asked to include any time that the child was not with a resident parent or a resident parent’s current partner, or at school. Thus, the definition is much wider than in other studies that focus on childcare use when parents are working or studying, or on early years education. In order to remind parents to include all possible people or organisations that may have looked after their children, they were shown the following list:
Formal providers
• Nursery school • Nursery class attached to primary or infants’ school • Reception class • Special day school or nursery or unit • Day nursery • Playgroup or pre-school • Childminder • Nanny or au pair • Babysitter who came to home • Breakfast / after-school club or activity5 • Holiday club / scheme
Informal providers
• Ex-husband / wife / partner / the child’s other parent (who does not live in this family) • The child’s grandparent(s) • The child’s older brother / sister • Another relative • A friend or neighbour
Other
• Other nursery education provider • Other childcare provider. It is worth noting that this classifies providers according to the service for which they were being used (e.g. day care or early years education) and therefore uses terminology such as ‘nursery schools’ and ‘day nurseries’. The classification does not include forms of integrated provision such as Children’s Centres, which can include a number of the types of childcare and early years education listed above (although the Childcare and Early Years Survey of Parents does ask parents whether or not their provider is part of a Children’s Centre). Reception classes were only included as childcare if it was not compulsory schooling, that is, if the child was aged under 5. Further details of the definitions of the above categories of providers can be found in the technical appendix within the Childcare and Early Years Survey of Parents report (Speight et al. 2009). This inclusive definition of childcare means that parents will have included time when their child was visiting friends or family, at a sport or leisure activity, and so on. The term early years provision also covers both ‘care’ for young children and ‘early years education’.
5 Those parents who used this type of provision were asked separately whether it was based on the same site as the school / nursery school or on a different site.
12
1.5 Report outline The types of childcare families use for their children are strongly related to their children’s ages (Smith et al. 2009a, Speight et al. 2009). For instance, while pre-school children typically attend early years education providers such as nursery schools and day nurseries, school-age children typically attend out-of-school providers such as breakfast and after-school clubs. As such, the influence of other characteristics on childcare use can be seen more clearly when looking at pre-school and school-age children separately. For this reason Chapter 2 of this report focuses on types and amounts of childcare received by pre-school children and Chapter 3 focuses on childcare received by school-age children. The two chapters look at whether and how receipt of childcare varied by the level of disadvantage experienced by children in terms of the types of childcare providers they attended, the number of hours they spent in childcare and the reasons they attended childcare. Chapter 4 examines whether and how parents’ views of the childcare available in their local areas varied by the level of disadvantage they experienced. In particular, it looks at how families had found out about local childcare options and their views on the sufficiency of the information available to them. It also considers parents’ views on the availability, quality and affordability of childcare in their local areas, before turning to the reasons why some families had chosen not to use childcare or early years education. Chapter 5 explores whether and how families’ experiences of disadvantage related to maternal employment, focusing on how childcare and other factors had influenced mothers’ decisions about whether to work, and the reasons mothers gave for not working. 1.6 Interpreting the results This section provides information about the data and tables used in this report to aid interpretation of the findings. Data This analysis is based on data from the Childcare and Early Years Survey of Parents 2008, which is part of a national survey series of over 7,000 parents in England with children aged 0-14 years. The survey collects information on parents’ views and experiences of using childcare. It was conducted by the National Centre for Social Research on behalf of the Department for Children, Schools and Families. The sample was randomly selected from Child Benefit records, since these records provide a comprehensive sampling frame for families with dependent children. Excluding parents who opted out of the study (eight per cent of families), the response rate in the survey was 64%, and the socio-demographic profile of respondents closely matches those of the Child Benefit population (see Speight et al. (2009) for further technical details regarding the Childcare and Early Years Survey of Parents). Weights A weight was applied to the analysis which ensures that the research findings are representative of the population of families in England in receipt of Child Benefit. Full details of the weighting are provided in the 2008 Childcare and Early Years Survey of Parents report (Speight et al. 2009). Bases The tables in this report contain the total number of cases in the whole sample (or in the particular sub-group being analysed), and the base for different columns (e.g. families with a
13

particular level of disadvantage). The total base figure includes all the eligible cases (i.e. all respondents or all respondents who were asked a particular question) minus any coded as ‘don’t know’ or ‘not answered’. Thus, while the base description may be the same across several tables (e.g. all children), the base sizes may differ slightly due to the exclusion of those coded ‘don’t know’ or ‘not answered’. In some tables, the column bases do not add up to the total base and this is mainly because some categories might not be included in the table, either because they are too small or are not useful for the purpose of the analysis. Percentages Due to rounding, percentage figures may not add up to exactly 100%. Furthermore, where the information in tables is based on questions that could yield more than one response, the percentages in the table could add up to more than 100%. Statistical significance Throughout the report, whenever the text comments on differences between sub-groups of the sample, these differences have been tested for statistical significance using the survey commands in SPSS 15.0 or STATA 10.0, and found to be significant at the 95% confidence level or above. Symbols in tables The symbols below have been used in the tables and they denote the following: N/A to indicate that this category does not apply (given the base of the table) [ ] to indicate a percentage based on fewer than 50 respondents, which should be treated
with caution + to indicate a percentage value of less than 0.5% 0 to indicate a percentage value of zero.
14

2 Childcare received by pre-school children 2.1 Introduction Research suggests that experience of multiple disadvantage can have compounding effects on families including a negative association with a range of outcomes for children (Cabinet Office 2007, Oroyemi et al. 2009). However, childcare initiatives provide an important path to improving children’s outcomes, because access to childcare can facilitate parental employment thereby helping to lift children out of poverty, and because research suggests that attending childcare can have a positive influence on children’s development (e.g. Sylva et al. 2004, Smith et al. 2009b, Bradshaw and Wasoff 2009). However, it is known that disadvantaged families (such as non-working families and families with a low income) are less likely to use childcare than families in better circumstances (Speight et al. 2009). Less research has been conducted into childcare use by multiply disadvantaged families. This chapter explores the relationship between multiple disadvantage and children’s receipt of childcare. In particular, the chapter focuses on the relationship between multiple disadvantage and the childcare received by pre-school children.6 First, it investigates the types of childcare received by pre-school children, and how this differs for children aged 0-2 and 3-4. It then explores take-up of the free entitlement to early years education by 3 and 4 year olds experiencing multiple disadvantage, before moving on to look at the packages of childcare received by pre-school children, the number of hours these children attend childcare, and the reasons they do so. All analysis relates to childcare use during a term time reference week. 2.2 Types of childcare children receive Formal and informal childcare received by pre-school children Table 2.1 shows clear associations between receipt of childcare and multiple disadvantage, whereby the more disadvantage pre-school children experienced, the less likely they were to have received any form of childcare. For example, 60% of pre-school children who experienced the highest level of multiple disadvantage received some form of childcare in the reference term time week compared with 73% of all pre-school children and 81% of children who experienced no disadvantage. This difference in the receipt of childcare is driven largely by the receipt of formal childcare, since 70% of children who were not disadvantaged received formal childcare compared with 43% of the most multiply disadvantaged children. In particular, children who experienced multiple disadvantage were less likely to attend day nurseries, playgroups, and childminders, which may reflect the lower employment rate among families experiencing multiple disadvantage, and the role day nurseries and childminders play in supporting parental employment (Smith et al. 2009a, Butt et al. 2007). The lack of association between level of disadvantage and pre-school children’s attendance at nursery schools, nursery classes and reception classes (which are mostly state funded) is indicative of the success of the free entitlement to early years education for 3 and 4 year olds. Recent research suggests that these forms of provision are disproportionately located in disadvantaged areas (Philips et al. 2009) and that disadvantaged children are more likely to receive their free entitlement in maintained provision (Ball and Vincent 2005). However, it appears that there is still more work to be done in improving take-up of the free entitlement
6 Pre-school children are defined as those aged 0-4, therefore some pre-school children may be attending a reception class.
15
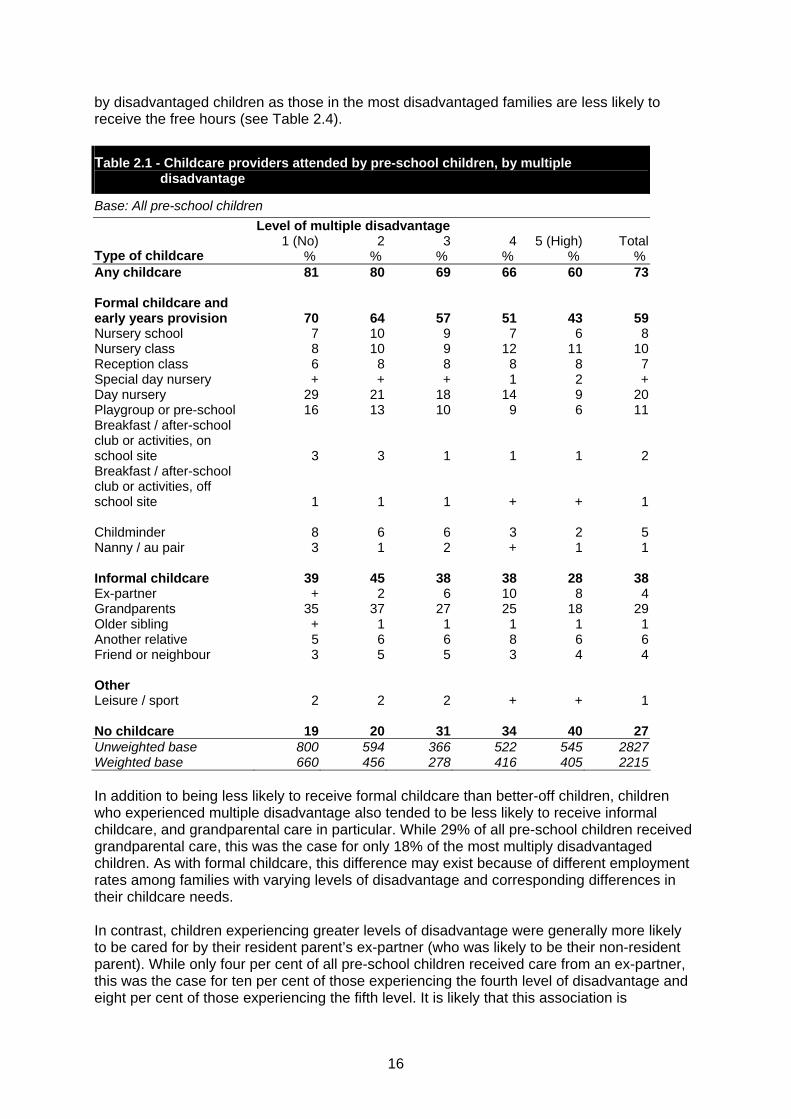
by disadvantaged children as those in the most disadvantaged families are less likely to receive the free hours (see Table 2.4).
Table 2.1 - Childcare providers attended by pre-school children, by multiple disadvantage
Base: All pre-school children
Level of multiple disadvantage 1 (No) 2 3 4 5 (High) Total
Type of childcare % % % % % % Any childcare 81 80 69 66 60 73 Formal childcare and early years provision 70 64 57 51 43 59 Nursery school 7 10 9 7 6 8 Nursery class 8 10 9 12 11 10 Reception class 6 8 8 8 8 7 Special day nursery + + + 1 2 + Day nursery 29 21 18 14 9 20 Playgroup or pre-school 16 13 10 9 6 11 Breakfast / after-school club or activities, on school site 3 3 1 1 1 2 Breakfast / after-school club or activities, off school site 1 1 1 + + 1 Childminder 8 6 6 3 2 5 Nanny / au pair 3 1 2 + 1 1 Informal childcare 39 45 38 38 28 38 Ex-partner + 2 6 10 8 4 Grandparents 35 37 27 25 18 29 Older sibling + 1 1 1 1 1 Another relative 5 6 6 8 6 6 Friend or neighbour 3 5 5 3 4 4 Other Leisure / sport 2 2 2 + + 1 No childcare 19 20 31 34 40 27 Unweighted base 800 594 366 522 545 2827 Weighted base 660 456 278 416 405 2215
In addition to being less likely to receive formal childcare than better-off children, children who experienced multiple disadvantage also tended to be less likely to receive informal childcare, and grandparental care in particular. While 29% of all pre-school children received grandparental care, this was the case for only 18% of the most multiply disadvantaged children. As with formal childcare, this difference may exist because of different employment rates among families with varying levels of disadvantage and corresponding differences in their childcare needs. In contrast, children experiencing greater levels of disadvantage were generally more likely to be cared for by their resident parent’s ex-partner (who was likely to be their non-resident parent). While only four per cent of all pre-school children received care from an ex-partner, this was the case for ten per cent of those experiencing the fourth level of disadvantage and eight per cent of those experiencing the fifth level. It is likely that this association is
16
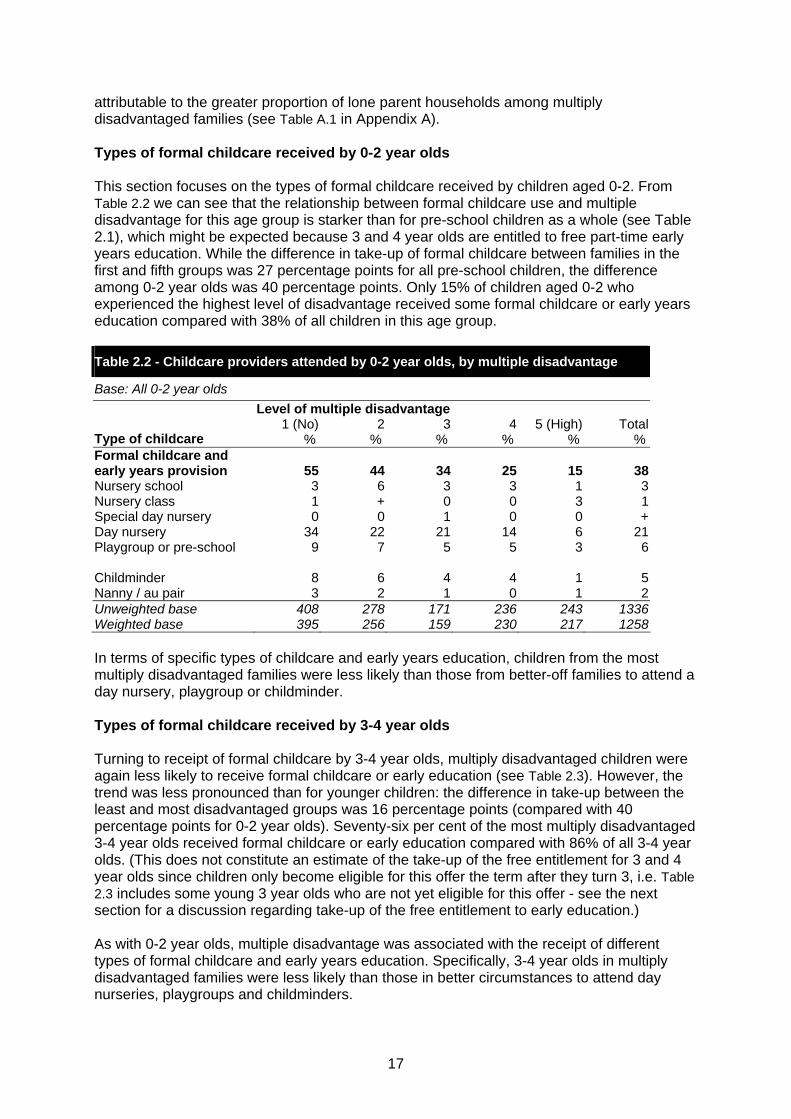
attributable to the greater proportion of lone parent households among multiply disadvantaged families (see Table A.1 in Appendix A). Types of formal childcare received by 0-2 year olds This section focuses on the types of formal childcare received by children aged 0-2. From Table 2.2 we can see that the relationship between formal childcare use and multiple disadvantage for this age group is starker than for pre-school children as a whole (see Table 2.1), which might be expected because 3 and 4 year olds are entitled to free part-time early years education. While the difference in take-up of formal childcare between families in the first and fifth groups was 27 percentage points for all pre-school children, the difference among 0-2 year olds was 40 percentage points. Only 15% of children aged 0-2 who experienced the highest level of disadvantage received some formal childcare or early years education compared with 38% of all children in this age group.
Table 2.2 - Childcare providers attended by 0-2 year olds, by multiple disadvantage
Base: All 0-2 year olds
Level of multiple disadvantage 1 (No) 2 3 4 5 (High) Total
Type of childcare % % % % % % Formal childcare and early years provision 55 44 34 25 15 38 Nursery school 3 6 3 3 1 3 Nursery class 1 + 0 0 3 1 Special day nursery 0 0 1 0 0 + Day nursery 34 22 21 14 6 21 Playgroup or pre-school 9 7 5 5 3 6 Childminder 8 6 4 4 1 5 Nanny / au pair 3 2 1 0 1 2 Unweighted base 408 278 171 236 243 1336 Weighted base 395 256 159 230 217 1258 In terms of specific types of childcare and early years education, children from the most multiply disadvantaged families were less likely than those from better-off families to attend a day nursery, playgroup or childminder. Types of formal childcare received by 3-4 year olds Turning to receipt of formal childcare by 3-4 year olds, multiply disadvantaged children were again less likely to receive formal childcare or early education (see Table 2.3). However, the trend was less pronounced than for younger children: the difference in take-up between the least and most disadvantaged groups was 16 percentage points (compared with 40 percentage points for 0-2 year olds). Seventy-six per cent of the most multiply disadvantaged 3-4 year olds received formal childcare or early education compared with 86% of all 3-4 year olds. (This does not constitute an estimate of the take-up of the free entitlement for 3 and 4 year olds since children only become eligible for this offer the term after they turn 3, i.e. Table 2.3 includes some young 3 year olds who are not yet eligible for this offer - see the next section for a discussion regarding take-up of the free entitlement to early education.) As with 0-2 year olds, multiple disadvantage was associated with the receipt of different types of formal childcare and early years education. Specifically, 3-4 year olds in multiply disadvantaged families were less likely than those in better circumstances to attend day nurseries, playgroups and childminders.
17

Table 2.3 - Childcare providers attended by 3-4 year olds, by multiple disadvantage
Base: All 3-4 year olds
Level of multiple disadvantage 1 (No) 2 3 4 5 (High) Total
Type of childcare % % % % % % Formal childcare and early years provision 92 89 88 83 76 86 Nursery school 13 15 18 13 13 14 Nursery class 19 23 22 26 22 22 Reception class 15 18 19 18 18 17 Special day nursery + + 0 1 3 1 Day nursery 22 20 15 15 12 17 Playgroup or pre-school 26 20 17 13 9 17 Breakfast / after-school club or activities, on school site 7 7 2 1 2 4 Breakfast / after-school club or activities, off school site 2 1 1 1 + 1 Childminder 8 6 9 3 2 6 Nanny / au pair 2 1 3 + 0 1 Unweighted base 392 316 195 286 302 1491 Weighted base 264 200 119 186 188 957 Receipt of the free entitlement to early years education by 3 to 4 year old children Now we focus on receipt of the free entitlement to early years education (12.5 hours per week in most areas) by eligible 3 and 4 year olds.7 These figures are based on whether the child received any early years education as recorded at the beginning of the interview, as well as on a separate question about receiving the ‘free’ hours.8 In Table 2.4 a clear trend can be seen whereby the more disadvantage children experienced the less likely they were to receive any early years education. While overall only seven per cent of eligible 3 and 4 year olds received no early years education9 in the term time reference week, this was the case for 16% of the most multiply disadvantaged children. This is a concern because research suggests that high quality early education can help improve children’s development (Sylva et al. 2004, Smith et al. 2009b), meaning that low take-up of early education could lead to disadvantaged children falling behind their more affluent peers at a very young age (see Feinstein et al. 2008). As discussed in section 4.5, lack of awareness of the free entitlement may be part of an explanation why multiply disadvantaged families are less likely to use early education for their 3 and 4 year old children than families in better circumstances.
7 Children are eligible for the free entitlement from 1 April, 1 September or 1 January following their 3rd birthday, and are entitled to up to six terms of provision before reaching statutory school age, which is the first term following their 5th birthday. However, even though it is not compulsory for children to attend school until the first term following their 5th birthday, more than half of 4 year olds attend school full- or part-time (usually, a reception class). The base for the figures on the free entitlement is all children who are eligible. To ensure that the take-up of the free entitlement does not appear artificially low, children attending school are included here in the proportion of children receiving the free entitlement (even though they were not asked the question about the free hours). 8 This question was asked only of those parents who reported that their child was receiving early years education; however, it was not asked if early years education was received through attending a reception class only. 9 Early years education is defined as: nursery school, nursery class, day nursery, special day school / nursery, playgroup / pre-school, childminder and other nursery education provider. Children aged 3-4 who attended school (full- or part-time) are also considered to be receiving early years education.
18
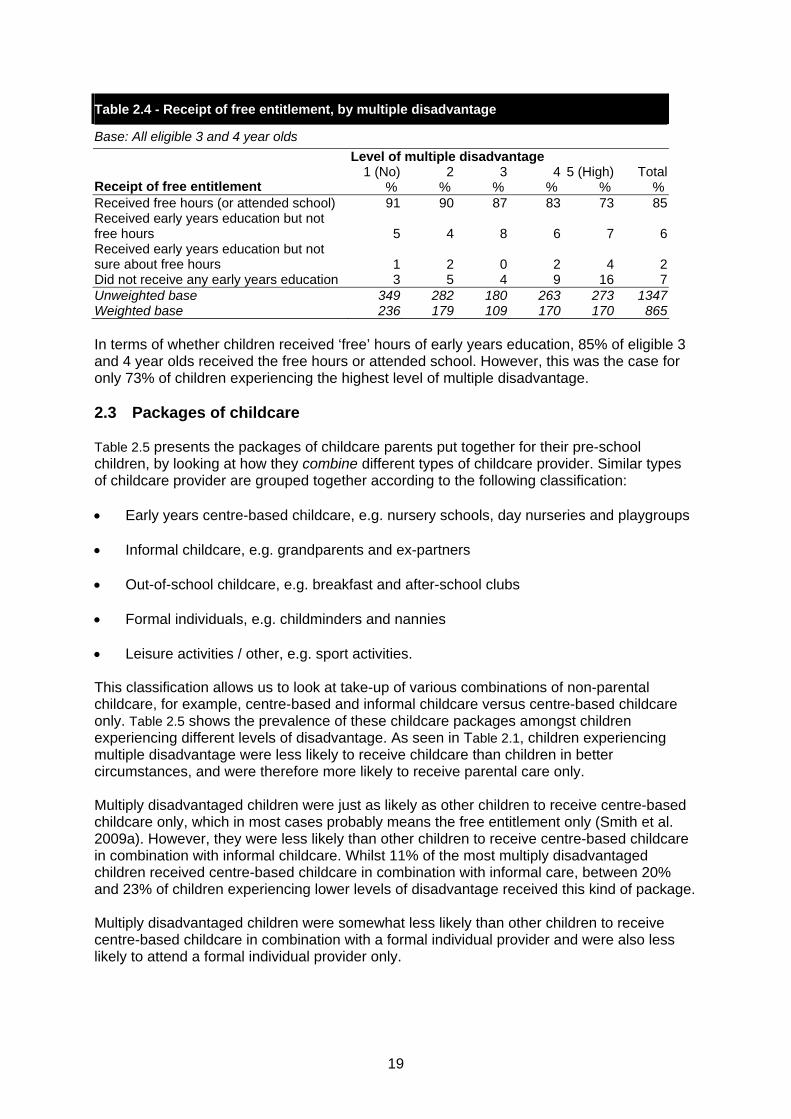
Table 2.4 - Receipt of free entitlement, by multiple disadvantage
Base: All eligible 3 and 4 year olds
Level of multiple disadvantage 1 (No) 2 3 4 5 (High) Total
Receipt of free entitlement % % % % % %Received free hours (or attended school) 91 90 87 83 73 85Received early years education but not free hours 5 4 8 6 7 6Received early years education but not sure about free hours 1 2 0 2 4 2Did not receive any early years education 3 5 4 9 16 7Unweighted base 349 282 180 263 273 1347Weighted base 236 179 109 170 170 865 In terms of whether children received ‘free’ hours of early years education, 85% of eligible 3 and 4 year olds received the free hours or attended school. However, this was the case for only 73% of children experiencing the highest level of multiple disadvantage. 2.3 Packages of childcare Table 2.5 presents the packages of childcare parents put together for their pre-school children, by looking at how they combine different types of childcare provider. Similar types of childcare provider are grouped together according to the following classification: • Early years centre-based childcare, e.g. nursery schools, day nurseries and playgroups
• Informal childcare, e.g. grandparents and ex-partners
• Out-of-school childcare, e.g. breakfast and after-school clubs
• Formal individuals, e.g. childminders and nannies
• Leisure activities / other, e.g. sport activities. This classification allows us to look at take-up of various combinations of non-parental childcare, for example, centre-based and informal childcare versus centre-based childcare only. Table 2.5 shows the prevalence of these childcare packages amongst children experiencing different levels of disadvantage. As seen in Table 2.1, children experiencing multiple disadvantage were less likely to receive childcare than children in better circumstances, and were therefore more likely to receive parental care only. Multiply disadvantaged children were just as likely as other children to receive centre-based childcare only, which in most cases probably means the free entitlement only (Smith et al. 2009a). However, they were less likely than other children to receive centre-based childcare in combination with informal childcare. Whilst 11% of the most multiply disadvantaged children received centre-based childcare in combination with informal care, between 20% and 23% of children experiencing lower levels of disadvantage received this kind of package. Multiply disadvantaged children were somewhat less likely than other children to receive centre-based childcare in combination with a formal individual provider and were also less likely to attend a formal individual provider only.
19
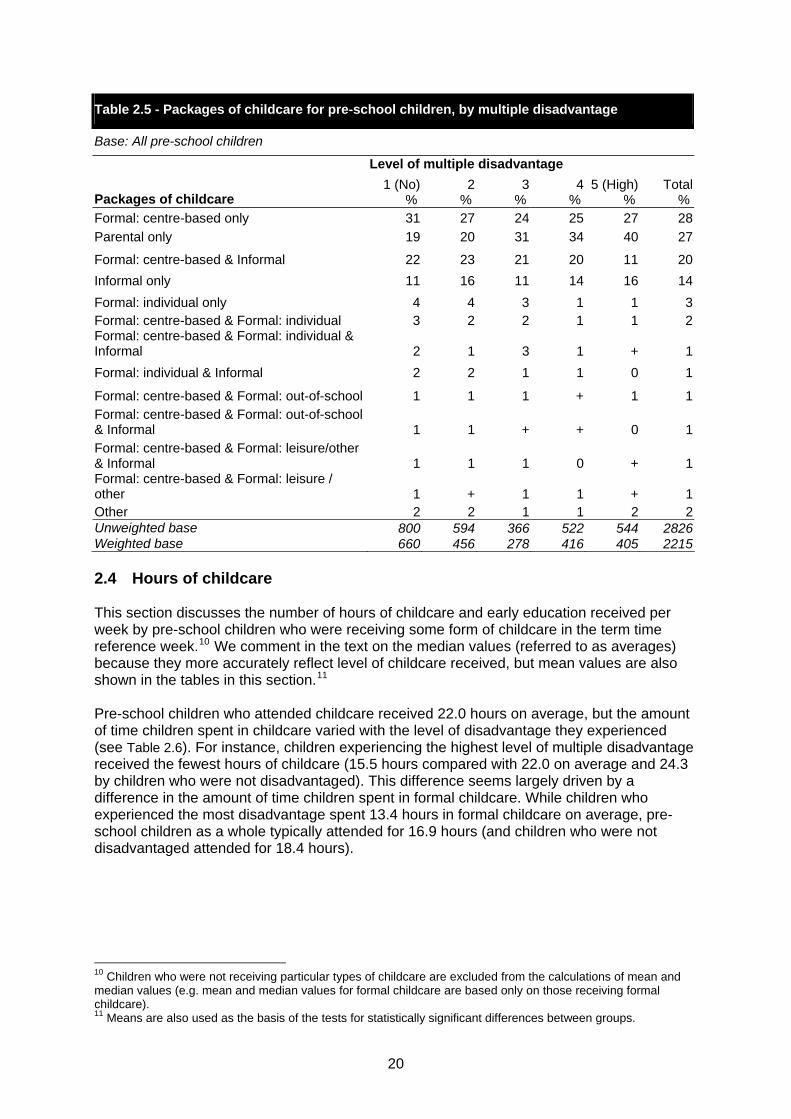
Table 2.5 - Packages of childcare for pre-school children, by multiple disadvantage
Base: All pre-school children
Level of multiple disadvantage
1 (No) 2 3 4 5 (High) TotalPackages of childcare % % % % % %Formal: centre-based only 31 27 24 25 27 28
Parental only 19 20 31 34 40 27
Formal: centre-based & Informal 22 23 21 20 11 20
Informal only 11 16 11 14 16 14
Formal: individual only 4 4 3 1 1 3Formal: centre-based & Formal: individual 3 2 2 1 1 2Formal: centre-based & Formal: individual & Informal 2 1 3 1 + 1
Formal: individual & Informal 2 2 1 1 0 1
Formal: centre-based & Formal: out-of-school 1 1 1 + 1 1Formal: centre-based & Formal: out-of-school & Informal 1 1 + + 0 1Formal: centre-based & Formal: leisure/other & Informal 1 1 1 0 + 1Formal: centre-based & Formal: leisure / other 1 + 1 1 + 1Other 2 2 1 1 2 2Unweighted base 800 594 366 522 544 2826Weighted base 660 456 278 416 405 2215 2.4 Hours of childcare This section discusses the number of hours of childcare and early education received per week by pre-school children who were receiving some form of childcare in the term time reference week.10 We comment in the text on the median values (referred to as averages) because they more accurately reflect level of childcare received, but mean values are also shown in the tables in this section.11 Pre-school children who attended childcare received 22.0 hours on average, but the amount of time children spent in childcare varied with the level of disadvantage they experienced (see Table 2.6). For instance, children experiencing the highest level of multiple disadvantage received the fewest hours of childcare (15.5 hours compared with 22.0 on average and 24.3 by children who were not disadvantaged). This difference seems largely driven by a difference in the amount of time children spent in formal childcare. While children who experienced the most disadvantage spent 13.4 hours in formal childcare on average, pre-school children as a whole typically attended for 16.9 hours (and children who were not disadvantaged attended for 18.4 hours).
10 Children who were not receiving particular types of childcare are excluded from the calculations of mean and median values (e.g. mean and median values for formal childcare are based only on those receiving formal childcare). 11 Means are also used as the basis of the tests for statistically significant differences between groups.
20
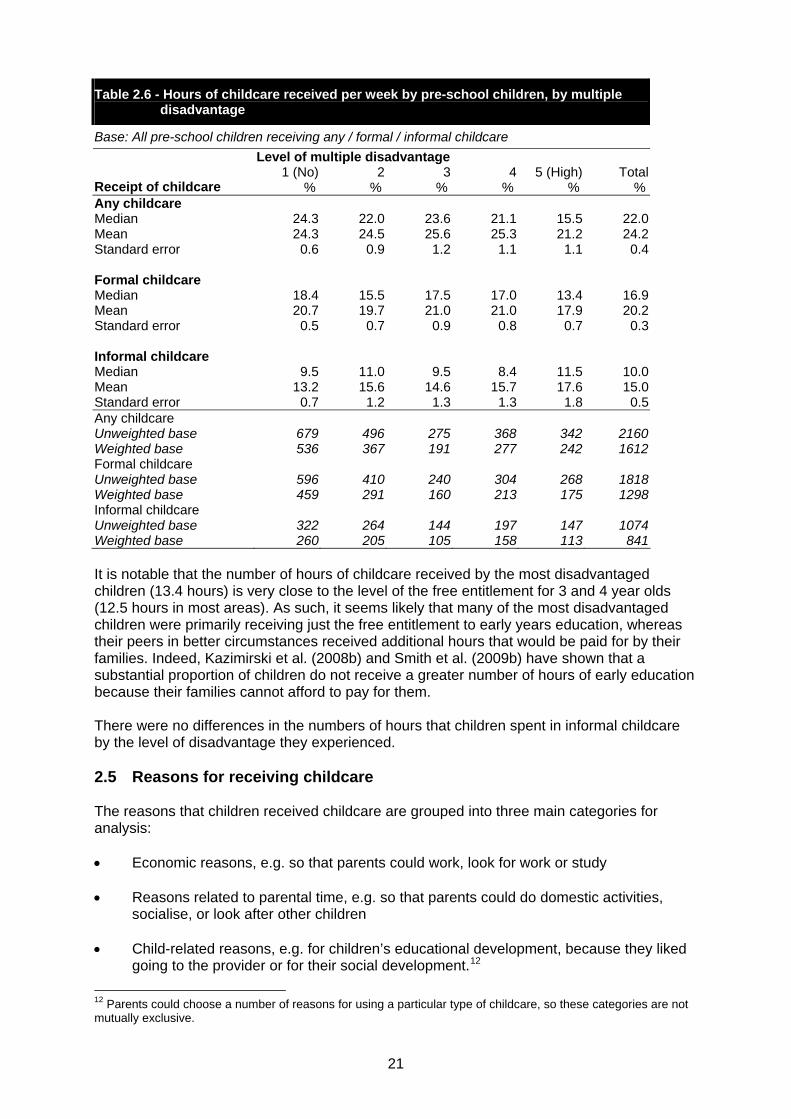
Table 2.6 - Hours of childcare received per week by pre-school children, by multiple disadvantage
Base: All pre-school children receiving any / formal / informal childcare
Level of multiple disadvantage 1 (No) 2 3 4 5 (High) Total
Receipt of childcare % % % % % % Any childcare Median 24.3 22.0 23.6 21.1 15.5 22.0 Mean 24.3 24.5 25.6 25.3 21.2 24.2 Standard error 0.6 0.9 1.2 1.1 1.1 0.4 Formal childcare Median 18.4 15.5 17.5 17.0 13.4 16.9 Mean 20.7 19.7 21.0 21.0 17.9 20.2 Standard error 0.5 0.7 0.9 0.8 0.7 0.3 Informal childcare Median 9.5 11.0 9.5 8.4 11.5 10.0 Mean 13.2 15.6 14.6 15.7 17.6 15.0 Standard error 0.7 1.2 1.3 1.3 1.8 0.5 Any childcare Unweighted base 679 496 275 368 342 2160 Weighted base 536 367 191 277 242 1612 Formal childcare Unweighted base 596 410 240 304 268 1818 Weighted base 459 291 160 213 175 1298 Informal childcare Unweighted base 322 264 144 197 147 1074 Weighted base 260 205 105 158 113 841
It is notable that the number of hours of childcare received by the most disadvantaged children (13.4 hours) is very close to the level of the free entitlement for 3 and 4 year olds (12.5 hours in most areas). As such, it seems likely that many of the most disadvantaged children were primarily receiving just the free entitlement to early years education, whereas their peers in better circumstances received additional hours that would be paid for by their families. Indeed, Kazimirski et al. (2008b) and Smith et al. (2009b) have shown that a substantial proportion of children do not receive a greater number of hours of early education because their families cannot afford to pay for them. There were no differences in the numbers of hours that children spent in informal childcare by the level of disadvantage they experienced. 2.5 Reasons for receiving childcare The reasons that children received childcare are grouped into three main categories for analysis: • Economic reasons, e.g. so that parents could work, look for work or study • Reasons related to parental time, e.g. so that parents could do domestic activities,
socialise, or look after other children • Child-related reasons, e.g. for children’s educational development, because they liked
going to the provider or for their social development.12
12 Parents could choose a number of reasons for using a particular type of childcare, so these categories are not mutually exclusive.
21

Overall, pre-school children were most likely to receive childcare for reasons related to their development or enjoyment (66% of all pre-school children). Furthermore, pre-school children were equally likely to receive childcare for child-related reasons, irrespective of the level of disadvantage they experienced. However, in terms of the other reasons that pre-school children received childcare, these strongly reflected the differing work status of families experiencing varying levels of disadvantage (see Figure 2.1). For example, the more disadvantage children experienced the less likely they were to receive childcare for economic reasons i.e. so that their parents could work or study. Seventy-one per cent of pre-school children who experienced no disadvantage received childcare for economic reasons, whereas this was the case for only 26% of children experiencing the highest level of multiple disadvantage. In contrast, children who experienced the most multiple disadvantage were more likely to receive childcare for reasons related to parental time e.g. so that their parent could go shopping, socialise or look after the home or other children.
Figure 2.1 - Reasons for receipt of childcare by pre-school children, by multiple disadvantage
0
10
20
30
40
50
60
70
80
1 (no) 2 3 4 5(high)
Level of multiple disadvantage
Per
cen
t
Economic
Child development/ enjoyment
Parental time
Base: All pre-school children receiving childcare
Source: Table B2.1 in Appendix B. 2.6 Summary • Sixty per cent of pre-school children who experienced the highest level of multiple
disadvantage received some form of childcare in the reference term time week, compared with 73% of all pre-school children and 81% of children who were not disadvantaged.
• The differences seen in take-up of childcare are largely driven by take-up of formal
childcare. The most multiply disadvantaged children were less likely to receive formal childcare than children in better circumstances (43% compared with 59% of all pre-school children and 70% of children who were not disadvantaged). This was particularly the case for 0-2 year olds where 55% of children who were not disadvantaged received formal childcare compared with 15% of the most disadvantaged.
• With regard to the free entitlement to early years education for 3 and 4 year olds, the
more disadvantage children experienced, the less likely they were to receive the free hours or attend an early education setting.
22

• The types of formal childcare multiply disadvantaged children were less likely to attend were: day nurseries, playgroups and childminders. This may reflect the lower employment rate among families experiencing multiple disadvantage, and the role day nurseries and childminders play in supporting parental employment.
• In terms of informal childcare, multiply disadvantaged children were less likely to be
looked after by their grandparents. • Pre-school children experiencing the most disadvantage spent an average (median) of
15.5 hours in childcare in the term time reference week, which was lower than the average amount of time all pre-school children spent in childcare (22.0 hours). This difference is largely driven by a difference in the amount of time children spent in formal childcare.
• Overall, pre-school children most commonly received childcare for reasons related to
their development and enjoyment. This was equally likely for all pre-school irrespective of the level of disadvantage they experienced.
• In contrast, the other reasons pre-school children received childcare strongly reflect the
differing work status of families experiencing varying levels of disadvantage. Children experiencing multiple disadvantage were less likely to receive childcare for economic reasons (i.e. so that parents could work) and were instead more likely to receive childcare for reasons related to parental time (i.e. so that parents could do domestic activities, socialise, or look after other children).
23
3 Childcare received by school-age children 3.1 Introduction Like Chapter 2, this chapter explores the relationship between multiple disadvantage and children’s receipt of childcare - however, here the focus is on receipt of childcare by school-age children.13 The analysis focuses on how multiple disadvantage influences the childcare received by school-age children in terms of the types of childcare provider and packages of childcare they receive during term time, the number of hours school-age children attend childcare, and the reasons they do so. The last part of this chapter discusses take-up of childcare during the school holidays and how this varies by the level of disadvantage children experience. 3.2 Types of childcare children receive We saw in Chapter 2 that pre-school children who experienced multiple disadvantage were less likely to receive childcare than pre-school children in better circumstances. Table 3.1 demonstrates that the same trend exists for school-age children. While 59% of all school-age children received some form of childcare during the term time reference week, this was the case for only 43% of school-age children who experienced the most disadvantage. As for pre-school children, the association between receipt of childcare and multiple disadvantage can largely be attributed to differential receipt of formal childcare. We can see from Table 3.1 that the more disadvantage school-age children experienced, the less likely they were to receive formal childcare. For instance, among all school-age children, 38% received some formal childcare over the term time reference week, but only 23% of the most multiply disadvantaged children did so. In particular, children experiencing multiple disadvantage were less likely to attend a breakfast or after-school club (both those on and off a school site) and were also less likely to go to a childminder than their peers in better circumstances. It is likely that these differences reflect both families’ requirements for childcare and their ability to pay. For instance, since multiply disadvantaged families are less likely to be employed than families in better circumstances, they are likely to have less need for childcare. Furthermore, since multiply disadvantaged families tend to have lower household incomes, it is likely that they are less able to afford childcare than families in better circumstances. Such differences were not restricted to formal childcare, however. There was also an association between experience of disadvantage and grandparental care, with the most multiply disadvantaged children being the least likely to receive care from their grandparents (13% compared with 18% of all school-age children and 21% of children who experienced no disadvantage, see Table 3.1).
13 School-age children are defined as those aged 5-14.
24
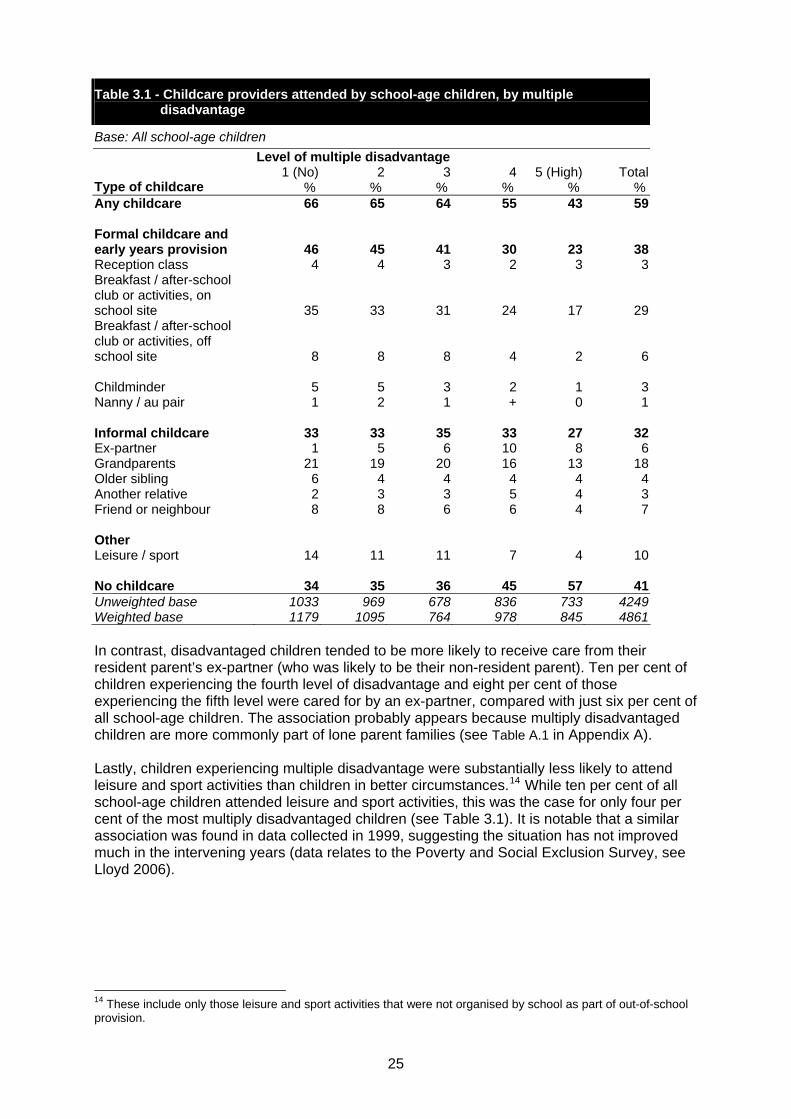
Table 3.1 - Childcare providers attended by school-age children, by multiple disadvantage
Base: All school-age children
Level of multiple disadvantage 1 (No) 2 3 4 5 (High) Total
Type of childcare % % % % % % Any childcare 66 65 64 55 43 59 Formal childcare and early years provision 46 45 41 30 23 38 Reception class 4 4 3 2 3 3 Breakfast / after-school club or activities, on school site 35 33 31 24 17 29 Breakfast / after-school club or activities, off school site 8 8 8 4 2 6 Childminder 5 5 3 2 1 3 Nanny / au pair 1 2 1 + 0 1 Informal childcare 33 33 35 33 27 32 Ex-partner 1 5 6 10 8 6 Grandparents 21 19 20 16 13 18 Older sibling 6 4 4 4 4 4 Another relative 2 3 3 5 4 3 Friend or neighbour 8 8 6 6 4 7 Other Leisure / sport 14 11 11 7 4 10 No childcare 34 35 36 45 57 41 Unweighted base 1033 969 678 836 733 4249 Weighted base 1179 1095 764 978 845 4861
In contrast, disadvantaged children tended to be more likely to receive care from their resident parent’s ex-partner (who was likely to be their non-resident parent). Ten per cent of children experiencing the fourth level of disadvantage and eight per cent of those experiencing the fifth level were cared for by an ex-partner, compared with just six per cent of all school-age children. The association probably appears because multiply disadvantaged children are more commonly part of lone parent families (see Table A.1 in Appendix A). Lastly, children experiencing multiple disadvantage were substantially less likely to attend leisure and sport activities than children in better circumstances.14 While ten per cent of all school-age children attended leisure and sport activities, this was the case for only four per cent of the most multiply disadvantaged children (see Table 3.1). It is notable that a similar association was found in data collected in 1999, suggesting the situation has not improved much in the intervening years (data relates to the Poverty and Social Exclusion Survey, see Lloyd 2006).
14 These include only those leisure and sport activities that were not organised by school as part of out-of-school provision.
25
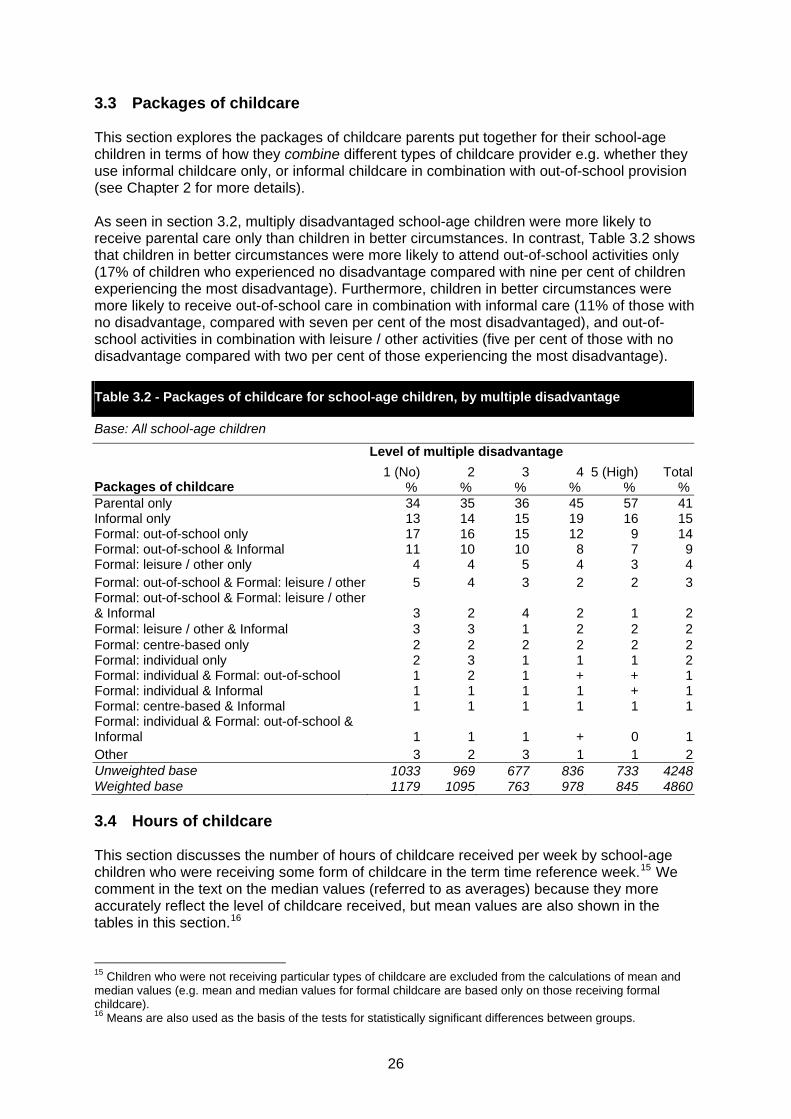
3.3 Packages of childcare This section explores the packages of childcare parents put together for their school-age children in terms of how they combine different types of childcare provider e.g. whether they use informal childcare only, or informal childcare in combination with out-of-school provision (see Chapter 2 for more details). As seen in section 3.2, multiply disadvantaged school-age children were more likely to receive parental care only than children in better circumstances. In contrast, Table 3.2 shows that children in better circumstances were more likely to attend out-of-school activities only (17% of children who experienced no disadvantage compared with nine per cent of children experiencing the most disadvantage). Furthermore, children in better circumstances were more likely to receive out-of-school care in combination with informal care (11% of those with no disadvantage, compared with seven per cent of the most disadvantaged), and out-of-school activities in combination with leisure / other activities (five per cent of those with no disadvantage compared with two per cent of those experiencing the most disadvantage).
Table 3.2 - Packages of childcare for school-age children, by multiple disadvantage
Base: All school-age children
Level of multiple disadvantage
1 (No) 2 3 4 5 (High) TotalPackages of childcare % % % % % %Parental only 34 35 36 45 57 41Informal only 13 14 15 19 16 15Formal: out-of-school only 17 16 15 12 9 14Formal: out-of-school & Informal 11 10 10 8 7 9Formal: leisure / other only 4 4 5 4 3 4Formal: out-of-school & Formal: leisure / other 5 4 3 2 2 3Formal: out-of-school & Formal: leisure / other & Informal 3 2 4 2 1 2Formal: leisure / other & Informal 3 3 1 2 2 2Formal: centre-based only 2 2 2 2 2 2Formal: individual only 2 3 1 1 1 2Formal: individual & Formal: out-of-school 1 2 1 + + 1Formal: individual & Informal 1 1 1 1 + 1Formal: centre-based & Informal 1 1 1 1 1 1Formal: individual & Formal: out-of-school & Informal 1 1 1 + 0 1Other 3 2 3 1 1 2Unweighted base 1033 969 677 836 733 4248Weighted base 1179 1095 763 978 845 4860 3.4 Hours of childcare This section discusses the number of hours of childcare received per week by school-age children who were receiving some form of childcare in the term time reference week.15 We comment in the text on the median values (referred to as averages) because they more accurately reflect the level of childcare received, but mean values are also shown in the tables in this section.16
15 Children who were not receiving particular types of childcare are excluded from the calculations of mean and median values (e.g. mean and median values for formal childcare are based only on those receiving formal childcare). 16 Means are also used as the basis of the tests for statistically significant differences between groups.
26
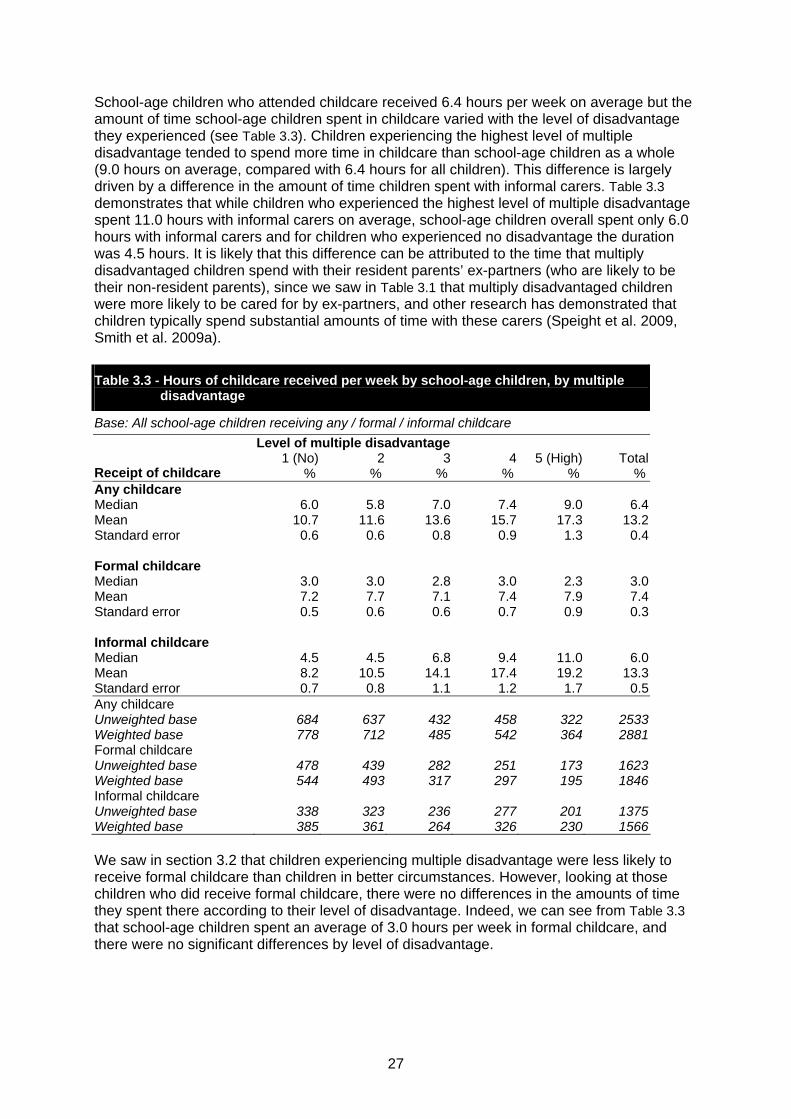
School-age children who attended childcare received 6.4 hours per week on average but the amount of time school-age children spent in childcare varied with the level of disadvantage they experienced (see Table 3.3). Children experiencing the highest level of multiple disadvantage tended to spend more time in childcare than school-age children as a whole (9.0 hours on average, compared with 6.4 hours for all children). This difference is largely driven by a difference in the amount of time children spent with informal carers. Table 3.3 demonstrates that while children who experienced the highest level of multiple disadvantage spent 11.0 hours with informal carers on average, school-age children overall spent only 6.0 hours with informal carers and for children who experienced no disadvantage the duration was 4.5 hours. It is likely that this difference can be attributed to the time that multiply disadvantaged children spend with their resident parents’ ex-partners (who are likely to be their non-resident parents), since we saw in Table 3.1 that multiply disadvantaged children were more likely to be cared for by ex-partners, and other research has demonstrated that children typically spend substantial amounts of time with these carers (Speight et al. 2009, Smith et al. 2009a).
Table 3.3 - Hours of childcare received per week by school-age children, by multiple disadvantage
Base: All school-age children receiving any / formal / informal childcare
Level of multiple disadvantage 1 (No) 2 3 4 5 (High) Total
Receipt of childcare % % % % % % Any childcare Median 6.0 5.8 7.0 7.4 9.0 6.4 Mean 10.7 11.6 13.6 15.7 17.3 13.2 Standard error 0.6 0.6 0.8 0.9 1.3 0.4 Formal childcare Median 3.0 3.0 2.8 3.0 2.3 3.0 Mean 7.2 7.7 7.1 7.4 7.9 7.4 Standard error 0.5 0.6 0.6 0.7 0.9 0.3 Informal childcare Median 4.5 4.5 6.8 9.4 11.0 6.0 Mean 8.2 10.5 14.1 17.4 19.2 13.3 Standard error 0.7 0.8 1.1 1.2 1.7 0.5 Any childcare Unweighted base 684 637 432 458 322 2533 Weighted base 778 712 485 542 364 2881 Formal childcare Unweighted base 478 439 282 251 173 1623 Weighted base 544 493 317 297 195 1846 Informal childcare Unweighted base 338 323 236 277 201 1375 Weighted base 385 361 264 326 230 1566
We saw in section 3.2 that children experiencing multiple disadvantage were less likely to receive formal childcare than children in better circumstances. However, looking at those children who did receive formal childcare, there were no differences in the amounts of time they spent there according to their level of disadvantage. Indeed, we can see from Table 3.3 that school-age children spent an average of 3.0 hours per week in formal childcare, and there were no significant differences by level of disadvantage.
27
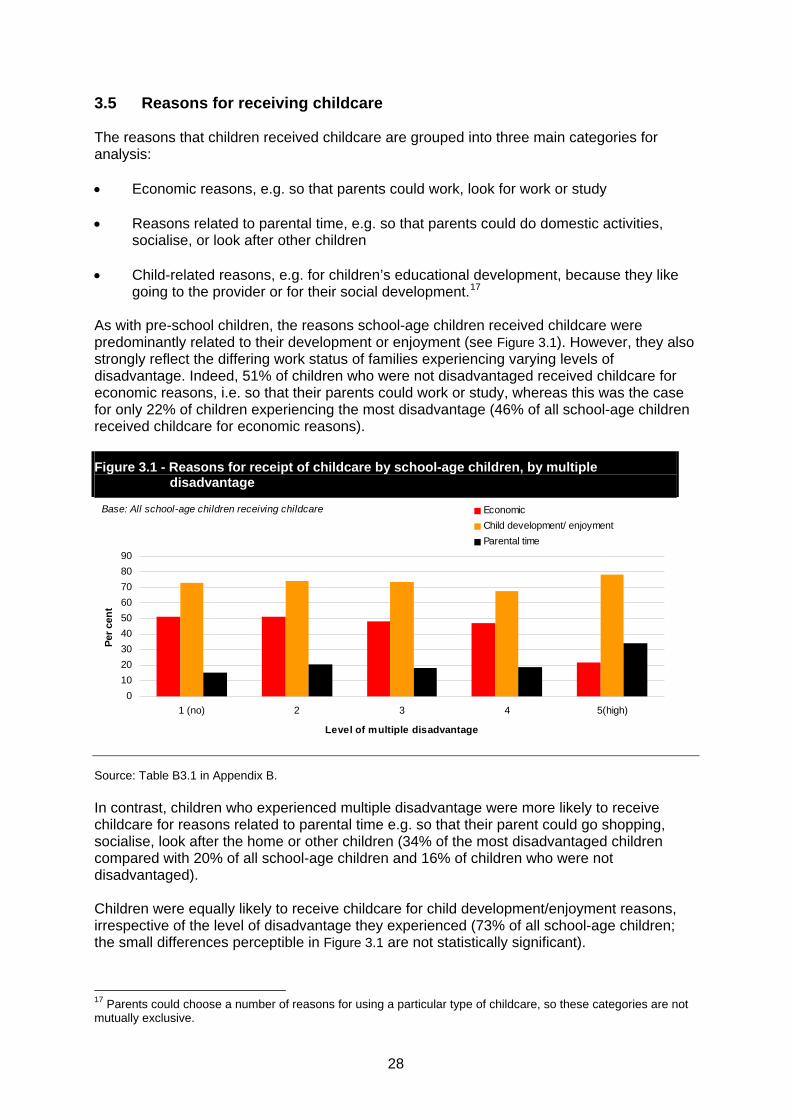
3.5 Reasons for receiving childcare The reasons that children received childcare are grouped into three main categories for analysis: • Economic reasons, e.g. so that parents could work, look for work or study • Reasons related to parental time, e.g. so that parents could do domestic activities,
socialise, or look after other children • Child-related reasons, e.g. for children’s educational development, because they like
going to the provider or for their social development.17 As with pre-school children, the reasons school-age children received childcare were predominantly related to their development or enjoyment (see Figure 3.1). However, they also strongly reflect the differing work status of families experiencing varying levels of disadvantage. Indeed, 51% of children who were not disadvantaged received childcare for economic reasons, i.e. so that their parents could work or study, whereas this was the case for only 22% of children experiencing the most disadvantage (46% of all school-age children received childcare for economic reasons).
Figure 3.1 - Reasons for receipt of childcare by school-age children, by multiple disadvantage
0
10
20
30
40
50
60
70
80
90
1 (no) 2 3 4 5(high)
Level of multiple disadvantage
Per
cen
t
Economic
Child development/ enjoyment
Parental time
Base: All school-age children receiving childcare
Source: Table B3.1 in Appendix B. In contrast, children who experienced multiple disadvantage were more likely to receive childcare for reasons related to parental time e.g. so that their parent could go shopping, socialise, look after the home or other children (34% of the most disadvantaged children compared with 20% of all school-age children and 16% of children who were not disadvantaged). Children were equally likely to receive childcare for child development/enjoyment reasons, irrespective of the level of disadvantage they experienced (73% of all school-age children; the small differences perceptible in Figure 3.1 are not statistically significant).
17 Parents could choose a number of reasons for using a particular type of childcare, so these categories are not mutually exclusive.
28

3.6 Receipt of childcare during the school holidays With schools, and many childcare providers, being closed during the school holidays, childcare arrangements can be particularly difficult during this time (Speight et al. 2009). This section looks at whether receipt of childcare during the school holidays varies with the level of disadvantage that children experience. Thirty per cent of all school-age children received some form of childcare during the school holidays. However, Table 3.4 demonstrates a trend whereby children in better circumstances were more likely to receive childcare during the school holidays than children experiencing multiple disadvantage. In all likelihood this reflects the lower employment levels among multiply disadvantaged families. This difference can be seen both in receipt of formal childcare and in receipt of informal childcare. In terms of formal childcare, multiply disadvantaged children were less likely to attend a holiday club than children in better circumstances (four per cent of the most disadvantaged children compared with seven per cent of all school-age children and ten per cent of children who were not disadvantaged). In terms of informal childcare, multiply disadvantaged children were less likely to receive care from their grandparents and somewhat less likely to receive care from a friend or neighbour.
Table 3.4 - Childcare providers attended by school-age children during school holidays, by multiple disadvantage
Base: All school-age children
Level of multiple disadvantage 1 (No) 2 3 4 5 (High) Total
Type of childcare % % % % % % Any childcare 35 35 34 23 19 30 Formal childcare and early years provision 16 15 14 8 6 12 Breakfast / after-school club or activities, on school site 2 2 1 1 + 1 Breakfast / after-school club or activities, off school site 1 1 1 1 + 1 Holiday club 10 10 7 5 4 7 Childminder 2 2 3 1 + 2 Nanny / au pair 1 1 2 + 0 1 Informal childcare 24 24 23 17 14 21 Ex-partner 1 3 4 4 4 3 Grandparents 20 18 17 11 8 15 Older sibling 2 1 2 1 1 2 Another relative 4 4 5 4 3 4 Friend or neighbour 6 6 5 2 2 5 Other Leisure / sport 1 1 1 1 1 1 No childcare 65 65 66 77 81 70 Unweighted base 1032 968 678 835 732 4245 Weighted base 1178 1093 764 977 844 4857
29

3.7 Summary • While 59% of all school-age children received some form of childcare during the term
time reference week, this was the case for only 43% of school-age children who experienced the highest level of multiple disadvantage.
• The association between receipt of childcare and multiple disadvantage can largely be
attributed to differential receipt of formal childcare. • Children experiencing multiple disadvantage were less likely to attend a breakfast or
after-school club (either on or off a school site), and were also less likely to go to a childminder, than their peers in better circumstances.
• In addition, the most multiply disadvantaged children were less likely to receive care
from their grandparents (13% compared with 18% of all school-age children and 21% of children who experienced no disadvantage).
• Children experiencing the highest level of multiple disadvantage were substantially less
likely to attend leisure and sport activities than children in better circumstances (four per cent compared with ten per cent of all school-age children and 14% of children who were not disadvantaged).
• School-age children experiencing the most disadvantage received an average
(median) of 9.0 hours of childcare, compared with 6.4 hours for all school-age children. It is likely that this difference can be attributed to the time that multiply disadvantaged children spent with their resident parents’ ex-partners (who were likely to be their non-resident parents).
• As with pre-school children, school-age children typically received childcare for reasons
related to their development or enjoyment, but reasons also strongly reflected the variations in work status of families experiencing different levels of disadvantage. Children in better circumstances were more likely to receive childcare for economic reasons (i.e. so that parents could work), while children who experienced multiple disadvantage were more likely to receive childcare for reasons related to parental time (i.e. so that parents could socialise, attend appointments, look after their other children, etc.).
• Children from families experiencing multiple disadvantage were less likely to receive
childcare during school holidays than those from families in better circumstances. This difference can be seen in receipt of both formal and informal childcare.
• With regard to formal childcare, the most multiply disadvantaged children were less
likely to attend a holiday club during school holidays than children in better circumstances (four per cent compared with seven per cent of all school-age children). In terms of informal childcare, multiply disadvantaged children were less likely to receive care from their grandparents or from parents’ friends or neighbours during the school holidays.
30
4 Parents’ views about childcare provision 4.1 Introduction This chapter explores parents’ views about childcare provision, and whether the views of families experiencing multiple disadvantage differ from those of other types of families. Being informed about the childcare options available to them, and believing that the formal childcare available in their local area is of good quality and affordable, are likely to be influential factors affecting parents’ choices about whether to use childcare, which types to use and when. Improving the quality and accessibility of information about childcare through Local Authorities and other Government-supported routes has been one of the key objectives of the Ten Year Childcare Strategy, as reinforced in the updated strategy document Next Steps for Early Learning and Childcare (HM Government 2009). First, the analysis focuses on the information about childcare that parents receive - the sources of this information, whether there is enough of it, and what other information parents would like to have - and explores patterns of differences between the information received by multiply disadvantaged families and those whose circumstances are more advantageous. Second, the chapter examines parents’ perceptions of the availability, quality and affordability of childcare in their local areas, and how these are influenced by the level of disadvantage they experience, as well as by their personal experiences of using childcare for their children and by how well informed about childcare they feel. Finally, the last section of the chapter focuses on those families who did not use any childcare in the last year and those families who did not use any early education for their pre-school age children. We explore their reasons for not using childcare or early education, and whether there are differences in these reasons between families experiencing multiple disadvantage and those in better circumstances. 4.2 Information about childcare Providing families with information about what childcare options are available to them in their local areas and how these could be financed is a key factor in enabling families to access formal childcare, especially for groups where the level of use of formal childcare provision has traditionally been low. The most common source of information about childcare mentioned by parents was word of mouth.18 This source was mentioned by 41% of all parents (Table 4.1). There was a strong association between the family’s level of disadvantage and how likely the parents were to say that they received information about childcare through the word of mouth: 48% of families that were not disadvantaged said this, compared to 31% of those experiencing the highest level of disadvantage.
18 Parents were shown a show card with a list of the most common sources and asked “In the last year, that is since [date], from which of these people or places have you obtained information about nursery education/childcare in your local area?”. Parents were able to use the ‘other’ option to say whether they had received information from sources not listed on the card.
31
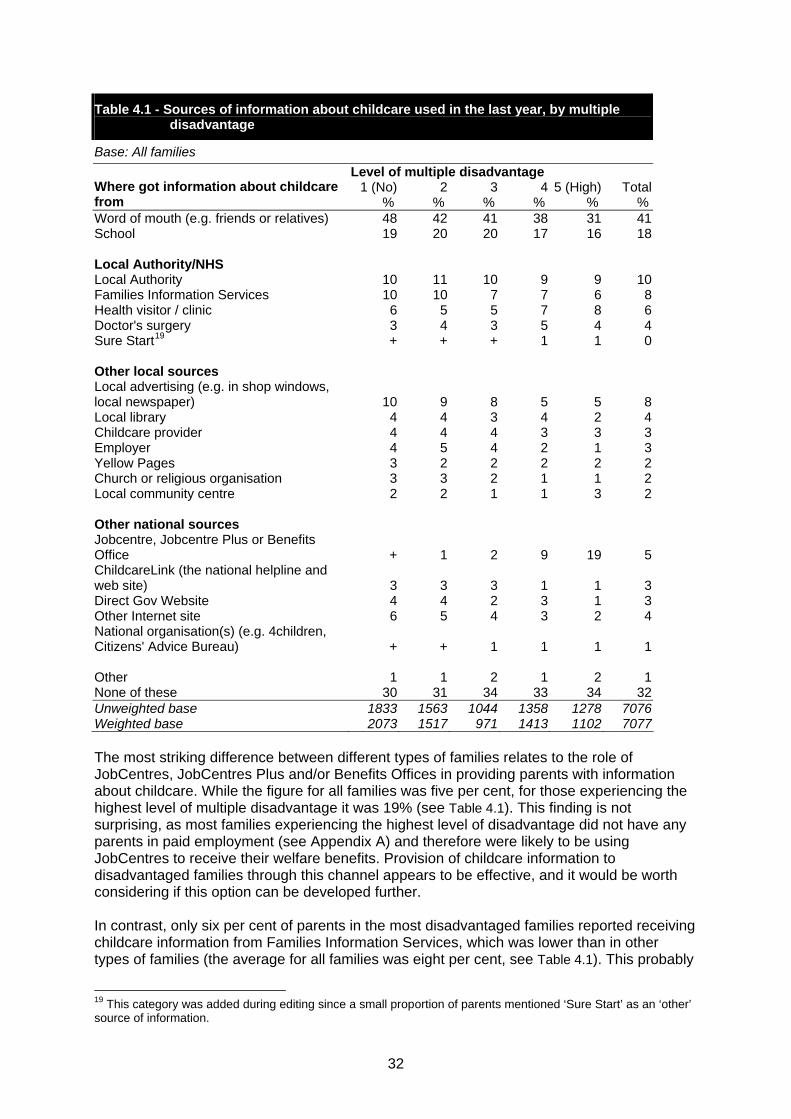
Table 4.1 - Sources of information about childcare used in the last year, by multiple disadvantage
Base: All families
Level of multiple disadvantage 1 (No) 2 3 4 5 (High) Total Where got information about childcare
from % % % % % % Word of mouth (e.g. friends or relatives) 48 42 41 38 31 41 School 19 20 20 17 16 18 Local Authority/NHS Local Authority 10 11 10 9 9 10 Families Information Services 10 10 7 7 6 8 Health visitor / clinic 6 5 5 7 8 6 Doctor's surgery 3 4 3 5 4 4 Sure Start19
+ + + 1 1 0 Other local sources Local advertising (e.g. in shop windows, local newspaper) 10 9 8 5 5 8 Local library 4 4 3 4 2 4 Childcare provider 4 4 4 3 3 3 Employer 4 5 4 2 1 3 Yellow Pages 3 2 2 2 2 2 Church or religious organisation 3 3 2 1 1 2 Local community centre 2 2 1 1 3 2 Other national sources Jobcentre, Jobcentre Plus or Benefits Office + 1 2 9 19 5 ChildcareLink (the national helpline and web site) 3 3 3 1 1 3 Direct Gov Website 4 4 2 3 1 3 Other Internet site 6 5 4 3 2 4 National organisation(s) (e.g. 4children, Citizens' Advice Bureau) + + 1 1 1 1 Other 1 1 2 1 2 1 None of these 30 31 34 33 34 32 Unweighted base 1833 1563 1044 1358 1278 7076 Weighted base 2073 1517 971 1413 1102 7077 The most striking difference between different types of families relates to the role of JobCentres, JobCentres Plus and/or Benefits Offices in providing parents with information about childcare. While the figure for all families was five per cent, for those experiencing the highest level of multiple disadvantage it was 19% (see Table 4.1). This finding is not surprising, as most families experiencing the highest level of disadvantage did not have any parents in paid employment (see Appendix A) and therefore were likely to be using JobCentres to receive their welfare benefits. Provision of childcare information to disadvantaged families through this channel appears to be effective, and it would be worth considering if this option can be developed further. In contrast, only six per cent of parents in the most disadvantaged families reported receiving childcare information from Families Information Services, which was lower than in other types of families (the average for all families was eight per cent, see Table 4.1). This probably
19 This category was added during editing since a small proportion of parents mentioned ‘Sure Start’ as an ‘other’ source of information.
32
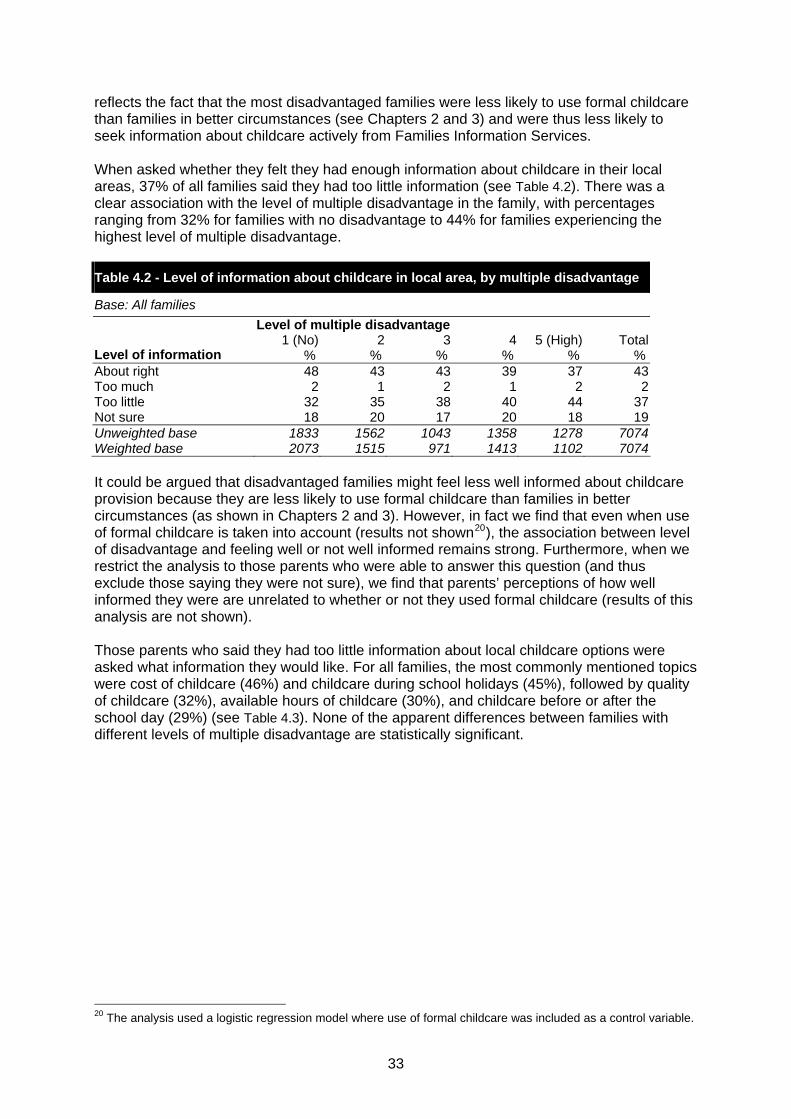
reflects the fact that the most disadvantaged families were less likely to use formal childcare than families in better circumstances (see Chapters 2 and 3) and were thus less likely to seek information about childcare actively from Families Information Services. When asked whether they felt they had enough information about childcare in their local areas, 37% of all families said they had too little information (see Table 4.2). There was a clear association with the level of multiple disadvantage in the family, with percentages ranging from 32% for families with no disadvantage to 44% for families experiencing the highest level of multiple disadvantage.
Table 4.2 - Level of information about childcare in local area, by multiple disadvantage
Base: All families
Level of multiple disadvantage 1 (No) 2 3 4 5 (High) Total
Level of information % % % % % % About right 48 43 43 39 37 43 Too much 2 1 2 1 2 2 Too little 32 35 38 40 44 37 Not sure 18 20 17 20 18 19 Unweighted base 1833 1562 1043 1358 1278 7074 Weighted base 2073 1515 971 1413 1102 7074 It could be argued that disadvantaged families might feel less well informed about childcare provision because they are less likely to use formal childcare than families in better circumstances (as shown in Chapters 2 and 3). However, in fact we find that even when use of formal childcare is taken into account (results not shown20), the association between level of disadvantage and feeling well or not well informed remains strong. Furthermore, when we restrict the analysis to those parents who were able to answer this question (and thus exclude those saying they were not sure), we find that parents’ perceptions of how well informed they were are unrelated to whether or not they used formal childcare (results of this analysis are not shown). Those parents who said they had too little information about local childcare options were asked what information they would like. For all families, the most commonly mentioned topics were cost of childcare (46%) and childcare during school holidays (45%), followed by quality of childcare (32%), available hours of childcare (30%), and childcare before or after the school day (29%) (see Table 4.3). None of the apparent differences between families with different levels of multiple disadvantage are statistically significant.
20 The analysis used a logistic regression model where use of formal childcare was included as a control variable.
33
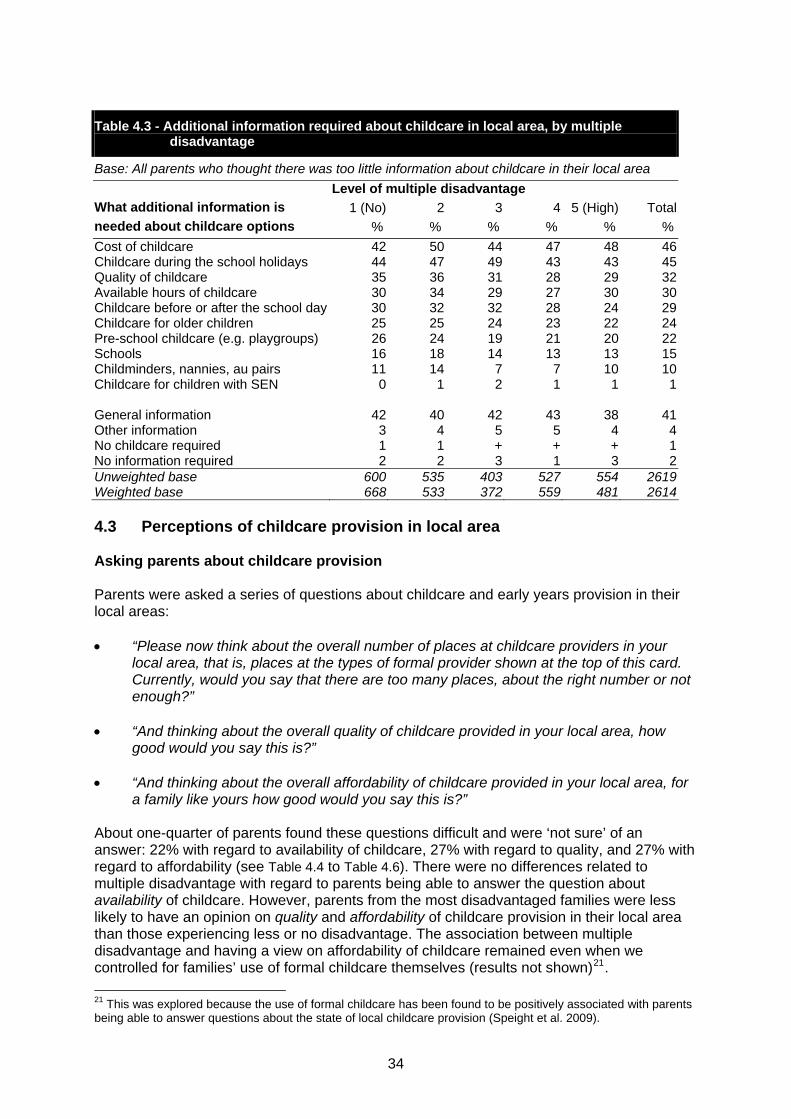
Table 4.3 - Additional information required about childcare in local area, by multiple disadvantage
Base: All parents who thought there was too little information about childcare in their local area
Level of multiple disadvantage
1 (No) 2 3 4 5 (High) TotalWhat additional information is
needed about childcare options % % % % % %
Cost of childcare 42 50 44 47 48 46Childcare during the school holidays 44 47 49 43 43 45Quality of childcare 35 36 31 28 29 32Available hours of childcare 30 34 29 27 30 30Childcare before or after the school day 30 32 32 28 24 29Childcare for older children 25 25 24 23 22 24Pre-school childcare (e.g. playgroups) 26 24 19 21 20 22Schools 16 18 14 13 13 15Childminders, nannies, au pairs 11 14 7 7 10 10Childcare for children with SEN 0 1 2 1 1 1 General information 42 40 42 43 38 41Other information 3 4 5 5 4 4No childcare required 1 1 + + + 1No information required 2 2 3 1 3 2Unweighted base 600 535 403 527 554 2619Weighted base 668 533 372 559 481 2614 4.3 Perceptions of childcare provision in local area Asking parents about childcare provision Parents were asked a series of questions about childcare and early years provision in their local areas: • “Please now think about the overall number of places at childcare providers in your
local area, that is, places at the types of formal provider shown at the top of this card. Currently, would you say that there are too many places, about the right number or not enough?”
• “And thinking about the overall quality of childcare provided in your local area, how
good would you say this is?” • “And thinking about the overall affordability of childcare provided in your local area, for
a family like yours how good would you say this is?” About one-quarter of parents found these questions difficult and were ‘not sure’ of an answer: 22% with regard to availability of childcare, 27% with regard to quality, and 27% with regard to affordability (see Table 4.4 to Table 4.6). There were no differences related to multiple disadvantage with regard to parents being able to answer the question about availability of childcare. However, parents from the most disadvantaged families were less likely to have an opinion on quality and affordability of childcare provision in their local area than those experiencing less or no disadvantage. The association between multiple disadvantage and having a view on affordability of childcare remained even when we controlled for families’ use of formal childcare themselves (results not shown)21.
21 This was explored because the use of formal childcare has been found to be positively associated with parents being able to answer questions about the state of local childcare provision (Speight et al. 2009).
34

Perceptions of availability Parents from the most multiply disadvantaged families were somewhat more likely to hold the view that there were not enough childcare places than families in better circumstances (see Table 4.4). This was not related to their actual use of formal childcare; and moreover, use of formal childcare was generally not associated with more positive or negative views on the availability of local childcare (see Table B4.1 in Appendix B).
Table 4.4 - Perceptions of availability of local childcare places, by multiple disadvantage
Base: All families
Level of multiple disadvantage 1 (No) 2 3 4 5 (High) Total Availability of local
childcare places % % % % % % Too many 1 2 1 1 1 1 About the right number 44 39 41 37 36 40 Not enough 34 39 36 37 40 37 Not sure 21 21 22 25 23 22 Unweighted base 1833 1563 1043 1357 1278 7074 Weighted base 2073 1517 971 1413 1102 7075 There was, however, a strong association between how well informed parents felt about local childcare provision and whether they were positive or negative about local availability. The analysis revealed that those parents who said there was too little information available to them were much more likely to say that there were not enough childcare places in their local area than those who felt satisfied with the amount of information they had received. Once the analysis controlled for parents’ answers to the information question, the association between multiple disadvantage and the view that there were not enough places disappeared (see Table B4.1 in Appendix B). This suggests that improving access to information about local childcare provision could significantly improve parents’ perceptions of the availability of childcare places, and this, in turn, might facilitate their use of the provision available. Perceptions of quality Overall, parents were quite positive about the quality of local childcare provision, with 19% assessing it as very good and a further 41% as fairly good (see Table 4.5). There was a strong association between perceptions of childcare quality and the level of disadvantage experienced by the family, with those experiencing more disadvantage being markedly less positive about the quality of local childcare.
Table 4.5 - Perceptions of quality of local childcare, by multiple disadvantage
Base: All families
Level of multiple disadvantage
1 (Low) 2 3 4 5 (High) Total Quality of local childcare % % % % % %
Very good 23 20 18 16 14 19 Fairly good 45 42 43 39 35 41 Fairly poor 7 8 8 9 13 9 Very poor 3 3 5 6 7 5 Not sure 22 27 26 29 31 27 Unweighted base 1833 1563 1043 1357 1278 7074 Weighted base 2073 1517 971 1413 1102 7075
35
Families who used formal childcare were more positive about the quality of local childcare than those who were not using any non-parental childcare (see Table B4.2 in Appendix B). To some extent, this contributes to the pattern of differences evident in Table 4.5, as disadvantaged families were less likely to use formal childcare. However, even when the analysis takes account of the family’s use of formal childcare provision, those experiencing disadvantage were still much less positive about the quality of childcare available than those in better circumstances (see Table B4.2 in Appendix B). Similarly, those parents who said there was too little information about childcare available to them were less likely to hold positive views about the quality of local childcare than those who felt well informed (and we showed earlier that parents in disadvantaged families were more likely to say they had too little information than those in better circumstances, see Table 4.2). However, even when we control for this factor alongside controlling for the use of formal childcare, there is still a strong association between multiple disadvantage and negative views about the quality of childcare (see Table B4.2 in Appendix B). It is possible that parents’ responses to some degree reflected the variation in quality of childcare settings between different types of areas, with deprived areas having fewer good quality settings (OFSTED 2008) and over four-fifths of families experiencing the highest level of disadvantage being concentrated in areas falling into the two quintiles with the highest values of the Index of Multiple Deprivation (see Table A.7 in Appendix A). Continuing improvements of early years provision in disadvantaged areas through initiatives such as Children’s Centres, as well as nation-wide improvements with regard to e.g. qualifications of staff working in childcare settings, should over time improve the image of childcare among families living in disadvantaged areas. However, there may be scope for more direct action in this regard, as it is likely that the actual variation in the childcare quality accounts for only a small part of the variation in parents’ perceptions of the quality. Perceptions of affordability With regard to perceptions of affordability of local childcare, among all families, the proportion of those assessing it as very or fairly good (35%)22 was similar to those assessing it as very or fairly poor (37%, see Table 4.6). However, there were substantial differences in these views between families experiencing different levels of disadvantage. Families experiencing the highest level of multiple disadvantage were more negative about the affordability of local childcare than those in better circumstances. This association persisted even after controlling for families’ use of formal childcare (which was generally associated with positive perceptions of affordability) and their views on how well informed they were about childcare provision in their local areas (with low levels of information being associated with negative perceptions of affordability) (see Table B4.3 in Appendix B).
22 The sum of these categories in is different from that quoted due to rounding. Table 4.6
36

Table 4.6 - Perceptions of affordability of local childcare places, by multiple disadvantage
Base: All families
Level of multiple disadvantage 1 (Low) 2 3 4 5 (High) Total Affordability of local
childcare % % % % % % Very good 6 6 6 5 5 6 Fairly good 39 32 26 24 21 30 Fairly poor 23 23 24 19 19 22 Very poor 10 14 19 19 21 15 Not sure 23 26 24 33 34 27 Unweighted base 1833 1563 1043 1357 1278 7074 Weighted base 2073 1517 971 1413 1102 7075 Perceptions of childcare provision and multiple disadvantage To sum up, parents’ perceptions of childcare provision in their local areas are strongly associated with how much disadvantage they experience, and those who feel that they do not have enough information about local childcare are particularly negative about its availability, quality and affordability. These findings are consistent with previous research that found that families living in deprived areas tended to overestimate the difficulties of arranging formal childcare for their pre-school children (Smith et al. 2007). There is also evidence that for working-class families the importance of the familiar and therefore the trusted is particularly high, in contrast to middle-class families whose choices about childcare are more rational (Vincent et al. 2009). There is clearly a need for targeted efforts to improve the level of information about childcare among families experiencing multiple disadvantage, which would lead to more positive perceptions of childcare. Furthermore, there may also be a need for other strategies targeting specifically parents’ perceptions of the quality and affordability of local childcare provision, given that even those parents from disadvantaged families who felt that they had enough information were still much more negative about the quality and affordability of childcare than parents from better-off families. It appears that perceptions of childcare might be an influential factor affecting patterns of childcare use by families experiencing multiple disadvantage, although it is likely that the relationship is reciprocal, and parents’ personal experiences of using childcare affect their perceptions of it. 4.4 Reasons for not using childcare The question about reasons for not using childcare was asked of parents who reported not using any childcare (of any type) in the last year. Families experiencing the highest level of multiple disadvantage were much more likely than other types of families to be among those who did not use any childcare in the last year (22%, compared with eight per cent of those with no disadvantage, and 13% of all families; table not shown). The most common reason for not using childcare mentioned by parents was that they wanted to look after their child(ren) themselves. This was mentioned by 68% of all families, and the percentage was the highest among the most multiply disadvantaged families (76%, see Table 4.7). All other reasons were chosen by much smaller proportions of parents, the second most prevalent reason - that the parent rarely needed to be away from their child(ren) - being mentioned by just under one quarter of all families (the differences by level of disadvantage relating to this answer are not statistically significant).
37

Table 4.7 - Reasons for not using childcare in last year, by multiple disadvantage
Base: Families who had not used any childcare in the last year
Level of multiple disadvantage 1 (Low) 2 3 4 5 (High) Total
Why no childcare in last year % % % % % %I'd rather look after my child(ren) myself 65 61 59 70 76 68I rarely need to be away from my children 19 23 20 26 29 24Child(ren) are old enough to look after himself/ herself / themselves 25 18 19 14 11 17I cannot afford childcare 10 8 20 7 20 13My/partner's work hours or conditions fit around child(ren) 5 8 3 1 1 3My child(ren) need special care 0 1 3 3 5 3There are no childcare providers I could trust 0 3 4 2 2 2I cannot find a childcare place as local providers are full 2 1 2 1 1 1I have had bad experience of childcare in the past 0 1 2 0 1 1I would have transport difficulties getting to a provider 1 0 1 2 0 1The quality of childcare is not good enough 0 2 2 1 0 1Other reasons 11 14 21 16 11 14Unweighted base 116 110 95 178 216 715Weighted base 172 161 111 214 238 896 There was an association between multiple disadvantage and parents reporting that they could not afford childcare (although it was not linear): while on average 13% of all families mentioned this reason, the percentage for the most disadvantaged families was 20% and for those with no disadvantage it was ten per cent (see Table 4.7). 4.5 Reasons for not using early years provision Families where the selected child was aged under 3 but not attending any nursery education providers23 during the term time reference week were asked why they were not using nursery education outside of the home. As discussed in Chapter 2, young children from disadvantaged families were much less likely to receive formal childcare than those from better-off families. In particular, children from the most disadvantaged families were much less likely to attend a day nursery (six per cent, compared with 21% of all children aged 0-2), and they were also less likely to attend a playgroup (three per cent, compared with six per cent of all children, see Table 2.2). The most common reason for not using nursery education for children under 3 mentioned by all parents was that the child was too young (59%), followed by parents wanting to look after their child(ren) themselves (35%, see Table 4.8). Cost factors were mentioned by 18% of all parents (19% of parents from the most disadvantaged families). The small differences in parents’ answers by level of disadvantage that are apparent in the table are not statistically significant.
23 Nursery education includes nursery school, nursery class, reception class, special day nursery, day nursery, playgroup and ‘other’ nursery education providers.
38
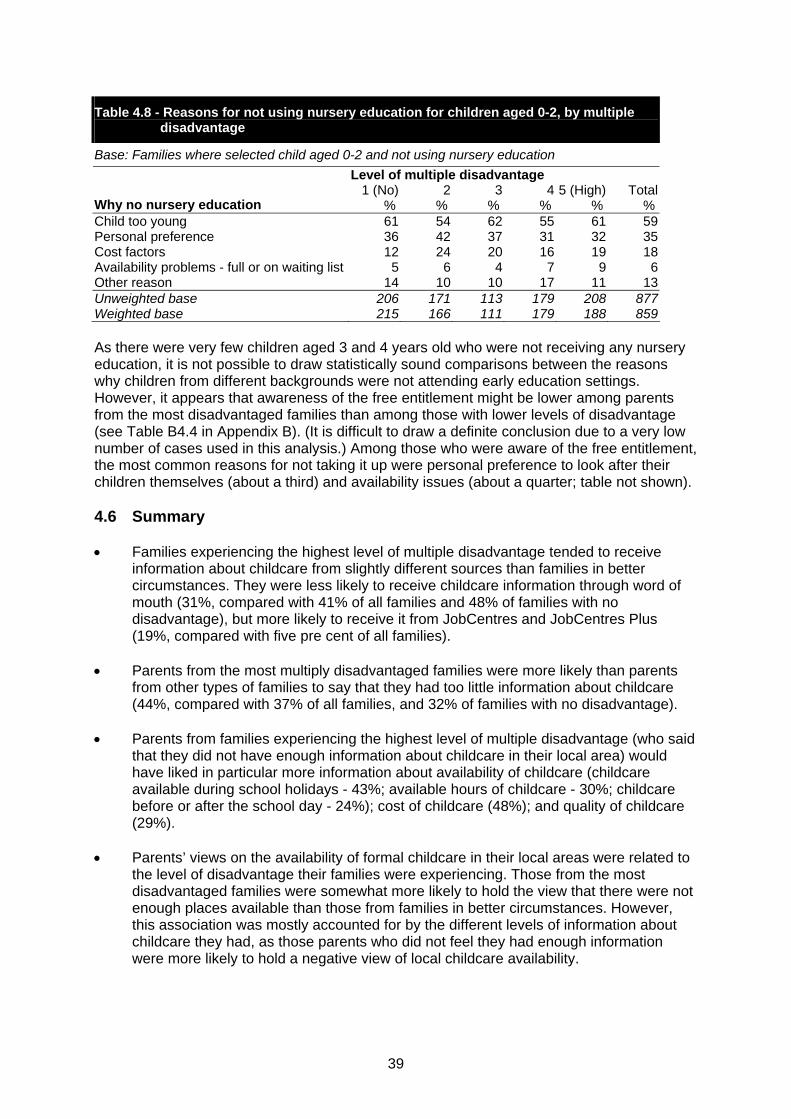
Table 4.8 - Reasons for not using nursery education for children aged 0-2, by multiple disadvantage
Base: Families where selected child aged 0-2 and not using nursery education
Level of multiple disadvantage 1 (No) 2 3 4 5 (High) Total
Why no nursery education % % % % % %Child too young 61 54 62 55 61 59Personal preference 36 42 37 31 32 35Cost factors 12 24 20 16 19 18Availability problems - full or on waiting list 5 6 4 7 9 6Other reason 14 10 10 17 11 13Unweighted base 206 171 113 179 208 877Weighted base 215 166 111 179 188 859
As there were very few children aged 3 and 4 years old who were not receiving any nursery education, it is not possible to draw statistically sound comparisons between the reasons why children from different backgrounds were not attending early education settings. However, it appears that awareness of the free entitlement might be lower among parents from the most disadvantaged families than among those with lower levels of disadvantage (see Table B4.4 in Appendix B). (It is difficult to draw a definite conclusion due to a very low number of cases used in this analysis.) Among those who were aware of the free entitlement, the most common reasons for not taking it up were personal preference to look after their children themselves (about a third) and availability issues (about a quarter; table not shown). 4.6 Summary • Families experiencing the highest level of multiple disadvantage tended to receive
information about childcare from slightly different sources than families in better circumstances. They were less likely to receive childcare information through word of mouth (31%, compared with 41% of all families and 48% of families with no disadvantage), but more likely to receive it from JobCentres and JobCentres Plus (19%, compared with five pre cent of all families).
• Parents from the most multiply disadvantaged families were more likely than parents
from other types of families to say that they had too little information about childcare (44%, compared with 37% of all families, and 32% of families with no disadvantage).
• Parents from families experiencing the highest level of multiple disadvantage (who said
that they did not have enough information about childcare in their local area) would have liked in particular more information about availability of childcare (childcare available during school holidays - 43%; available hours of childcare - 30%; childcare before or after the school day - 24%); cost of childcare (48%); and quality of childcare (29%).
• Parents’ views on the availability of formal childcare in their local areas were related to
the level of disadvantage their families were experiencing. Those from the most disadvantaged families were somewhat more likely to hold the view that there were not enough places available than those from families in better circumstances. However, this association was mostly accounted for by the different levels of information about childcare they had, as those parents who did not feel they had enough information were more likely to hold a negative view of local childcare availability.
39
• Parents’ perceptions of the quality of childcare in their local areas were strongly associated with the levels of disadvantage their families were experiencing - those from the most disadvantaged families were much less likely to believe that the quality of local childcare was good. This association remained strong even after the analysis took account of differences concerning use of formal childcare and how well informed parents felt about childcare.
• Similar patterns of association were found for parents’ perceptions of the affordability of
childcare in their local areas, with those from the most disadvantaged families holding much more negative views of affordability than those from families with less or no disadvantage. This association also remained strong even after controlling for use of formal childcare and for levels of information about childcare in the local area.
• The findings on perceptions of local childcare suggest that parents’ perceptions are
strongly associated with how much disadvantage they experience, with those who feel that they do not have enough information about local childcare being particularly negative about its availability, quality and affordability. There is clearly a need for targeted efforts to improve the level of information about childcare among families experiencing multiple disadvantage (which would lead to more positive perceptions of childcare), and perhaps also for other strategies for influencing what these parents think of formal childcare provision (particularly with regard to its quality and affordability). It appears that perceptions of childcare might be an influential factor affecting patterns of childcare use by families experiencing multiple disadvantage, although it is likely that the relationship is reciprocal, and parents’ personal experiences of using childcare affect their perceptions of it.
• Twenty-two per cent of families experiencing the highest level of disadvantage had not
used any childcare in the last year. Over three-quarters of these families said they preferred to look after their children themselves, which was somewhat higher than the percentage of all families not using childcare. In addition, parents from the most disadvantaged families were somewhat more likely than those from better-off families to quote cost as a barrier to childcare use (20%, compared with 13% of all families not using childcare).
• While there were substantial differences in the levels of use of formal childcare for pre-
school children by families experiencing different levels of disadvantage, there was little variation in the parents’ reasons for not using childcare or early education, with most parents of children aged under 3 mentioning that their children were too young for nursery education or that they preferred to look after them themselves, and those with 3-4 year olds mentioning their personal preferences as well as issues with availability of nursery places. However, the findings also suggest that the awareness of the free entitlement to early education for 3 and 4 year olds among parents in the most multiply disadvantaged families may be lower than among those in better circumstances (it is difficult to draw a definite conclusion due to a very low number of cases used in this analysis).
40

5 Childcare and maternal employment 5.1 Introduction This chapter moves on from childcare use to focus on maternal employment and multiple disadvantage. Increasing the rate of maternal employment (and of lone mothers’ employment in particular) has been a policy priority for the Labour Government since 1997 when it came into power, partly because of its belief that women’s skills and knowledge should contribute to the economy, and partly as a means of addressing the problem of child poverty (Lewis 2009). In accordance with this policy agenda, most state support with childcare (e.g. the childcare element of the Working Tax Credit, childcare vouchers) has been provided to families on the condition that they were in work. However, as our results show, most mothers from families experiencing multiple disadvantage were not in paid employment and therefore were not able to receive the types of support with childcare costs available to working mothers (see section 5.2). This chapter explores the role of access to appropriate and affordable childcare (alongside other factors) in enabling mothers to undertake paid work (or studying), and in hindering them from doing so, as perceived by mothers themselves. First, the chapter examines patterns of maternal employment in families experiencing different levels of multiple disadvantage and their relationship with mothers’ family status. Then it focuses in turn on (1) mothers who were not working for pay, (2) those who were working and (3) those who were studying or training towards a qualification. For these three groups of mothers, it explores the extent to which their childcare responsibilities and their access (or lack of access) to affordable childcare have acted as a barrier to or facilitator of their employment or studying. Work-related and financial factors influencing maternal employment are also explored. 5.2 Maternal employment, family status and multiple disadvantage Before turning our attention to the relationship between childcare provision and maternal employment, it is useful to outline employment patterns among mothers from disadvantaged families. Mothers from families experiencing the highest level of multiple disadvantage were much less likely to be in paid work than those from other types of families. While for all mothers just over a third (36%) were not in paid employment, this figure was as high as 85% for mothers in the most multiply disadvantaged families (see Table 5.1). These mothers were less likely than any others to be working full- or part-time, including long and short part-time hours. Overall, there was a linear association between the level of disadvantage experienced by the family and maternal employment, with higher levels of disadvantage being associated with lower employment rates.
Table 5.1 - Maternal employment, by multiple disadvantage
Base: All mothers
Level of multiple disadvantage 1 (No) 2 3 4 5 (High) Total
Work status % % % % % %Mother working FT 38 34 30 20 4 27Mother working PT (1-15 hrs/wk) 11 11 9 8 3 9Mother working PT (16-29 hrs/wk) 33 32 32 27 8 28Mother not working 18 23 29 45 85 36Unweighted base 1823 1556 1030 1336 1243 6988Weighted base 2060 1509 956 1387 1062 6974
41

The way the indicator of multiple disadvantage was constructed has undoubtedly contributed to the pattern of association we observe between disadvantage and maternal employment. The family being non-working (i.e. none of the parents being in paid employment) would count as a factor of disadvantage (see section 1.3). Furthermore, other factors of disadvantage used in the indicator (e.g. lone parent family, family with low qualifications and low income, family with three or more children) are also associated with lower rates of maternal employment (see Table 5.5 for some of these results; other results are not shown). However, the broader context for this is that maternal employment is in general related to material disadvantages experienced by the family (including child poverty), and hence a number of Government policies over the last decade (e.g. tax credits and childcare support) have attempted to increase employment rates of mothers (Butt et al. 2007, Lewis 2009). Where mothers in the most disadvantaged families did work, 94% of them worked as employees and six per cent as self-employed (see Table 5.2). This pattern is not significantly different from the pattern for all mothers.
Table 5.2 - Maternal self-employment, by multiple disadvantage
Base: Mothers in paid employment
Level of multiple disadvantage 1 (No) 2 3 4 5 (High) Total
Self employment % % % % % % Employed 90 91 89 92 94 91 Self-employed 10 9 11 8 6 9 Unweighted base 1458 1125 678 673 164 4098 Weighted base 1685 1154 679 765 159 4441 Mothers from families experiencing the highest level of multiple disadvantage were more likely to work shifts (29% of those doing paid work worked shifts usually or sometimes), compared with mothers from better-off families (of all mothers, only 18% worked shifts, see Table 5.3).
Table 5.3 - Maternal shift working, by multiple disadvantage
Base: Mothers in paid employment
Level of multiple disadvantage 1 (No) 2 3 4 5 (High) Total
Shift working % % % % % % Usually 10 12 14 16 22 13 Sometimes 4 6 6 6 7 5 Never 86 82 80 78 71 82 Unweighted base 1454 1122 677 671 164 4088 Weighted base 1681 1150 678 762 159 4431 Thirteen per cent of mothers in the most disadvantaged families were studying or undertaking some training towards a qualification (see Table 5.4). This proportion was not significantly different from the figure for all mothers (15%).
42
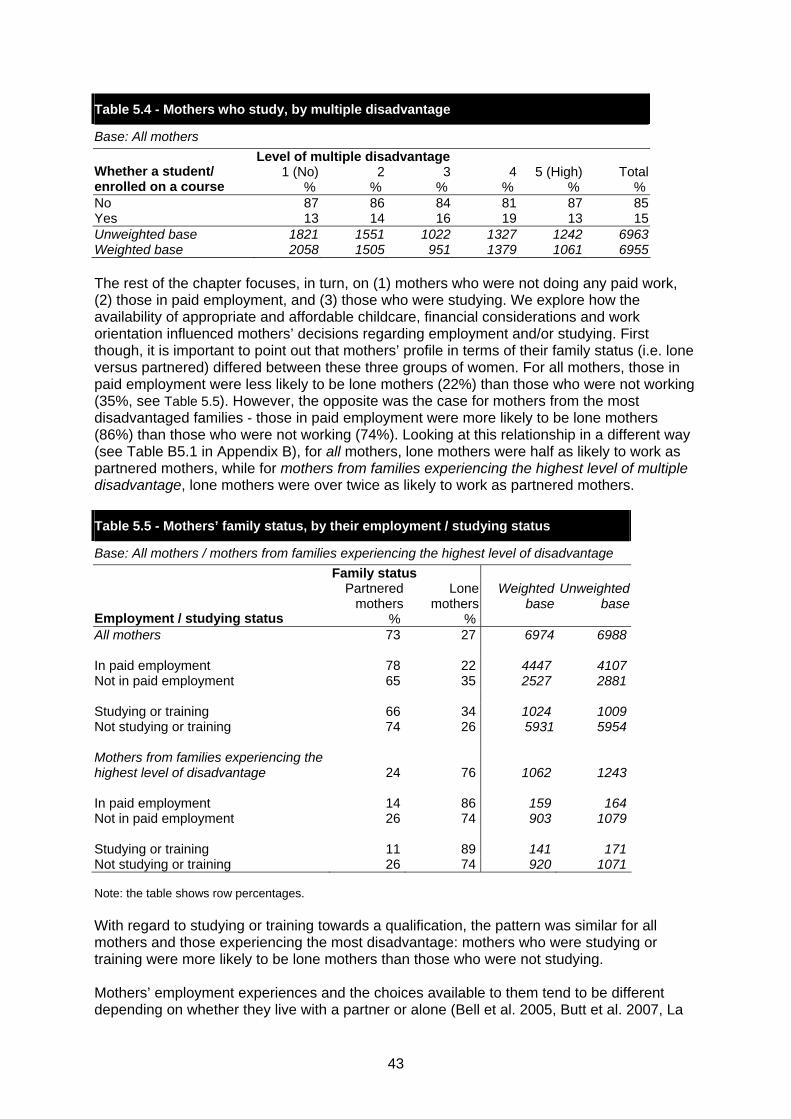
Table 5.4 - Mothers who study, by multiple disadvantage
Base: All mothers
Level of multiple disadvantage 1 (No) 2 3 4 5 (High) Total Whether a student/
enrolled on a course % % % % % % No 87 86 84 81 87 85 Yes 13 14 16 19 13 15 Unweighted base 1821 1551 1022 1327 1242 6963 Weighted base 2058 1505 951 1379 1061 6955 The rest of the chapter focuses, in turn, on (1) mothers who were not doing any paid work, (2) those in paid employment, and (3) those who were studying. We explore how the availability of appropriate and affordable childcare, financial considerations and work orientation influenced mothers’ decisions regarding employment and/or studying. First though, it is important to point out that mothers’ profile in terms of their family status (i.e. lone versus partnered) differed between these three groups of women. For all mothers, those in paid employment were less likely to be lone mothers (22%) than those who were not working (35%, see Table 5.5). However, the opposite was the case for mothers from the most disadvantaged families - those in paid employment were more likely to be lone mothers (86%) than those who were not working (74%). Looking at this relationship in a different way (see Table B5.1 in Appendix B), for all mothers, lone mothers were half as likely to work as partnered mothers, while for mothers from families experiencing the highest level of multiple disadvantage, lone mothers were over twice as likely to work as partnered mothers.
Table 5.5 - Mothers’ family status, by their employment / studying status
Base: All mothers / mothers from families experiencing the highest level of disadvantage
Family status Partnered
mothersLone
mothersWeighted
baseUnweighted
base Employment / studying status % % All mothers 73 27 6974 6988 In paid employment 78 22 4447 4107 Not in paid employment 65 35 2527 2881 Studying or training 66 34 1024 1009 Not studying or training 74 26 5931 5954 Mothers from families experiencing the highest level of disadvantage 24 76 1062
1243
In paid employment 14 86 159 164 Not in paid employment 26 74 903 1079 Studying or training 11 89 141 171 Not studying or training 26 74 920 1071 Note: the table shows row percentages. With regard to studying or training towards a qualification, the pattern was similar for all mothers and those experiencing the most disadvantage: mothers who were studying or training were more likely to be lone mothers than those who were not studying. Mothers’ employment experiences and the choices available to them tend to be different depending on whether they live with a partner or alone (Bell et al. 2005, Butt et al. 2007, La
43

Valle et al. 2008, Cabinet Office 2008), and the interface between childcare and paid work is also different for lone and partnered mothers (Speight et al. 2009). Therefore, where possible, our analysis of the relationship between maternal employment and childcare use in disadvantaged families takes account of the mothers’ family status. 5.3 Barriers to employment This section focuses on mothers who were not in paid employment and explores their reasons for not working. Table 5.6 shows mothers’ answers to the question that listed child- and childcare-related reasons for not working. The table shows clearly that forgoing paid employment is not a deliberate choice for many mothers in disadvantaged families but a consequence of their circumstances. Reasons related to access to appropriate childcare were mentioned by 34% of mothers from the most disadvantaged families, compared with 20% of mothers from families with no disadvantage and 28% of all non-working mothers. A significant proportion of mothers said they were not working because they wanted to stay with their child(ren). However, this reason was mentioned by a much lower proportion of mothers in the most disadvantaged families (35%) than in other types of families (46% of all non-working mothers mentioned this reason, and 68% of mothers from families with no disadvantage). Mothers from the most disadvantaged families were also less likely to say that their children would suffer if they went out to work (11%, compared with 25% of mothers who were not disadvantaged and 16% of all mothers).24
Table 5.6 - Childcare-related reasons for not working, by multiple disadvantage
Base: Mothers not in paid employment, excluding those on maternity leave and long-term sick / disabled
Level of multiple disadvantage 1 (No) 2 3 4 5 (High) TotalChildcare-related reasons for not
working % % % % % %I want to stay with my child(ren) 68 57 51 41 35 46Child(ren) are too young 30 28 27 30 27 28Lack of free / cheap childcare which would make working worthwhile 12 15 17 17 20 17Child(ren) would suffer if I went out to work 25 22 18 15 11 16Lack of affordable good quality childcare 8 9 10 11 12 11Child(ren) has / have a long term illness/ disability/special needs and needs a lot of attention 0 6 10 7 14 9Lack of childcare at suitable times 5 4 3 5 8 6Lack of good quality childcare 3 3 4 6 7 5Lack of reliable childcare 2 2 4 2 6 4Lack of childcare in local area 2 1 2 2 2 2 Any childcare-related reasons mentioned 20 22 25 30 34 28 Other reasons 5 4 2 6 4 4None of these reasons 14 16 23 22 24 21Unweighted base 305 354 266 509 865 2299Weighted base 302 273 201 463 683 1923
24 All differences discussed in this paragraph remain statistically significant even after controlling for mothers’ family status (i.e. lone v partnered mothers).
44

When asked whether they would prefer to go out to work if they could arrange good quality childcare which was convenient, reliable and affordable, just under two-thirds of mothers from families experiencing the highest level of disadvantage agreed or agreed strongly that they would (62%25), compared with just over a third of mothers from families with no disadvantage (37%, see Table 5.7). Only 26% of mothers in the most disadvantaged families disagreed or disagreed strongly with the statement that they would prefer to go out to work. This pattern of association holds even when we control for mothers’ family status (lone vs partnered mothers). Overall, lone mothers were more likely than partnered mothers to agree that they would prefer to go out to work if appropriate childcare was available to them (results not shown).
Table 5.7 - Whether non-working mothers would prefer to work if good quality, convenient, reliable and affordable childcare was available, by multiple disadvantage
Base: Mothers not in paid employment
Level of multiple disadvantage 1 (No) 2 3 4 5 (High) Total Whether would prefer to
work % % % % % % Agree strongly 13 16 21 24 30 23 Agree 24 22 24 32 33 29 Neither agree nor disagree 16 13 17 16 12 14 Disagree 27 27 23 15 15 19 Disagree strongly 20 22 15 13 11 15 Unweighted base 336 396 306 567 1020 2625 Weighted base 341 321 238 530 850 2280 In addition, non-working mothers were asked whether a number of work-related and financial reasons applied to their decision not to work. The results presented in Table 5.8 show that financial considerations played a significant role for mothers in the most disadvantaged families. Only one per cent of these mothers said that they had enough money (compared with 11% of all mothers, and 35% of mothers from families with no disadvantage), and 17% expressed a concern that they would lose their benefits (compared with 11% of all mothers, and almost no mothers from families with no disadvantage). Mothers from the most disadvantaged families were more likely than mothers from better-off families to say that they were not sufficiently qualified to find a decent job (20%, compared with 13% of all mothers and four per cent of mothers from families with no disadvantage) and that there was a lack of job opportunities in their area (11%, compared with eight per cent of all mothers and four per cent of mothers from families with no disadvantage, see Table 5.8). Mothers’ own illnesses and disabilities, and their responsibilities to care for ill, disabled or elderly family members, also seemed to be a particular issue for those in the most disadvantaged families.26 Nineteen per cent of mothers from families experiencing the highest level of disadvantage mentioned their own illness or disability as a barrier to work (compared with 12% of all mothers, and one per cent of mothers from families with no disadvantage), and 12% of mothers from the most disadvantaged families mentioned their
25 The sum of these categories in is different from that quoted due to rounding. Table 5.726 As discussed in section 1.3, long-standing illness or disability of a parent and/or of a child in the household contributed points to the score of multiple disadvantage. Partly as a result of this, families experiencing the highest level of multiple disadvantage were much more likely than other types of families to include a parent with illness or disability (42% of children in the most disadvantaged families had at least one parent with a long-standing illness of disability, compared with 20% of all children, see Table A.9 in Appendix A); and children from the most disadvantaged families were more likely to have a long-standing illness or disability themselves (31% of selected children in the most disadvantaged families had an illness or disability, compared with 15% of all children, see Table A.11 in Appendix A).
45
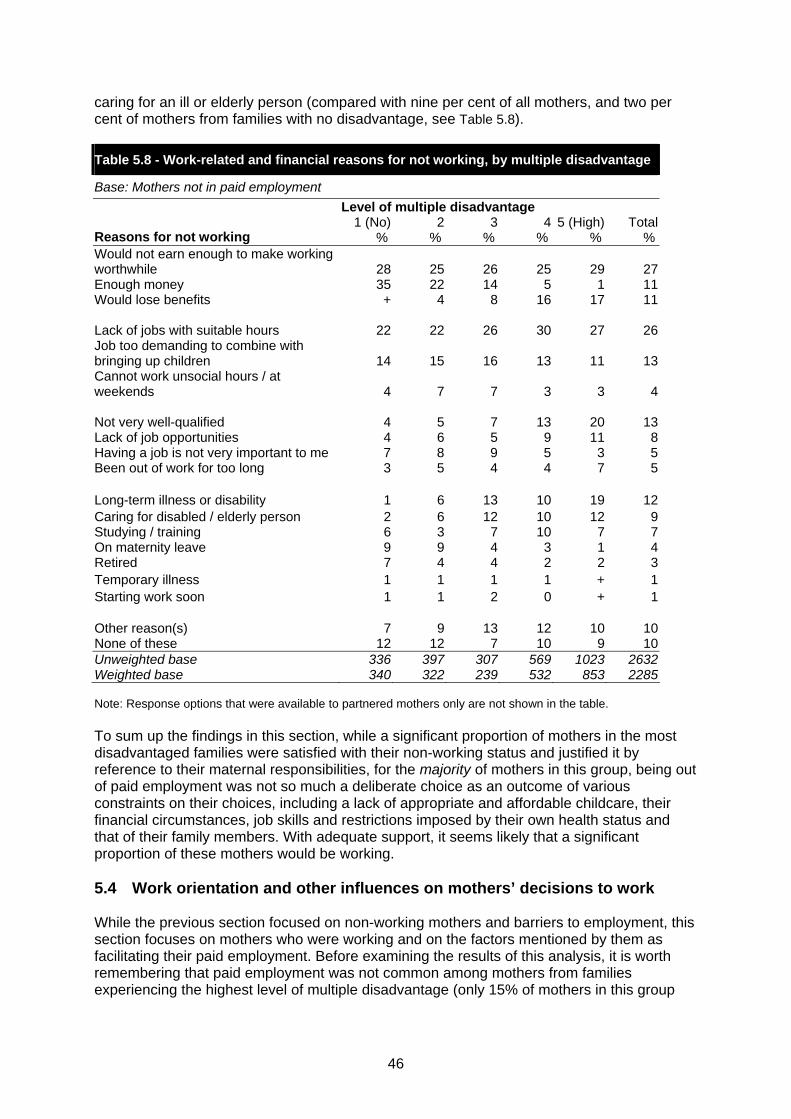
caring for an ill or elderly person (compared with nine per cent of all mothers, and two per cent of mothers from families with no disadvantage, see Table 5.8).
Table 5.8 - Work-related and financial reasons for not working, by multiple disadvantage
Base: Mothers not in paid employment
Level of multiple disadvantage 1 (No) 2 3 4 5 (High) Total
Reasons for not working % % % % % %Would not earn enough to make working worthwhile 28 25 26 25 29 27Enough money 35 22 14 5 1 11Would lose benefits + 4 8 16 17 11 Lack of jobs with suitable hours 22 22 26 30 27 26Job too demanding to combine with bringing up children 14 15 16 13 11 13Cannot work unsocial hours / at weekends 4 7 7 3 3 4 Not very well-qualified 4 5 7 13 20 13Lack of job opportunities 4 6 5 9 11 8Having a job is not very important to me 7 8 9 5 3 5Been out of work for too long 3 5 4 4 7 5 Long-term illness or disability 1 6 13 10 19 12Caring for disabled / elderly person 2 6 12 10 12 9Studying / training 6 3 7 10 7 7On maternity leave 9 9 4 3 1 4Retired 7 4 4 2 2 3Temporary illness 1 1 1 1 + 1Starting work soon 1 1 2 0 + 1 Other reason(s) 7 9 13 12 10 10None of these 12 12 7 10 9 10Unweighted base 336 397 307 569 1023 2632Weighted base 340 322 239 532 853 2285 Note: Response options that were available to partnered mothers only are not shown in the table. To sum up the findings in this section, while a significant proportion of mothers in the most disadvantaged families were satisfied with their non-working status and justified it by reference to their maternal responsibilities, for the majority of mothers in this group, being out of paid employment was not so much a deliberate choice as an outcome of various constraints on their choices, including a lack of appropriate and affordable childcare, their financial circumstances, job skills and restrictions imposed by their own health status and that of their family members. With adequate support, it seems likely that a significant proportion of these mothers would be working. 5.4 Work orientation and other influences on mothers’ decisions to work While the previous section focused on non-working mothers and barriers to employment, this section focuses on mothers who were working and on the factors mentioned by them as facilitating their paid employment. Before examining the results of this analysis, it is worth remembering that paid employment was not common among mothers from families experiencing the highest level of multiple disadvantage (only 15% of mothers in this group
46

worked, see Table 5.1), and furthermore, most of the working mothers in these families (86%) were lone parents (see Table 5.5). As discussed in the previous section, childcare responsibilities (and lack of access to appropriate childcare) were mentioned by non-working mothers as one of the most important barriers to paid employment. The survey also asked mothers who were working about childcare arrangements that facilitated their paid work. As shown in Table 5.9, 50% of mothers from families experiencing the highest level of multiple disadvantage mentioned their children being at school as a factor that helped them work (this proportion was similar to that for all working mothers). Help from relatives and friends was frequently mentioned as well: 43% of working mothers in the most disadvantaged families mentioned relatives helping with childcare and 11% mentioned friends. Again, these proportions were similar for families experiencing different levels of disadvantage.
Table 5.9 - Childcare arrangements that helped mothers to go out to work, by multiple disadvantage
Base: Mothers in paid employment
Level of multiple disadvantage 1 (No) 2 3 4 5 (High) TotalChildcare arrangements that helped
mothers to go out to work % % % % % %Child(ren) at school 45 47 48 48 50 47Relatives help with childcare 42 42 45 45 43 43Childcare fits with working hours 42 39 36 39 31 39Have good quality childcare 39 36 34 37 26 36Have reliable free / cheap childcare 27 32 31 36 38 31Friends help with childcare 12 13 14 14 11 13Child(ren) old enough to look after himself / herself / themselves 12 11 10 12 18 11Help with childcare costs through tax credits 3 8 13 17 11 9Employer provides / pays for childcare 2 + 1 1 0 1 Other 1 1 1 + 0 1None of these reasons 9 10 9 8 7 9Unweighted base 1371 1058 644 647 159 3879Weighted base 1571 1083 644 740 155 4194 Note: Response options that were available to partnered or lone mothers only are not shown in the table. The only two statistically significant differences between mothers from the most disadvantaged families and those from other families were, first, with regard to mentioning reliable free or cheap childcare, which was mentioned more frequently by those experiencing the highest level of multiple disadvantage (38%, compared with 31% of all working mothers and 27% of mothers from families with no disadvantage), and second, with regard to mentioning childcare support through tax credits (which was mentioned by 11% of working mothers in the most disadvantaged families, compared with nine per cent of all working mothers and three per cent of mothers from families with no disadvantage, see Table 5.9). The survey also asked working mothers about work-related and financial reasons for working. The most frequently mentioned reason was that mothers enjoyed working. This was mentioned by 71% of working mothers from families experiencing the highest level of disadvantage, and this proportion was similar for mothers in different types of families (see Table 5.10). There were some differences in work-related reasons mentioned by mothers from families experiencing different levels of disadvantage: those from the most disadvantaged families were more likely to mention that they wanted to get out of the house and that they would feel useless without a job, but less likely to say that their careers would suffer if they took a break.
47

Financial reasons for working were mentioned almost as frequently as enjoyment of work. Sixty-five per cent of working mothers experiencing the highest level of multiple disadvantage said they were working because they needed the money and had no choice (see Table 5.10). The proportion of mothers mentioning this reason was similar across all types of families. The biggest differences between working mothers with different levels of disadvantage was with regard to mentioning pension plans: only eight per cent of mothers in the most disadvantaged families said they were working because they needed to keep on contributing to their pensions, while the figure for all working mothers was 26%. These findings probably reflect differences in job situations between different groups of working mothers in terms of career opportunities, availability of benefits such as pensions etc., and they are consistent with survey findings about family-friendly working arrangements available to mothers. Working mothers from families experiencing the highest level of multiple disadvantage were significantly less likely than those who were better-off to mention that they could work flexi-time, or that they could work some of the time from home (see Table 5.10).
Table 5.10 - Work-related and financial reasons for working, by multiple disadvantage
Base: Mothers in paid employment
Level of multiple disadvantage 1 (No) 2 3 4 5 (High) TotalInfluences on mother’s decision to
go out to work % % % % % %I’ve no choice, I need the money 60 63 73 69 65 65I like to have my own money 54 50 47 48 44 50I need to keep on contributing to my pension 31 27 25 16 8 26 I enjoy working 72 69 68 70 71 70I want to get out of the house 30 27 30 36 43 31I would feel useless without a job 18 21 26 28 34 22My career would suffer if I took a break 19 15 14 8 5 15 I can work flexi-time 26 22 23 16 13 22I don't have to work during school holidays 20 21 18 15 15 19I can work from home some of the time 13 10 9 5 3 10I can work from home most / all of the time 8 6 6 3 5 6I enjoy the company / meeting other people + + 0 + 1 + Other 2 3 4 5 4 3None of these reasons 1 + + 1 1 1Unweighted base 1371 1058 644 647 159 3879Weighted base 1571 1083 644 740 155 4194 Note: Response options that were available to partnered or lone mothers only are not shown in the table. Table 5.11 shows working mothers’ views on ideal working arrangements, and whether they varied by the level of disadvantage experienced by their families. The proportion of working mothers saying they would prefer to stay at home if they could afford to give up work was 39%, and this proportion did not vary significantly between different groups of mothers. The proportion of mothers saying that they would work fewer hours if they could afford it was 58% for all mothers, and again, this did not vary significantly between different types of families. Finally, 18% of all working mothers said they would work more hours if they could arrange good quality childcare which was convenient, reliable and affordable. Mothers from the most
48

disadvantaged families were significantly more likely to say this than other mothers (30%, compared with 18% of all mothers). This is consistent with the finding reported in section 5.3 that lack of (or limited) access to childcare was a significant barrier to employment for mothers in disadvantaged families.
Table 5.11 - Views on ideal working arrangements, by multiple disadvantage
Base: Mothers in paid employment
Level of multiple disadvantage 1 (No) 2 3 4 5 (High) Total Views on ideal working
arrangements % % % % % % If I could afford to give up work, I would prefer to stay at home Agree strongly 22 21 22 18 24 21 Agree 18 17 15 19 20 18 Neither agree nor disagree 16 15 16 17 9 16 Disagree 36 37 38 35 37 36 Disagree strongly 8 9 9 12 10 9 If I could afford it, I would work fewer hours so I could spend more time looking after my children Agree strongly 28 28 28 23 21 27 Agree 30 31 32 35 31 31 Neither agree nor disagree 14 15 13 13 18 14 Disagree 24 22 24 24 26 23 Disagree strongly 4 4 3 6 5 4 If I could arrange good quality childcare which was convenient, reliable and affordable, I would work more hours Agree strongly 3 3 6 6 5 4 Agree 10 13 16 18 25 14 Neither agree nor disagree 10 10 11 15 18 11 Disagree 54 48 47 47 38 50 Disagree strongly 23 26 20 15 14 22 Unweighted base 1373 1052 643 647 158 3873 Weighted base 1573 1075 643 740 155 4186 5.5 Childcare arrangements available to studying mothers This section focuses on mothers who were studying or undertaking some training towards a qualification. As discussed in section 5.2, 13% of mothers from families experiencing the highest level of multiple disadvantage were studying or training, and the vast majority of these mothers (89%) were lone parents. Analysis of the results shown in Table 5.12 reveals that the main factor that enabled mothers to study was that their children were at school. Thirty-nine per cent of all mothers who were studying mentioned this factor, and 45% of mothers in the most disadvantaged families (this difference is not statistically significant).
Availability of suitable childcare was mentioned frequently by mothers from all types of families as a factor facilitating their studying. However, mothers from families experiencing the highest level of multiple disadvantage were more likely than mothers from other families to mention that having reliable free or cheap childcare helped them study (35%, compared with 23% of all mothers and 17% of mothers from families with no disadvantage, see Table 5.12). Furthermore, 14% of mothers from the most disadvantaged families said that their colleges provided or paid for some or all of their childcare. This was significantly higher than the figure for all mothers who were studying (five per cent). This shows that affordable childcare plays an important role in enabling mothers from disadvantaged families to study.
49
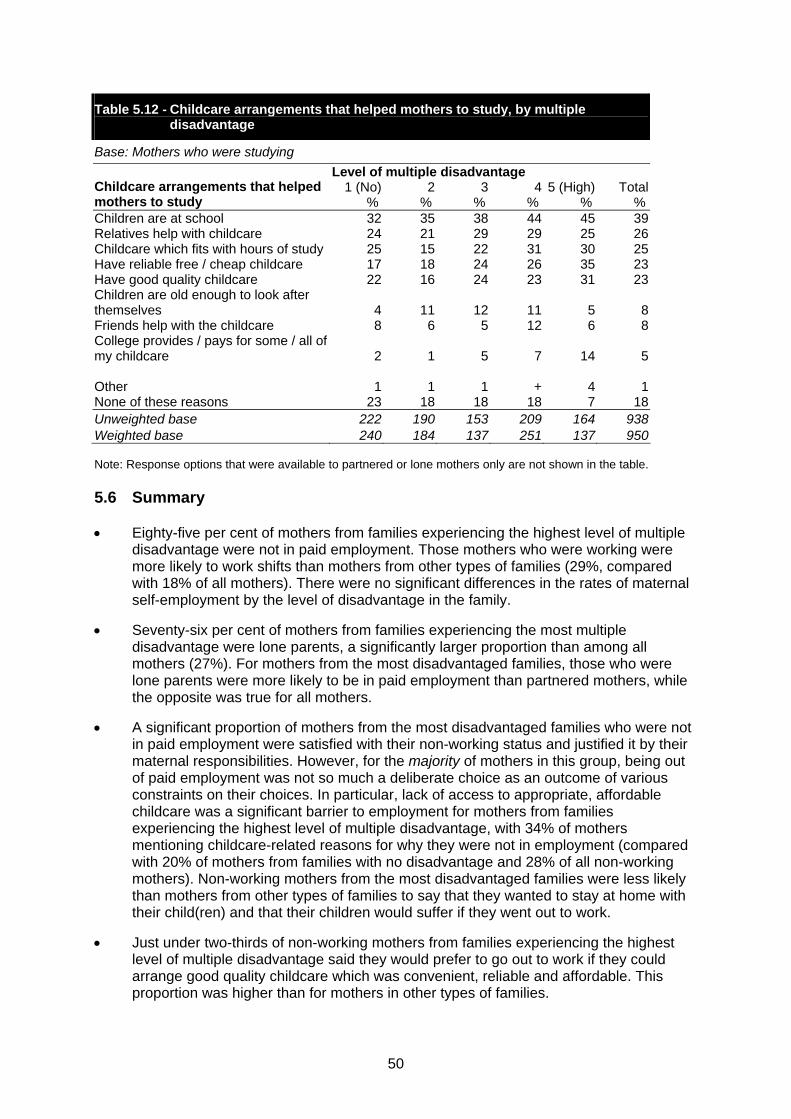
Table 5.12 - Childcare arrangements that helped mothers to study, by multiple disadvantage
Base: Mothers who were studying
Level of multiple disadvantage 1 (No) 2 3 4 5 (High) Total Childcare arrangements that helped
mothers to study % % % % % % Children are at school 32 35 38 44 45 39 Relatives help with childcare 24 21 29 29 25 26 Childcare which fits with hours of study 25 15 22 31 30 25 Have reliable free / cheap childcare 17 18 24 26 35 23 Have good quality childcare 22 16 24 23 31 23 Children are old enough to look after themselves 4 11 12 11 5 8 Friends help with the childcare 8 6 5 12 6 8 College provides / pays for some / all of my childcare 2 1 5 7 14 5 Other 1 1 1 + 4 1 None of these reasons 23 18 18 18 7 18 Unweighted base 222 190 153 209 164 938 Weighted base 240 184 137 251 137 950 Note: Response options that were available to partnered or lone mothers only are not shown in the table. 5.6 Summary
• Eighty-five per cent of mothers from families experiencing the highest level of multiple
disadvantage were not in paid employment. Those mothers who were working were more likely to work shifts than mothers from other types of families (29%, compared with 18% of all mothers). There were no significant differences in the rates of maternal self-employment by the level of disadvantage in the family.
• Seventy-six per cent of mothers from families experiencing the most multiple disadvantage were lone parents, a significantly larger proportion than among all mothers (27%). For mothers from the most disadvantaged families, those who were lone parents were more likely to be in paid employment than partnered mothers, while the opposite was true for all mothers.
• A significant proportion of mothers from the most disadvantaged families who were not in paid employment were satisfied with their non-working status and justified it by their maternal responsibilities. However, for the majority of mothers in this group, being out of paid employment was not so much a deliberate choice as an outcome of various constraints on their choices. In particular, lack of access to appropriate, affordable childcare was a significant barrier to employment for mothers from families experiencing the highest level of multiple disadvantage, with 34% of mothers mentioning childcare-related reasons for why they were not in employment (compared with 20% of mothers from families with no disadvantage and 28% of all non-working mothers). Non-working mothers from the most disadvantaged families were less likely than mothers from other types of families to say that they wanted to stay at home with their child(ren) and that their children would suffer if they went out to work.
• Just under two-thirds of non-working mothers from families experiencing the highest level of multiple disadvantage said they would prefer to go out to work if they could arrange good quality childcare which was convenient, reliable and affordable. This proportion was higher than for mothers in other types of families.
50

• Other barriers to employment mentioned by mothers in the most disadvantaged families who were not in paid work were financial concerns (e.g. 29% said they would not earn enough to make working worthwhile, and 17% worried that they would lose their benefits if they went out to work), a lack of jobs with suitable hours (27%), concerns about not being sufficiently qualified (20%), mothers’ own illnesses or disabilities (19%), and their responsibilities to care for ill or elderly family members (12%). Differences by level of disadvantage suggest that not doing paid work was much less of a choice for mothers from disadvantaged families than for those from families in better circumstances.
• Mothers from the most disadvantaged families who were in paid employment
mentioned that children being at school (50%) and relatives helping with childcare (43%) were key factors in facilitating their employment. Mothers from families experiencing the highest level of disadvantage were more likely than those from other types of families to mention as factors reliable free or cheap childcare (38%) and childcare support through tax credits (11%). Thirty per cent of mothers from the most disadvantaged families who were in paid employment said they would work more hours if they could arrange good quality childcare which was convenient, reliable and affordable; this proportion was significantly higher than that for all working mothers (18%).
• Seventy-one per cent of working mothers from families experiencing the highest level
of multiple disadvantage said they worked because they enjoyed working, and 65% said they had to work as they needed the money. These proportions were similar for mothers from different types of families. Working mothers from the most disadvantaged families were more likely than mothers from better-off families to mention that they wanted to get out of the house and that they would feel useless without a job, but less likely to say that their careers would suffer if they took a break or that they needed to keep on contributing to their pension.
• Thirteen per cent of mothers from families experiencing the highest level of multiple
disadvantage were studying or undertaking some training towards a qualification. This proportion was not significantly different from the figure for all mothers.
• The main factor that enabled mothers to study was that their children were at school
(this was mentioned by 45% of mothers in the most disadvantaged families who were studying). Availability of suitable childcare as a factor facilitating study was mentioned frequently by mothers in all types of families. However, mothers from families experiencing the highest level of multiple disadvantage were more likely than mothers from other families to mention that having reliable free or cheap childcare helped them study (35%, compared with 23% of all mothers). Fourteen per cent of mothers from families with the highest level of disadvantage said that their colleges provided or paid for (all or some) childcare and that this facilitated their studying.
51
6 Conclusions The issue of multiple disadvantage and how it affects outcomes for children and their families has been high on the policy agenda since New Labour came into power in 1997. There is good research evidence that problems with low income, unemployment and area deprivation have a cumulative effect on all aspects of children’s development and their subsequent life chances (CMPO 2006, Lloyd 2006, Hansen and Joshi 2007, Johnson and Kosykh 2008, Sylva et al. 2004). There is also evidence that attending a good quality early years setting can have a beneficial effect on children’s development and in particular on those from disadvantaged backgrounds (Coghlan et al. 2009, Hansen and Hawkes 2009, Smith et al. 2009b, Melhuish et al. 2008, Sylva et al. 2004). Addressing multiple disadvantage among young children and their families has therefore been the driver behind many government childcare initiatives, and the convergence between the Government’s child poverty and childcare strategies has steadily increased (Lloyd 2008). This report focused on families experiencing a multitude of disadvantages, including family breakdown, worklessness, low or no educational qualifications, low income, presence of illness or disability in the family, living in a deprived area, and some others. The analysis explored patterns of childcare use by families who experienced five or more factors of disadvantage (out of nine that could contribute to the score) as well as their views on childcare provision, and it compared these patterns and views with those among better-off families. There were substantial differences in the use of childcare, and formal childcare in particular, by families experiencing the highest level of multiple disadvantage and those with no or less disadvantage. While overall 59% of pre-school children received some type of formal childcare in term time, this was the case for only 43% of children from the most disadvantaged families. The pattern of differences was similar for school-age children. The largest differences in the take-up of formal childcare were among children aged under 3: overall, 38% of children in this age group received formal childcare, but only 15% of children from the most disadvantaged families did so. It is possible that the true scale of differences in the take-up of formal childcare and early years provision between families experiencing the highest level of disadvantage and those in better circumstances is even greater than evident in the survey data analysed in this report. This is because families and individuals most vulnerable to poverty and social exclusion are often missed in social surveys. These might be found among some minority ethnic groups, those on low incomes, homeless families and mobile populations such as Travellers (Levitas et al. 2006). These groups might be somewhat under-represented in the Childcare and Early Years Survey of Parents 2008 due to non-response but also possibly due to not receiving the Child Benefit (as the sample for the survey was drawn from Child Benefit records). While, this report did not explore directly the issue of cost of childcare. other research shows that the cost of childcare provision in England is high (Butt et al. 2007, Speight et al. 2009) and as such may be a key factor influencing the observed differences in the take-up of childcare by level of disadvantage. However, even where the provision was free - as is the case with free part-time early education for 3 and 4 year olds - children from the most disadvantaged families were less likely to receive it than those from better-off families: 16% of children in the most disadvantaged families did not receive early education, compared with 7% of all children in this age group. In its latest review of the National Childcare Strategy, the Government reiterates that their early years policies are informed by strong evidence that:
52

‘These services have the potential to narrow gaps between children from disadvantaged backgrounds and their peers and transform life chances.’ (HM Government, 2009: 8)
The finding about large differences in the take-up of early education by different types of families therefore raises the question whether Local Authorities are currently fully able to meet their duty under the Childcare Act 2006 to close the gap between developmental and educational outcomes for children from disadvantaged and better-off families through the provision of quality early learning and childcare. This finding also strongly suggests that more needs to be done to reach disadvantaged families and raise their awareness of the availability of the free early education and its potential benefits for the child’s development. The evidence of good practice in outreach strategies is available and points in the direction of multi-agency and tailored approaches, where target families are identified and approached in a personalised way (see, for example, Kazimirski et al. 2008a). With the most recent initiative of free part-time early education for disadvantaged 2 year olds being rolled out across all Local Authorities in England from September 2009, there is likely to be further accumulation of evidence of good practice in reaching disadvantaged families, which could be drawn upon when trying to maximise the take-up of early education by pre-school children from disadvantaged backgrounds. In addition to the substantial differences in the take-up of formal childcare by multiply disadvantaged families and those who were less or not disadvantaged, there was also substantial variation in the information about childcare that parents received and their perceptions of childcare in their local area. Overall, parents from families experiencing the highest level of multiple disadvantage were less likely to be well informed about local childcare options (44% said they had too little information), and the channels through which they received information about childcare were somewhat different from those used by families in better circumstances. In particular, 19% of parents from families experiencing the highest level of disadvantage said they received childcare information from a JobCentre or JobCentre Plus (compared with five per cent of all families), which suggests that this might be an effective way of reaching disadvantaged families. How well informed parents were about local childcare provision was strongly associated with their perceptions of the availability, quality and affordability of childcare in their local area, with those being less informed tending to have more negative perceptions. This contributed to the finding that parents from disadvantaged families were generally more negative about local childcare provision than those from better-off families. However, even when this association was taken into account, parents from the most disadvantaged families were still more negative about the quality and affordability of local childcare provision than those in better-off families. With regard to the quality of childcare, it is possible that parents’ responses to some degree reflected the variation in quality of childcare settings between different types of areas, with deprived areas having fewer good quality settings (OFSTED 2008) and over four-fifths of families experiencing the highest level of disadvantage being concentrated in areas falling into the two quintiles with the highest values of the Index of Multiple Deprivation. Continuing improvements of early years provision in disadvantaged areas through initiatives such as Children’s Centres, as well as nation-wide improvements with regard to e.g. qualifications of staff working in childcare settings, should over time improve the image of childcare among families living in disadvantaged areas.
53
However, there may be scope for more direct action in this regard, as it is likely that the actual variation in the childcare quality accounts for only a small part of the variation in parents’ perceptions of quality. Again, a multi-agency and tailored approach to disadvantaged families not using formal childcare and holding negative views about it might be the most effective outreach strategy, but more research (and qualitative research in particular) on disadvantaged families, their views about childcare and how these views might be improved would be very useful. The analysis has also shown that parents from the most disadvantaged families were more negative about the affordability of childcare in their local area than parents from families with less or no disadvantage. This is not surprising, as the market price of childcare in England is high (Butt et al. 2007, Speight et al. 2009) and with the exception of the free entitlement to early education by 3 and 4 year olds, most government support with childcare costs is linked to parental employment (e.g. the childcare element of the Working Tax Credit). As such, the majority of families experiencing the highest level of multiple disadvantage were workless households (80%) and thus were not eligible for this support. At the same time, analysis of answers from mothers who were not in paid employment about reasons why they were not in work revealed that for a significant proportion lack of access to appropriate, affordable childcare was a significant barrier to employment. Just under two-thirds of non-working mothers in families experiencing the highest level of multiple disadvantage said that they would prefer to go out to work if they could arrange good quality childcare which was convenient, reliable and affordable. With the exception of the free entitlement to early education for 3 and 4 year olds, financial support is largely available through demand-side childcare subsidies (such as tax credits). These findings suggest this system may not be functioning as effectively as desired with regard to the most disadvantaged families (a conclusion drawn in other research as well: see, for example, La Valle and Smith 2009 and Lloyd 2008). Instead, provision of early learning and childcare that is free (or very inexpensive) at the point of use, as with the free entitlement to early education for 3 and 4 year olds, might be a more effective way of increasing the number of disadvantaged children receiving formal provision and benefiting from it. Such an extension of childcare provision might also encourage the take-up of employment among mothers experiencing multiple disadvantage and thus contribute to reducing child poverty, as there is substantive international evidence of the important role this can play (Plantenga and Remery 2009).
54
References Adelman, L., Middleton, S. and Ashworth, K. (2003) Britain’s Poorest Children: Severe and Persistent Poverty and Social Exclusion. London: Save the Children. Ball, S. and Vincent, C. (2005) ‘The “Childcare Champion?” New Labour, social justice and the childcare market’, British Educational Research Journal, 31 (5), pp. 557-70. Barnes, M., Lyon, N. and Conolly, A. (2005) The Living Standards of Children in Bad Housing: Evidence from the Families and Children Study (FACS) 2004. London: National Centre for Social Research. Barnes, M., Conolly, A. and Tomaszewski, W. (2008) The circumstances of persistently poor families with children: Evidence from the Families and Children Study (FACS). DWP Research Report No 487. Norwich: HM Stationery Office. Bell, A., Finch, N., La Valle, I., Sainsbury, R. and Skinner C. (2005) A question of balance: lone parents, childcare and work. DWP Research Report 230. Leeds: Corporate Document Services. Belsky, J., Barnes, J. and Melhuish, E. (2007) (Eds.) The National Evaluation of Sure Start - Does Area-based Early Intervention Work? Bristol: The Policy Press. Berthoud, R. (2003) Multiple Disadvantage in Employment: A Quantitative Analysis. York: JRF. Bradshaw, P. and Wasoff, F. (2009) Growing Up in Scotland: Multiple Childcare Provision and its Effects on Child Outcomes. Edinburgh: The Scottish Government. Brooks-Gunn, J., Duncan, G.J. and Maritato, N. (1997) ‘Poor families, poor outcomes: The well being of children and youth’, in G.J. Duncan and J. Brooks-Gunn (Eds.), Consequences of Growing Up Poor, New York: Russell Sage Foundation, pp. 1-17. Bryson, C., Kazimirski, A. and Southwood, H. (2006) Childcare and Early Years Provision: A Study of Parents’ Use, Views and Experiences. DfES Research Report 723. Nottingham: DfES Publications. Butt, S., Goddard, K. and La Valle, I. with Hill, M. (2007) Childcare Nation? Progress on the childcare strategy and priorities for the future. London: Daycare Trust. Cabinet Office (2007) Reaching Out: Think Family - Analysis and Themes from the Families at Risk Review. London: The Stationery Office. Cabinet Office (2008) Families in Britain: An Evidence Paper. London: Cabinet Office, The Strategy Unit. CMPO Research Team (2006) Up to 7: Family Background and Child Development Up to Age 7 in the Avon Longitudinal Survey of Parents and Children (ALSPAC). Bristol: University of Bristol. Coghlan, M., Bergeron, C., White, K., Sharp, C., Morris, M. and Rutt, S. (2009) Narrowing the Gap in Outcomes for Young Children Through Effective Practices in the Early Years. London: C4EO.
55

Department for Children, Schools and Families (2009) Free Early Learning and Childcare - The Offer for Two Year Olds. A Guidance Document for Local Authorities. London: DCSF. Dinos, S., Tian, Y., Solanki, A-R. with Hauari, H. (2006) The National Evaluation of On Track, Phase Two: Tracking Services and Users. DFES Research Brief RB769. Nottingham: DfES Publications. Feinstein, L., Duckworth, K. and Sabates, R. (2008) ‘Education and the family: passing success across generations’, in P. Aggleton and S. Power (Eds.), Foundations and Futures of Education. Oxford: Routledge. Ghate, D. and Hazel, N. (2002) Parenting in Poor Environments: Stress, Support and Coping. London: Jessica Kingsley Publishers. Hansen, K., and Hawkes, D. (2009) ‘Early childcare and child development’, Journal of Social Policy, 38 (2): 211-239. Hansen, K. and Joshi, H. (2007) (Eds.) Millennium Cohort Study Second Survey: A User’s Guide to Initial Findings. London: Centre for Longitudinal Studies, Institute of Education. HM Government (2008) PSA Delivery Agreement 10 and PSA Delivery Agreement 11. London: The Stationery Office. HM Government (2009) Next Steps for Early Learning and Childcare: Building on the 10-Year Strategy. London: The Stationery Office. HM Treasury (1999) Supporting Children Through the Tax and Benefits System. London: The Stationery Office. HM Treasury (2004a) The Child Poverty Review. London: The Stationery Office. HM Treasury (2004b) Choice for Parents, The Best Start for Children: a 10- Year Strategy for Childcare. London: The Stationery Office. HM Treasury & Department for Education and Skills (2007) Policy Review of children and young people: A discussion paper. London: The Stationery Office. Johnson, P. and Kosykh, J. (2008) Early Years, Life Chances and Equality: A Literature Review. Manchester: Equality and Human Rights Commission. Kazimirski, A., Dickens, S., and White, C. (2008a) Pilot Scheme for Two Year Old Children: Evaluation of Outreach Approaches. DCSF Research Report DCSF-RR021. Nottingham: DCSF Publications. Kazimirski, A., Smith, R., Butt, S., Ireland, E. and Lloyd, E. (2008b) Childcare and Early Years Survey 2007: Parents’ Use, Views and Experiences. DCSF Research Report DCSF-RR025. Nottingham: DCSF Publications La Valle, I., Finch, S., Nove, A. and Lewin, C. (2000) Parents’ Demand for Childcare. Department for Education and Employment Research Report RR 176. Nottingham: DfES Publications. La Valle, I., Clery, E. and Huerta, M. C. (2008) Maternity Rights and Mothers’ Employment Decisions. DWP Research Report 496. Leeds: Corporate Document Services.
56

La Valle, I. and Smith, R. (2009) ‘Good quality childcare for all? Progress towards universal provision’, National Institute Economic Review, 207, pp. 75-82. Levitas, R., Pantazis, C., Fahmy, E., Gordon, D., Lloyd, E. and Patsios, D. (2007) The Multi-dimensional Analysis of Social Exclusion. London: Social Exclusion Task Force. Lewis, J. (2009) Work-Family Balance, Gender and Policy. Cheltenham, UK, and Northampton, MA, USA: Edward Elgar. Lloyd, E. (2006) ‘Children, poverty and social exclusion’, in C. Pantazis, D. Gordon and R. Levitas (Eds.), Poverty and Social Exclusion in Britain: The Millennium Survey. Bristol: The Policy Press. Lloyd, E. (2008) ‘The interface between childcare, family support and child poverty strategies under New Labour: tensions and contradictions’, Social Policy and Society, 7 (4), pp. 479- 494. Lyon, N., Mangla, J., Tait, C. and Scholes, S. (2007) Families and Children Study (FACS) 2005: Wave 7 Technical Report. London: National Centre for Social Research. Magadi, M. and Middleton, S. (2007) Severe Child Poverty in the UK. London: Save the Children. Melhuish. E. C., Phan, M. B., Sylva, K., Sammons, P., Siraj-Blatchford, I., and Taggart, B. (2008) ‘Effects of the home learning environment and preschool centre experience upon literacy and numeracy development in early primary school’, Journal of Social Issues, 64(1): 95-114. OFSTED (2008) Early Years: Leading to Excellence http://www.ofsted.gov.uk/Ofsted-home/Leading-to-excellence (accessed 5 November 2009) Oroyemi, P., Damioli, G., Barnes, M. and Crosier, T. (2009) Understanding the Risks of Social Exclusion Across the Life Course: Families with Children. London: Cabinet Office. Philips, R., Norden. O., McGinigal, S. and Cooper, J. (2009) Childcare and Early Years Providers Survey 2008. DCSF Research Report DCSF-RR164. London: DCSF. Plantenga, J. and Remery, C. (2009) The Provision of Childcare Services: A Comparative Review of 30 European Countries. Brussels: European Commission. Smith, R., Speight, S. and La Valle, I. (2009a) Fitting It All Together: How Families Arrange Their Childcare and the Influence on Children’s Home Learning. DCSF Research Report DCSF-RR090. London: DCSF. Smith, R., Purdon, S., Schneider, V., La Valle, I., Wollny I., Owen, R., Bryson, C., Mathers, S., Sylva, K. and Lloyd, E. (2009b) Early Education for Two Year Old Children Evaluation. DCSF Research Report DCSF-RR134. London: DCSF. Smith, T., Smith, G., Coxon, K., Sigala, M., Sylva, K., Mathers, S., La Valle, I., Smith, R., Purdon, S., Dearden, L., Shaw, J. and Sibieta, L. (2007) National Evaluation of the Neighbourhood Nurseries Initiative: Integrated Report. DfES Research Report SSU/2007/FR/024. Nottingham: DfES Publications.
57
Social Exclusion Task Force (2009) Context for Social Exclusion Work. http://www.cabinetoffice.gov.uk/social_exclusion_task_force/context.aspx (accessed 4 September 2009). Speight, S., Smith, R., La Valle, I., Schneider, V., and Perry, J. with Coshall, C. and Tipping, S. (2009) Childcare and Early Years Survey of Parents 2008. DCSF Research report DCSF-RR136. London: DCSF. Stratford, N., Finch, S. and Petick, J. (1997) Survey of Parents of Three and Four Year Old Children and their Use of Early Years Services. DfES Research Report 31.Nottingham: DfES Publications. Sylva, K., Melhuish, E. C., Sammons, P., Siraj-Blatchford, I. and Taggart, B. (2004) The Effective Provision of Pre-School Education (EPPE) Project: Final Report - A Longitudinal Study Funded by the DfES 1997-2004. Sure Start Research Report SSU/FR/2004/01. Nottingham: DfES Publications. Vincent, C., Braun, A., and Ball, S. (2009) ‘Local links, local knowledge: choosing care settings and schools’, British Educational Research Journal, 99999 (1), pp. 1-20.
58

APPENDIX A - Socio-demographic profile A.1 Family characteristics All the family characteristics discussed in this section were included in the score of disadvantage, and as such they are all strongly associated with multiple disadvantage. The purpose of this appendix is to illustrate the distribution of each characteristic across the levels of disadvantage. Family type Table A.1 shows how family type is associated with level of disadvantage. Twenty-six per cent of all children lived in households headed by a lone parent, however this proportion is much higher amongst children experiencing the highest level of multiple disadvantage, 71% of whom lived in households headed by a lone parent.
Table A.1 - Family type, by multiple disadvantage
Base: All children
Level of multiple disadvantage 1 (No) 2 3 4 5 (High) Total
Family type % % % % % % Couple 100 92 83 56 29 74 Lone parent 0 8 17 44 71 26 Unweighted base 1833 1563 1044 1358 1278 7076 Weighted base 1839 1551 1042 1394 1250 7076 Number of children in the household Overall, most children lived in families with two children aged 0-14 (44%). However, the most multiply disadvantaged children were most likely to live in families with three or more children (46%, compared with only 26% of all families) (Table A.2).
Table A.2 - Number of children aged 0-14 in household, by multiple disadvantage
Base: All children
Level of multiple disadvantage 1 (No) 2 3 4 5 (High) Total Number of children in
household % % % % % % 1 35 28 25 34 24 30 2 65 42 40 34 29 44 3+ 0 30 35 31 46 26 Unweighted base 1833 1563 1044 1358 1278 7076 Weighted base 1839 1551 1042 1394 1250 7076 Work status Table A.3 shows work status, and illustrates that whilst only 19% of all children lived in non-working families, a large majority of multiply disadvantaged children lived in non-working households (80%).
59

Table A.3 - Family work status, by multiple disadvantage
Base: All children
Level of multiple disadvantage 1 (No) 2 3 4 5 (High) Total
Work status % % % % % % Working 100 99 99 78 20 81 Not working 0 1 1 22 80 19 Unweighted base 1833 1563 1044 1358 1278 7076 Weighted base 1839 1551 1042 1394 1250 7076
Household income and receipt of benefits
Table A.4 shows families’ gross yearly incomes by level of multiple disadvantage. Families with higher levels of disadvantage had lower household incomes than families in better circumstances. For instance, while only 11% of all children lived in a household with an income of less than £10,000, this was the case for 39% of children experiencing multiple disadvantage. Families with an income below £20,000 were given one point towards the score of disadvantage.
Table A.4 - Family yearly income, by multiple disadvantage
Base: All children
Level of multiple disadvantage 1 (No) 2 3 4 5 (High) Total
Gross yearly income % % % % % % Up to £9,999 0 1 3 18 39 11 £10,000-19,999 0 7 23 51 53 25 £20,000-29,999 15 24 28 20 6 18 £30,000-44,999 31 31 25 8 1 20 £45,000 or more 54 38 20 3 + 25 Unweighted base 1668 1447 977 1289 1232 6613 Weighted base 1667 1437 974 1326 1204 6608
Since information on income was missing for seven per cent of families taking part in the survey, receipt of some means-tested benefits (namely Job Seeker’s Allowance, Income Support and Housing/Council Tax Benefit) was used to contribute to the score of disadvantage for those families. Twenty-two per cent of children lived in families who received one or more of these benefits, compared with 82% of children from families experiencing the highest level of multiple disadvantage (Table A.5).
Table A.5 - Family’s receipt of benefits, by multiple disadvantage
Base: All children
Level of multiple disadvantage 1 (No) 2 3 4 5 (High) Total
Receipt of benefits % % % % % % Job Seeker’s Allowance + + + 3 6 2 Income Support + + 1 15 66 15 Housing / Council Tax Benefit + 1 3 27 66 18 Any benefits + 1 5 32 82 22 None 100 99 95 68 18 78 Unweighted base 1833 1563 1044 1358 1278 7076 Weighted base 1839 1551 1042 1394 1250 7076
60

Tenure status Table A.6 shows that the majority of children lived in families who either owned their properties outright or had bought them with the help of a mortgage or loan (64%). Thirty-four per cent of children overall lived in rented accommodation, but children experiencing multiple disadvantage were much more likely to do so: 91% of those experiencing the highest level of disadvantage were living in rented accommodation. Living in rented accommodation has contributed to the score of multiple disadvantage as a proxy for social housing.
Table A.6 - Type of accommodation, by multiple disadvantage
Base: All children
Level of multiple disadvantage 1 (No) 2 3 4 5 (High) Total
Type of accommodation % % % % % % Owned outright 9 9 8 5 2 7 Bought with the help of a mortgage or loan 89 80 64 30 6 57 Part rent / part mortgage (shared ownership) 1 1 1 2 + 1 Rented 0 9 25 61 91 34 Live rent-free (including with relatives / friends) 1 1 2 3 1 2 Squatting 0 + 0 0 0 1 Unweighted base 1827 1556 1038 1351 1278 7050 Weighted base 1832 1543 1036 1387 1250 7049 Area deprivation
Table A.7 shows that families experiencing multiple deprivation were more likely than other families to live in deprived areas (as measured by the index of multiple deprivation). Whilst 23% of all children lived in the 20% most disadvantaged areas of the country, this was the case for 62% of the most multiply disadvantaged children.
Table A.7 - Area deprivation, by multiple disadvantage
Base: All children
Level of multiple disadvantage 1 (No) 2 3 4 5 (High) Total Quintiles of Index of
Multiple Deprivation % % % % % % 1 (least disadvantaged) 34 27 19 8 2 20 2 27 23 23 11 5 18 3 24 21 19 18 11 19 4 15 19 21 26 20 20 5 (most disadvantaged) 0 10 18 37 62 23 Unweighted base 1833 1563 1044 1358 1278 7076 Weighted base 1839 1551 1042 1394 1250 7076 A.2 Parent characteristics
All the parent characteristics below were used to construct the score of disadvantage.
Educational level
Respondents and their partners were asked about their highest academic qualifications, and where all parents in the household had low qualifications (below GCSE / O-Level grade A-C) they were given a point towards the score of disadvantage. Whilst only 19% of all children
61

lived in families where all parents in the household had low qualifications, this was the case for 62% of children experiencing the most multiple disadvantage (see Table A.8).
Table A.8 - Parents’ educational attainment, by multiple disadvantage
Base: All children
Level of multiple disadvantage 1 (No) 2 3 4 5 (High) Total Highest qualification
achieved % % % % % % Mother A-level and above 57 50 36 21 10 37 GSCE grade A-C / O-Level and equivalent 34 34 37 37 23 33 Lower / no academic qualifications 6 13 23 38 66 27 Other academic qualifications 3 3 3 4 1 3 Father A-level and above 56 45 37 18 6 40 GSCE grade A-C / O-Level and equivalent 32 34 29 28 15 30 Lower / no academic qualifications 11 19 33 51 78 28 Other academic qualifications 2 2 2 3 1 2 Family Some higher attainment 100 96 87 72 38 81 All lower attainment 0 4 13 28 62 19 Mother Unweighted base 1814 1540 1015 1321 1230 6920 Weighted base 1818 1527 1011 1357 1197 6911 Father Unweighted base 1676 1299 796 712 368 4851 Weighted base 1671 1290 788 717 370 4835 Family Unweighted base 1833 1563 1044 1358 1278 7076 Weighted base 1839 1551 1042 1394 1250 7076 Illness and / or disability Fourteen per cent of mothers and 12% of fathers had a long-standing illness or disability. Parental illness and/or disability contributed to the score of disadvantage where any parent in the household had a long-standing illness or disability. One-fifth of all children lived in a household where at least one parent had a long-standing illness or disability. However this was more than twice as high for children experiencing the highest level of multiple disadvantage (42%).
62
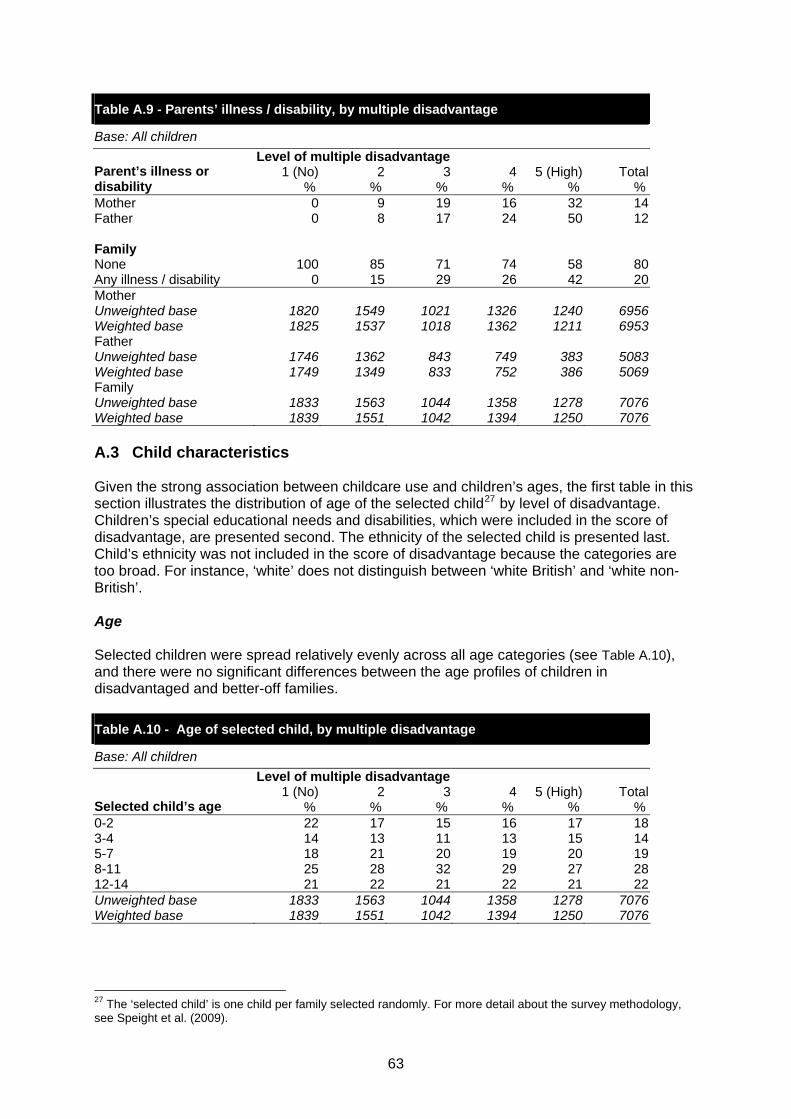
Table A.9 - Parents’ illness / disability, by multiple disadvantage
Base: All children
Level of multiple disadvantage 1 (No) 2 3 4 5 (High) Total Parent’s illness or
disability % % % % % % Mother 0 9 19 16 32 14 Father 0 8 17 24 50 12 Family None 100 85 71 74 58 80 Any illness / disability 0 15 29 26 42 20 Mother Unweighted base 1820 1549 1021 1326 1240 6956 Weighted base 1825 1537 1018 1362 1211 6953 Father Unweighted base 1746 1362 843 749 383 5083 Weighted base 1749 1349 833 752 386 5069 Family Unweighted base 1833 1563 1044 1358 1278 7076 Weighted base 1839 1551 1042 1394 1250 7076 A.3 Child characteristics Given the strong association between childcare use and children’s ages, the first table in this section illustrates the distribution of age of the selected child27 by level of disadvantage. Children’s special educational needs and disabilities, which were included in the score of disadvantage, are presented second. The ethnicity of the selected child is presented last. Child’s ethnicity was not included in the score of disadvantage because the categories are too broad. For instance, ‘white’ does not distinguish between ‘white British’ and ‘white non-British’. Age Selected children were spread relatively evenly across all age categories (see Table A.10), and there were no significant differences between the age profiles of children in disadvantaged and better-off families.
Table A.10 - Age of selected child, by multiple disadvantage
Base: All children
Level of multiple disadvantage 1 (No) 2 3 4 5 (High) Total
Selected child’s age % % % % % % 0-2 22 17 15 16 17 18 3-4 14 13 11 13 15 14 5-7 18 21 20 19 20 19 8-11 25 28 32 29 27 28 12-14 21 22 21 22 21 22 Unweighted base 1833 1563 1044 1358 1278 7076 Weighted base 1839 1551 1042 1394 1250 7076
27 The ‘selected child’ is one child per family selected randomly. For more detail about the survey methodology, see Speight et al. (2009).
63
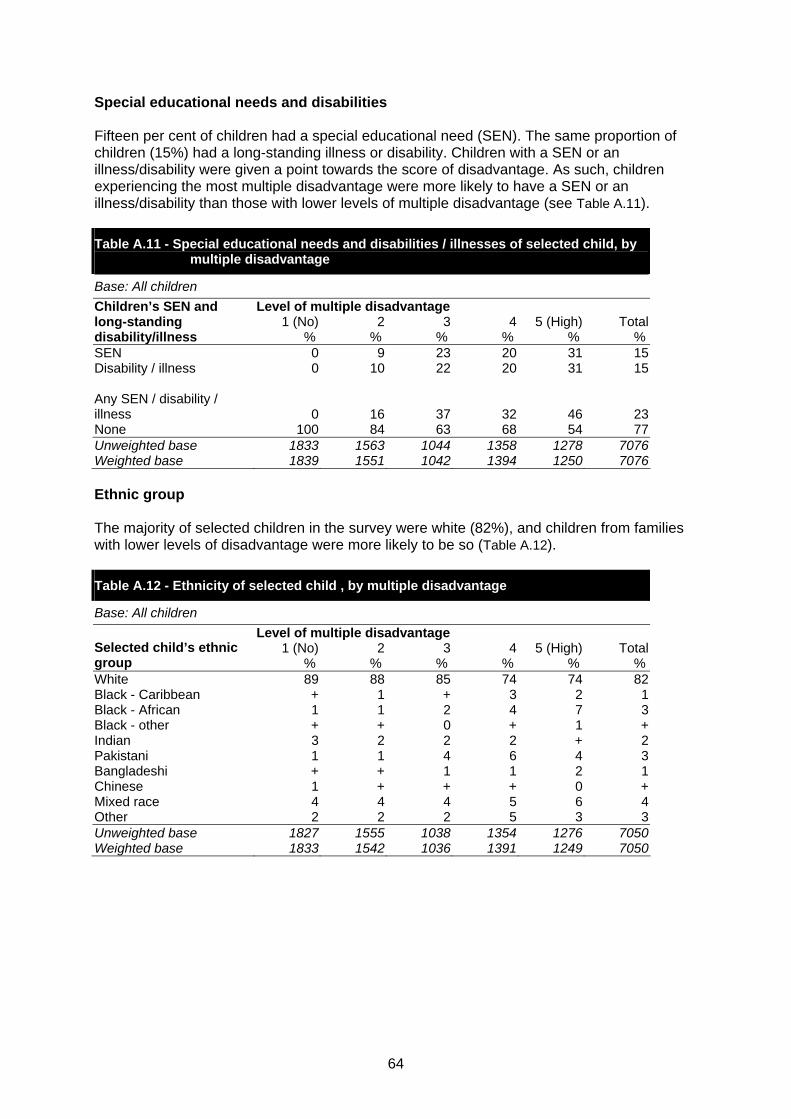
Special educational needs and disabilities Fifteen per cent of children had a special educational need (SEN). The same proportion of children (15%) had a long-standing illness or disability. Children with a SEN or an illness/disability were given a point towards the score of disadvantage. As such, children experiencing the most multiple disadvantage were more likely to have a SEN or an illness/disability than those with lower levels of multiple disadvantage (see Table A.11).
Table A.11 - Special educational needs and disabilities / illnesses of selected child, by multiple disadvantage
Base: All children
Level of multiple disadvantage 1 (No) 2 3 4 5 (High) Total
Children’s SEN and long-standing disability/illness % % % % % % SEN 0 9 23 20 31 15 Disability / illness 0 10 22 20 31 15 Any SEN / disability / illness 0 16 37 32 46 23 None 100 84 63 68 54 77 Unweighted base 1833 1563 1044 1358 1278 7076 Weighted base 1839 1551 1042 1394 1250 7076 Ethnic group The majority of selected children in the survey were white (82%), and children from families with lower levels of disadvantage were more likely to be so (Table A.12).
Table A.12 - Ethnicity of selected child , by multiple disadvantage
Base: All children
Level of multiple disadvantage 1 (No) 2 3 4 5 (High) Total Selected child’s ethnic
group % % % % % % White 89 88 85 74 74 82 Black - Caribbean + 1 + 3 2 1 Black - African 1 1 2 4 7 3 Black - other + + 0 + 1 + Indian 3 2 2 2 + 2 Pakistani 1 1 4 6 4 3 Bangladeshi + + 1 1 2 1 Chinese 1 + + + 0 + Mixed race 4 4 4 5 6 4 Other 2 2 2 5 3 3 Unweighted base 1827 1555 1038 1354 1276 7050 Weighted base 1833 1542 1036 1391 1249 7050
64

APPENDIX B - Additional tables
Table B2.1 - Reasons for receipt of childcare by pre-school children, by multiple disadvantage
Base: All pre-school children receiving childcare
Level of multiple disadvantage 1 (No) 2 3 4 5 (High) Total Reasons for receiving
childcare % % % % % % Economic 71 62 60 52 26 58 Child development / enjoyment 64 65 67 67 68 66 Parental time 26 31 30 37 42 32 Unweighted base 679 496 275 368 342 2160 Weighted base 536 367 191 277 242 1612
Table B3.1 - Reasons for receipt of childcare by school-age children, by multiple disadvantage
Base: All school-age children receiving childcare
Level of multiple disadvantage 1 (No) 2 3 4 5 (High) Total Reasons for receiving
childcare % % % % % % Economic 51 51 48 47 22 46 Child development / enjoyment 73 74 74 68 78 73 Parental time 16 21 18 19 34 20 Unweighted base 684 637 432 458 322 2533 Weighted base 778 712 485 542 364 2881
65

Table B4.1 - Logistic regression models for perceptions of poor availability of childcare in local area
Base: All families who had views on availability of childcare in local area
Model 1 Model 2 Odds ratio SE Odds ratio SELevel of multiple disadvantage (5=High) 4 0.88 0.10 0.93 0.113 *0.78 0.09 0.83 0.102 0.88 0.09 0.98 0.111=No disadvantage ***0.70 0.07 0.83 0.08
Use of childcare (No childcare used)
Used formal childcare 1.01 0.09Used informal and / or ‘other’ childcare 0.98 0.11
Level of information about childcare (About right)
Too much 0.83 0.22Too little ***4.39 0.32Not sure **1.39 0.15
Age of children (School-age child(ren) only)
Pre-school age child(ren) only ***0.68 0.06Pre-school and school-age child(ren) 0.91 0.07Unweighted base 5656 5655 Weighted base 5499 5497 Note: *p<0.05, ** p<0.01, ***p<0.001. The dependent variable is answering “Not enough childcare places” versus answering “About the right number” or “Too many”. Those who answered “Not sure” were excluded from the analysis. Odds ratio >1 indicates higher odds of perceptions of poor availability of childcare in local area, and odds ratio <1 indicates lower odds.
66
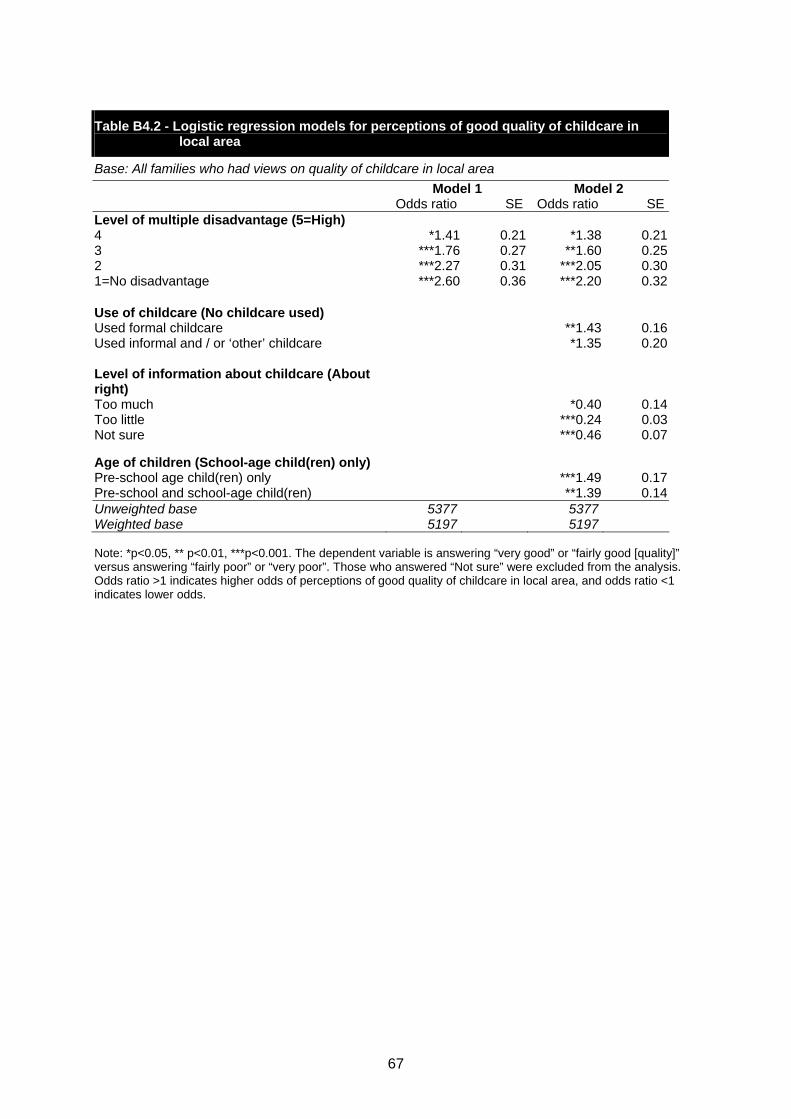
Table B4.2 - Logistic regression models for perceptions of good quality of childcare in local area
Base: All families who had views on quality of childcare in local area
Model 1 Model 2 Odds ratio SE Odds ratio SELevel of multiple disadvantage (5=High) 4 *1.41 0.21 *1.38 0.213 ***1.76 0.27 **1.60 0.252 ***2.27 0.31 ***2.05 0.301=No disadvantage ***2.60 0.36 ***2.20 0.32
Use of childcare (No childcare used)
Used formal childcare **1.43 0.16Used informal and / or ‘other’ childcare *1.35 0.20
Level of information about childcare (About right)
Too much *0.40 0.14Too little ***0.24 0.03Not sure ***0.46 0.07
Age of children (School-age child(ren) only)
Pre-school age child(ren) only ***1.49 0.17Pre-school and school-age child(ren) **1.39 0.14Unweighted base 5377 5377 Weighted base 5197 5197 Note: *p<0.05, ** p<0.01, ***p<0.001. The dependent variable is answering “very good” or “fairly good [quality]” versus answering “fairly poor” or “very poor”. Those who answered “Not sure” were excluded from the analysis. Odds ratio >1 indicates higher odds of perceptions of good quality of childcare in local area, and odds ratio <1 indicates lower odds.
67

68
Table B4.3 - Logistic regression models for perceptions of poor affordability of childcare in local area
Base: All families who had views on affordability of childcare in local area
Model 1 Model 2 Odds ratio SE Odds ratio SELevel of multiple disadvantage (5=High) 4 0.87 0.10 0.96 0.113 0.88 0.11 1.03 0.132 ***0.65 0.07 *0.75 0.081=No disadvantage ***0.48 0.05 ***0.58 0.07
Use of childcare (No childcare used)
Used formal childcare ***0.65 0.06Used informal and / or ‘other’ childcare 1.00 0.13
Level of information about childcare (About right)
Too much 0.92 0.22Too little ***2.71 0.19Not sure ***1.73 0.20
Age of children (School-age child(ren) only)
Pre-school age child(ren) only 0.97 0.09Pre-school and school-age child(ren) 1.10 0.08Unweighted base 5312 5312 Weighted base 5134 5134 Note: *p<0.05, ** p<0.01, ***p<0.001. The dependent variable is answering “very poor” or “fairly poor [affordability]” versus answering “fairly good” or “very good”. Those who answered “Not sure” were excluded from the analysis. Odds ratio >1 indicates higher odds of perceptions of poor affordability of childcare in local area, and odds ratio <1 indicates lower odds.
Table B4.4 - Parents’ awareness of the free entitlement to early education for 3 and 4 year old children, by multiple disadvantage
Base: Parents of eligible 3 and 4 year olds who did not receive early years education
Level of multiple disadvantage 1 (No) 2 3 4 5 (High) Total
Awareness of free entitlement % % % % % %Aware [78] [100] [86] [59] [48] 64Unaware [22] [0] [14] [41] [52] 36Unweighted base 7 9 4 15 28 63Weighted base 11 14 7 24 44 100
Table B5.1 - Logistic regression models for maternal employment, by family status
Base: All mothers / mothers from families experiencing the highest level of disadvantage
All mothers Mothers in the most disadvantaged
families Odds ratio SE Odds ratio SEMother’s family status (Partnered) Lone mother ***0.52 0.04 **2.09 0.49Unweighted base 6988 1243 Weighted base 6974 1062 Note: *p<0.05, ** p<0.01, ***p<0.001. The dependent variable is being in paid employment (versus not being in paid work). Odds ratio >1 indicates higher odds of working, and odd ratios <1 indicates lower odds.

Ref: DCSF-RR191
ISBN: 978 1 84775 628 2
© National Centre for Social Research 2010
www.dcsf.gov.uk/research
Published by the Department forChildren, Schools and Families


![ORGANISATIONAL CLIMATE AND PERFORMANCE: A …roar.uel.ac.uk/3932/1/Jummy's_Final_Thesis[1].pdf · ORGANISATIONAL CLIMATE AND PERFORMANCE: A ... relationship between organisational](https://img.pdfslide.us/doc/110x75/5bbe439209d3f208478b929b/organisational-climate-and-performance-a-roaruelacuk39321jummysfinalthesis1pdf.jpg)