Embed Size (px)
Citation preview

AUTHORIZATION TO LEND AND REPRODUCE THE THESIS
As the sole author of this thesis, I authorize Brown University to lend it to other
institutions or individuals for the purpose of scholarly research
____________ __________________________
Date Ahbid Zein-Sabatto, Author
I further authorize Brown University to reproduce this thesis by photocopying or other
means, in total or in part, at the request of other institutions or individuals for the purpose
of scholarly research
____________ __________________________
Date Ahbid Zein-Sabatto, Author

Utilizing Three-Dimensional, Noninvasive, and Label-Free
OCT Imaging to Detect Cellular Viability in Neurospheroids
By
Ahbid Zein-Sabatto
B.E., Vanderbilt University, 2016
Submitted in partial fulfillment of the requirements for the degree of Master of Science in
the School of Engineering at Brown University
PROVIDENCE, RHODE ISLAND
May 2019

ii
This thesis by Ahbid Zein-Sabatto is accepted in its present form by the School of
Engineering as satisfying the thesis requirements for the degree of Master of Science.
____________ _____________________________
Date Jonghwan Lee, Ph.D., Advisor
____________ _____________________________
Date Diane Hoffman-Kim, Ph.D., Reader
____________ _____________________________
Date Celinda Kofron, Ph.D., Reader
Approved by the Graduate Council
____________ _____________________________
Date Andrew G. Campbell, Ph.D.,
Dean of the Graduate School

iii
Curriculum Vitae
Ahbid Zein-Sabatto | [email protected]
Education
Master of Science, Sc.M. Biomedical Engineering May 2019
Brown University: Providence, Rhode Island
Bachelor of Engineering, B.E. Biomedical Engineering May 2016
Vanderbilt University: Nashville, Tennessee
Research
Graduate Researcher, Biomedical Optics and Neuroengineering Aug 2017-Present
Department of Biomedical Engineering
Advisor: Dr. Jonghwan Lee in collaboration with Dr. Diane Hoffman-Kim
Brown University: Providence, Rhode Island
▪ Evaluating the use of high-throughput, noninvasive, and label-free OCT imaging
techniques to assess cellular viability of tissue engineered neurospheroids
▪ Validating the use of OCT imaging to longitudinally monitor viability in ischemic
stroke models
Methods: optical coherence tomography, Matlab, Fluor-4 calcium imaging, lactate
dehydrogenase assay, live/dead assay, confocal microscopy, immunohistochemistry
Independent Researcher, Idea2Impact Summer Research Jun 2015-Aug 2015
Department of Biomedical Engineering
Advisors: Dr. Matthew Walker III, Dr. Amanda Lowery, Dr. Christina Marasco
Vanderbilt University: Nashville, Tennessee
▪ Designed and developed a medical device that utilizes low level light therapy to
treat chronic diabetic foot ulcers
Methods: printed circuit board design, low-level-light therapy, surface mount circuit
assembly
Undergraduate Student Researcher, Bone Biomechanics Jan 2011-Aug 2013
Department of Orthopedic Surgery
Advisor: Dr. Jeffry S. Nyman
Vanderbilt University: Nashville, Tennessee
▪ Investigated the effects of age, disease, genetics, and other factors on bone
toughness
▪ Advanced the understanding of bone fractures and their predictors in high risk
patients
iv
Methods: µ-computed tomography, nuclear magnetic resonance imaging, Raman
spectroscopy, 3-point-bend-test, osteoblast cell culture, light microscopy, metallurgic
sample preparation
Publications
1. Makowski AJ, Pence IJ, Uppuganti S, Zein-Sabatto A, Huszagh MC, Mahadevan-
Jansen A, & Nyman JS. Polarization in Raman Spectroscopy Helps Explain Bone
Brittleness in Genetic Mouse Models. Journal of Biomedical Optic.
2014;19(11):117008 DOI: 10.1117/1.JBO.19.11.117008.
2. Nyman JS, Gorochow LE, Horch RA, Uppuganti S, Zein-Sabatto A, Manhard
MK, & Does MD. Partial Removal of Pore and Loosely Bound Water by Low-
Energy Drying Decreases Cortical Bone Toughness in Young and Old
Donors. Journal of the Mechanical Behavior of Biomedical Materials.
2013;22:136–145 DOI: 10.1016/j.jmbbm.2012.08.013.
3. Zein-Sabatto A, Horch RA, Murry M, & Nyman JS. The Significance of ATF-4
and TGF-β to Bound Water and Bone Fracture Resistance. Young Scientist.
2012;2:51-53.
Patents
1. Hicks A, Fross B, Mendoza J, Piper L, Schlunk S, Stedman E, Zein-Sabatto A.
Systems, Devices, and Methods for Administering Low-Level-Light Therapy. U.S.
Patent Application 2018/0304094 A1. Publication Date: Oct. 25, 2018.
Poster Presentations (‘*’ designates the presenters)
1. Fross B*, Mendoza J*, Piper L*, Schlunk S*, Stedman E*, Zein-Sabatto A*, Hicks
A. Diabetic Foot Ulcer Treatment Utilizing a Low-Level Light Therapy Device.
Poster presentation at the 2016 Vanderbilt Senior Design Day, Nashville, TN, USA;
April 2016
2. Makowski AJ*, Uppuganti S, Zein-Sabatto A, Huszagh M, Granke M, & Nyman
JS. Loss in Tissue Heterogeneity Corresponds with the Age-Related Decrease in
Fracture Toughness of Bone. Poster presentation at the 2014 annual meeting of the
Orthopedic Research Society, New Orleans, LA, USA; March 2014
3. Makowski AJ*, Uppuganti S, Zein-Sabatto A, Whitehead J, Granke M,
Mahadevan-Jansen A, & Nyman JS. Measuring Bone Heterogeneity with Raman

v
Spectroscopy to Explain Aging Differences in Human Fracture Toughness. Poster
presentation at the 2013 annual meeting of the American Society for Bone and
Mineral Research, Baltimore, MD, USA; October 2013
4. Granke M*, Uppuganti S, Makowski AJ, Zein-Sabatto A, Schultze AK,
Whitehead J, & Nyman JS. Does Reference Point Indentation Assess the Fracture
Toughness of Human Cortical Bone? Poster presentation at the 2013 annual
meeting of the American Society for Bone and Mineral Research, Baltimore, MD,
USA; October 2013
5. Zein-Sabatto A*, Huszagh M, Makowski AJ, Uppuganti S, Mahadevan-Jansen A,
& Nyman JS. Polarization Raman Spectroscopy Mapping Signifies Age-Related
Changes in Bone Fracture Resistance. Poster presentation at the 2013 VUSE
Summer Research Program symposium, Nashville, TN, USA; September 2013
6. Zein-Sabatto A*, Horch RA, Murry M, Esparza J, Rowland B, Makowski AJ, &
Nyman JS. The Effects of ATF4 and TGF-β Mediation on Bone Integrity. Poster
presentation at the 2011 School for Science and Math at Vanderbilt symposium,
Nashville, TN, USA; July 2011
7. Zein-Sabatto A*, Kumar V*, Das S*, & Konjeti R*. The Effects of Surface Area,
Distance, and Voltage on the Production of Hydrogen by Means of Short-Pulse
Hydrolysis. Presentation at the 2011 annual meeting of the Tennessee Junior
Academy of Science, Nashville, TN, USA; April 2011
Teaching and Mentorship Experience
Professional Tutor, Bridges to Belmont Jan 2017-Apr 2017
Supervisor: Dr. Nadi Bishop
Belmont University: Nashville, Tennessee
▪ Tutored undergraduate students in various subjects
▪ Assisted students in developing studying and note-taking techniques
Lab Assistant, Vanderbilt Student Volunteers for Science Aug 2012-May 2016
Supervisor: Patricia C. Tellinghuisen
Vanderbilt University: Nashville, Tennessee
▪ Maintained and replenished science experiment kits used by middle school
students in the Nashville metropolitan area and surrounding counties
▪ Conducted in-class science experiments to enrich teaching curriculum
▪ Directed and trained peers to enhance work flow

vi
Honors and Awards
Best in Healthcare Award Apr 2016
Vanderbilt University, Senior Design Day
Nashville, Tennessee
Thomas G. Arnold Prize for Biomedical Engineering System Design May 2016
Vanderbilt University, Department of Biomedical Engineering
Nashville, Tennessee
Affiliation & Leadership
Muslim Students Association: Vanderbilt University
▪ Member Aug 2012-May 2016
▪ Treasurer Aug 2013-Apr 2016
Middle Eastern Student Association: Vanderbilt University
▪ Treasurer Aug 2015-Apr 2016
Languages
▪ Arabic: fluent
▪ French: beginner proficiency

vii
Acknowledgments
I am blessed to have been surrounded by wonderful people at Brown, for they
have contributed greatly to my research and accomplishments.
First, I would like to thank Dr. Jonghwan Lee for welcoming me to his lab,
guiding me through my research, providing continuous words of encouragement, and
exemplifying all the characteristics of a great advisor.
I would like to thank Dr. Diane Hoffman-Kim for collaborating with our lab and
providing invaluable insight to my research. None of this would not have been possible
without your support. I would also like to thank you for participating in my thesis
committee.
I would like to thank Dr. Celinda Kofron for participating in my thesis committee
and for fulfilling the role of Master’s Program Director during a time of need.
Thank you to the members of the Lee Lab for your support, friendship, and advice
throughout the years. A special thanks to Dr. Julia Lee for mentoring me, teaching me
how to use the OCT imaging system, and being there when things did not go as planned.
You have shown me how great an amazing mentor can be. I would also like to extend a
special thanks to Jess Sevetson from the Hoffman-Kim lab for being the backbone of this
research. Thank you for sharing your neurospheroids, answering my many questions, and
helping me with all the IHC and calcium imaging.
Finally, thank you to my family and friends for your unconditional love and for
making me the man I am today. I am eternally grateful for having you in my life.

viii
Table of Contents
List of Figures ................................................................................................................... xi
Chapter 1: Taking Neurons to the Third Dimension .................................................... 1
1.1 Introduction ............................................................................................................... 1
1.2 Three-Dimensional Neurospheroids ......................................................................... 2
1.3 Applications of 3D Neural Cultures ......................................................................... 3
1.4 Cellular Viability Analysis ....................................................................................... 4
1.4.1 Traditional Cellular Viability Assays ................................................................ 4
1.4.2 Challenges Associated with Traditional Methods ............................................. 6
Chapter 2: Optical Coherence Tomography Imaging and System .............................. 9
2.1 Introduction ............................................................................................................... 9
2.2 Optical Coherence Tomography for Viability Imaging .......................................... 10
2.2.1 Advantages of Utilizing Optical Coherence Tomography Imaging ................ 10
2.2.2 The Link Between Cellular Viability and Optical Coherence Tomography ... 12
2.3 Optical Coherence Tomography Parameters .......................................................... 14
2.3.1 Intensity ............................................................................................................ 14
2.3.2 Decorrelation .................................................................................................... 15
2.3.3 Diffusion Coefficient ....................................................................................... 17
2.3.4 Surface Area-to-Volume-Ratio ........................................................................ 19
2.3.5 OCT Viability Imaging in Literature ............................................................... 20
Chapter 3: Optical Coherence Microscopy Revealed Time-Dependent Changes in
Cellular Dynamics in Response to Ethanol Treatment ............................................... 23
3.1 Abstract ................................................................................................................... 23
3.2 Introduction ............................................................................................................. 24
3.3 Methods .................................................................................................................. 25

ix
3.3.1 Neurospheroid Cell Isolation ........................................................................... 25
3.3.2 Forming Three-Dimensional, Self-Aggregating Neurospheroids .................... 26
3.3.3 Calcium Imaging .............................................................................................. 27
3.3.4 Immunohistochemistry .................................................................................... 28
3.3.5 ClearT2 Optical Clearing Protocol .................................................................... 28
3.3.6 OCM Imaging System and Scanning Protocol ................................................ 29
3.3.7 OCM Data Processing ...................................................................................... 29
3.3.8 Cellular Viability Manipulation ....................................................................... 31
3.3.9 Statistical Analysis ........................................................................................... 31
3.4 Results ..................................................................................................................... 32
3.4.1 OCM Imaging Revealed Cells Through Contrast in Intracellular Motility ..... 32
3.4.2 OCM Intensity Signal Displayed Unique Time-Dependent Responses to
Ethanol Treatment ..................................................................................................... 34
3.4.3 Ethanol Disrupted Membrane Integrity Through Oncotic Necrosis ................ 36
3.5 Discussion ............................................................................................................... 37
3.6 Conclusion .............................................................................................................. 41
Chapter 4: High-throughput, Multi-Metric, and 3D Assessment of Neurospheroids
........................................................................................................................................... 42
4.1 Abstract ................................................................................................................... 42
4.2 Introduction ............................................................................................................. 42
4.3 Methods .................................................................................................................. 44
4.3.1 Neurospheroid Cell Isolation ........................................................................... 44
4.3.2 Forming Three-Dimensional, Self-Aggregating Neurospheroids .................... 45
4.3.3 SD OCT Imaging System and Scanning Protocol ........................................... 46
4.3.4 Cellular Viability Manipulation ....................................................................... 47
4.3.5 OCT Data Processing ....................................................................................... 47

x
4.3.6 Statistical Analysis ........................................................................................... 48
4.4 Results ..................................................................................................................... 49
4.4.1 Ethanol Elicited Dose and Time-Dependent Changes in OCT Intensity Signal
................................................................................................................................... 49
4.4.2 Ethanol Did Not Elicit Dose and Time-Dependent Changes in OCT
Decorrelation ............................................................................................................. 50
4.4.3 Ethanol Elicited a Slight Increase in Diffusion Coefficient ............................. 51
4.5 Discussion ............................................................................................................... 53
4.6 Conclusion .............................................................................................................. 56
References ........................................................................................................................ 57

xi
List of Figures
Figure 1. A schematic of a typical SD OCT system is shown. Light paths are represented
as arrows. The source, sample, and reference light paths are colored red, blue, and gray,
respectively. ...................................................................................................................... 10
Figure 2. (A) Transmission electron micrographs of a normal neuron, (B) an apoptotic
neuron, (C and D) and necrotic neurons. Scale bar 2.5 µm. Abbreviations: N, nucleus;
PM, plasma membrane; Mi, mitochondria. Adapted from Won et al., 2002.................... 13
Figure 3. A diagram explaining the steps and equations used to derive the intensity for a
continuous sample using SD OCT. E0 is the equation for the electric field of the source
light, R is the sample’s field reflectivity, c is the speed of light, ε is the permittivity of
free space, k is the wave number, z is the sample depth, ω is the angular frequency, σ is
the standard deviation of the center angular frequency, CC is the complex conjugate, and
ζ is the Fourier transformed wave number........................................................................ 15
Figure 4. (A) An illustration of the cross-section of a voxel (blue square) containing light
scattering particles (colored circles) before and after Δt time has passed. Black arrows
signify the direction of particle movement, and white arrows indicate the reflected light’s
path. (B) The resulting OCT signal produced by the combined interference of all
scattering particles present within the voxel (i.e. speckle). (C) The equation used to derive
decorrelation where D is the decorrelation, R is the field reflectivity, and t is time. ....... 16
Figure 5. (A) An illustration of the particles contributing to the DLS OCT signal in a
given voxel. (B) A model of the autocorrelation function on a complex plane. The
magnitude of MS and MF are proportional to the static and flowing particles, respectively.

xii
Particles with larger cross-sections contribute more to the DLS OCT signal. Adapted
from Lee et al., 2012. ........................................................................................................ 18
Figure 6. The process of acquiring and analyzing OCM data is described. (Top left) The
imaging plane, identified by the shaded blue region, was acquired along the central plane
of the neurospheroid. (Top right) A 2D OCM decorrelation map was then reconstructed
at the focal plane. (Bottom right) Multiple longitudinal images were acquired at a fixed
FOV for one hour. (Bottom left) OCM-derived viability data can then be plotted
longitudinally for each spheroid. ...................................................................................... 30
Figure 7. A visual representation of how the shell (region between the dotted red and
blue line) and core (region within the dotted blue line) are designated when analyzing
OCM data. Scale bar 100 µm. ........................................................................................... 31
Figure 8. (Left to right) IHC, calcium, decorrelation, and intensity images of
neurospheroids at 14 DIV at various depths. Cell nuclei and neuronal microtubules were
labeled using DAPI (blue) and β-III-tubulin (red), respectively. Calcium images were
acquired with OGB indicator (green). Scale bars 100 µm. ............................................... 33
Figure 9. OGB calcium (left) and OCM decorrelation (right) en face images of
neurospheroids at 9 and 14 DIV, respectively. Magnified views are designated by the red
squares............................................................................................................................... 34
Figure 10. Raw and normalized mean intensity and decorrelation parameters were
longitudinally measured in 4 M etOH treated neurospheroids (n=4; DIV: 5, 7, 19, and
28). Error bars represent the standard deviations. Either the one-way repeated measures
ANOVA with Tukey test or the Friedman test with Dunn’s post hoc tests were conducted
depending on the normality and variance of the data. Statistical results compared the 10-

xiii
minute value with all other time points and are reported in the order of core, shell, and
total regions from left to right. P < 0.05 *, < 0.01 **, and < 0.001 †. .............................. 35
Figure 11. Z-projections were acquired from neurospheroids at 9 DIV using OGB
calcium indicator after 4 M etOH treatment. Projections were created from the average of
the top 100 slices. Images A-F were taken at pretreatment, 1, 10, 30, 45, and 60 minutes
after treatment, respectively. Image G is of a 60-minute control spheroid. Images A-F are
from the same spheroid. Scale bars 100 µm. .................................................................... 36
Figure 12. Z-projections were acquired from neurospheroids at 14 DIV using the top 100
slices. Astrocytes (GFAP, gray) and cell nuclei (DAPI, blue) were stained. Images were
taken at 10 min control (A), 10 min treatment (B), 60 min control (C), and 60 min
treatment (D). Scale bars 100 µm. .................................................................................... 37
Figure 13. (Left) En face intensity image of multiple neurospheroids within a gel. The
spheroid centered in the red square appears in various orthogonal planes (center and
right). The red ellipses in the orthogonal views are fitted for each selected spheroid. ..... 48
Figure 14. Raw and normalized mean intensity were longitudinally plotted for
neurospheroids in the 4 M etOH (n spheroids = 85; n gels = 6; n batches = 3; DIV 7 and
14) 2 M etOH (n spheroids = 45; n gels = 3; n batches = 2; DIV 21), and PBS (n
spheroids = 60; n gels = 4; n batches = 2; DIV 14 and 21) treatment groups. The core,
shell, and total intensity parameters were plotted individually to visualize any regional
changes. One-way repeated measures ANOVA/Friedman test with Tukey/Dunn’s post
hoc tests were conducted to determine statistical significance (for normally or non-
normally distributed data, respectively). The statistical significance between the initial
xiv
condition and all other time points was reported in the order of core, shell, and total
region from left to right. P values < 0.05 *, < 0.01 **, and < 0.001 †.............................. 49
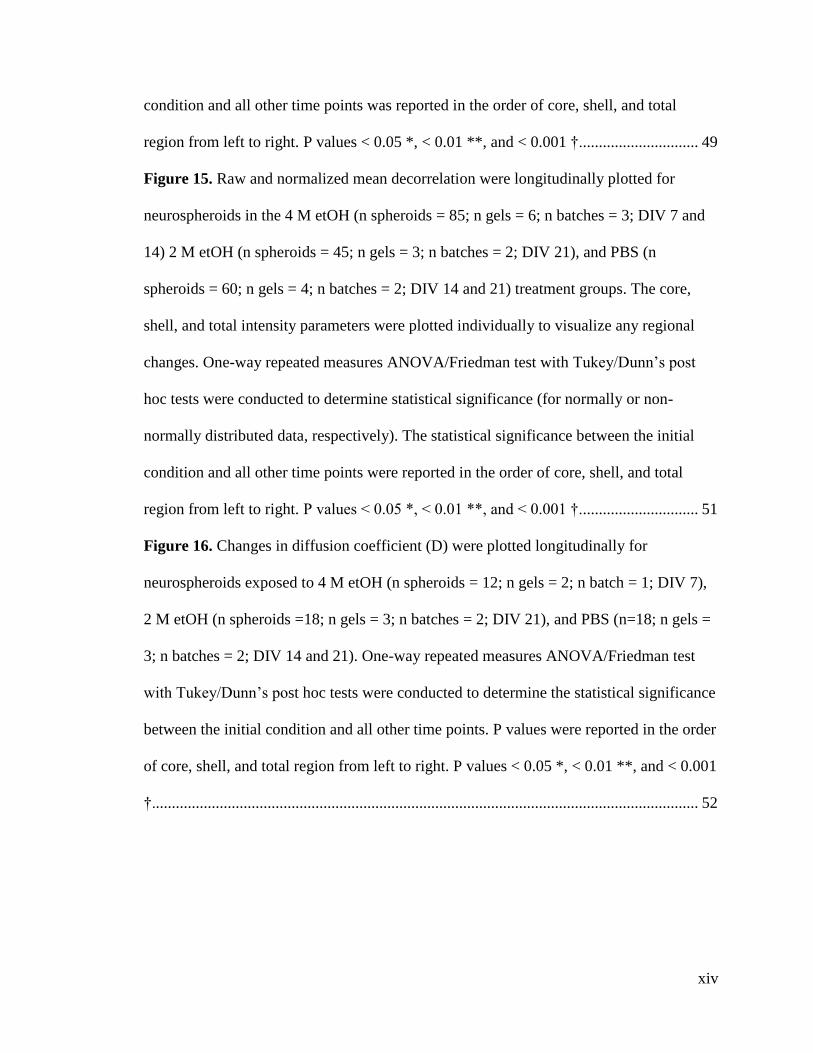
Figure 15. Raw and normalized mean decorrelation were longitudinally plotted for
neurospheroids in the 4 M etOH (n spheroids = 85; n gels = 6; n batches = 3; DIV 7 and
14) 2 M etOH (n spheroids = 45; n gels = 3; n batches = 2; DIV 21), and PBS (n
spheroids = 60; n gels = 4; n batches = 2; DIV 14 and 21) treatment groups. The core,
shell, and total intensity parameters were plotted individually to visualize any regional
changes. One-way repeated measures ANOVA/Friedman test with Tukey/Dunn’s post
hoc tests were conducted to determine statistical significance (for normally or non-
normally distributed data, respectively). The statistical significance between the initial
condition and all other time points were reported in the order of core, shell, and total
region from left to right. P values < 0.05 *, < 0.01 **, and < 0.001 †.............................. 51
Figure 16. Changes in diffusion coefficient (D) were plotted longitudinally for
neurospheroids exposed to 4 M etOH (n spheroids = 12; n gels = 2; n batch = 1; DIV 7),
2 M etOH (n spheroids =18; n gels = 3; n batches = 2; DIV 21), and PBS (n=18; n gels =
3; n batches = 2; DIV 14 and 21). One-way repeated measures ANOVA/Friedman test
with Tukey/Dunn’s post hoc tests were conducted to determine the statistical significance
between the initial condition and all other time points. P values were reported in the order
of core, shell, and total region from left to right. P values < 0.05 *, < 0.01 **, and < 0.001
†......................................................................................................................................... 52

1
Chapter 1: Taking Neurons to the Third Dimension
1.1 Introduction
Cell cultures have proven to be an invaluable research tool used to advance the
understanding of complex biological systems. Two-dimensional (2D) in vitro models (i.e.
cells cultured on flat petri dishes and well plates) enable researchers to investigate
various cellular mechanisms in a low-cost, controlled, and high-throughput environment
prior to initiating more rigorous studies. For example, 2D in vitro models are often used
in preclinical studies to predict the safety and efficacy of novel drug candidates before
advancing to expensive and time-consuming clinical trials. Successful screenings help
pharmaceutical companies focus their resources on the most promising drugs to reduce
attrition rates. A recent study has found that only 13.8% of all drug development
programs progressed from phase 1 to final approval 1. Pharmaceutical companies are
constantly searching for more relevant in vitro models to help improve the efficiency of
their drug pipelines. Cell cultures are also heavily used in academia for various
applications including cellular biology, developmental biology, and disease pathogenesis.
It is clear that our understanding of cellular mechanisms and physiology is largely due to
the advancements made using cell cultures.
Nevertheless, multiple studies have found that 2D in vitro models inaccurately
replicate in vivo conditions and cellular behavior. Cells are responsive to their
microenvironments and rely on cell-cell and cell-matrix interactions for normal
physiological function and differentiation 2-4. Cells grown on a petri dish experience an
unnaturally stiff attachment surface and are forced into a planar morphology which

2
affects cell adhesion, signaling, and organization 4,5. Neurons and cells of the central
nervous system (CNS) are particularly affected by these limitations since their native
environment is drastically altered when grown on a flat surface. Under healthy in vivo
conditions, neurons in the brain create intricate three-dimensional (3D) networks with
neighboring glia and neurons that are compromised in 2D cultures. As a result, the
inaccurate culturing environment can challenge the relevance of neuronal cell cultures
and their ability to properly model the in vivo response. The recent development of 3D in
vitro models aims to improve upon traditional 2D techniques by fostering an environment
that more accurately replicates in vivo conditions 6.
1.2 Three-Dimensional Neurospheroids
Multiple neuronal cell lines have been successfully translated into 3D constructs
using a variety of methods 7; however, the present study focuses on neurospheroids
developed by the Hoffman-Kim lab which are derived from postnatal cortical rat tissue.
These neurospheroids are scaffold-free and self-aggregating; as a result, they do not
require unnaturally high concentrations of scaffolding proteins, growth factors, or
extracellular matrix (ECM) to promote adhesion and proliferation 8-10. Furthermore, the
neurospheroids could be produced with high batch consistency and in large quantities
without the need for specialized equipment which enables the use of high-throughput
testing. Depending on the days in vitro (DIV) and seeding density, neurospheroids can
have diameters between 100-300 µm 10. Cells within the neurospheroids successfully
replicated various in vivo cortical tissue characteristics including cell diversity,
morphology, electrophysiology, and biomechanical properties. Immunohistochemistry
(IHC) coupled with confocal imaging revealed the presence of neurons, astrocytes,

3
oligodendrocytes, microglia, and progenitor cells at relevant densities 10. In addition, the
neurospheroids innately produced the necessary ECM, in the form of laminin, without the
need for exogenous factors 10. The dispersion of glia and formation of neurites that
extended in all directions were morphologically similar to in vivo tissue as well 10.
Neurons at 14 and 21 DIV were capable of firing spontaneous and evoked action
potentials with robust excitatory and inhibitory synaptic activity as determined by whole
cell patch-clamps 10. Finally, the neurospheroids had an elastic modulus within the range
of neonatal brain tissue 10. These findings promote the use of neurospheroids as a robust
and reliable testing platform with versatile applications that bridge the gap between
traditional in vitro and in vivo models.
1.3 Applications of 3D Neural Cultures
Neurospheroids and other 3D neural cultures can be utilized in a variety of studies
due to their high versatility. In some studies, 3D cultures provided a testing platform that
was more clinically relevant than in vivo animal models. Microcephaly pathogenesis is
normally studied in vivo using mice; however, mice failed to exhibit the characteristic
reduction of brain size seen in human patients 11. Meanwhile, 3D cerebral organoids
derived from human pluripotent stem cells (hPSCs) successfully replicated fundamental
neurodevelopmental processes associated with healthy and diseased brains 11. In other
studies, neurospheroids derived from hPSCs expressed the hallmark pathologies of
Alzheimer’s disease through β-amyloid and tau accumulation 12-14. The establishment of
more relevant in vitro disease models will help researchers develop the most accurate
understanding of the underlying biological mechanisms associated with disease
pathogenesis.

4
3D neural tissues also provide an advantageous, high-throughput testing platform
for the use in cytotoxicity and drug screening studies. The 3D in vitro model provides
more relevance than its 2D counterpart while mitigating the ethical concerns associated
with using animal models, especially when a large sample size is required. In one study,
neurospheroids were used to evaluate the cytotoxicity of perfluorooctanoic and
perfluorooctanesulfonic acid which were commonly widespread industrial compounds 15.
Neurospheroids have also been used to study the effects of regional glioblastoma tumor
heterogeneity and its impact on drug efficacy 16-18. Sufficiently large tumor spheroids
inherently reproduce the hypoxic, acidic, and low nutrient cores of tumors found in situ;
as a result, they can more accurately predict the true tumor drug response 16-18. The drug
screening capabilities of 3D in vitro models was further validated in studies that analyzed
Zika-infected 3D neural tissue and the effectiveness of various drugs to counteract the
infection 19,20. As highlighted by these studies, 3D neural cultures enable researchers to
utilize powerful high-throughput approaches to examine the effects of development,
diseases, and drugs on the CNS.
1.4 Cellular Viability Analysis
1.4.1 Traditional Cellular Viability Assays
Cellular viability is an example of a critical analytical assessment used for in vitro
studies. As the name suggests, cellular viability assays determine the health of cells
within a sample. Techniques including live/dead assays, colorimetric assays, fluorescence
imaging, and IHC are utilized often 21-24. Live/dead assays such as calcein AM, ethidium
homodimer, propidium iodide, and trypan blue rely on the ability of cells with intact

5
membranes to exclude or uptake certain dyes to differentiate them from dead cells. The
sample can be analyzed by a flow cytometer or fluorescence microscope to measure
cellular viability. Colorimetric assays such as the MTT [3-(4,5-dimethylthiazol-2-yl)-2,5-
diphenyltetrazolium bromide] and lactate dehydrogenase (LDH) assays rely on the
interaction of cellular enzymes with a color changing substrate. Viability can then be
analyzed utilizing a plate reader which monitors the change in optical absorption as a
result of the color change. Fluorescence imaging overlaps with some tags used in
live/dead assays and IHC; however, it can also take the form of calcium imaging.
Calcium homeostasis is an integral part of neuronal growth, and the disruption of
intracellular calcium levels leads to cell death 25-27. As a result, intracellular calcium
measurements can be used in conjunction with other assays to determine cellular
viability. Other assays, such as terminal deoxynucleotidyl transferase dUTP nick end
labeling (TUNEL) which binds to fragmented DNA and annexin V which binds to
extracellular phosphatidylserine, can be coupled with fluorescent markers to detect
specific death pathways such as apoptosis. IHC utilizes antibodies, typically attached to a
fluorescent marker, to detect certain antigens within tissue. If structural proteins such as
the cytoskeleton are tagged, then dead cells can be identified due to the morphological
changes associated with cell death. In addition, this technique could be used to
differentiate between various cell death pathways occurring within a sample based on
their unique morphological “fingerprints”. Cell death pathways will be discussed in more
detail in section 2.2.2.

6
1.4.2 Challenges Associated with Traditional Methods
Despite the advancements made to produce improved 3D in vitro models, there is
an evident lack of noninvasive, label-free, and nondestructive evaluation techniques for
3D tissue cultures 17. In many cases, traditional techniques have been developed and
optimized in 2D cultures; therefore, they do not translate well into the 3D construct. One
main concern of utilizing these methods involves the addition of foreign reagents or
labeling molecules to the sample. These assays analyze viability as a “snapshot” at
certain time points due to the terminal and cytotoxic nature of the added reagents. In
addition, some procedures (e.g. IHC, TUNEL, and propidium iodide) require the sample
to be fixed or optically cleared/sectioned. This prevents the true longitudinal assessment
of viability within the same sample. Another concern associated with adding labeling
molecules to the cell media involves the disproportionate tagging of cells closer to the
surface. This makes it difficult to analyze cellular viability within the deeper regions of
3D cultures due to the limited diffusion of labeling molecules that depends on their initial
concentration, size, and cell permeability 21. Live florescence imaging can eliminate the
use of cytotoxic reagents; however, fluorescent labels are susceptible to photobleaching
and phototoxicity which reduces their longitudinal capabilities 28. Imaging with chemical
fluorophores is also affected by the concentration of labeling molecules, the duration of
incubation, and 3D culture size (i.e. limitations in label diffusion). Recommended
concentrations and incubation times provided by the manufacturer are generally
determined for 2D cultures which forces researchers to independently run optimization
experiments tailored for their 3D setups. This is time consuming and necessitates the
need for standardized methods. Genetically encoded fluorescent tags overcome the

7
aforementioned limitations; however, they are costlier and can be conducted readily in a
small selection of animal models.
Challenges also arise with the utilization of certain analytical equipment. Plate
readers are typically used with colorimetric assays using specially made well plates
containing a known density of cells. A substrate solution that is either clear or a specific
color is added to the cells in the well plate. As the enzymes begin to react with their
substrate, a color change occurs which is measured as a change in absorbance at a given
wavelength. The change in absorbance is then compared to a standard curve and
correlated with viability. These assays are sensitive to both the viability and quantity of
cells present within a sample. It is more difficult to estimate the number of cells present
in 3D than 2D cultures due to increased batch heterogeneity (i.e. differences in spheroid
quantity, size, and composition). This makes it difficult to optimize the protocol to
achieve reliable and repeatable results. In addition, depending on seeding format, there
are generally fewer cells present in a single gel of neurospheroids than a confluent layer
on a well plate. The smaller quantity of cells may not be sufficient to produce a
noticeable color change in the assay which results in false negatives. To overcome these
challenges, 3D culture experiments utilizing a plate reader should include multiple
positive and negative controls as well as a robust standard curve for effective data
analysis.
Flow cytometers are also optimally designed for the use in 2D cultures. Flow
cytometry generally involves the measure and classification of cells within a suspension
based on their fluorescence. For example, cells can be simultaneously labeled using two
fluorescent markers. Each label should have a unique emission spectrum which allows
8
the flow cytometer to quantifiably plot the intensity distribution of multiple wavelengths
as it measures the fluorescence of cells passing a detector. This technique requires the
disaggregation of cells which eliminates any spatially relevant data present in 3D
cultures. Moreover, there are fewer cells fluorescently tagged in 3D cultures due to the
limited diffusion of the labeling molecules which could be potentially analyzed as false
negatives. As a result, plate readers and flow cytometers are most effectively used with
2D cultures.

9
Chapter 2: Optical Coherence Tomography Imaging and
System
2.1 Introduction
Optical coherence tomography (OCT) is a high resolution, label-free, and
noninvasive imaging modality with micrometer spatial resolution and millimeter imaging
depth 29. OCT imaging fundamentally relies on low coherence interferometry to analyze
sample tissue. Source light from a superluminescent diode is split into a reference and
sample arm. Light traveling through the reference arm is reflected off a mirror and
redirected to a detector. Meanwhile, the beam in the sample arm interacts with the
sample, and the backscattered light travels to the detector. The interference pattern
created from the two light paths creates an OCT signal related to the sample’s optical
properties. Broadband light sources are used to maintain low coherence such that only
light from a certain focal plane is resolvable. Adjusting the position of the reference
mirror shifts the focal plane allowing for 3D imaging of the sample throughout its depth.
Spectral Domain OCT (SD OCT) utilizes a similar imaging protocol but replaces the
detector with a spectrometer and does not require adjusting the reference mirror to obtain
3D images. Instead, the inverse Fourier transform is used to resolve the depth encoded
OCT signal from the sample at faster acquisition rates than traditional OCT. Figure 1
provides a basic schematic of the light paths and components of a SD OCT imaging
system. The SD OCT system can also be coupled with a variety of objective lenses to
obtain 3D images with different spatial resolutions. A SD OCT imaging system was
exclusively used in this study.

10
2.2 Optical Coherence Tomography for Viability Imaging
2.2.1 Advantages of Utilizing Optical Coherence Tomography Imaging
OCT and its various forms have multiple advantages over current cellular
viability imaging modalities. It most notably eliminates the need for foreign labels or
cytotoxic protocols which permits longitudinal, paired sample analysis. Theoretically,
OCT can be used to indefinitely image the same sample for the duration of the sample’s
usability. Current techniques preclude the true longitudinal assessment of disease
pathogenesis. Analyzing data from disease models like Alzheimer’s disease and cerebral
reperfusion injury is difficult with terminal assays since the disease symptoms can
progress at different rates across samples. In addition, the time intervals used for terminal
Figure 1. A schematic of a typical SD OCT system is shown. Light paths
are represented as arrows. The source, sample, and reference light paths
are colored red, blue, and gray, respectively.

11
assays are arbitrarily decided. This makes the continuous and longitudinal assessment of
a sample using OCT imaging more ideal for tracking the progression of diseases than
traditional methods.
Paired sample analysis, which is enabled by OCT imaging, is preferable over
unpaired analysis due to the reduction of variance within a sample. The reduction in
sample variance enables researchers to use smaller sample sizes while maintaining
statistical significance. This is critical for applications involving personalized medicine
since tissue biopsies can be limited. As a result, OCT viability imaging has the potential
to effectively implement personalized medicine and improve patient response to
treatment.
OCT’s penetration capability enables it to acquire images throughout 3D tissue
with high fidelity. Depending on the field of view (FOV), an entire spheroid could be
mapped which allows for the unique analysis of 3D regions (i.e. shell and core
measurements). This approach enables researchers to analyze the effects of hypoxic, low-
nutrient cores on treatment efficacy independently from the nutrient rich surface.
Arguably, confocal and two-photon microscopy can be used to generate 3D stacks of a
sample; however, OCT imaging does not require substantial time-intensive sample
preparation such as mixing reagents, sample incubation, or optical clearing. Multiple
spheroids can also be mapped in a relatively short time period due to OCT’s fast image
acquisition rates. A large FOV and fast imaging speeds are necessary components for an
efficient high-throughput imaging system. Drug screening studies can greatly benefit
from these features. Coupling a high-throughput imaging system with the ability to

12
analyze region-specific changes in viability can be applied to study the effects of 3D
tumor heterogeneity and its impact on drug resistance.
Finally, neuronal tissue has been successfully imaged using OCT in ex vivo and in
vitro environments with high spatial resolution and in close accordance with ‘gold
standards’ of the field 30-32. Based on these findings, it is expected that OCT can
successfully image neurospheroids. Overall, the combined advantages of the OCT system
make it a potentially powerful cellular viability imaging tool for neurospheroids.
2.2.2 The Link Between Cellular Viability and Optical Coherence Tomography
OCT-based viability imaging is dependent on the changes in optical scattering
properties between viable and dead cells. For the purposes of this study, cell death will be
categorized through apoptosis or oncotic necrosis. This classification is overly simplified
since there exist other cell death pathways; however, the two pathways mentioned are
expected to be the most commonly found in this study. Apoptosis occurs when the cell
actively initiates signaling cascades resulting in the degradation and condensation of the
nucleus and cytoplasm into dense apoptotic bodies 33,34. Oncosis is characterized by
cellular and organelle swelling, increased membrane permeability, and blebbing that
ultimately leads to necrosis 34. Transmission electron micrographs of single neurons (Fig.
2) clearly display the unique morphological differences between apoptotic and necrotic
cells 35. These distinct morphological characteristics impact the optical scattering profile
of cells that is detectable by OCT imaging; therefore, it is reasonable to believe that
apoptotic neurons will produce an OCT “signature” that is uniquely different from those
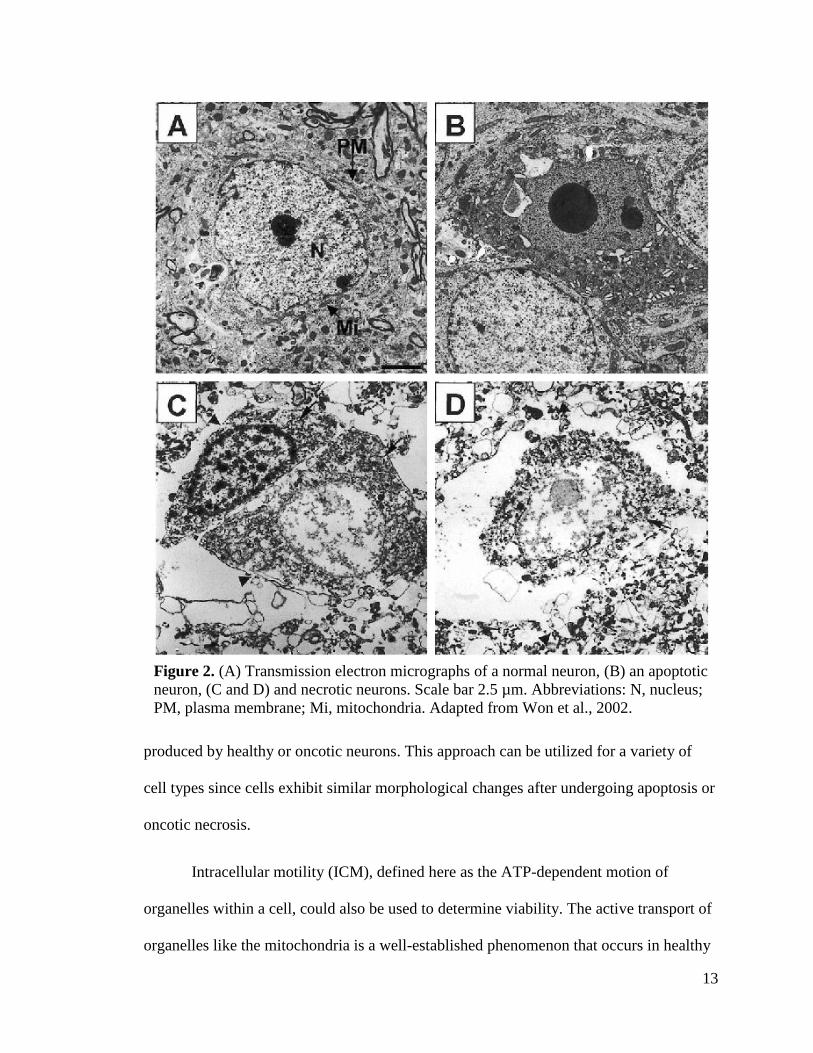
13
produced by healthy or oncotic neurons. This approach can be utilized for a variety of
cell types since cells exhibit similar morphological changes after undergoing apoptosis or
oncotic necrosis.
Intracellular motility (ICM), defined here as the ATP-dependent motion of
organelles within a cell, could also be used to determine viability. The active transport of
organelles like the mitochondria is a well-established phenomenon that occurs in healthy
Figure 2. (A) Transmission electron micrographs of a normal neuron, (B) an apoptotic
neuron, (C and D) and necrotic neurons. Scale bar 2.5 µm. Abbreviations: N, nucleus;
PM, plasma membrane; Mi, mitochondria. Adapted from Won et al., 2002.

14
neurons 36-39. Meanwhile, dead or metabolically compromised neurons are incapable of
sustaining these motions. It is expected that live cells will have more ICM than dead
cells. OCT imaging can detect the motion of scattering particles in each voxel which can
be used to measure ICM and differentiate between live and dead cells. The impact of
different cell death pathways on ICM will be discussed in more detail in sections 2.3.2
and 2.3.3.
2.3 Optical Coherence Tomography Parameters
Multiple OCT-derived parameters can be obtained using different scanning
protocols and post-processing procedures. This allows for a multi-metric approach to
analyze cellular viability within a sample. Parameters can be assessed individually or
collectively to obtain the best measurement of cellular viability. In particular, intensity,
decorrelation, diffusion coefficient, and surface area-to-volume-ratio (SATVR) will be
discussed.
2.3.1 Intensity
Intensity is an OCT parameter that quantifies the amount of light, in mW/cm2,
that is backscattered to the detector/spectrometer. Regions with higher reflectivity are
capable of backscattering more light than their surroundings and appear brighter on OCT
images. However, the intensities of deeper sample regions become attenuated due to the
absorption and decreased penetration of light. The process for deriving the intensity of a
sample is outlined in Figure 3. Since intensity is sensitive to the field reflectivity of a
sample, physical changes to the density and structure of the intracellular scattering
particles will affect the intensity profile of the cell. It can be hypothesized that the

15
intensity of a cell undergoing apoptosis will increase due to the compaction of organelles
(i.e. more optically dense); meanwhile, the intensity will decrease in oncotic cells due to
the dispersal and swelling of organelles (i.e. less optically dense). Samples that are
optically denser are capable of reflecting more light and therefore have a higher intensity.
2.3.2 Decorrelation
Decorrelation measures the change in the complex-valued OCT signal (i.e.
speckle) per given voxel over a short period of time. The associated imaging protocol
repetitively scans along the y-axis through a B-scan. The time between B-scans,
Figure 3. A diagram explaining the steps and equations used to derive the intensity
for a continuous sample using SD OCT. E0 is the equation for the electric field of the
source light, R is the sample’s field reflectivity, c is the speed of light, ε is the
permittivity of free space, k is the wave number, z is the sample depth, ω is the
angular frequency, σ is the standard deviation of the center angular frequency, CC is
the complex conjugate, and ζ is the Fourier transformed wave number.

16
identified as Δt, can be optimized based on the speed of moving particles within a
sample. In general, a longer Δt allows for the capture of slow-moving particles while
shorter periods are more sensitive to fast-moving particles. Stationary particles will
exhibit no decorrelation; meanwhile, the light scattered from particles entering, leaving,
and moving within a voxel collectively contribute to the speckle (Fig. 4A). Nevertheless,
Figure 4. (A) An illustration of the cross-section of a voxel (blue square) containing
light scattering particles (colored circles) before and after Δt time has passed. Black
arrows signify the direction of particle movement, and white arrows indicate the
reflected light’s path. (B) The resulting OCT signal produced by the combined
interference of all scattering particles present within the voxel (i.e. speckle). (C) The
equation used to derive decorrelation where D is the decorrelation, R is the field
reflectivity, and t is time.
C
𝐷 ≡ |�̃�(𝑡0 + ∆𝑡) − �̃�(𝑡0)|2
A
B

17
particle size, particle depth, and the wavelength of incident light determine which
particles contribute to the speckle. The difference in speckle in the complex plane is then
used to derive the decorrelation (Fig. 4B and 4C). Decorrelation can be used to measure
cellular viability since the movement of scattering particles can be attributed to ICM.
Necrotic cells are expected to have decorrelations measurements similar to that of the
extracellular space. This is expected because the damaged cell membrane can no longer
isolate the cytoplasm from the cell’s surroundings. Early apoptotic cells may exhibit
higher decorrelation since the process of nucleic and cytoplasmic fragmentation involves
the dynamic restructuring of organelles.
2.3.3 Diffusion Coefficient
The diffusion coefficient is similar to decorrelation in that it is capable of
measuring ICM. Unlike decorrelation, the diffusion coefficient is a standardized, metric
unit-based parameter that is measured in µm2/s. Standardized metrics can be compared
across imaging systems; however, arbitrary metrics (e.g. relative intensity and
decorrelation) cannot be cross-analyzed reliably. Acquiring the diffusion coefficient
requires an alternate scanning protocol termed dynamic light scattering (DLS). DLS OCT
repetitively acquires axial line scans, also known as A-scans, with a speed of 47,000 A-
scans/s 40. The brief fluctuations in scattered light captured by the DLS OCT system are
used to analyze the motion of particles within a voxel (Fig. 5) 40. The OCT signal from a
voxel with mixed particle dynamics is then fitted using the autocorrelation function to
derive the diffusion coefficient using the following equation:

18
Equation 1.
𝑔(𝒓, 𝜏) =⟨𝑅∗(𝒓, 𝑡)𝑅(𝒓, 𝑡 + 𝜏)⟩𝑡
⟨𝑅∗(𝒓, 𝑡)𝑅(𝒓, 𝑡)⟩𝑡=
𝑀𝑠(𝒓) + 𝑀𝐹(𝒓)𝑒−ℎ𝑡2𝑣𝑡
2(𝒓)𝜏2−ℎ2𝑣𝑧2(𝒓)𝜏2
𝑒−𝑞2𝐷(𝒓)𝜏𝑒𝑖𝑞𝑣𝑧(𝒓)𝜏 + [1 − 𝑀𝑠(𝒓) − 𝑀𝐹(𝒓)]𝛿(𝜏)
The Ms term relates to the ratio of static particles, MF to the moving particles, vt is the
transverse velocity, vz is the axial velocity, and D is the diffusion coefficient 40. The
exponential components of the equation are related to the velocity-dependent term,
diffusion-oriented decay, and axial velocity-dependent term in the order they appear in
Equation 1 40. Unlike other ICM based metrics, the diffusion coefficient is less sensitive
to noise and errors caused by the presence of mixed particle dynamics within the same
voxel. Instead, the DLS OCT mathematical model accounts for the different particle
dynamics (Eq. 1). As a result, the diffusion coefficient can directly measure ICM since
intracellular dynamics can be modeled by Brownian motion 41. Necrotic cells that are no
longer encapsulated by a membrane will exhibit diffusive motions that are
Figure 5. (A) An illustration of the particles contributing to the DLS OCT signal in a
given voxel. (B) A model of the autocorrelation function on a complex plane. The
magnitude of MS and MF are proportional to the static and flowing particles,
respectively. Particles with larger cross-sections contribute more to the DLS OCT
signal. Adapted from Lee et al., 2012.

19
indistinguishable from the extracellular space. Early apoptotic cells with intact
membranes will sustain intracellular dynamics that differ from their backgrounds.
2.3.4 Surface Area-to-Volume-Ratio
Geometry and bulk characteristics of 3D tissues can be used to indirectly predict
viability. As previously mentioned, cells undergoing apoptosis or oncotic necrosis will
experience morphological changes that impact their structural dimensions. These changes
are difficult to measure from a single cell; however, the collective changes from multiple
cells within a spheroid can be detected using a sufficiently large FOV. Analyzing
geometric measurements (e.g. surface area, diameter, volume, etc.) individually is not
adequate since these parameters can vary greatly among spheroids of the same DIV and
seeding density. Instead, the SATVR can be used to minimize the variance associated
with batch heterogeneity. Despite this, the SATVR parameter is driven by a r-1
dependency (Eq. 2), and spheroids with a larger radius will inherently have a smaller
SATVR regardless of viability.
Equation 2.
𝑆𝐴𝑇𝑉𝑅 =4𝜋𝑟2
43 𝜋𝑟3
∝1
𝑟
𝐴𝑑𝑗𝑢𝑠𝑡𝑒𝑑 𝑆𝐴𝑇𝑉𝑅 = 4𝜋𝑟2
(43 𝜋𝑟3)
23
∝ 𝑐𝑜𝑛𝑠𝑡𝑎𝑛𝑡
This can be accounted for by raising the denominator (i.e. volume) to the 2/3 power. This
eliminates the parameter’s dependency on the spheroid’s radius, thus enabling the
analysis of spheroids across different sizes.

20
2.3.5 OCT Viability Imaging in Literature
Initial applications of OCT involved diagnostic imaging of the eye 42,43. OCT’s
penetration depth, high resolution, noninvasive nature, and functionality (i.e. different
imaging modes) makes it an ideal imaging system for the detection of structural damage
to the retina and its associated vasculature 44. Although biomedical applications of OCT
are predominantly ophthalmic, recent applications have extended to neuroimaging,
endoscopic imaging, and various forms of structural imaging 45-47. OCT applications
involving cellular viability imaging of 3D tissues have also emerged with promising
results.
One of the earliest applications of OCT cellular viability imaging involved
measuring temporal changes in speckle from rat osteogenic sarcoma tumor spheroids 48.
Jeong et al. calculated the speckle’s standard deviation at each voxel from multiple
successive images and normalized it to the mean intensity 48. This approach requires that
viable cells produce time-varying speckle maps while dead cells remain static. They
demonstrated a decrease in speckle fluctuations associated with treating their tumor
spheroids with cytoskeletal anti-cancer drugs (e.g. nocodazole, colchicine, and
paclitaxel). These anti-cancer drugs disrupt microtubule polymerization to ultimately
prevent cell replication and cause cell death 48. They also took advantage of OCT’s
imaging capabilities to generate motility maps at depths of 600 µm from the spheroid’s
surface 48. In a similar study, Martucci et al. treated 3D liver spheroids with various
concentrations of acetaminophen to mimic drug-induced liver injury and measured the
change in speckle-variance distribution. They observed a decrease in speckle variance
associated with an increase in treatment concertation that was consistent with the results

21
from a CellTiter-Glo cellular activity assay 49. In another study, Dunkers et al. utilized
image cross-correlation to determine the number of features a final image had in common
with an earlier image taken at the same location. Their findings demonstrated that the
number of common features in dead cells approached 100% after treatment with
ultraviolet light which can be associated with the termination of ICM 50. Other studies
that measured the phase change in OCT signal observed a similar reduction in
intracellular fluctuations associated with cell death 51,52.
Nevertheless, correlating ICM with fluctuations in speckle has its challenges.
Speckle fluctuations provide an indirect and qualitative measure of ICM since it
fundamentally relies on healthy cells being “noisier” than dead cells. Furthermore,
measurements of speckle are considerably affected by system noise, vibrations, sample
depth, and the passive drifting of cells within the FOV. The effects of different cell death
pathways were also not addressed in the studies mentioned. An alternate approach,
utilized by Farhat et al., measured the decorrelation time extracted from the intensity
autocorrelation function which provided a better measurement of ICM. They induced
apoptosis in acute myeloid leukemia cells using cisplatin and observed an increase in
ICM (i.e. a decrease in decorrelation time) 53. These findings are consistent with the
hypothesis that ICM in apoptotic cells is higher than viable cells due to ongoing cell
fragmentation 53.
OCT-based parameters involving backscattered intensity and scattering
attenuation have also been used to measure cellular viability. In a different study
conducted by Farhat et al., the backscattered intensity of control, apoptotic, and necrotic
cells was measured. Cells undergoing apoptosis and mitotic arrest experienced an

22
increase in integrated intensity while a decrease was observed in necrotic cells 54.
Nevertheless, no consistent changes in intensity were observed in liver spheroids by
Martucci et al. after treatment with acetaminophen which may suggest cell-dependent
differences in the parameter’s ability to measure viability 49. Scattering attenuation,
which is closely related to backscattered intensity, measures the decay of scattered light
as a function of sample depth 55. In a study conducted by van der Meer et al., the
attenuation coefficient increased in apoptotic cells and decreased in necrotic cells 55.
Huang et al. utilized a similar approach to differentiate cells in the necrotic core from the
remaining viable cells in glioblastoma spheroids 17. Interestingly, both studies correlated
regions of higher scattering attenuation with apoptotic cell death as confirmed by either
an Annexin V or TUNEL assay 17,55. These results support the hypothesis that apoptotic
cells become more optically dense due to cell fragmentation and condensation;
meanwhile, oncotic cells become less dense due to the dispersal of internal scattering
organelles and particles.
Correlating cellular viability with intensity-based parameters has its challenges as
well. Since backscattered intensity is largely dependent on the incident light, factors
including the inherent fluctuations in source light, angle of objective lens, depth of the
sample, presence of debris above the sample, and changes in the refractive index
surrounding the spheroid could have an impact on intensity measurements.

23
Chapter 3: Optical Coherence Microscopy Revealed Time-
Dependent Changes in Cellular Dynamics in Response to
Ethanol Treatment
3.1 Abstract
Three-dimensional neurospheroids provide a robust in vitro platform that
improves upon traditional 2D cultures. Nevertheless, conventional cell viability assays
are not fully optimized for the use in 3D cultures. OCT is a label-free, 3D, and high-
resolution imaging modality that has a potential for nondestructive cell viability
assessment. In this study, a SD OCM system was utilized to assess the viability of
neurospheroids derived from postnatal cortical rat tissue. Neurospheroids at various DIV
were treated with 4 M etOH to induce oncotic necrosis and repeatedly imaged for one
hour. SD OCM imaging was capable of visualizing cell bodies, based on contrast
produced by intracellular motility, with greater penetration depth than confocal
microscopy. Prolonged exposure to etOH resulted in the steady decrease in the OCM
intensity signal while no significant changes occurred in decorrelation. The decrease in
intensity was attributed to the disruption and degradation of the neuronal cell membrane
resulting in oncotic necrosis as visualized by immunohistochemistry and calcium
imaging. These results support the feasibility of nondestructive, multi-parametric OCT-
based cell viability imaging in 3D tissue which is capable of tracking underlying cell
death processes. This approach can be implemented to a variety of in vitro disease and
drug studies.
24
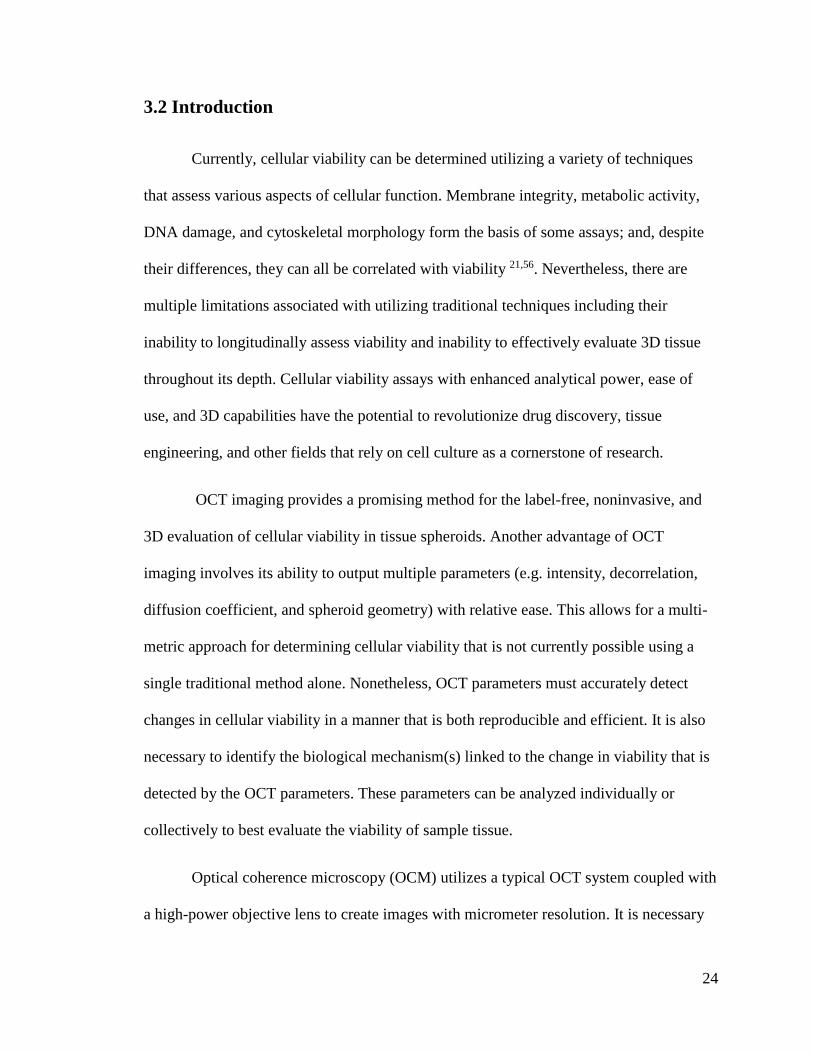
3.2 Introduction
Currently, cellular viability can be determined utilizing a variety of techniques
that assess various aspects of cellular function. Membrane integrity, metabolic activity,
DNA damage, and cytoskeletal morphology form the basis of some assays; and, despite
their differences, they can all be correlated with viability 21,56. Nevertheless, there are
multiple limitations associated with utilizing traditional techniques including their
inability to longitudinally assess viability and inability to effectively evaluate 3D tissue
throughout its depth. Cellular viability assays with enhanced analytical power, ease of
use, and 3D capabilities have the potential to revolutionize drug discovery, tissue
engineering, and other fields that rely on cell culture as a cornerstone of research.
OCT imaging provides a promising method for the label-free, noninvasive, and
3D evaluation of cellular viability in tissue spheroids. Another advantage of OCT
imaging involves its ability to output multiple parameters (e.g. intensity, decorrelation,
diffusion coefficient, and spheroid geometry) with relative ease. This allows for a multi-
metric approach for determining cellular viability that is not currently possible using a
single traditional method alone. Nonetheless, OCT parameters must accurately detect
changes in cellular viability in a manner that is both reproducible and efficient. It is also
necessary to identify the biological mechanism(s) linked to the change in viability that is
detected by the OCT parameters. These parameters can be analyzed individually or
collectively to best evaluate the viability of sample tissue.
Optical coherence microscopy (OCM) utilizes a typical OCT system coupled with
a high-power objective lens to create images with micrometer resolution. It is necessary

25
to validate the changes in OCM parameters with a change in viability at the cellular level.
Once an OCM parameter is validated, more studies can be conducted to better understand
how the parameter responds to multiple death pathways and cell types. In this study, a
commercially available SD OCT system was coupled with a 40x objective lens to image
neurospheroids extracted from primary postnatal cortical rat tissue. Neurospheroids were
exposed to high concentrations of ethanol (etOH) to elicit oncotic necrosis. The cytotoxic
impact of etOH treatment is well documented by many in vitro studies involving a variety
of cell types. Depending on the concentration, cell type, and exposure period, etOH can
elicit cell death through multiple mechanisms including DNA synthesis inhibition 57,58,
DNA fragmentation 59,60, induction of oxidative stress 61,62, and reduction of metabolic
function 63,64. Ethanol is also capable of disordering the cell membrane and, at high
concentrations, cause the solubilization of the cell membrane leading to necrosis 60,65-67.
Pure 200-proof etOH was utilized to induce oncotic necrosis in the tissue sample.
Ethanol was directly added to the media to achieve a final concentration of 4 M. The
etOH was allowed to diffuse throughout the sample while roughly maintaining a
temperature of 37ºC. The spheroids were imaged longitudinally over the course of one
hour to track the changes in viability. IHC and calcium images were utilized to determine
the underlying biological mechanism(s) responsible for the changes in OCM parameters.
3.3 Methods
3.3.1 Neurospheroid Cell Isolation
The neurospheroids used in this study were derived from primary cortical tissue
extracted from female postnatal Charles River rats. Neonatal rats were wrapped in a layer

26
of gauze followed by plastic wrap and placed inside an ice bucket for 30-40 minutes to
induce hypothermia. Enough gauze was used to ensure a painless cooling (i.e. providing
indirect contact with the ice bed). The plastic wrap was left open at the ends to allow air
flow but prevent any ice or water from entering the bundle. After inducing hypothermia,
a pair of sharpened dissection scissors were used to decapitate the rat below the ears. The
scissors were then used to make a sagittal cut from the base of the head to the skull to
expose the brain. The brain was then placed into a petri dish with Neurobasal A/B27
media without calcium, and the cortex was isolated. Cortical tissue was then placed in a
conical tube and submerged with 2 mg/mL papain solution dissolved in Hibernate A
(BrainBits, LLC) without calcium for 30 minutes at 30°C. The papain solution was
removed, and the tissue was triturated with a fire-polished Pasteur pipette in Hibernate A
buffer supplemented with 1 x B27 supplement (Invitrogen) and 0.5 mM GlutaMAX
(Invitrogen). The cell solution was then centrifuged at 150g for 5 minutes, and the
supernatant was removed. The cell pellet was resuspended in Neurobasal A/B27 media
using the following components: Neurobasal A media (Invitrogen) supplemented with
1xB27, 0.5 mM GlutaMAX, and 1x Penicillin-Streptomycin (Invitrogen). The cell
suspension was filtered using a 40 µm cell strainer to remove debris and washed once by
repeating the centrifuging, resuspending, and filtering steps. Cortical cells were seeded at
a density of 8,000 cells/well in 2% agarose microarrays.
3.3.2 Forming Three-Dimensional, Self-Aggregating Neurospheroids
Microarrays were created from molten 2% agarose (Invitrogen) by pouring the
solution onto a mold with rounded 400-µm diameter pegs (#24-96-small, MicroTissues,
Inc.). Newly created gels were equilibrated in cell media using three media exchanges
27
over a 48-hour period. Media was aspirated from the gels before seeding, and a cell
solution of 75 µL/gel was added directly onto the gel. The gels have a small recess that
prevents the cell suspension from flowing out. The cell suspension was allowed to settle
in the microwells for 30 minutes followed by the addition of 1 mL of Neurobasal A/B27
media in a 24-well plate. Neurospheroids were incubated at 37ºC with 5% CO2, and the
media was changed every 3-4 days.
3.3.3 Calcium Imaging
Intracellular calcium levels were measured using OGB calcium indicator. 30 µL
of 4% F-127 (diluted using DMSO) was added to one vial of OGB1 powder. The solution
was sonicated in the dark for 15 minutes followed by the addition of 30 µL of media and
an additional 5 minutes of sonication. Roughly 8 µL of OGB1 solution was added to a
single well of a 24-well plate which contained about 1 mL of media and the
neurospheroids. The plate was incubated in the dark for 20-25 minutes at 37ºC and 5%
CO2. After incubation, the well was washed twice with media to remove excess dye. The
neurospheroids were then removed from the agarose gel by gently pipetting up and down
over the wells. The extracted neurospheroids were transferred to a 35 mm petri dish with
a 25 mm glass bottom for confocal imaging. Images were acquired using a high
sensitivity resonant scanner in an Olympus FV3000RS with a laser intensity of 0.6%, HV
from 400-500, gain of 1, and offset of 6. Cells were kept at 37ºC throughout the imaging
session. Images were converted to a .tif format and collapsed into a single plane for
viewing using Fiji ImageJ software.

28
3.3.4 Immunohistochemistry
Neurospheroids were washed three times using Neurobasal A/B27 media. The
media was removed, and the cells were fixed using 4% vol/vol paraformaldehyde for at
least 24 hours. The fixative was removed, and the samples were washed with 8% wt/vol
sucrose in phosphate-buffered saline (PBS) three times. Following fixation,
neurospheroids were extracted from the gels and placed into Eppendorf tubes. A blocking
solution comprised of 10% normal goat serum, 4% bovine serum albumin, and 1%
Triton-X 100 in PBS was added to the tubes for 2-3 hours. Primary antibody was diluted
using PBT solution of 0.2% Triton-X 100 in PBS and added to the tube. Primary
antibody solution was removed and neurospheroids were washed using PBT twice prior
to the addition of the secondary antibody solution. Spheroids were optically cleared using
ClearT2 protocol prior to imaging using the Olympus FV3000RS. Images were prepared
in Fiji ImageJ software.
3.3.5 ClearT2 Optical Clearing Protocol
ClearT2 optical clearing protocol was used to enhance IHC imaging of
neurospheroids. Solutions which consisted of 20% and 40% wt/vol polyethylene glycol
(PEG) were made in water, and 50% vol/vol formamide (Sigma Aldrich) solution was
made in PBS. Neurospheroids were first placed in 25% formamide/10 % PEG for 10
minutes, then 50% formamide/20% PEG for 5 minutes, and finally 50% formamide/20%
PEG for 60 minutes. The neurospheroids were kept in the final solution and transferred to
a glass-bottom confocal dish for IHC imaging.

29
3.3.6 OCM Imaging System and Scanning Protocol
A commercially available Telesto III SD OCT system (Thorlabs, Newton, NJ,
USA) was used with a center wavelength of 1310 nm and bandwidth of 170 nm. The SD
OCT system was coupled with a 40x objective lens (1-U2M587, Olympus America, Inc.)
for microscopic imaging and a 2048-pixel line-scan camera capable of 47,000 A-scans/s.
A FOV capturing 832 x 832 x 256 pixels was obtained with a lateral and axial resolution
of 0.5 μm and 3.5 μm, respectively, resulting in an imaging volume of 416 μm x 416 μm x
896 μm. A time delay of 10 ms between B-scans was used to create 3D decorrelation maps
of the neurospheroids. Custom LabVIEW software was used to acquire OCM data. Gels
containing neurospheroids were transferred from a 24 well-plate to a 35 mm petri dish to
allow the objective lens easier access to the spheroids. Prior to the transfer, molten agarose
was spread across the bottom of the petri dish. The gel was then placed over the agarose
(without any media) and allowed to solidify in place for 1-2 minutes. Once set in place, 3
mL of media was added to the petri dish. Neurospheroids were kept on a heating pad
(PhysioSuite, Kent Scientific, Torrington, CT, USA) to maintain a temperature of 37°C
throughout the imaging session. Images were acquired at 10, 30, 45, and 60 minutes after
the addition of etOH.
3.3.7 OCM Data Processing
OCM image reconstruction was accomplished using Matlab (MathWorks, Natick,
MA, USA). Image enhancements such as median filtering, motion correction, dispersion
compensation, interpolation, and volume averaging were utilized to improve overall image
quality and resolution. Ultimately, 3D intensity and decorrelation maps were produced for
the neurospheroid throughout the FOV. Analysis of the neurospheroids was conducted on

30
2D en face slices extracted from the 3D maps at the focal plane near the center of the
neurospheroid (Fig. 6). Further processing of the en face images involved categorizing the
neurospheroid into core and shell regions (Fig. 7). The radius of each spheroid in the en
face image was determined and the core was characterized as the inner half of the radius
while the outer half was designated as the shell (Fig. 7).
Figure 6. The process of acquiring and analyzing OCM data is described. (Top left)
The imaging plane, identified by the shaded blue region, was acquired along the
central plane of the neurospheroid. (Top right) A 2D OCM decorrelation map was
then reconstructed at the focal plane. (Bottom right) Multiple longitudinal images
were acquired at a fixed FOV for one hour. (Bottom left) OCM-derived viability data
can then be plotted longitudinally for each spheroid.

31
Figure 7. A visual representation of how the shell (region between the dotted red and
blue line) and core (region within the dotted blue line) are designated when analyzing
OCM data. Scale bar 100 µm.
3.3.8 Cellular Viability Manipulation
In order to cause a decrease in cellular viability, 200-proof etOH was used to
induce oncotic necrosis in the neurospheroids. Ethanol was directly pipetted into the petri
dish until a final concentration of 4 M was achieved. The etOH was not directly added
over the gel, to prevent the dislodging of neurospheroids, and allowed to passively
diffuse throughout the media for 10 minutes prior to acquiring the first image.
Consecutive images were acquired at 30, 45, and 60 minutes.
3.3.9 Statistical Analysis
Raw and normalized mean intensity and decorrelation values were reported for
the core, shell, and total regions of the neurospheroid alongside the standard deviation.
SigmaPlot 12.5 software (Systat Software Inc., San Jose, CA, USA) was used to create
figures and conduct one-way repeated measures ANOVA alongside Tukey post hoc tests
to determine statistical significance. Data sets that failed normality and equal variance
assumptions were analyzed using the Friedman test (i.e. non-parametric equivalent of the

32
one-way repeated measures ANOVA) with Dunn’s post hoc test. Statistical analysis was
only conducted on the raw means.
3.4 Results
3.4.1 OCM Imaging Revealed Cells Through Contrast in Intracellular Motility
One of the primary advantages of utilizing OCM involves its ability to image cells
without the need for labeling molecules. This becomes a crucial feature when imaging
large spheroids and other 3D tissue since cells in deep regions are not exposed to the
same concentration of labeling molecules as those closer to the surface 68. The depth-
dependent tagging of cells causes disproportionate intensity profiles which can skew
results. To demonstrate this advantage, neurospheroids were imaged using OCM and
confocal microscopy at depths of 30 µm, 90 µm, and 150 µm from the spheroid’s surface
(Fig. 8). IHC and calcium images were acquired from separate spheroids while OCM
intensity and decorrelation maps were from the same spheroid at identical locations. Cell
nuclei, neuronal cytoskeletal networks, and cell bodies were identified using DAPI, β-III-
tubulin, and OGB calcium indictor, respectively. OCM decorrelation maps revealed cell-
like features that are consistent with those found in IHC and calcium images (Fig. 8 and
9). Cellular features in OCM decorrelation maps had larger decorrelation values than
their surroundings which indicated regions with higher motility. Interestingly, many
bodies featured darker center regions with lower motility which may indicate cell nuclei.
Confocal image intensity began to noticeably attenuate at depths of 90 µm while OCM
images resolved the neurospheroid all throughout the depths. The cell-like bodies present
in the OCM decorrelation maps were compared to cell bodies found in the calcium
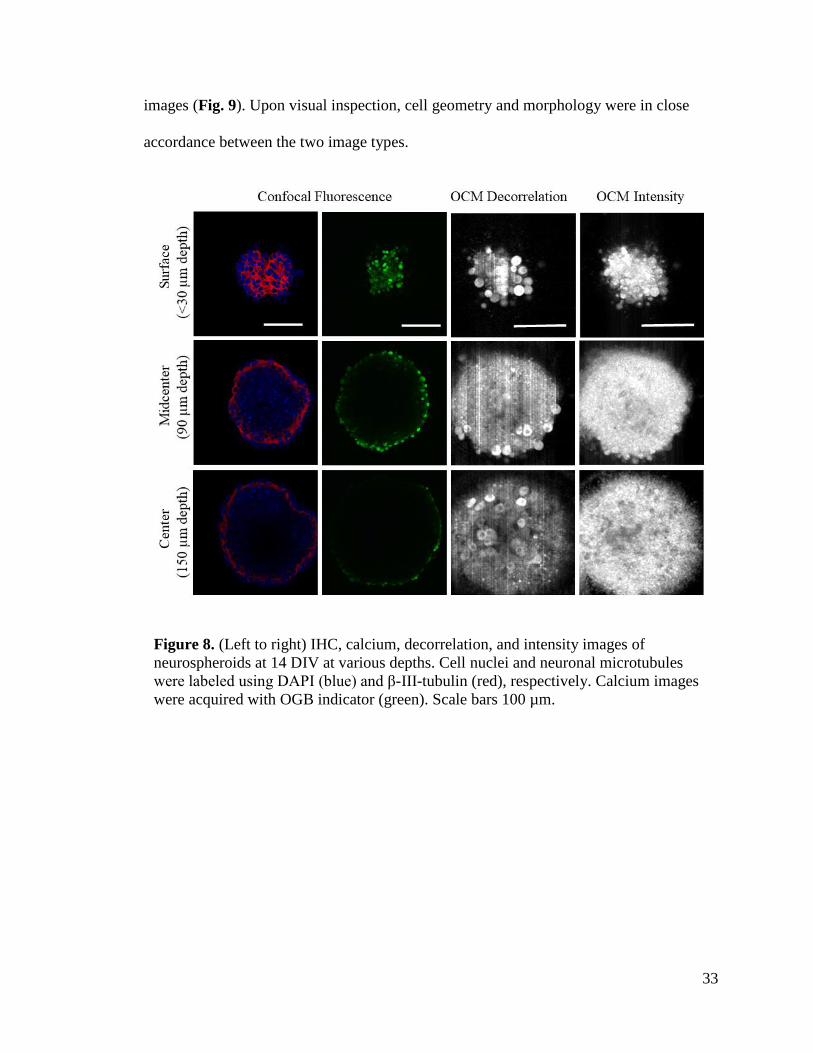
33
images (Fig. 9). Upon visual inspection, cell geometry and morphology were in close
accordance between the two image types.
Figure 8. (Left to right) IHC, calcium, decorrelation, and intensity images of
neurospheroids at 14 DIV at various depths. Cell nuclei and neuronal microtubules
were labeled using DAPI (blue) and β-III-tubulin (red), respectively. Calcium images
were acquired with OGB indicator (green). Scale bars 100 µm.

34
3.4.2 OCM Intensity Signal Displayed Unique Time-Dependent Responses to
Ethanol Treatment
2D en face OCM intensity and decorrelation maps were obtained for
neurospheroids treated with 4 M etOH (n=4; DIV: 5, 7, 19, and 28). The intensity and
decorrelation time courses were obtained by averaging their values over the core, shell,
and total regions of the neurospheroid (Fig. 10). Statistical tests revealed that the mean
intensities at 30, 45, and 60 minutes were significantly different from the intensity at 10
minutes for the core region alone. In addition, the mean intensity measurements of the
core were significantly different from the shell across all time intervals. No significant
changes were observed in the decorrelation parameter (Fig. 10). Both intensity and
decorrelation were unchanged under control conditions (results not shown).
Figure 9. OGB calcium (left) and OCM decorrelation (right) en face images of
neurospheroids at 9 and 14 DIV, respectively. Magnified views are designated by the
red squares.

35
Figure 10. Raw and normalized mean intensity and decorrelation parameters were
longitudinally measured in 4 M etOH treated neurospheroids (n=4; DIV: 5, 7, 19, and
28). Error bars represent the standard deviations. Either the one-way repeated
measures ANOVA with Tukey test or the Friedman test with Dunn’s post hoc tests
were conducted depending on the normality and variance of the data. Statistical results
compared the 10-minute value with all other time points and are reported in the order
of core, shell, and total regions from left to right. P < 0.05 *, < 0.01 **, and < 0.001 †.

36
3.4.3 Ethanol Disrupted Membrane Integrity Through Oncotic Necrosis
Neurospheroids were imaged using OGB calcium indicator to reveal changes in
cellular membrane integrity in response to etOH treatment. Neuronal cell bodies can be
easily identified in calcium images due to their distinct intracellular calcium signatures.
Within one minute, membrane disruption was observed through the dissolution of some
cell bodies near the spheroid periphery and increased fluorescence intensity associated
with the influx of calcium down its concentration gradient (Fig. 11B). Within 10 minutes,
cell membranes were disrupted throughout the spheroid (Fig. 11C-F). Cell nuclei and
astrocytes remained intact despite 60 minutes of exposure to 4 M etOH as seen in IHC
images (Fig. 12).
Figure 11. Z-projections were acquired from neurospheroids at 9 DIV using OGB
calcium indicator after 4 M etOH treatment. Projections were created from the
average of the top 100 slices. Images A-F were taken at pretreatment, 1, 10, 30, 45,
and 60 minutes after treatment, respectively. Image G is of a 60-minute control
spheroid. Images A-F are from the same spheroid. Scale bars 100 µm.
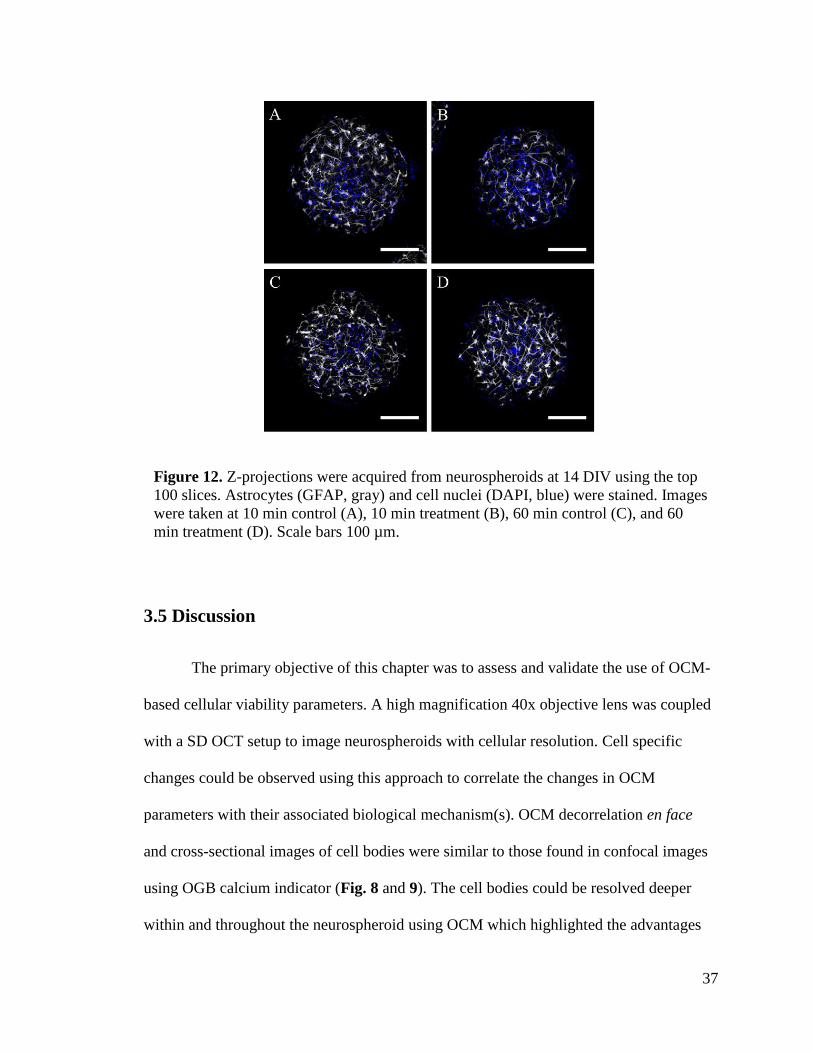
37
3.5 Discussion
The primary objective of this chapter was to assess and validate the use of OCM-
based cellular viability parameters. A high magnification 40x objective lens was coupled
with a SD OCT setup to image neurospheroids with cellular resolution. Cell specific
changes could be observed using this approach to correlate the changes in OCM
parameters with their associated biological mechanism(s). OCM decorrelation en face
and cross-sectional images of cell bodies were similar to those found in confocal images
using OGB calcium indicator (Fig. 8 and 9). The cell bodies could be resolved deeper
within and throughout the neurospheroid using OCM which highlighted the advantages
Figure 12. Z-projections were acquired from neurospheroids at 14 DIV using the top
100 slices. Astrocytes (GFAP, gray) and cell nuclei (DAPI, blue) were stained. Images
were taken at 10 min control (A), 10 min treatment (B), 60 min control (C), and 60
min treatment (D). Scale bars 100 µm.

38
of using a label-free imaging system (Fig. 8). Interestingly, many cell bodies could be
identified with regions of lower decorrelation near their center. It is likely that the regions
with higher decorrelation represent the cytoplasm while the central region with lower
decorrelation is the cell nucleus. These findings were consistent with a previous study
conducted using DLS OCT on rat cerebral cortex 69. When particles in a given voxel
move over a short time period, they produce a fluctuating scattering profile that is
measurable by an increase in decorrelation. The contrast in decorrelation between the
cytoplasm and nucleus could be explained by the presence of faster moving particles in
the cytoplasm. It is also possible that the scattering particles within the nucleus are too
small to be resolved by the current SD OCM imaging system.
The ability to acquire longitudinal intensity and decorrelation data from the same
samples highlighted another strength of the OCM imaging system. This method provided
a more detailed approach to analyzing viability within 3D tissues. Statistical analysis
revealed that the core, but not shell or total intensity, was significantly affected by etOH
treatment starting at 30 minutes. Furthermore, one-way repeated measures ANOVA and
Friedman tests revealed that the core and shell intensities were significantly different
throughout the experiment. These findings indicated that regional and time-dependent
differences to etOH treatment could be distinguished (Fig. 10). It was expected that
significant changes in shell intensity would occur with treatment. This assumption is
supported by Figure 11 were clear disruption in cell membrane integrity could be
observed in the periphery. It is possible that changes to the shell intensity occurred
quickly and leveled out within 10 minutes. Acquiring and tracking OCM data at earlier
time points with greater temporal resolution should reveal the presence of fast dynamics.

39
In addition, increasing the sample size will greatly benefit the performance of the
statistical tests.
Differences between intensity and decorrelation trends suggest that the parameters
measured different processes within cells. Nevertheless, no statistically significant
changes in decorrelation were observed. In a previous study, a decrease in OCT speckle
variation, an analog of decorrelation, was observed in liver spheroids after treatment with
acetaminophen 49. Similarly, a decrease in decorrelation time was observed when acute
myeloid leukemia cells were treated with cisplatin 53. The contradiction between results
from the present and previous studies may be explained by the time-dependent effects of
different treatments on ICM. Ethanol treatment may have induced rapid changes to ICM-
related decorrelation across spheroid regions that were not captured by the earliest time
interval utilized in this study. This assumption is supported by Figure 11 since the most
significant changes to cell membrane integrity occurred within the first 10 minutes of 4
M etOH exposure. Future decorrelation images should be acquired within 0-10 minutes
to track these major changes. Furthermore, lower concentrations of etOH could be used
to elicit slower changes in viability.
A microscopic approach was utilized in this study to determine the underlying
biological mechanisms associated with the changes in OCM parameters. In particular, the
steady decrease in core intensity should correlate with changes to biological factors
associated with cellular viability. The major disruption of membrane integrity suggested
that oncotic necrosis occurred within the sample (Fig. 11). The presence of intact nuclei
after 60 minutes of etOH exposure confirmed that apoptotic condensation of nuclei had
not occurred; therefore, oncotic necrosis was the primary pathway of cell death (Fig. 12).
40
It can also be seen in Figure 12 that astrocytes were not primarily affected by the etOH
treatment; therefore, neuronal membrane integrity was the most likely source for the
decrease in intensity. The disruption of neuronal membrane integrity can impact intensity
in two ways. First, neurons undergoing oncosis swell which causes their volumes to
increase and organelles to become more disperse. This can result in a decrease in
intensity since the probability of light backscattering due to organelles decreases. Another
explanation involves the inability of the membrane to keep organelles constrained within
the neuron. Neurons undergoing oncotic necrosis spew their contents into the
extracellular space which also causes a decrease in optical density resulting in a decrease
in intensity.
In this study, cellular viability was monitored using OCM imaging in response to
etOH treatment. Additional viability manipulators should be tested to assess how OCM
parameters respond to various cell death processes. For instance, methods that induce
apoptosis should be tested and compared to those that induce oncosis. Theoretically, the
differences in morphology and optical scattering properties between cells undergoing
different cell death pathways could be differentiated by OCM imaging. In the present
study, neurospheroids of various DIV were imaged and analyzed; however, age, size, and
gender could impact their response to the etOH treatment. Future studies could address
this by increasing sample size and comparing OCM parameters across the various groups.
Given the label-free and noninvasive nature of OCM imaging, sample viability could be
monitored well over the one-hour period measured in this study. Ultimately, longitudinal
dose response curves could be created to assess cytotoxic properties of drugs or monitor
treatment of injury and/or disease models utilizing 3D neurospheroids.

41
3.6 Conclusion
In conclusion, the validity of utilizing OCM-based viability imaging was
examined in this study. Neurospheroids were treated with 4 M etOH to induce oncotic
necrosis and imaged longitudinally using OCM. Cell bodies can be identified in the OCM
decorrelation images without the use of labels and at depths that exceed conventional
confocal microscopy. Differences between the intensity and decorrelation trends may
indicate their ability to measure different biological mechanisms associated with cell
death (i.e. disruption of cellular morphology and ATP-dependent ICM). Further studies
are warranted to examine OCM’s ability to track the effects of other cell death pathways.
In addition, it would be advantageous to examine the effects of spheroid age, gender, and
various etOH concentrations to fully validate the OCM viability imaging system.

42
Chapter 4: High-throughput, Multi-Metric, and 3D
Assessment of Neurospheroids
4.1 Abstract
High-throughput drug screenings provide a powerful tool to investigate the
efficacy of various drug treatments. 3D in vitro models help improve the overall clinical
relevance of these tests; however, current high-throughput imaging systems are not
optimized for the 3D construct. OCT is a label-free, nondestructive, and 3D imaging
modality that can address the limitations faced with traditional methods. A low
magnification objective lens was utilized to obtain images with large FOVs to capture
multiple spheroids. Intensity, decorrelation, and diffusion coefficient parameters were
measured longitudinally to track cell viability in neurospheroids. Neurospheroids were
exposed to final concentrations of 4 M etOH, 2 M etOH, and PBS sham groups to
determine the interaction between treatment dose and exposure time on viability. A
significant decrease in intensity was observed in the 4 M etOH group starting at 45
minutes. The diffusion coefficient had a slight yet significant increase in the 4 M group at
60 minutes and in the 2 M group at 45 and 60 minutes. Overall, the use of macroscopic
OCT-based cellular viability imaging is promising for high-throughput applications.
4.2 Introduction
High-throughput drug screening studies form a vital component of the drug
discovery pipeline. Early preclinical studies help determine the safety and efficacy of
novel drugs to predict their performance at treating various diseases. Despite the
implementation of early preclinical tests, only 13.8% of drugs are approved 1. One step
43
that can be taken to improve overall drug success rate is to enhance the performance of
preclinical in vitro models at predicting clinical outcomes. Recent studies have shown
that 3D in vitro cultures more accurately model the in vivo response to treatment 70-73. As
a result, adopting 3D in vitro models in high-throughput studies will increase their overall
clinical relevance. Nonetheless, there are challenges associated with transitioning to 3D
models. Currently, high-throughput confocal imaging systems are used to measure
viability across multiple samples and treatment groups. As previously shown, confocal
fluorescence imaging is not optimized for the evaluation of 3D tissues. OCT is a label-
free, nondestructive, and 3D imaging system with cellular viability applications capable
of replacing the confocal setup 17,18,48-55.
Thus far in this study, a microscopic approach was utilized to correlate OCT-
based parameters with changes in viability. High resolution imaging allows for the cell-
specific tracking of viability which enables the visual identification of the cell death
pathway occurring within a sample. Nevertheless, only a single spheroid can be imaged
along a very narrow focal plane using higher magnifications. This can make it difficult to
obtain an adequate sample size to establish statistical significance. Microscopic imaging
is also sensitive to noise and external vibrations that can affect image quality and
analysis. On the other hand, macroscopic imaging lacks cell specificity while
substantially increasing the number of spheroids within the FOV. The entirety of multiple
spheroids can be imaged and analyzed simultaneously using lower magnifications. SD
OCT’s rapid image acquisition rates and imaging depth make it a promising candidate for
high-throughput viability imaging. If coupled with a motorized stage, an OCT imaging
system could be utilized in a similar manner to a high-throughput confocal setup 74.

44
The ability of the SD OCT system to detect changes in viability using a low
magnification objective lens was examined. Previous studies have shown that
macroscopic parameters like the scattering attenuation and SATVR correlate well with
tumor spheroid viability and traditional viability assays 17,18. In this study, intensity,
decorrelation, and diffusion coefficient were monitored longitudinally in neurospheroids.
Two concentrations of etOH were used to determine the dose-dependent response to
treatment. One-way repeated measures ANOVA and the Friedman test were used to
determine if treatment concentration and duration significantly affected OCT-derived
viability parameters (e.g. intensity, decorrelation, and diffusion coefficient).
4.3 Methods
4.3.1 Neurospheroid Cell Isolation
The neurospheroids used in this study were derived from primary cortical tissue
extracted from female postnatal Charles River rats. Neonatal rats were wrapped in a layer
of gauze followed by plastic wrap and placed inside an ice bucket for 30-40 minutes to
induce hypothermia. Enough gauze was used to ensure a painless cooling (i.e. providing
indirect contact with the ice bed). The plastic wrap was left open at the ends to allow air
flow but prevent any ice or water from entering the bundle. After inducing hypothermia,
a pair of sharpened dissection scissors were used to decapitate the rat below the ears. The
scissors were then used to make a sagittal cut from the base of the head to the skull to
expose the brain. The brain was then placed into a petri dish with Neurobasal A/B27
media without calcium, and the cortex was isolated. Cortical tissue was then placed in a
conical tube and submerged with 2 mg/mL papain solution dissolved in Hibernate A
45
(BrainBits, LLC) without calcium for 30 minutes at 30°C. The papain solution was
removed, and the tissue was triturated with a fire-polished Pasteur pipette in Hibernate A
buffer supplemented with 1 x B27 supplement (Invitrogen) and 0.5 mM GlutaMAX
(Invitrogen). The cell solution was then centrifuged at 150g for 5 minutes, and the
supernatant was removed. The cell pellet was resuspended in Neurobasal A/B27 media
using the following components: Neurobasal A media (Invitrogen) supplemented with
1xB27, 0.5 mM GlutaMAX, and 1x Penicillin-Streptomycin (Invitrogen). The cell
suspension was filtered using a 40 µm cell strainer to remove debris and washed once by
repeating the centrifuging, resuspending, and filtering steps. Cortical cells were seeded at
a density of 8,000 cells/well in 2% agarose microarrays.
4.3.2 Forming Three-Dimensional, Self-Aggregating Neurospheroids
Microarrays were created from molten 2% agarose (Invitrogen) by pouring the
solution onto a mold with rounded 400-µm diameter pegs (#24-96-small, MicroTissues,
Inc.). Newly created gels were equilibrated in cell media using three media exchanges
over a 48-hour period. Media was aspirated from the gels before seeding, and a cell
solution of 75 µL/gel was added directly onto the gel. The gels have a small recess that
prevents the cell suspension from flowing out. The cell suspension was allowed to settle
in the microwells for 30 minutes followed by the addition of 1 mL of Neurobasal A/B27
media in a 24-well plate. Neurospheroids were incubated at 37ºC with 5% CO2, and the
media was changed every 3-4 days.
46
4.3.3 SD OCT Imaging System and Scanning Protocol
A commercially available Telesto III SD OCT system (Thorlabs, Newton, NJ,
USA) was used with a center wavelength of 1310 nm, bandwidth of 170 nm, and an axial
resolution of 3.5 µm. The SD OCT system was coupled with a low magnification LSM03
objective lens (Thorlabs, Newton, NJ, USA) for macroscopic imaging and a 2048-pixel
line-scan camera capable of 47,000 A-scans/s. A FOV capturing 512 x 512 x 1024 pixels
was obtained, resulting in an imaging volume of 5 mm x 5 mm x 3 mm (in the x,y,z
directions) which contained the 3D intensity and decorrelation maps. A time delay of 10
ms between B-scans was used to derive the decorrelation.
The diffusion coefficient was acquired using DLS OCT imaging protocol. A FOV
capturing 128 x 256 x 1024 pixels was obtained, resulting in an imaging volume roughly
1 mm x 2.5 mm x 3 mm (in the x, y, and z directions). A total of 256 volume scans were
taken along the x direction with a time delay of 3.9 ms between each line scan.
Custom LabVIEW software was used to acquire OCT data. Gels containing
neurospheroids were transferred from a 24 well-plate to a 35 mm petri dish to allow the
objective lens easier access to the spheroids. Prior to the transfer, molten agarose was
spread across the bottom of the petri dish. The gel was then placed over the agarose
(without any media) and allowed to solidify in place for 1-2 minutes. Once set in place, 3
mL of media was added to the petri dish. Neurospheroids were kept on a heating pad
(PhysioSuite, Kent Scientific, Torrington, CT, USA) to maintain a temperature of 37°C
throughout the imaging session. Images were acquired at 15, 30, 45, and 60 minutes after
the addition of etOH.

47
4.3.4 Cellular Viability Manipulation
In order to cause a decrease in cellular viability, 200-proof etOH was used to
induce oncotic necrosis in the neurospheroids. The interaction between treatment dose
and duration was examined by comparing spheroids exposed to 4 M etOH, 2 M etOH
(50% vol/vol in PBS), and PBS sham treatment. The appropriate volume of etOH or PBS
was directly pipetted into the petri dish. Care was taken to not directly add liquids over
the gel to prevent the dislodging of neurospheroids. The treatment administered was
allowed to passively diffuse throughout the media for 15 minutes prior to acquiring the
first image. Consecutive images were acquired at 30, 45, and 60 minutes.
4.3.5 OCT Data Processing
OCT image reconstruction was accomplished using Matlab (MathWorks, Natick,
MA, USA). Image enhancements such as median filtering, motion correction, dispersion
compensation, interpolation, and volume averaging were utilized to improve overall
image quality and resolution. A total of 10-15 healthy spheroids near the center of the gel
were selected and tracked longitudinally for the intensity and decorrelation parameters.
Each spheroid was fitted into a 3D ellipsoid from which all the voxels were grouped into
the core, shell, and total regions and averaged (Fig. 13). Individual spheroid means were
averaged again for the gel at each time point. This process was repeated for the diffusion
coefficient except it involved selecting six spheroids and gel averages were not calculated
(i.e. statistical analysis was conducted on spheroid, and not gel, averages due to limited
replicates).

48
4.3.6 Statistical Analysis
Raw and normalized mean intensity, decorrelation, and diffusion coefficient (only
raw) were calculated along with the standard deviation. SigmaPlot 12.5 software (Systat
Software Inc., San Jose, CA, USA) was used to create figures and conduct one-way
repeated measures ANOVA alongside Tukey post hoc tests for normally distributed data
with equal variance. Data sets that failed these assumptions were analyzed using the
Friedman test with Dunn’s post hoc tests to determine statistical significance. These tests
were used to determine if statistically significant changes occurred due to time or
spheroid region within each treatment group. Regular one-way ANOVA with
Tukey/Dunn’s post hoc tests were used to determine the statistical differences between
treatment groups within the same time interval. Statistical tests were only conducted on
the raw means.
Figure 13. (Left) En face intensity image of multiple neurospheroids within a gel. The
spheroid centered in the red square appears in various orthogonal planes (center and
right). The red ellipses in the orthogonal views are fitted for each selected spheroid.
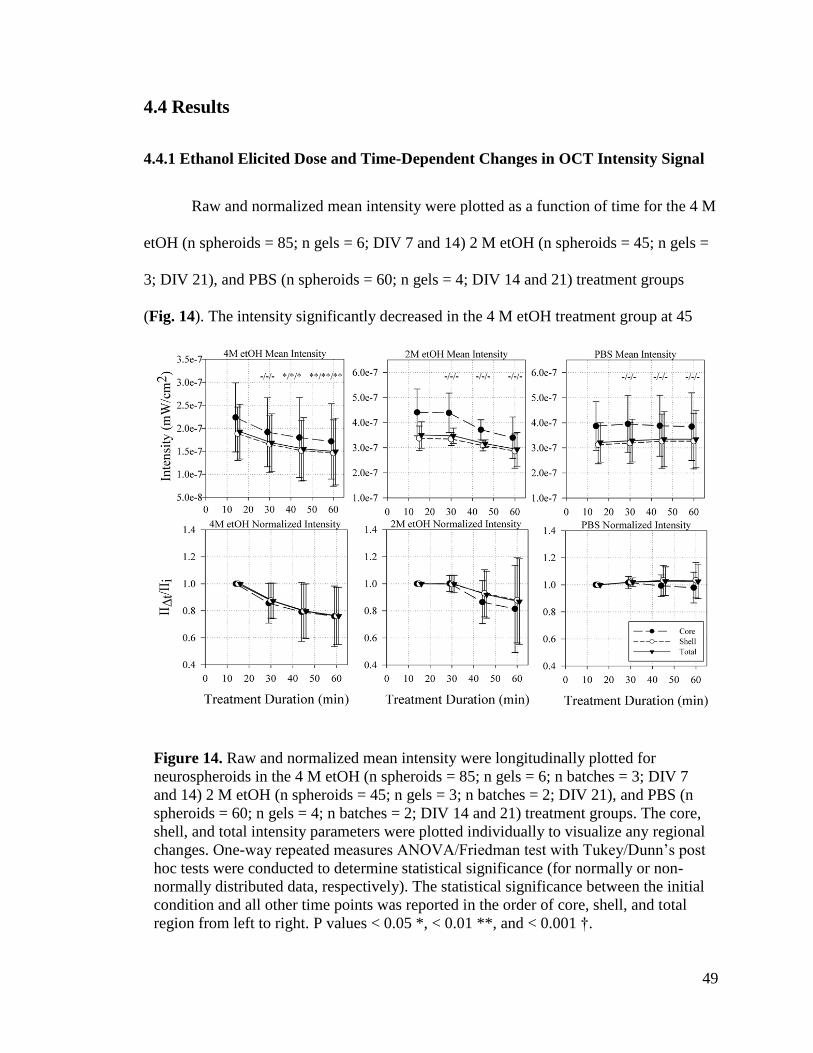
49
4.4 Results
4.4.1 Ethanol Elicited Dose and Time-Dependent Changes in OCT Intensity Signal
Raw and normalized mean intensity were plotted as a function of time for the 4 M
etOH (n spheroids = 85; n gels = 6; DIV 7 and 14) 2 M etOH (n spheroids = 45; n gels =
3; DIV 21), and PBS (n spheroids = 60; n gels = 4; DIV 14 and 21) treatment groups
(Fig. 14). The intensity significantly decreased in the 4 M etOH treatment group at 45
Figure 14. Raw and normalized mean intensity were longitudinally plotted for
neurospheroids in the 4 M etOH (n spheroids = 85; n gels = 6; n batches = 3; DIV 7
and 14) 2 M etOH (n spheroids = 45; n gels = 3; n batches = 2; DIV 21), and PBS (n
spheroids = 60; n gels = 4; n batches = 2; DIV 14 and 21) treatment groups. The core,
shell, and total intensity parameters were plotted individually to visualize any regional
changes. One-way repeated measures ANOVA/Friedman test with Tukey/Dunn’s post
hoc tests were conducted to determine statistical significance (for normally or non-
normally distributed data, respectively). The statistical significance between the initial
condition and all other time points was reported in the order of core, shell, and total
region from left to right. P values < 0.05 *, < 0.01 **, and < 0.001 †.

50
and 60 minutes which resulted in a 20% (p<0.05) and 25% (p<0.01) drop from the initial
value, respectively. No statistically significant changes were seen in the 2 M or PBS
groups. One-way repeated measures ANOVA/Friedman test revealed statistical
differences between the core and shell regions within all treatment groups except for the
4 M group at 45 minutes and 2 M group at 60 minutes. Similarly, one-way ANOVA
revealed that there were statistically significant differences in intensity between the 2 M
and 4 M groups as well as the 4 M and PBS groups across all time intervals expect at 60
minutes were no differences were found between the 4 M and 2 M groups.
4.4.2 Ethanol Did Not Elicit Dose and Time-Dependent Changes in OCT
Decorrelation
Data for the decorrelation metric was longitudinally plotted as well (Fig. 15). The
number of spheroids, gels, and batches were identical with the intensity data sets. No
statistically significant differences in decorrelation were observed in any of the treatment
groups. The core and shell decorrelation were only significantly different in the 2 M
group at 15 and 30 minutes. There were no differences between treatment types at each
time interval.

51
4.4.3 Ethanol Elicited a Slight Increase in Diffusion Coefficient
While the decorrelation relates to relative changes in the OCT signal, the
diffusion coefficient is measured using standardized units that do not require
normalization. Changes in diffusion coefficient due to 4 M etOH (n spheroids = 12; n
batch = 1; DIV 7), 2 M etOH (n spheroids = 18; n batches = 2; DIV 21), and PBS (n
spheroids = 18; n batches = 3; DIV 14 and 21) were plotted against time (Fig. 16). There
Figure 15. Raw and normalized mean decorrelation were longitudinally plotted for
neurospheroids in the 4 M etOH (n spheroids = 85; n gels = 6; n batches = 3; DIV 7
and 14) 2 M etOH (n spheroids = 45; n gels = 3; n batches = 2; DIV 21), and PBS (n
spheroids = 60; n gels = 4; n batches = 2; DIV 14 and 21) treatment groups. The core,
shell, and total intensity parameters were plotted individually to visualize any regional
changes. One-way repeated measures ANOVA/Friedman test with Tukey/Dunn’s post
hoc tests were conducted to determine statistical significance (for normally or non-
normally distributed data, respectively). The statistical significance between the initial
condition and all other time points were reported in the order of core, shell, and total
region from left to right. P values < 0.05 *, < 0.01 **, and < 0.001 †.

52
was a slight but significant increase in the core diffusion coefficient at 60 minutes from
0.2065 to 0.2139 µm2/s (p < 0.001). In addition, there were statistically significant
increases in diffusion coefficient with the 2 M group across all spheroid regions at 45 and
60 minutes (p<0.001). Interestingly, there were statistically significant changes in
diffusion coefficient within the PBS treated group. Core and shell diffusion coefficients
were significantly different in the 4 M group at 15 minutes, in the 2 M group at 60
minutes, and in the PBS group across all time intervals. Finally, one-way ANOVA with
Tukey/Dunn’s post hoc tests revealed significant differences between the 4 M and 2 M
treatment groups as well as the 4 M and PBS groups across all time intervals.
Figure 16. Changes in diffusion coefficient (D) were plotted longitudinally for
neurospheroids exposed to 4 M etOH (n spheroids = 12; n gels = 2; n batch = 1; DIV
7), 2 M etOH (n spheroids =18; n gels = 3; n batches = 2; DIV 21), and PBS (n=18; n
gels = 3; n batches = 2; DIV 14 and 21). One-way repeated measures
ANOVA/Friedman test with Tukey/Dunn’s post hoc tests were conducted to
determine the statistical significance between the initial condition and all other time
points. P values were reported in the order of core, shell, and total region from left to
right. P values < 0.05 *, < 0.01 **, and < 0.001 †.

53
4.5 Discussion
The ability of the SD OCT imaging system to track changes in cellular viability at
a macroscopic level was examined in this chapter. Three treatment groups (i.e. 4 M etOH,
2 M etOH, and PBS sham) were imaged using a low magnification LSM03 objective
lens. Multiple spheroids from a single FOV were analyzed for changes in intensity,
decorrelation, and diffusion coefficient at the core, shell, and total regions of the
neurospheroids.
Based on the results from the previous higher magnification approach, it was
expected that intensity would decrease in a time-dependent manner in the 4 M etOH
group. Indeed, this was observed with the macroscopic approach (Fig. 14). It was also
expected that a smaller, delayed decrease in intensity would be observed in the 2 M etOH
group; however, no statistically significant changes occurred. Interestingly, the mean
intensities of the 2 M and 4 M etOH groups were statistically different at each time point
except at 60 minutes. This suggested that the effects of 2 M etOH on intensity may
require exposure periods in excess of 60 minutes to manifest. Another factor that could
impact the results is the difference in spheroid age between the treatment groups.
Spheroids in the 4 M etOH group were considerably younger than those in the 2 M group
(DIV 7 and 14 vs. 21, respectively). In addition, only three gels were analyzed for the 2
M group which could impact the performance of the statistical tests. Future studies
should test later time points, adjust the disparity in spheroid age, and include more
replicates to improve the reliability of the results.

54
The decorrelation results from the macroscopic approach were similar to those
found using microscopic imaging. There were no statistically significant changes in
decorrelation in any of the treatment groups (Fig. 15). As previously mentioned, the lack
of significant changes in the 4 M group could be due to the inadequate temporal window
used in this study. It is reasonable to believe that 4 M etOH treatment elicits rapid
changes in decorrelation that occur soon after the etOH is added which plateau by 15
minutes. It is unclear from the results whether the 2 M etOH treatment elicits
decorrelation changes within the same time period as the 4 M group or if it is not
concentrated enough to cause a change in decorrelation. Furthermore, different
concentrations of etOH have been shown to elicit different effects on cells 57-67. This
could mean that 2 M etOH treatment elicited a different type of cell death that does not
induce a change in decorrelation. Acquiring OCT images immediately after the treatment
is added to the spheroids, with an appropriate temporal resolution, should help address
these concerns.
It was expected that ICM decreases with cell viability since dead cells are no
longer capable of sustaining metabolic functions. Nevertheless, the diffusion coefficient
increased in both the 4 M and 2 M etOH treatment groups (Fig. 16). These results
suggested that measurements of ICM are overwhelmed by other diffusive motions.
Similar results were observed in a recent study which reported a decrease in decorrelation
time (which is comparable to an increase in diffusion coefficient) when oncotic necrosis
was induced in breast cancer cells 75. The exact process responsible for the increase in
diffusion coefficient is not yet identified. Interestingly, some significant changes in
diffusion coefficient could also be observed in the PBS sham treatment group (Fig. 16).

55
This suggests that PBS may not serve as an ideal sham treatment since the diffusive flow
within the cells was affected. It can also be assumed that the change in temperature,
concentration of nutrients, and fluid densities caused by the addition of PBS to the media
elicited some effects on intracellular transport within the cells. Future studies can address
these concerns by replacing PBS with media sham treatment.
Overall, the results from this chapter are promising regarding the ability of a low
magnification OCT system to analyze cellular viability in a high-throughput manner.
Despite this, more studies need to be conducted to fully validate the use of OCT for
viability imaging. Most notably, the effects of other cell death pathways must be
examined using the OCT system. It would also be beneficial to induce the same type of
cell death pathway using alternate methods (e.g. temperature, osmolarity, glucose
deprivation, etc.) to compare the changes in OCT parameters. Ideally, the same cell death
pathway should affect the OCT parameters in the same way regardless of treatment
method. Future studies should account for the effects of DIV on viability by testing
spheroids from the same age. In addition, changes to OCT parameters within the first 10-
15 minutes should be investigated more thoroughly especially for the decorrelation and
diffusion coefficient. Finally, more parameters should be tested such as the SATVR and
scattering attenuation. Testing additional parameters allows for a more comprehensive
and holistic approach to determining viability. Ultimately, an algorithm utilizing multiple
OCT-derived parameters will be created through cluster and correlation analysis to
measure the viability within a sample in a high-throughput, label-free, and nondestructive
manner.

56
4.6 Conclusion
The recent emergence of in vitro tissue spheroids for applications in drug
screening studies necessitates the need for more efficient high-throughput imaging
modalities. OCT is label-free, nondestructive, and capable of imaging multiple spheroids
throughout their depths. In this chapter, macroscopic changes in intensity, decorrelation,
and diffusion coefficient were measured in response to 4 M etOH, 2 M etOH, and PBS
sham treatment. Significant changes in intensity and diffusion coefficient were observed
with a change in viability. More studies need to be conducted to fully validate the effects
of viability on OCT-based parameters. Finally, the impacts of spheroid age, treatment
type, and temporal resolution on OCT viability imaging need to be determined.

57
References
1. Wong CH, Siah KW, Lo AW. Estimation of clinical trial success rates and related
parameters. Biostatistics. 2018;20(2):273-86.
2. Ma W, Tavakoli T, Derby E, Serebryakova Y, Rao MS, Mattson MP. Cell-extracellular
matrix interactions regulate neural differentiation of human embryonic stem cells.
BMC Developmental Biology. 2008;8:90.
3. Togashi H, Sakisaka T, Takai Y. Cells adhesion molecules in the central nervous
system. Cell Adhesion and Migration. 2009;3(1):29-35.
4. Baker BM, Chen CS. Deconstructing the third dimension: how 3D culture
microenvironments alter cellular cues. Journal of Cell Science. 2012;125(13):3015-24.
5. Cukierman E, Pankov R, Stevens DR, Yamada KM. Taking cell-matrix adhesion to
the third dimension. Science. 2001;294(5547):1708-12.
6. Edmondson R, Broglie JJ, Adcock AF, Yang L. Three-dimensional cell culture
systems and their applications in drug discovery and cell-based biosensors. Assay and
Drug Development Technology. 2014;12(4):207-18.
7. Hopkins AM, DeSimone E, Chwalek K, Kaplan DL. 3D in vitro modeling of the
central nervous system. Progress in Neurobiology. 2015;125:1-25.
8. Lin RZ, Chang HY. Recent advances in three-dimensional multicellular spheroid
culture for biomedical research. Biotechnology Journal. 2008;3(9-10):1172-84.
9. Fennema E, Rivron N, Rouwkema J, van Blitterswijk C, de Boer J. Spheroid culture
as a tool for creating 3D complex tissues. Trends in Biotechnology. 2013;31(2):108-
15.

58
10. Dingle YT, Boutin ME, Chirila AM, Livi LL, Labriola NR, Jakubek LM, Morgan JR,
Darling EM, Kauer JA, Hoffman-Kim D. Three-dimensional neural spheroid culture:
an in vitro model for cortical studies. Tissue Engineering Part C Methods.
2015;21(12):1274-83.
11. Lancaster MA, Renner M, Martin C, Wenzel D, Bicknell LS, Hurles ME, Homfray T,
Penninger JM, Jackson AP, Knoblich JA. Cerebral organoids model human brain
development and microcephaly. Nature. 2013;501(7467):373-379.
12. Choi SH, Kim YH, Hebisch M, Sliwinski C, Lee S, D’Avanzo C, Chen H, Hooli B,
Asselin C, Muffat J, Klee JB, Zhang C, Wainger BJ, Peitz M, Kovacs DM, Woolf CJ,
Wagner SL, Tanzi RE, Kim DY. A three-dimensional human neural cell culture
model of Alzheimer’s disease. Nature. 2014;515(7526):274–8.
13. Jorfi M, D’Avanzo C, Tanzi RE, Kim DY, Irimia D. Human Neurospheroid Arrays
for In Vitro Studies of Alzheimer’s Disease. Scientific Reports. 2018;8:2450.
14. Lee H-K, Sanchez CV, Chen M, Morin PJ, Wells JM, Hanlon EB, Xia W. Three-
dimensional human neuro-spheroid model of Alzheimer’s disease based on
differentiated induced pluripotent stem cells. PLoS One. 2016;11(9):e0163072.
15. Choi S, Kim J, Park J, Lee K, Kim E, Jeon WB. Cytotoxicity and inhibition of
intracellular interaction in N2a neurospheroids by perfluorooctanoic acid and
perfluorooctanesulfonic acid. Food and Chemical Toxicology. 2013;60:520-9.
16. Khaitan D, Chandna S, Arya MB, Dwarakanath BS. Establishment and
characterization of multicellular spheroids from a human glioma cell line; implication
for tumor therapy. Journal of Translational Medicine. 2006;4:12.
59
17. Huang Y, Wang S, Guo Q, Kessel S, Rubinoff I, Chan LL, Li P, Liu Y, Qiu J, Zhou
C. Optical coherence tomography detects necrotic regions and volumetrically
quantifies multicellular tumor spheroids. Cancer Research. 2017;77(21):6011-20.
18. Jung Y, Klein OJ, Wang H, Evans CL. Longitudinal, label-free, quantitative tracking
of cell death and viability in a 3D tumor model with OCT. Nature. 2016;6:27017.
19. Watanabe M, Buth JE, Vishlaghi N, de la Torre-Ubieta L, Taxidis J, Khakh B,
Coppola G, Pearson CA, Yamauchi K, Gong D, Dai X, Damoiseaux R, Aliyari R,
Liebscher S, Schenke-Layland K, Caneda C, Huang EJ, Zhang Y, Cheng G,
Geschwind DH, Golshani P, Sun R, Novitch BG. Self-organized cerebral organoids
with human specific features predict effective drugs to combat Zika virus infection.
Cell Reports. 2017;21(2):517-32.
20. Garcez PP, Loiola EC, de Costa RM, Higa LM, Trindade P, Delvecchio R,
Nascimento JM, Brindeiro R, Tanuri A, Rehen SK. Zika virus impairs growth in
human neurospheres and brain organoids. Science. 2016;352(6287):816-18.
21. Aras MA, Hartnett KA, Aizenman E. Assessment of Cell Viability in Primary
Neuronal Cultures. Current Protocols in Neuroscience. 2008;44(1):7.18.1-7.18.15.
22. Brana C, Benham C, Sundstorm L. A method for characterizing cell death in vitro by
combining propidium iodide staining with immunohistochemistry. Brain Research
Brain Research Protocols. 2002;10(2):109-14.
23. Landry S, McGhee P, Girardin R, Keeler W. Monitoring live cell viability:
Comparative study of fluorescence, oblique incidence reflection and phase contrast
microscopy imaging techniques. Optics Express. 2004;12(23):5754-9.
24. Gerlich D, Ellenberg J. 4D imaging to assay complex dynamics in live specimens.
Nature Cell Biology. 2003;Suppl:S14-9.

60
25. Ringler SL, Aye J, Byrne E, Anderson M, Turner CP. Effects of disrupting calcium
homeostasis on neuronal maturation: early inhibition and later recovery. Cellular and
Molecular Neurobiology. 2008;28(3):389-409.
26. Kim JW, Oh HA, Lee SH, Kim KC, Eun PH, Ko MJ, Gonzales ELT, Seung H, Kim
S, Bahn GH, Shin CY. T-Type Calcium Channels Are Required to Maintain Viability
of Neural Progenitor Cells. Biomolecules and Therapeutics. 2018;26(5):439-445.
27. Turner CP, Connell J, Blackstone K, Ringler SL. Loss of calcium and increased
apoptosis within the same neuron. Brain Research. 2006;1128(1):50-60.
28. Ettinger A, Wittmann T. Fluorescence Live Cell Imaging. Methods in Cell Biology.
2014;123:77-94.
29. Huang D, Swanson EA, Lin CP, Schuman JS, Stinson WG, Chang W, Hee MR,
Flotte T, Gregory K, Puliafito CA. Optical coherence tomography. Science.
1991;254:1178–81.
30. Tamborski S, Lyu HC, Dolezyczek H, Malinowska M, Wilczynski G, Szlag D, Lasser
T, Wojtkowski M, Szkulmowski M. Extended-focus optical coherence microscopy
for high resolution imaging of the murine brain. Biomedical Optics Express.
2016;7(11):4400-14.
31. Magnain C, Augustinack JC, Konukoglu E, Frosch MP, Sakadžić S, Varjabedian A,
Garcia N, Wedeen VJ, Boas DA, Fischl B. Optical coherence tomography visualizes
neurons in human entorhinal cortex. Neurophotonics. 2015;2(1):015004.
32. Bizheva K, Unterhuber A, Hermann B, Považay B, Sattmann H, Drexler W. Imaging
ex vivo and in vitro brain morphology in animal models with ultrahigh resolution
optical coherence tomography. Journal of Biomedical Optics. 2004;9(4):719-724.

61
33. Fink SL, and Cookson BT. Apoptosis, Pyroptosis, and Necrosis: Mechanistic
Description of Dead and Dying Eukaryotic Cells . Infection and Immunity.
2005;73(4):1907-1916. doi:10.1128/IAI.73.4.1907-1916.2005.
34. Majno G, and Joris I. Apoptosis, oncosis, and necrosis. An overview of cell death.
The American Journal of Pathology. 1995;146(1):3-15.
35. Won SK, Kim DY, Gwag BJ. Cellular and molecular pathways of ischemic neuronal
death. Journal of Biochemistry and Molecular Biology. 2002;35(1):67-86.
36. Mironov SL. ADP Regulates Movements of Mitochondria in Neurons. Biophysical
Journal. 2007;92(8):2944-2952. doi:10.1529/biophysj.106.092981.
37. Xiao Q, Hu X, Wei Z, and Tam KY. Cytoskeleton Molecular Motors: Structures and
Their Functions in Neuron. International Journal of Biological Sciences.
2016;12(9):1083-1092. doi:10.7150/ijbs.15633
38. Appert-Rolland C, Ebbinghaus M, and Santen L. Intracellular transport driven by
cytoskeletal motors: General mechanisms and defects. Physics Reports. 2015;593:1-
59. doi:10.1016/j.physrep.2015.07.001.
39. Lin MY, Sheng ZH. Regulation of mitochondrial transport in neurons. Experimental
Cell Research. 2015;334(1):35-44.
40. Lee J, Wu W, Jiang JY, Zhu B, Boas DA. Dynamic light scattering optical coherence
tomography. Optics Express. 2012;20(20):22262-77.
41. Joo C, Evans CL, Stepinac T, Hasan T, de Boer JF. Diffusive and directional
intracellular dynamics measured by field-based dynamic light scattering. Optics
Express. 2010;18(3):2858-71.
62
42. Swanson EA, Izatt JA, Hee MR, Huang D, Lin CP, Schuman JS, Puliafito CA,
Fujimoto JG. In vivo retinal imaging by optical coherence tomography. Optics
Letters. 1993;18(21):1864-66.
43. Izatt JA, Hee MR, Swanson EA, Lin CP, Huang D, Schuman JS, Puliafito CA,
Fujimoto JG. Micrometer-scale resolution imaging of the anterior eye in vivo with
optical coherence tomography. Archives of Ophthalmology. 1994;112(12):1584-9.
44. Fercher AF, Drexler W, Hitzenberger CK, Lasser T. Optical coherence tomography-
principles and applications. Reports on Progress in Physics. 2003;66(2):239-303.
45. Men J, Huang Y, Solanki J, Zeng X, Alex A, Jerwick J, Zhang Z, Tanzi RE, Li A,
Zhou C. Optical coherence tomography for brain imaging and developmental biology.
IEEE Jornal of Selected Topics in Quantum Electronics. 2015;22(4):6803213.
46. Gora MJ, Suter MJ, Tearney GJ, Li X, Endoscopic optical coherence tomogprahy:
techniques and clinical applications. Biomedical Optics Express.
2017;8(5):2405:2444.
47. Kashani AH, Chen CL, Gahm JK, Zheng F, Richter GM, Rosenfeld PJ, Shi Y, Wang
RK. Optical coherence tomography angiography: a comphrensive review of current
methods and clinical applications. Progress in Retinal Eye Research. 2017;60:66-100.
48. Jeong K, Turek JJ, Nolte DD. Volumetric motility-contrast imaging of tissue response
to cytoskeletal anti-cancer drugs. Optics Express. 2007;15(21):14057-64.
49. Martucci NJ, Morgan K, Anderson GW, Hayes PC, Plevris JN, Nelson LJ,
Bagnaninchi PO. Nondestructive optical toxicity assays of 3D liver spheroids with
optical coherence tomography. Advanced Biosystems. 2018;2(3):1700212.
63
50. Dunkers JP, Lee YJ, Chatterjee K. Single cell viability measurements in 3D scaffolds
using in situ label free imaging by optical coherence tomography. Biomaterials.
2012;33(7):2119-26.
51. Holmes C, Tabrizian M, Bagnaninchi PO. Motility imaging via optical coherence
phase microscopy enables label-free monitoring of tissue growth and viability in 3D
tissue-engineering scaffolds. Journal of Tissue Engineering and Regenerative
Medicine. 2015;9(5):641-5
52. Bagnaninchi PO, Drummond N, Holmes C, Daoud J, Tabrizian M. Two-dimensional
and three-dimensional viability measurements of adult stem cells with optical
coherence phase microscopy. Journal of Biomedical Optics. 2011; 16(8):0860035.
53. Farhat G, Mariampillai A, Yang VX, Czarnota GJ, Kolios MC. Detecting apoptosis
using dynamic light scattering with optical coherence tomography. Journal of
Biomedical Optics. 2011;16(7):070505.
54. Farhat G, Yang VX, Czarnota GJ, Kolios MC. Detecting cell death with optical
coherence tomography and envelope statistics. Journal of Biomedical Optics.
2011;16(2):026017.
55. van der Meer FJ, Faber DJ, Aalders MC, Poot AA, Vermes I, van Leeuwen TG.
Apoptosis- and necrosis-induced changes in light attenuation measured by optical
coherence tomography. Lasers in Medical Science. 2009;25(2):259-67.
56. Riss TL, Moravec RA, Niles AL, Duellman S, Benink HA, Worzella TJ, Minor L.
Cell viability assays. In: Sittampalam GS, Coussns NP, Brimacombe K, et al., editors.
Assay Guidance Manual. Bethesda, MD: Eli Lilly & Company and the National
Center for Advancing Translational Sciences; 2004.
https://www.ncbi.nlm.nih.gov/books/NBK144065/; accessed March 10, 2019.

64
57. Yeo EJ, Lim HK, Park SC. Effect of short-term ethanol on the proliferative response
of Swiss 3T3 cells to mitogenic growth factors. Experimental and Molecular
Medicine. 2000;32:161-9.
58. Carter EA, & Wands JR. Ethanol inhibits hormone stimulated hepatocyte DNA
synthesis. Biochemical and Biophysical Research Communication. 1985;128:767-74.
59. DeVito WJ, Stone S, Shamgochian M. Ethanol increases the neurotoxic effect of
tumor necrosis factor-alpha in cultured rat astrocytes. Alcoholism, Clinical and
Experimental Research. 2000;24:82-92.
60. Castilla R, Gonzalez R, Fouad D, Fraga E, Muntane J. Dual effect of ethanol on cell
death in primary culture of human and rat hepatocytes. Alcohol and Alcoholism.
2004; 39: 290-6.
61. Kurose I, Higuchi H, Miura S, Saito H, Watanabe N, Hokari R, Hirokawa M,
Takaishi M, Zeki S, Nakamura T, Ebinuma H, Kato S, Ishii H. Oxidative stress-
mediated apoptosis of hepatocytes exposed to acute ethanol intoxication. Hepatology.
1997;25:368-78.
62. Higuchi H, Kurose I, Kato S, Miura S., Ishii H. Ethanol-induced apoptosis and
oxidative stress in hepatocytes. Alcoholism, Clinical and Experimental Research.
1996;20:340-6.
63. Devi BG, Henderson GI, Frosto TA, Schenker S. Effect of acute ethanol exposure on
cultured fetal rat hepatocytes: relation to mitochondrial function. Alcoholism, Clinical
and Experimental Research. 1994;18:1436-42.
64. Cunningham CC, Coleman WB, Spach PI. The effects of chronic ethanol
consumption on hepatic mitochondrial energy metabolism. Alcohol and Alcoholism.
1990;25:127-36.
65
65. Chang SW, Chou SF, Wang YH. Ethanol treatment induces significant cell death in
porcine corneal fibroblasts. Cornea. 2006;25:1072-9.
66. Baker RC, Kramer RE. Cytotoxicity of short-chain alcohols. Annual Review of
Pharmacology and Toxicology. 1999;39:127-50.
67. Lyon RC, McComb JA, Scherurs J, Goldstein DB. A relationship between alcohol
intoxication and the disordering of brain membranes by a series of short-chain
alcohols. Journal of Pharmacology and Experimental Therapeutics. 1981;218:669-
75.
68. Zanoni M, Piccinini F, Arienti C, Zamagni A, Santi S, Polico R, Bevilacqua A, Tesei
A. 3D tumor spheroid models for in vitro therapeutic screening: a systematic
approach to enhance the biological relevance of data obtained. Scientific Reports.
2016;6:19103.
69. Lee J, Radhakrishnan H, Wu W, Daneshmand A, Climov M, Ayata C, Boas DA.
Quantitative imaging of cerebral blood flow velocity and intracellular motility using
dynamic light scattering-optical cohere tomography. Journal of Cerebral Blood Flow
and Metabolism. 2013;33(6):819-25.
70. Sant S, Johnston PA. The production of 3D tumor spheroids for cancer drug
discovery. Drug Discovery Today: Technologies. 2017;23:27–36.
71. Smith SJ, Wilson M, Ward JH, Rahman CV, Peet AC, Macarthur DC, Rose FR,
Grundy RG, Rahman R. Recapitulation of tumor heterogeneity and molecular
signatures in a 3D brain cancer model with decreased sensitivity to histone
deacetylase inhibition. PLoS One. 2012;7(12):e52335.

66
72. Karlsson H, Fryknas M, Larsson R, Nygren P. Loss of cancer drug activity in colon
cancer HCT-116 cells during spheroid formation in new 3-D spheroid cell culture
system. Experimental Cell Research. 2012;318(13):1577-85.
73. Khawar IA, Park JK, Jung ES, Lee MA, Chang S, Kuh HJ. Three Dimensional
Mixed-Cell Spheroids Mimic Stroma-Mediated Chemoresistance and Invasive
Migration in hepatocellular carcinoma. Neoplasia. 2018;20(8):800–12.
74. Huang Y, Guo Q, Zou J, Wang X, Titus S, Ferrer M, Zhou C. High-throughput
optical coherence tomography imaging for drug screening with 3D tumor spheroids.
Biophotonics Congress: Biomedical Optics Congress 2018. 2018;OTh2D.5.
75. Arezza NJ, Razani M, Kolios MC. Dyanmic light scattering optical coherence
tomography to probe motion of subcellular scatterers. Journal of Biomedical Optics.
2019;24(2):025002.