Embed Size (px)
Citation preview
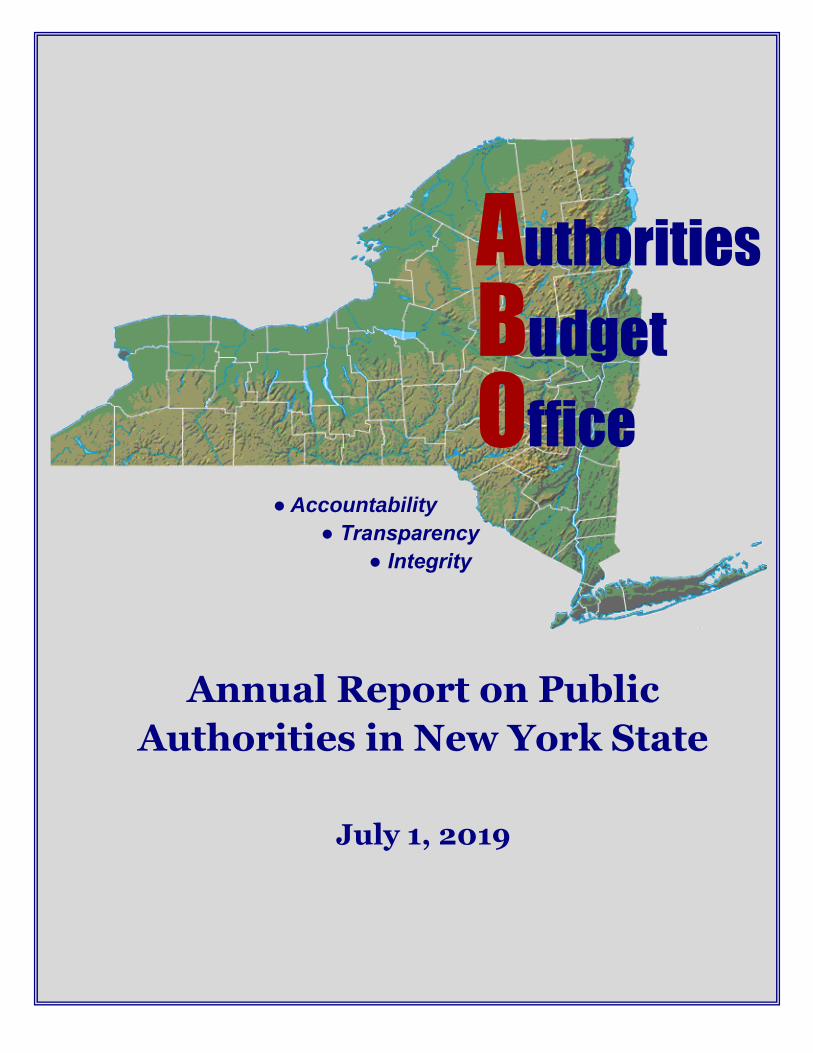
Authorities Budget Office
Authorities
Budget
Office
● Accountability
● Transparency
● Integrity
Annual Report on Public
Authorities in New York State
July 1, 2019
Table of Contents
Introduction .................................................................................................................................................. 1
Responsibilities of the Authorities Budget Office ......................................................................................... 1
State and Local Authorities in New York ....................................................................................................... 2
Regulation and Ruling ................................................................................................................................... 2
Training ......................................................................................................................................................... 4
Compliance Reviews and Investigations ....................................................................................................... 5
Public Authorities Spending 2014 - 2018 ...................................................................................................... 9
Public Authorities Debt 2014 - 2018 ........................................................................................................... 19
Public Authorities Procurement Practices 2014 -2018 ............................................................................... 28
Public Authorities Staffing and Compensation 2014 - 2018 ....................................................................... 37
Economic Development Results 2014 - 2018 ............................................................................................. 48
Appendix I: Public Authorities That Have Filed to File Required Reports in PARIS .................................... A1
Authorities Budget Office 1
2019 Annual Report on Public Authorities in New York State
Introduction
The Authorities Budget Office (ABO) was first created in unconsolidated law as the Authority Budget Office
with enactment of the Public Authorities Accountability Act of 2005 (PAAA). The ABO was re-established
as an independent office in Title 2 of Public Authorities Law when the 2009 Public Authorities Reform Act
(PARA) took effect on March 1, 2010. From its inception, the ABO’s mission has been to make public
authorities more accountable and transparent and to act in ways consistent with their governing statutes
and public purpose. The ABO carries out its mission by: collecting, analyzing and disseminating to the
public information on the finances and operations of state and local public authorities; conducting reviews
to assess the operating and governance practices of public authorities and their compliance with state
laws; promoting good governance principles through training, policy guidance, the issuance of best
practices recommendations and assistance to public authority staff and board members; and investigating
complaints made against public authorities for noncompliance or inappropriate conduct. Consistent with
this public purpose, and pursuant to Section 7 of Title 2 of Public Authorities Law, the ABO also issues an
annual report which contains its conclusions, assessments and opinions on the performance of state and
local authorities. The 2019 Annual Report on Public Authorities in New York State is the thirteenth annual
report released by the Authorities Budget Office.
Responsibilities of the Authorities Budget Office
The ABO’s powers and duties include collecting and analyzing financial and program information,
exercising oversight of public entities, and enforcing statutory requirements through its ability to conduct
investigations and sanction boards of directors. No other office in the country has a similar centralized
mission, including oversight of such a diverse system of 583 state and local public authorities. The 2009
Public Authorities Reform Act provided the ABO with added enforcement powers to more effectively carry
out these duties and responsibilities. Key additional powers include the authority to:
• Promulgate regulations necessary to effectuate the purposes of the Act.
• Make recommendations to the Governor and the Legislature concerning changes in the terms of
office of board members.
• Initiate investigations and act upon complaints received concerning the lack of compliance with
statutory requirements by state or local authorities.
• Issue subpoenas in conjunction with such investigations.
• Conduct examinations of the books, records, acts and practices of public authorities.
• Publicly warn and censure authorities for non-compliance with the law and establish guidelines
governing such actions.
• Recommend the suspension or dismissal of officers or directors who fail to act in accordance
with the law, their oath, or their fiduciary duty.
Authorities Budget Office 2
2019 Annual Report on Public Authorities in New York State
The ABO is headed by a Director, appointed by the Governor and confirmed by the State Senate. The
Director serves a fixed four year term to protect and assure the independence of the Office and can only
be removed for reasons of permanent disability, inefficiency, neglect of duty, malfeasance, illegal or
inappropriate conduct, or a breach of fiduciary duty.
State and Local Authorities in New York
New York State has a complex system of public authorities that are formed to achieve public or quasi-
public objectives, including financing, building and managing public projects or improving a variety of
governmental functions.
Today, the enforcement and oversight powers of the Authorities Budget Office (ABO) extend to 583 state
and local public authorities. This is an increase of 298 since July 1, 2008, when the ABO issued its first
annual report. The current inventory of covered authorities includes:
• 48 state authorities
• 535 local authorities
➢ 109 IDAs
➢ 294 not-for-Profit corporations affiliated with, sponsored, or created by a local
government (including 38 Tobacco Asset Securitization Corporations)
➢ 41 urban renewal or community development agencies
➢ 28 water, water finance, and water and sewer authorities
➢ 9 solid waste and resource recovery authorities
➢ 5 parking authorities
➢ 3 airport authorities
➢ 25 land banks
➢ 21 miscellaneous authorities
Note: The inventory count changes throughout the year as authorities are created or dissolved.
Regulation and Ruling
ABO Develops IDA Projects Website Posting Regulation
The Authorities Budget Office issued regulations to increase the accountability, and to improve the
efficiency and transparency, of the operations of Industrial Development Agencies (“IDAs”) within New
York State. Effective December 5, 2018, Part 250 (the “Regulations”) was added to Title 19 of the New
York Codes, Rules, and Regulations. These regulations, which require conspicuous online records posting,
Authorities Budget Office 3
2019 Annual Report on Public Authorities in New York State
reiterate the statutory requirements of Section 859-a of the General Municipal Law regarding the
prerequisites to the provision of financial assistance by IDAs.
The new IDA regulations require IDAs to post the blank project information request form as well as the
approved project application on the IDAs official website, as required by Chapter 563 of the Laws of 2015.
The purpose of the regulations is to ensure the transparency and accountability of these public authorities
by requiring the project information to be available on each IDA’s website for public review.
The regulation opens up the activities of IDAs to the communities they serve. Posting board approved
project documents on their website ensures compliance with the 2015 law and gives the public improved
access to the tax incentives provided to project recipients.
In 2015, as part of the State Comptroller’s legislative agenda, Chapter 563 of the Laws of 2015 - A.7915
(Magnarelli)/S.5867 (Marchione) was adopted to increase the accountability and improve the efficiency
and transparency of the operations of industrial development agencies and authorities (IDAs) by requiring
standard application forms for requests for financial assistance, uniform criteria for the evaluation and
selection for each category of projects for which financial assistance is provided, and uniform project
agreements.
According to the law, the standard applications must be approved by the boards of the agencies and
authorities prior to being posted on the websites. Additionally, IDAs would be required to post on their
websites the policies for the suspension or discontinuance of such financial assistance.
ABO Secures Favorable Ruling vs. Madison County Industrial Development Agency in NYS
Court of Appeals
The ABO recently secured a favorable ruling against the Madison County Industrial Development Agency
in the New York State Court of Appeals. The matter involved the question of whether IDA’s are allowed
to file consolidated reports with the ABO and whether an IDA may create a subsidiary. The Madison
County IDA created the Madison Grant Facilitation Corp. as a way of protecting the IDA from liability
regarding third-party contractors, in the event they fail to comply with their contractual obligations. The
ABO’s top concern was that of maintaining transparency and accountability, which they feared could be
lost if IDA’s could file consolidated reports. This also brought to question whether IDA’s have the power
to create subsidiaries. The New York State Attorney General released a formal opinion on the matter
(2014-01), determining that local IDA’s were not, in fact, allowed to create subsidiaries. This formal
opinion guided the ABO in deciding that the Madison County IDA could not consider the Madison Grant
Facilitation Corp. as a subsidiary; thus, they could not consolidate their filings to the ABO. The Madison
County IDA challenged this determination and the formal opinion by the Attorney General, and brought
action against the ABO in New York’s Supreme Court. The Supreme Court dismissed the petition, agreeing
with the Attorney General’s formal opinion that local IDA’s could not create subsidiaries. The Appellate
Division also agreed with this ruling, which lead the Madison County IDA to seek leave to file an appeal in
the New York State Court of Appeals. Leave was granted and after arguments and the courts deliberation,
Authorities Budget Office 4
2019 Annual Report on Public Authorities in New York State
Chief Judge DiFiore issued a ruling that the judgment of the Appellate Division be upheld; the ABO’s
reliance on the AG’s Opinion was not arbitrary and the IDA may not file consolidated reports to the ABO.
This ruling has affirmed the breadth of enforcement powers provided to the ABO as well as limiting the
scope of power held by local IDA’s.
The full decision can be found here: https://www.nycourts.gov/ctapps/Decisions/2019/Mar19/14opn19-
Decision.pdf .
Training
During 2018-2019 the ABO provided training to board members and staff of public authorities, issued
policy guidance concerning the implementation of the laws governing public authorities, and issued
recommended practices to promote good governance of public authorities.
Board Member Training
• 451 board members trained during period of 2018-2019
• More than 6,700 board members trained since 2006
Section 2824 of Public Authorities Law requires board members of public authorities to receive training
regarding their legal, fiduciary, financial and ethical responsibilities as board members of an authority.
Since July 2011, the ABO has offered board member training through interactive online webinars, which
cover topics such as the use of executive session, ethical conduct, board member independence, conflicts
of interest, fiduciary responsibilities, and a demonstration of the Public Authorities Reporting Information
System (PARIS) so as to better understand reporting requirements. As the sessions are offered to small
groups of less than 20 participants, board members have the ability to ask and answer questions and
address issues which affect their experience as a board member of both small and large public authorities.
Board members should also remember that Section 2824 (2) of Public Authorities Law indicates that board
members shall participate in continued training to remain informed of best practices, regulatory and
statutory changes. As such, our office recommends that board members attend training every three years
or upon reappointment to a board. During the last year, 451 board members and staff were trained in this
manner. Overall, more than 6,700 board members and staff have received training since 2006.
Public Authority Reporting Information System (PARIS) Training
The Authorities Budget Office also conducts PARIS webinar training for Authority staff members which is
interactive and online. This training is ongoing and intended primarily for staff responsible for entering
information into PARIS. Sessions are conducted as needed.
The trainer reviews each required report in PARIS (Annual, Budget, Procurement, Investment) and staff
are encouraged to ask questions regarding their particular issues with PARIS. Common topics include how
Authorities Budget Office 5
2019 Annual Report on Public Authorities in New York State
to report full time equivalent (FTE) staff in the Annual Report, how to report debt, reporting on real and
personal property, procurement contracts, IDA project information as well as how to correctly report
budget information.
Compliance Reviews and Investigations
The ABO conducts compliance and operational reviews to assess public authority operating and
governance practices, and investigates complaints of public authority activities received from the public.
Compliance Reviews
IDA Sales and Use Tax Exemptions: IDAs are authorized by Article 18-A of General Municipal Law to offer
financial incentives to attract, retain, and expand businesses to improve economic conditions in their
respective locales. One of the financial assistance benefits offered by IDAs is exemption from state and
local sales tax. IDAs appoint project owners to act as agents of the IDA to make project-related purchases
that are exempt from sales taxes. IDAs are required to annually report the amount of sales tax exemptions
claimed for each project in the Public Authorities Reporting Information System (PARIS). For 2016 and
2017, IDAs reported providing a total of $495.5 million in sales tax exemptions to over 700 projects.
In 2013, legislation was passed to reform how IDAs provide state and local sales tax exemption benefits.
The legislation requires IDAs to maintain records for sales tax exemptions provided and to recapture sales
tax exemption benefits claimed by a project applicant in excess of amounts approved.
Our review found that only three of the nine IDAs reviewed are adequately monitoring sales tax
exemptions provided to projects. We reviewed 43 projects and found that eight reported to the respective
IDA that the project used more sales tax exemptions than the IDA approved. In total, these projects
reported that they claimed $385,979 more than the IDA had approved. In addition, another project
reported to the IDA that it continued to claim an additional $43,293 in sales tax exemptions after its
approved time period elapsed. Yet there were no actions taken by these IDAs to determine the reason for
the excessive amounts reported or to recapture the excess as required by the 2013 legislation until we
conducted our review.
For example, the Monroe County IDA approved a project to receive $230,400 in sales tax exemptions; but
the project reported to the IDA that it used $235,312 in sales tax exemptions, which is $4,912 in excess of
the amount approved. Monroe County IDA officials did not contact the project regarding this excess until
we notified Monroe County IDA that the project was selected for our review.
Five of the IDAs responded to our review and indicated that they contacted seven of the nine projects
regarding the excess sales tax exemptions reported by the projects. One IDA indicated that it had
recaptured a portion of the excess amount that we identified. Four IDAs indicated that they contacted the
Authorities Budget Office 6
2019 Annual Report on Public Authorities in New York State
project owners to inquire about the excess sales tax exemptions reported, and those project owners
generally provided the IDAs with revised documents that resulted in the total sales tax exemptions
reported being within the amounts approved by the respective IDA boards.
In addition, we found IDA boards are approving resolutions without indicating the amount of financial
assistance being considered. Of the 43 projects reviewed, one project did not have a resolution and 16
other project resolutions did not indicate the amount of sales tax exemptions being approved by the
board. In addition, the amount of sales tax exemptions recorded on the ST-60s (NYS Sales and Use Tax
Exemption Form) do not always match the amount that is approved by the IDA board. For example,
Madison County IDA executed a project agreement to provide $50,100 in sales tax exemptions, but then
issued an ST-60 to the project that allowed the project to claim up to $125,070 in sales tax exemptions.
Further, we found that only three of the nine IDAs reviewed have policies in place to recapture sales tax
exemptions in excess of the amounts approved and that only one of the nine IDAs reviewed are posting
all project resolutions and project agreements on their web sites, as required by Section 875 (7) of General
Municipal Law. In addition, not all IDAs are submitting annual compliance reports to the Tax Department
as required by Section 875 (3)(d) of General Municipal Law. Of the nine IDAs reviewed, only two had
submitted the annual compliance reports for 2016 and 2017. In response to our review, six of the IDAs
indicated that these reports are now or will be submitted to the Tax Department.
Counties of Warren and Washington Industrial Development Agency and Civic Development Corporation:
The Counties of Warren and Washington Industrial Development Agency (IDA) was established by Chapter
862 of Laws of 1971 as a public benefit corporation created to promote, develop, encourage and assist in
the construction, expansion, and equipping of economically sound industrial and commercial facilities in
order to advance the job opportunities, general prosperity, and economic welfare of the citizens of
Warren County and Washington County.
The IDA coordinates with the Counties of Warren and Washington Civic Development Corporation (CDC),
a not-for-profit corporation created pursuant to Section 1411 of Not-For-Profit Corporation Law in 2011
to promote community and economic development and create jobs in the not-for-profit sectors of Warren
and Washington Counties. The CDC accomplishes this by providing access to low interest financing.
Our review found that the IDA has not adopted adequate procedures to evaluate proposed projects
seeking financial assistance. Although IDA Executive Committee board members review the project
application and the cost-benefit analysis as a basis for approving projects for financial assistance, we
found that the information in the cost-benefit analysis does not always match the information provided
in the project application. Of the five projects approved since June 2016, the amount of exemptions in the
cost-benefit analyses prepared by the IDA for each of those projects were different than the amount of
total exemptions requested in the application. Although the Executive Committee members receive both
Authorities Budget Office 7
2019 Annual Report on Public Authorities in New York State
the project application and the cost-benefit analysis as part of their review of the proposed projects, there
was no indication that committee members were aware of these discrepancies or had questions regarding
the amount of exemptions to approve.
We also found that the IDA is not adequately monitoring sales tax exemptions reported by projects, and
is failing to recapture funds in accordance with its established policy and General Municipal Law. The
amount of sales tax exemptions approved by the board and recorded on the ST-60 (NYS Sales and Use Tax
Exemption Form) does not always match the amount of sales tax exemptions requested by the project
owner, and there is no record to explain the reason for the difference. And although General Municipal
Law requires that board resolutions include the amount of sales tax approved, of the 11 projects approved
for sales tax exemptions during our review period (January 2015 through October 2018), only one board
resolution included the amount of sales tax exemptions approved by the board. We also noted that two
projects reported to the IDA that they claimed more sales tax exemptions than the amount recorded on
the ST-60, but there was no action taken by the IDA to recapture the excess exemptions.
We also found that some projects may be receiving more sales tax exemptions than intended by the
board, because the amount of sales tax exemptions recorded on the ST-60 for five projects was based on
an 8 percent sales tax rate, rather than the 7 percent sales tax rate in effect in the counties during the
time periods under review.
General Municipal Law also requires IDAs to annually evaluate all active projects toward achieving the
objectives indicated in the project agreement, and that these assessments must be provided to the board.
The IDA requires project owners to submit an annual employment survey to report the number of full-
time equivalent employees as of the end of each year. However, we found that only 12 of the 24 active
projects were presented to the board in 2015, no projects were presented to the board in 2016, and only
22 of the 26 active projects were presented to the board in 2017.
Our review also found that the IDA does not have a written contract with its legal counsel, that conflicts
of interest are not adequately identified and addressed, and that although the IDA hired a contractor to
verify the accuracy of data submitted in the Public Authorities Reporting Information System (PARIS) the
IDA reported incorrect data in its annual PARIS submissions. Our report recommends that IDA and CDC
board members attend board member refresher training.
Board Member Training Compliance: In April 2017, the ABO issued compliance review GR-2017-01 –
Board Member Training Compliance. At that time, 234 board members representing 98 authorities had
not attended state approved board member training, as required by Public Authorities Law Section
2824(2). In March 2019, the ABO revisited the training status of the board members of the 98 authorities.
Of the 234 board members, 135 board members continued to serve on the respective authority yet 72 of
the board members (53 percent) still had not attended the required training.
Authorities Budget Office 8
2019 Annual Report on Public Authorities in New York State
Pursuant to Section 6(2)(f) of Title 2 of Public Authorities Law, the ABO may publicly warn any authority
for non-compliance. In accordance with this provision, the ABO issued individual warning letters to each
of the 72 board members due to their lack of compliance with Section 2824(2) of Public Authorities Law,
stipulating that the board member attend state approved board member training by August 1, 2019 or
face further action. As of this report, 33 board members subsequently attended board member training
while 39 board members still have not attended board member training and remain out of compliance. If
no action is taken by the 39 board members by August 1, the ABO will commence action to notify each
board member’s appointing authority and recommend their removal from the Authority’s board of
directors. The ABO is continuing to monitor board member compliance and will be reporting on the
actions taken subsequent to August 1.
Special Report
Activities and Status as a Local Authority – Orange County Partnership, Inc.: This cumulative report is on
activities of the Orange County Partnership Inc. (hereinafter “the Partnership” or “OCP”). The Partnership,
which was determined to be a local authority in December 2011 and has been on the Authorities Budget
Office (“ABO”) delinquency list since that time, takes extraordinary actions to evade the statutory
transparency requirements of a local authority. The financial support from both the County and the
Orange County IDA (“OC IDA”) since 2006 totals more than $6.7 million and that is only a portion of the
complete public support. Rather than serve as a model for economic development public-private
partnerships, OCP contorts its form to evade the transparency rules of a local authority. OCP remains the
economic development authority for Orange County, NY (the “County”).
After a prolonged period of defiance by the Partnership and rounds of litigation between the Partnership
and the ABO, in December 2018, the State Supreme Court in Orange County ordered the Partnership to
file its required governance and financial reports with the ABO database, the Public Authorities Reporting
Information System (“PARIS”). The Court also ordered OCP to provide the ABO with responses to any
other reasonable requests for information that would allow ABO to understand the Partnership’s
corporate status as a local authority; and, upon completion of these conditions, the ABO would reassess
the status of OCP and make a new determination on the Partnership’s current 2019 status.
The ABO reviewed OCP’s PARIS filings and public records to determine its corporate and financial activities
as required by the Public Authorities Accountability Act of 2005 (“PAAA”), the Public Authorities Reform
Act of 2009 (“PARA”), and the Order issued by Supreme Court, Orange County, and determined that
Orange County Partnership Inc. remains a local authority as it was created by Orange County and the OC
IDA. OCP further has remained sponsored by and affiliated with these and other municipalities’ IDAs and
other public entities between 1985 and 2019.
OCP insists that it is a wholly private corporation working outside the jurisdiction of the ABO, however
this is not accurate. The ABO staff reviewed the records and report on OCP’s compliance under the
Authorities Budget Office 9
2019 Annual Report on Public Authorities in New York State
meaning of Public Authorities Law. Ascribing the plain and ordinary meaning to those terms in the law,
OCP meets the definition and qualifies as a “local authority” for purposes of the statute. This analysis can
serve as a guide for other not-for-profit corporations doing public service in New York State.
Public Authorities Spending 2014 – 2018
The data presented in the following tables is as reported by the public authorities in the Public Authorities
Reporting Information System (PARIS), and while certified not all data is confirmed to be accurate.
Through a quality assurance process the ABO may have requested a public authority to make corrections
to the data reported, but the ABO itself does not change or correct any information that is submitted.
The following tables include state and local authorities that filed at least one referenced report for the
2014-2018 reporting periods.
Authority Operating Expenses
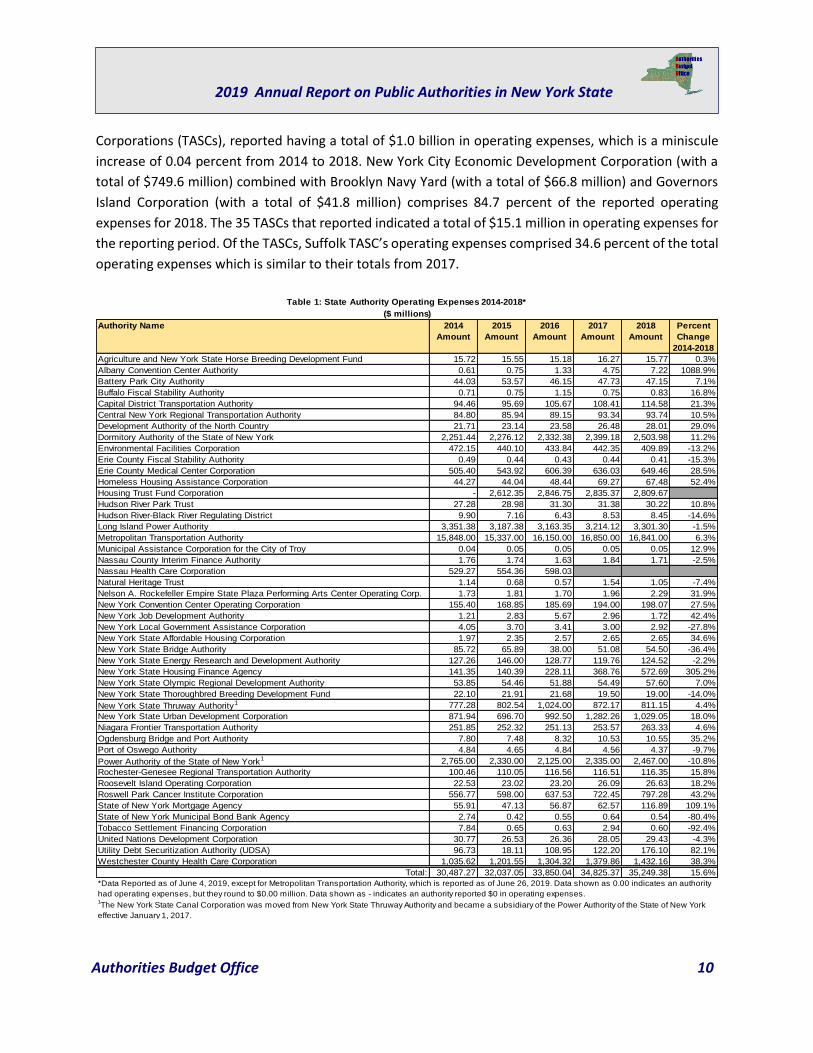
State authority operating expenses for 2018 were $35.2 billion, an increase of 15.6 percent between 2014
and 2018 as Table 1 indicates. The majority of the increase was driven by the Housing Trust Fund
Corporation, which increased $2.8 billion across the same time period. The Metropolitan Transportation
Authority also reported a $993.0 million increase over the 5 years. This table does not include data from
Nassau Health Care Corporation as they have not filed their fiscal year end 2017 or 2018 reports.
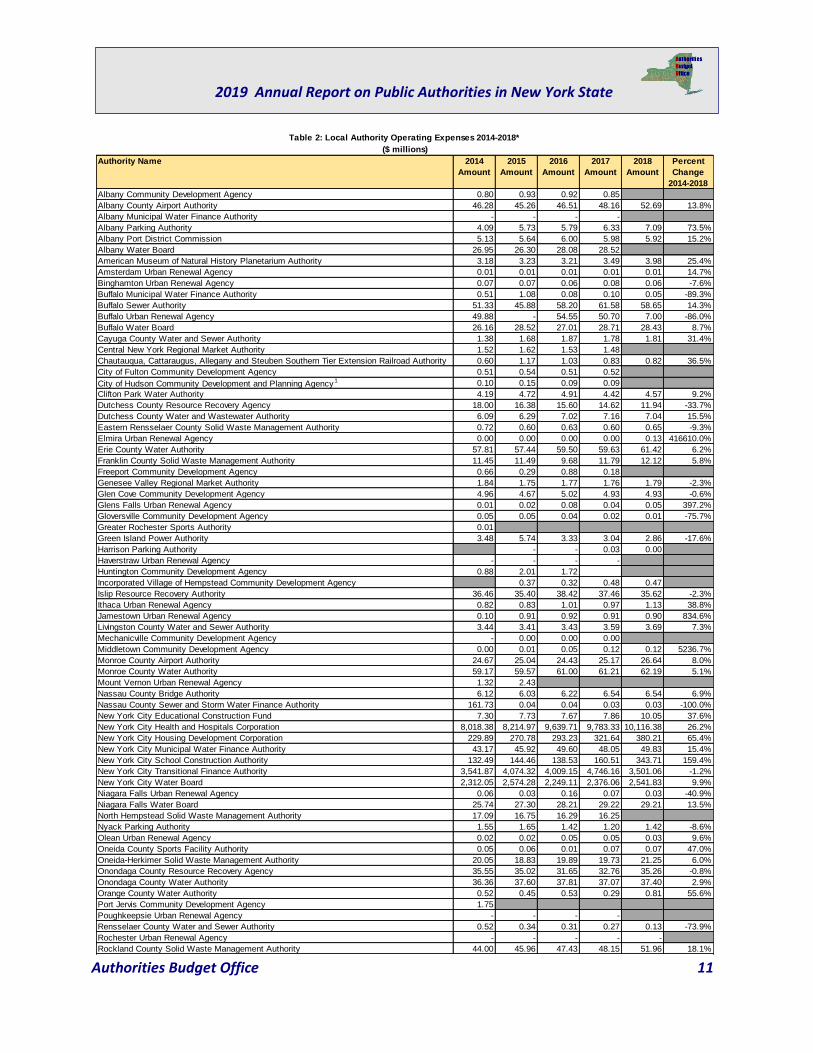
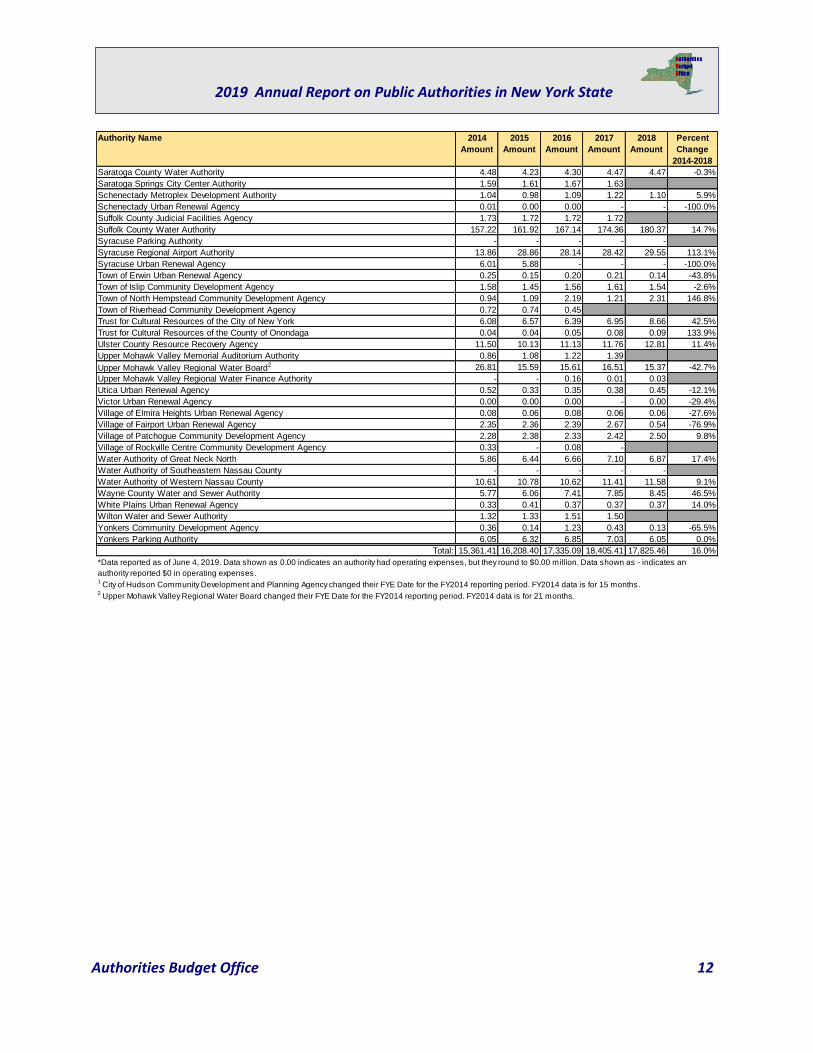
Table 2 shows that local authorities in total reported $17.8 billion in operating expenses for 2018, a 16.0
percent increase from 2014 to 2018. This is mainly due to the New York City Health and Hospitals
Corporation having an increase of $2.1 billion (26.2 percent) over this period. The overall increase would
likely have been even larger, since 24 of the 102 local authorities did not file their reports by the time this
report was issued.
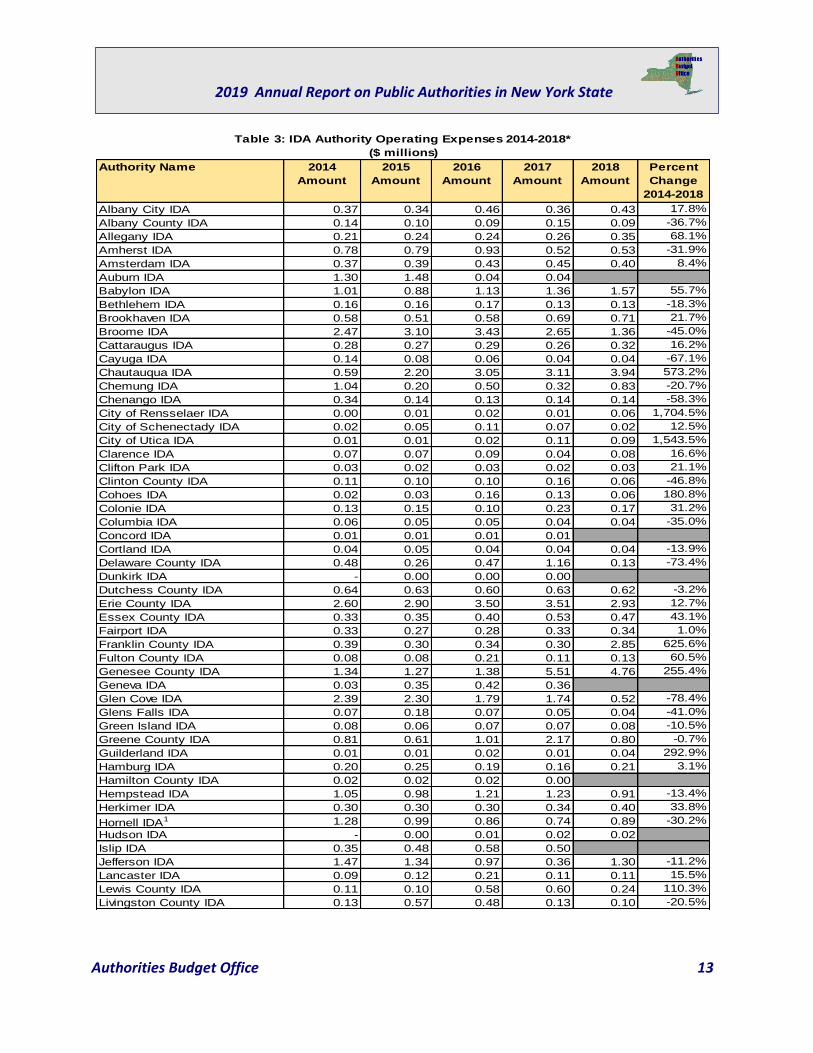
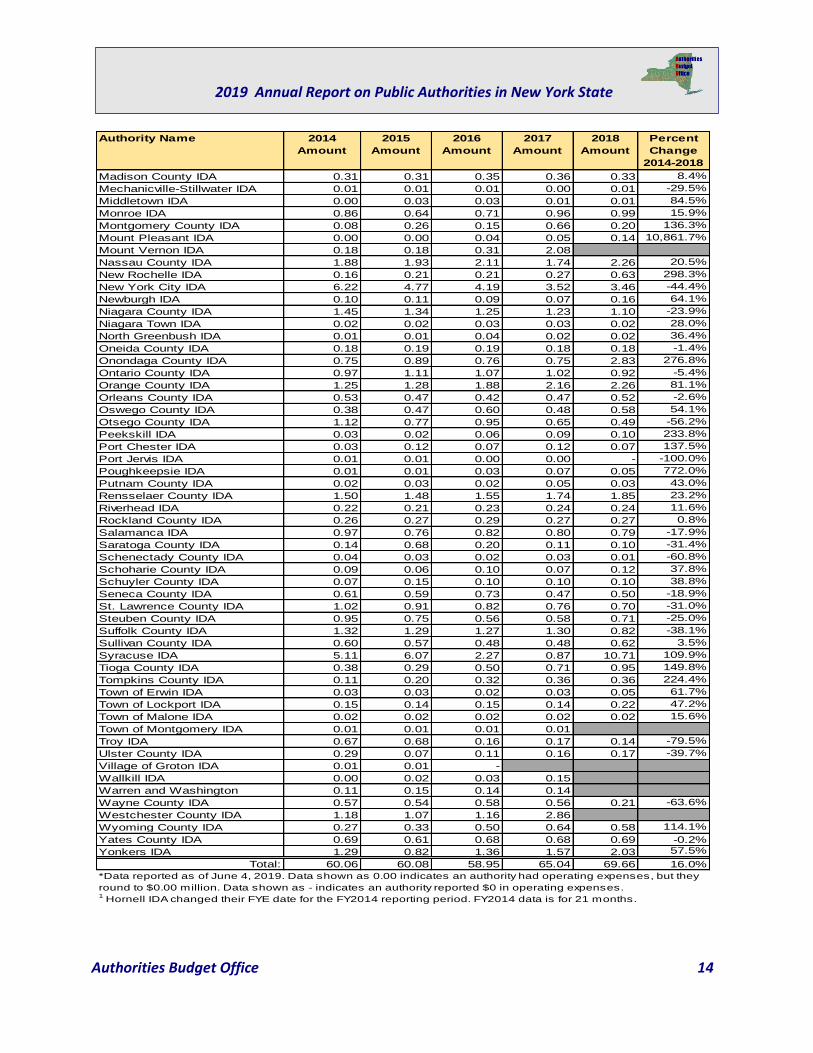
Industrial development agencies (IDAs) reported $69.7 million in operating expenses for 2018 as shown
in Table 3, a 16.0 percent increase from 2014 to 2018. This overall increase was mainly due to Syracuse
IDA increasing $5.6 million (109.9 percent) from 2014 to 2018, as well as Chautauqua IDA increasing by
$3.4 million (573.2 percent) across the same period. Other notable increases included Genesee County
IDA increasing $3.4 million (255.4 percent) and Franklin County IDA increasing $2.5 million (625.6
percent).
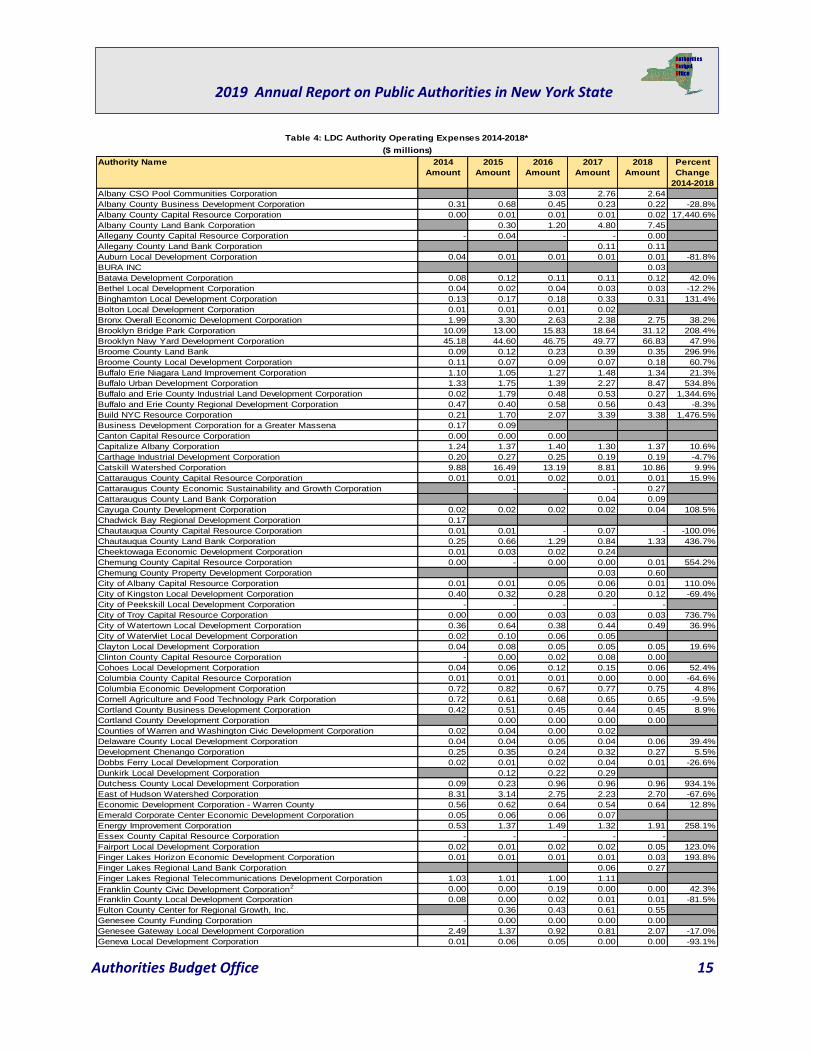
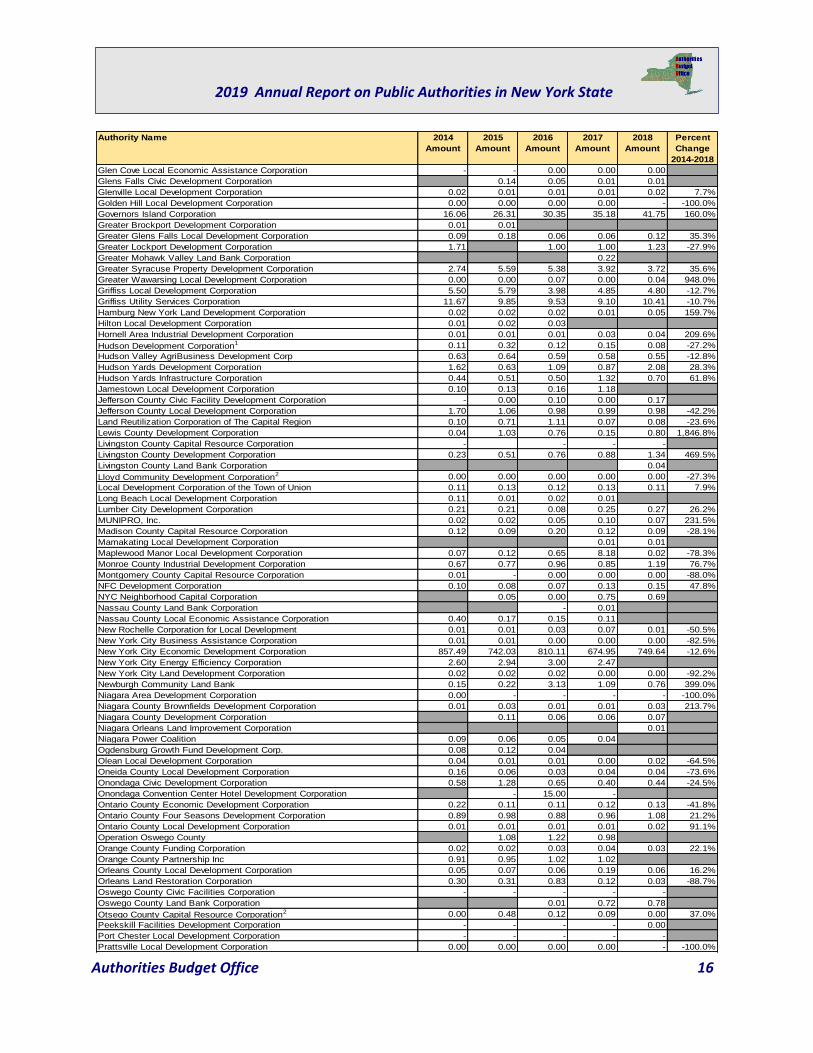
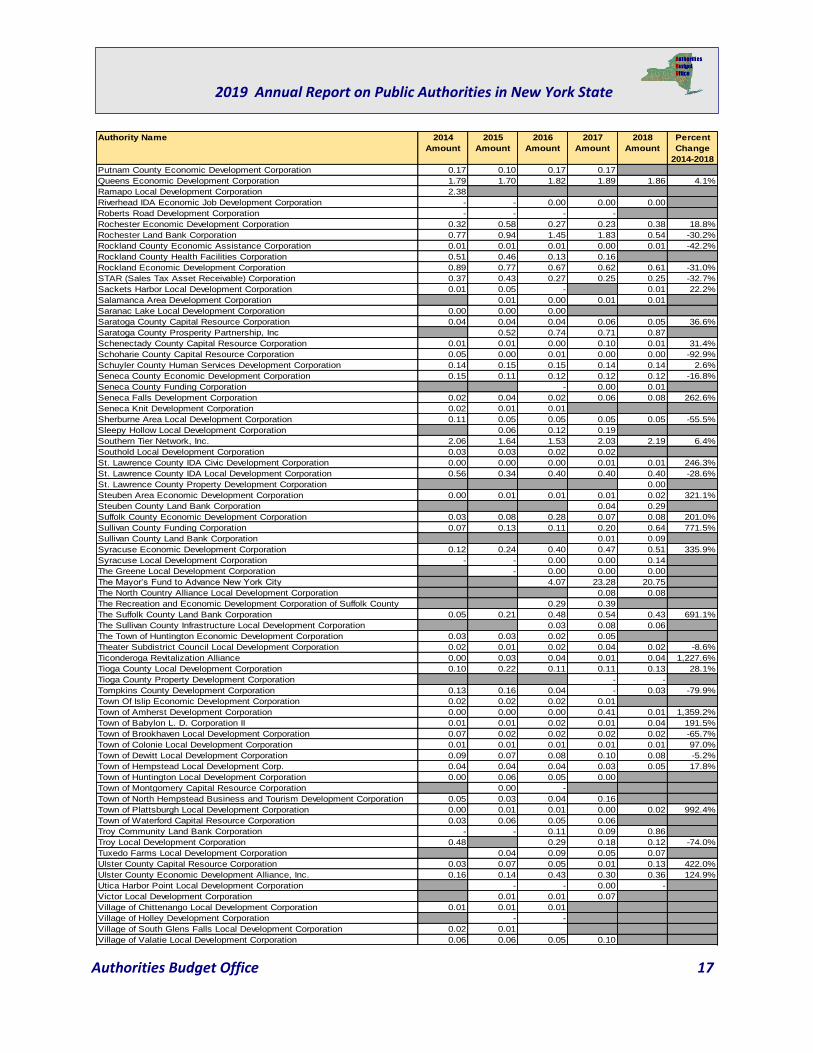
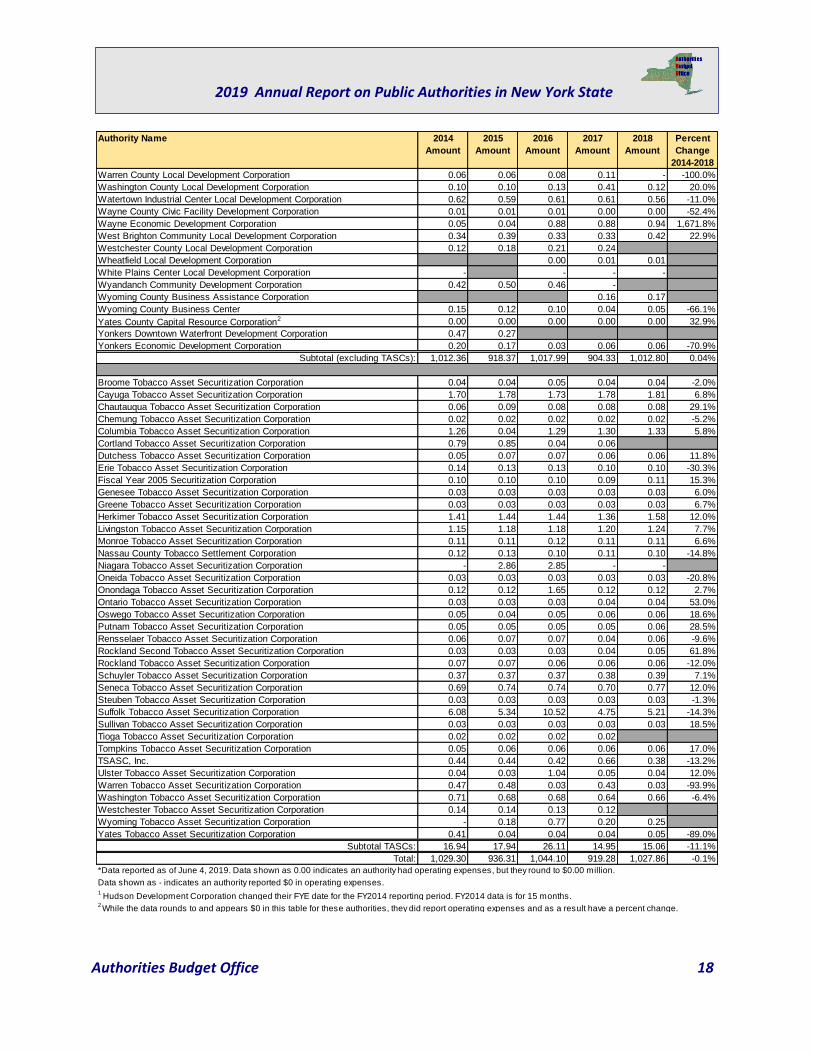
The ABO uses “local development corporation (LDC)” as a generic term to include not-for-profit
corporations that meet the definition of a local authority in accordance with Section 2 of Public Authorities
Law. Table 4 indicates that for 2018, a total of 185 LDCs, excluding Tobacco Asset Securitization
Authorities Budget Office 10
2019 Annual Report on Public Authorities in New York State
Corporations (TASCs), reported having a total of $1.0 billion in operating expenses, which is a miniscule
increase of 0.04 percent from 2014 to 2018. New York City Economic Development Corporation (with a
total of $749.6 million) combined with Brooklyn Navy Yard (with a total of $66.8 million) and Governors
Island Corporation (with a total of $41.8 million) comprises 84.7 percent of the reported operating
expenses for 2018. The 35 TASCs that reported indicated a total of $15.1 million in operating expenses for
the reporting period. Of the TASCs, Suffolk TASC’s operating expenses comprised 34.6 percent of the total
operating expenses which is similar to their totals from 2017.
Authority Name 2014
Amount
2015
Amount
2016
Amount
2017
Amount
2018
Amount
Percent
Change
2014-2018
Agriculture and New York State Horse Breeding Development Fund 15.72 15.55 15.18 16.27 15.77 0.3%
Albany Convention Center Authority 0.61 0.75 1.33 4.75 7.22 1088.9%
Battery Park City Authority 44.03 53.57 46.15 47.73 47.15 7.1%
Buffalo Fiscal Stability Authority 0.71 0.75 1.15 0.75 0.83 16.8%
Capital District Transportation Authority 94.46 95.69 105.67 108.41 114.58 21.3%
Central New York Regional Transportation Authority 84.80 85.94 89.15 93.34 93.74 10.5%
Development Authority of the North Country 21.71 23.14 23.58 26.48 28.01 29.0%
Dormitory Authority of the State of New York 2,251.44 2,276.12 2,332.38 2,399.18 2,503.98 11.2%
Environmental Facilities Corporation 472.15 440.10 433.84 442.35 409.89 -13.2%
Erie County Fiscal Stability Authority 0.49 0.44 0.43 0.44 0.41 -15.3%
Erie County Medical Center Corporation 505.40 543.92 606.39 636.03 649.46 28.5%
Homeless Housing Assistance Corporation 44.27 44.04 48.44 69.27 67.48 52.4%
Housing Trust Fund Corporation - 2,612.35 2,846.75 2,835.37 2,809.67
Hudson River Park Trust 27.28 28.98 31.30 31.38 30.22 10.8%
Hudson River-Black River Regulating District 9.90 7.16 6.43 8.53 8.45 -14.6%
Long Island Power Authority 3,351.38 3,187.38 3,163.35 3,214.12 3,301.30 -1.5%
Metropolitan Transportation Authority 15,848.00 15,337.00 16,150.00 16,850.00 16,841.00 6.3%
Municipal Assistance Corporation for the City of Troy 0.04 0.05 0.05 0.05 0.05 12.9%
Nassau County Interim Finance Authority 1.76 1.74 1.63 1.84 1.71 -2.5%
Nassau Health Care Corporation 529.27 554.36 598.03
Natural Heritage Trust 1.14 0.68 0.57 1.54 1.05 -7.4%
Nelson A. Rockefeller Empire State Plaza Performing Arts Center Operating Corp. 1.73 1.81 1.70 1.96 2.29 31.9%
New York Convention Center Operating Corporation 155.40 168.85 185.69 194.00 198.07 27.5%
New York Job Development Authority 1.21 2.83 5.67 2.96 1.72 42.4%
New York Local Government Assistance Corporation 4.05 3.70 3.41 3.00 2.92 -27.8%
New York State Affordable Housing Corporation 1.97 2.35 2.57 2.65 2.65 34.6%
New York State Bridge Authority 85.72 65.89 38.00 51.08 54.50 -36.4%
New York State Energy Research and Development Authority 127.26 146.00 128.77 119.76 124.52 -2.2%
New York State Housing Finance Agency 141.35 140.39 228.11 368.76 572.69 305.2%
New York State Olympic Regional Development Authority 53.85 54.46 51.88 54.49 57.60 7.0%
New York State Thoroughbred Breeding Development Fund 22.10 21.91 21.68 19.50 19.00 -14.0%
New York State Thruway Authority1 777.28 802.54 1,024.00 872.17 811.15 4.4%
New York State Urban Development Corporation 871.94 696.70 992.50 1,282.26 1,029.05 18.0%
Niagara Frontier Transportation Authority 251.85 252.32 251.13 253.57 263.33 4.6%
Ogdensburg Bridge and Port Authority 7.80 7.48 8.32 10.53 10.55 35.2%
Port of Oswego Authority 4.84 4.65 4.84 4.56 4.37 -9.7%
Power Authority of the State of New York1 2,765.00 2,330.00 2,125.00 2,335.00 2,467.00 -10.8%
Rochester-Genesee Regional Transportation Authority 100.46 110.05 116.56 116.51 116.35 15.8%
Roosevelt Island Operating Corporation 22.53 23.02 23.20 26.09 26.63 18.2%
Roswell Park Cancer Institute Corporation 556.77 598.00 637.53 722.45 797.28 43.2%
State of New York Mortgage Agency 55.91 47.13 56.87 62.57 116.89 109.1%
State of New York Municipal Bond Bank Agency 2.74 0.42 0.55 0.64 0.54 -80.4%
Tobacco Settlement Financing Corporation 7.84 0.65 0.63 2.94 0.60 -92.4%
United Nations Development Corporation 30.77 26.53 26.36 28.05 29.43 -4.3%
Utility Debt Securitization Authority (UDSA) 96.73 18.11 108.95 122.20 176.10 82.1%
Westchester County Health Care Corporation 1,035.62 1,201.55 1,304.32 1,379.86 1,432.16 38.3%
Total: 30,487.27 32,037.05 33,850.04 34,825.37 35,249.38 15.6%
Table 1: State Authority Operating Expenses 2014-2018*
($ millions)
*Data Reported as of June 4, 2019, except for Metropolitan Transportation Authority, which is reported as of June 26, 2019. Data shown as 0.00 indicates an authority
had operating expenses, but they round to $0.00 million. Data shown as - indicates an authority reported $0 in operating expenses.1The New York State Canal Corporation was moved from New York State Thruway Authority and became a subsidiary of the Power Authority of the State of New York
effective January 1, 2017.
Authorities Budget Office 11
2019 Annual Report on Public Authorities in New York State
Authority Name 2014
Amount
2015
Amount
2016
Amount
2017
Amount
2018
Amount
Percent
Change
2014-2018
Albany Community Development Agency 0.80 0.93 0.92 0.85
Albany County Airport Authority 46.28 45.26 46.51 48.16 52.69 13.8%
Albany Municipal Water Finance Authority - - - -
Albany Parking Authority 4.09 5.73 5.79 6.33 7.09 73.5%
Albany Port District Commission 5.13 5.64 6.00 5.98 5.92 15.2%
Albany Water Board 26.95 26.30 28.08 28.52
American Museum of Natural History Planetarium Authority 3.18 3.23 3.21 3.49 3.98 25.4%
Amsterdam Urban Renewal Agency 0.01 0.01 0.01 0.01 0.01 14.7%
Binghamton Urban Renewal Agency 0.07 0.07 0.06 0.08 0.06 -7.6%
Buffalo Municipal Water Finance Authority 0.51 1.08 0.08 0.10 0.05 -89.3%
Buffalo Sewer Authority 51.33 45.88 58.20 61.58 58.65 14.3%
Buffalo Urban Renewal Agency 49.88 - 54.55 50.70 7.00 -86.0%
Buffalo Water Board 26.16 28.52 27.01 28.71 28.43 8.7%
Cayuga County Water and Sewer Authority 1.38 1.68 1.87 1.78 1.81 31.4%
Central New York Regional Market Authority 1.52 1.62 1.53 1.48
Chautauqua, Cattaraugus, Allegany and Steuben Southern Tier Extension Railroad Authority 0.60 1.17 1.03 0.83 0.82 36.5%
City of Fulton Community Development Agency 0.51 0.54 0.51 0.52
City of Hudson Community Development and Planning Agency1 0.10 0.15 0.09 0.09
Clifton Park Water Authority 4.19 4.72 4.91 4.42 4.57 9.2%
Dutchess County Resource Recovery Agency 18.00 16.38 15.60 14.62 11.94 -33.7%
Dutchess County Water and Wastewater Authority 6.09 6.29 7.02 7.16 7.04 15.5%
Eastern Rensselaer County Solid Waste Management Authority 0.72 0.60 0.63 0.60 0.65 -9.3%
Elmira Urban Renewal Agency 0.00 0.00 0.00 0.00 0.13 416610.0%
Erie County Water Authority 57.81 57.44 59.50 59.63 61.42 6.2%
Franklin County Solid Waste Management Authority 11.45 11.49 9.68 11.79 12.12 5.8%
Freeport Community Development Agency 0.66 0.29 0.88 0.18
Genesee Valley Regional Market Authority 1.84 1.75 1.77 1.76 1.79 -2.3%
Glen Cove Community Development Agency 4.96 4.67 5.02 4.93 4.93 -0.6%
Glens Falls Urban Renewal Agency 0.01 0.02 0.08 0.04 0.05 397.2%
Gloversville Community Development Agency 0.05 0.05 0.04 0.02 0.01 -75.7%
Greater Rochester Sports Authority 0.01
Green Island Power Authority 3.48 5.74 3.33 3.04 2.86 -17.6%
Harrison Parking Authority - - 0.03 0.00
Haverstraw Urban Renewal Agency - - - -
Huntington Community Development Agency 0.88 2.01 1.72
Incorporated Village of Hempstead Community Development Agency 0.37 0.32 0.48 0.47
Islip Resource Recovery Authority 36.46 35.40 38.42 37.46 35.62 -2.3%
Ithaca Urban Renewal Agency 0.82 0.83 1.01 0.97 1.13 38.8%
Jamestown Urban Renewal Agency 0.10 0.91 0.92 0.91 0.90 834.6%
Livingston County Water and Sewer Authority 3.44 3.41 3.43 3.59 3.69 7.3%
Mechanicville Community Development Agency - 0.00 0.00 0.00
Middletown Community Development Agency 0.00 0.01 0.05 0.12 0.12 5236.7%
Monroe County Airport Authority 24.67 25.04 24.43 25.17 26.64 8.0%
Monroe County Water Authority 59.17 59.57 61.00 61.21 62.19 5.1%
Mount Vernon Urban Renewal Agency 1.32 2.43
Nassau County Bridge Authority 6.12 6.03 6.22 6.54 6.54 6.9%
Nassau County Sewer and Storm Water Finance Authority 161.73 0.04 0.04 0.03 0.03 -100.0%
New York City Educational Construction Fund 7.30 7.73 7.67 7.86 10.05 37.6%
New York City Health and Hospitals Corporation 8,018.38 8,214.97 9,639.71 9,783.33 10,116.38 26.2%
New York City Housing Development Corporation 229.89 270.78 293.23 321.64 380.21 65.4%
New York City Municipal Water Finance Authority 43.17 45.92 49.60 48.05 49.83 15.4%
New York City School Construction Authority 132.49 144.46 138.53 160.51 343.71 159.4%
New York City Transitional Finance Authority 3,541.87 4,074.32 4,009.15 4,746.16 3,501.06 -1.2%
New York City Water Board 2,312.05 2,574.28 2,249.11 2,376.06 2,541.83 9.9%
Niagara Falls Urban Renewal Agency 0.06 0.03 0.16 0.07 0.03 -40.9%
Niagara Falls Water Board 25.74 27.30 28.21 29.22 29.21 13.5%
North Hempstead Solid Waste Management Authority 17.09 16.75 16.29 16.25
Nyack Parking Authority 1.55 1.65 1.42 1.20 1.42 -8.6%
Olean Urban Renewal Agency 0.02 0.02 0.05 0.05 0.03 9.6%
Oneida County Sports Facility Authority 0.05 0.06 0.01 0.07 0.07 47.0%
Oneida-Herkimer Solid Waste Management Authority 20.05 18.83 19.89 19.73 21.25 6.0%
Onondaga County Resource Recovery Agency 35.55 35.02 31.65 32.76 35.26 -0.8%
Onondaga County Water Authority 36.36 37.60 37.81 37.07 37.40 2.9%
Orange County Water Authority 0.52 0.45 0.53 0.29 0.81 55.6%
Port Jervis Community Development Agency 1.75
Poughkeepsie Urban Renewal Agency - - - -
Rensselaer County Water and Sewer Authority 0.52 0.34 0.31 0.27 0.13 -73.9%
Rochester Urban Renewal Agency - - - - -
Rockland County Solid Waste Management Authority 44.00 45.96 47.43 48.15 51.96 18.1%
Table 2: Local Authority Operating Expenses 2014-2018*
($ millions)
Authorities Budget Office 12
2019 Annual Report on Public Authorities in New York State
Authority Name 2014
Amount
2015
Amount
2016
Amount
2017
Amount
2018
Amount
Percent
Change
2014-2018
Saratoga County Water Authority 4.48 4.23 4.30 4.47 4.47 -0.3%
Saratoga Springs City Center Authority 1.59 1.61 1.67 1.63
Schenectady Metroplex Development Authority 1.04 0.98 1.09 1.22 1.10 5.9%
Schenectady Urban Renewal Agency 0.01 0.00 0.00 - - -100.0%
Suffolk County Judicial Facilities Agency 1.73 1.72 1.72 1.72
Suffolk County Water Authority 157.22 161.92 167.14 174.36 180.37 14.7%
Syracuse Parking Authority - - - - -
Syracuse Regional Airport Authority 13.86 28.86 28.14 28.42 29.55 113.1%
Syracuse Urban Renewal Agency 6.01 5.88 - - - -100.0%
Town of Erwin Urban Renewal Agency 0.25 0.15 0.20 0.21 0.14 -43.8%
Town of Islip Community Development Agency 1.58 1.45 1.56 1.61 1.54 -2.6%
Town of North Hempstead Community Development Agency 0.94 1.09 2.19 1.21 2.31 146.8%
Town of Riverhead Community Development Agency 0.72 0.74 0.45
Trust for Cultural Resources of the City of New York 6.08 6.57 6.39 6.95 8.66 42.5%
Trust for Cultural Resources of the County of Onondaga 0.04 0.04 0.05 0.08 0.09 133.9%
Ulster County Resource Recovery Agency 11.50 10.13 11.13 11.76 12.81 11.4%
Upper Mohawk Valley Memorial Auditorium Authority 0.86 1.08 1.22 1.39
Upper Mohawk Valley Regional Water Board2 26.81 15.59 15.61 16.51 15.37 -42.7%
Upper Mohawk Valley Regional Water Finance Authority - - 0.16 0.01 0.03
Utica Urban Renewal Agency 0.52 0.33 0.35 0.38 0.45 -12.1%
Victor Urban Renewal Agency 0.00 0.00 0.00 - 0.00 -29.4%
Village of Elmira Heights Urban Renewal Agency 0.08 0.06 0.08 0.06 0.06 -27.6%
Village of Fairport Urban Renewal Agency 2.35 2.36 2.39 2.67 0.54 -76.9%
Village of Patchogue Community Development Agency 2.28 2.38 2.33 2.42 2.50 9.8%
Village of Rockville Centre Community Development Agency 0.33 - 0.08 -
Water Authority of Great Neck North 5.86 6.44 6.66 7.10 6.87 17.4%
Water Authority of Southeastern Nassau County - - - - -
Water Authority of Western Nassau County 10.61 10.78 10.62 11.41 11.58 9.1%
Wayne County Water and Sewer Authority 5.77 6.06 7.41 7.85 8.45 46.5%
White Plains Urban Renewal Agency 0.33 0.41 0.37 0.37 0.37 14.0%
Wilton Water and Sewer Authority 1.32 1.33 1.51 1.50
Yonkers Community Development Agency 0.36 0.14 1.23 0.43 0.13 -65.5%
Yonkers Parking Authority 6.05 6.32 6.85 7.03 6.05 0.0%
Total: 15,361.41 16,208.40 17,335.09 18,405.41 17,825.46 16.0%
*Data reported as of June 4, 2019. Data shown as 0.00 indicates an authority had operating expenses, but they round to $0.00 million. Data shown as - indicates an
authority reported $0 in operating expenses.1 City of Hudson Community Development and Planning Agency changed their FYE Date for the FY2014 reporting period. FY2014 data is for 15 months.
2 Upper Mohawk Valley Regional Water Board changed their FYE Date for the FY2014 reporting period. FY2014 data is for 21 months.
Authorities Budget Office 13
2019 Annual Report on Public Authorities in New York State
Authority Name 2014
Amount
2015
Amount
2016
Amount
2017
Amount
2018
Amount
Percent
Change
2014-2018
Albany City IDA 0.37 0.34 0.46 0.36 0.43 17.8%
Albany County IDA 0.14 0.10 0.09 0.15 0.09 -36.7%
Allegany IDA 0.21 0.24 0.24 0.26 0.35 68.1%
Amherst IDA 0.78 0.79 0.93 0.52 0.53 -31.9%
Amsterdam IDA 0.37 0.39 0.43 0.45 0.40 8.4%
Auburn IDA 1.30 1.48 0.04 0.04
Babylon IDA 1.01 0.88 1.13 1.36 1.57 55.7%
Bethlehem IDA 0.16 0.16 0.17 0.13 0.13 -18.3%
Brookhaven IDA 0.58 0.51 0.58 0.69 0.71 21.7%
Broome IDA 2.47 3.10 3.43 2.65 1.36 -45.0%
Cattaraugus IDA 0.28 0.27 0.29 0.26 0.32 16.2%
Cayuga IDA 0.14 0.08 0.06 0.04 0.04 -67.1%
Chautauqua IDA 0.59 2.20 3.05 3.11 3.94 573.2%
Chemung IDA 1.04 0.20 0.50 0.32 0.83 -20.7%
Chenango IDA 0.34 0.14 0.13 0.14 0.14 -58.3%
City of Rensselaer IDA 0.00 0.01 0.02 0.01 0.06 1,704.5%
City of Schenectady IDA 0.02 0.05 0.11 0.07 0.02 12.5%
City of Utica IDA 0.01 0.01 0.02 0.11 0.09 1,543.5%
Clarence IDA 0.07 0.07 0.09 0.04 0.08 16.6%
Clifton Park IDA 0.03 0.02 0.03 0.02 0.03 21.1%
Clinton County IDA 0.11 0.10 0.10 0.16 0.06 -46.8%
Cohoes IDA 0.02 0.03 0.16 0.13 0.06 180.8%
Colonie IDA 0.13 0.15 0.10 0.23 0.17 31.2%
Columbia IDA 0.06 0.05 0.05 0.04 0.04 -35.0%
Concord IDA 0.01 0.01 0.01 0.01
Cortland IDA 0.04 0.05 0.04 0.04 0.04 -13.9%
Delaware County IDA 0.48 0.26 0.47 1.16 0.13 -73.4%
Dunkirk IDA - 0.00 0.00 0.00
Dutchess County IDA 0.64 0.63 0.60 0.63 0.62 -3.2%
Erie County IDA 2.60 2.90 3.50 3.51 2.93 12.7%
Essex County IDA 0.33 0.35 0.40 0.53 0.47 43.1%
Fairport IDA 0.33 0.27 0.28 0.33 0.34 1.0%
Franklin County IDA 0.39 0.30 0.34 0.30 2.85 625.6%
Fulton County IDA 0.08 0.08 0.21 0.11 0.13 60.5%
Genesee County IDA 1.34 1.27 1.38 5.51 4.76 255.4%
Geneva IDA 0.03 0.35 0.42 0.36
Glen Cove IDA 2.39 2.30 1.79 1.74 0.52 -78.4%
Glens Falls IDA 0.07 0.18 0.07 0.05 0.04 -41.0%
Green Island IDA 0.08 0.06 0.07 0.07 0.08 -10.5%
Greene County IDA 0.81 0.61 1.01 2.17 0.80 -0.7%
Guilderland IDA 0.01 0.01 0.02 0.01 0.04 292.9%
Hamburg IDA 0.20 0.25 0.19 0.16 0.21 3.1%
Hamilton County IDA 0.02 0.02 0.02 0.00
Hempstead IDA 1.05 0.98 1.21 1.23 0.91 -13.4%
Herkimer IDA 0.30 0.30 0.30 0.34 0.40 33.8%
Hornell IDA1 1.28 0.99 0.86 0.74 0.89 -30.2%
Hudson IDA - 0.00 0.01 0.02 0.02
Islip IDA 0.35 0.48 0.58 0.50
Jefferson IDA 1.47 1.34 0.97 0.36 1.30 -11.2%
Lancaster IDA 0.09 0.12 0.21 0.11 0.11 15.5%
Lewis County IDA 0.11 0.10 0.58 0.60 0.24 110.3%
Livingston County IDA 0.13 0.57 0.48 0.13 0.10 -20.5%
Table 3: IDA Authority Operating Expenses 2014-2018*
($ millions)
Authorities Budget Office 14
2019 Annual Report on Public Authorities in New York State
Authority Name 2014
Amount
2015
Amount
2016
Amount
2017
Amount
2018
Amount
Percent
Change
2014-2018
Madison County IDA 0.31 0.31 0.35 0.36 0.33 8.4%
Mechanicville-Stillwater IDA 0.01 0.01 0.01 0.00 0.01 -29.5%
Middletown IDA 0.00 0.03 0.03 0.01 0.01 84.5%
Monroe IDA 0.86 0.64 0.71 0.96 0.99 15.9%
Montgomery County IDA 0.08 0.26 0.15 0.66 0.20 136.3%
Mount Pleasant IDA 0.00 0.00 0.04 0.05 0.14 10,861.7%
Mount Vernon IDA 0.18 0.18 0.31 2.08
Nassau County IDA 1.88 1.93 2.11 1.74 2.26 20.5%
New Rochelle IDA 0.16 0.21 0.21 0.27 0.63 298.3%
New York City IDA 6.22 4.77 4.19 3.52 3.46 -44.4%
Newburgh IDA 0.10 0.11 0.09 0.07 0.16 64.1%
Niagara County IDA 1.45 1.34 1.25 1.23 1.10 -23.9%
Niagara Town IDA 0.02 0.02 0.03 0.03 0.02 28.0%
North Greenbush IDA 0.01 0.01 0.04 0.02 0.02 36.4%
Oneida County IDA 0.18 0.19 0.19 0.18 0.18 -1.4%
Onondaga County IDA 0.75 0.89 0.76 0.75 2.83 276.8%
Ontario County IDA 0.97 1.11 1.07 1.02 0.92 -5.4%
Orange County IDA 1.25 1.28 1.88 2.16 2.26 81.1%
Orleans County IDA 0.53 0.47 0.42 0.47 0.52 -2.6%
Oswego County IDA 0.38 0.47 0.60 0.48 0.58 54.1%
Otsego County IDA 1.12 0.77 0.95 0.65 0.49 -56.2%
Peekskill IDA 0.03 0.02 0.06 0.09 0.10 233.8%
Port Chester IDA 0.03 0.12 0.07 0.12 0.07 137.5%
Port Jervis IDA 0.01 0.01 0.00 0.00 - -100.0%
Poughkeepsie IDA 0.01 0.01 0.03 0.07 0.05 772.0%
Putnam County IDA 0.02 0.03 0.02 0.05 0.03 43.0%
Rensselaer County IDA 1.50 1.48 1.55 1.74 1.85 23.2%
Riverhead IDA 0.22 0.21 0.23 0.24 0.24 11.6%
Rockland County IDA 0.26 0.27 0.29 0.27 0.27 0.8%
Salamanca IDA 0.97 0.76 0.82 0.80 0.79 -17.9%
Saratoga County IDA 0.14 0.68 0.20 0.11 0.10 -31.4%
Schenectady County IDA 0.04 0.03 0.02 0.03 0.01 -60.8%
Schoharie County IDA 0.09 0.06 0.10 0.07 0.12 37.8%
Schuyler County IDA 0.07 0.15 0.10 0.10 0.10 38.8%
Seneca County IDA 0.61 0.59 0.73 0.47 0.50 -18.9%
St. Lawrence County IDA 1.02 0.91 0.82 0.76 0.70 -31.0%
Steuben County IDA 0.95 0.75 0.56 0.58 0.71 -25.0%
Suffolk County IDA 1.32 1.29 1.27 1.30 0.82 -38.1%
Sullivan County IDA 0.60 0.57 0.48 0.48 0.62 3.5%
Syracuse IDA 5.11 6.07 2.27 0.87 10.71 109.9%
Tioga County IDA 0.38 0.29 0.50 0.71 0.95 149.8%
Tompkins County IDA 0.11 0.20 0.32 0.36 0.36 224.4%
Town of Erwin IDA 0.03 0.03 0.02 0.03 0.05 61.7%
Town of Lockport IDA 0.15 0.14 0.15 0.14 0.22 47.2%
Town of Malone IDA 0.02 0.02 0.02 0.02 0.02 15.6%
Town of Montgomery IDA 0.01 0.01 0.01 0.01
Troy IDA 0.67 0.68 0.16 0.17 0.14 -79.5%
Ulster County IDA 0.29 0.07 0.11 0.16 0.17 -39.7%
Village of Groton IDA 0.01 0.01 -
Wallkill IDA 0.00 0.02 0.03 0.15
Warren and Washington 0.11 0.15 0.14 0.14
Wayne County IDA 0.57 0.54 0.58 0.56 0.21 -63.6%
Westchester County IDA 1.18 1.07 1.16 2.86
Wyoming County IDA 0.27 0.33 0.50 0.64 0.58 114.1%
Yates County IDA 0.69 0.61 0.68 0.68 0.69 -0.2%
Yonkers IDA 1.29 0.82 1.36 1.57 2.03 57.5%
Total: 60.06 60.08 58.95 65.04 69.66 16.0%
1 Hornell IDA changed their FYE date for the FY2014 reporting period. FY2014 data is for 21 months.
*Data reported as of June 4, 2019. Data shown as 0.00 indicates an authority had operating expenses, but they
round to $0.00 million. Data shown as - indicates an authority reported $0 in operating expenses.
Authorities Budget Office 15
2019 Annual Report on Public Authorities in New York State
Authority Name 2014
Amount
2015
Amount
2016
Amount
2017
Amount
2018
Amount
Percent
Change
2014-2018
Albany CSO Pool Communities Corporation 3.03 2.76 2.64
Albany County Business Development Corporation 0.31 0.68 0.45 0.23 0.22 -28.8%
Albany County Capital Resource Corporation 0.00 0.01 0.01 0.01 0.02 17,440.6%
Albany County Land Bank Corporation 0.30 1.20 4.80 7.45
Allegany County Capital Resource Corporation - 0.04 - - 0.00
Allegany County Land Bank Corporation 0.11 0.11
Auburn Local Development Corporation 0.04 0.01 0.01 0.01 0.01 -81.8%
BURA INC 0.03
Batavia Development Corporation 0.08 0.12 0.11 0.11 0.12 42.0%
Bethel Local Development Corporation 0.04 0.02 0.04 0.03 0.03 -12.2%
Binghamton Local Development Corporation 0.13 0.17 0.18 0.33 0.31 131.4%
Bolton Local Development Corporation 0.01 0.01 0.01 0.02
Bronx Overall Economic Development Corporation 1.99 3.30 2.63 2.38 2.75 38.2%
Brooklyn Bridge Park Corporation 10.09 13.00 15.83 18.64 31.12 208.4%
Brooklyn Navy Yard Development Corporation 45.18 44.60 46.75 49.77 66.83 47.9%
Broome County Land Bank 0.09 0.12 0.23 0.39 0.35 296.9%
Broome County Local Development Corporation 0.11 0.07 0.09 0.07 0.18 60.7%
Buffalo Erie Niagara Land Improvement Corporation 1.10 1.05 1.27 1.48 1.34 21.3%
Buffalo Urban Development Corporation 1.33 1.75 1.39 2.27 8.47 534.8%
Buffalo and Erie County Industrial Land Development Corporation 0.02 1.79 0.48 0.53 0.27 1,344.6%
Buffalo and Erie County Regional Development Corporation 0.47 0.40 0.58 0.56 0.43 -8.3%
Build NYC Resource Corporation 0.21 1.70 2.07 3.39 3.38 1,476.5%
Business Development Corporation for a Greater Massena 0.17 0.09
Canton Capital Resource Corporation 0.00 0.00 0.00
Capitalize Albany Corporation 1.24 1.37 1.40 1.30 1.37 10.6%
Carthage Industrial Development Corporation 0.20 0.27 0.25 0.19 0.19 -4.7%
Catskill Watershed Corporation 9.88 16.49 13.19 8.81 10.86 9.9%
Cattaraugus County Capital Resource Corporation 0.01 0.01 0.02 0.01 0.01 15.9%
Cattaraugus County Economic Sustainability and Growth Corporation - - - 0.27
Cattaraugus County Land Bank Corporation 0.04 0.09
Cayuga County Development Corporation 0.02 0.02 0.02 0.02 0.04 108.5%
Chadwick Bay Regional Development Corporation 0.17
Chautauqua County Capital Resource Corporation 0.01 0.01 - 0.07 - -100.0%
Chautauqua County Land Bank Corporation 0.25 0.66 1.29 0.84 1.33 436.7%
Cheektowaga Economic Development Corporation 0.01 0.03 0.02 0.24
Chemung County Capital Resource Corporation 0.00 - 0.00 0.00 0.01 554.2%
Chemung County Property Development Corporation 0.03 0.60
City of Albany Capital Resource Corporation 0.01 0.01 0.05 0.06 0.01 110.0%
City of Kingston Local Development Corporation 0.40 0.32 0.28 0.20 0.12 -69.4%
City of Peekskill Local Development Corporation - - - - -
City of Troy Capital Resource Corporation 0.00 0.00 0.03 0.03 0.03 736.7%
City of Watertown Local Development Corporation 0.36 0.64 0.38 0.44 0.49 36.9%
City of Watervliet Local Development Corporation 0.02 0.10 0.06 0.05
Clayton Local Development Corporation 0.04 0.08 0.05 0.05 0.05 19.6%
Clinton County Capital Resource Corporation - 0.00 0.02 0.08 0.00
Cohoes Local Development Corporation 0.04 0.06 0.12 0.15 0.06 52.4%
Columbia County Capital Resource Corporation 0.01 0.01 0.01 0.00 0.00 -64.6%
Columbia Economic Development Corporation 0.72 0.82 0.67 0.77 0.75 4.8%
Cornell Agriculture and Food Technology Park Corporation 0.72 0.61 0.68 0.65 0.65 -9.5%
Cortland County Business Development Corporation 0.42 0.51 0.45 0.44 0.45 8.9%
Cortland County Development Corporation 0.00 0.00 0.00 0.00
Counties of Warren and Washington Civic Development Corporation 0.02 0.04 0.00 0.02
Delaware County Local Development Corporation 0.04 0.04 0.05 0.04 0.06 39.4%
Development Chenango Corporation 0.25 0.35 0.24 0.32 0.27 5.5%
Dobbs Ferry Local Development Corporation 0.02 0.01 0.02 0.04 0.01 -26.6%
Dunkirk Local Development Corporation 0.12 0.22 0.29
Dutchess County Local Development Corporation 0.09 0.23 0.96 0.96 0.96 934.1%
East of Hudson Watershed Corporation 8.31 3.14 2.75 2.23 2.70 -67.6%
Economic Development Corporation - Warren County 0.56 0.62 0.64 0.54 0.64 12.8%
Emerald Corporate Center Economic Development Corporation 0.05 0.06 0.06 0.07
Energy Improvement Corporation 0.53 1.37 1.49 1.32 1.91 258.1%
Essex County Capital Resource Corporation - - - - -
Fairport Local Development Corporation 0.02 0.01 0.02 0.02 0.05 123.0%
Finger Lakes Horizon Economic Development Corporation 0.01 0.01 0.01 0.01 0.03 193.8%
Finger Lakes Regional Land Bank Corporation 0.06 0.27
Finger Lakes Regional Telecommunications Development Corporation 1.03 1.01 1.00 1.11
Franklin County Civic Development Corporation2 0.00 0.00 0.19 0.00 0.00 42.3%
Franklin County Local Development Corporation 0.08 0.00 0.02 0.01 0.01 -81.5%
Fulton County Center for Regional Growth, Inc. 0.36 0.43 0.61 0.55
Genesee County Funding Corporation - 0.00 0.00 0.00 0.00
Genesee Gateway Local Development Corporation 2.49 1.37 0.92 0.81 2.07 -17.0%
Geneva Local Development Corporation 0.01 0.06 0.05 0.00 0.00 -93.1%
Table 4: LDC Authority Operating Expenses 2014-2018*
($ millions)
Authorities Budget Office 16
2019 Annual Report on Public Authorities in New York State
Authority Name 2014
Amount
2015
Amount
2016
Amount
2017
Amount
2018
Amount
Percent
Change
2014-2018
Glen Cove Local Economic Assistance Corporation - - 0.00 0.00 0.00
Glens Falls Civic Development Corporation 0.14 0.05 0.01 0.01
Glenville Local Development Corporation 0.02 0.01 0.01 0.01 0.02 7.7%
Golden Hill Local Development Corporation 0.00 0.00 0.00 0.00 - -100.0%
Governors Island Corporation 16.06 26.31 30.35 35.18 41.75 160.0%
Greater Brockport Development Corporation 0.01 0.01
Greater Glens Falls Local Development Corporation 0.09 0.18 0.06 0.06 0.12 35.3%
Greater Lockport Development Corporation 1.71 1.00 1.00 1.23 -27.9%
Greater Mohawk Valley Land Bank Corporation 0.22
Greater Syracuse Property Development Corporation 2.74 5.59 5.38 3.92 3.72 35.6%
Greater Wawarsing Local Development Corporation 0.00 0.00 0.07 0.00 0.04 948.0%
Griffiss Local Development Corporation 5.50 5.79 3.98 4.85 4.80 -12.7%
Griffiss Utility Services Corporation 11.67 9.85 9.53 9.10 10.41 -10.7%
Hamburg New York Land Development Corporation 0.02 0.02 0.02 0.01 0.05 159.7%
Hilton Local Development Corporation 0.01 0.02 0.03
Hornell Area Industrial Development Corporation 0.01 0.01 0.01 0.03 0.04 209.6%
Hudson Development Corporation1 0.11 0.32 0.12 0.15 0.08 -27.2%
Hudson Valley AgriBusiness Development Corp 0.63 0.64 0.59 0.58 0.55 -12.8%
Hudson Yards Development Corporation 1.62 0.63 1.09 0.87 2.08 28.3%
Hudson Yards Infrastructure Corporation 0.44 0.51 0.50 1.32 0.70 61.8%
Jamestown Local Development Corporation 0.10 0.13 0.16 1.18
Jefferson County Civic Facility Development Corporation - 0.00 0.10 0.00 0.17
Jefferson County Local Development Corporation 1.70 1.06 0.98 0.99 0.98 -42.2%
Land Reutilization Corporation of The Capital Region 0.10 0.71 1.11 0.07 0.08 -23.6%
Lewis County Development Corporation 0.04 1.03 0.76 0.15 0.80 1,846.8%
Livingston County Capital Resource Corporation - - - -
Livingston County Development Corporation 0.23 0.51 0.76 0.88 1.34 469.5%
Livingston County Land Bank Corporation 0.04
Lloyd Community Development Corporation2 0.00 0.00 0.00 0.00 0.00 -27.3%
Local Development Corporation of the Town of Union 0.11 0.13 0.12 0.13 0.11 7.9%
Long Beach Local Development Corporation 0.11 0.01 0.02 0.01
Lumber City Development Corporation 0.21 0.21 0.08 0.25 0.27 26.2%
MUNIPRO, Inc. 0.02 0.02 0.05 0.10 0.07 231.5%
Madison County Capital Resource Corporation 0.12 0.09 0.20 0.12 0.09 -28.1%
Mamakating Local Development Corporation 0.01 0.01
Maplewood Manor Local Development Corporation 0.07 0.12 0.65 8.18 0.02 -78.3%
Monroe County Industrial Development Corporation 0.67 0.77 0.96 0.85 1.19 76.7%
Montgomery County Capital Resource Corporation 0.01 - 0.00 0.00 0.00 -88.0%
NFC Development Corporation 0.10 0.08 0.07 0.13 0.15 47.8%
NYC Neighborhood Capital Corporation 0.05 0.00 0.75 0.69
Nassau County Land Bank Corporation - 0.01
Nassau County Local Economic Assistance Corporation 0.40 0.17 0.15 0.11
New Rochelle Corporation for Local Development 0.01 0.01 0.03 0.07 0.01 -50.5%
New York City Business Assistance Corporation 0.01 0.01 0.00 0.00 0.00 -82.5%
New York City Economic Development Corporation 857.49 742.03 810.11 674.95 749.64 -12.6%
New York City Energy Efficiency Corporation 2.60 2.94 3.00 2.47
New York City Land Development Corporation 0.02 0.02 0.02 0.00 0.00 -92.2%
Newburgh Community Land Bank 0.15 0.22 3.13 1.09 0.76 399.0%
Niagara Area Development Corporation 0.00 - - - - -100.0%
Niagara County Brownfields Development Corporation 0.01 0.03 0.01 0.01 0.03 213.7%
Niagara County Development Corporation 0.11 0.06 0.06 0.07
Niagara Orleans Land Improvement Corporation 0.01
Niagara Power Coalition 0.09 0.06 0.05 0.04
Ogdensburg Growth Fund Development Corp. 0.08 0.12 0.04
Olean Local Development Corporation 0.04 0.01 0.01 0.00 0.02 -64.5%
Oneida County Local Development Corporation 0.16 0.06 0.03 0.04 0.04 -73.6%
Onondaga Civic Development Corporation 0.58 1.28 0.65 0.40 0.44 -24.5%
Onondaga Convention Center Hotel Development Corporation - 15.00 -
Ontario County Economic Development Corporation 0.22 0.11 0.11 0.12 0.13 -41.8%
Ontario County Four Seasons Development Corporation 0.89 0.98 0.88 0.96 1.08 21.2%
Ontario County Local Development Corporation 0.01 0.01 0.01 0.01 0.02 91.1%
Operation Oswego County 1.08 1.22 0.98
Orange County Funding Corporation 0.02 0.02 0.03 0.04 0.03 22.1%
Orange County Partnership Inc 0.91 0.95 1.02 1.02
Orleans County Local Development Corporation 0.05 0.07 0.06 0.19 0.06 16.2%
Orleans Land Restoration Corporation 0.30 0.31 0.83 0.12 0.03 -88.7%
Oswego County Civic Facilities Corporation - - - - -
Oswego County Land Bank Corporation 0.01 0.72 0.78
Otsego County Capital Resource Corporation2 0.00 0.48 0.12 0.09 0.00 37.0%
Peekskill Facilities Development Corporation - - - - 0.00
Port Chester Local Development Corporation - - - - -
Prattsville Local Development Corporation 0.00 0.00 0.00 0.00 - -100.0%
Authorities Budget Office 17
2019 Annual Report on Public Authorities in New York State
Authority Name 2014
Amount
2015
Amount
2016
Amount
2017
Amount
2018
Amount
Percent
Change
2014-2018
Putnam County Economic Development Corporation 0.17 0.10 0.17 0.17
Queens Economic Development Corporation 1.79 1.70 1.82 1.89 1.86 4.1%
Ramapo Local Development Corporation 2.38
Riverhead IDA Economic Job Development Corporation - - 0.00 0.00 0.00
Roberts Road Development Corporation - - - -
Rochester Economic Development Corporation 0.32 0.58 0.27 0.23 0.38 18.8%
Rochester Land Bank Corporation 0.77 0.94 1.45 1.83 0.54 -30.2%
Rockland County Economic Assistance Corporation 0.01 0.01 0.01 0.00 0.01 -42.2%
Rockland County Health Facilities Corporation 0.51 0.46 0.13 0.16
Rockland Economic Development Corporation 0.89 0.77 0.67 0.62 0.61 -31.0%
STAR (Sales Tax Asset Receivable) Corporation 0.37 0.43 0.27 0.25 0.25 -32.7%
Sackets Harbor Local Development Corporation 0.01 0.05 - 0.01 22.2%
Salamanca Area Development Corporation 0.01 0.00 0.01 0.01
Saranac Lake Local Development Corporation 0.00 0.00 0.00
Saratoga County Capital Resource Corporation 0.04 0.04 0.04 0.06 0.05 36.6%
Saratoga County Prosperity Partnership, Inc 0.52 0.74 0.71 0.87
Schenectady County Capital Resource Corporation 0.01 0.01 0.00 0.10 0.01 31.4%
Schoharie County Capital Resource Corporation 0.05 0.00 0.01 0.00 0.00 -92.9%
Schuyler County Human Services Development Corporation 0.14 0.15 0.15 0.14 0.14 2.6%
Seneca County Economic Development Corporation 0.15 0.11 0.12 0.12 0.12 -16.8%
Seneca County Funding Corporation - 0.00 0.01
Seneca Falls Development Corporation 0.02 0.04 0.02 0.06 0.08 262.6%
Seneca Knit Development Corporation 0.02 0.01 0.01
Sherburne Area Local Development Corporation 0.11 0.05 0.05 0.05 0.05 -55.5%
Sleepy Hollow Local Development Corporation 0.06 0.12 0.19
Southern Tier Network, Inc. 2.06 1.64 1.53 2.03 2.19 6.4%
Southold Local Development Corporation 0.03 0.03 0.02 0.02
St. Lawrence County IDA Civic Development Corporation 0.00 0.00 0.00 0.01 0.01 246.3%
St. Lawrence County IDA Local Development Corporation 0.56 0.34 0.40 0.40 0.40 -28.6%
St. Lawrence County Property Development Corporation 0.00
Steuben Area Economic Development Corporation 0.00 0.01 0.01 0.01 0.02 321.1%
Steuben County Land Bank Corporation 0.04 0.29
Suffolk County Economic Development Corporation 0.03 0.08 0.28 0.07 0.08 201.0%
Sullivan County Funding Corporation 0.07 0.13 0.11 0.20 0.64 771.5%
Sullivan County Land Bank Corporation 0.01 0.09
Syracuse Economic Development Corporation 0.12 0.24 0.40 0.47 0.51 335.9%
Syracuse Local Development Corporation - - 0.00 0.00 0.14
The Greene Local Development Corporation - 0.00 0.00 0.00
The Mayor’s Fund to Advance New York City 4.07 23.28 20.75
The North Country Alliance Local Development Corporation 0.08 0.08
The Recreation and Economic Development Corporation of Suffolk County 0.29 0.39
The Suffolk County Land Bank Corporation 0.05 0.21 0.48 0.54 0.43 691.1%
The Sullivan County Infrastructure Local Development Corporation 0.03 0.08 0.06
The Town of Huntington Economic Development Corporation 0.03 0.03 0.02 0.05
Theater Subdistrict Council Local Development Corporation 0.02 0.01 0.02 0.04 0.02 -8.6%
Ticonderoga Revitalization Alliance 0.00 0.03 0.04 0.01 0.04 1,227.6%
Tioga County Local Development Corporation 0.10 0.22 0.11 0.11 0.13 28.1%
Tioga County Property Development Corporation - -
Tompkins County Development Corporation 0.13 0.16 0.04 - 0.03 -79.9%
Town Of Islip Economic Development Corporation 0.02 0.02 0.02 0.01
Town of Amherst Development Corporation 0.00 0.00 0.00 0.41 0.01 1,359.2%
Town of Babylon L. D. Corporation II 0.01 0.01 0.02 0.01 0.04 191.5%
Town of Brookhaven Local Development Corporation 0.07 0.02 0.02 0.02 0.02 -65.7%
Town of Colonie Local Development Corporation 0.01 0.01 0.01 0.01 0.01 97.0%
Town of Dewitt Local Development Corporation 0.09 0.07 0.08 0.10 0.08 -5.2%
Town of Hempstead Local Development Corp. 0.04 0.04 0.04 0.03 0.05 17.8%
Town of Huntington Local Development Corporation 0.00 0.06 0.05 0.00
Town of Montgomery Capital Resource Corporation 0.00 -
Town of North Hempstead Business and Tourism Development Corporation 0.05 0.03 0.04 0.16
Town of Plattsburgh Local Development Corporation 0.00 0.01 0.01 0.00 0.02 992.4%
Town of Waterford Capital Resource Corporation 0.03 0.06 0.05 0.06
Troy Community Land Bank Corporation - - 0.11 0.09 0.86
Troy Local Development Corporation 0.48 0.29 0.18 0.12 -74.0%
Tuxedo Farms Local Development Corporation 0.04 0.09 0.05 0.07
Ulster County Capital Resource Corporation 0.03 0.07 0.05 0.01 0.13 422.0%
Ulster County Economic Development Alliance, Inc. 0.16 0.14 0.43 0.30 0.36 124.9%
Utica Harbor Point Local Development Corporation - - 0.00 -
Victor Local Development Corporation 0.01 0.01 0.07
Village of Chittenango Local Development Corporation 0.01 0.01 0.01
Village of Holley Development Corporation - -
Village of South Glens Falls Local Development Corporation 0.02 0.01
Village of Valatie Local Development Corporation 0.06 0.06 0.05 0.10
Authorities Budget Office 18
2019 Annual Report on Public Authorities in New York State
Authority Name 2014
Amount
2015
Amount
2016
Amount
2017
Amount
2018
Amount
Percent
Change
2014-2018
Warren County Local Development Corporation 0.06 0.06 0.08 0.11 - -100.0%
Washington County Local Development Corporation 0.10 0.10 0.13 0.41 0.12 20.0%
Watertown Industrial Center Local Development Corporation 0.62 0.59 0.61 0.61 0.56 -11.0%
Wayne County Civic Facility Development Corporation 0.01 0.01 0.01 0.00 0.00 -52.4%
Wayne Economic Development Corporation 0.05 0.04 0.88 0.88 0.94 1,671.8%
West Brighton Community Local Development Corporation 0.34 0.39 0.33 0.33 0.42 22.9%
Westchester County Local Development Corporation 0.12 0.18 0.21 0.24
Wheatfield Local Development Corporation 0.00 0.01 0.01
White Plains Center Local Development Corporation - - - -
Wyandanch Community Development Corporation 0.42 0.50 0.46 -
Wyoming County Business Assistance Corporation 0.16 0.17
Wyoming County Business Center 0.15 0.12 0.10 0.04 0.05 -66.1%
Yates County Capital Resource Corporation2 0.00 0.00 0.00 0.00 0.00 32.9%
Yonkers Downtown Waterfront Development Corporation 0.47 0.27
Yonkers Economic Development Corporation 0.20 0.17 0.03 0.06 0.06 -70.9%
Subtotal (excluding TASCs): 1,012.36 918.37 1,017.99 904.33 1,012.80 0.04%
Broome Tobacco Asset Securitization Corporation 0.04 0.04 0.05 0.04 0.04 -2.0%
Cayuga Tobacco Asset Securitization Corporation 1.70 1.78 1.73 1.78 1.81 6.8%
Chautauqua Tobacco Asset Securitization Corporation 0.06 0.09 0.08 0.08 0.08 29.1%
Chemung Tobacco Asset Securitization Corporation 0.02 0.02 0.02 0.02 0.02 -5.2%
Columbia Tobacco Asset Securitization Corporation 1.26 0.04 1.29 1.30 1.33 5.8%
Cortland Tobacco Asset Securitization Corporation 0.79 0.85 0.04 0.06
Dutchess Tobacco Asset Securitization Corporation 0.05 0.07 0.07 0.06 0.06 11.8%
Erie Tobacco Asset Securitization Corporation 0.14 0.13 0.13 0.10 0.10 -30.3%
Fiscal Year 2005 Securitization Corporation 0.10 0.10 0.10 0.09 0.11 15.3%
Genesee Tobacco Asset Securitization Corporation 0.03 0.03 0.03 0.03 0.03 6.0%
Greene Tobacco Asset Securitization Corporation 0.03 0.03 0.03 0.03 0.03 6.7%
Herkimer Tobacco Asset Securitization Corporation 1.41 1.44 1.44 1.36 1.58 12.0%
Livingston Tobacco Asset Securitization Corporation 1.15 1.18 1.18 1.20 1.24 7.7%
Monroe Tobacco Asset Securitization Corporation 0.11 0.11 0.12 0.11 0.11 6.6%
Nassau County Tobacco Settlement Corporation 0.12 0.13 0.10 0.11 0.10 -14.8%
Niagara Tobacco Asset Securitization Corporation - 2.86 2.85 - -
Oneida Tobacco Asset Securitization Corporation 0.03 0.03 0.03 0.03 0.03 -20.8%
Onondaga Tobacco Asset Securitization Corporation 0.12 0.12 1.65 0.12 0.12 2.7%
Ontario Tobacco Asset Securitization Corporation 0.03 0.03 0.03 0.04 0.04 53.0%
Oswego Tobacco Asset Securitization Corporation 0.05 0.04 0.05 0.06 0.06 18.6%
Putnam Tobacco Asset Securitization Corporation 0.05 0.05 0.05 0.05 0.06 28.5%
Rensselaer Tobacco Asset Securitization Corporation 0.06 0.07 0.07 0.04 0.06 -9.6%
Rockland Second Tobacco Asset Securitization Corporation 0.03 0.03 0.03 0.04 0.05 61.8%
Rockland Tobacco Asset Securitization Corporation 0.07 0.07 0.06 0.06 0.06 -12.0%
Schuyler Tobacco Asset Securitization Corporation 0.37 0.37 0.37 0.38 0.39 7.1%
Seneca Tobacco Asset Securitization Corporation 0.69 0.74 0.74 0.70 0.77 12.0%
Steuben Tobacco Asset Securitization Corporation 0.03 0.03 0.03 0.03 0.03 -1.3%
Suffolk Tobacco Asset Securitization Corporation 6.08 5.34 10.52 4.75 5.21 -14.3%
Sullivan Tobacco Asset Securitization Corporation 0.03 0.03 0.03 0.03 0.03 18.5%
Tioga Tobacco Asset Securitization Corporation 0.02 0.02 0.02 0.02
Tompkins Tobacco Asset Securitization Corporation 0.05 0.06 0.06 0.06 0.06 17.0%
TSASC, Inc. 0.44 0.44 0.42 0.66 0.38 -13.2%
Ulster Tobacco Asset Securitization Corporation 0.04 0.03 1.04 0.05 0.04 12.0%
Warren Tobacco Asset Securitization Corporation 0.47 0.48 0.03 0.43 0.03 -93.9%
Washington Tobacco Asset Securitization Corporation 0.71 0.68 0.68 0.64 0.66 -6.4%
Westchester Tobacco Asset Securitization Corporation 0.14 0.14 0.13 0.12
Wyoming Tobacco Asset Securitization Corporation - 0.18 0.77 0.20 0.25
Yates Tobacco Asset Securitization Corporation 0.41 0.04 0.04 0.04 0.05 -89.0%
Subtotal TASCs: 16.94 17.94 26.11 14.95 15.06 -11.1%
Total: 1,029.30 936.31 1,044.10 919.28 1,027.86 -0.1%
*Data reported as of June 4, 2019. Data shown as 0.00 indicates an authority had operating expenses, but they round to $0.00 million.
Data shown as - indicates an authority reported $0 in operating expenses.1 Hudson Development Corporation changed their FYE date for the FY2014 reporting period. FY2014 data is for 15 months.
2 While the data rounds to and appears $0 in this table for these authorities, they did report operating expenses and as a result have a percent change.
Authorities Budget Office 19
2019 Annual Report on Public Authorities in New York State
Public Authorities Debt 2014 – 2018
Authority Debt Outstanding
As shown in Table 5, the total amount of outstanding debt reported by all public authorities for 2018 was
$282.1 billion. Of this, $165.2 billion (nearly 60 percent) was debt issued by state authorities. The amount
of debt originally issued at the direction of New York State or backed by its moral obligation or direct
appropriations (state debt) totaled $49.0 billion, which constitutes 29.7 percent of the total outstanding
debt issued by state authorities. This is down from 32.7 percent in 2014. Outstanding debt issued by state
authorities to finance the capital needs and purposes of these authorities, and retired using the
authorities’ own revenue streams and not State Fund dollars, totaled $69.7 billion, or 42.2 percent of the
total, which increased from 40.4 percent in 2014. Conduit debt, or debt issued on behalf of third parties,
issued by state authorities was $46.5 billion in 2018. This comprised 28.2 percent of all outstanding debt
as reported by state authorities, which increased from the 26.9 percent reported for 2014.
The outstanding debt reported by local authorities for the 2018 reporting period totaled $89.8 billion, a
19.0 percent increase in outstanding debt compared to 2014. Debt issued to finance the purposes of the
authority comprised 84.7 percent of the total outstanding debt of local authorities. The remaining
outstanding debt included state backed debt, 8.9 percent, and conduit debt, 6.5 percent. The total
amount of outstanding debt reported by IDAs continues to decline. IDAs reported a total of $7.6 billion
of total outstanding debt for the 2018 reporting period, down from $13.6 billion reported in 2014. This is
a 44.0 percent decrease. Conduit debt continues to make up most of the outstanding debt for IDAs. IDA’s
continue to show that 3.0 percent of debt is issued for authority purposes. In previous years, this type of
debt has made up less than one percent of total IDA debt. Breaking the trend, the total amount of
outstanding debt reported by LDC’s shows a slight decrease. Conduit debt reported by LDCs continues to
make up 58.6 percent of total LDC debt, which increased from 44.5 percent in 2014.
As indicated in Table 6, the amount of outstanding debt reported by state authorities continues an
increasing trend from 2014. Although most state authorities report a decrease in the amount of debt
outstanding, Erie County Medical Center Corporation, New York Job Development Authority, New York
State Housing Finance Agency (NYSHFA), Ogdensburg Bridge and Port Authority (OBPA), Utility Debt
Securitization Authority and Westchester County Health Care Corporation all report increases of 40
percent or more when compared to 2014. Combined, their outstanding debt reported is $32.8 billion
compared to $22.19 billion in 2014. NYSHFA issued $1.3 million in bonds to finance 40 new projects for
housing units and $455.3 million to finance projects under a multi-year program. OBPA issued $10.8
million in new debt, a portion to be used for the expansion of the Ogdensburg International Airport, which
began in 2016. Albany Convention Center Authority and Port of Oswego Authority retired all outstanding
debt in 2018. Central New York Regional Transportation Authority continues to report that all of its debt
has been retired since 2014.
Authorities Budget Office 20
2019 Annual Report on Public Authorities in New York State
As of October 31, 2017, all bonds of Tobacco Settlement Financing Corporation (TSFC) were retired; no
new debt was issued in 2018. TSFC’s enabling statute indicates that the authority shall continue to exist
until six months after all its liabilities have been met or otherwise discharged. TSFC was created in 2003
to purchase all or a portion of New York State’s share of the Tobacco Settlement Revenues under the
Master Settlement Agreement (MSA) with tobacco companies. The Purchase and Sale agreement
between the state and TSFC provides that TSFC receives all Tobacco Settlement Revenues until the state
directs TSFC to: (i) pay, transfer, assign or otherwise convey to the state for deposit into such fund or
account of the state as the law may require, all or any portion of the moneys of TSFC, (ii) sell, transfer,
assign and otherwise convey to the state the right to receive any remaining payments belong to TSFC
under the MSA, and (iii) execute and deliver to the escrow agent under the MSA inevitable instructions to
make all remaining payments to the state. As previously reported, until the state shall direct TSFC
otherwise, Tobacco Settlement Revenues will continue to be due to TSFC.
Table 7 shows that the amount of outstanding debt reported by local authorities continues to increase.
Similar to previous year, the increase in debt is primarily due to continued debt issuances by the New York
City Transitional Finance Authority (NYCTFA), whose primary purpose is to finance a portion of the New
York City’s capital program, including a portion of New York City’s five-year educational facilities capital
plan. NYCTFA increased their debt by $2.7 billion. New York City Housing Development Corporation,
whose mission is to stimulate economic growth and revitalize neighborhoods and empowered to do so by
financing housing through the issuance of bonds, notes and debt obligations, increased their debt by $1.0
billion, mostly due to the issuance of 19 new Housing Revenue Bonds series.
IDA debt continues its decreasing trend, which is shown in Table 8. IDA total debt in 2018 was $7.6 billion,
which is a 43.9 percent decrease from the debt reported in 2014. New York City IDA shows a decrease of
$3.2 billion compared to 2014, however, it appears the debt was shifted to Build NYC Resource
Corporation, an LDC which was created in 2011 with a “primary goal […] to facilitate access to private
activity tax-exempt bond financing for not-for-profit institutions”. This decreasing trend of IDA debt is
primarily due to the expiration of the IDAs’ statutory authority to provide financial assistance to civic
facility projects in January 2008. Of the 89 reporting IDAs, 16 reported zero outstanding debt (Broome,
Cayuga, Chenango, Clarence, Clifton Park, Fairport, Glen Cove, Glens Falls, Hamburg, Lewis County,
Middletown, Montgomery County, Port Jervis, Schoharie County, Steuben County and Wayne County.)
Conversely, eight IDAs reported increasing the amount of outstanding debt in 2018 for a combined total
of $842.2 million. Amsterdam, Green Island, Guilderland, Jefferson, Oneida County, Sullivan County and
Town of Lockport continue to increase debt since at least 2017. In addition, Monroe IDA reported the
largest increase in debt since 2014, issuing $347 million in new debt for the Rochester Joint Schools
Construction Board Phase 2 (part of a four-phase project to improve the Rochester City School District)
and Cedarwood Community Partners, which is an affordable housing project.
Authorities Budget Office 21
2019 Annual Report on Public Authorities in New York State
As shown in Table 9, LDCs reported a 30.9 percent increase for total outstanding debt, or an increase of
$3.8 billion, between 2014 and 2018. However, when compared to the percent change of 60.4 (2013 and
2017), this year’s percent change is noticeably lower. This is partially due to having fewer certified reports
from LDCs for the most current fiscal year, including Nassau County Local Economic Assistance
Corporation and Westchester County Local Development Corporation. Combined, these two LDCs
reported a total of $1.1 billion of debt for the 2017 reporting period. If these two LDCs had reported for
the 2018 reporting year, the percent increase for total outstanding debt would presumably be higher.
The Build NYC Resource Corporation remains the biggest contributor to this increase, jumping from $1.1
billion in 2014 to nearly $3.0 billion in 2018. As previously indicated, it appears NYC IDA shifted some of
its debt to this LDC. Similarly, the LDCs reporting a significant increase in outstanding debt are the same
authorities identified the previous year. They are the Monroe County Industrial Development Corporation
($846 million increase), the Dutchess County Local Development Corporation ($663 million increase), and
the Buffalo and Erie County Industrial Land Development Corporation ($241 million increase).
Table 10 shows the total debt outstanding in 2018 for all TASCs was $3.2 billion. This is a 16.1 percent
decrease when compared to those reporting in 2014.
Authority
Type
Authority Name 2014 Debt
Outstanding
2015 Debt
Outstanding
2016 Debt
Outstanding
2017 Debt
Outstanding
2018 Debt
Outstanding
State Total: 155,676.69 154,002.40 156,845.14 160,436.20 165,248.77
State Guaranteed 12.35 9.26 6.17 3.09 0.00
State Supported 48,488.26 46,592.07 47,400.32 46,209.44 48,699.40
State Contingent Obligation 351.36 304.10 256.53 220.04 193.19
State Moral Obligation 6.79 2.21 1.68 1.11 0.49
Other State-Funded 2,022.35 1,637.64 889.54 194.48 174.21
Authority Debt - General Obligation 239.23 191.15 183.59 291.64 292.13
Authority Debt - Revenue 61,380.62 61,719.37 62,619.76 63,671.86 66,281.59
Authority Debt - Other 1,279.71 2,272.18 3,166.74 3,208.22 3,085.46
Conduit Debt 41,896.04 41,274.42 42,320.82 46,636.33 46,522.32
Local Total: 75,457.89 78,677.03 82,156.76 86,338.12 89,797.69
State Guaranteed 0.00 - - - -
Other State-Funded 6,051.42 7,425.76 8,045.98 7,881.64 7,944.26
Authority Debt - General Obligation 193.10 183.48 170.08 151.47 97.13
Authority Debt - Revenue 62,757.96 64,575.56 68,081.76 72,518.75 75,928.96
Authority Debt - Other 137.41 88.77 38.52 4.44 16.94
Conduit Debt 6,285.52 6,374.00 5,794.13 5,758.84 5,790.91
Conduit Debt - Pilot Increment Financing 32.48 29.47 26.30 22.98 19.49
Local - IDA Total: 13,577.69 11,404.38 10,166.86 8,237.08 7,610.80
Authority Debt - General Obligation 10.47 9.68 9.33 8.74 8.21
Authority Debt - Revenue 0.72 0.43 209.77 209.54 209.44
Authority Debt - Other 11.68 12.32 16.09 12.91 11.53
Conduit Debt 13,496.27 11,328.50 9,883.63 7,965.33 7,349.25
Conduit Debt - Pilot Increment Financing 58.55 53.45 48.05 40.56 32.37
Local - LDC Total: 16,227.11 18,319.80 20,215.16 20,830.10 19,449.66
Other State-Funded 20.17 26.79 12.75 12.48 12.15
Authority Debt - General Obligation 117.66 129.83 174.94 177.96 164.34
Authority Debt - Revenue 4,975.59 4,971.39 5,094.16 4,785.59 4,556.24
Authority Debt - Other 3,897.35 3,910.70 3,538.75 3,459.37 3,319.15
Conduit Debt 7,214.20 9,279.65 11,393.51 12,393.70 11,396.85
Conduit Debt - Pilot Increment Financing 2.14 1.45 1.06 0.99 0.93
Debt Total: 260,939.38 262,403.61 269,383.92 275,841.50 282,106.92
Table 5: Debt Categories by Authority Type*
($ millions)
*Data reported as of June 4, 2019. Data shown as - indicates no debt outstanding during reporting period.
Syracuse IDA misreported $209.5 million of authority debt in the 2016 reporting period.
Authorities Budget Office 22
2019 Annual Report on Public Authorities in New York State
Authority Name 2014 Debt
Outstanding
2015 Debt
Outstanding
2016 Debt
Outstanding
2017 Debt
Outstanding
2018 Debt
Outstanding
Percent
Change
2014 - 2018
Albany Convention Center Authority1 - - - 0.98 0.00
Battery Park City Authority 1,058.63 1,058.63 1,009.08 982.85 955.46 -9.7%
Buffalo Fiscal Stability Authority 63.16 48.90 34.93 27.78 22.26 -64.8%
Central New York Regional Transportation Authority1 0.00 - - - -
Development Authority of the North Country 12.14 9.14 13.94 12.94 12.23 0.8%
Dormitory Authority of the State of New York 45,772.00 45,664.53 47,286.01 47,856.64 50,471.46 10.3%
Environmental Facilities Corporation 6,721.39 6,414.72 6,053.60 5,917.93 6,266.56 -6.8%
Erie County Fiscal Stability Authority 391.77 349.04 300.15 383.83 339.97 -13.2%
Erie County Medical Center Corporation 173.13 175.53 173.65 272.51 257.33 48.6%
Long Island Power Authority 5,876.73 4,730.60 3,762.60 3,574.53 3,831.97 -34.8%
Metropolitan Transportation Authority 34,746.67 36,474.61 37,238.42 38,083.14 39,614.25 14.0%
Municipal Assistance Corporation for the City of Troy 38.00 33.78 29.40 24.45 19.29 -49.2%
Nassau County Interim Finance Authority 1,087.52 921.61 783.65 653.98 535.48 -50.8%
Nassau Health Care Corporation 242.95 269.95 256.40
New York Job Development Authority 6,939.30 6,436.63 6,595.92 10,068.65 10,007.06 44.2%
New York Local Government Assistance Corporation 2,592.38 2,345.04 2,058.40 1,758.18 1,369.58 -47.2%
New York State Bridge Authority 110.28 103.70 96.86 89.72 82.27 -25.4%
New York State Energy Research and Development 3,388.14 3,386.35 3,059.30 2,654.63 2,535.47 -25.2%
New York State Housing Finance Agency 12,661.28 13,644.43 15,446.38 16,780.29 17,733.68 40.1%
New York State Thruway Authority2 13,627.38 10,977.11 10,165.42 8,827.30 8,219.98 -39.7%
New York State Urban Development Corporation 10,720.56 11,083.64 12,418.80 12,895.56 13,578.72 26.7%
Niagara Frontier Transportation Authority 152.34 140.28 134.73 133.57 130.16 -14.6%
Ogdensburg Bridge and Port Authority 4.13 3.38 2.59 2.07 10.97 166.0%
Port of Oswego Authority1 1.41 1.27 1.05 0.30 0.00 -100.0%
Power Authority of the State of New York 1,597.24 1,562.97 1,370.77 1,305.97 1,284.81 -19.6%
Roswell Park Cancer Institute Corporation 232.36 218.23 203.82 189.67 172.16 -25.9%
State of New York Mortgage Agency 2,703.24 2,602.72 2,510.08 2,533.66 2,589.53 -4.2%
State of New York Municipal Bond Bank Agency 551.56 506.11 454.93 402.32 347.63 -37.0%
Tobacco Settlement Financing Corporation1 1,744.90 1,377.64 659.87 0.00 - -100.0%
United Nations Development Corporation 87.19 81.75 76.07 70.11 63.85 -26.8%
Utility Debt Securitization Authority (UDSA) 1,932.32 2,919.44 3,965.53 4,262.40 4,139.59 114.2%
Westchester County Health Care Corporation 446.63 460.71 682.84 670.27 657.06 47.1%
Total: 155,676.69 154,002.40 156,845.14 160,436.20 165,248.77 6.1%
Table 6: State Authority Debt Outstanding 2014-2018*
($ millions)
* Data reported as of June 4, 2019. Data shown as 0.00 indicates an authority had debt, but paid it off during the reporting year or that the authority had
debt, but it rounds to $0.00 million. Data shown as - indicates no debt outstanding during reporting period.1Albany Convention Center Authority, Central New York Regional Transportation Authority, Port of Oswego Authority and Tobacco Settlement Financing
Corporation had debt, but paid it off during the reporting year. 2The New York State Canal Corporation was moved from New York State Thruway Authority and became a subsidiary of the Power Authority of the State of
New York effective January 1, 2017.
Authorities Budget Office 23
2019 Annual Report on Public Authorities in New York State
Authority Name 2014 Debt
Outstanding
2015 Debt
Outstanding
2016 Debt
Outstanding
2017 Debt
Outstanding
2018 Debt
Outstanding
Percent
Change
2014 - 2018
Albany Community Development Agency 0.59 0.51 0.43 0.35
Albany County Airport Authority 105.05 96.78 88.22 77.32 90.49 -13.9%
Albany Municipal Water Finance Authority 46.97 42.34 35.58 42.88
Albany Parking Authority 16.58 15.61 14.63 13.38 9.88 -40.5%
Albany Port District Commission 0.00 - - - -
American Museum of Natural History Planetarium Authority 0.57 0.57 0.57 0.57 0.57 0.0%
Buffalo Municipal Water Finance Authority 152.61 143.42 136.92 128.52 119.89 -21.4%
Buffalo Sewer Authority 36.89 43.86 41.83 40.19 38.51 4.4%
Buffalo Urban Renewal Agency 6.03 3.87 0.00 - - -100.0%
Cayuga County Water and Sewer Authority 5.98 5.66 5.35 5.05 4.96 -17.1%
Central New York Regional Market Authority 1.02 0.95 0.89 0.85
Clifton Park Water Authority 19.79 18.62 17.41 15.94 14.64 -26.0%
Dutchess County Resource Recovery Agency 16.14 15.22 14.24 12.13 10.96 -32.1%
Dutchess County Water and Wastewater Authority 35.85 34.70 38.95 36.17 39.30 9.6%
Elmira Urban Renewal Agency 0.21 0.11 0.00 - - -100.0%
Erie County Water Authority 74.97 66.45 51.56 42.97 58.49 -22.0%
Franklin County Solid Waste Management Authority 22.28 14.51 12.31 22.91 21.39 -4.0%
Freeport Community Development Agency 0.00 1.16 1.16 -
Gloversville Community Development Agency 0.15 0.15 0.15 0.15 0.15 0.0%
Green Island Power Authority 15.58 14.79 13.95 12.98 12.06 -22.6%
Haverstraw Urban Renewal Agency 2.73 2.60 2.47 2.32
Incorporated Village of Hempstead Community Development Agency 1.57 1.57 1.44 1.44
Islip Resource Recovery Authority 9.43 8.34 7.23 6.10 4.94 -47.6%
Ithaca Urban Renewal Agency 0.75 0.75 0.72 0.69 0.63 -16.0%
Livingston County Water and Sewer Authority 4.48 4.34 4.19 4.04 3.89 -13.3%
Monroe County Airport Authority 37.11 30.41 23.37 15.97 10.19 -72.5%
Monroe County Water Authority 145.34 142.39 139.01 135.13 130.75 -10.0%
Nassau County Bridge Authority 9.90 9.68 9.45 0.23 8.73 -11.8%
Nassau County Sewer and Storm Water Finance Authority 157.20 154.26 144.06 133.71 122.90 -21.8%
New York City Educational Construction Fund 266.16 264.19 240.41 235.88 231.20 -13.1%
New York City Health and Hospitals Corporation 880.21 833.41 784.42 746.77 679.68 -22.8%
New York City Housing Development Corporation 9,200.76 10,099.42 9,978.06 10,649.95 11,664.45 26.8%
New York City Municipal Water Finance Authority 29,872.18 29,570.91 29,714.29 30,030.40 30,015.40 0.5%
New York City Transitional Finance Authority 31,038.82 33,850.11 37,357.48 40,695.65 43,355.31 39.7%
Niagara Falls Water Board 105.87 105.72 105.72 101.81 97.71 -7.7%
North Hempstead Solid Waste Management Authority 3.44 2.61 1.76 0.89
Nyack Parking Authority 0.17 0.13 0.08 0.04 0.00 -100.0%
Oneida-Herkimer Solid Waste Management Authority 36.93 33.24 30.79 24.78 22.46 -39.2%
Onondaga County Resource Recovery Agency 46.02 54.56 52.82 51.03 49.17 6.8%
Onondaga County Water Authority 62.00 64.26 60.12 56.99 53.77 -13.3%
Rensselaer County Water and Sewer Authority 13.80 10.18 10.04 5.97 0.00 -100.0%
Rockland County Solid Waste Management Authority 55.76 51.77 47.60 40.60 34.54 -38.1%
Saratoga County Water Authority 46.46 45.93 44.98 44.30 43.60 -6.1%
Schenectady Metroplex Development Authority 56.33 54.62 51.62 56.57 53.35 -5.3%
Suffolk County Judicial Facilities Agency 66.23 63.94 63.05 60.35
Suffolk County Water Authority 745.84 726.21 814.91 806.21 802.00 7.5%
Town of Islip Community Development Agency 0.00 - - - -
Trust for Cultural Resources of the City of New York 1,645.80 1,542.71 1,567.20 1,530.14 1,551.56 -5.7%
Trust for Cultural Resources of the County of Onondaga 214.06 211.24 209.42 236.97 233.00 8.8%
Ulster County Resource Recovery Agency 14.18 12.11 9.98 7.85 5.45 -61.6%
Upper Mohawk Valley Memorial Auditorium Authority 0.69 0.72 0.58 0.52
Upper Mohawk Valley Regional Water Finance Authority 62.34 58.70 61.92 63.20 64.68 3.8%
Water Authority of Great Neck North 31.07 30.57 30.11 27.44 26.58 -14.5%
Water Authority of Western Nassau County 64.52 112.59 110.20 107.92 105.54 63.6%
Wayne County Water and Sewer Authority 0.89 0.78 0.67 2.12 1.88 111.9%
Wilton Water and Sewer Authority 0.57 0.29 0.00 -
Yonkers Community Development Agency 0.34 0.34 0.34 0.00 - -100.0%
Yonkers Parking Authority 2.32 2.17 2.02 1.85 1.68 -27.6%
Total: 75,457.89 78,677.03 82,156.76 86,338.12 89,797.69 19.0%
Table 7: Local Authority (Other) Debt Outstanding 2014-2018*
($ millions)
* Data reported as of June 4, 2019. Data shown as 0.00 indicates an authority had debt, but paid it off during the reporting year or that the authority had debt, but it
rounds to $0.00 million. Data shown as - indicates no debt outstanding during reporting period.
Authorities Budget Office 24
2019 Annual Report on Public Authorities in New York State
Authority Name 2014 Debt
Outstanding
2015 Debt
Outstanding
2016 Debt
Outstanding
2017 Debt
Outstanding
2018 Debt
Outstanding
Percent
Change
2014 - 2018
Albany City IDA 438.10 198.91 176.62 117.31 108.04 -75.3%
Albany County IDA 18.66 17.38 16.73 15.24 14.60 -21.7%
Allegany IDA 18.75 9.57 9.55 8.46 7.17 -61.8%
Amherst IDA 19.83 18.56 17.25 6.15 5.23 -73.6%
Amsterdam IDA 1.07 0.87 0.80 12.72 12.63 1085.3%
Auburn IDA 2.20 2.09 1.97 1.85
Babylon IDA 42.27 33.94 25.83 17.60 8.95 -78.8%
Bethlehem IDA 12.32 12.02 11.70 11.28 10.93 -11.3%
Brookhaven IDA 107.84 104.94 100.97 87.04 30.02 -72.2%
Broome IDA 59.80 0.48 0.00 - - -100.0%
Cattaraugus IDA 14.10 13.29 5.50 4.99 0.92 -93.5%
Cayuga IDA 0.00 0.00 - - -
Chautauqua IDA 96.45 93.66 92.07 79.05 71.73 -25.6%
Chemung IDA 38.73 12.28 11.90 10.02 8.56 -77.9%
Chenango IDA 0.00 - - - -
City of Schenectady IDA 37.10 33.09 31.25 4.64 4.48 -87.9%
Clarence IDA 0.00 - - - -
Clifton Park IDA 0.00 - - - -
Clinton County IDA 52.66 40.87 2.82 2.59 2.45 -95.3%
Cohoes IDA 4.54 4.38 4.22 4.05 3.88 -14.6%
Colonie IDA 6.35 6.11 5.81 5.16 4.86 -23.5%
Columbia IDA 12.89 12.25 11.60 10.93 10.21 -20.8%
Concord IDA 0.00 - - -
Delaware County IDA 9.52 8.36 7.14 5.86 4.52 -52.6%
Dutchess County IDA 252.78 234.73 215.16 179.54 157.46 -37.7%
Erie County IDA 1,163.80 1,019.75 1,097.95 1,013.36 945.90 -18.7%
Essex County IDA 4.18 3.85 3.71 3.71 3.71 -11.3%
Fairport IDA 0.30 0.30 0.00 - - -100.0%
Franklin County IDA 13.89 12.45 10.91 7.79 6.40 -53.9%
Fulton County IDA 7.42 6.78 3.84 2.33 2.21 -70.2%
Genesee County IDA 14.08 13.32 12.53 11.72 10.89 -22.7%
Geneva IDA 57.56 57.56 57.56 0.00
Glen Cove IDA 15.15 15.15 0.00 - - -100.0%
Glens Falls IDA 11.18 10.90 0.00 - - -100.0%
Green Island IDA 13.91 13.76 13.60 16.00 15.75 13.2%
Greene County IDA 0.57 0.51 0.46 0.43 0.36 -36.1%
Guilderland IDA 5.29 4.65 4.29 35.75 35.37 568.6%
Hamburg IDA 1.13 0.63 0.50 0.00 - -100.0%
Hempstead IDA 177.75 135.88 133.07 110.90 90.95 -48.8%
Herkimer IDA 16.84 14.59 8.54 7.43 5.19 -69.2%
Hornell IDA1 1.91 0.81 0.70 0.63 0.17 -90.9%
Islip IDA 56.99 16.78 15.28 15.28
Jefferson IDA 3.48 28.38 27.46 25.92 24.09 591.6%
Lancaster IDA 32.34 25.01 26.95 26.29 25.78 -20.3%
Lewis County IDA 0.01 0.00 0.00 0.00 - -100.0%
Livingston County IDA 9.62 8.48 7.23 6.23 5.14 -46.6%
Madison County IDA 110.78 15.24 17.24 3.96 3.58 -96.8%
Middletown IDA 0.75 0.00 - - - -100.0%
Monroe IDA 429.65 412.80 407.66 357.01 675.58 57.2%
Montgomery County IDA 0.30 0.00 - - - -100.0%
Mount Pleasant IDA 21.06 20.11 19.12 18.09 17.01 -19.2%
Mount Vernon IDA 34.14 20.90 14.66 11.53
Nassau County IDA 525.29 460.92 431.52 388.83 372.74 -29.0%
New Rochelle IDA 68.48 63.84 62.59 61.28 59.41 -13.2%
New York City IDA 6,269.17 5,549.31 4,688.97 3,294.42 3,062.68 -51.1%
Newburgh IDA 34.61 33.12 31.53 29.80 28.42 -17.9%
Niagara County IDA 42.90 39.98 37.23 34.78 26.62 -37.9%
Niagara Town IDA 0.00 0.00 0.00 0.00 0.00 0.0%
North Greenbush IDA 1.91 1.65 1.50 1.24 1.04 -45.5%
Table 8: IDA Debt Outstanding 2014-2018*
($ millions)
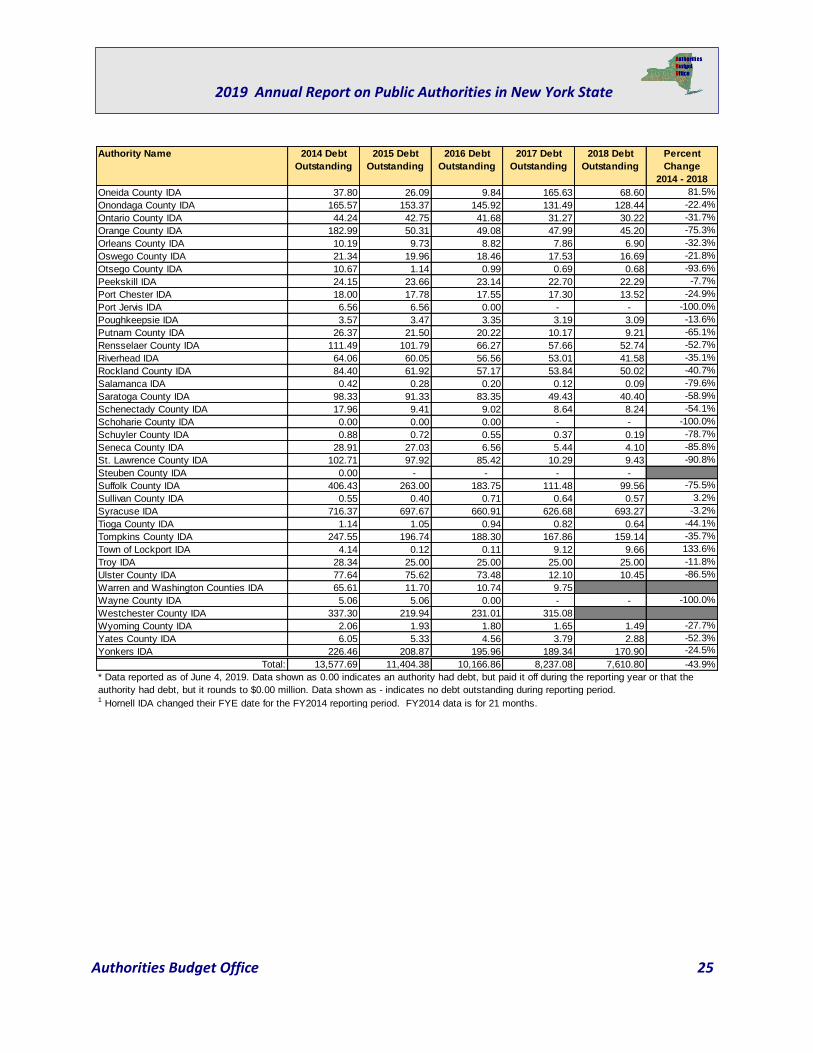
Authorities Budget Office 25
2019 Annual Report on Public Authorities in New York State
Authority Name 2014 Debt
Outstanding
2015 Debt
Outstanding
2016 Debt
Outstanding
2017 Debt
Outstanding
2018 Debt
Outstanding
Percent
Change
2014 - 2018
Oneida County IDA 37.80 26.09 9.84 165.63 68.60 81.5%
Onondaga County IDA 165.57 153.37 145.92 131.49 128.44 -22.4%
Ontario County IDA 44.24 42.75 41.68 31.27 30.22 -31.7%
Orange County IDA 182.99 50.31 49.08 47.99 45.20 -75.3%
Orleans County IDA 10.19 9.73 8.82 7.86 6.90 -32.3%
Oswego County IDA 21.34 19.96 18.46 17.53 16.69 -21.8%
Otsego County IDA 10.67 1.14 0.99 0.69 0.68 -93.6%
Peekskill IDA 24.15 23.66 23.14 22.70 22.29 -7.7%
Port Chester IDA 18.00 17.78 17.55 17.30 13.52 -24.9%
Port Jervis IDA 6.56 6.56 0.00 - - -100.0%
Poughkeepsie IDA 3.57 3.47 3.35 3.19 3.09 -13.6%
Putnam County IDA 26.37 21.50 20.22 10.17 9.21 -65.1%
Rensselaer County IDA 111.49 101.79 66.27 57.66 52.74 -52.7%
Riverhead IDA 64.06 60.05 56.56 53.01 41.58 -35.1%
Rockland County IDA 84.40 61.92 57.17 53.84 50.02 -40.7%
Salamanca IDA 0.42 0.28 0.20 0.12 0.09 -79.6%
Saratoga County IDA 98.33 91.33 83.35 49.43 40.40 -58.9%
Schenectady County IDA 17.96 9.41 9.02 8.64 8.24 -54.1%
Schoharie County IDA 0.00 0.00 0.00 - - -100.0%
Schuyler County IDA 0.88 0.72 0.55 0.37 0.19 -78.7%
Seneca County IDA 28.91 27.03 6.56 5.44 4.10 -85.8%
St. Lawrence County IDA 102.71 97.92 85.42 10.29 9.43 -90.8%
Steuben County IDA 0.00 - - - -
Suffolk County IDA 406.43 263.00 183.75 111.48 99.56 -75.5%
Sullivan County IDA 0.55 0.40 0.71 0.64 0.57 3.2%
Syracuse IDA 716.37 697.67 660.91 626.68 693.27 -3.2%
Tioga County IDA 1.14 1.05 0.94 0.82 0.64 -44.1%
Tompkins County IDA 247.55 196.74 188.30 167.86 159.14 -35.7%
Town of Lockport IDA 4.14 0.12 0.11 9.12 9.66 133.6%
Troy IDA 28.34 25.00 25.00 25.00 25.00 -11.8%
Ulster County IDA 77.64 75.62 73.48 12.10 10.45 -86.5%
Warren and Washington Counties IDA 65.61 11.70 10.74 9.75
Wayne County IDA 5.06 5.06 0.00 - - -100.0%
Westchester County IDA 337.30 219.94 231.01 315.08
Wyoming County IDA 2.06 1.93 1.80 1.65 1.49 -27.7%
Yates County IDA 6.05 5.33 4.56 3.79 2.88 -52.3%
Yonkers IDA 226.46 208.87 195.96 189.34 170.90 -24.5%
Total: 13,577.69 11,404.38 10,166.86 8,237.08 7,610.80 -43.9%
1 Hornell IDA changed their FYE date for the FY2014 reporting period. FY2014 data is for 21 months.
* Data reported as of June 4, 2019. Data shown as 0.00 indicates an authority had debt, but paid it off during the reporting year or that the
authority had debt, but it rounds to $0.00 million. Data shown as - indicates no debt outstanding during reporting period.
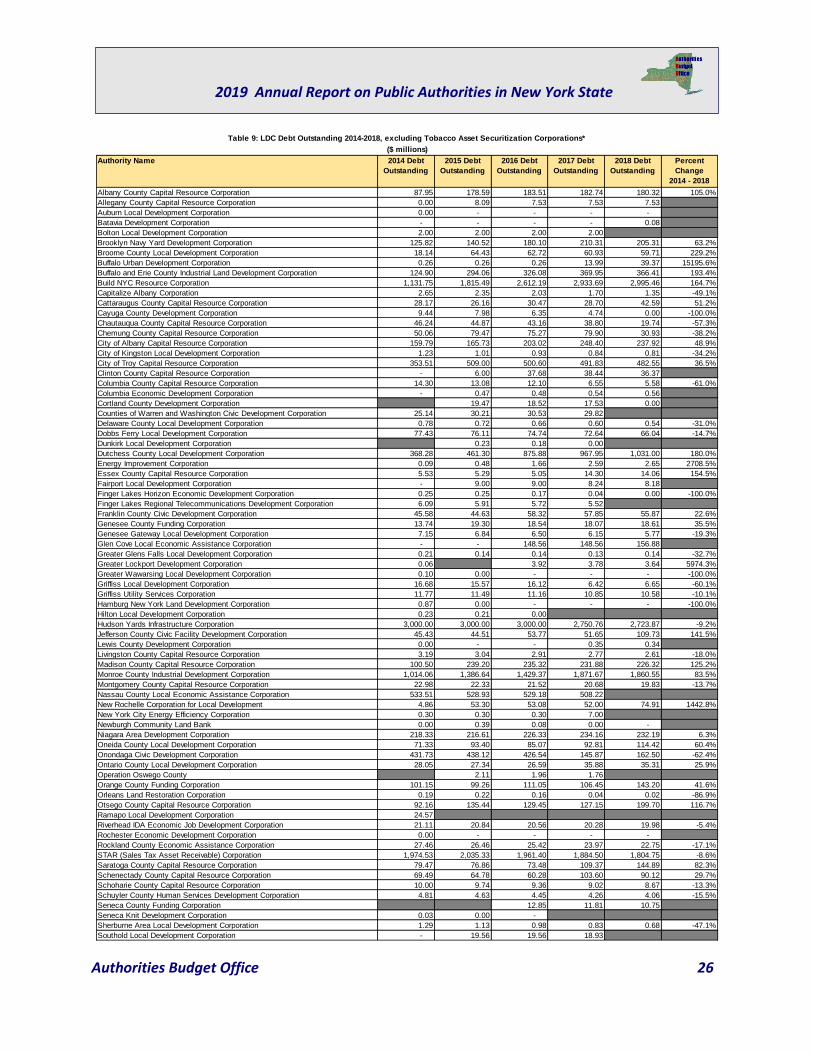
Authorities Budget Office 26
2019 Annual Report on Public Authorities in New York State
Authority Name 2014 Debt
Outstanding
2015 Debt
Outstanding
2016 Debt
Outstanding
2017 Debt
Outstanding
2018 Debt
Outstanding
Percent
Change
2014 - 2018
Albany County Capital Resource Corporation 87.95 178.59 183.51 182.74 180.32 105.0%
Allegany County Capital Resource Corporation 0.00 8.09 7.53 7.53 7.53
Auburn Local Development Corporation 0.00 - - - -
Batavia Development Corporation - - - - 0.08
Bolton Local Development Corporation 2.00 2.00 2.00 2.00
Brooklyn Navy Yard Development Corporation 125.82 140.52 180.10 210.31 205.31 63.2%
Broome County Local Development Corporation 18.14 64.43 62.72 60.93 59.71 229.2%
Buffalo Urban Development Corporation 0.26 0.26 0.26 13.99 39.37 15195.6%
Buffalo and Erie County Industrial Land Development Corporation 124.90 294.06 326.08 369.95 366.41 193.4%
Build NYC Resource Corporation 1,131.75 1,815.49 2,612.19 2,933.69 2,995.46 164.7%
Capitalize Albany Corporation 2.65 2.35 2.03 1.70 1.35 -49.1%
Cattaraugus County Capital Resource Corporation 28.17 26.16 30.47 28.70 42.59 51.2%
Cayuga County Development Corporation 9.44 7.98 6.35 4.74 0.00 -100.0%
Chautauqua County Capital Resource Corporation 46.24 44.87 43.16 38.80 19.74 -57.3%
Chemung County Capital Resource Corporation 50.06 79.47 75.27 79.90 30.93 -38.2%
City of Albany Capital Resource Corporation 159.79 165.73 203.02 248.40 237.92 48.9%
City of Kingston Local Development Corporation 1.23 1.01 0.93 0.84 0.81 -34.2%
City of Troy Capital Resource Corporation 353.51 509.00 500.60 491.83 482.55 36.5%
Clinton County Capital Resource Corporation - 6.00 37.68 38.44 36.37
Columbia County Capital Resource Corporation 14.30 13.08 12.10 6.55 5.58 -61.0%
Columbia Economic Development Corporation - 0.47 0.48 0.54 0.56
Cortland County Development Corporation 19.47 18.52 17.53 0.00
Counties of Warren and Washington Civic Development Corporation 25.14 30.21 30.53 29.82
Delaware County Local Development Corporation 0.78 0.72 0.66 0.60 0.54 -31.0%
Dobbs Ferry Local Development Corporation 77.43 76.11 74.74 72.64 66.04 -14.7%
Dunkirk Local Development Corporation 0.23 0.18 0.00
Dutchess County Local Development Corporation 368.28 461.30 875.88 967.95 1,031.00 180.0%
Energy Improvement Corporation 0.09 0.48 1.66 2.59 2.65 2708.5%
Essex County Capital Resource Corporation 5.53 5.29 5.05 14.30 14.06 154.5%
Fairport Local Development Corporation - 9.00 9.00 8.24 8.18
Finger Lakes Horizon Economic Development Corporation 0.25 0.25 0.17 0.04 0.00 -100.0%
Finger Lakes Regional Telecommunications Development Corporation 6.09 5.91 5.72 5.52
Franklin County Civic Development Corporation 45.58 44.63 58.32 57.85 55.87 22.6%
Genesee County Funding Corporation 13.74 19.30 18.54 18.07 18.61 35.5%
Genesee Gateway Local Development Corporation 7.15 6.84 6.50 6.15 5.77 -19.3%
Glen Cove Local Economic Assistance Corporation - - 148.56 148.56 156.88
Greater Glens Falls Local Development Corporation 0.21 0.14 0.14 0.13 0.14 -32.7%
Greater Lockport Development Corporation 0.06 3.92 3.78 3.64 5974.3%
Greater Wawarsing Local Development Corporation 0.10 0.00 - - - -100.0%
Griffiss Local Development Corporation 16.68 15.57 16.12 6.42 6.65 -60.1%
Griffiss Utility Services Corporation 11.77 11.49 11.16 10.85 10.58 -10.1%
Hamburg New York Land Development Corporation 0.87 0.00 - - - -100.0%
Hilton Local Development Corporation 0.23 0.21 0.00
Hudson Yards Infrastructure Corporation 3,000.00 3,000.00 3,000.00 2,750.76 2,723.87 -9.2%
Jefferson County Civic Facility Development Corporation 45.43 44.51 53.77 51.65 109.73 141.5%
Lewis County Development Corporation 0.00 - - 0.35 0.34
Livingston County Capital Resource Corporation 3.19 3.04 2.91 2.77 2.61 -18.0%
Madison County Capital Resource Corporation 100.50 239.20 235.32 231.88 226.32 125.2%
Monroe County Industrial Development Corporation 1,014.06 1,386.64 1,429.37 1,871.67 1,860.55 83.5%
Montgomery County Capital Resource Corporation 22.98 22.33 21.52 20.68 19.83 -13.7%
Nassau County Local Economic Assistance Corporation 533.51 528.93 529.18 508.22
New Rochelle Corporation for Local Development 4.86 53.30 53.08 52.00 74.91 1442.8%
New York City Energy Efficiency Corporation 0.30 0.30 0.30 7.00
Newburgh Community Land Bank 0.00 0.39 0.08 0.00 -
Niagara Area Development Corporation 218.33 216.61 226.33 234.16 232.19 6.3%
Oneida County Local Development Corporation 71.33 93.40 85.07 92.81 114.42 60.4%
Onondaga Civic Development Corporation 431.73 438.12 426.54 145.87 162.50 -62.4%
Ontario County Local Development Corporation 28.05 27.34 26.59 35.88 35.31 25.9%
Operation Oswego County 2.11 1.96 1.76
Orange County Funding Corporation 101.15 99.26 111.05 106.45 143.20 41.6%
Orleans Land Restoration Corporation 0.19 0.22 0.16 0.04 0.02 -86.9%
Otsego County Capital Resource Corporation 92.16 135.44 129.45 127.15 199.70 116.7%
Ramapo Local Development Corporation 24.57
Riverhead IDA Economic Job Development Corporation 21.11 20.84 20.56 20.28 19.98 -5.4%
Rochester Economic Development Corporation 0.00 - - - -
Rockland County Economic Assistance Corporation 27.46 26.46 25.42 23.97 22.75 -17.1%
STAR (Sales Tax Asset Receivable) Corporation 1,974.53 2,035.33 1,961.40 1,884.50 1,804.75 -8.6%
Saratoga County Capital Resource Corporation 79.47 76.86 73.48 109.37 144.89 82.3%
Schenectady County Capital Resource Corporation 69.49 64.78 60.28 103.60 90.12 29.7%
Schoharie County Capital Resource Corporation 10.00 9.74 9.36 9.02 8.67 -13.3%
Schuyler County Human Services Development Corporation 4.81 4.63 4.45 4.26 4.06 -15.5%
Seneca County Funding Corporation 12.85 11.81 10.75
Seneca Knit Development Corporation 0.03 0.00 -
Sherburne Area Local Development Corporation 1.29 1.13 0.98 0.83 0.68 -47.1%
Southold Local Development Corporation - 19.56 19.56 18.93
Table 9: LDC Debt Outstanding 2014-2018, excluding Tobacco Asset Securitization Corporations*
($ millions)
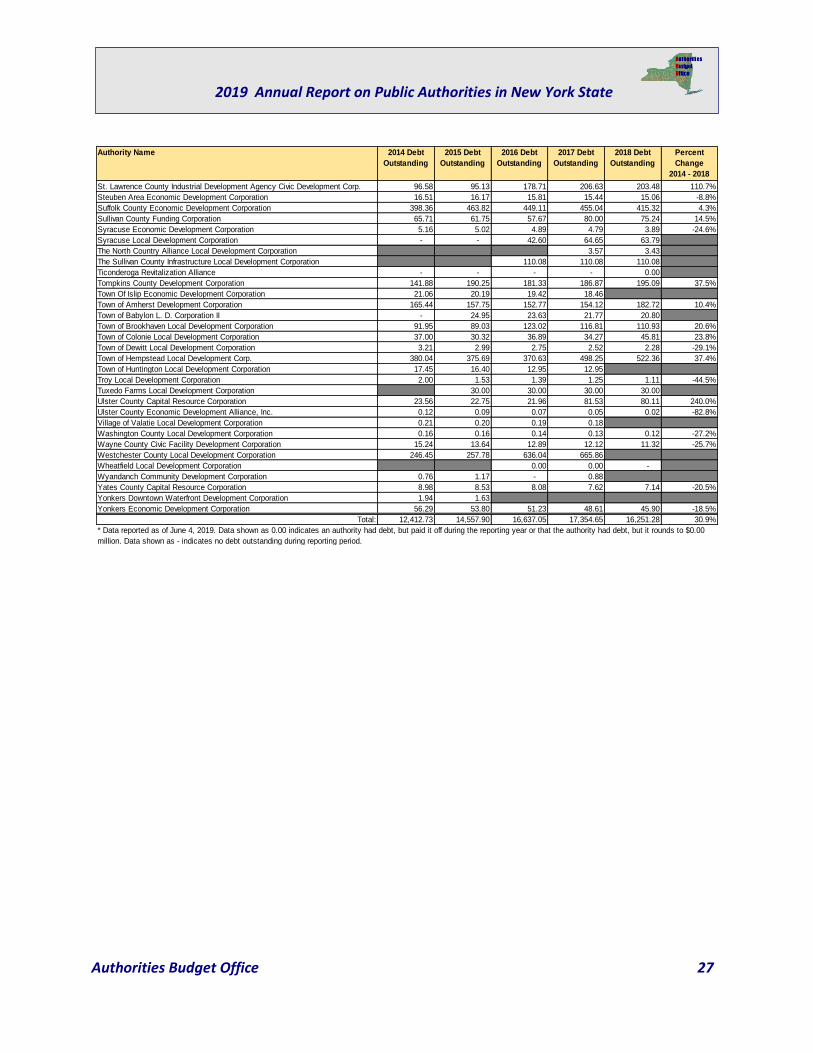
Authorities Budget Office 27
2019 Annual Report on Public Authorities in New York State
Authority Name 2014 Debt
Outstanding
2015 Debt
Outstanding
2016 Debt
Outstanding
2017 Debt
Outstanding
2018 Debt
Outstanding
Percent
Change
2014 - 2018
St. Lawrence County Industrial Development Agency Civic Development Corp. 96.58 95.13 178.71 206.63 203.48 110.7%
Steuben Area Economic Development Corporation 16.51 16.17 15.81 15.44 15.06 -8.8%
Suffolk County Economic Development Corporation 398.36 463.82 449.11 455.04 415.32 4.3%
Sullivan County Funding Corporation 65.71 61.75 57.67 80.00 75.24 14.5%
Syracuse Economic Development Corporation 5.16 5.02 4.89 4.79 3.89 -24.6%
Syracuse Local Development Corporation - - 42.60 64.65 63.79
The North Country Alliance Local Development Corporation 3.57 3.43
The Sullivan County Infrastructure Local Development Corporation 110.08 110.08 110.08
Ticonderoga Revitalization Alliance - - - - 0.00
Tompkins County Development Corporation 141.88 190.25 181.33 186.87 195.09 37.5%
Town Of Islip Economic Development Corporation 21.06 20.19 19.42 18.46
Town of Amherst Development Corporation 165.44 157.75 152.77 154.12 182.72 10.4%
Town of Babylon L. D. Corporation II - 24.95 23.63 21.77 20.80
Town of Brookhaven Local Development Corporation 91.95 89.03 123.02 116.81 110.93 20.6%
Town of Colonie Local Development Corporation 37.00 30.32 36.89 34.27 45.81 23.8%
Town of Dewitt Local Development Corporation 3.21 2.99 2.75 2.52 2.28 -29.1%
Town of Hempstead Local Development Corp. 380.04 375.69 370.63 498.25 522.36 37.4%
Town of Huntington Local Development Corporation 17.45 16.40 12.95 12.95
Troy Local Development Corporation 2.00 1.53 1.39 1.25 1.11 -44.5%
Tuxedo Farms Local Development Corporation 30.00 30.00 30.00 30.00
Ulster County Capital Resource Corporation 23.56 22.75 21.96 81.53 80.11 240.0%
Ulster County Economic Development Alliance, Inc. 0.12 0.09 0.07 0.05 0.02 -82.8%
Village of Valatie Local Development Corporation 0.21 0.20 0.19 0.18
Washington County Local Development Corporation 0.16 0.16 0.14 0.13 0.12 -27.2%
Wayne County Civic Facility Development Corporation 15.24 13.64 12.89 12.12 11.32 -25.7%
Westchester County Local Development Corporation 246.45 257.78 636.04 665.86
Wheatfield Local Development Corporation 0.00 0.00 -
Wyandanch Community Development Corporation 0.76 1.17 - 0.88
Yates County Capital Resource Corporation 8.98 8.53 8.08 7.62 7.14 -20.5%
Yonkers Downtown Waterfront Development Corporation 1.94 1.63
Yonkers Economic Development Corporation 56.29 53.80 51.23 48.61 45.90 -18.5%
Total: 12,412.73 14,557.90 16,637.05 17,354.65 16,251.28 30.9%
* Data reported as of June 4, 2019. Data shown as 0.00 indicates an authority had debt, but paid it off during the reporting year or that the authority had debt, but it rounds to $0.00
million. Data shown as - indicates no debt outstanding during reporting period.
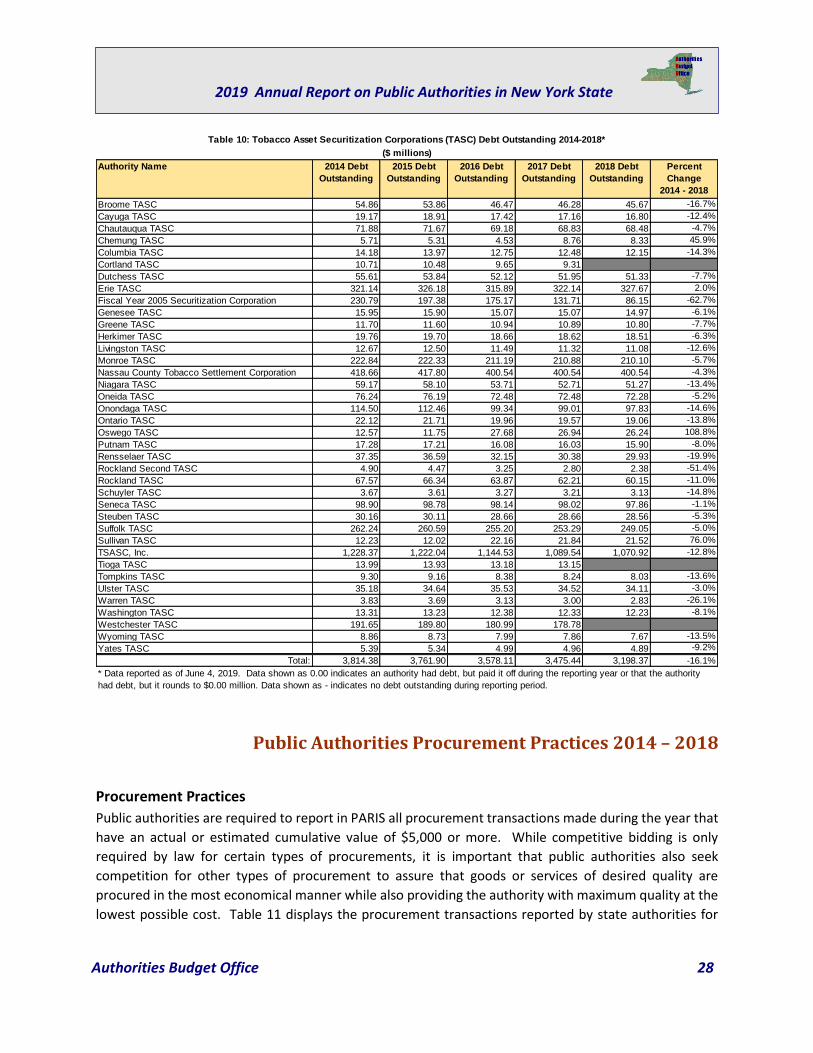
Authorities Budget Office 28
2019 Annual Report on Public Authorities in New York State
Public Authorities Procurement Practices 2014 – 2018
Procurement Practices
Public authorities are required to report in PARIS all procurement transactions made during the year that
have an actual or estimated cumulative value of $5,000 or more. While competitive bidding is only
required by law for certain types of procurements, it is important that public authorities also seek
competition for other types of procurement to assure that goods or services of desired quality are
procured in the most economical manner while also providing the authority with maximum quality at the
lowest possible cost. Table 11 displays the procurement transactions reported by state authorities for
Authority Name 2014 Debt
Outstanding
2015 Debt
Outstanding
2016 Debt
Outstanding
2017 Debt
Outstanding
2018 Debt
Outstanding
Percent
Change
2014 - 2018
Broome TASC 54.86 53.86 46.47 46.28 45.67 -16.7%
Cayuga TASC 19.17 18.91 17.42 17.16 16.80 -12.4%
Chautauqua TASC 71.88 71.67 69.18 68.83 68.48 -4.7%
Chemung TASC 5.71 5.31 4.53 8.76 8.33 45.9%
Columbia TASC 14.18 13.97 12.75 12.48 12.15 -14.3%
Cortland TASC 10.71 10.48 9.65 9.31
Dutchess TASC 55.61 53.84 52.12 51.95 51.33 -7.7%
Erie TASC 321.14 326.18 315.89 322.14 327.67 2.0%
Fiscal Year 2005 Securitization Corporation 230.79 197.38 175.17 131.71 86.15 -62.7%
Genesee TASC 15.95 15.90 15.07 15.07 14.97 -6.1%
Greene TASC 11.70 11.60 10.94 10.89 10.80 -7.7%
Herkimer TASC 19.76 19.70 18.66 18.62 18.51 -6.3%
Livingston TASC 12.67 12.50 11.49 11.32 11.08 -12.6%
Monroe TASC 222.84 222.33 211.19 210.88 210.10 -5.7%
Nassau County Tobacco Settlement Corporation 418.66 417.80 400.54 400.54 400.54 -4.3%
Niagara TASC 59.17 58.10 53.71 52.71 51.27 -13.4%
Oneida TASC 76.24 76.19 72.48 72.48 72.28 -5.2%
Onondaga TASC 114.50 112.46 99.34 99.01 97.83 -14.6%
Ontario TASC 22.12 21.71 19.96 19.57 19.06 -13.8%
Oswego TASC 12.57 11.75 27.68 26.94 26.24 108.8%
Putnam TASC 17.28 17.21 16.08 16.03 15.90 -8.0%
Rensselaer TASC 37.35 36.59 32.15 30.38 29.93 -19.9%
Rockland Second TASC 4.90 4.47 3.25 2.80 2.38 -51.4%
Rockland TASC 67.57 66.34 63.87 62.21 60.15 -11.0%
Schuyler TASC 3.67 3.61 3.27 3.21 3.13 -14.8%
Seneca TASC 98.90 98.78 98.14 98.02 97.86 -1.1%
Steuben TASC 30.16 30.11 28.66 28.66 28.56 -5.3%
Suffolk TASC 262.24 260.59 255.20 253.29 249.05 -5.0%
Sullivan TASC 12.23 12.02 22.16 21.84 21.52 76.0%
TSASC, Inc. 1,228.37 1,222.04 1,144.53 1,089.54 1,070.92 -12.8%
Tioga TASC 13.99 13.93 13.18 13.15
Tompkins TASC 9.30 9.16 8.38 8.24 8.03 -13.6%
Ulster TASC 35.18 34.64 35.53 34.52 34.11 -3.0%
Warren TASC 3.83 3.69 3.13 3.00 2.83 -26.1%
Washington TASC 13.31 13.23 12.38 12.33 12.23 -8.1%
Westchester TASC 191.65 189.80 180.99 178.78
Wyoming TASC 8.86 8.73 7.99 7.86 7.67 -13.5%
Yates TASC 5.39 5.34 4.99 4.96 4.89 -9.2%
Total: 3,814.38 3,761.90 3,578.11 3,475.44 3,198.37 -16.1%
Table 10: Tobacco Asset Securitization Corporations (TASC) Debt Outstanding 2014-2018*
($ millions)
* Data reported as of June 4, 2019. Data shown as 0.00 indicates an authority had debt, but paid it off during the reporting year or that the authority
had debt, but it rounds to $0.00 million. Data shown as - indicates no debt outstanding during reporting period.
Authorities Budget Office 29
2019 Annual Report on Public Authorities in New York State
2018. State authorities reported spending a total of $10.4 billion in procurement contracts during the
2018 reporting year. This is a 21.8 percent increase from the total amount reported by state authorities
in 2017. Four authorities reported increasing their procurement transactions by more than $100 million
and include the Dormitory Authority of the State of NY for design, construction and maintenance,
Metropolitan Transportation Authority (MTA) on subway cars and buses, New York State Urban
Development Corporation (NYSUDC) for work connected to the Javits Expansion Project and the
Moynihan Station, and Westchester County Health Care Corporation (WCHCC). Looking specifically at
WCHCC, the authority increased the number of transactions from 1,007 in 2017 to 1,626 in 2018.
Approximately 69.3 percent of the total reported by state authorities for 2018 was spent on contracts
awarded through a competitive selection process as shown in Table 11. The remaining amounts expended
by state authorities on procurement contracts was either through non-competitive bid (20.6 percent),
non-contract procurement/purchase order (8.3 percent), or were purchased under state contract (1.7
percent). Overall, these numbers illustrate that the majority expended by state authorities in 2018 was
awarded through a competitive selection process. However, the use of non-competitive contracts
increased by 54.7 percent when compared to 2017. Agriculture and New York State Horse Breeding
Development Fund, Buffalo Fiscal Stability Authority, Homeless Housing Assistance Corporation, Long
Island Power Authority, Municipal Assistance Corporation for the City of Troy, Nassau County Interim
Finance Authority, Natural Heritage Trust, New York State Affordable Housing Corporation, New York
State Thoroughbred Breeding Development Fund, NYSUDC, Ogdensburg Bridge and Port Authority, and
WCHCC continue to report awarding more non-competitive contracts than competitive contracts. MTA
and NYSUDC also contributed to this increase by awarding a combined total of $698.6 million in new non-
competitive procurement contracts, or $1.0 billion. NYSUDC awarded $1.5 billion towards redevelopment
of the Moynihan Station and expended $308.6 million in 2018.
As shown in Table 12, local authorities reported spending $2.9 billion in procurement contracts during the
2018 reporting year, which is the same as 2017. However, when New York City Health and Hospitals
Corporation and New York City School Construction Authority are removed from the calculations,
procurement transactions show an increase of 12.4 percent. This increase is largely caused by Syracuse
Regional Airport Authority, which added $24.1 million for design and construction/maintenance contracts
for airport terminal improvements and security services at Syracuse Hancock International Airport.
Compared to 2017, there was not much change in the types of procurement contracts local authorities
were utilizing. The majority of the expended amount was for contracts awarded through a competitive
selection process (64.9 percent). The remaining procurements were either for contracts awarded without
a competitive selection process (15.3 percent), purchases under state contract (4.2 percent), or non-
contract procurement/purchase order (15.6 percent).
Table 13 indicates that IDAs reported spending $34.6 million in procurement transactions during the 2018
reporting year. Although IDAs have historically reported spending less than all other authority types, it is
unusual for them to show a decrease in overall procurement transactions when compared against the
previous year. This year IDAs report a 16.4 percent decrease, or a total of $6.8 million less than reported
for 2017. Broome, Monroe, Ontario County, St. Lawrence County and Tioga County IDAs combined
Authorities Budget Office 30
2019 Annual Report on Public Authorities in New York State
reported $7.9 million less in procurement transactions than they reported in 2017. Erie County is the one
anomaly reporting a $5 million increase in procurement transactions, focused mostly on competitive
construction and maintenance contracts for the Buffalo Southern railroad and Bethlehem Rail project.
IDAs reported spending the lowest percentage of procurements on competitive contracts (48.0 percent).
The remaining IDA procurements were either awarded through non-competitive bids (37.6 percent), non-
contract procurement/purchase order (13.6 percent) or under state contracts (1.0 percent).
Additionally, Table 14 shows that LDCs reported spending $5.5 billion in procurement contracts during
the 2018 reporting year. This is an increase of 878 percent when compared to 2017, caused solely by the
$4.9 billion in new contracts for New York City Economic Development Corporation (NYCEDC), which
include $3.3 billion in consulting services for various projects such as management of the five boroughs,
the Coney Island Hospital Campus Construction Project, and Rockaway Boardwalk construction. When
NYCEDC is excluded from the analysis, overall procurements for LDCs totals $158.6 million, or a decrease
of 72.2 percent. Authorities who decreased their overall spending the most in 2018 compared to 2017 are
Brooklyn Bridge Park Corporation ($5.8 million), Southern Tier Network, Inc ($2.6 million), and The
Mayor’s Fund to Advance New York City ($1.8 million). The majority expended was on contracts awarded
through a competitive selection process (82.5 percent). The remaining procurements were either
awarded through a non-competitive bidding process (16.9 percent), non-contract procurement/purchase
order (0.5 percent) or purchased under state contract (less than 0.1 percent).
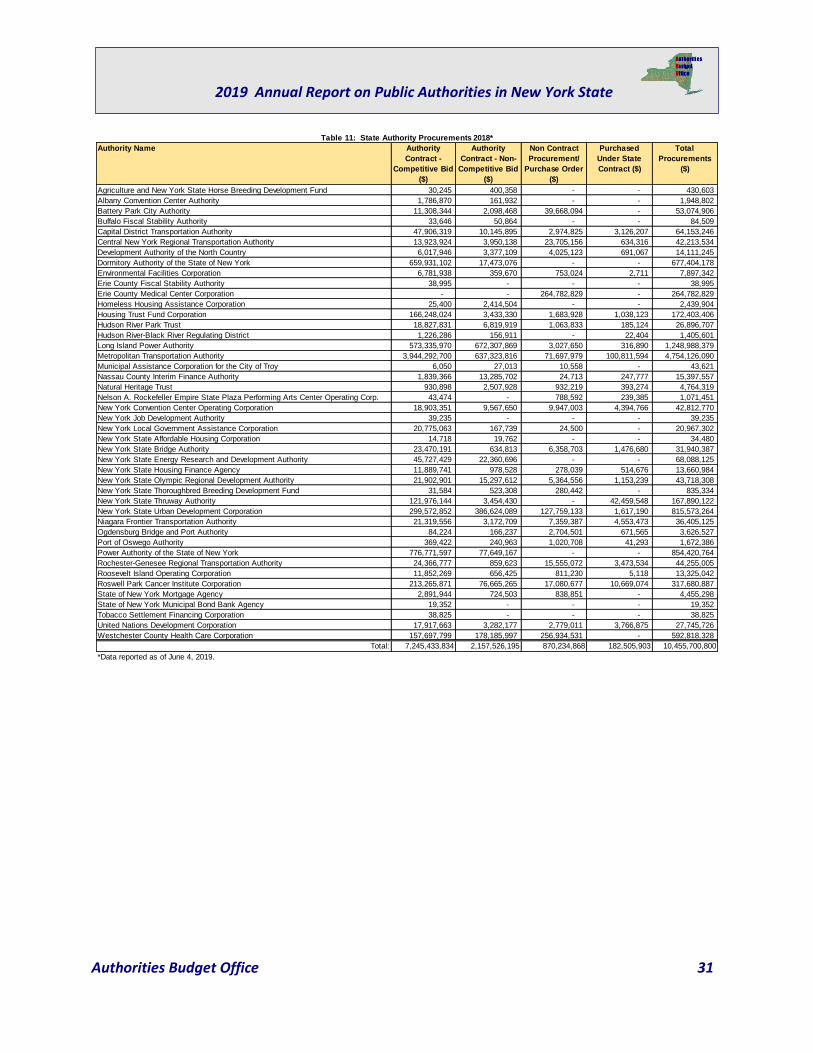
Authorities Budget Office 31
2019 Annual Report on Public Authorities in New York State
Authority Name Authority
Contract -
Competitive Bid
($)
Authority
Contract - Non-
Competitive Bid
($)
Non Contract
Procurement/
Purchase Order
($)
Purchased
Under State
Contract ($)
Total
Procurements
($)
Agriculture and New York State Horse Breeding Development Fund 30,245 400,358 - - 430,603
Albany Convention Center Authority 1,786,870 161,932 - - 1,948,802
Battery Park City Authority 11,308,344 2,098,468 39,668,094 - 53,074,906
Buffalo Fiscal Stability Authority 33,646 50,864 - - 84,509
Capital District Transportation Authority 47,906,319 10,145,895 2,974,825 3,126,207 64,153,246
Central New York Regional Transportation Authority 13,923,924 3,950,138 23,705,156 634,316 42,213,534
Development Authority of the North Country 6,017,946 3,377,109 4,025,123 691,067 14,111,245
Dormitory Authority of the State of New York 659,931,102 17,473,076 - - 677,404,178
Environmental Facilities Corporation 6,781,938 359,670 753,024 2,711 7,897,342
Erie County Fiscal Stability Authority 38,995 - - - 38,995
Erie County Medical Center Corporation - - 264,782,829 - 264,782,829
Homeless Housing Assistance Corporation 25,400 2,414,504 - - 2,439,904
Housing Trust Fund Corporation 166,248,024 3,433,330 1,683,928 1,038,123 172,403,406
Hudson River Park Trust 18,827,831 6,819,919 1,063,833 185,124 26,896,707
Hudson River-Black River Regulating District 1,226,286 156,911 - 22,404 1,405,601
Long Island Power Authority 573,335,970 672,307,869 3,027,650 316,890 1,248,988,379
Metropolitan Transportation Authority 3,944,292,700 637,323,816 71,697,979 100,811,594 4,754,126,090
Municipal Assistance Corporation for the City of Troy 6,050 27,013 10,558 - 43,621
Nassau County Interim Finance Authority 1,839,366 13,285,702 24,713 247,777 15,397,557
Natural Heritage Trust 930,898 2,507,928 932,219 393,274 4,764,319
Nelson A. Rockefeller Empire State Plaza Performing Arts Center Operating Corp. 43,474 - 788,592 239,385 1,071,451
New York Convention Center Operating Corporation 18,903,351 9,567,650 9,947,003 4,394,766 42,812,770
New York Job Development Authority 39,235 - - - 39,235
New York Local Government Assistance Corporation 20,775,063 167,739 24,500 - 20,967,302
New York State Affordable Housing Corporation 14,718 19,762 - - 34,480
New York State Bridge Authority 23,470,191 634,813 6,358,703 1,476,680 31,940,387
New York State Energy Research and Development Authority 45,727,429 22,360,696 - - 68,088,125
New York State Housing Finance Agency 11,889,741 978,528 278,039 514,676 13,660,984
New York State Olympic Regional Development Authority 21,902,901 15,297,612 5,364,556 1,153,239 43,718,308
New York State Thoroughbred Breeding Development Fund 31,584 523,308 280,442 - 835,334
New York State Thruway Authority 121,976,144 3,454,430 - 42,459,548 167,890,122
New York State Urban Development Corporation 299,572,852 386,624,089 127,759,133 1,617,190 815,573,264
Niagara Frontier Transportation Authority 21,319,556 3,172,709 7,359,387 4,553,473 36,405,125
Ogdensburg Bridge and Port Authority 84,224 166,237 2,704,501 671,565 3,626,527
Port of Oswego Authority 369,422 240,963 1,020,708 41,293 1,672,386
Power Authority of the State of New York 776,771,597 77,649,167 - - 854,420,764
Rochester-Genesee Regional Transportation Authority 24,366,777 859,623 15,555,072 3,473,534 44,255,005
Roosevelt Island Operating Corporation 11,852,269 656,425 811,230 5,118 13,325,042
Roswell Park Cancer Institute Corporation 213,265,871 76,665,265 17,080,677 10,669,074 317,680,887
State of New York Mortgage Agency 2,891,944 724,503 838,851 - 4,455,298
State of New York Municipal Bond Bank Agency 19,352 - - - 19,352
Tobacco Settlement Financing Corporation 38,825 - - - 38,825
United Nations Development Corporation 17,917,663 3,282,177 2,779,011 3,766,875 27,745,726
Westchester County Health Care Corporation 157,697,799 178,185,997 256,934,531 - 592,818,328
Total: 7,245,433,834 2,157,526,195 870,234,868 182,505,903 10,455,700,800
*Data reported as of June 4, 2019.
Table 11: State Authority Procurements 2018*
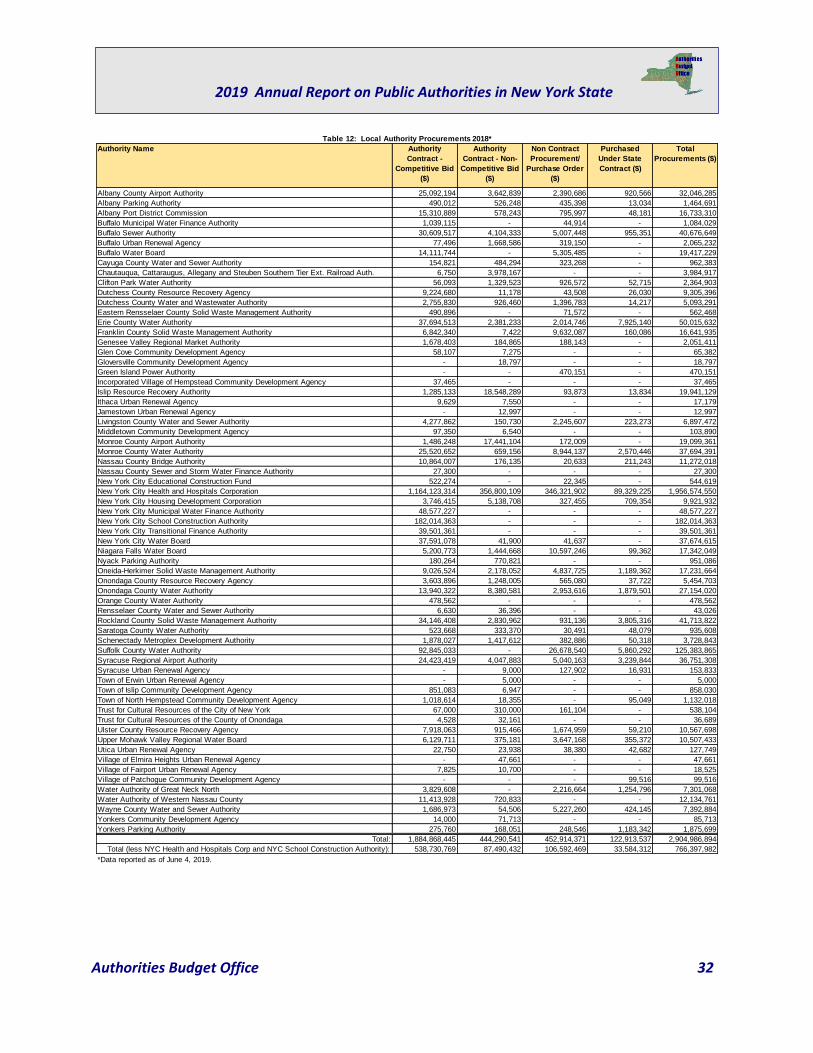
Authorities Budget Office 32
2019 Annual Report on Public Authorities in New York State
Authority Name Authority
Contract -
Competitive Bid
($)
Authority
Contract - Non-
Competitive Bid
($)
Non Contract
Procurement/
Purchase Order
($)
Purchased
Under State
Contract ($)
Total
Procurements ($)
Albany County Airport Authority 25,092,194 3,642,839 2,390,686 920,566 32,046,285
Albany Parking Authority 490,012 526,248 435,398 13,034 1,464,691
Albany Port District Commission 15,310,889 578,243 795,997 48,181 16,733,310
Buffalo Municipal Water Finance Authority 1,039,115 - 44,914 - 1,084,029
Buffalo Sewer Authority 30,609,517 4,104,333 5,007,448 955,351 40,676,649
Buffalo Urban Renewal Agency 77,496 1,668,586 319,150 - 2,065,232
Buffalo Water Board 14,111,744 - 5,305,485 - 19,417,229
Cayuga County Water and Sewer Authority 154,821 484,294 323,268 - 962,383
Chautauqua, Cattaraugus, Allegany and Steuben Southern Tier Ext. Railroad Auth. 6,750 3,978,167 - - 3,984,917
Clifton Park Water Authority 56,093 1,329,523 926,572 52,715 2,364,903
Dutchess County Resource Recovery Agency 9,224,680 11,178 43,508 26,030 9,305,396
Dutchess County Water and Wastewater Authority 2,755,830 926,460 1,396,783 14,217 5,093,291
Eastern Rensselaer County Solid Waste Management Authority 490,896 - 71,572 - 562,468
Erie County Water Authority 37,694,513 2,381,233 2,014,746 7,925,140 50,015,632
Franklin County Solid Waste Management Authority 6,842,340 7,422 9,632,087 160,086 16,641,935
Genesee Valley Regional Market Authority 1,678,403 184,865 188,143 - 2,051,411
Glen Cove Community Development Agency 58,107 7,275 - - 65,382
Gloversville Community Development Agency - 18,797 - - 18,797
Green Island Power Authority - - 470,151 - 470,151
Incorporated Village of Hempstead Community Development Agency 37,465 - - - 37,465
Islip Resource Recovery Authority 1,285,133 18,548,289 93,873 13,834 19,941,129
Ithaca Urban Renewal Agency 9,629 7,550 - - 17,179
Jamestown Urban Renewal Agency - 12,997 - - 12,997
Livingston County Water and Sewer Authority 4,277,862 150,730 2,245,607 223,273 6,897,472
Middletown Community Development Agency 97,350 6,540 - - 103,890
Monroe County Airport Authority 1,486,248 17,441,104 172,009 - 19,099,361
Monroe County Water Authority 25,520,652 659,156 8,944,137 2,570,446 37,694,391
Nassau County Bridge Authority 10,864,007 176,135 20,633 211,243 11,272,018
Nassau County Sewer and Storm Water Finance Authority 27,300 - - - 27,300
New York City Educational Construction Fund 522,274 - 22,345 - 544,619
New York City Health and Hospitals Corporation 1,164,123,314 356,800,109 346,321,902 89,329,225 1,956,574,550
New York City Housing Development Corporation 3,746,415 5,138,708 327,455 709,354 9,921,932
New York City Municipal Water Finance Authority 48,577,227 - - - 48,577,227
New York City School Construction Authority 182,014,363 - - - 182,014,363
New York City Transitional Finance Authority 39,501,361 - - - 39,501,361
New York City Water Board 37,591,078 41,900 41,637 - 37,674,615
Niagara Falls Water Board 5,200,773 1,444,668 10,597,246 99,362 17,342,049
Nyack Parking Authority 180,264 770,821 - - 951,086
Oneida-Herkimer Solid Waste Management Authority 9,026,524 2,178,052 4,837,725 1,189,362 17,231,664
Onondaga County Resource Recovery Agency 3,603,896 1,248,005 565,080 37,722 5,454,703
Onondaga County Water Authority 13,940,322 8,380,581 2,953,616 1,879,501 27,154,020
Orange County Water Authority 478,562 - - - 478,562
Rensselaer County Water and Sewer Authority 6,630 36,396 - - 43,026
Rockland County Solid Waste Management Authority 34,146,408 2,830,962 931,136 3,805,316 41,713,822
Saratoga County Water Authority 523,668 333,370 30,491 48,079 935,608
Schenectady Metroplex Development Authority 1,878,027 1,417,612 382,886 50,318 3,728,843
Suffolk County Water Authority 92,845,033 - 26,678,540 5,860,292 125,383,865
Syracuse Regional Airport Authority 24,423,419 4,047,883 5,040,163 3,239,844 36,751,308
Syracuse Urban Renewal Agency - 9,000 127,902 16,931 153,833
Town of Erwin Urban Renewal Agency - 5,000 - - 5,000
Town of Islip Community Development Agency 851,083 6,947 - - 858,030
Town of North Hempstead Community Development Agency 1,018,614 18,355 - 95,049 1,132,018
Trust for Cultural Resources of the City of New York 67,000 310,000 161,104 - 538,104
Trust for Cultural Resources of the County of Onondaga 4,528 32,161 - - 36,689
Ulster County Resource Recovery Agency 7,918,063 915,466 1,674,959 59,210 10,567,698
Upper Mohawk Valley Regional Water Board 6,129,711 375,181 3,647,168 355,372 10,507,433
Utica Urban Renewal Agency 22,750 23,938 38,380 42,682 127,749
Village of Elmira Heights Urban Renewal Agency - 47,661 - - 47,661
Village of Fairport Urban Renewal Agency 7,825 10,700 - - 18,525
Village of Patchogue Community Development Agency - - - 99,516 99,516
Water Authority of Great Neck North 3,829,608 - 2,216,664 1,254,796 7,301,068
Water Authority of Western Nassau County 11,413,928 720,833 - - 12,134,761
Wayne County Water and Sewer Authority 1,686,973 54,506 5,227,260 424,145 7,392,884
Yonkers Community Development Agency 14,000 71,713 - - 85,713
Yonkers Parking Authority 275,760 168,051 248,546 1,183,342 1,875,699
Total: 1,884,868,445 444,290,541 452,914,371 122,913,537 2,904,986,894
Total (less NYC Health and Hospitals Corp and NYC School Construction Authority): 538,730,769 87,490,432 106,592,469 33,584,312 766,397,982
*Data reported as of June 4, 2019.
Table 12: Local Authority Procurements 2018*
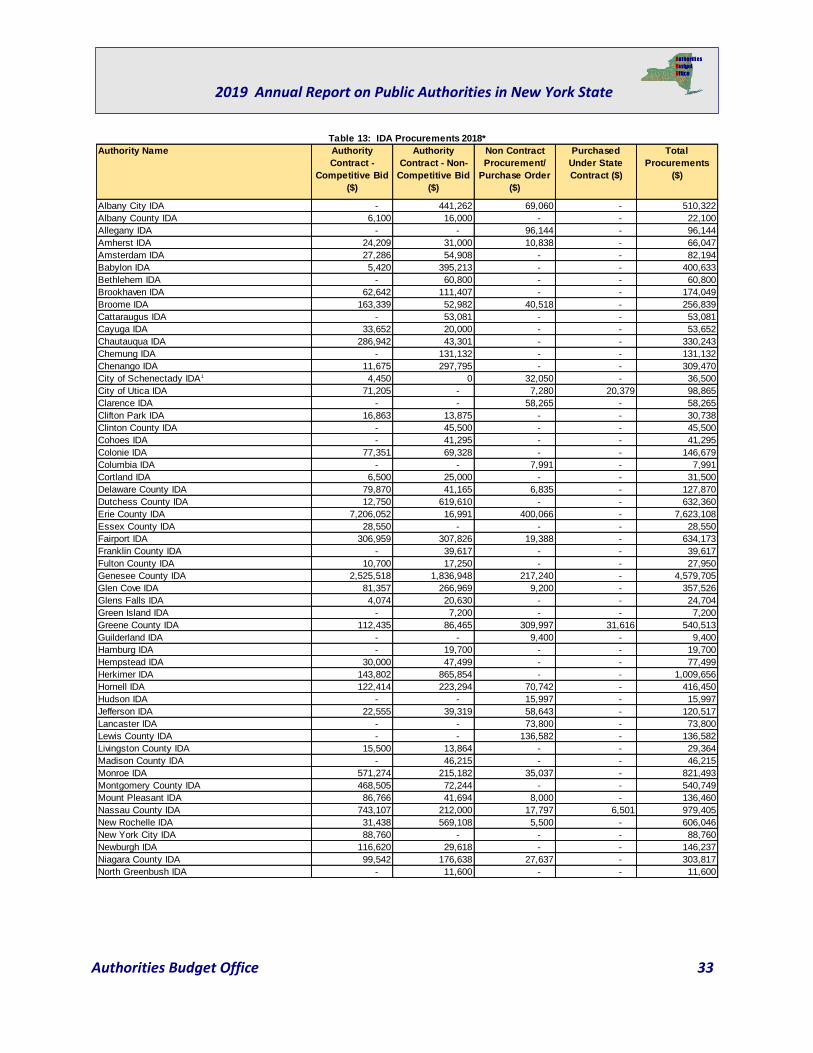
Authorities Budget Office 33
2019 Annual Report on Public Authorities in New York State
Authority Name Authority
Contract -
Competitive Bid
($)
Authority
Contract - Non-
Competitive Bid
($)
Non Contract
Procurement/
Purchase Order
($)
Purchased
Under State
Contract ($)
Total
Procurements
($)
Albany City IDA - 441,262 69,060 - 510,322
Albany County IDA 6,100 16,000 - - 22,100
Allegany IDA - - 96,144 - 96,144
Amherst IDA 24,209 31,000 10,838 - 66,047
Amsterdam IDA 27,286 54,908 - - 82,194
Babylon IDA 5,420 395,213 - - 400,633
Bethlehem IDA - 60,800 - - 60,800
Brookhaven IDA 62,642 111,407 - - 174,049
Broome IDA 163,339 52,982 40,518 - 256,839
Cattaraugus IDA - 53,081 - - 53,081
Cayuga IDA 33,652 20,000 - - 53,652
Chautauqua IDA 286,942 43,301 - - 330,243
Chemung IDA - 131,132 - - 131,132
Chenango IDA 11,675 297,795 - - 309,470
City of Schenectady IDA1 4,450 0 32,050 - 36,500
City of Utica IDA 71,205 - 7,280 20,379 98,865
Clarence IDA - - 58,265 - 58,265
Clifton Park IDA 16,863 13,875 - - 30,738
Clinton County IDA - 45,500 - - 45,500
Cohoes IDA - 41,295 - - 41,295
Colonie IDA 77,351 69,328 - - 146,679
Columbia IDA - - 7,991 - 7,991
Cortland IDA 6,500 25,000 - - 31,500
Delaware County IDA 79,870 41,165 6,835 - 127,870
Dutchess County IDA 12,750 619,610 - - 632,360
Erie County IDA 7,206,052 16,991 400,066 - 7,623,108
Essex County IDA 28,550 - - - 28,550
Fairport IDA 306,959 307,826 19,388 - 634,173
Franklin County IDA - 39,617 - - 39,617
Fulton County IDA 10,700 17,250 - - 27,950
Genesee County IDA 2,525,518 1,836,948 217,240 - 4,579,705
Glen Cove IDA 81,357 266,969 9,200 - 357,526
Glens Falls IDA 4,074 20,630 - - 24,704
Green Island IDA - 7,200 - - 7,200
Greene County IDA 112,435 86,465 309,997 31,616 540,513
Guilderland IDA - - 9,400 - 9,400
Hamburg IDA - 19,700 - - 19,700
Hempstead IDA 30,000 47,499 - - 77,499
Herkimer IDA 143,802 865,854 - - 1,009,656
Hornell IDA 122,414 223,294 70,742 - 416,450
Hudson IDA - - 15,997 - 15,997
Jefferson IDA 22,555 39,319 58,643 - 120,517
Lancaster IDA - - 73,800 - 73,800
Lewis County IDA - - 136,582 - 136,582
Livingston County IDA 15,500 13,864 - - 29,364
Madison County IDA - 46,215 - - 46,215
Monroe IDA 571,274 215,182 35,037 - 821,493
Montgomery County IDA 468,505 72,244 - - 540,749
Mount Pleasant IDA 86,766 41,694 8,000 - 136,460
Nassau County IDA 743,107 212,000 17,797 6,501 979,405
New Rochelle IDA 31,438 569,108 5,500 - 606,046
New York City IDA 88,760 - - - 88,760
Newburgh IDA 116,620 29,618 - - 146,237
Niagara County IDA 99,542 176,638 27,637 - 303,817
North Greenbush IDA - 11,600 - - 11,600
Table 13: IDA Procurements 2018*
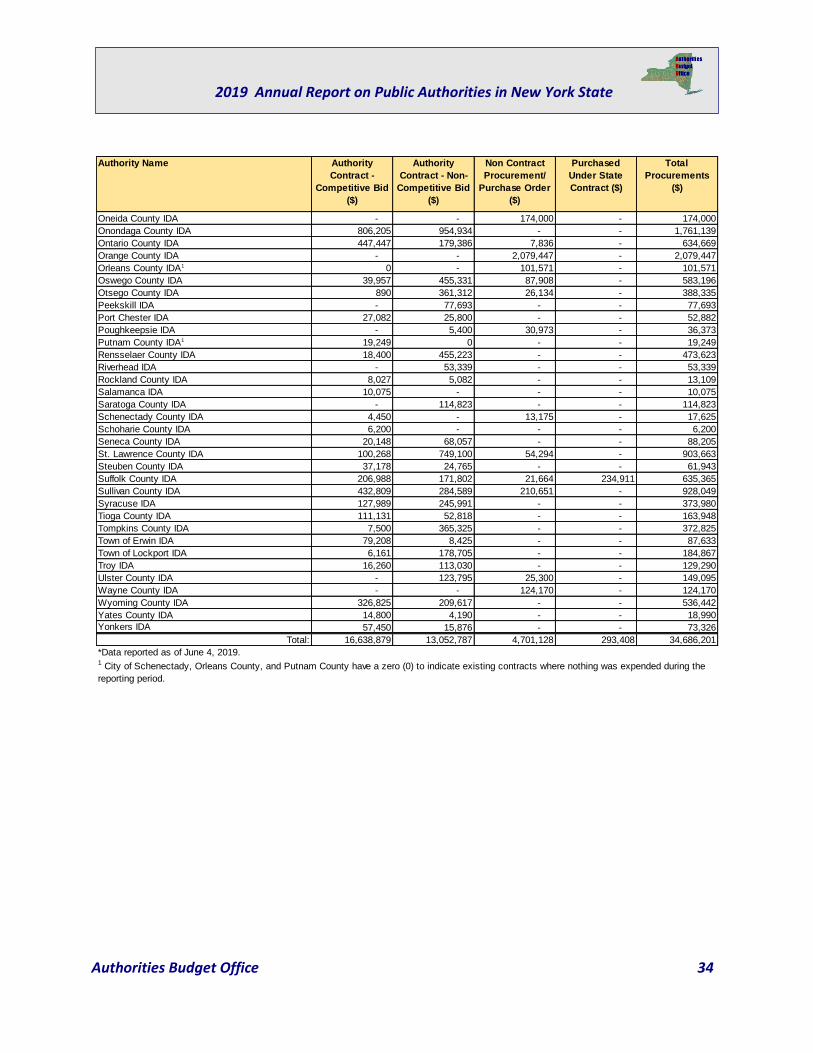
Authorities Budget Office 34
2019 Annual Report on Public Authorities in New York State
Authority Name Authority
Contract -
Competitive Bid
($)
Authority
Contract - Non-
Competitive Bid
($)
Non Contract
Procurement/
Purchase Order
($)
Purchased
Under State
Contract ($)
Total
Procurements
($)
Oneida County IDA - - 174,000 - 174,000
Onondaga County IDA 806,205 954,934 - - 1,761,139
Ontario County IDA 447,447 179,386 7,836 - 634,669
Orange County IDA - - 2,079,447 - 2,079,447
Orleans County IDA1 0 - 101,571 - 101,571
Oswego County IDA 39,957 455,331 87,908 - 583,196
Otsego County IDA 890 361,312 26,134 - 388,335
Peekskill IDA - 77,693 - - 77,693
Port Chester IDA 27,082 25,800 - - 52,882
Poughkeepsie IDA - 5,400 30,973 - 36,373
Putnam County IDA1 19,249 0 - - 19,249
Rensselaer County IDA 18,400 455,223 - - 473,623
Riverhead IDA - 53,339 - - 53,339
Rockland County IDA 8,027 5,082 - - 13,109
Salamanca IDA 10,075 - - - 10,075
Saratoga County IDA - 114,823 - - 114,823
Schenectady County IDA 4,450 - 13,175 - 17,625
Schoharie County IDA 6,200 - - - 6,200
Seneca County IDA 20,148 68,057 - - 88,205
St. Lawrence County IDA 100,268 749,100 54,294 - 903,663
Steuben County IDA 37,178 24,765 - - 61,943
Suffolk County IDA 206,988 171,802 21,664 234,911 635,365
Sullivan County IDA 432,809 284,589 210,651 - 928,049
Syracuse IDA 127,989 245,991 - - 373,980
Tioga County IDA 111,131 52,818 - - 163,948
Tompkins County IDA 7,500 365,325 - - 372,825
Town of Erwin IDA 79,208 8,425 - - 87,633
Town of Lockport IDA 6,161 178,705 - - 184,867
Troy IDA 16,260 113,030 - - 129,290
Ulster County IDA - 123,795 25,300 - 149,095
Wayne County IDA - - 124,170 - 124,170
Wyoming County IDA 326,825 209,617 - - 536,442
Yates County IDA 14,800 4,190 - - 18,990
Yonkers IDA 57,450 15,876 - - 73,326
Total: 16,638,879 13,052,787 4,701,128 293,408 34,686,201
*Data reported as of June 4, 2019.1 City of Schenectady, Orleans County, and Putnam County have a zero (0) to indicate existing contracts where nothing was expended during the
reporting period.
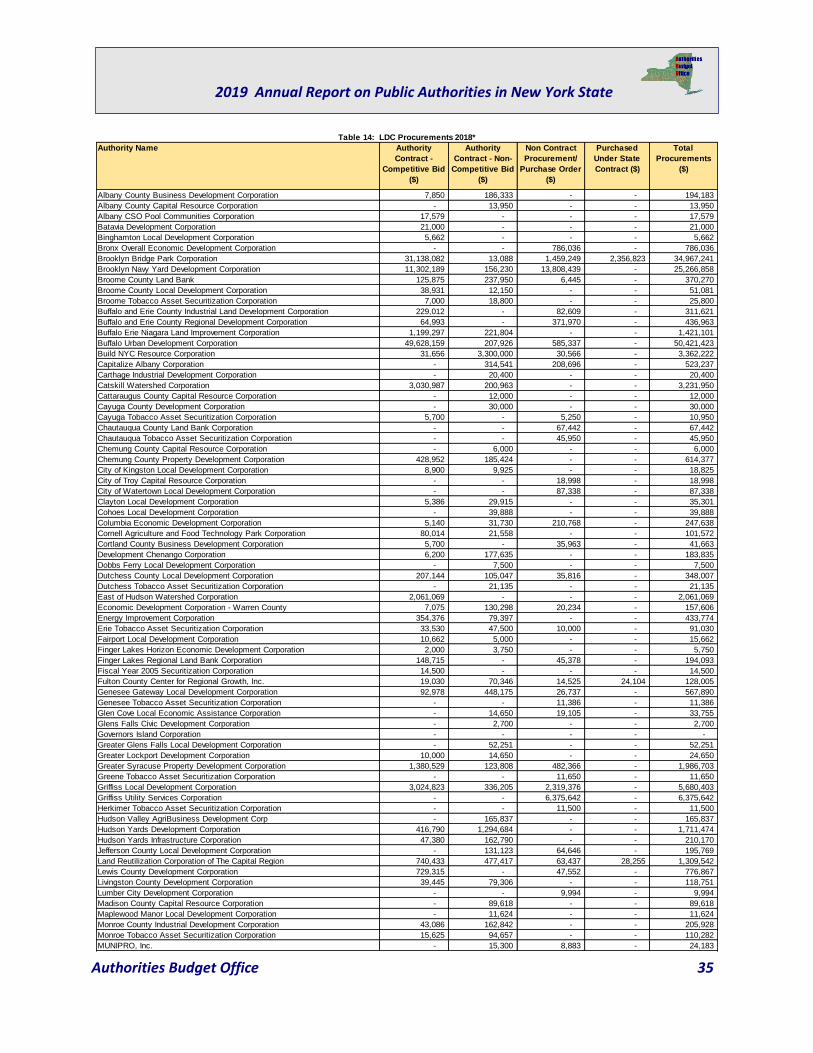
Authorities Budget Office 35
2019 Annual Report on Public Authorities in New York State
Authority Name Authority
Contract -
Competitive Bid
($)
Authority
Contract - Non-
Competitive Bid
($)
Non Contract
Procurement/
Purchase Order
($)
Purchased
Under State
Contract ($)
Total
Procurements
($)
Albany County Business Development Corporation 7,850 186,333 - - 194,183
Albany County Capital Resource Corporation - 13,950 - - 13,950
Albany CSO Pool Communities Corporation 17,579 - - - 17,579
Batavia Development Corporation 21,000 - - - 21,000
Binghamton Local Development Corporation 5,662 - - - 5,662
Bronx Overall Economic Development Corporation - - 786,036 - 786,036
Brooklyn Bridge Park Corporation 31,138,082 13,088 1,459,249 2,356,823 34,967,241
Brooklyn Navy Yard Development Corporation 11,302,189 156,230 13,808,439 - 25,266,858
Broome County Land Bank 125,875 237,950 6,445 - 370,270
Broome County Local Development Corporation 38,931 12,150 - - 51,081
Broome Tobacco Asset Securitization Corporation 7,000 18,800 - - 25,800
Buffalo and Erie County Industrial Land Development Corporation 229,012 - 82,609 - 311,621
Buffalo and Erie County Regional Development Corporation 64,993 - 371,970 - 436,963
Buffalo Erie Niagara Land Improvement Corporation 1,199,297 221,804 - - 1,421,101
Buffalo Urban Development Corporation 49,628,159 207,926 585,337 - 50,421,423
Build NYC Resource Corporation 31,656 3,300,000 30,566 - 3,362,222
Capitalize Albany Corporation - 314,541 208,696 - 523,237
Carthage Industrial Development Corporation - 20,400 - - 20,400
Catskill Watershed Corporation 3,030,987 200,963 - - 3,231,950
Cattaraugus County Capital Resource Corporation - 12,000 - - 12,000
Cayuga County Development Corporation - 30,000 - - 30,000
Cayuga Tobacco Asset Securitization Corporation 5,700 - 5,250 - 10,950
Chautauqua County Land Bank Corporation - - 67,442 - 67,442
Chautauqua Tobacco Asset Securitization Corporation - - 45,950 - 45,950
Chemung County Capital Resource Corporation - 6,000 - - 6,000
Chemung County Property Development Corporation 428,952 185,424 - - 614,377
City of Kingston Local Development Corporation 8,900 9,925 - - 18,825
City of Troy Capital Resource Corporation - - 18,998 - 18,998
City of Watertown Local Development Corporation - - 87,338 - 87,338
Clayton Local Development Corporation 5,386 29,915 - - 35,301
Cohoes Local Development Corporation - 39,888 - - 39,888
Columbia Economic Development Corporation 5,140 31,730 210,768 - 247,638
Cornell Agriculture and Food Technology Park Corporation 80,014 21,558 - - 101,572
Cortland County Business Development Corporation 5,700 - 35,963 - 41,663
Development Chenango Corporation 6,200 177,635 - - 183,835
Dobbs Ferry Local Development Corporation - 7,500 - - 7,500
Dutchess County Local Development Corporation 207,144 105,047 35,816 - 348,007
Dutchess Tobacco Asset Securitization Corporation - 21,135 - - 21,135
East of Hudson Watershed Corporation 2,061,069 - - - 2,061,069
Economic Development Corporation - Warren County 7,075 130,298 20,234 - 157,606
Energy Improvement Corporation 354,376 79,397 - - 433,774
Erie Tobacco Asset Securitization Corporation 33,530 47,500 10,000 - 91,030
Fairport Local Development Corporation 10,662 5,000 - - 15,662
Finger Lakes Horizon Economic Development Corporation 2,000 3,750 - - 5,750
Finger Lakes Regional Land Bank Corporation 148,715 - 45,378 - 194,093
Fiscal Year 2005 Securitization Corporation 14,500 - - - 14,500
Fulton County Center for Regional Growth, Inc. 19,030 70,346 14,525 24,104 128,005
Genesee Gateway Local Development Corporation 92,978 448,175 26,737 - 567,890
Genesee Tobacco Asset Securitization Corporation - - 11,386 - 11,386
Glen Cove Local Economic Assistance Corporation - 14,650 19,105 - 33,755
Glens Falls Civic Development Corporation - 2,700 - - 2,700
Governors Island Corporation - - - - -
Greater Glens Falls Local Development Corporation - 52,251 - - 52,251
Greater Lockport Development Corporation 10,000 14,650 - - 24,650
Greater Syracuse Property Development Corporation 1,380,529 123,808 482,366 - 1,986,703
Greene Tobacco Asset Securitization Corporation - - 11,650 - 11,650
Griffiss Local Development Corporation 3,024,823 336,205 2,319,376 - 5,680,403
Griffiss Utility Services Corporation - - 6,375,642 - 6,375,642
Herkimer Tobacco Asset Securitization Corporation - - 11,500 - 11,500
Hudson Valley AgriBusiness Development Corp - 165,837 - - 165,837
Hudson Yards Development Corporation 416,790 1,294,684 - - 1,711,474
Hudson Yards Infrastructure Corporation 47,380 162,790 - - 210,170
Jefferson County Local Development Corporation - 131,123 64,646 - 195,769
Land Reutilization Corporation of The Capital Region 740,433 477,417 63,437 28,255 1,309,542
Lewis County Development Corporation 729,315 - 47,552 - 776,867
Livingston County Development Corporation 39,445 79,306 - - 118,751
Lumber City Development Corporation - - 9,994 - 9,994
Madison County Capital Resource Corporation - 89,618 - - 89,618
Maplewood Manor Local Development Corporation - 11,624 - - 11,624
Monroe County Industrial Development Corporation 43,086 162,842 - - 205,928
Monroe Tobacco Asset Securitization Corporation 15,625 94,657 - - 110,282
MUNIPRO, Inc. - 15,300 8,883 - 24,183
Table 14: LDC Procurements 2018*
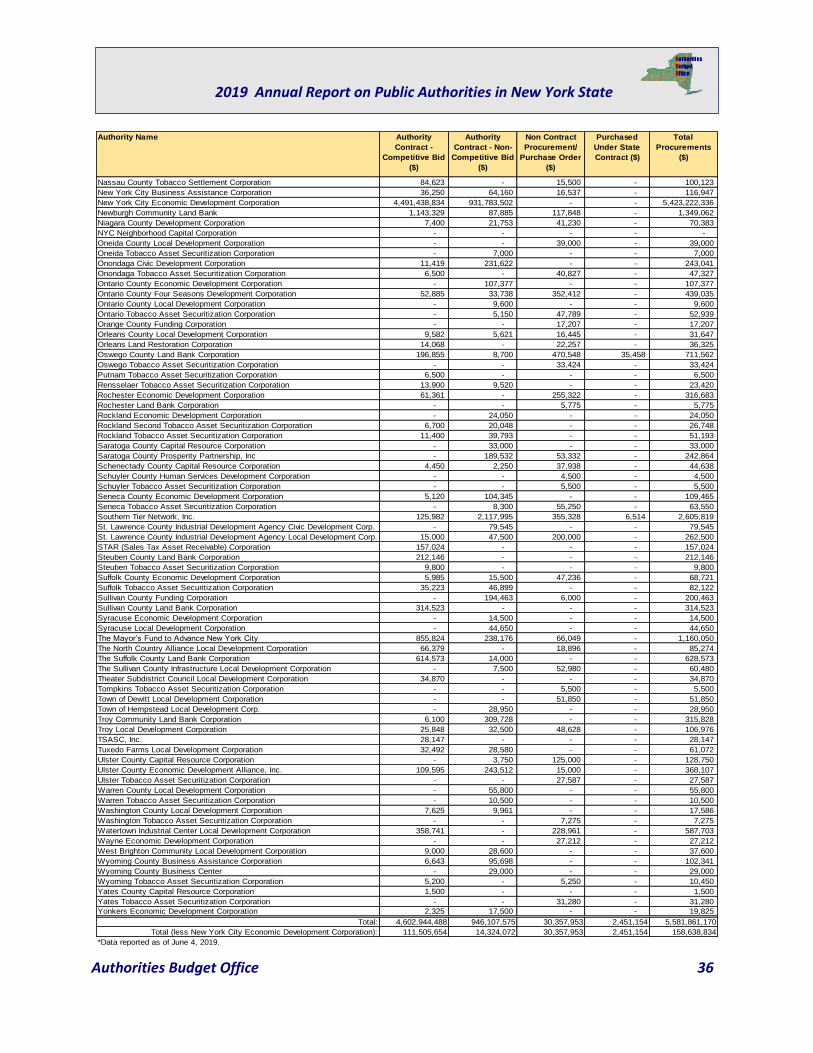
Authorities Budget Office 36
2019 Annual Report on Public Authorities in New York State
Authority Name Authority
Contract -
Competitive Bid
($)
Authority
Contract - Non-
Competitive Bid
($)
Non Contract
Procurement/
Purchase Order
($)
Purchased
Under State
Contract ($)
Total
Procurements
($)
Nassau County Tobacco Settlement Corporation 84,623 - 15,500 - 100,123
New York City Business Assistance Corporation 36,250 64,160 16,537 - 116,947
New York City Economic Development Corporation 4,491,438,834 931,783,502 - - 5,423,222,336
Newburgh Community Land Bank 1,143,329 87,885 117,848 - 1,349,062
Niagara County Development Corporation 7,400 21,753 41,230 - 70,383
NYC Neighborhood Capital Corporation - - - - -
Oneida County Local Development Corporation - - 39,000 - 39,000
Oneida Tobacco Asset Securitization Corporation - 7,000 - - 7,000
Onondaga Civic Development Corporation 11,419 231,622 - - 243,041
Onondaga Tobacco Asset Securitization Corporation 6,500 - 40,827 - 47,327
Ontario County Economic Development Corporation - 107,377 - - 107,377
Ontario County Four Seasons Development Corporation 52,885 33,738 352,412 - 439,035
Ontario County Local Development Corporation - 9,600 - - 9,600
Ontario Tobacco Asset Securitization Corporation - 5,150 47,789 - 52,939
Orange County Funding Corporation - - 17,207 - 17,207
Orleans County Local Development Corporation 9,582 5,621 16,445 - 31,647
Orleans Land Restoration Corporation 14,068 - 22,257 - 36,325
Oswego County Land Bank Corporation 196,855 8,700 470,548 35,458 711,562
Oswego Tobacco Asset Securitization Corporation - - 33,424 - 33,424
Putnam Tobacco Asset Securitization Corporation 6,500 - - - 6,500
Rensselaer Tobacco Asset Securitization Corporation 13,900 9,520 - - 23,420
Rochester Economic Development Corporation 61,361 - 255,322 - 316,683
Rochester Land Bank Corporation - - 5,775 - 5,775
Rockland Economic Development Corporation - 24,050 - - 24,050
Rockland Second Tobacco Asset Securitization Corporation 6,700 20,048 - - 26,748
Rockland Tobacco Asset Securitization Corporation 11,400 39,793 - - 51,193
Saratoga County Capital Resource Corporation - 33,000 - - 33,000
Saratoga County Prosperity Partnership, Inc - 189,532 53,332 - 242,864
Schenectady County Capital Resource Corporation 4,450 2,250 37,938 - 44,638
Schuyler County Human Services Development Corporation - - 4,500 - 4,500
Schuyler Tobacco Asset Securitization Corporation - - 5,500 - 5,500
Seneca County Economic Development Corporation 5,120 104,345 - - 109,465
Seneca Tobacco Asset Securitization Corporation - 8,300 55,250 - 63,550
Southern Tier Network, Inc. 125,982 2,117,995 355,328 6,514 2,605,819
St. Lawrence County Industrial Development Agency Civic Development Corp. - 79,545 - - 79,545
St. Lawrence County Industrial Development Agency Local Development Corp. 15,000 47,500 200,000 - 262,500
STAR (Sales Tax Asset Receivable) Corporation 157,024 - - - 157,024
Steuben County Land Bank Corporation 212,146 - - - 212,146
Steuben Tobacco Asset Securitization Corporation 9,800 - - - 9,800
Suffolk County Economic Development Corporation 5,985 15,500 47,236 - 68,721
Suffolk Tobacco Asset Securitization Corporation 35,223 46,899 - - 82,122
Sullivan County Funding Corporation - 194,463 6,000 - 200,463
Sullivan County Land Bank Corporation 314,523 - - - 314,523
Syracuse Economic Development Corporation - 14,500 - - 14,500
Syracuse Local Development Corporation - 44,650 - - 44,650
The Mayor’s Fund to Advance New York City 855,824 238,176 66,049 - 1,160,050
The North Country Alliance Local Development Corporation 66,379 - 18,896 - 85,274
The Suffolk County Land Bank Corporation 614,573 14,000 - - 628,573
The Sullivan County Infrastructure Local Development Corporation - 7,500 52,980 - 60,480
Theater Subdistrict Council Local Development Corporation 34,870 - - - 34,870
Tompkins Tobacco Asset Securitization Corporation - - 5,500 - 5,500
Town of Dewitt Local Development Corporation - - 51,850 - 51,850
Town of Hempstead Local Development Corp. - 28,950 - - 28,950
Troy Community Land Bank Corporation 6,100 309,728 - - 315,828
Troy Local Development Corporation 25,848 32,500 48,628 - 106,976
TSASC, Inc. 28,147 - - - 28,147
Tuxedo Farms Local Development Corporation 32,492 28,580 - - 61,072
Ulster County Capital Resource Corporation - 3,750 125,000 - 128,750
Ulster County Economic Development Alliance, Inc. 109,595 243,512 15,000 - 368,107
Ulster Tobacco Asset Securitization Corporation - - 27,587 - 27,587
Warren County Local Development Corporation - 55,800 - - 55,800
Warren Tobacco Asset Securitization Corporation - 10,500 - - 10,500
Washington County Local Development Corporation 7,625 9,961 - - 17,586
Washington Tobacco Asset Securitization Corporation - - 7,275 - 7,275
Watertown Industrial Center Local Development Corporation 358,741 - 228,961 - 587,703
Wayne Economic Development Corporation - - 27,212 - 27,212
West Brighton Community Local Development Corporation 9,000 28,600 - - 37,600
Wyoming County Business Assistance Corporation 6,643 95,698 - - 102,341
Wyoming County Business Center - 29,000 - - 29,000
Wyoming Tobacco Asset Securitization Corporation 5,200 - 5,250 - 10,450
Yates County Capital Resource Corporation 1,500 - - - 1,500
Yates Tobacco Asset Securitization Corporation - - 31,280 - 31,280
Yonkers Economic Development Corporation 2,325 17,500 - - 19,825
Total: 4,602,944,488 946,107,575 30,357,953 2,451,154 5,581,861,170
Total (less New York City Economic Development Corporation): 111,505,654 14,324,072 30,357,953 2,451,154 158,638,834
*Data reported as of June 4, 2019.
Authorities Budget Office 37
2019 Annual Report on Public Authorities in New York State
Public Authorities Staffing and Compensation 2014 – 2018
Authority Staffing Information
As shown in Table 15, state authorities have reported a moderate 1.6% increase in staffing levels from
2014 to 2018, with a larger 12.8% increase in salaries paid. This is mainly driven by an increase in salaries
reported by the Metropolitan Transportation Authority of $956 million over the same period but also
include salary increases from the New York Convention Center Operating Corporation, Erie County
Medical Center and the Power Authority of the State of New York (NYPA) totaling $200 million over the
5 years. Some state authorities do report decreases in staffing and salary levels from 2014 to 2018. The
largest reported decrease in staffing levels is the New York State Thruway Authority (-342) and also
reduced their salaries by $18.0 million since 2014. The total compensation reported by state authorities
increased to $9.0 billion for 2018.
Local authorities have reported a minimal increase in staffing levels from 2014 to 2018 but the total
compensation reported for 2018 was $3.1 billion, an increase of 12.1 percent, as indicated in Table 16.
This increase in staffing can still be attributed to New York City Health and Hospitals Corporation reporting
the addition of only 128 staff (a 0.3 percent increase) but over $300 million in salaries increase (12.3
percent).
As indicated in Table 17, IDAs reported having a total of 358 staff in 2018 earning a total compensation of
$12.2 million. However, this compensation doesn’t represent the total amount paid to staff working for
IDAs since many IDAs rely on staff that are paid by either a local government or an LDC to perform the
work of the IDA. As a result, there is generally little movement in IDA staffing levels, which increased
slightly 5.0 percent from 2014 to 2018, with salaries increasing 16.7 percent.
Also, in 2018, a total of 122 LDCs, not including TASCs, reported having staff. These entities employed
1,692 individuals at a total cost of $88.3 million. The largest LDC’s by far were the New York City Economic
Development Corporation who reported 513 staff, and Brooklyn Navy Yard who reported 482 staff, which
combined to represent 58.8 percent of total staff and 76.0 percent of total compensation. Similar to IDAs,
this compensation doesn’t represent the total amount paid to staff working for LDCs since many LDCs rely
on staff that are paid by either a local government or another authority to perform the work of the LDC.
Authorities Budget Office 38
2019 Annual Report on Public Authorities in New York State
Authority Name 2014
Staff
2014 Total
Comp.
2015
Staff
2015 Total
Comp.
2016
Staff
2016 Total
Comp.
2017
Staff
2017 Total
Comp.
2018
Staff
2018 Total
Comp.
Agriculture and New York State Horse Breeding Development Fund 2 44,077 1 44,077 1 45,840 1 45,840 3 216,840
Albany Convention Center Authority 2 196,515 2 196,515 2 196,515 2 196,515 2 159,195
Battery Park City Authority 226 9,597,595 194 6,021,897 233 10,383,144 240 10,527,620 246 11,146,915
Buffalo Fiscal Stability Authority 5 342,861 5 352,452 5 380,212 5 372,365 5 375,511
Capital District Transportation Authority 781 35,464,746 771 36,531,923 883 38,151,017 821 41,540,648 873 41,371,384
Central New York Regional Transportation Authority 698 28,491,322 736 29,333,979 764 29,375,705 738 30,096,504 769 30,940,533
Development Authority of the North Country 74 4,169,104 80 4,330,995 84 4,563,852 87 4,792,732 92 5,179,002
Dormitory Authority of the State of New York 549 45,104,535 523 44,306,107 533 45,413,996 557 46,612,369 613 51,557,978
Environmental Facilities Corporation 112 8,054,515 114 8,235,704 122 8,362,226 115 8,674,666 112 9,058,651
Erie County Fiscal Stability Authority 4 263,553 4 281,763 4 281,763 3 246,030 3 228,184
Erie County Medical Center Corporation 3,506 179,187,483 3,800 201,182,031 3,945 208,273,474 4,023 221,324,435 4,257 238,509,443
Housing Trust Fund Corporation 130 7,258,673 213 13,055,048 242 17,352,325 219 16,549,054 204 16,824,646
Hudson River Park Trust 110 4,766,549 104 5,060,349 109 5,238,909 117 5,667,952 134 6,284,656
Hudson River-Black River Regulating District 19 1,109,697 20 1,236,182 22 1,413,996 24 1,504,027 21 1,244,093
Long Island Power Authority 100 6,967,473 55 5,722,811 52 5,679,212 54 7,095,535 62 7,644,230
Metropolitan Transportation Authority 78,551 6,231,899,537 78,493 6,198,769,381 78,087 6,354,767,490 79,832 6,762,431,346 80,669 7,188,126,411
Municipal Assistance Corporation for the City of Troy 2 - 0 - 0 - 0 - 0 -
Nassau County Interim Finance Authority 5 732,822 5 745,500 5 745,962 5 760,882 7 787,997
Nassau Health Care Corporation 4,145 280,325,806 4,127 295,821,615 4,180 295,235,547
Natural Heritage Trust 82 2,920,027 69 2,623,035 73 2,690,201 76 3,012,158 82 3,564,177
Nelson A. Rockefeller Empire State Plaza Performing Arts Center Operating Corp. 62 514,879 55 563,700 67 581,672 43 584,096 47 619,539
New York Convention Center Operating Corporation 3,468 72,401,098 3,580 83,262,577 4,238 93,386,708 3,786 86,047,756 4,373 136,578,060
New York Job Development Authority 4 - 4 - 4 - 4 - 5 -
New York Local Government Assistance Corporation 24 - 25 - 24 - 24 - 27 -
New York State Affordable Housing Corporation 52 4,006,703 208 4,758,047 214 5,176,315 199 6,486,859 267 7,110,992
New York State Bridge Authority 261 11,605,335 256 11,432,851 257 11,550,248 282 11,771,549 289 12,339,299
New York State Energy Research and Development Authority 337 25,963,409 337 26,761,182 335 28,845,625 326 29,318,629 332 30,783,827
New York State Housing Finance Agency 200 2,844,644 207 2,866,096 246 3,192,973 263 3,478,386 293 3,536,497
New York State Olympic Regional Development Authority 1,734 18,329,230 1,860 20,139,624 1,771 18,968,417 1,734 17,812,615 1,814 20,349,128
New York State Thoroughbred Breeding Development Fund 6 402,946 7 439,921 6 448,427 7 461,288 6 476,560
New York State Thruway Authority1 4,294 182,657,999 4,245 172,744,686 4,303 170,413,305 3,754 151,611,226 3,952 164,630,393
New York State Urban Development Corporation 290 20,683,595 317 23,105,723 329 26,183,009 351 27,124,862 361 29,107,201
Niagara Frontier Transportation Authority 1,694 83,805,127 1,728 85,106,736 1,712 85,749,375 1,714 85,902,251 1,786 92,470,348
Ogdensburg Bridge and Port Authority 66 1,756,412 58 1,654,681 76 1,743,123 96 2,107,032 71 1,971,233
Port of Oswego Authority 136 1,503,435 108 1,285,832 117 1,525,522 103 1,328,176 77 1,116,441
Power Authority of the State of New York1 1,655 150,961,355 1,728 166,369,687 1,782 177,481,232 2,327 208,946,220 2,380 227,452,341
Rochester-Genesee Regional Transportation Authority 916 44,276,562 1,005 46,581,650 1,022 46,163,119 1,045 48,463,769 1,034 48,036,434
Roosevelt Island Operating Corporation 165 6,692,228 171 7,063,762 188 7,551,564 175 7,785,907 187 8,092,779
Roswell Park Cancer Institute Corporation 2,614 194,440,539 2,593 201,265,593 2,716 217,261,423 2,919 228,721,037 3,010 247,856,165
State of New York Mortgage Agency 200 8,180,675 207 8,981,161 246 11,235,767 275 13,772,331 292 15,683,663
State of New York Municipal Bond Bank Agency 200 - 207 - 246 - 269 - 294 -
Tobacco Settlement Financing Corporation 200 - 207 - 248 - 267 - 293 -
United Nations Development Corporation 15 1,600,577 14 1,352,952 12 1,305,120 12 1,158,000 11 1,187,223
Utility Debt Securitization Authority (UDSA) 3 - 3 - 3 - 3 - 4 -
Westchester County Health Care Corporation 3,227 275,294,014 3,296 275,095,811 3,306 285,459,346 3,342 319,092,905 3,302 313,465,527
Total: 110,926 7,954,817,654 111,742 7,994,683,635 112,814 8,222,773,676 110,239 8,413,425,572 112,661 8,976,083,495
Table 15: State Authority Staff (number) and Total Compensation 2014-2018*
*Data Reported as of June 4, 2019. Data shown as - indicates an authority reported $0 in compensation. Fields shaded in grey represent the annual report was not submitted. If an authority has never reported staff, they
are not included in the table. Additionally, the staff count may include duplicate staff members as some employees perform work at multiple authorities.1The New York State Canal Corporation was moved from New York State Thruway Authority and became a subsidiary of the Power Authority of the State of New York effective January 1, 2017.
Authorities Budget Office 39
2019 Annual Report on Public Authorities in New York State
Authority Name 2014
Staff
2014 Total
Comp.
2015
Staff
2015 Total
Comp.
2016
Staff
2016 Total
Comp.
2017
Staff
2017 Total
Comp.
2018
Staff
2018 Total
Comp.
Albany Community Development Agency 13 669,017 15 701,877 15 695,894 17 819,252
Albany County Airport Authority 28 1,681,250 26 1,746,440 30 1,820,953 26 1,899,482 27 1,945,716
Albany Municipal Water Finance Authority 1 - 1 - 0 - 0 -
Albany Parking Authority 28 908,727 47 1,691,677 47 1,584,852 47 1,658,801 51 1,758,681
Albany Port District Commission 55 1,663,476 50 1,663,253 53 1,591,603 55 1,689,265 57 1,781,743
Albany Water Board 146 5,841,817 148 5,609,104 131 5,765,263 159 7,199,808
Amsterdam Urban Renewal Agency 1 10,614 1 10,967 1 11,579 1 11,579 1 12,169
Binghamton Urban Renewal Agency 2 - 3 - 2 - 2 - 2 -
Buffalo Sewer Authority 202 10,652,703 202 10,059,062 235 10,481,193 239 11,362,426 223 11,923,920
Buffalo Urban Renewal Agency 47 2,095,959 49 2,113,931 50 2,336,214 43 2,381,289 42 2,235,044
Buffalo Water Board 95 - 87 - 104 - 117 - 118 -
Cayuga County Water and Sewer Authority 6 109,712 6 190,083 8 205,138 7 166,307 6 198,351
Central New York Regional Market Authority 12 357,833 15 409,425 20 385,839 18 370,796
City of Fulton Community Development Agency 8 277,880 7 280,944 7 287,699 7 287,699
City of Hudson Community Development and Planning Agency1 2 - 2 - 3 25,000 0 -
Clifton Park Water Authority 22 980,220 22 1,007,544 23 1,054,598 23 1,085,470 23 1,096,865
Dutchess County Resource Recovery Agency 5 309,899 3 223,491 5 206,854 5 158,896 4 154,179
Dutchess County Water and Wastewater Authority 21 1,304,053 23 1,467,540 25 1,527,758 33 1,623,790 30 1,670,670
Eastern Rensselaer County Solid Waste Management Authority 4 76,416 4 83,219 4 82,723 4 72,647 3 69,103
Elmira Urban Renewal Agency 0 - 0 - 0 - 4 233,567 5 237,102
Erie County Water Authority 296 16,736,892 289 16,841,676 277 16,725,391 271 17,027,972 263 17,583,070
Franklin County Solid Waste Management Authority 41 1,147,395 40 1,132,075 43 1,179,802 39 1,327,456 39 1,280,312
Freeport Community Development Agency 5 289,121 5 289,121 3 150,733 3 150,733
Genesee Valley Regional Market Authority 7 260,106 8 206,934 7 208,984 9 307,968 8 261,943
Glen Cove Community Development Agency 9 414,823 8 223,601 9 233,205 13 261,574 10 267,102
Glens Falls Urban Renewal Agency 1 4,000 1 4,000 1 4,304 1 4,304 1 4,304
Gloversville Community Development Agency 1 17,243 1 23,493 1 9,795 1 9,795 1 9,795
Greater Rochester Sports Authority 1 -
Green Island Power Authority 12 402,727 12 432,522 12 384,194 11 342,353 12 353,818
Huntington Community Development Agency 8 510,851 8 565,424 9 553,099
Incorporated Village of Hempstead Community Development Agency 3 164,158 6 330,928 6 330,928 3 150,000
Islip Resource Recovery Authority 32 1,782,634 32 1,830,647 32 1,778,268 38 1,870,532 37 1,877,250
Ithaca Urban Renewal Agency 4 192,504 4 217,497 5 198,949 4 222,943 4 227,401
Jamestown Urban Renewal Agency 0 - 10 502,280 10 510,738 11 487,917 9 402,795
Livingston County Water and Sewer Authority 14 676,162 12 562,787 10 557,413 12 629,547 15 653,722
Middletown Community Development Agency 3 - 3 - 3 - 3 - 0 -
Monroe County Airport Authority 108 - 111 - 113 - 98 - 101 -
Monroe County Water Authority 252 15,617,823 250 15,653,496 252 15,347,009 258 16,051,072 259 16,447,268
Mount Vernon Urban Renewal Agency 27 830,261 27 803,289
Nassau County Bridge Authority 71 2,070,596 65 2,447,529 61 1,854,750 59 1,966,317 50 1,909,167
Nassau County Sewer and Storm Water Finance Authority 3 - 3 - 3 - 3 - 3 -
New York City Educational Construction Fund 3 344,574 4 469,570 3 350,960 3 368,658 3 375,609
New York City Health and Hospitals Corporation 43,308 2,479,668,129 47,409 2,622,427,198 48,346 2,876,896,521 45,879 2,870,890,243 43,436 2,783,428,502
New York City Housing Development Corporation 175 15,191,330 175 15,619,749 173 14,969,532 173 15,440,550 189 16,996,794
New York City Municipal Water Finance Authority 29 858,629 27 861,545 23 755,274 27 819,448 26 825,823
New York City School Construction Authority 896 64,095,897 935 72,365,029 935 72,365,029 1,054 83,522,023 1,088 86,696,669
New York City Transitional Finance Authority 31 674,239 27 734,340 24 761,045 26 766,364 27 860,812
New York City Water Board 10 - 10 - 9 - 8 - 7 -
Niagara Falls Urban Renewal Agency 3 - 4 - 4 - 4 - 4 -
Niagara Falls Water Board 108 4,955,482 104 5,097,182 98 4,944,858 141 5,373,872 157 5,856,250
North Hempstead Solid Waste Management Authority 19 1,191,690 22 1,243,947 21 1,010,302 23 1,147,491
Nyack Parking Authority 12 256,165 12 256,165 7 287,082 6 285,825 7 319,923
Olean Urban Renewal Agency 4 4,059 4 4,059 4 4,059 4 4,059 0 -
Oneida County Sports Facility Authority 4 - 3 - 6 - 5 - 3 -
Oneida-Herkimer Solid Waste Management Authority 80 3,656,638 84 3,896,430 83 3,861,297 82 4,114,268 83 4,235,096
Onondaga County Resource Recovery Agency 70 3,830,027 78 3,737,420 77 3,737,568 77 4,110,674 76 4,032,148
Onondaga County Water Authority 141 9,165,367 146 9,505,707 143 9,522,690 177 11,719,100 180 12,128,924
Orange County Water Authority 2 55,733 2 57,189 2 59,046 2 59,046 2 62,203
Port Jervis Community Development Agency 5 136,650
Table 16: Local (Other) Authority Staff (number) and Total Compensation 2014-2018*
Authorities Budget Office 40
2019 Annual Report on Public Authorities in New York State
Authority Name 2014
Staff
2014 Total
Comp.
2015
Staff
2015 Total
Comp.
2016
Staff
2016 Total
Comp.
2017
Staff
2017 Total
Comp.
2018
Staff
2018 Total
Comp.
Rensselaer County Water and Sewer Authority 3 - 3 - 3 - 3 - 3 -
Rockland County Solid Waste Management Authority 32 2,221,695 30 2,257,553 35 2,404,314 34 2,625,057 34 2,675,112
Saratoga County Water Authority 13 506,245 8 356,767 11 330,769 8 347,154 7 360,170
Saratoga Springs City Center Authority 26 672,509 22 668,174 24 804,670 20 723,374
Schenectady Metroplex Development Authority 6 452,565 5 481,145 5 535,490 6 532,378 6 513,656
Schenectady Urban Renewal Agency 2 - 2 - 0 - 0 - 0 -
Suffolk County Water Authority 605 42,293,383 598 41,827,365 600 41,537,934 628 47,977,418 600 46,208,651
Syracuse Regional Airport Authority 10 394,668 12 488,683 15 785,127 17 967,043 38 1,688,477
Town of Erwin Urban Renewal Agency 5 212,086 3 203,533 3 150,063 3 130,940 3 92,538
Town of Islip Community Development Agency 15 955,940 13 845,650 15 904,012 13 883,013 11 829,665
Town of North Hempstead Community Development Agency 3 289,612 3 298,254 3 307,167 3 250,711 3 278,087
Trust for Cultural Resources of the County of Onondaga 5 - 4 - 5 - 5 - 5 -
Ulster County Resource Recovery Agency 43 1,560,559 37 1,676,141 36 1,621,593 37 1,697,197 40 1,702,095
Upper Mohawk Valley Regional Water Board2 190 9,367,997 106 4,983,419 94 4,753,978 92 4,823,330 84 4,617,187
Utica Urban Renewal Agency 5 145,625 5 145,625 10 139,859 10 146,265 10 174,014
Victor Urban Renewal Agency 1 - 1 - 1 - 1 - 1 -
Village of Elmira Heights Urban Renewal Agency 1 27,540 0 - 1 27,540 2 - 2 -
Village of Fairport Urban Renewal Agency 6 349,843 7 388,832 7 357,760 8 354,190 5 320,719
Village of Patchogue Community Development Agency 5 123,247 5 125,182 4 112,545 3 112,446 3 112,446
Village of Rockville Centre Community Development Agency 1 30,000 0 - 0 - 1 17,500
Water Authority of Great Neck North 27 1,886,001 25 1,943,612 25 2,190,590 29 2,194,313 29 2,264,862
Water Authority of Western Nassau County 56 4,054,327 54 4,240,590 57 4,015,508 53 4,470,205 51 4,596,157
Wayne County Water and Sewer Authority 31 1,150,302 35 1,354,980 44 1,605,626 47 1,861,779 52 2,052,215
White Plains Urban Renewal Agency 0 - 3 - 3 - 0 - 3 -
Wilton Water and Sewer Authority 5 184,568 5 208,750 5 208,750 6 246,533
Yonkers Community Development Agency 6 - 8 - 8 - 8 45,600 7 44,935
Yonkers Parking Authority 42 3,242,658 40 2,928,973 40 2,934,722 42 3,080,358 40 3,215,009
Total: 47,637 2,722,098,695 51,683 2,870,857,844 52,632 3,123,343,999 50,417 3,144,120,915 47,732 3,052,076,238
1 City of Hudson Community Development and Planning Agency changed their FYE Date for the FY2014 reporting period. FY2014 data is for 15 months.2 Upper Mohawk Valley Regional Water Board changed their FYE Date for the FY2014 reporting period. FY2014 data is for 21 months.
*Data Reported as of June 4, 2019. Data shown as - indicates an authority reported $0 in compensation. Fields shaded in grey represent the annual report was not submitted. If an authority has never
reported staff, they are not included in the table. Additionally, the staff count may include duplicate staff members as some employees perform work at multiple authorities.
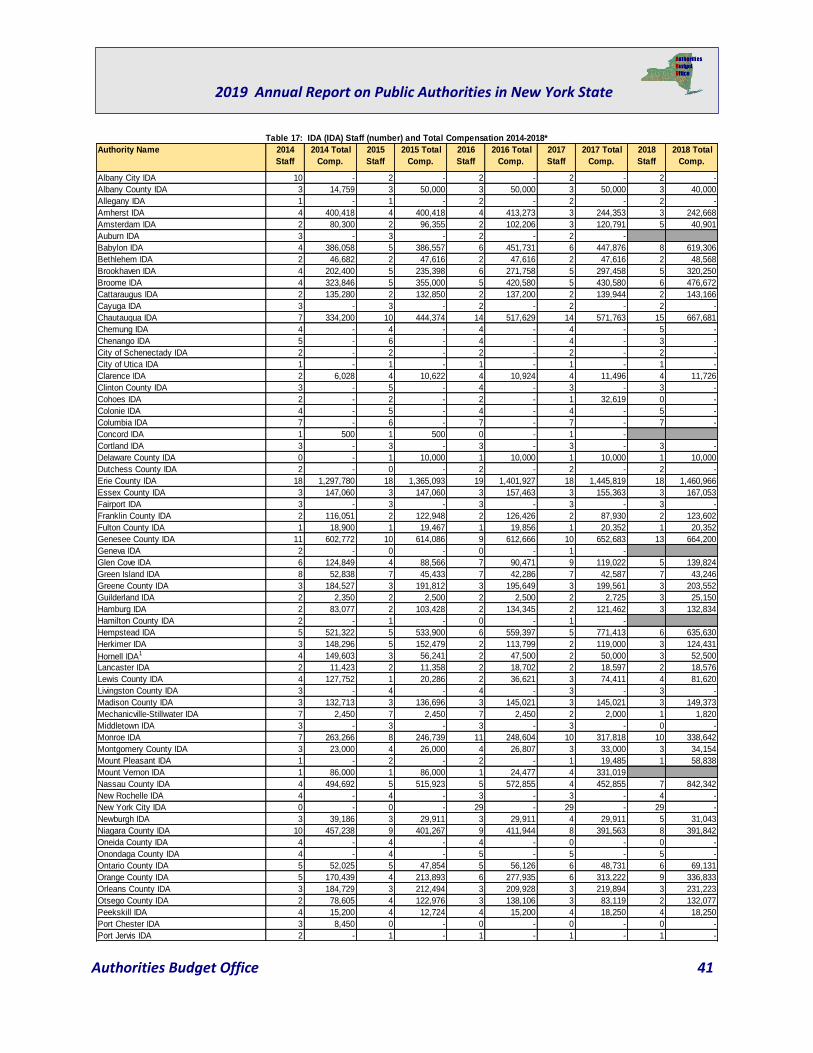
Authorities Budget Office 41
2019 Annual Report on Public Authorities in New York State
Authority Name 2014
Staff
2014 Total
Comp.
2015
Staff
2015 Total
Comp.
2016
Staff
2016 Total
Comp.
2017
Staff
2017 Total
Comp.
2018
Staff
2018 Total
Comp.
Albany City IDA 10 - 2 - 2 - 2 - 2 -
Albany County IDA 3 14,759 3 50,000 3 50,000 3 50,000 3 40,000
Allegany IDA 1 - 1 - 2 - 2 - 2 -
Amherst IDA 4 400,418 4 400,418 4 413,273 3 244,353 3 242,668
Amsterdam IDA 2 80,300 2 96,355 2 102,206 3 120,791 5 40,901
Auburn IDA 3 - 3 - 2 - 2 -
Babylon IDA 4 386,058 5 386,557 6 451,731 6 447,876 8 619,306
Bethlehem IDA 2 46,682 2 47,616 2 47,616 2 47,616 2 48,568
Brookhaven IDA 4 202,400 5 235,398 6 271,758 5 297,458 5 320,250
Broome IDA 4 323,846 5 355,000 5 420,580 5 430,580 6 476,672
Cattaraugus IDA 2 135,280 2 132,850 2 137,200 2 139,944 2 143,166
Cayuga IDA 3 - 3 - 2 - 2 - 2 -
Chautauqua IDA 7 334,200 10 444,374 14 517,629 14 571,763 15 667,681
Chemung IDA 4 - 4 - 4 - 4 - 5 -
Chenango IDA 5 - 6 - 4 - 4 - 3 -
City of Schenectady IDA 2 - 2 - 2 - 2 - 2 -
City of Utica IDA 1 - 1 - 1 - 1 - 1 -
Clarence IDA 2 6,028 4 10,622 4 10,924 4 11,496 4 11,726
Clinton County IDA 3 - 5 - 4 - 3 - 3 -
Cohoes IDA 2 - 2 - 2 - 1 32,619 0 -
Colonie IDA 4 - 5 - 4 - 4 - 5 -
Columbia IDA 7 - 6 - 7 - 7 - 7 -
Concord IDA 1 500 1 500 0 - 1 -
Cortland IDA 3 - 3 - 3 - 3 - 3 -
Delaware County IDA 0 - 1 10,000 1 10,000 1 10,000 1 10,000
Dutchess County IDA 2 - 0 - 2 - 2 - 2 -
Erie County IDA 18 1,297,780 18 1,365,093 19 1,401,927 18 1,445,819 18 1,460,966
Essex County IDA 3 147,060 3 147,060 3 157,463 3 155,363 3 167,053
Fairport IDA 3 - 3 - 3 - 3 - 3 -
Franklin County IDA 2 116,051 2 122,948 2 126,426 2 87,930 2 123,602
Fulton County IDA 1 18,900 1 19,467 1 19,856 1 20,352 1 20,352
Genesee County IDA 11 602,772 10 614,086 9 612,666 10 652,683 13 664,200
Geneva IDA 2 - 0 - 0 - 1 -
Glen Cove IDA 6 124,849 4 88,566 7 90,471 9 119,022 5 139,824
Green Island IDA 8 52,838 7 45,433 7 42,286 7 42,587 7 43,246
Greene County IDA 3 184,527 3 191,812 3 195,649 3 199,561 3 203,552
Guilderland IDA 2 2,350 2 2,500 2 2,500 2 2,725 3 25,150
Hamburg IDA 2 83,077 2 103,428 2 134,345 2 121,462 3 132,834
Hamilton County IDA 2 - 1 - 0 - 1 -
Hempstead IDA 5 521,322 5 533,900 6 559,397 5 771,413 6 635,630
Herkimer IDA 3 148,296 5 152,479 2 113,799 2 119,000 3 124,431
Hornell IDA1 4 149,603 3 56,241 2 47,500 2 50,000 3 52,500
Lancaster IDA 2 11,423 2 11,358 2 18,702 2 18,597 2 18,576
Lewis County IDA 4 127,752 1 20,286 2 36,621 3 74,411 4 81,620
Livingston County IDA 3 - 4 - 4 - 3 - 3 -
Madison County IDA 3 132,713 3 136,696 3 145,021 3 145,021 3 149,373
Mechanicville-Stillwater IDA 7 2,450 7 2,450 7 2,450 2 2,000 1 1,820
Middletown IDA 3 - 3 - 3 - 3 - 0 -
Monroe IDA 7 263,266 8 246,739 11 248,604 10 317,818 10 338,642
Montgomery County IDA 3 23,000 4 26,000 4 26,807 3 33,000 3 34,154
Mount Pleasant IDA 1 - 2 - 2 - 1 19,485 1 58,838
Mount Vernon IDA 1 86,000 1 86,000 1 24,477 4 331,019
Nassau County IDA 4 494,692 5 515,923 5 572,855 4 452,855 7 842,342
New Rochelle IDA 4 - 4 - 3 - 3 - 4 -
New York City IDA 0 - 0 - 29 - 29 - 29 -
Newburgh IDA 3 39,186 3 29,911 3 29,911 4 29,911 5 31,043
Niagara County IDA 10 457,238 9 401,267 9 411,944 8 391,563 8 391,842
Oneida County IDA 4 - 4 - 4 - 0 - 0 -
Onondaga County IDA 4 - 4 - 5 - 5 - 5 -
Ontario County IDA 5 52,025 5 47,854 5 56,126 6 48,731 6 69,131
Orange County IDA 5 170,439 4 213,893 6 277,935 6 313,222 9 336,833
Orleans County IDA 3 184,729 3 212,494 3 209,928 3 219,894 3 231,223
Otsego County IDA 2 78,605 4 122,976 3 138,106 3 83,119 2 132,077
Peekskill IDA 4 15,200 4 12,724 4 15,200 4 18,250 4 18,250
Port Chester IDA 3 8,450 0 - 0 - 0 - 0 -
Port Jervis IDA 2 - 1 - 1 - 1 - 1 -
Table 17: IDA (IDA) Staff (number) and Total Compensation 2014-2018*
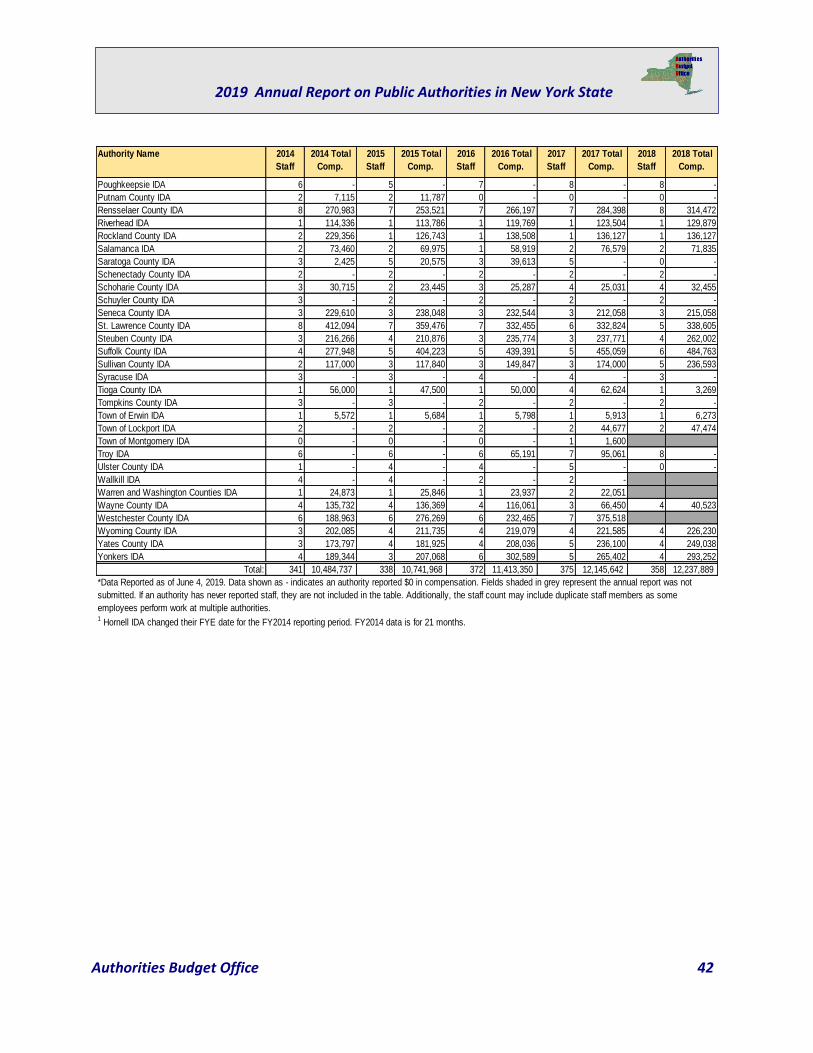
Authorities Budget Office 42
2019 Annual Report on Public Authorities in New York State
Authority Name 2014
Staff
2014 Total
Comp.
2015
Staff
2015 Total
Comp.
2016
Staff
2016 Total
Comp.
2017
Staff
2017 Total
Comp.
2018
Staff
2018 Total
Comp.
Poughkeepsie IDA 6 - 5 - 7 - 8 - 8 -
Putnam County IDA 2 7,115 2 11,787 0 - 0 - 0 -
Rensselaer County IDA 8 270,983 7 253,521 7 266,197 7 284,398 8 314,472
Riverhead IDA 1 114,336 1 113,786 1 119,769 1 123,504 1 129,879
Rockland County IDA 2 229,356 1 126,743 1 138,508 1 136,127 1 136,127
Salamanca IDA 2 73,460 2 69,975 1 58,919 2 76,579 2 71,835
Saratoga County IDA 3 2,425 5 20,575 3 39,613 5 - 0 -
Schenectady County IDA 2 - 2 - 2 - 2 - 2 -
Schoharie County IDA 3 30,715 2 23,445 3 25,287 4 25,031 4 32,455
Schuyler County IDA 3 - 2 - 2 - 2 - 2 -
Seneca County IDA 3 229,610 3 238,048 3 232,544 3 212,058 3 215,058
St. Lawrence County IDA 8 412,094 7 359,476 7 332,455 6 332,824 5 338,605
Steuben County IDA 3 216,266 4 210,876 3 235,774 3 237,771 4 262,002
Suffolk County IDA 4 277,948 5 404,223 5 439,391 5 455,059 6 484,763
Sullivan County IDA 2 117,000 3 117,840 3 149,847 3 174,000 5 236,593
Syracuse IDA 3 - 3 - 4 - 4 - 3 -
Tioga County IDA 1 56,000 1 47,500 1 50,000 4 62,624 1 3,269
Tompkins County IDA 3 - 3 - 2 - 2 - 2 -
Town of Erwin IDA 1 5,572 1 5,684 1 5,798 1 5,913 1 6,273
Town of Lockport IDA 2 - 2 - 2 - 2 44,677 2 47,474
Town of Montgomery IDA 0 - 0 - 0 - 1 1,600
Troy IDA 6 - 6 - 6 65,191 7 95,061 8 -
Ulster County IDA 1 - 4 - 4 - 5 - 0 -
Wallkill IDA 4 - 4 - 2 - 2 -
Warren and Washington Counties IDA 1 24,873 1 25,846 1 23,937 2 22,051
Wayne County IDA 4 135,732 4 136,369 4 116,061 3 66,450 4 40,523
Westchester County IDA 6 188,963 6 276,269 6 232,465 7 375,518
Wyoming County IDA 3 202,085 4 211,735 4 219,079 4 221,585 4 226,230
Yates County IDA 3 173,797 4 181,925 4 208,036 5 236,100 4 249,038
Yonkers IDA 4 189,344 3 207,068 6 302,589 5 265,402 4 293,252
Total: 341 10,484,737 338 10,741,968 372 11,413,350 375 12,145,642 358 12,237,889
1 Hornell IDA changed their FYE date for the FY2014 reporting period. FY2014 data is for 21 months.
*Data Reported as of June 4, 2019. Data shown as - indicates an authority reported $0 in compensation. Fields shaded in grey represent the annual report was not
submitted. If an authority has never reported staff, they are not included in the table. Additionally, the staff count may include duplicate staff members as some
employees perform work at multiple authorities.
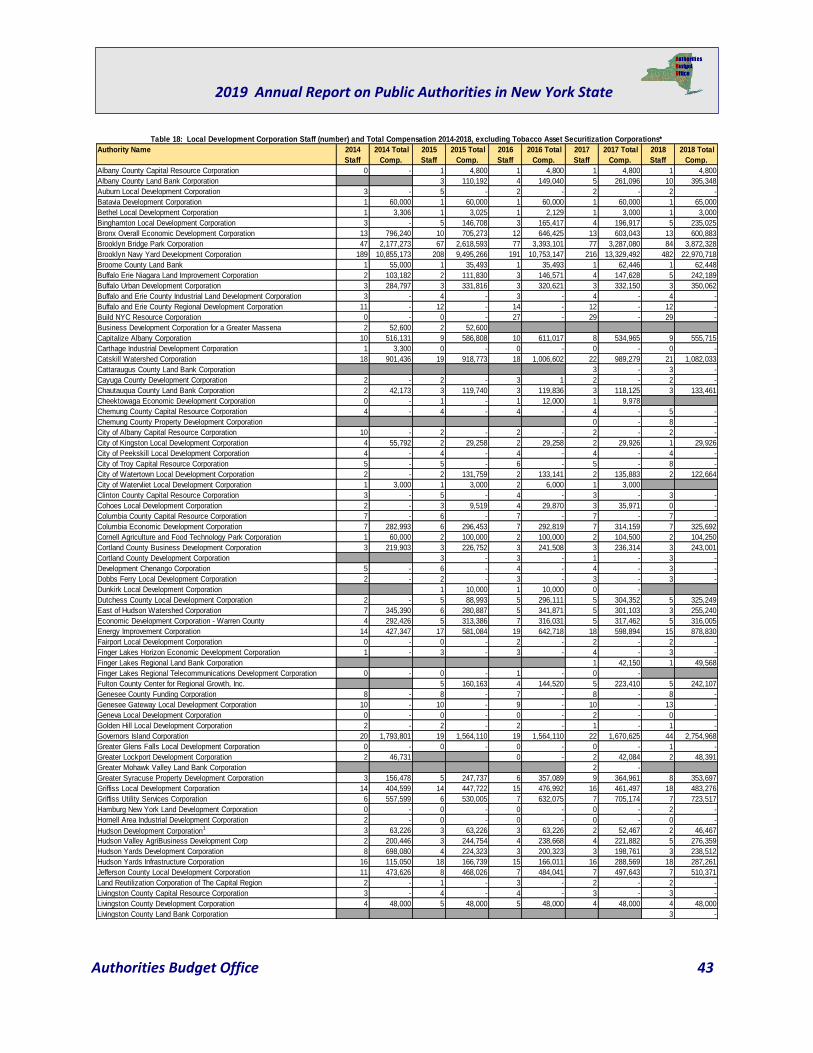
Authorities Budget Office 43
2019 Annual Report on Public Authorities in New York State
Authority Name 2014
Staff
2014 Total
Comp.
2015
Staff
2015 Total
Comp.
2016
Staff
2016 Total
Comp.
2017
Staff
2017 Total
Comp.
2018
Staff
2018 Total
Comp.
Albany County Capital Resource Corporation 0 - 1 4,800 1 4,800 1 4,800 1 4,800
Albany County Land Bank Corporation 3 110,192 4 149,040 5 261,096 10 395,348
Auburn Local Development Corporation 3 - 5 - 2 - 2 - 2 -
Batavia Development Corporation 1 60,000 1 60,000 1 60,000 1 60,000 1 65,000
Bethel Local Development Corporation 1 3,306 1 3,025 1 2,129 1 3,000 1 3,000
Binghamton Local Development Corporation 3 - 5 146,708 3 165,417 4 196,917 5 235,025
Bronx Overall Economic Development Corporation 13 796,240 10 705,273 12 646,425 13 603,043 13 600,883
Brooklyn Bridge Park Corporation 47 2,177,273 67 2,618,593 77 3,393,101 77 3,287,080 84 3,872,328
Brooklyn Navy Yard Development Corporation 189 10,855,173 208 9,495,266 191 10,753,147 216 13,329,492 482 22,970,718
Broome County Land Bank 1 55,000 1 35,493 1 35,493 1 62,446 1 62,448
Buffalo Erie Niagara Land Improvement Corporation 2 103,182 2 111,830 3 146,571 4 147,628 5 242,189
Buffalo Urban Development Corporation 3 284,797 3 331,816 3 320,621 3 332,150 3 350,062
Buffalo and Erie County Industrial Land Development Corporation 3 - 4 - 3 - 4 - 4 -
Buffalo and Erie County Regional Development Corporation 11 - 12 - 14 - 12 - 12 -
Build NYC Resource Corporation 0 - 0 - 27 - 29 - 29 -
Business Development Corporation for a Greater Massena 2 52,600 2 52,600
Capitalize Albany Corporation 10 516,131 9 586,808 10 611,017 8 534,965 9 555,715
Carthage Industrial Development Corporation 1 3,300 0 - 0 - 0 - 0 -
Catskill Watershed Corporation 18 901,436 19 918,773 18 1,006,602 22 989,279 21 1,082,033
Cattaraugus County Land Bank Corporation 3 - 3 -
Cayuga County Development Corporation 2 - 2 - 3 1 2 - 2 -
Chautauqua County Land Bank Corporation 2 42,173 3 119,740 3 119,836 3 118,125 3 133,461
Cheektowaga Economic Development Corporation 0 - 1 - 1 12,000 1 9,978
Chemung County Capital Resource Corporation 4 - 4 - 4 - 4 - 5 -
Chemung County Property Development Corporation 0 - 8 -
City of Albany Capital Resource Corporation 10 - 2 - 2 - 2 - 2 -
City of Kingston Local Development Corporation 4 55,792 2 29,258 2 29,258 2 29,926 1 29,926
City of Peekskill Local Development Corporation 4 - 4 - 4 - 4 - 4 -
City of Troy Capital Resource Corporation 5 - 5 - 6 - 5 - 8 -
City of Watertown Local Development Corporation 2 - 2 131,759 2 133,141 2 135,883 2 122,664
City of Watervliet Local Development Corporation 1 3,000 1 3,000 2 6,000 1 3,000
Clinton County Capital Resource Corporation 3 - 5 - 4 - 3 - 3 -
Cohoes Local Development Corporation 2 - 3 9,519 4 29,870 3 35,971 0 -
Columbia County Capital Resource Corporation 7 - 6 - 7 - 7 - 7 -
Columbia Economic Development Corporation 7 282,993 6 296,453 7 292,819 7 314,159 7 325,692
Cornell Agriculture and Food Technology Park Corporation 1 60,000 2 100,000 2 100,000 2 104,500 2 104,250
Cortland County Business Development Corporation 3 219,903 3 226,752 3 241,508 3 236,314 3 243,001
Cortland County Development Corporation 3 - 3 - 1 - 3 -
Development Chenango Corporation 5 - 6 - 4 - 4 - 3 -
Dobbs Ferry Local Development Corporation 2 - 2 - 3 - 3 - 3 -
Dunkirk Local Development Corporation 1 10,000 1 10,000 0 -
Dutchess County Local Development Corporation 2 - 5 88,993 5 296,111 5 304,352 5 325,249
East of Hudson Watershed Corporation 7 345,390 6 280,887 5 341,871 5 301,103 3 255,240
Economic Development Corporation - Warren County 4 292,426 5 313,386 7 316,031 5 317,462 5 316,005
Energy Improvement Corporation 14 427,347 17 581,084 19 642,718 18 598,894 15 878,830
Fairport Local Development Corporation 0 - 0 - 2 - 2 - 2 -
Finger Lakes Horizon Economic Development Corporation 1 - 3 - 3 - 4 - 3 -
Finger Lakes Regional Land Bank Corporation 1 42,150 1 49,568
Finger Lakes Regional Telecommunications Development Corporation 0 - 0 - 1 - 0 -
Fulton County Center for Regional Growth, Inc. 5 160,163 4 144,520 5 223,410 5 242,107
Genesee County Funding Corporation 8 - 8 - 7 - 8 - 8 -
Genesee Gateway Local Development Corporation 10 - 10 - 9 - 10 - 13 -
Geneva Local Development Corporation 0 - 0 - 0 - 2 - 0 -
Golden Hill Local Development Corporation 2 - 2 - 2 - 1 - 1 -
Governors Island Corporation 20 1,793,801 19 1,564,110 19 1,564,110 22 1,670,625 44 2,754,968
Greater Glens Falls Local Development Corporation 0 - 0 - 0 - 0 - 1 -
Greater Lockport Development Corporation 2 46,731 0 - 2 42,084 2 48,391
Greater Mohawk Valley Land Bank Corporation 2 -
Greater Syracuse Property Development Corporation 3 156,478 5 247,737 6 357,089 9 364,961 8 353,697
Griffiss Local Development Corporation 14 404,599 14 447,722 15 476,992 16 461,497 18 483,276
Griffiss Utility Services Corporation 6 557,599 6 530,005 7 632,075 7 705,174 7 723,517
Hamburg New York Land Development Corporation 0 - 0 - 0 - 0 - 2 -
Hornell Area Industrial Development Corporation 2 - 0 - 0 - 0 - 0 -
Hudson Development Corporation1 3 63,226 3 63,226 3 63,226 2 52,467 2 46,467
Hudson Valley AgriBusiness Development Corp 2 200,446 3 244,754 4 238,668 4 221,882 5 276,359
Hudson Yards Development Corporation 8 698,080 4 224,323 3 200,323 3 198,761 3 238,512
Hudson Yards Infrastructure Corporation 16 115,050 18 166,739 15 166,011 16 288,569 18 287,261
Jefferson County Local Development Corporation 11 473,626 8 468,026 7 484,041 7 497,643 7 510,371
Land Reutilization Corporation of The Capital Region 2 - 1 - 3 - 2 - 2 -
Livingston County Capital Resource Corporation 3 - 4 - 4 - 3 - 3 -
Livingston County Development Corporation 4 48,000 5 48,000 5 48,000 4 48,000 4 48,000
Livingston County Land Bank Corporation 3 -
Table 18: Local Development Corporation Staff (number) and Total Compensation 2014-2018, excluding Tobacco Asset Securitization Corporations*
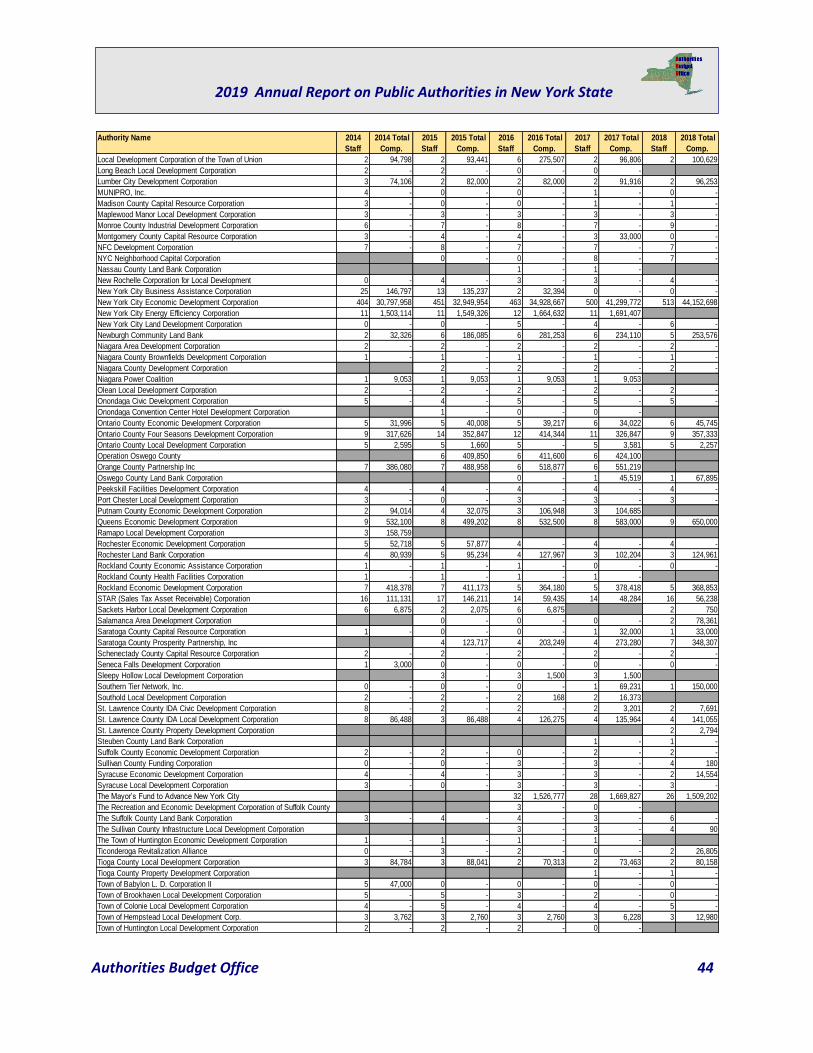
Authorities Budget Office 44
2019 Annual Report on Public Authorities in New York State
Authority Name 2014
Staff
2014 Total
Comp.
2015
Staff
2015 Total
Comp.
2016
Staff
2016 Total
Comp.
2017
Staff
2017 Total
Comp.
2018
Staff
2018 Total
Comp.
Local Development Corporation of the Town of Union 2 94,798 2 93,441 6 275,507 2 96,806 2 100,629
Long Beach Local Development Corporation 2 - 2 - 0 - 0 -
Lumber City Development Corporation 3 74,106 2 82,000 2 82,000 2 91,916 2 96,253
MUNIPRO, Inc. 4 - 0 - 0 - 1 - 0 -
Madison County Capital Resource Corporation 3 - 0 - 0 - 1 - 1 -
Maplewood Manor Local Development Corporation 3 - 3 - 3 - 3 - 3 -
Monroe County Industrial Development Corporation 6 - 7 - 8 - 7 - 9 -
Montgomery County Capital Resource Corporation 3 - 4 - 4 - 3 33,000 0 -
NFC Development Corporation 7 - 8 - 7 - 7 - 7 -
NYC Neighborhood Capital Corporation 0 - 0 - 8 - 7 -
Nassau County Land Bank Corporation 1 - 1 -
New Rochelle Corporation for Local Development 0 - 4 - 3 - 3 - 4 -
New York City Business Assistance Corporation 25 146,797 13 135,237 2 32,394 0 - 0 -
New York City Economic Development Corporation 404 30,797,958 451 32,949,954 463 34,928,667 500 41,299,772 513 44,152,698
New York City Energy Efficiency Corporation 11 1,503,114 11 1,549,326 12 1,664,632 11 1,691,407
New York City Land Development Corporation 0 - 0 - 5 - 4 - 6 -
Newburgh Community Land Bank 2 32,326 6 186,085 6 281,253 6 234,110 5 253,576
Niagara Area Development Corporation 2 - 2 - 2 - 2 - 2 -
Niagara County Brownfields Development Corporation 1 - 1 - 1 - 1 - 1 -
Niagara County Development Corporation 2 - 2 - 2 - 2 -
Niagara Power Coalition 1 9,053 1 9,053 1 9,053 1 9,053
Olean Local Development Corporation 2 - 2 - 2 - 2 - 2 -
Onondaga Civic Development Corporation 5 - 4 - 5 - 5 - 5 -
Onondaga Convention Center Hotel Development Corporation 1 - 0 - 0 -
Ontario County Economic Development Corporation 5 31,996 5 40,008 5 39,217 6 34,022 6 45,745
Ontario County Four Seasons Development Corporation 9 317,626 14 352,847 12 414,344 11 326,847 9 357,333
Ontario County Local Development Corporation 5 2,595 5 1,660 5 - 5 3,581 5 2,257
Operation Oswego County 6 409,850 6 411,600 6 424,100
Orange County Partnership Inc 7 386,080 7 488,958 6 518,877 6 551,219
Oswego County Land Bank Corporation 0 - 1 45,519 1 67,895
Peekskill Facilities Development Corporation 4 - 4 - 4 - 4 - 4 -
Port Chester Local Development Corporation 3 - 0 - 3 - 3 - 3 -
Putnam County Economic Development Corporation 2 94,014 4 32,075 3 106,948 3 104,685
Queens Economic Development Corporation 9 532,100 8 499,202 8 532,500 8 583,000 9 650,000
Ramapo Local Development Corporation 3 158,759
Rochester Economic Development Corporation 5 52,718 5 57,877 4 - 4 - 4 -
Rochester Land Bank Corporation 4 80,939 5 95,234 4 127,967 3 102,204 3 124,961
Rockland County Economic Assistance Corporation 1 - 1 - 1 - 0 - 0 -
Rockland County Health Facilities Corporation 1 - 1 - 1 - 1 -
Rockland Economic Development Corporation 7 418,378 7 411,173 5 364,180 5 378,418 5 368,853
STAR (Sales Tax Asset Receivable) Corporation 16 111,131 17 146,211 14 59,435 14 48,284 16 56,238
Sackets Harbor Local Development Corporation 6 6,875 2 2,075 6 6,875 2 750
Salamanca Area Development Corporation 0 - 0 - 0 - 2 78,361
Saratoga County Capital Resource Corporation 1 - 0 - 0 - 1 32,000 1 33,000
Saratoga County Prosperity Partnership, Inc 4 123,717 4 203,249 4 273,280 7 348,307
Schenectady County Capital Resource Corporation 2 - 2 - 2 - 2 - 2 -
Seneca Falls Development Corporation 1 3,000 0 - 0 - 0 - 0 -
Sleepy Hollow Local Development Corporation 3 - 3 1,500 3 1,500
Southern Tier Network, Inc. 0 - 0 - 0 - 1 69,231 1 150,000
Southold Local Development Corporation 2 - 2 - 2 168 2 16,373
St. Lawrence County IDA Civic Development Corporation 8 - 2 - 2 - 2 3,201 2 7,691
St. Lawrence County IDA Local Development Corporation 8 86,488 3 86,488 4 126,275 4 135,964 4 141,055
St. Lawrence County Property Development Corporation 2 2,794
Steuben County Land Bank Corporation 1 - 1 -
Suffolk County Economic Development Corporation 2 - 2 - 0 - 2 - 2 -
Sullivan County Funding Corporation 0 - 0 - 3 - 3 - 4 180
Syracuse Economic Development Corporation 4 - 4 - 3 - 3 - 2 14,554
Syracuse Local Development Corporation 3 - 0 - 3 - 3 - 3 -
The Mayor’s Fund to Advance New York City 32 1,526,777 28 1,669,827 26 1,509,202
The Recreation and Economic Development Corporation of Suffolk County 3 - 0 -
The Suffolk County Land Bank Corporation 3 - 4 - 4 - 3 - 6 -
The Sullivan County Infrastructure Local Development Corporation 3 - 3 - 4 90
The Town of Huntington Economic Development Corporation 1 - 1 - 1 - 1 -
Ticonderoga Revitalization Alliance 0 - 3 - 2 - 0 - 2 26,805
Tioga County Local Development Corporation 3 84,784 3 88,041 2 70,313 2 73,463 2 80,158
Tioga County Property Development Corporation 1 - 1 -
Town of Babylon L. D. Corporation II 5 47,000 0 - 0 - 0 - 0 -
Town of Brookhaven Local Development Corporation 5 - 5 - 3 - 2 - 0 -
Town of Colonie Local Development Corporation 4 - 5 - 4 - 4 - 5 -
Town of Hempstead Local Development Corp. 3 3,762 3 2,760 3 2,760 3 6,228 3 12,980
Town of Huntington Local Development Corporation 2 - 2 - 2 - 0 -
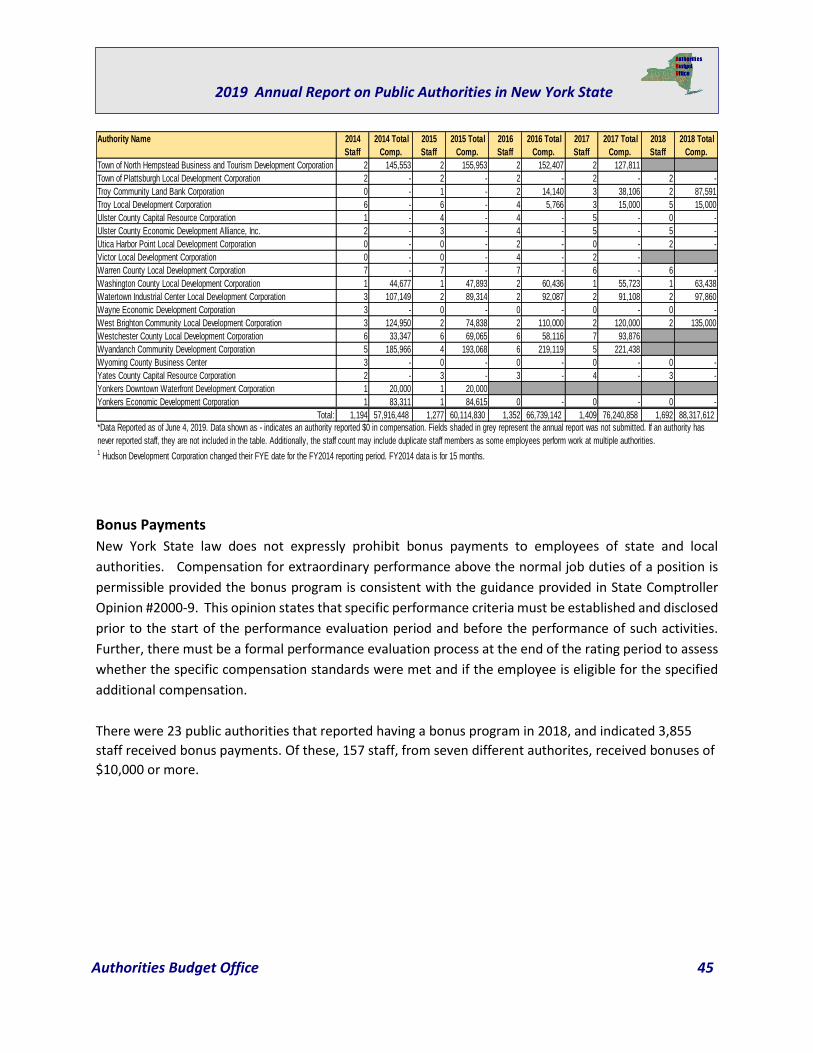
Authorities Budget Office 45
2019 Annual Report on Public Authorities in New York State
Bonus Payments
New York State law does not expressly prohibit bonus payments to employees of state and local
authorities. Compensation for extraordinary performance above the normal job duties of a position is
permissible provided the bonus program is consistent with the guidance provided in State Comptroller
Opinion #2000-9. This opinion states that specific performance criteria must be established and disclosed
prior to the start of the performance evaluation period and before the performance of such activities.
Further, there must be a formal performance evaluation process at the end of the rating period to assess
whether the specific compensation standards were met and if the employee is eligible for the specified
additional compensation.
There were 23 public authorities that reported having a bonus program in 2018, and indicated 3,855
staff received bonus payments. Of these, 157 staff, from seven different authorites, received bonuses of
$10,000 or more.
Authority Name 2014
Staff
2014 Total
Comp.
2015
Staff
2015 Total
Comp.
2016
Staff
2016 Total
Comp.
2017
Staff
2017 Total
Comp.
2018
Staff
2018 Total
Comp.
Town of North Hempstead Business and Tourism Development Corporation 2 145,553 2 155,953 2 152,407 2 127,811
Town of Plattsburgh Local Development Corporation 2 - 2 - 2 - 2 - 2 -
Troy Community Land Bank Corporation 0 - 1 - 2 14,140 3 38,106 2 87,591
Troy Local Development Corporation 6 - 6 - 4 5,766 3 15,000 5 15,000
Ulster County Capital Resource Corporation 1 - 4 - 4 - 5 - 0 -
Ulster County Economic Development Alliance, Inc. 2 - 3 - 4 - 5 - 5 -
Utica Harbor Point Local Development Corporation 0 - 0 - 2 - 0 - 2 -
Victor Local Development Corporation 0 - 0 - 4 - 2 -
Warren County Local Development Corporation 7 - 7 - 7 - 6 - 6 -
Washington County Local Development Corporation 1 44,677 1 47,893 2 60,436 1 55,723 1 63,438
Watertown Industrial Center Local Development Corporation 3 107,149 2 89,314 2 92,087 2 91,108 2 97,860
Wayne Economic Development Corporation 3 - 0 - 0 - 0 - 0 -
West Brighton Community Local Development Corporation 3 124,950 2 74,838 2 110,000 2 120,000 2 135,000
Westchester County Local Development Corporation 6 33,347 6 69,065 6 58,116 7 93,876
Wyandanch Community Development Corporation 5 185,966 4 193,068 6 219,119 5 221,438
Wyoming County Business Center 3 - 0 - 0 - 0 - 0 -
Yates County Capital Resource Corporation 2 - 3 - 3 - 4 - 3 -
Yonkers Downtown Waterfront Development Corporation 1 20,000 1 20,000
Yonkers Economic Development Corporation 1 83,311 1 84,615 0 - 0 - 0 -
Total: 1,194 57,916,448 1,277 60,114,830 1,352 66,739,142 1,409 76,240,858 1,692 88,317,612
1 Hudson Development Corporation changed their FYE date for the FY2014 reporting period. FY2014 data is for 15 months.
*Data Reported as of June 4, 2019. Data shown as - indicates an authority reported $0 in compensation. Fields shaded in grey represent the annual report was not submitted. If an authority has
never reported staff, they are not included in the table. Additionally, the staff count may include duplicate staff members as some employees perform work at multiple authorities.
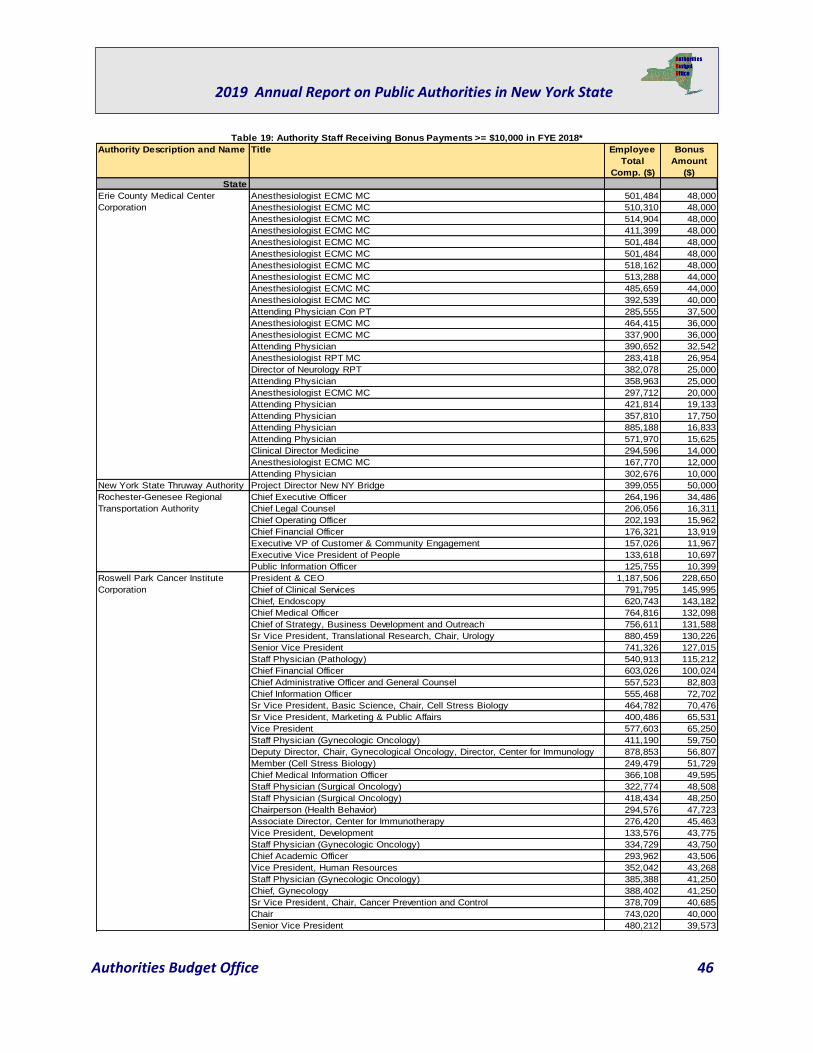
Authorities Budget Office 46
2019 Annual Report on Public Authorities in New York State
Authority Description and Name Title Employee
Total
Comp. ($)
Bonus
Amount
($)
State
Erie County Medical Center Anesthesiologist ECMC MC 501,484 48,000
Corporation Anesthesiologist ECMC MC 510,310 48,000
Anesthesiologist ECMC MC 514,904 48,000
Anesthesiologist ECMC MC 411,399 48,000
Anesthesiologist ECMC MC 501,484 48,000
Anesthesiologist ECMC MC 501,484 48,000
Anesthesiologist ECMC MC 518,162 48,000
Anesthesiologist ECMC MC 513,288 44,000
Anesthesiologist ECMC MC 485,659 44,000
Anesthesiologist ECMC MC 392,539 40,000
Attending Physician Con PT 285,555 37,500
Anesthesiologist ECMC MC 464,415 36,000
Anesthesiologist ECMC MC 337,900 36,000
Attending Physician 390,652 32,542
Anesthesiologist RPT MC 283,418 26,954
Director of Neurology RPT 382,078 25,000
Attending Physician 358,963 25,000
Anesthesiologist ECMC MC 297,712 20,000
Attending Physician 421,814 19,133
Attending Physician 357,810 17,750
Attending Physician 885,188 16,833
Attending Physician 571,970 15,625
Clinical Director Medicine 294,596 14,000
Anesthesiologist ECMC MC 167,770 12,000
Attending Physician 302,676 10,000
New York State Thruway Authority Project Director New NY Bridge 399,055 50,000
Rochester-Genesee Regional Chief Executive Officer 264,196 34,486
Transportation Authority Chief Legal Counsel 206,056 16,311
Chief Operating Officer 202,193 15,962
Chief Financial Officer 176,321 13,919
Executive VP of Customer & Community Engagement 157,026 11,967
Executive Vice President of People 133,618 10,697
Public Information Officer 125,755 10,399
Roswell Park Cancer Institute President & CEO 1,187,506 228,650
Corporation Chief of Clinical Services 791,795 145,995
Chief, Endoscopy 620,743 143,182
Chief Medical Officer 764,816 132,098
Chief of Strategy, Business Development and Outreach 756,611 131,588
Sr Vice President, Translational Research, Chair, Urology 880,459 130,226
Senior Vice President 741,326 127,015
Staff Physician (Pathology) 540,913 115,212
Chief Financial Officer 603,026 100,024
Chief Administrative Officer and General Counsel 557,523 82,803
Chief Information Officer 555,468 72,702
Sr Vice President, Basic Science, Chair, Cell Stress Biology 464,782 70,476
Sr Vice President, Marketing & Public Affairs 400,486 65,531
Vice President 577,603 65,250
Staff Physician (Gynecologic Oncology) 411,190 59,750
Deputy Director, Chair, Gynecological Oncology, Director, Center for Immunology 878,853 56,807
Member (Cell Stress Biology) 249,479 51,729
Chief Medical Information Officer 366,108 49,595
Staff Physician (Surgical Oncology) 322,774 48,508
Staff Physician (Surgical Oncology) 418,434 48,250
Chairperson (Health Behavior) 294,576 47,723
Associate Director, Center for Immunotherapy 276,420 45,463
Vice President, Development 133,576 43,775
Staff Physician (Gynecologic Oncology) 334,729 43,750
Chief Academic Officer 293,962 43,506
Vice President, Human Resources 352,042 43,268
Staff Physician (Gynecologic Oncology) 385,388 41,250
Chief, Gynecology 388,402 41,250
Sr Vice President, Chair, Cancer Prevention and Control 378,709 40,685
Chair 743,020 40,000
Senior Vice President 480,212 39,573
Table 19: Authority Staff Receiving Bonus Payments >= $10,000 in FYE 2018*
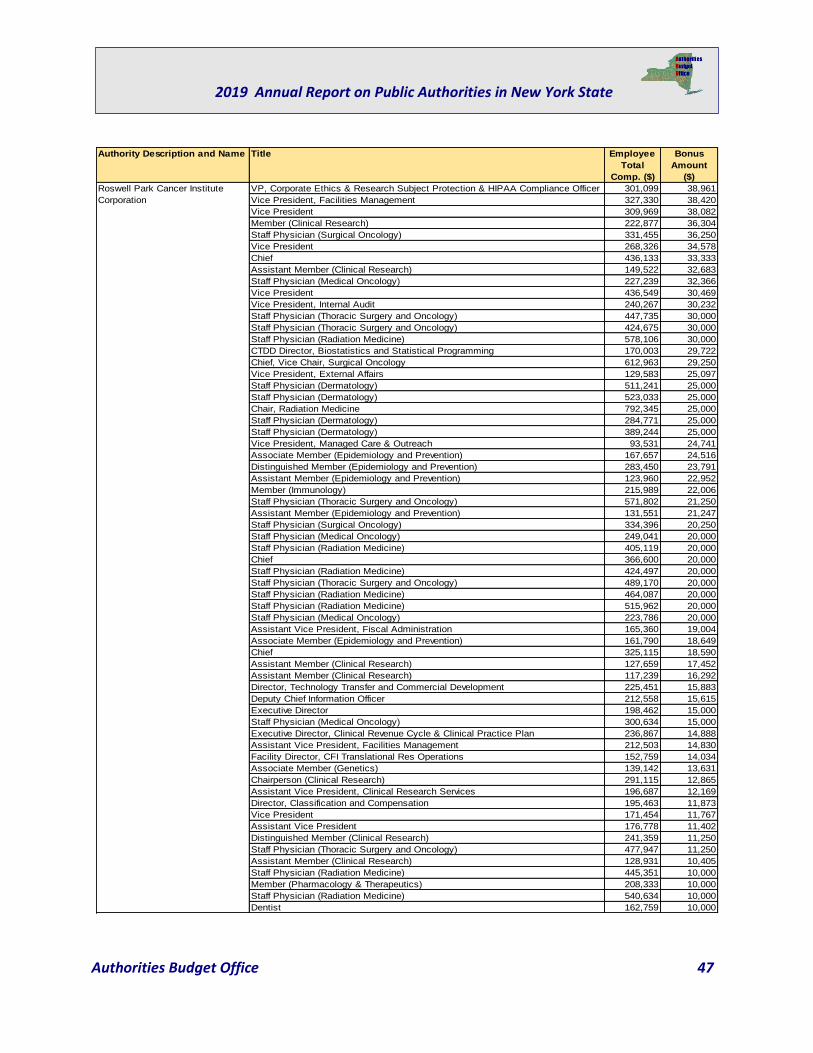
Authorities Budget Office 47
2019 Annual Report on Public Authorities in New York State
Authority Description and Name Title Employee
Total
Comp. ($)
Bonus
Amount
($)
Roswell Park Cancer Institute VP, Corporate Ethics & Research Subject Protection & HIPAA Compliance Officer 301,099 38,961
Corporation Vice President, Facilities Management 327,330 38,420
Vice President 309,969 38,082
Member (Clinical Research) 222,877 36,304
Staff Physician (Surgical Oncology) 331,455 36,250
Vice President 268,326 34,578
Chief 436,133 33,333
Assistant Member (Clinical Research) 149,522 32,683
Staff Physician (Medical Oncology) 227,239 32,366
Vice President 436,549 30,469
Vice President, Internal Audit 240,267 30,232
Staff Physician (Thoracic Surgery and Oncology) 447,735 30,000
Staff Physician (Thoracic Surgery and Oncology) 424,675 30,000
Staff Physician (Radiation Medicine) 578,106 30,000
CTDD Director, Biostatistics and Statistical Programming 170,003 29,722
Chief, Vice Chair, Surgical Oncology 612,963 29,250
Vice President, External Affairs 129,583 25,097
Staff Physician (Dermatology) 511,241 25,000
Staff Physician (Dermatology) 523,033 25,000
Chair, Radiation Medicine 792,345 25,000
Staff Physician (Dermatology) 284,771 25,000
Staff Physician (Dermatology) 389,244 25,000
Vice President, Managed Care & Outreach 93,531 24,741
Associate Member (Epidemiology and Prevention) 167,657 24,516
Distinguished Member (Epidemiology and Prevention) 283,450 23,791
Assistant Member (Epidemiology and Prevention) 123,960 22,952
Member (Immunology) 215,989 22,006
Staff Physician (Thoracic Surgery and Oncology) 571,802 21,250
Assistant Member (Epidemiology and Prevention) 131,551 21,247
Staff Physician (Surgical Oncology) 334,396 20,250
Staff Physician (Medical Oncology) 249,041 20,000
Staff Physician (Radiation Medicine) 405,119 20,000
Chief 366,600 20,000
Staff Physician (Radiation Medicine) 424,497 20,000
Staff Physician (Thoracic Surgery and Oncology) 489,170 20,000
Staff Physician (Radiation Medicine) 464,087 20,000
Staff Physician (Radiation Medicine) 515,962 20,000
Staff Physician (Medical Oncology) 223,786 20,000
Assistant Vice President, Fiscal Administration 165,360 19,004
Associate Member (Epidemiology and Prevention) 161,790 18,649
Chief 325,115 18,590
Assistant Member (Clinical Research) 127,659 17,452
Assistant Member (Clinical Research) 117,239 16,292
Director, Technology Transfer and Commercial Development 225,451 15,883
Deputy Chief Information Officer 212,558 15,615
Executive Director 198,462 15,000
Staff Physician (Medical Oncology) 300,634 15,000
Executive Director, Clinical Revenue Cycle & Clinical Practice Plan 236,867 14,888
Assistant Vice President, Facilities Management 212,503 14,830
Facility Director, CFI Translational Res Operations 152,759 14,034
Associate Member (Genetics) 139,142 13,631
Chairperson (Clinical Research) 291,115 12,865
Assistant Vice President, Clinical Research Services 196,687 12,169
Director, Classification and Compensation 195,463 11,873
Vice President 171,454 11,767
Assistant Vice President 176,778 11,402
Distinguished Member (Clinical Research) 241,359 11,250
Staff Physician (Thoracic Surgery and Oncology) 477,947 11,250
Assistant Member (Clinical Research) 128,931 10,405
Staff Physician (Radiation Medicine) 445,351 10,000
Member (Pharmacology & Therapeutics) 208,333 10,000
Staff Physician (Radiation Medicine) 540,634 10,000
Dentist 162,759 10,000
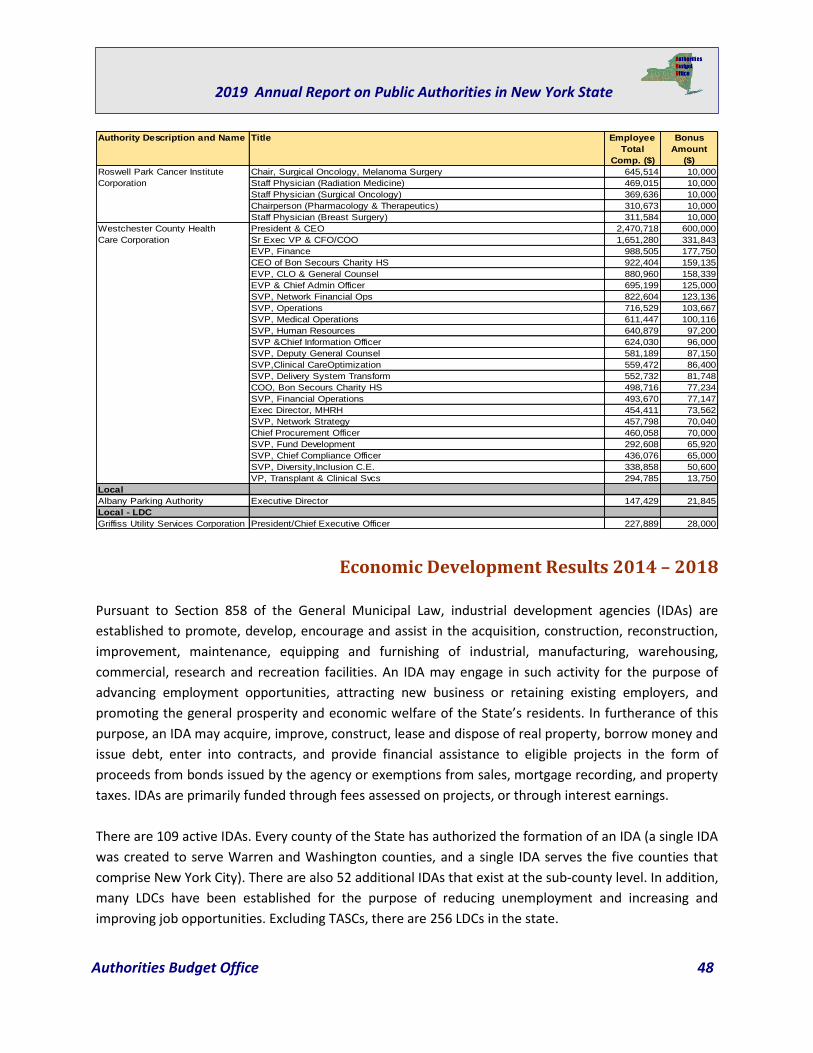
Authorities Budget Office 48
2019 Annual Report on Public Authorities in New York State
Economic Development Results 2014 – 2018
Pursuant to Section 858 of the General Municipal Law, industrial development agencies (IDAs) are
established to promote, develop, encourage and assist in the acquisition, construction, reconstruction,
improvement, maintenance, equipping and furnishing of industrial, manufacturing, warehousing,
commercial, research and recreation facilities. An IDA may engage in such activity for the purpose of
advancing employment opportunities, attracting new business or retaining existing employers, and
promoting the general prosperity and economic welfare of the State’s residents. In furtherance of this
purpose, an IDA may acquire, improve, construct, lease and dispose of real property, borrow money and
issue debt, enter into contracts, and provide financial assistance to eligible projects in the form of
proceeds from bonds issued by the agency or exemptions from sales, mortgage recording, and property
taxes. IDAs are primarily funded through fees assessed on projects, or through interest earnings.
There are 109 active IDAs. Every county of the State has authorized the formation of an IDA (a single IDA
was created to serve Warren and Washington counties, and a single IDA serves the five counties that
comprise New York City). There are also 52 additional IDAs that exist at the sub-county level. In addition,
many LDCs have been established for the purpose of reducing unemployment and increasing and
improving job opportunities. Excluding TASCs, there are 256 LDCs in the state.
Authority Description and Name Title Employee
Total
Comp. ($)
Bonus
Amount
($)
Roswell Park Cancer Institute Chair, Surgical Oncology, Melanoma Surgery 645,514 10,000
Corporation Staff Physician (Radiation Medicine) 469,015 10,000
Staff Physician (Surgical Oncology) 369,636 10,000
Chairperson (Pharmacology & Therapeutics) 310,673 10,000
Staff Physician (Breast Surgery) 311,584 10,000
Westchester County Health President & CEO 2,470,718 600,000
Care Corporation Sr Exec VP & CFO/COO 1,651,280 331,843
EVP, Finance 988,505 177,750
CEO of Bon Secours Charity HS 922,404 159,135
EVP, CLO & General Counsel 880,960 158,339
EVP & Chief Admin Officer 695,199 125,000
SVP, Network Financial Ops 822,604 123,136
SVP, Operations 716,529 103,667
SVP, Medical Operations 611,447 100,116
SVP, Human Resources 640,879 97,200
SVP &Chief Information Officer 624,030 96,000
SVP, Deputy General Counsel 581,189 87,150
SVP,Clinical CareOptimization 559,472 86,400
SVP, Delivery System Transform 552,732 81,748
COO, Bon Secours Charity HS 498,716 77,234
SVP, Financial Operations 493,670 77,147
Exec Director, MHRH 454,411 73,562
SVP, Network Strategy 457,798 70,040
Chief Procurement Officer 460,058 70,000
SVP, Fund Development 292,608 65,920
SVP, Chief Compliance Officer 436,076 65,000
SVP, Diversity,Inclusion C.E. 338,858 50,600
VP, Transplant & Clinical Svcs 294,785 13,750
Local
Albany Parking Authority Executive Director 147,429 21,845
Local - LDC
Griffiss Utility Services Corporation President/Chief Executive Officer 227,889 28,000
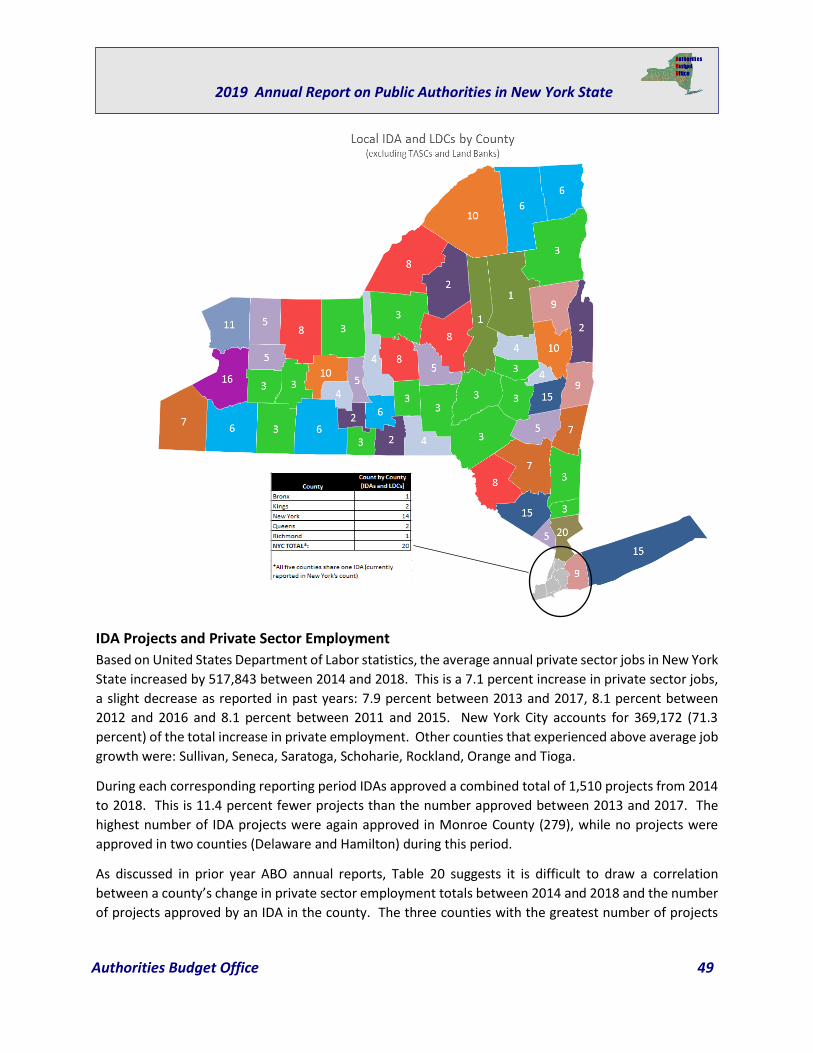
Authorities Budget Office 49
2019 Annual Report on Public Authorities in New York State
IDA Projects and Private Sector Employment
Based on United States Department of Labor statistics, the average annual private sector jobs in New York
State increased by 517,843 between 2014 and 2018. This is a 7.1 percent increase in private sector jobs,
a slight decrease as reported in past years: 7.9 percent between 2013 and 2017, 8.1 percent between
2012 and 2016 and 8.1 percent between 2011 and 2015. New York City accounts for 369,172 (71.3
percent) of the total increase in private employment. Other counties that experienced above average job
growth were: Sullivan, Seneca, Saratoga, Schoharie, Rockland, Orange and Tioga.
During each corresponding reporting period IDAs approved a combined total of 1,510 projects from 2014
to 2018. This is 11.4 percent fewer projects than the number approved between 2013 and 2017. The
highest number of IDA projects were again approved in Monroe County (279), while no projects were
approved in two counties (Delaware and Hamilton) during this period.
As discussed in prior year ABO annual reports, Table 20 suggests it is difficult to draw a correlation
between a county’s change in private sector employment totals between 2014 and 2018 and the number
of projects approved by an IDA in the county. The three counties with the greatest number of projects
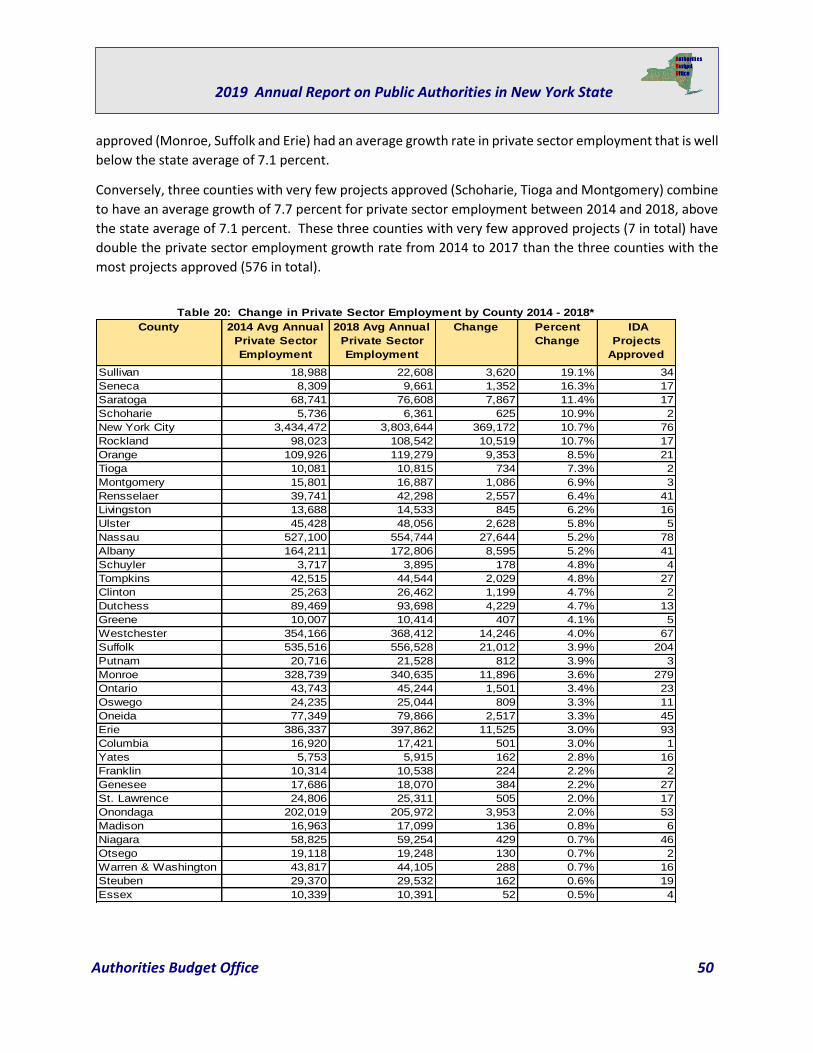
Authorities Budget Office 50
2019 Annual Report on Public Authorities in New York State
approved (Monroe, Suffolk and Erie) had an average growth rate in private sector employment that is well
below the state average of 7.1 percent.
Conversely, three counties with very few projects approved (Schoharie, Tioga and Montgomery) combine
to have an average growth of 7.7 percent for private sector employment between 2014 and 2018, above
the state average of 7.1 percent. These three counties with very few approved projects (7 in total) have
double the private sector employment growth rate from 2014 to 2017 than the three counties with the
most projects approved (576 in total).
County 2014 Avg Annual
Private Sector
Employment
2018 Avg Annual
Private Sector
Employment
Change Percent
Change
IDA
Projects
Approved
Sullivan 18,988 22,608 3,620 19.1% 34
Seneca 8,309 9,661 1,352 16.3% 17
Saratoga 68,741 76,608 7,867 11.4% 17
Schoharie 5,736 6,361 625 10.9% 2
New York City 3,434,472 3,803,644 369,172 10.7% 76
Rockland 98,023 108,542 10,519 10.7% 17
Orange 109,926 119,279 9,353 8.5% 21
Tioga 10,081 10,815 734 7.3% 2
Montgomery 15,801 16,887 1,086 6.9% 3
Rensselaer 39,741 42,298 2,557 6.4% 41
Livingston 13,688 14,533 845 6.2% 16
Ulster 45,428 48,056 2,628 5.8% 5
Nassau 527,100 554,744 27,644 5.2% 78
Albany 164,211 172,806 8,595 5.2% 41
Schuyler 3,717 3,895 178 4.8% 4
Tompkins 42,515 44,544 2,029 4.8% 27
Clinton 25,263 26,462 1,199 4.7% 2
Dutchess 89,469 93,698 4,229 4.7% 13
Greene 10,007 10,414 407 4.1% 5
Westchester 354,166 368,412 14,246 4.0% 67
Suffolk 535,516 556,528 21,012 3.9% 204
Putnam 20,716 21,528 812 3.9% 3
Monroe 328,739 340,635 11,896 3.6% 279
Ontario 43,743 45,244 1,501 3.4% 23
Oswego 24,235 25,044 809 3.3% 11
Oneida 77,349 79,866 2,517 3.3% 45
Erie 386,337 397,862 11,525 3.0% 93
Columbia 16,920 17,421 501 3.0% 1
Yates 5,753 5,915 162 2.8% 16
Franklin 10,314 10,538 224 2.2% 2
Genesee 17,686 18,070 384 2.2% 27
St. Lawrence 24,806 25,311 505 2.0% 17
Onondaga 202,019 205,972 3,953 2.0% 53
Madison 16,963 17,099 136 0.8% 6
Niagara 58,825 59,254 429 0.7% 46
Otsego 19,118 19,248 130 0.7% 2
Warren & Washington 43,817 44,105 288 0.7% 16
Steuben 29,370 29,532 162 0.6% 19
Essex 10,339 10,391 52 0.5% 4
Table 20: Change in Private Sector Employment by County 2014 - 2018*
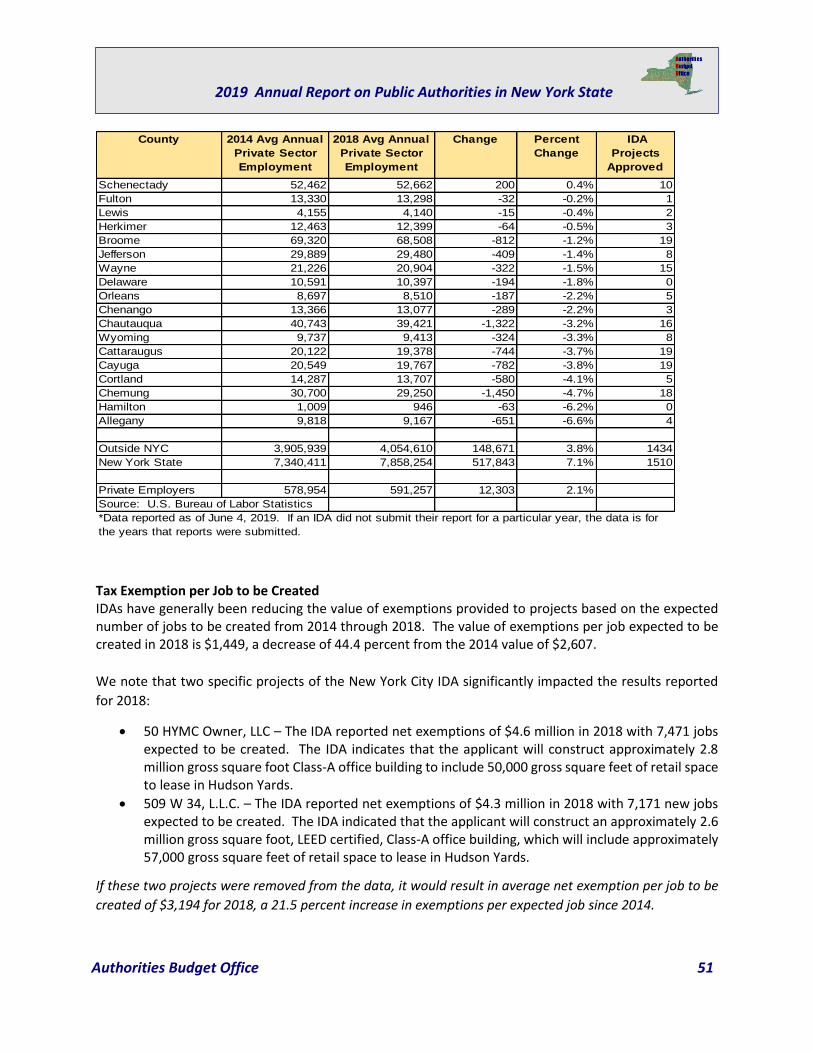
Authorities Budget Office 51
2019 Annual Report on Public Authorities in New York State
Tax Exemption per Job to be Created IDAs have generally been reducing the value of exemptions provided to projects based on the expected number of jobs to be created from 2014 through 2018. The value of exemptions per job expected to be created in 2018 is $1,449, a decrease of 44.4 percent from the 2014 value of $2,607.
We note that two specific projects of the New York City IDA significantly impacted the results reported
for 2018:
• 50 HYMC Owner, LLC – The IDA reported net exemptions of $4.6 million in 2018 with 7,471 jobs expected to be created. The IDA indicates that the applicant will construct approximately 2.8 million gross square foot Class-A office building to include 50,000 gross square feet of retail space to lease in Hudson Yards.
• 509 W 34, L.L.C. – The IDA reported net exemptions of $4.3 million in 2018 with 7,171 new jobs expected to be created. The IDA indicated that the applicant will construct an approximately 2.6 million gross square foot, LEED certified, Class-A office building, which will include approximately 57,000 gross square feet of retail space to lease in Hudson Yards.
If these two projects were removed from the data, it would result in average net exemption per job to be
created of $3,194 for 2018, a 21.5 percent increase in exemptions per expected job since 2014.
County 2014 Avg Annual
Private Sector
Employment
2018 Avg Annual
Private Sector
Employment
Change Percent
Change
IDA
Projects
Approved
Schenectady 52,462 52,662 200 0.4% 10
Fulton 13,330 13,298 -32 -0.2% 1
Lewis 4,155 4,140 -15 -0.4% 2
Herkimer 12,463 12,399 -64 -0.5% 3
Broome 69,320 68,508 -812 -1.2% 19
Jefferson 29,889 29,480 -409 -1.4% 8
Wayne 21,226 20,904 -322 -1.5% 15
Delaware 10,591 10,397 -194 -1.8% 0
Orleans 8,697 8,510 -187 -2.2% 5
Chenango 13,366 13,077 -289 -2.2% 3
Chautauqua 40,743 39,421 -1,322 -3.2% 16
Wyoming 9,737 9,413 -324 -3.3% 8
Cattaraugus 20,122 19,378 -744 -3.7% 19
Cayuga 20,549 19,767 -782 -3.8% 19
Cortland 14,287 13,707 -580 -4.1% 5
Chemung 30,700 29,250 -1,450 -4.7% 18
Hamilton 1,009 946 -63 -6.2% 0
Allegany 9,818 9,167 -651 -6.6% 4
Outside NYC 3,905,939 4,054,610 148,671 3.8% 1434
New York State 7,340,411 7,858,254 517,843 7.1% 1510
Private Employers 578,954 591,257 12,303 2.1%
Source: U.S. Bureau of Labor Statistics
*Data reported as of June 4, 2019. If an IDA did not submit their report for a particular year, the data is for
the years that reports were submitted.
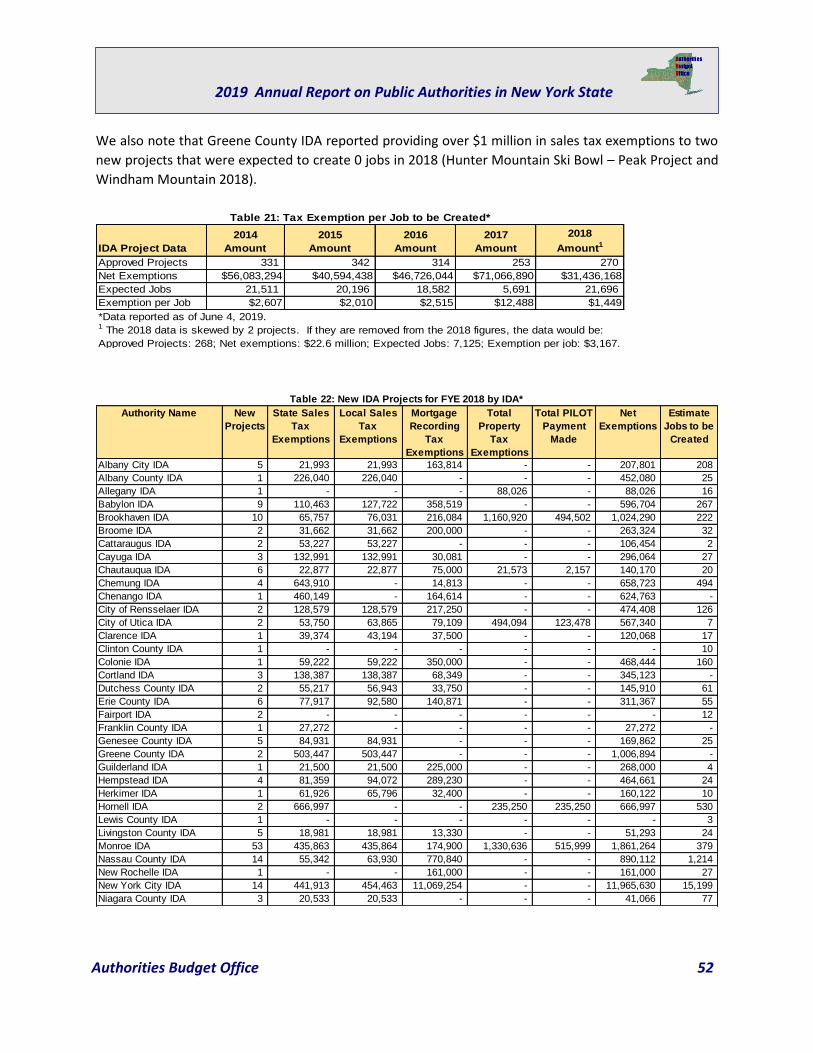
Authorities Budget Office 52
2019 Annual Report on Public Authorities in New York State
We also note that Greene County IDA reported providing over $1 million in sales tax exemptions to two
new projects that were expected to create 0 jobs in 2018 (Hunter Mountain Ski Bowl – Peak Project and
Windham Mountain 2018).
IDA Project Data
2014
Amount
2015
Amount
2016
Amount
2017
Amount
2018
Amount1
Approved Projects 331 342 314 253 270
Net Exemptions $56,083,294 $40,594,438 $46,726,044 $71,066,890 $31,436,168
Expected Jobs 21,511 20,196 18,582 5,691 21,696
Exemption per Job $2,607 $2,010 $2,515 $12,488 $1,449
*Data reported as of June 4, 2019.1 The 2018 data is skewed by 2 projects. If they are removed from the 2018 figures, the data would be:
Approved Projects: 268; Net exemptions: $22.6 million; Expected Jobs: 7,125; Exemption per job: $3,167.
Table 21: Tax Exemption per Job to be Created*
Authority Name New
Projects
State Sales
Tax
Exemptions
Local Sales
Tax
Exemptions
Mortgage
Recording
Tax
Exemptions
Total
Property
Tax
Exemptions
Total PILOT
Payment
Made
Net
Exemptions
Estimate
Jobs to be
Created
Albany City IDA 5 21,993 21,993 163,814 - - 207,801 208
Albany County IDA 1 226,040 226,040 - - - 452,080 25
Allegany IDA 1 - - - 88,026 - 88,026 16
Babylon IDA 9 110,463 127,722 358,519 - - 596,704 267
Brookhaven IDA 10 65,757 76,031 216,084 1,160,920 494,502 1,024,290 222
Broome IDA 2 31,662 31,662 200,000 - - 263,324 32
Cattaraugus IDA 2 53,227 53,227 - - - 106,454 2
Cayuga IDA 3 132,991 132,991 30,081 - - 296,064 27
Chautauqua IDA 6 22,877 22,877 75,000 21,573 2,157 140,170 20
Chemung IDA 4 643,910 - 14,813 - - 658,723 494
Chenango IDA 1 460,149 - 164,614 - - 624,763 -
City of Rensselaer IDA 2 128,579 128,579 217,250 - - 474,408 126
City of Utica IDA 2 53,750 63,865 79,109 494,094 123,478 567,340 7
Clarence IDA 1 39,374 43,194 37,500 - - 120,068 17
Clinton County IDA 1 - - - - - - 10
Colonie IDA 1 59,222 59,222 350,000 - - 468,444 160
Cortland IDA 3 138,387 138,387 68,349 - - 345,123 -
Dutchess County IDA 2 55,217 56,943 33,750 - - 145,910 61
Erie County IDA 6 77,917 92,580 140,871 - - 311,367 55
Fairport IDA 2 - - - - - - 12
Franklin County IDA 1 27,272 - - - - 27,272 -
Genesee County IDA 5 84,931 84,931 - - - 169,862 25
Greene County IDA 2 503,447 503,447 - - - 1,006,894 -
Guilderland IDA 1 21,500 21,500 225,000 - - 268,000 4
Hempstead IDA 4 81,359 94,072 289,230 - - 464,661 24
Herkimer IDA 1 61,926 65,796 32,400 - - 160,122 10
Hornell IDA 2 666,997 - - 235,250 235,250 666,997 530
Lewis County IDA 1 - - - - - - 3
Livingston County IDA 5 18,981 18,981 13,330 - - 51,293 24
Monroe IDA 53 435,863 435,864 174,900 1,330,636 515,999 1,861,264 379
Nassau County IDA 14 55,342 63,930 770,840 - - 890,112 1,214
New Rochelle IDA 1 - - 161,000 - - 161,000 27
New York City IDA 14 441,913 454,463 11,069,254 - - 11,965,630 15,199
Niagara County IDA 3 20,533 20,533 - - - 41,066 77
Table 22: New IDA Projects for FYE 2018 by IDA*
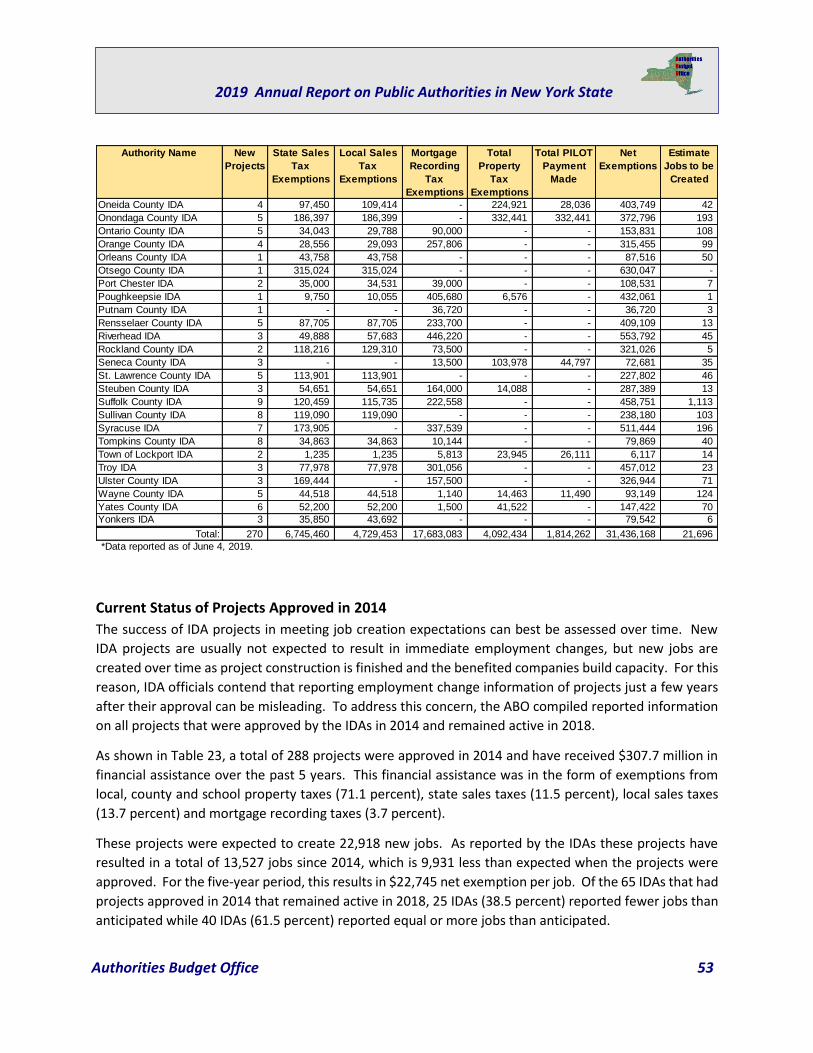
Authorities Budget Office 53
2019 Annual Report on Public Authorities in New York State
Current Status of Projects Approved in 2014
The success of IDA projects in meeting job creation expectations can best be assessed over time. New
IDA projects are usually not expected to result in immediate employment changes, but new jobs are
created over time as project construction is finished and the benefited companies build capacity. For this
reason, IDA officials contend that reporting employment change information of projects just a few years
after their approval can be misleading. To address this concern, the ABO compiled reported information
on all projects that were approved by the IDAs in 2014 and remained active in 2018.
As shown in Table 23, a total of 288 projects were approved in 2014 and have received $307.7 million in
financial assistance over the past 5 years. This financial assistance was in the form of exemptions from
local, county and school property taxes (71.1 percent), state sales taxes (11.5 percent), local sales taxes
(13.7 percent) and mortgage recording taxes (3.7 percent).
These projects were expected to create 22,918 new jobs. As reported by the IDAs these projects have
resulted in a total of 13,527 jobs since 2014, which is 9,931 less than expected when the projects were
approved. For the five-year period, this results in $22,745 net exemption per job. Of the 65 IDAs that had
projects approved in 2014 that remained active in 2018, 25 IDAs (38.5 percent) reported fewer jobs than
anticipated while 40 IDAs (61.5 percent) reported equal or more jobs than anticipated.
Authority Name New
Projects
State Sales
Tax
Exemptions
Local Sales
Tax
Exemptions
Mortgage
Recording
Tax
Exemptions
Total
Property
Tax
Exemptions
Total PILOT
Payment
Made
Net
Exemptions
Estimate
Jobs to be
Created
Oneida County IDA 4 97,450 109,414 - 224,921 28,036 403,749 42
Onondaga County IDA 5 186,397 186,399 - 332,441 332,441 372,796 193
Ontario County IDA 5 34,043 29,788 90,000 - - 153,831 108
Orange County IDA 4 28,556 29,093 257,806 - - 315,455 99
Orleans County IDA 1 43,758 43,758 - - - 87,516 50
Otsego County IDA 1 315,024 315,024 - - - 630,047 -
Port Chester IDA 2 35,000 34,531 39,000 - - 108,531 7
Poughkeepsie IDA 1 9,750 10,055 405,680 6,576 - 432,061 1
Putnam County IDA 1 - - 36,720 - - 36,720 3
Rensselaer County IDA 5 87,705 87,705 233,700 - - 409,109 13
Riverhead IDA 3 49,888 57,683 446,220 - - 553,792 45
Rockland County IDA 2 118,216 129,310 73,500 - - 321,026 5
Seneca County IDA 3 - - 13,500 103,978 44,797 72,681 35
St. Lawrence County IDA 5 113,901 113,901 - - - 227,802 46
Steuben County IDA 3 54,651 54,651 164,000 14,088 - 287,389 13
Suffolk County IDA 9 120,459 115,735 222,558 - - 458,751 1,113
Sullivan County IDA 8 119,090 119,090 - - - 238,180 103
Syracuse IDA 7 173,905 - 337,539 - - 511,444 196
Tompkins County IDA 8 34,863 34,863 10,144 - - 79,869 40
Town of Lockport IDA 2 1,235 1,235 5,813 23,945 26,111 6,117 14
Troy IDA 3 77,978 77,978 301,056 - - 457,012 23
Ulster County IDA 3 169,444 - 157,500 - - 326,944 71
Wayne County IDA 5 44,518 44,518 1,140 14,463 11,490 93,149 124
Yates County IDA 6 52,200 52,200 1,500 41,522 - 147,422 70
Yonkers IDA 3 35,850 43,692 - - - 79,542 6
Total: 270 6,745,460 4,729,453 17,683,083 4,092,434 1,814,262 31,436,168 21,696
*Data reported as of June 4, 2019.
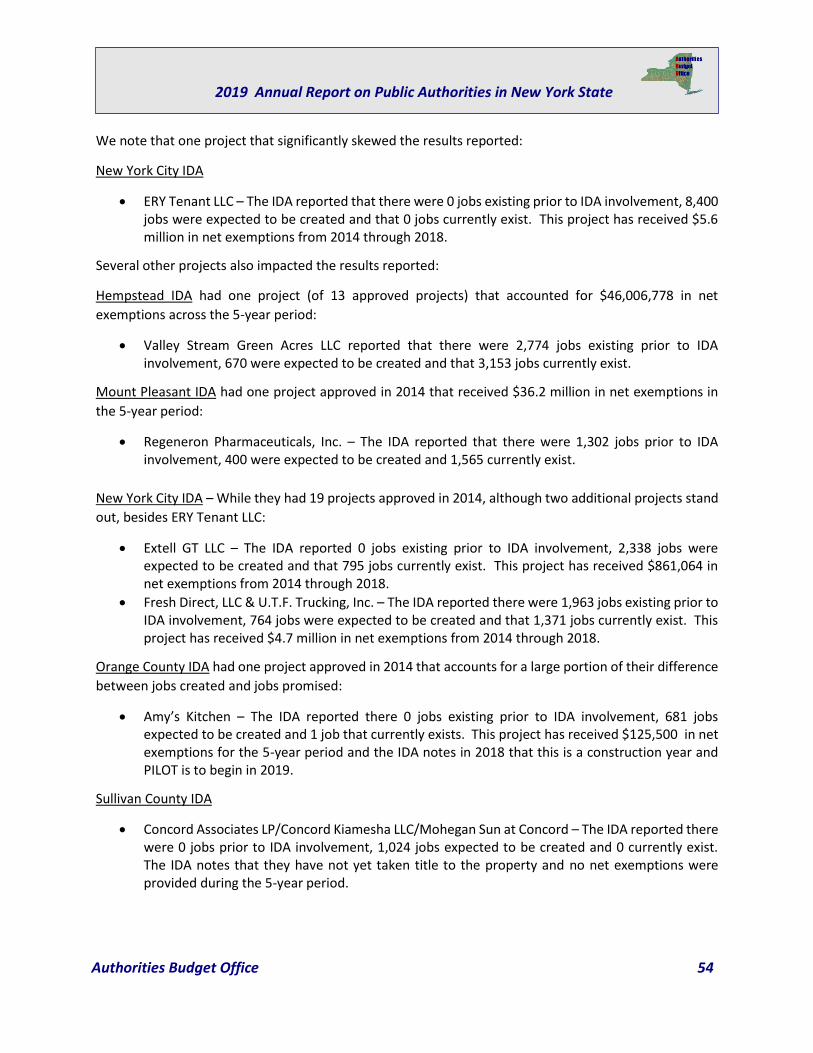
Authorities Budget Office 54
2019 Annual Report on Public Authorities in New York State
We note that one project that significantly skewed the results reported:
New York City IDA
• ERY Tenant LLC – The IDA reported that there were 0 jobs existing prior to IDA involvement, 8,400 jobs were expected to be created and that 0 jobs currently exist. This project has received $5.6 million in net exemptions from 2014 through 2018.
Several other projects also impacted the results reported:
Hempstead IDA had one project (of 13 approved projects) that accounted for $46,006,778 in net
exemptions across the 5-year period:
• Valley Stream Green Acres LLC reported that there were 2,774 jobs existing prior to IDA involvement, 670 were expected to be created and that 3,153 jobs currently exist.
Mount Pleasant IDA had one project approved in 2014 that received $36.2 million in net exemptions in
the 5-year period:
• Regeneron Pharmaceuticals, Inc. – The IDA reported that there were 1,302 jobs prior to IDA involvement, 400 were expected to be created and 1,565 currently exist.
New York City IDA – While they had 19 projects approved in 2014, although two additional projects stand
out, besides ERY Tenant LLC:
• Extell GT LLC – The IDA reported 0 jobs existing prior to IDA involvement, 2,338 jobs were expected to be created and that 795 jobs currently exist. This project has received $861,064 in net exemptions from 2014 through 2018.
• Fresh Direct, LLC & U.T.F. Trucking, Inc. – The IDA reported there were 1,963 jobs existing prior to IDA involvement, 764 jobs were expected to be created and that 1,371 jobs currently exist. This project has received $4.7 million in net exemptions from 2014 through 2018.
Orange County IDA had one project approved in 2014 that accounts for a large portion of their difference
between jobs created and jobs promised:
• Amy’s Kitchen – The IDA reported there 0 jobs existing prior to IDA involvement, 681 jobs expected to be created and 1 job that currently exists. This project has received $125,500 in net exemptions for the 5-year period and the IDA notes in 2018 that this is a construction year and PILOT is to begin in 2019.
Sullivan County IDA
• Concord Associates LP/Concord Kiamesha LLC/Mohegan Sun at Concord – The IDA reported there were 0 jobs prior to IDA involvement, 1,024 jobs expected to be created and 0 currently exist. The IDA notes that they have not yet taken title to the property and no net exemptions were provided during the 5-year period.
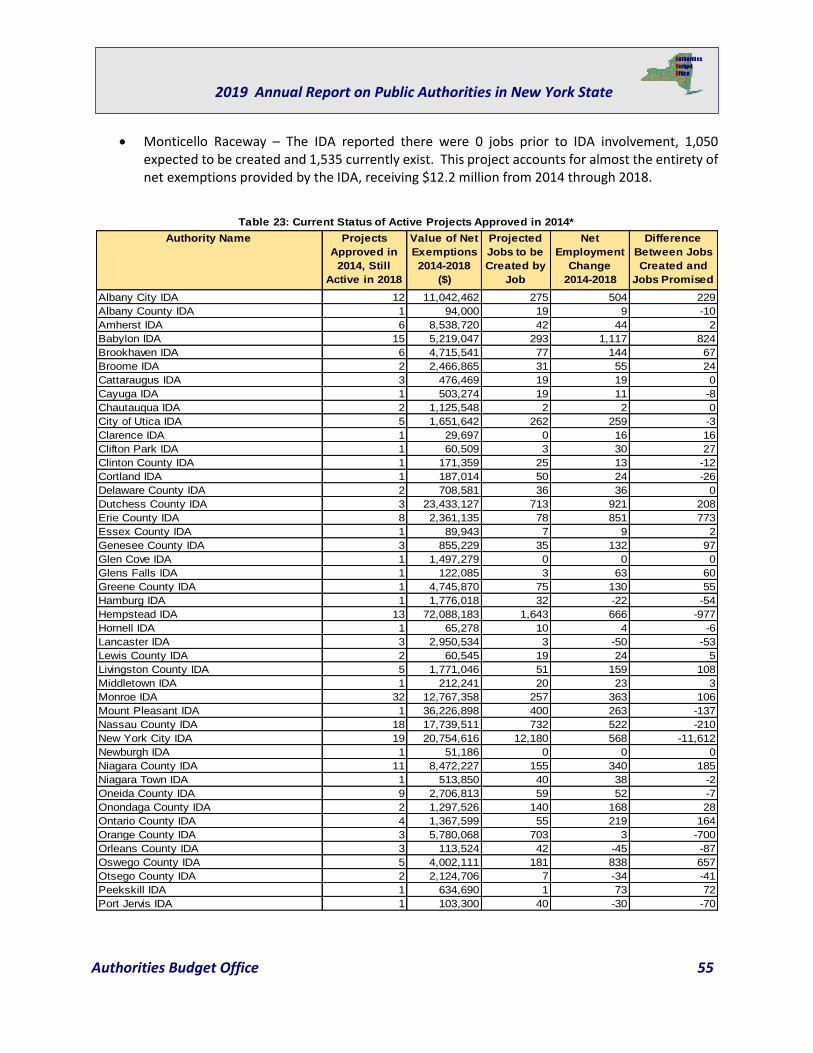
Authorities Budget Office 55
2019 Annual Report on Public Authorities in New York State
• Monticello Raceway – The IDA reported there were 0 jobs prior to IDA involvement, 1,050 expected to be created and 1,535 currently exist. This project accounts for almost the entirety of net exemptions provided by the IDA, receiving $12.2 million from 2014 through 2018.
Authority Name Projects
Approved in
2014, Still
Active in 2018
Value of Net
Exemptions
2014-2018
($)
Projected
Jobs to be
Created by
Job
Net
Employment
Change
2014-2018
Difference
Between Jobs
Created and
Jobs Promised
Albany City IDA 12 11,042,462 275 504 229
Albany County IDA 1 94,000 19 9 -10
Amherst IDA 6 8,538,720 42 44 2
Babylon IDA 15 5,219,047 293 1,117 824
Brookhaven IDA 6 4,715,541 77 144 67
Broome IDA 2 2,466,865 31 55 24
Cattaraugus IDA 3 476,469 19 19 0
Cayuga IDA 1 503,274 19 11 -8
Chautauqua IDA 2 1,125,548 2 2 0
City of Utica IDA 5 1,651,642 262 259 -3
Clarence IDA 1 29,697 0 16 16
Clifton Park IDA 1 60,509 3 30 27
Clinton County IDA 1 171,359 25 13 -12
Cortland IDA 1 187,014 50 24 -26
Delaware County IDA 2 708,581 36 36 0
Dutchess County IDA 3 23,433,127 713 921 208
Erie County IDA 8 2,361,135 78 851 773
Essex County IDA 1 89,943 7 9 2
Genesee County IDA 3 855,229 35 132 97
Glen Cove IDA 1 1,497,279 0 0 0
Glens Falls IDA 1 122,085 3 63 60
Greene County IDA 1 4,745,870 75 130 55
Hamburg IDA 1 1,776,018 32 -22 -54
Hempstead IDA 13 72,088,183 1,643 666 -977
Hornell IDA 1 65,278 10 4 -6
Lancaster IDA 3 2,950,534 3 -50 -53
Lewis County IDA 2 60,545 19 24 5
Livingston County IDA 5 1,771,046 51 159 108
Middletown IDA 1 212,241 20 23 3
Monroe IDA 32 12,767,358 257 363 106
Mount Pleasant IDA 1 36,226,898 400 263 -137
Nassau County IDA 18 17,739,511 732 522 -210
New York City IDA 19 20,754,616 12,180 568 -11,612
Newburgh IDA 1 51,186 0 0 0
Niagara County IDA 11 8,472,227 155 340 185
Niagara Town IDA 1 513,850 40 38 -2
Oneida County IDA 9 2,706,813 59 52 -7
Onondaga County IDA 2 1,297,526 140 168 28
Ontario County IDA 4 1,367,599 55 219 164
Orange County IDA 3 5,780,068 703 3 -700
Orleans County IDA 3 113,524 42 -45 -87
Oswego County IDA 5 4,002,111 181 838 657
Otsego County IDA 2 2,124,706 7 -34 -41
Peekskill IDA 1 634,690 1 73 72
Port Jervis IDA 1 103,300 40 -30 -70
Table 23: Current Status of Active Projects Approved in 2014*
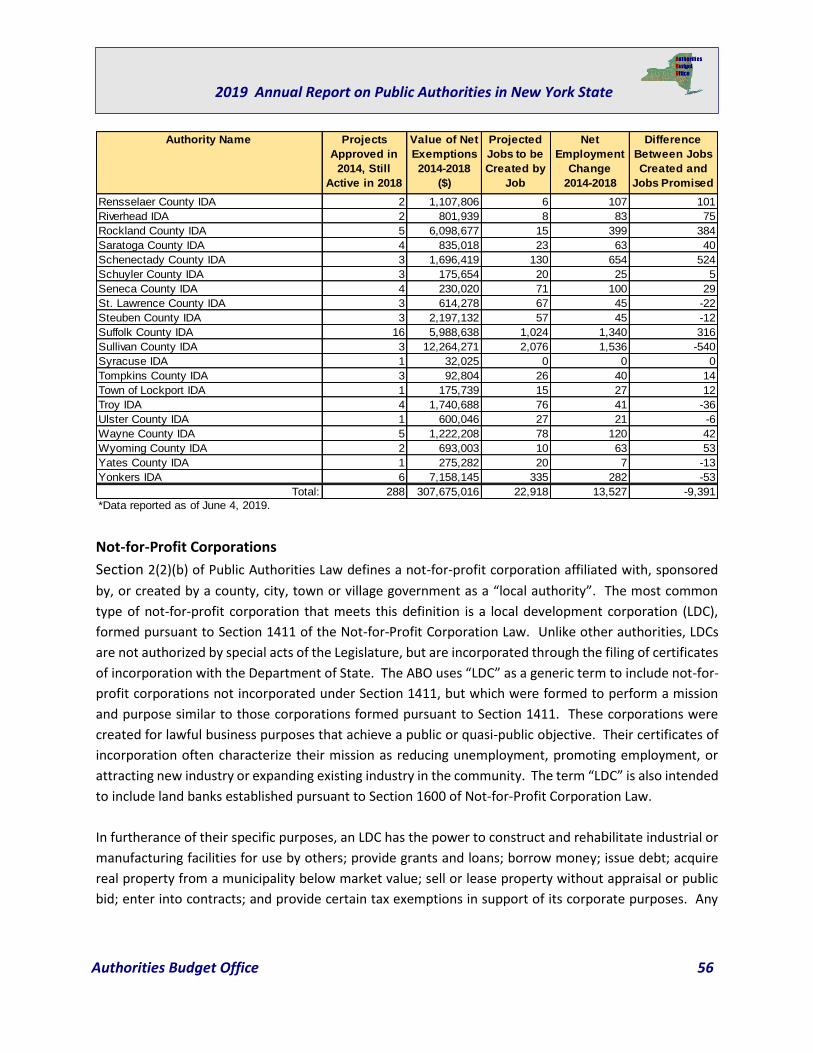
Authorities Budget Office 56
2019 Annual Report on Public Authorities in New York State
Not-for-Profit Corporations
Section 2(2)(b) of Public Authorities Law defines a not-for-profit corporation affiliated with, sponsored
by, or created by a county, city, town or village government as a “local authority”. The most common
type of not-for-profit corporation that meets this definition is a local development corporation (LDC),
formed pursuant to Section 1411 of the Not-for-Profit Corporation Law. Unlike other authorities, LDCs
are not authorized by special acts of the Legislature, but are incorporated through the filing of certificates
of incorporation with the Department of State. The ABO uses “LDC” as a generic term to include not-for-
profit corporations not incorporated under Section 1411, but which were formed to perform a mission
and purpose similar to those corporations formed pursuant to Section 1411. These corporations were
created for lawful business purposes that achieve a public or quasi-public objective. Their certificates of
incorporation often characterize their mission as reducing unemployment, promoting employment, or
attracting new industry or expanding existing industry in the community. The term “LDC” is also intended
to include land banks established pursuant to Section 1600 of Not-for-Profit Corporation Law.
In furtherance of their specific purposes, an LDC has the power to construct and rehabilitate industrial or
manufacturing facilities for use by others; provide grants and loans; borrow money; issue debt; acquire
real property from a municipality below market value; sell or lease property without appraisal or public
bid; enter into contracts; and provide certain tax exemptions in support of its corporate purposes. Any
Authority Name Projects
Approved in
2014, Still
Active in 2018
Value of Net
Exemptions
2014-2018
($)
Projected
Jobs to be
Created by
Job
Net
Employment
Change
2014-2018
Difference
Between Jobs
Created and
Jobs Promised
Rensselaer County IDA 2 1,107,806 6 107 101
Riverhead IDA 2 801,939 8 83 75
Rockland County IDA 5 6,098,677 15 399 384
Saratoga County IDA 4 835,018 23 63 40
Schenectady County IDA 3 1,696,419 130 654 524
Schuyler County IDA 3 175,654 20 25 5
Seneca County IDA 4 230,020 71 100 29
St. Lawrence County IDA 3 614,278 67 45 -22
Steuben County IDA 3 2,197,132 57 45 -12
Suffolk County IDA 16 5,988,638 1,024 1,340 316
Sullivan County IDA 3 12,264,271 2,076 1,536 -540
Syracuse IDA 1 32,025 0 0 0
Tompkins County IDA 3 92,804 26 40 14
Town of Lockport IDA 1 175,739 15 27 12
Troy IDA 4 1,740,688 76 41 -36
Ulster County IDA 1 600,046 27 21 -6
Wayne County IDA 5 1,222,208 78 120 42
Wyoming County IDA 2 693,003 10 63 53
Yates County IDA 1 275,282 20 7 -13
Yonkers IDA 6 7,158,145 335 282 -53
Total: 288 307,675,016 22,918 13,527 -9,391
*Data reported as of June 4, 2019.
Authorities Budget Office 57
2019 Annual Report on Public Authorities in New York State
county, city, town or village in New York State may cause the incorporation of an LDC by public officers or
private individuals.
The creation of LDCs in recent years has increased the risk for waste and abuse of public funds. LDCs could
be used as vehicles to alleviate municipal budget pressures by taking debt off the municipality’s books or
providing cash infusions to balance budgets. That is why the ABO has focused on identifying LDCs that
meet the definition of a local authority and subjecting those corporations to the regulatory, governance
and reporting provisions of the PAAA and PARA.
Excluding Tobacco Asset Securitization Corporations (TASCs), there were a total of 66 LDCs that reported
having provided 1,317 loans with a total amount of $210.8 million outstanding, as shown in Table 24.
Loans issued by the Catskill Watershed Corporation, the Buffalo and Erie County Regional Development
Corporation, the NYC Neighborhood Capital Corporation and the NYC Economic Development Corporation
comprised 54.3 percent of the amount of loans outstanding. The largest loan reported in 2018 was issued
by Buffalo Urban Development Corporation for $9.7 million that was loaned to the development project
at Northland Avenue which will be the location of the Western New York Workforce Training Center.
Table 25 shows that excluding TASCs, there were a total of 34 LDCs that reported providing grant funds in
2018. These LDCs reported providing a total of 192 grants totaling $56.4 million. This is a large decrease
(-79.4 percent) from last year’s reporting period, when in 2017 the total grant funds were mostly
comprised of the $112.8 million grant that Hudson Yards Infrastructure Corporation’s issued to the NYC
Transitional Finance Authority and a $91.4 million grant that New York City Economic Development
Corporation (NYC EDC) issued to the Wildlife Conservation Society. In 2018, NYC EDC was responsible for
88.2 percent of the total dollar amount of grants ($49.7 million), with 14 grants issued. The largest grant
NYC EDC issued was $14.2 million for upgrades to Second Stage Theater for renovations to their theater,
and adding wheelchair access to their box office, lobby and restrooms. As a comparison, the LDC with the
second largest amount of grants issued in 2018 was Genesee Gateway Local Development Corporation
for $944,089.
As indicated in Table 26, 60 LDCs (excluding TASCS) reported bonds issued for development projects.
These LDCs reported a total of 484 bonds issued, with $15.6 billion outstanding. Five LDCs account for
66.4 percent of the amount outstanding in bonds: Build NYC Resource Corporation ($3.0 billion), Hudson
Yards Infrastructure Corporation ($2.7 billion), STAR Corporation ($1.8 billion), Monroe County Industrial
Development Corporation ($1.8 billion), and Dutchess County Local Development Corporation ($1.0
billion). Hudson Yards Infrastructure Corporation reported one of the largest outstanding bond amounts
during 2018, which was a result of 2 bonds issued related to infrastructure improvements in the Hudson
Yards area on the West Side of Manhattan.
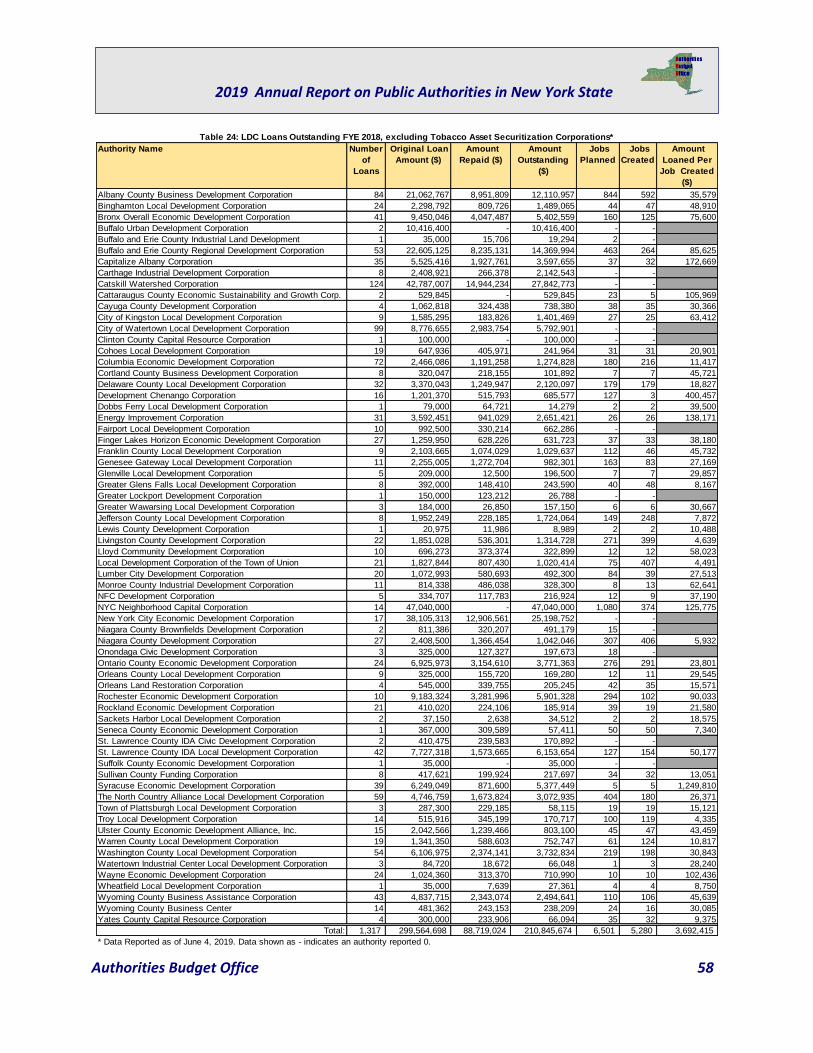
Authorities Budget Office 58
2019 Annual Report on Public Authorities in New York State
Authority Name Number
of
Loans
Original Loan
Amount ($)
Amount
Repaid ($)
Amount
Outstanding
($)
Jobs
Planned
Jobs
Created
Amount
Loaned Per
Job Created
($)
Albany County Business Development Corporation 84 21,062,767 8,951,809 12,110,957 844 592 35,579
Binghamton Local Development Corporation 24 2,298,792 809,726 1,489,065 44 47 48,910
Bronx Overall Economic Development Corporation 41 9,450,046 4,047,487 5,402,559 160 125 75,600
Buffalo Urban Development Corporation 2 10,416,400 - 10,416,400 - -
Buffalo and Erie County Industrial Land Development 1 35,000 15,706 19,294 2 -
Buffalo and Erie County Regional Development Corporation 53 22,605,125 8,235,131 14,369,994 463 264 85,625
Capitalize Albany Corporation 35 5,525,416 1,927,761 3,597,655 37 32 172,669
Carthage Industrial Development Corporation 8 2,408,921 266,378 2,142,543 - -
Catskill Watershed Corporation 124 42,787,007 14,944,234 27,842,773 - -
Cattaraugus County Economic Sustainability and Growth Corp. 2 529,845 - 529,845 23 5 105,969
Cayuga County Development Corporation 4 1,062,818 324,438 738,380 38 35 30,366
City of Kingston Local Development Corporation 9 1,585,295 183,826 1,401,469 27 25 63,412
City of Watertown Local Development Corporation 99 8,776,655 2,983,754 5,792,901 - -
Clinton County Capital Resource Corporation 1 100,000 - 100,000 - -
Cohoes Local Development Corporation 19 647,936 405,971 241,964 31 31 20,901
Columbia Economic Development Corporation 72 2,466,086 1,191,258 1,274,828 180 216 11,417
Cortland County Business Development Corporation 8 320,047 218,155 101,892 7 7 45,721
Delaware County Local Development Corporation 32 3,370,043 1,249,947 2,120,097 179 179 18,827
Development Chenango Corporation 16 1,201,370 515,793 685,577 127 3 400,457
Dobbs Ferry Local Development Corporation 1 79,000 64,721 14,279 2 2 39,500
Energy Improvement Corporation 31 3,592,451 941,029 2,651,421 26 26 138,171
Fairport Local Development Corporation 10 992,500 330,214 662,286 - -
Finger Lakes Horizon Economic Development Corporation 27 1,259,950 628,226 631,723 37 33 38,180
Franklin County Local Development Corporation 9 2,103,665 1,074,029 1,029,637 112 46 45,732
Genesee Gateway Local Development Corporation 11 2,255,005 1,272,704 982,301 163 83 27,169
Glenville Local Development Corporation 5 209,000 12,500 196,500 7 7 29,857
Greater Glens Falls Local Development Corporation 8 392,000 148,410 243,590 40 48 8,167
Greater Lockport Development Corporation 1 150,000 123,212 26,788 - -
Greater Wawarsing Local Development Corporation 3 184,000 26,850 157,150 6 6 30,667
Jefferson County Local Development Corporation 8 1,952,249 228,185 1,724,064 149 248 7,872
Lewis County Development Corporation 1 20,975 11,986 8,989 2 2 10,488
Livingston County Development Corporation 22 1,851,028 536,301 1,314,728 271 399 4,639
Lloyd Community Development Corporation 10 696,273 373,374 322,899 12 12 58,023
Local Development Corporation of the Town of Union 21 1,827,844 807,430 1,020,414 75 407 4,491
Lumber City Development Corporation 20 1,072,993 580,693 492,300 84 39 27,513
Monroe County Industrial Development Corporation 11 814,338 486,038 328,300 8 13 62,641
NFC Development Corporation 5 334,707 117,783 216,924 12 9 37,190
NYC Neighborhood Capital Corporation 14 47,040,000 - 47,040,000 1,080 374 125,775
New York City Economic Development Corporation 17 38,105,313 12,906,561 25,198,752 - -
Niagara County Brownfields Development Corporation 2 811,386 320,207 491,179 15 -
Niagara County Development Corporation 27 2,408,500 1,366,454 1,042,046 307 406 5,932
Onondaga Civic Development Corporation 3 325,000 127,327 197,673 18 -
Ontario County Economic Development Corporation 24 6,925,973 3,154,610 3,771,363 276 291 23,801
Orleans County Local Development Corporation 9 325,000 155,720 169,280 12 11 29,545
Orleans Land Restoration Corporation 4 545,000 339,755 205,245 42 35 15,571
Rochester Economic Development Corporation 10 9,183,324 3,281,996 5,901,328 294 102 90,033
Rockland Economic Development Corporation 21 410,020 224,106 185,914 39 19 21,580
Sackets Harbor Local Development Corporation 2 37,150 2,638 34,512 2 2 18,575
Seneca County Economic Development Corporation 1 367,000 309,589 57,411 50 50 7,340
St. Lawrence County IDA Civic Development Corporation 2 410,475 239,583 170,892 - -
St. Lawrence County IDA Local Development Corporation 42 7,727,318 1,573,665 6,153,654 127 154 50,177
Suffolk County Economic Development Corporation 1 35,000 - 35,000 - -
Sullivan County Funding Corporation 8 417,621 199,924 217,697 34 32 13,051
Syracuse Economic Development Corporation 39 6,249,049 871,600 5,377,449 5 5 1,249,810
The North Country Alliance Local Development Corporation 59 4,746,759 1,673,824 3,072,935 404 180 26,371
Town of Plattsburgh Local Development Corporation 3 287,300 229,185 58,115 19 19 15,121
Troy Local Development Corporation 14 515,916 345,199 170,717 100 119 4,335
Ulster County Economic Development Alliance, Inc. 15 2,042,566 1,239,466 803,100 45 47 43,459
Warren County Local Development Corporation 19 1,341,350 588,603 752,747 61 124 10,817
Washington County Local Development Corporation 54 6,106,975 2,374,141 3,732,834 219 198 30,843
Watertown Industrial Center Local Development Corporation 3 84,720 18,672 66,048 1 3 28,240
Wayne Economic Development Corporation 24 1,024,360 313,370 710,990 10 10 102,436
Wheatfield Local Development Corporation 1 35,000 7,639 27,361 4 4 8,750
Wyoming County Business Assistance Corporation 43 4,837,715 2,343,074 2,494,641 110 106 45,639
Wyoming County Business Center 14 481,362 243,153 238,209 24 16 30,085
Yates County Capital Resource Corporation 4 300,000 233,906 66,094 35 32 9,375
Total: 1,317 299,564,698 88,719,024 210,845,674 6,501 5,280 3,692,415
* Data Reported as of June 4, 2019. Data shown as - indicates an authority reported 0.
Table 24: LDC Loans Outstanding FYE 2018, excluding Tobacco Asset Securitization Corporations*
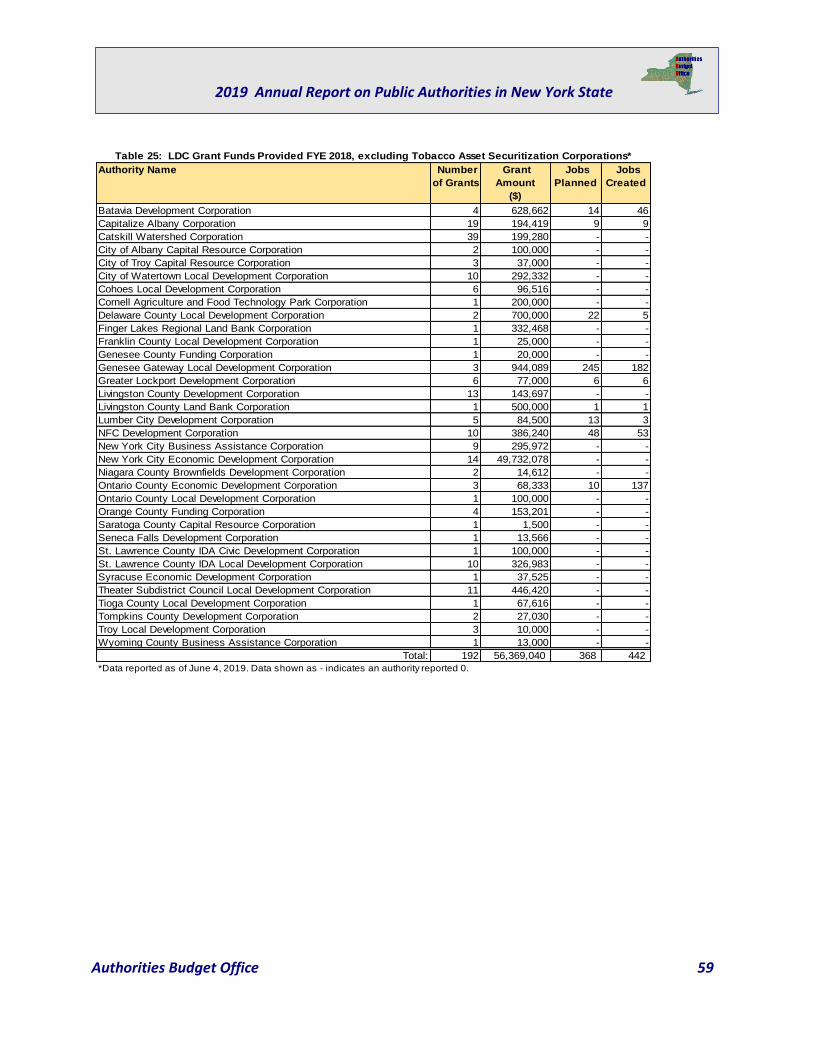
Authorities Budget Office 59
2019 Annual Report on Public Authorities in New York State
Authority Name Number
of Grants
Grant
Amount
($)
Jobs
Planned
Jobs
Created
Batavia Development Corporation 4 628,662 14 46
Capitalize Albany Corporation 19 194,419 9 9
Catskill Watershed Corporation 39 199,280 - -
City of Albany Capital Resource Corporation 2 100,000 - -
City of Troy Capital Resource Corporation 3 37,000 - -
City of Watertown Local Development Corporation 10 292,332 - -
Cohoes Local Development Corporation 6 96,516 - -
Cornell Agriculture and Food Technology Park Corporation 1 200,000 - -
Delaware County Local Development Corporation 2 700,000 22 5
Finger Lakes Regional Land Bank Corporation 1 332,468 - -
Franklin County Local Development Corporation 1 25,000 - -
Genesee County Funding Corporation 1 20,000 - -
Genesee Gateway Local Development Corporation 3 944,089 245 182
Greater Lockport Development Corporation 6 77,000 6 6
Livingston County Development Corporation 13 143,697 - -
Livingston County Land Bank Corporation 1 500,000 1 1
Lumber City Development Corporation 5 84,500 13 3
NFC Development Corporation 10 386,240 48 53
New York City Business Assistance Corporation 9 295,972 - -
New York City Economic Development Corporation 14 49,732,078 - -
Niagara County Brownfields Development Corporation 2 14,612 - -
Ontario County Economic Development Corporation 3 68,333 10 137
Ontario County Local Development Corporation 1 100,000 - -
Orange County Funding Corporation 4 153,201 - -
Saratoga County Capital Resource Corporation 1 1,500 - -
Seneca Falls Development Corporation 1 13,566 - -
St. Lawrence County IDA Civic Development Corporation 1 100,000 - -
St. Lawrence County IDA Local Development Corporation 10 326,983 - -
Syracuse Economic Development Corporation 1 37,525 - -
Theater Subdistrict Council Local Development Corporation 11 446,420 - -
Tioga County Local Development Corporation 1 67,616 - -
Tompkins County Development Corporation 2 27,030 - -
Troy Local Development Corporation 3 10,000 - -
Wyoming County Business Assistance Corporation 1 13,000 - -
Total: 192 56,369,040 368 442
*Data reported as of June 4, 2019. Data shown as - indicates an authority reported 0.
Table 25: LDC Grant Funds Provided FYE 2018, excluding Tobacco Asset Securitization Corporations*
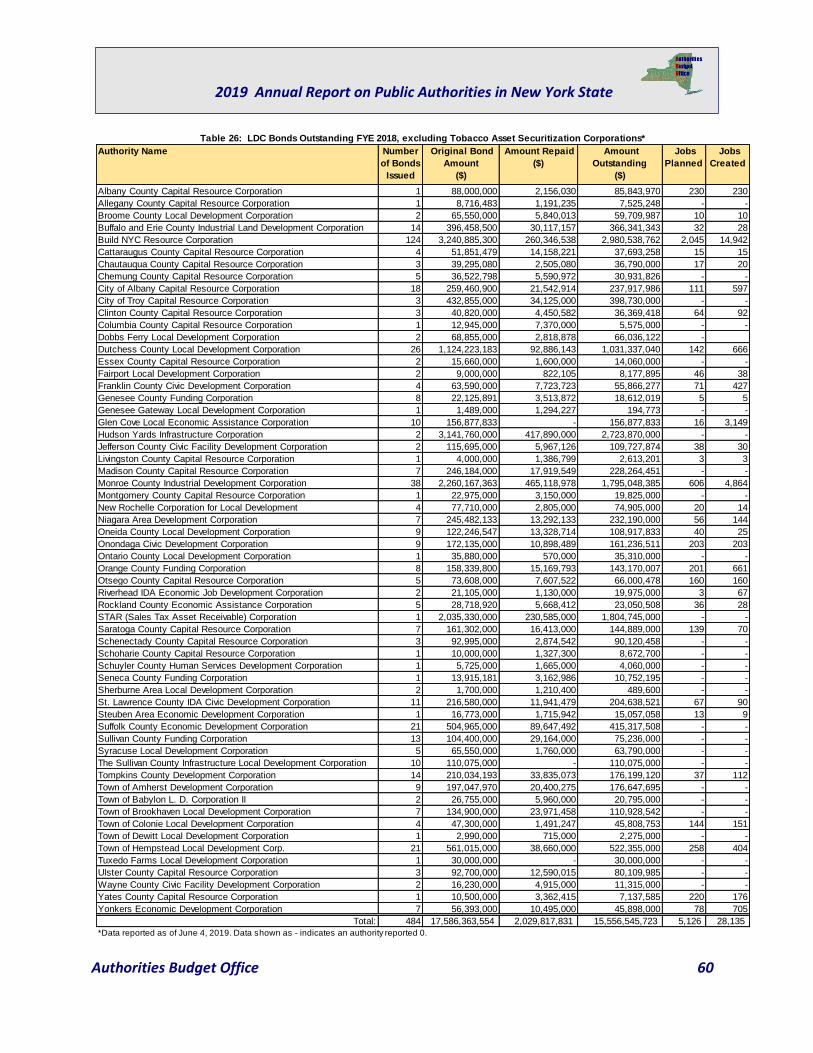
Authorities Budget Office 60
2019 Annual Report on Public Authorities in New York State
Authority Name Number
of Bonds
Issued
Original Bond
Amount
($)
Amount Repaid
($)
Amount
Outstanding
($)
Jobs
Planned
Jobs
Created
Albany County Capital Resource Corporation 1 88,000,000 2,156,030 85,843,970 230 230
Allegany County Capital Resource Corporation 1 8,716,483 1,191,235 7,525,248 - -
Broome County Local Development Corporation 2 65,550,000 5,840,013 59,709,987 10 10
Buffalo and Erie County Industrial Land Development Corporation 14 396,458,500 30,117,157 366,341,343 32 28
Build NYC Resource Corporation 124 3,240,885,300 260,346,538 2,980,538,762 2,045 14,942
Cattaraugus County Capital Resource Corporation 4 51,851,479 14,158,221 37,693,258 15 15
Chautauqua County Capital Resource Corporation 3 39,295,080 2,505,080 36,790,000 17 20
Chemung County Capital Resource Corporation 5 36,522,798 5,590,972 30,931,826 - -
City of Albany Capital Resource Corporation 18 259,460,900 21,542,914 237,917,986 111 597
City of Troy Capital Resource Corporation 3 432,855,000 34,125,000 398,730,000 - -
Clinton County Capital Resource Corporation 3 40,820,000 4,450,582 36,369,418 64 92
Columbia County Capital Resource Corporation 1 12,945,000 7,370,000 5,575,000 - -
Dobbs Ferry Local Development Corporation 2 68,855,000 2,818,878 66,036,122 -
Dutchess County Local Development Corporation 26 1,124,223,183 92,886,143 1,031,337,040 142 666
Essex County Capital Resource Corporation 2 15,660,000 1,600,000 14,060,000 - -
Fairport Local Development Corporation 2 9,000,000 822,105 8,177,895 46 38
Franklin County Civic Development Corporation 4 63,590,000 7,723,723 55,866,277 71 427
Genesee County Funding Corporation 8 22,125,891 3,513,872 18,612,019 5 5
Genesee Gateway Local Development Corporation 1 1,489,000 1,294,227 194,773 - -
Glen Cove Local Economic Assistance Corporation 10 156,877,833 - 156,877,833 16 3,149
Hudson Yards Infrastructure Corporation 2 3,141,760,000 417,890,000 2,723,870,000 - -
Jefferson County Civic Facility Development Corporation 2 115,695,000 5,967,126 109,727,874 38 30
Livingston County Capital Resource Corporation 1 4,000,000 1,386,799 2,613,201 3 3
Madison County Capital Resource Corporation 7 246,184,000 17,919,549 228,264,451 - -
Monroe County Industrial Development Corporation 38 2,260,167,363 465,118,978 1,795,048,385 606 4,864
Montgomery County Capital Resource Corporation 1 22,975,000 3,150,000 19,825,000 - -
New Rochelle Corporation for Local Development 4 77,710,000 2,805,000 74,905,000 20 14
Niagara Area Development Corporation 7 245,482,133 13,292,133 232,190,000 56 144
Oneida County Local Development Corporation 9 122,246,547 13,328,714 108,917,833 40 25
Onondaga Civic Development Corporation 9 172,135,000 10,898,489 161,236,511 203 203
Ontario County Local Development Corporation 1 35,880,000 570,000 35,310,000 - -
Orange County Funding Corporation 8 158,339,800 15,169,793 143,170,007 201 661
Otsego County Capital Resource Corporation 5 73,608,000 7,607,522 66,000,478 160 160
Riverhead IDA Economic Job Development Corporation 2 21,105,000 1,130,000 19,975,000 3 67
Rockland County Economic Assistance Corporation 5 28,718,920 5,668,412 23,050,508 36 28
STAR (Sales Tax Asset Receivable) Corporation 1 2,035,330,000 230,585,000 1,804,745,000 - -
Saratoga County Capital Resource Corporation 7 161,302,000 16,413,000 144,889,000 139 70
Schenectady County Capital Resource Corporation 3 92,995,000 2,874,542 90,120,458 - -
Schoharie County Capital Resource Corporation 1 10,000,000 1,327,300 8,672,700 - -
Schuyler County Human Services Development Corporation 1 5,725,000 1,665,000 4,060,000 - -
Seneca County Funding Corporation 1 13,915,181 3,162,986 10,752,195 - -
Sherburne Area Local Development Corporation 2 1,700,000 1,210,400 489,600 - -
St. Lawrence County IDA Civic Development Corporation 11 216,580,000 11,941,479 204,638,521 67 90
Steuben Area Economic Development Corporation 1 16,773,000 1,715,942 15,057,058 13 9
Suffolk County Economic Development Corporation 21 504,965,000 89,647,492 415,317,508 - -
Sullivan County Funding Corporation 13 104,400,000 29,164,000 75,236,000 - -
Syracuse Local Development Corporation 5 65,550,000 1,760,000 63,790,000 - -
The Sullivan County Infrastructure Local Development Corporation 10 110,075,000 - 110,075,000 - -
Tompkins County Development Corporation 14 210,034,193 33,835,073 176,199,120 37 112
Town of Amherst Development Corporation 9 197,047,970 20,400,275 176,647,695 - -
Town of Babylon L. D. Corporation II 2 26,755,000 5,960,000 20,795,000 - -
Town of Brookhaven Local Development Corporation 7 134,900,000 23,971,458 110,928,542 - -
Town of Colonie Local Development Corporation 4 47,300,000 1,491,247 45,808,753 144 151
Town of Dewitt Local Development Corporation 1 2,990,000 715,000 2,275,000 - -
Town of Hempstead Local Development Corp. 21 561,015,000 38,660,000 522,355,000 258 404
Tuxedo Farms Local Development Corporation 1 30,000,000 - 30,000,000 - -
Ulster County Capital Resource Corporation 3 92,700,000 12,590,015 80,109,985 - -
Wayne County Civic Facility Development Corporation 2 16,230,000 4,915,000 11,315,000 - -
Yates County Capital Resource Corporation 1 10,500,000 3,362,415 7,137,585 220 176
Yonkers Economic Development Corporation 7 56,393,000 10,495,000 45,898,000 78 705
Total: 484 17,586,363,554 2,029,817,831 15,556,545,723 5,126 28,135
*Data reported as of June 4, 2019. Data shown as - indicates an authority reported 0.
Table 26: LDC Bonds Outstanding FYE 2018, excluding Tobacco Asset Securitization Corporations*
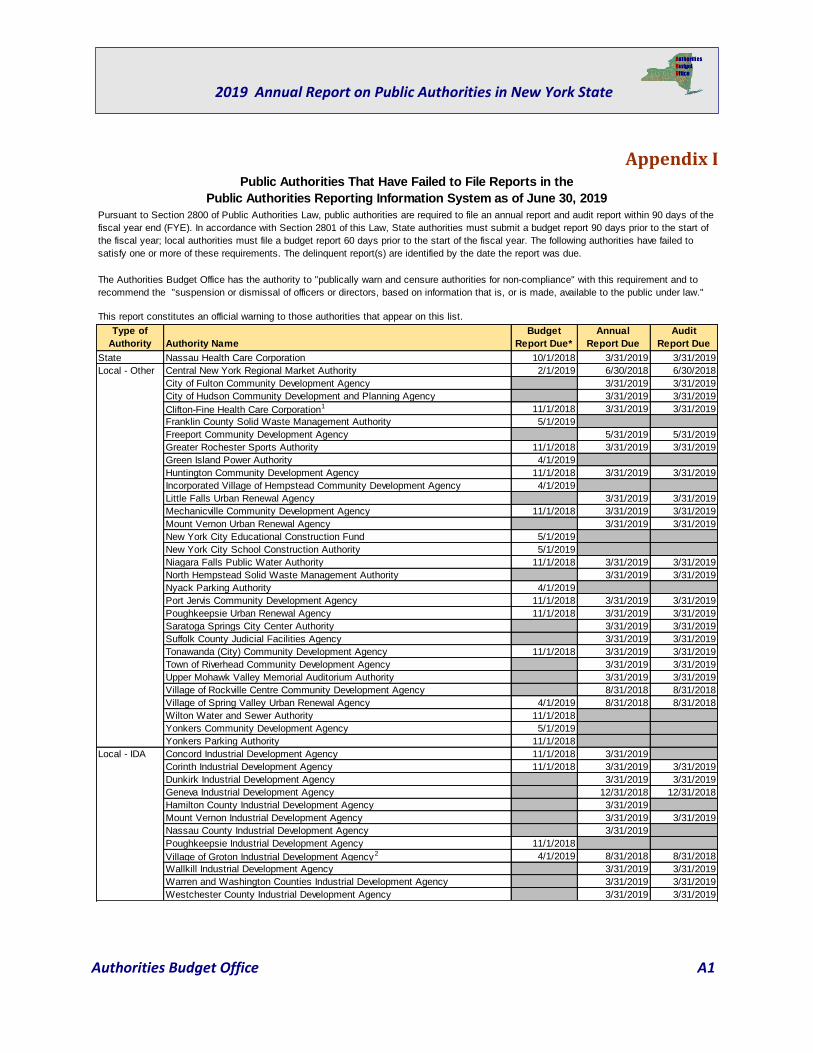
Authorities Budget Office A1
2019 Annual Report on Public Authorities in New York State
Appendix I
Type of
Authority Authority Name
Budget
Report Due*
Annual
Report Due
Audit
Report Due
State Nassau Health Care Corporation 10/1/2018 3/31/2019 3/31/2019
Local - Other Central New York Regional Market Authority 2/1/2019 6/30/2018 6/30/2018
City of Fulton Community Development Agency 3/31/2019 3/31/2019
City of Hudson Community Development and Planning Agency 3/31/2019 3/31/2019
Clifton-Fine Health Care Corporation1 11/1/2018 3/31/2019 3/31/2019
Franklin County Solid Waste Management Authority 5/1/2019
Freeport Community Development Agency 5/31/2019 5/31/2019
Greater Rochester Sports Authority 11/1/2018 3/31/2019 3/31/2019
Green Island Power Authority 4/1/2019
Huntington Community Development Agency 11/1/2018 3/31/2019 3/31/2019
Incorporated Village of Hempstead Community Development Agency 4/1/2019
Little Falls Urban Renewal Agency 3/31/2019 3/31/2019
Mechanicville Community Development Agency 11/1/2018 3/31/2019 3/31/2019
Mount Vernon Urban Renewal Agency 3/31/2019 3/31/2019
New York City Educational Construction Fund 5/1/2019
New York City School Construction Authority 5/1/2019
Niagara Falls Public Water Authority 11/1/2018 3/31/2019 3/31/2019
North Hempstead Solid Waste Management Authority 3/31/2019 3/31/2019
Nyack Parking Authority 4/1/2019
Port Jervis Community Development Agency 11/1/2018 3/31/2019 3/31/2019
Poughkeepsie Urban Renewal Agency 11/1/2018 3/31/2019 3/31/2019
Saratoga Springs City Center Authority 3/31/2019 3/31/2019
Suffolk County Judicial Facilities Agency 3/31/2019 3/31/2019
Tonawanda (City) Community Development Agency 11/1/2018 3/31/2019 3/31/2019
Town of Riverhead Community Development Agency 3/31/2019 3/31/2019
Upper Mohawk Valley Memorial Auditorium Authority 3/31/2019 3/31/2019
Village of Rockville Centre Community Development Agency 8/31/2018 8/31/2018
Village of Spring Valley Urban Renewal Agency 4/1/2019 8/31/2018 8/31/2018
Wilton Water and Sewer Authority 11/1/2018
Yonkers Community Development Agency 5/1/2019
Yonkers Parking Authority 11/1/2018
Local - IDA Concord Industrial Development Agency 11/1/2018 3/31/2019
Corinth Industrial Development Agency 11/1/2018 3/31/2019 3/31/2019
Dunkirk Industrial Development Agency 3/31/2019 3/31/2019
Geneva Industrial Development Agency 12/31/2018 12/31/2018
Hamilton County Industrial Development Agency 3/31/2019
Mount Vernon Industrial Development Agency 3/31/2019 3/31/2019
Nassau County Industrial Development Agency 3/31/2019
Poughkeepsie Industrial Development Agency 11/1/2018
Village of Groton Industrial Development Agency2 4/1/2019 8/31/2018 8/31/2018
Wallkill Industrial Development Agency 3/31/2019 3/31/2019
Warren and Washington Counties Industrial Development Agency 3/31/2019 3/31/2019
Westchester County Industrial Development Agency 3/31/2019 3/31/2019
Public Authorities That Have Failed to File Reports in the
Public Authorities Reporting Information System as of June 30, 2019
Pursuant to Section 2800 of Public Authorities Law, public authorities are required to file an annual report and audit report within 90 days of the
fiscal year end (FYE). In accordance with Section 2801 of this Law, State authorities must submit a budget report 90 days prior to the start of
the fiscal year; local authorities must file a budget report 60 days prior to the start of the fiscal year. The following authorities have failed to
satisfy one or more of these requirements. The delinquent report(s) are identified by the date the report was due.
The Authorities Budget Office has the authority to "publically warn and censure authorities for non-compliance" with this requirement and to
recommend the "suspension or dismissal of officers or directors, based on information that is, or is made, available to the public under law."
This report constitutes an official warning to those authorities that appear on this list.
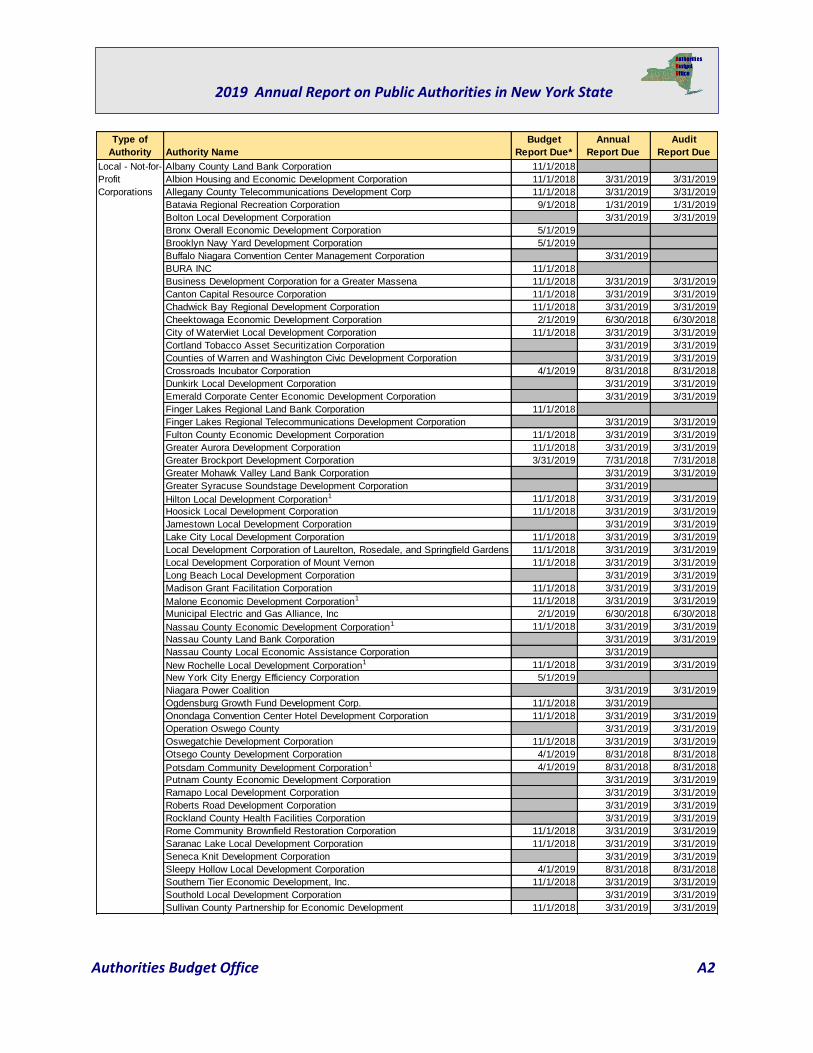
Authorities Budget Office A2
2019 Annual Report on Public Authorities in New York State
Type of
Authority Authority Name
Budget
Report Due*
Annual
Report Due
Audit
Report Due
Local - Not-for- Albany County Land Bank Corporation 11/1/2018
Profit Albion Housing and Economic Development Corporation 11/1/2018 3/31/2019 3/31/2019
Corporations Allegany County Telecommunications Development Corp 11/1/2018 3/31/2019 3/31/2019
Batavia Regional Recreation Corporation 9/1/2018 1/31/2019 1/31/2019
Bolton Local Development Corporation 3/31/2019 3/31/2019
Bronx Overall Economic Development Corporation 5/1/2019
Brooklyn Navy Yard Development Corporation 5/1/2019
Buffalo Niagara Convention Center Management Corporation 3/31/2019
BURA INC 11/1/2018
Business Development Corporation for a Greater Massena 11/1/2018 3/31/2019 3/31/2019
Canton Capital Resource Corporation 11/1/2018 3/31/2019 3/31/2019
Chadwick Bay Regional Development Corporation 11/1/2018 3/31/2019 3/31/2019
Cheektowaga Economic Development Corporation 2/1/2019 6/30/2018 6/30/2018
City of Watervliet Local Development Corporation 11/1/2018 3/31/2019 3/31/2019
Cortland Tobacco Asset Securitization Corporation 3/31/2019 3/31/2019
Counties of Warren and Washington Civic Development Corporation 3/31/2019 3/31/2019
Crossroads Incubator Corporation 4/1/2019 8/31/2018 8/31/2018
Dunkirk Local Development Corporation 3/31/2019 3/31/2019
Emerald Corporate Center Economic Development Corporation 3/31/2019 3/31/2019
Finger Lakes Regional Land Bank Corporation 11/1/2018
Finger Lakes Regional Telecommunications Development Corporation 3/31/2019 3/31/2019
Fulton County Economic Development Corporation 11/1/2018 3/31/2019 3/31/2019
Greater Aurora Development Corporation 11/1/2018 3/31/2019 3/31/2019
Greater Brockport Development Corporation 3/31/2019 7/31/2018 7/31/2018
Greater Mohawk Valley Land Bank Corporation 3/31/2019 3/31/2019
Greater Syracuse Soundstage Development Corporation 3/31/2019
Hilton Local Development Corporation1 11/1/2018 3/31/2019 3/31/2019
Hoosick Local Development Corporation 11/1/2018 3/31/2019 3/31/2019
Jamestown Local Development Corporation 3/31/2019 3/31/2019
Lake City Local Development Corporation 11/1/2018 3/31/2019 3/31/2019
Local Development Corporation of Laurelton, Rosedale, and Springfield Gardens 11/1/2018 3/31/2019 3/31/2019
Local Development Corporation of Mount Vernon 11/1/2018 3/31/2019 3/31/2019
Long Beach Local Development Corporation 3/31/2019 3/31/2019
Madison Grant Facilitation Corporation 11/1/2018 3/31/2019 3/31/2019
Malone Economic Development Corporation1 11/1/2018 3/31/2019 3/31/2019
Municipal Electric and Gas Alliance, Inc 2/1/2019 6/30/2018 6/30/2018
Nassau County Economic Development Corporation1 11/1/2018 3/31/2019 3/31/2019
Nassau County Land Bank Corporation 3/31/2019 3/31/2019
Nassau County Local Economic Assistance Corporation 3/31/2019
New Rochelle Local Development Corporation1 11/1/2018 3/31/2019 3/31/2019
New York City Energy Efficiency Corporation 5/1/2019
Niagara Power Coalition 3/31/2019 3/31/2019
Ogdensburg Growth Fund Development Corp. 11/1/2018 3/31/2019
Onondaga Convention Center Hotel Development Corporation 11/1/2018 3/31/2019 3/31/2019
Operation Oswego County 3/31/2019 3/31/2019
Oswegatchie Development Corporation 11/1/2018 3/31/2019 3/31/2019
Otsego County Development Corporation 4/1/2019 8/31/2018 8/31/2018
Potsdam Community Development Corporation1 4/1/2019 8/31/2018 8/31/2018
Putnam County Economic Development Corporation 3/31/2019 3/31/2019
Ramapo Local Development Corporation 3/31/2019 3/31/2019
Roberts Road Development Corporation 3/31/2019 3/31/2019
Rockland County Health Facilities Corporation 3/31/2019 3/31/2019
Rome Community Brownfield Restoration Corporation 11/1/2018 3/31/2019 3/31/2019
Saranac Lake Local Development Corporation 11/1/2018 3/31/2019 3/31/2019
Seneca Knit Development Corporation 3/31/2019 3/31/2019
Sleepy Hollow Local Development Corporation 4/1/2019 8/31/2018 8/31/2018
Southern Tier Economic Development, Inc. 11/1/2018 3/31/2019 3/31/2019
Southold Local Development Corporation 3/31/2019 3/31/2019
Sullivan County Partnership for Economic Development 11/1/2018 3/31/2019 3/31/2019
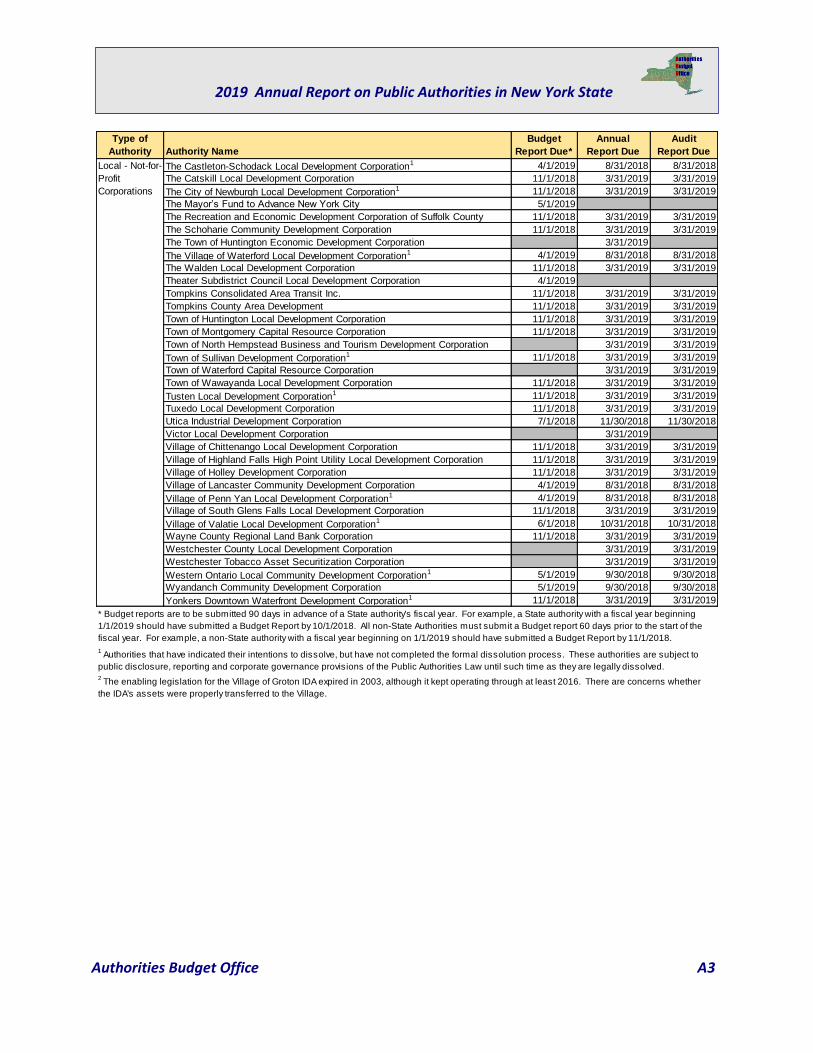
Authorities Budget Office A3
2019 Annual Report on Public Authorities in New York State
Type of
Authority Authority Name
Budget
Report Due*
Annual
Report Due
Audit
Report Due
Local - Not-for- The Castleton-Schodack Local Development Corporation1 4/1/2019 8/31/2018 8/31/2018
Profit The Catskill Local Development Corporation 11/1/2018 3/31/2019 3/31/2019
Corporations The City of Newburgh Local Development Corporation1 11/1/2018 3/31/2019 3/31/2019
The Mayor’s Fund to Advance New York City 5/1/2019
The Recreation and Economic Development Corporation of Suffolk County 11/1/2018 3/31/2019 3/31/2019
The Schoharie Community Development Corporation 11/1/2018 3/31/2019 3/31/2019
The Town of Huntington Economic Development Corporation 3/31/2019
The Village of Waterford Local Development Corporation1 4/1/2019 8/31/2018 8/31/2018
The Walden Local Development Corporation 11/1/2018 3/31/2019 3/31/2019
Theater Subdistrict Council Local Development Corporation 4/1/2019
Tompkins Consolidated Area Transit Inc. 11/1/2018 3/31/2019 3/31/2019
Tompkins County Area Development 11/1/2018 3/31/2019 3/31/2019
Town of Huntington Local Development Corporation 11/1/2018 3/31/2019 3/31/2019
Town of Montgomery Capital Resource Corporation 11/1/2018 3/31/2019 3/31/2019
Town of North Hempstead Business and Tourism Development Corporation 3/31/2019 3/31/2019
Town of Sullivan Development Corporation1 11/1/2018 3/31/2019 3/31/2019
Town of Waterford Capital Resource Corporation 3/31/2019 3/31/2019
Town of Wawayanda Local Development Corporation 11/1/2018 3/31/2019 3/31/2019
Tusten Local Development Corporation1 11/1/2018 3/31/2019 3/31/2019
Tuxedo Local Development Corporation 11/1/2018 3/31/2019 3/31/2019
Utica Industrial Development Corporation 7/1/2018 11/30/2018 11/30/2018
Victor Local Development Corporation 3/31/2019
Village of Chittenango Local Development Corporation 11/1/2018 3/31/2019 3/31/2019
Village of Highland Falls High Point Utility Local Development Corporation 11/1/2018 3/31/2019 3/31/2019
Village of Holley Development Corporation 11/1/2018 3/31/2019 3/31/2019
Village of Lancaster Community Development Corporation 4/1/2019 8/31/2018 8/31/2018
Village of Penn Yan Local Development Corporation1 4/1/2019 8/31/2018 8/31/2018
Village of South Glens Falls Local Development Corporation 11/1/2018 3/31/2019 3/31/2019
Village of Valatie Local Development Corporation1 6/1/2018 10/31/2018 10/31/2018
Wayne County Regional Land Bank Corporation 11/1/2018 3/31/2019 3/31/2019
Westchester County Local Development Corporation 3/31/2019 3/31/2019
Westchester Tobacco Asset Securitization Corporation 3/31/2019 3/31/2019
Western Ontario Local Community Development Corporation1 5/1/2019 9/30/2018 9/30/2018
Wyandanch Community Development Corporation 5/1/2019 9/30/2018 9/30/2018
Yonkers Downtown Waterfront Development Corporation1 11/1/2018 3/31/2019 3/31/2019
2 The enabling legislation for the Village of Groton IDA expired in 2003, although it kept operating through at least 2016. There are concerns whether
the IDA's assets were properly transferred to the Village.
1 Authorities that have indicated their intentions to dissolve, but have not completed the formal dissolution process. These authorities are subject to
public disclosure, reporting and corporate governance provisions of the Public Authorities Law until such time as they are legally dissolved.
* Budget reports are to be submitted 90 days in advance of a State authority's fiscal year. For example, a State authority with a fiscal year beginning
1/1/2019 should have submitted a Budget Report by 10/1/2018. All non-State Authorities must submit a Budget report 60 days prior to the start of the
fiscal year. For example, a non-State authority with a fiscal year beginning on 1/1/2019 should have submitted a Budget Report by 11/1/2018.

Authorities Budget Office
Authorities Budget Office
PO Box 2076
Albany, NY 12220-0076
(518) 474-1932 (Albany and Capital District)
1-800-560-1770 (For use outside the 518 area code only)
E-mail address: [email protected]