Embed Size (px)
Citation preview

Our reference: KNOSYS 2544 P-authorquery-v11
AUTHOR QUERY FORM
Journal: KNOSYS
Article Number: 2544
Please e-mail or fax your responses and any corrections to:
E-mail: [email protected]
Fax: +31 2048 52799
Dear Author,
Please check your proof carefully and mark all corrections at the appropriate place in the proof (e.g., by using on-screen annotation in the PDFfile) or compile them in a separate list. Note: if you opt to annotate the file with software other than Adobe Reader then please also highlightthe appropriate place in the PDF file. To ensure fast publication of your paper please return your corrections within 48 hours.
For correction or revision of any artwork, please consult http://www.elsevier.com/artworkinstructions.
Any queries or remarks that have arisen during the processing of your manuscript are listed below and highlighted by flags in the proof. Clickon the ‘Q’ link to go to the location in the proof.
Location inarticle
Query / Remark: click on the Q link to goPlease insert your reply or correction at the corresponding line in the proof
Q1 Please confirm that given names and surnames have been identified correctly.
Q2 Please check whether the identification of corresponding author is okay as typeset.
Q3 As per journal requirements, a minimum of at least five keywords are required. Kindly provide the same.
Q4 Please check whether the insertion of ‘Ref. [2]’ text citation is okay as typeset.
Q5 Please note that the author name ‘Hongwu et al.’ does not match with Ref. [30]. Kindly check.
Q6 Please note that ‘Figs. 2–6, 7–10 and 11 and 12’ have identical captions. Kindly check.
Thank you for your assistance.
Please check this box if you have nocorrections to make to the PDF file
1
3
4
5
6
7
89
10
11
1 3
1415161718
192021222324
2 5
39
40
41
42
43
44
45
46
47
48
49
50
51
52
53
54
55
56
57
58
59
60
Q2
Q1
Q3
Q4
Knowledge-Based Systems xxx (2013) xxx–xxx
KNOSYS 2544 No. of Pages 11, Model 5G
1 August 2013
Contents lists available at SciVerse ScienceDirect
Knowledge-Based Systems
journal homepage: www.elsevier .com/ locate /knosys
MAR: Maximum Attribute Relative of soft set for clustering attributeselection
0950-7051/$ - see front matter � 2013 Published by Elsevier B.V.http://dx.doi.org/10.1016/j.knosys.2013.05.009
⇑ Corresponding author.E-mail addresses: [email protected] (R. Mamat), [email protected] (T. Herawan),
[email protected] (M.M. Deris).
Please cite this article in press as: R. Mamat et al., MAR: Maximum Attribute Relative of soft set for clustering attribute selection, Knowl. Based Syst.http://dx.doi.org/10.1016/j.knosys.2013.05.009
Rabiei Mamat a,⇑, Tutut Herawan b, Mustafa Mat Deris c
a Department of Computer Science, Universiti Malaysia Terengganu, 21300 Kuala Terengganu, Terengganu, Malaysiab Department of Information System, University of Malaya, 50603 Pantai Valley, Kuala Lumpur, Malaysiac Faculty of Computer Science and Information Technology, Universiti Tun Hussein Onn Malaysia, Parit Raja, 86400 Batu Pahat, Johore, Malaysia
a r t i c l e i n f o a b s t r a c t
2627282930313233343536
Article history:Received 13 July 2012Received in revised form 15 May 2013Accepted 15 May 2013Available online xxxx
Keywords:Soft set theoryClustering attributesAttribute relativeComplexity
37
Clustering, which is a set of categorical data into a homogenous class, is a fundamental operation in datamining. One of the techniques of data clustering was performed by introducing a clustering attribute. Anumber of algorithms have been proposed to address the problem of clustering attribute selection. How-ever, the performance of these algorithms is still an issue due to high computational complexity. Thispaper proposes a new algorithm called Maximum Attribute Relative (MAR) for clustering attribute selec-tion. It is based on a soft set theory by introducing the concept of the attribute relative in informationsystems. Based on the experiment on fourteen UCI datasets and a supplier dataset, the proposed algo-rithm achieved a lower computational time than the three rough set-based algorithms, i.e. TR, MMR,and MDA up to 62%, 64%, and 40% respectively and compared to a soft set-based algorithm, i.e. NSS upto 33%. Furthermore, MAR has a good scalability, i.e. the executing time of the algorithm tends to increaselinearly as the number of instances and attributes are increased respectively.
� 2013 Published by Elsevier B.V.
38
61
62
63
64
65
66
67
68
69
70
71
72
73
74
75
76
77
78
79
80
81
82
1. Introduction
Data clustering refers to the method of creating a group ofobjects or cluster. Results of data clustering or so-called data clus-ter is a collection of data objects where each cluster contains dataobjects that are similar to each other and their different clustersare quite distinct [1]. Data clustering is also known as clusteranalysis, segmentation analysis, taxonomy analysis, and unsuper-vised classification. Clustering has been used in many areas suchas gene data processing [2], transactional data processing [3], deci-sion support [4], and radar signals processing [5]. Recently, greaterattentions have been given to categorical data clustering [6,7],where data objects are made up of non-numerical attributes.
The main difference between categorical data and numericaldata is the multi-valued attribute that belongs to the categoricaldata. These properties lead to difficulties in the similarities and dis-similarity measurement in the clustering process, since the normaldistance measures cannot be applied directly to the categoricaldata. Therefore, the best similarity measurement of the categoricaldata is done by defining the common object for the attribute aswell as the common values of the attribute, and the associationbetween the two [8]. A number of algorithms for clustering
83
84
85
86
categorical data have been proposed including works by Ganti etal. [9], Gibson et al. [10], Guha et al. [11] and Zaki [12].
These methods make important contributions to the issue ofclustering categorical data. However, these approaches have ledto an increment in computational complexity and inefficient sys-tem due to the properties of multi-valued attribute in the categor-ical data, having so many structures and evolved into a very largedata set. Another major issue is that they are not designed to han-dle uncertainties, while in the real world it is very important inmany applications since there are no sharp boundaries betweenclusters.
To this, rough set theory [13–15] has been used by introducinga series of clustering attributes, in which, one of the attributes isselected and used to cluster the objects that are not clustered yetat each time until all objects are clustered. The approaches of find-ing a clustering attribute had successfully exploited the uncertain-ties in the multi-valued information system [26,27,29]. But, somescenarios under study have shown that those approaches havetheir own drawbacks, i.e. there exists some unexpected iterationthat leads to an increment in the processing time. In addition, aclustering attribute also leads to the instability to the cluster num-ber in the clustering process.
A new way to manage uncertain data is called the soft set the-ory, which is proposed by Molodtsov [16] in 1999. According tohim, the main advantage of soft set theory is free from the inade-quacy of the parameterization tools, unlike in the previous theories
(2013),
87
88
89
90
91
92
93
94
95
96
97
98
99
100
101
102
103
104
105
106
107
108
109
110
111
112
113
114
115
116
117
118
119
120
121
122
123
124
125
126
127
128
129
130
131
132
133
134
135
136
137
138
139
140
141
142
143
144
145
146
147
148
149
150
151
152
153
154
155
156
157
158
159
160
161
162
163
164
165
166
167
168
169
170
171
172
173
174175177177
178
179
180
181182
184184
Table 1Tabular representation of soft set (F, E) in (5).
U/E e1 e2 e3 e4 e5 e6 e7
c1 1 0 0 0 0 0 0c2 1 1 0 1 1 0 0c3 0 0 0 1 0 0 0c4 1 0 0 1 0 0 0c5 1 0 0 1 1 0 0c6 0 0 1 0 1 1 1c7 0 0 0 0 1 0 0c8 0 1 0 1 1 0 0c9 0 1 1 0 1 1 1c10 0 0 1 0 1 1 1
Table 2Multi-valued information system.
SID Degree English Exp IT Math Prog Stat
1 Ph.D Good Medium Good Good Good Good2 Ph.D Medium Medium Good Good Good Good3 M.Sc Medium Medium Medium Good Good Good4 M.Sc Medium Medium Medium Good Good Medium5 M.Sc Medium Medium Medium Medium Medium Medium6 M.Sc Medium Medium Medium Medium Medium Medium7 B.Sc Medium Good Good Medium Medium Medium8 B.Sc Bad Good Good Medium Medium Good
Q5
2 R. Mamat et al. / Knowledge-Based Systems xxx (2013) xxx–xxx
KNOSYS 2544 No. of Pages 11, Model 5G
1 August 2013
such as the theory of probability. The soft set theory uses parame-terization sets as its main solutions for problem solving, whichmakes it very convenient and easy to apply in practice. As a result,great progresses of study in soft set theory have been made, includ-ing the works of [17–22]. As for standard soft set, it may be rede-fined as the classification of objects in two distinct classes (yes/1and no/0), thus confirming that soft set can deal with a Boolean-valued information system.
For a multi-valued information system, the concepts of multi-soft sets have been proposed in [23]. Since a direct proof that everyrough set is a soft set have been given in [24], Hongwu et al. [30]proposed a soft set model on the equivalent classes of an informa-tion system, which can be easily applied in obtaining approximatesets of rough sets. Furthermore, they use it to select a clusteringattribute for categorical datasets and a heuristic algorithm, namelythe NSS. Experimental results on fifteen UCI benchmark datasetsshowed that the proposed NSS algorithm provides a faster decisionin selecting a clustering attribute as compared with MaximumDependency Attributes (MDA) approach. However, since it trans-fers MDA to a soft set attribute dependency model, the time com-plexity of the algorithm is still an outstanding issue.
In this paper, by applying the concept of attribute relatives insoft set theory, an alternative technique to select a clustering attri-bute using soft set theory is proposed. In summary, the contribu-tions of this work are summarized as follows:
a. MAR, an alternative technique to select a clustering attributeusing soft set theory is suggested. It is based on a concept ofattribute relative where the comparison of attributes ismade by taking into account the relative of the attribute atthe category level.
b. The proposed technique potentially discovers the attributessubsets with better coverage and achieves a lower computa-tional time. From the experimentation on fifteen UCI bench-mark data sets, the MAR achieves a lower computationaltime than the three rough set-based algorithms, i.e. TR,MMR, MDA up to 62%, 64%, and 40%, respectively and a softset-based algorithm NSS up to 33%.
The rest of the paper is organized as follows. In Section 2, we ex-plain some basic knowledge about this topic. Then, we give a liter-ature survey and review on rough and soft set-based clusteringattribute selection techniques in Sections 3 and 4. In Section 5,we present the MAR’s technique. Section 6 discusses the experi-ment and a series of evaluations on the result. Finally, we concludethis work in Section 7.
2. Essential rudiments
2.1. Decision system
An information system as defined in [15] is a 4-tuple (quadruple)S = (U, A, V, f), where U = {u0,u1, . . . ,ujU�1j,ujUj} is a non-empty finiteset of objects, A = {a0,a1, . . . ,ajA�1j,ajAj} is a non-empty finite set ofattributes, V ¼
Sei2AVei
, where Va is the domain (value set) of attri-bute a, f: U � A ? V is an information function, such that, f(x,a) 2 Va, for every (x, a) 2 U � A, is called information (knowledge)function. An information system can be intuitively expressed interms of an information table such as in Table 1.
In many applications, there is an outcome of classification thatis known. This posteriori knowledge is expressed by one (or more)distinguished attribute called decision attribute; the process isknown as supervised learning. An information system of this kindis called a decision system. A decision system is an information sys-tem of the form D = (U, A [ {d}, V, f), where d R A is the decisionattribute.
Please cite this article in press as: R. Mamat et al., MAR: Maximum Attribute Relhttp://dx.doi.org/10.1016/j.knosys.2013.05.009
2.2. Rough set theory
Rough set theory is an approach to aid decision making in thepresence of uncertainty [13–15]. Within this theory, a data-setcan be formally described using an information system. The notionof information system provides a convenient tool for the represen-tation of objects in terms of their attribute values. Based on theconcept of an information system, some basic definitions in therough set theory are given below.
Let S = (U, A, V, f), an information system as defined in Section2.1 and U is the set of all objects.
Definition 1 (Indiscernibility Relation IND(B)). Given two objects xi,xj 2 U, they are indiscernible by the set of attributes B in A, if andonly if f(xi, a) = f(xj, a) for every a 2 B. That is, (xi, xj) 2 IND(B), if andonly if "a 2 B where B # A, f(xi, a) = f(xj, a).
Obviously, IND(B) is an equivalence relation. It is well-knownthat an equivalence relation induces a unique partition. The parti-tion of U induced by IND(B) in S = (U, A, V, f) denoted by U/B andequivalence class in the partition U/B containing x 2 U, denotedby [x]IND(B).
Definition 2 (Equivalence class). Given IND(B), the set of objects inU having the same values for the set of attributes in B is called anequivalence classes, [x]IND(B). It is s also known as an elementary setwith respect to B.
Definition 3 (Lower Approximation). Given a set of attributes B inA and set of objects X in U. The lower approximation of X is definedas the union of all elementary set which is contained in X. That isXB ¼ fx 2 Uj½x�INDðBÞ # Xg ð1Þ
Definition 4 (Upper Approximation). Given a set of attributes B in Aand set of objects X in U. The upper approximation of X is definedas the union of the elementary sets which has a non-empty inter-section with X. That is
XB ¼ fx 2 Uj½x�INDðBÞ \ X – /g ð2Þ
ative of soft set for clustering attribute selection, Knowl. Based Syst. (2013),
185
186
187188
190190
191
192
193
194
195
196
197198200200
201
202
203
204
205
206
207
208
209
210
211
212
213
214
215
216
218218
219
220
221
222
223
224
225
226
227
228
229
230
231
232
233
234
236236
237
238
239
240
241
R. Mamat et al. / Knowledge-Based Systems xxx (2013) xxx–xxx 3
KNOSYS 2544 No. of Pages 11, Model 5G
1 August 2013
Definition 5 (Roughness). The accuracy of approximation (rough-ness) of any subset X # U with respect to B # A denoted byaB(X) is measured by
aBðXÞ ¼XB
XBð3Þ
242
243
244
245
246
247
248
249
250
251
2.3. Soft set theory
Throughout this section, U refers to an initial universe, E is a setof parameters describing objects in U, P(U) is the power set of Uand A # E.
Definition 6 (See [16,25]). A pair (F, A) is called a soft set over Uwhere F is a mapping given by
F : A! PðUÞ ð4Þ
In other words, a soft set (F, A) over U is a parameterized familyof the universe U. For a 2 A, F(a) may be considered as the set of a-elements of the soft set F(A) or the set a-approximate elements ofthe soft set F(A). Clearly, a soft set is not a (crisp) set.
253253
254
255
256
257
258
259
260
261
262
263
264
265
266
267
Example 1. Let a universe U = {c1, c2, c3, c4, c5, c6, c7, c8, c9, c10} be aset of candidates and a set of parameters E = {e1, e2, e3, e4, e5, e6, e7}be a set of soft skills which stand for the parameters ‘‘communi-cative’’, ‘‘critical thinking’’, ‘‘team work’’, ‘‘information manage-ment’’, ‘‘entrepreneurship’’, ‘‘leadership’’ and ‘‘moral’’, respectively.Consider F be a mapping of E into the set of all subsets of the set Uas F(e1) = {c1, c2, c4, c5}, F(e2) = {c3, c8, c9}, F(e3) = {c6, c9, c10},F(e4) = {c2, c3, c4, c5, c8}, F(e5) = {c2, c5, c6, c7, c8.c9, c10}, F(e6) = {c6, c9,c10} and F(e7) = {c6, c9, c10}. Now consider a soft set (F, E), whichdescribes the ‘‘capabilities of the candidate for hire’’. According tothe data collected, the soft set (F, E) is given by
ðF; EÞ ¼
communicative ¼ fc1; c2; c4; c5g;critical thinking ¼ fc3; c8; c9g;team work ¼ fc6; c9; c10g;information management ¼ fc2; c3; c4; c5; c8g;entrepreneurship ¼ fc2; c5; c6; c7; c8; c9; c10g;leadership ¼ fc6; c9; c10g;moral ¼ fc6; c9; c10g
8>>>>>>>>>>><>>>>>>>>>>>:
9>>>>>>>>>>>=>>>>>>>>>>>;
ð5Þ
Obviously, the soft set (F, E) is not a crisp set and (F, E) is a param-eterized family {F(ei), i = 1,2,3, . . . ,7} of subsets of the set Uthat havetwo parts of approximation: predicate (p) and value (v). For exam-ple, for the approximation ‘‘moral = {c6, c9, c10}’’, p is moral andv = {c6, c9, c10}.
Definition 7. Let S = (U, A, V{0,1}, f) be an information system. IfVa = {0,1}, for every a 2 A, then S = (U, A, V{0,1}, f) is called a Bool-ean-valued information system.
Proposition 1. Each soft set can be considered as a Boolean-valuedinformation system.
Proof. Let (F, E) be a soft-set over the universe U, S = (U, A, V, f) bean information system. Obviously, the universe U in (F, E) can beconsidered as the universe U, the parameter set E may be consid-ered as the attributes A. Then, the information function, f is definedby
f ¼1; h 2 FðeÞ0; h R FðeÞ
�
Please cite this article in press as: R. Mamat et al., MAR: Maximum Attribute Relhttp://dx.doi.org/10.1016/j.knosys.2013.05.009
That is, when hi 2 F(ej), where hi 2 U and ej 2 E, then f(hi, ej) = 1,otherwise f(hi, ej) = 0. To this, we have V(hi, ej) = {0,1}. Therefore, asoft set (F, E) can be considered as a Boolean-valued informationsystem where S = (U, A, V{0,1}, f) and a soft set (F, E) can be repre-sented in the form of binary table.
As can be seen in Table 1, ‘1’ denotes the presence of thedescribed parameters, while ‘0’ means the parameter which is notpart of the capabilities of the candidate.
However, for a multi-valued information system, as describedin [23], this needs to be converted to multi-soft sets based on thenotion of a decomposition of a multi valued information system.Let S = (U, A, V, f) be a multi valued information system and Si = (U,ai, V{0,1}, f), where i = 1,2, . . . , jAj be a Boolean valued informationsystem. As a result of decomposition, we have
S ¼ ðU;A;V ; f Þ ¼S1 ¼ ðU; ai;Vf0;1g; f Þ () ðF; a1Þ
..
. ... ..
.
SjAj ¼ ðU; ajAj;Vf0;1g; f Þ () ðF; ajAjÞ
8>><>>:
¼ ððF; aiÞ; ðF; a2Þ; . . . ; ðF; ajAjÞÞ
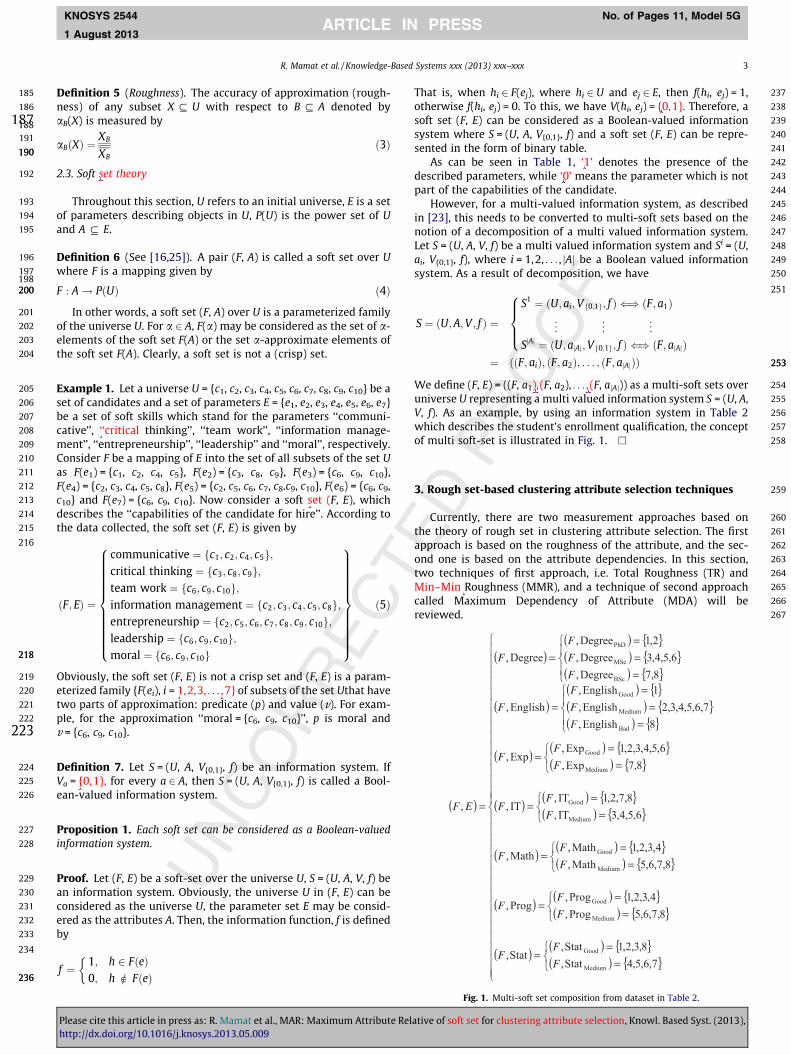
We define (F, E) = ((F, a1), (F, a2), . . . , (F, ajAj)) as a multi-soft sets overuniverse U representing a multi valued information system S = (U, A,V, f). As an example, by using an information system in Table 2which describes the student’s enrollment qualification, the conceptof multi soft-set is illustrated in Fig. 1. h
3. Rough set-based clustering attribute selection techniques
Currently, there are two measurement approaches based onthe theory of rough set in clustering attribute selection. The firstapproach is based on the roughness of the attribute, and the sec-ond one is based on the attribute dependencies. In this section,two techniques of first approach, i.e. Total Roughness (TR) andMin–Min Roughness (MMR), and a technique of second approachcalled Maximum Dependency of Attribute (MDA) will bereviewed.
Fig. 1. Multi-soft set composition from dataset in Table 2.
ative of soft set for clustering attribute selection, Knowl. Based Syst. (2013),
268
269
270
271
272
273
274
275
276
277
278279
281281
282
283
284
285
286
287
288289
291291
292
293
294295
297297
298
299
300
301
302
303304
306306
307
308
309
310
311312
314314
315
316
317318
320320
321
322
323324
326326
327
328
329330332332
333
334
335
336
337
338
339
340
341
342
343
344345
347347
348
349
350
351352354354
355
356
357
358
359360362362
363
364
365
366
367
368
369
370
371
372
373
374
375
376
377
378
379380
382382
383384
386386
4 R. Mamat et al. / Knowledge-Based Systems xxx (2013) xxx–xxx
KNOSYS 2544 No. of Pages 11, Model 5G
1 August 2013
3.1. Total Roughness (TR)
Total roughness technique, which is proposed by Mazlack et al.[26], has three main steps. The first one is to determine the rough-ness of each attribute by exploiting the relationship between lowerand upper approximation which is defined in Eqs. (1) and (2),respectively. Let S = (U, A, V, f), an information system as describedin Section 2.1, that ai 2 A has k-different values, say bk, k = 1,2, . . . ,n.Let X(ai = bk), k = 1,2, . . . ,n be a subset of the objects having k-dif-ferent values of attribute ai. The roughness of the set X(ai = bk),k = 1,2, . . . ,n with respect to aj, where i – j, denoted byTR Roughaj
ðXjai ¼ bkÞ, is defined by
TR RoughajðXjai ¼ bkÞ ¼
jXajðai ¼ bkÞj
jXaiðai ¼ bkÞj
; k ¼ 1;2; . . . ;n ð6Þ
where jXajðai ¼ bkÞj and jXaj
ðai ¼ bkÞj are, respectively, the cardinal-ity of lower and upper approximations of a subset of the objectshaving k-different values of attribute ai with respect to attributeaj, where i – j.
The next step, the mean roughness of attribute ai 2 A withrespect to attribute aj 2 A, where i – j, denoted byTR MeanRoughaj
ðaiÞ is evaluated as follows:
TR MeanRoughajðaiÞ ¼
PjVðaiÞjj¼1 RðXjai ¼ bkÞjVðaiÞj
ð7Þ
where V(ai) is the set of values of attribute ai 2 A. Finally, the totalroughness of attribute ai 2 A, with respect to attribute aj 2 A, wherei – j denoted as TR(ai) is obtained by the following formula:
TRðaiÞ ¼PjAj
j¼1TR MeanRoughajðaiÞ
jAj � 1ð8Þ
Mazlack et al. suggested that the highest of TR is the best selectionfor a clustering attribute.
3.2. Min–Min Roughness (MMR)
MMR, proposed by Parmar et al. [27], is another rough set-based technique. The value of roughness of MMR technique is gi-ven below:
MMR RoughajðXjai ¼ bkÞ ¼ 1�
jXajðai ¼ bkÞj
jXajðai ¼ bkÞj
¼ 1� TR RoughajðXjai ¼ bkÞ ð9Þ
It is clear that MMR technique uses Marczewski–Steinhaus met-ric [28] to measure the roughness of the set X(ai = bk), k = 1,2, . . . ,n,with respect to aj, where i – j.
The value of the mean roughness of MMR technique is given asfollows:
MMR MeanRoughajðaiÞ ¼
PjVðaiÞjk¼1 MMR Roughaj
ðXjai ¼ bkÞjVðaiÞj
ð10Þ
From Eqs. (9) and (10), it is easily seen that the value of the meanroughness of MMR technique is an opposite of the value of themean roughness of TR.
MMR MeanRoughajðaiÞ ¼
PjVðaiÞjk¼1 ð1� TR Roughaj
ðXjai ¼ bkÞÞjVðaiÞj
¼PjVðaiÞj
k¼1 1�PjVðaiÞj
k¼1 TR RoughajðXjai ¼ bkÞ
jVðaiÞj
¼ jVðaiÞjjVðaiÞj
�PjVðaiÞj
k¼1 TR RoughajðXjai ¼ bkÞ
jVðaiÞj¼ 1� TR MeanRoughaj
ðaiÞ
Please cite this article in press as: R. Mamat et al., MAR: Maximum Attribute Relhttp://dx.doi.org/10.1016/j.knosys.2013.05.009
for i – j.Let m be the attributes, Min-Roughness (MR) of attribute ai with
respect to all aj, where i – j is defined asMinRðaiÞ¼minfMMR MeanRougha1
ðaiÞ; . . . ;MMR MeanRoughamðaiÞg
where 1 6 i, j 6m.The minimum of the Min-Roughness or known as Min–Min-
Roughness, which is denoted by MMR, is formulated as follows:
MMR ¼ minðMinRða1Þ; . . . ;MinRðaiÞ; . . . ;MinRðajAjÞÞ ð11Þ
where A is the number of attribute in the information system, ai 2 A,1 6 i 6 jAj. Parmar et al. suggested that the least mean roughness isthe best selection of a clustering attribute.
3.3. Maximum Attribute Dependency (MDA)
Maximum Dependency of Attributes, which is proposed by Her-awan et al. [29], disseminate the attributes of information systemby using the attribute dependencies. MDA has a 4-step algorithmwhich starts with a search for indiscernibility relation. Subse-quently, attribute dependency for each attribute in the informationsystem is calculated. If given two attributes, ai, aj 2 A, the depen-dency degree (in k) of attribute ai on attribute aj denoted by aj) k-
ai is calculated using the following equation:
kajðaiÞ ¼
PX2ðU=aiÞjajðXÞjjUj ð12Þ
The highest dependency degree (Max-Dependency), which isdenoted as MD for each ai 2 A, 1 6 i 6 jAj, is selected in the follow-ing step. If given m attributes, then, MD of attribute ai, aj 2 A is de-fined as
MDðaiÞ ¼maxðkaiðaiÞ; . . . ; kaj
ðaiÞ; . . . ; kam ðaiÞÞ ð13Þ
where ai – aj and 1 6 i, j 6m. Lastly, MDA technique suggested thatthe highest MD is selected as a clustering attribute using Eq. (14). Ifthere are more than one attribute shared the highest k value, then,the next highest k in each attribute will be used and compared untilthe tie is broken.MDA ¼ maxðMDða1Þ; . . . ;MDðaiÞ; . . . ;MDðamÞÞ ð14Þ
In reviewing the above three techniques to handle large data-sets, even with increasing computing capabilities, the complexityof computation is still an outstanding issues. From the analysis,we have found that two techniques, i.e., MMR and MDA, are suf-fered with ‘unpredicted iteration’. If there are n objects in thedata-set, by taking the worst case scenarios, this situation can trig-ger n2 of processing time which can increase the computationalcomplexity when involving large data-sets. Although TR does notface the same problems as discussed above, TR initially has insuf-ficient computational time as discussed in [29]. Therefore, there isa need for a technique in clustering attribute selection to furtherimprove the computational complexity.
4. Soft set-based clustering attribute selection techniques
A novel soft-set (NSS) approach has been proposed by Hongwuet al. in [30]. In this approach, the re-definition of attribute depen-dency in the rough set theory is given in the contact of soft set the-ory. In NSS, the degree of dependency is defined as:
kajðaiÞ ¼
jajðaiÞjjUj ð15Þ
The cardinality of ai(aj) can be calculated as
jaiðajÞj ¼XDþjU=aj j
k¼Dþ1
jaiðekÞj ð16Þ
ative of soft set for clustering attribute selection, Knowl. Based Syst. (2013),
387
388
389391391
392
393
394
395
396
397
398
399
400
401
402
403
405405
406
407
408
409
411411
412
413
414
415
417417
418
419
420
421
422
423
424
425
426
427
428
429
430
431
432
433
434
435
R. Mamat et al. / Knowledge-Based Systems xxx (2013) xxx–xxx 5
KNOSYS 2544 No. of Pages 11, Model 5G
1 August 2013
where lower approximation of attribute aj with respect to attribute ai
is defined as
436437
438
439
440
441
442
aiðajÞ ¼ fxjx 2 aiðekÞ; k ¼ Dþ 1; . . . ;Dþ jU=ajjg ð17Þ
where D ¼Pj�1
l¼1jU=alj.As another alternative approach of the rough set theory, the NSS
takes the highest total degree of dependency as the selected clus-tering attribute.
443
444
445
446
5. Proposed maximum attribute relative
Throughout this section, a pair (F, A), refers to multi-soft setsover the universe U representing a categorical valued informationsystem S = (U, A, V, f).
Definition 8. Let (F, A) be a multi soft-sets over the universe U,where (F, ai), . . . , (F, ajAj) # (F, A) and ðF; aij
Þ; . . . ; ðF; aijai jÞ# ðF; aiÞ.
Support of ðF; aij Þ by ðF; aikÞ denoted supðF;aik
ÞðF; aij Þ is defined as
supðF;aikÞðF; aij Þ ¼
jðF; aij Þ \ ðF; aik ÞjjðF; aik Þj
ð18Þ
Definition 9. Maximum support is a summation of all supportwith value equals to 1. For each soft set ðF; aij Þ, the maximum sup-port, max supðF;aij
Þ, is defined as
max supðF;aijÞ ¼
XðsupðF;aik
ÞðF; aij Þ ¼ 1Þ ð19Þ
Definition 10. Minimum support is a summation of all supportwith value less than 1. For each soft set ðF; aij Þ, the minimum sup-port is denoted by min supðF;aij
Þ is defined as
min supðF;aijÞ ¼
XðsupðF;aik
ÞðF; aij Þ – 1Þ ð20Þ
471
Definition 11. Mode refers to the value that is most frequentlyoccurred in the probability distribution.472
473
474
Definition 12. Max refers to the value that is the highest in theprobability distribution.475
476
477
478
479
Proposition 2. IfModeðmaxðmax supðF;aij
Þ; . . . ;max supðF;ajmjjnj ÞÞ ¼ 1Þ then ðF; aij Þ is aclustering attribute.
480
481
482483
485485
486
Proof. Let (F, ai) and (F, aj) be two soft sets over the universe U, ifai = aj then the support value of (F, ai) is equal to 1, therefore it issaid that ai is relative to aj. Therefore, ai can be used to describeaj and vice versa. If ai – aj, then there exists (F, ak) where ai = ak
and aj – ak then, the support value of (F, ai) is greater than 1. Basedon Definition 5, it is clear that (F, ai) is selected as a clustering attri-bute. h
487
488
489
490
491
492
Corollary 1. If Modeðmaxðmax supðF;aijÞ; . . . ;max supðF;ajmjjnj ÞÞ > 1Þ
then maxðmin supðF;aijÞ; . . . ;min supðF;ajmjjnj ÞÞ is a clustering attribute.
Proof. The proof is clear from Definition 10 and Proposition 2. h
Please cite this article in press as: R. Mamat et al., MAR: Maximum Attribute Relhttp://dx.doi.org/10.1016/j.knosys.2013.05.009
5.1. The complexity
Suppose that in an information system, there are n objects, mattributes and l is the maximum distinct values of each attribute.Computational cost to determine the elementary set of all attri-butes is ai – aj. The proposed technique needs ml(ml � 1) timesto determine the support for each category. Thus, the computa-tional complexity for the proposed technique is O(ml(ml � 1) + nm + 1).
5.2. Algorithm
The proposed algorithm for the proposed technique is describedin the following figure.
Algorithm 1. MAR Algorithm
Input: Categorical-valued data-setOutput: A Clustering attributeBegin1. Builds the multi-soft set approximation2. Calculate Support, MaxSup and MinSuP
for i = all categoriesfor j = all categories
intersection = Data(i) And Data(j)Sup(i,j) = Intersection/Data(j)if Sup (i,j) = 1 then
MaxSup(i) = MaxSup(i) + Sup(i,j)else
MinSup(i) = MinSup(i) + Sup(i,j)end
endend
3. Finding Clustering Attributeif Mode(Max(MaxSup(data(1)..data(n)))) = 1 then
Clustering Attribute = Max(MaxSup(Data(1)..Data(n)))else
Clustering Attribute = Max(MinSup(Data(1)..Data(n)))end
End
Example 2. In this part, the example of implementating the pro-posed technique is presented. Dataset as in Table 2 is used as aninput data. The dataset contains 8 objects with 7 categorical-val-ued attributes. The attributes are Degree, English, Exp, IT, Math, Prog,and Stat where the first two attributes, i.e., Degree and Englishhave 3 categorical values and the rest have 2 values. From algo-rithm 1, the technique begins by transforming the input datasetinto the multi- soft set, as shown in Fig. 1. Secondly, the supportvalue for each soft set by other soft-set is acquired using formulaas defined in Definition 3. For example, the support value for softset (F, ExpMedium) by (F, MathMedium) is calculated as follows;
supðF;MathMediumÞðF; ExpMediumÞ ¼jf1;2;3;4;5;6g \ jf5;6;7;8g
jf5;6;7;8gj ¼ 24
¼ 0:5
As a result, overall support value for the case (F, ExpMediium) are1.0, 1.0, 0.0, 1.0, 0.8333, 0.0, 1.0, 0.0, 0.5, 1.0, 1.0, 0.5, 1.0, 0.5, 0.75,and 0.75. The support values of all soft set are summarized in Table3. Once the support value has raised, the calculation of the maxi-mum and minimum support value for the current soft set can bedone directly using Definitions 4 and 5, respectively. Then, usingDefinition 6, the support index for each soft set is computed. Lastly,
ative of soft set for clustering attribute selection, Knowl. Based Syst. (2013),
493
494
495
496
497
498
499
500
501
502
503
504
505
506
507
508
509
510
511
512
513
514
515
516
517
518
519
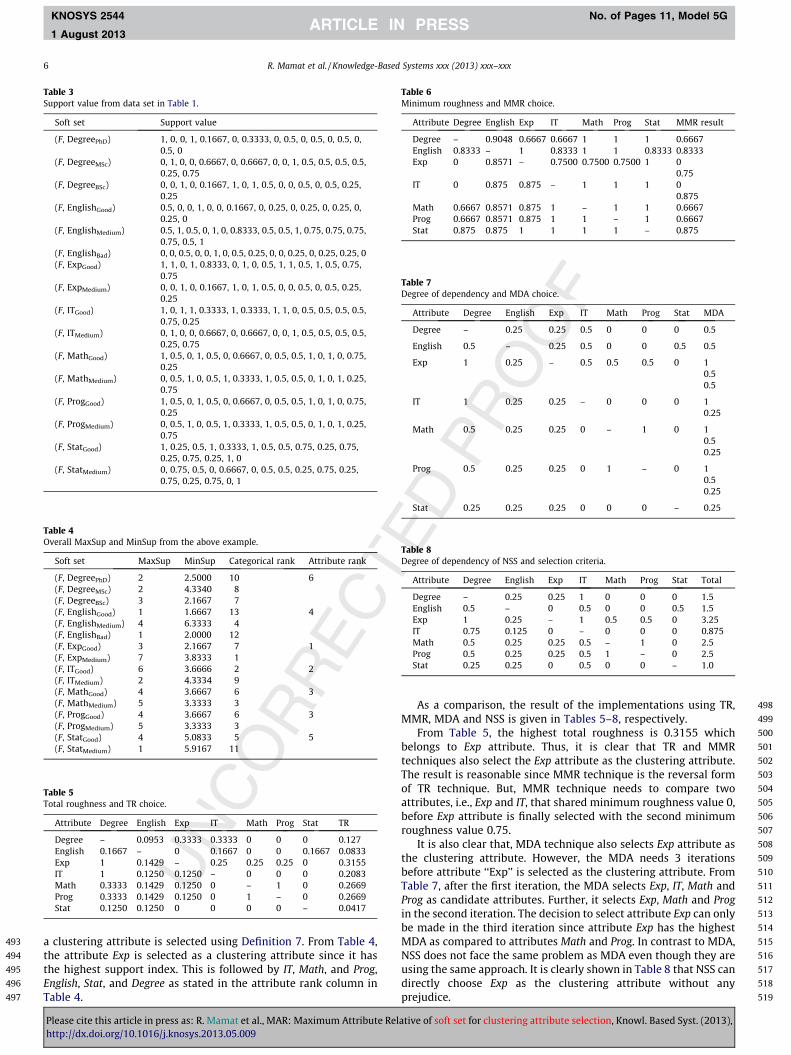
Table 3Support value from data set in Table 1.
Soft set Support value
(F, DegreePhD) 1, 0, 0, 1, 0.1667, 0, 0.3333, 0, 0.5, 0, 0.5, 0, 0.5, 0,0.5, 0
(F, DegreeMSc) 0, 1, 0, 0, 0.6667, 0, 0.6667, 0, 0, 1, 0.5, 0.5, 0.5, 0.5,0.25, 0.75
(F, DegreeBSc) 0, 0, 1, 0, 0.1667, 1, 0, 1, 0.5, 0, 0, 0.5, 0, 0.5, 0.25,0.25
(F, EnglishGood) 0.5, 0, 0, 1, 0, 0, 0.1667, 0, 0.25, 0, 0.25, 0, 0.25, 0,0.25, 0
(F, EnglishMedium) 0.5, 1, 0.5, 0, 1, 0, 0.8333, 0.5, 0.5, 1, 0.75, 0.75, 0.75,0.75, 0.5, 1
(F, EnglishBad) 0, 0, 0.5, 0, 0, 1, 0, 0.5, 0.25, 0, 0, 0.25, 0, 0.25, 0.25, 0(F, ExpGood) 1, 1, 0, 1, 0.8333, 0, 1, 0, 0.5, 1, 1, 0.5, 1, 0.5, 0.75,
0.75(F, ExpMedium) 0, 0, 1, 0, 0.1667, 1, 0, 1, 0.5, 0, 0, 0.5, 0, 0.5, 0.25,
0.25(F, ITGood) 1, 0, 1, 1, 0.3333, 1, 0.3333, 1, 1, 0, 0.5, 0.5, 0.5, 0.5,
0.75, 0.25(F, ITMedium) 0, 1, 0, 0, 0.6667, 0, 0.6667, 0, 0, 1, 0.5, 0.5, 0.5, 0.5,
0.25, 0.75(F, MathGood) 1, 0.5, 0, 1, 0.5, 0, 0.6667, 0, 0.5, 0.5, 1, 0, 1, 0, 0.75,
0.25(F, MathMedium) 0, 0.5, 1, 0, 0.5, 1, 0.3333, 1, 0.5, 0.5, 0, 1, 0, 1, 0.25,
0.75(F, ProgGood) 1, 0.5, 0, 1, 0.5, 0, 0.6667, 0, 0.5, 0.5, 1, 0, 1, 0, 0.75,
0.25(F, ProgMedium) 0, 0.5, 1, 0, 0.5, 1, 0.3333, 1, 0.5, 0.5, 0, 1, 0, 1, 0.25,
0.75(F, StatGood) 1, 0.25, 0.5, 1, 0.3333, 1, 0.5, 0.5, 0.75, 0.25, 0.75,
0.25, 0.75, 0.25, 1, 0(F, StatMedium) 0, 0.75, 0.5, 0, 0.6667, 0, 0.5, 0.5, 0.25, 0.75, 0.25,
0.75, 0.25, 0.75, 0, 1
Table 4Overall MaxSup and MinSup from the above example.
Soft set MaxSup MinSup Categorical rank Attribute rank
(F, DegreePhD) 2 2.5000 10 6(F, DegreeMSc) 2 4.3340 8(F, DegreeBSc) 3 2.1667 7(F, EnglishGood) 1 1.6667 13 4(F, EnglishMedium) 4 6.3333 4(F, EnglishBad) 1 2.0000 12(F, ExpGood) 3 2.1667 7 1(F, ExpMedium) 7 3.8333 1(F, ITGood) 6 3.6666 2 2(F, ITMedium) 2 4.3334 9(F, MathGood) 4 3.6667 6 3(F, MathMedium) 5 3.3333 3(F, ProgGood) 4 3.6667 6 3(F, ProgMedium) 5 3.3333 3(F, StatGood) 4 5.0833 5 5(F, StatMedium) 1 5.9167 11
Table 5Total roughness and TR choice.
Attribute Degree English Exp IT Math Prog Stat TR
Degree – 0.0953 0.3333 0.3333 0 0 0 0.127English 0.1667 – 0 0.1667 0 0 0.1667 0.0833Exp 1 0.1429 – 0.25 0.25 0.25 0 0.3155IT 1 0.1250 0.1250 – 0 0 0 0.2083Math 0.3333 0.1429 0.1250 0 – 1 0 0.2669Prog 0.3333 0.1429 0.1250 0 1 – 0 0.2669Stat 0.1250 0.1250 0 0 0 0 – 0.0417
Table 6Minimum roughness and MMR choice.
Attribute Degree English Exp IT Math Prog Stat MMR result
Degree – 0.9048 0.6667 0.6667 1 1 1 0.6667English 0.8333 – 1 0.8333 1 1 0.8333 0.8333Exp 0 0.8571 – 0.7500 0.7500 0.7500 1 0
0.75IT 0 0.875 0.875 – 1 1 1 0
0.875Math 0.6667 0.8571 0.875 1 – 1 1 0.6667Prog 0.6667 0.8571 0.875 1 1 – 1 0.6667Stat 0.875 0.875 1 1 1 1 – 0.875
Table 7Degree of dependency and MDA choice.
Attribute Degree English Exp IT Math Prog Stat MDA
Degree – 0.25 0.25 0.5 0 0 0 0.5
English 0.5 – 0.25 0.5 0 0 0.5 0.5
Exp 1 0.25 – 0.5 0.5 0.5 0 10.50.5
IT 1 0.25 0.25 – 0 0 0 10.25
Math 0.5 0.25 0.25 0 – 1 0 10.50.25
Prog 0.5 0.25 0.25 0 1 – 0 10.50.25
Stat 0.25 0.25 0.25 0 0 0 – 0.25
Table 8Degree of dependency of NSS and selection criteria.
Attribute Degree English Exp IT Math Prog Stat Total
Degree – 0.25 0.25 1 0 0 0 1.5English 0.5 – 0 0.5 0 0 0.5 1.5Exp 1 0.25 – 1 0.5 0.5 0 3.25IT 0.75 0.125 0 – 0 0 0 0.875Math 0.5 0.25 0.25 0.5 – 1 0 2.5Prog 0.5 0.25 0.25 0.5 1 – 0 2.5Stat 0.25 0.25 0 0.5 0 0 – 1.0
6 R. Mamat et al. / Knowledge-Based Systems xxx (2013) xxx–xxx
KNOSYS 2544 No. of Pages 11, Model 5G
1 August 2013
a clustering attribute is selected using Definition 7. From Table 4,the attribute Exp is selected as a clustering attribute since it hasthe highest support index. This is followed by IT, Math, and Prog,English, Stat, and Degree as stated in the attribute rank column inTable 4.
Please cite this article in press as: R. Mamat et al., MAR: Maximum Attribute Relhttp://dx.doi.org/10.1016/j.knosys.2013.05.009
As a comparison, the result of the implementations using TR,MMR, MDA and NSS is given in Tables 5–8, respectively.
From Table 5, the highest total roughness is 0.3155 whichbelongs to Exp attribute. Thus, it is clear that TR and MMRtechniques also select the Exp attribute as the clustering attribute.The result is reasonable since MMR technique is the reversal formof TR technique. But, MMR technique needs to compare twoattributes, i.e., Exp and IT, that shared minimum roughness value 0,before Exp attribute is finally selected with the second minimumroughness value 0.75.
It is also clear that, MDA technique also selects Exp attribute asthe clustering attribute. However, the MDA needs 3 iterationsbefore attribute ‘‘Exp’’ is selected as the clustering attribute. FromTable 7, after the first iteration, the MDA selects Exp, IT, Math andProg as candidate attributes. Further, it selects Exp, Math and Progin the second iteration. The decision to select attribute Exp can onlybe made in the third iteration since attribute Exp has the highestMDA as compared to attributes Math and Prog. In contrast to MDA,NSS does not face the same problem as MDA even though they areusing the same approach. It is clearly shown in Table 8 that NSS candirectly choose Exp as the clustering attribute without anyprejudice.
ative of soft set for clustering attribute selection, Knowl. Based Syst. (2013),
520
521
522
523
524
525
526
527
528
529
530
531
532
533
534
535
536
537
538
539
540
Q6
R. Mamat et al. / Knowledge-Based Systems xxx (2013) xxx–xxx 7
KNOSYS 2544 No. of Pages 11, Model 5G
1 August 2013
6. Experiment results
This section explains and discusses the experimental results ofthe proposed technique. The main focus of the experiments is onthe performance measurement of the proposed technique in whichexecution time is used as a parameter. For comparisons, four tech-niques which have been discussed earlier will be used with four-teen datasets obtained from the benchmark UCI machinelearning Repository [31] and a Supplier Dataset from [32] as de-scribed in Table 9 below.
All the selected data sets are different from one another interms of size, either horizontally or vertically aimed to analyze
Table 9Datasets.
No Data sets Number of instances Number of attributes
1 Acute Inflammation 120 62 Balloons 16 43 Bank Marketing 45,211 114 Car Evaluation 1728 65 Chess 3196 366 Cylinder Bands 512 157 Lenses 24 48 Lung Cancer 32 569 Mushroom 8124 22
10 Nursery 12,960 711 Solar Flare 1389 1012 Soybean (Large) 307 3513 Soybean (Small) 47 3514 Supplier Dataset 27 715 Zoo 101 17
Fig. 2. The execution times (in seconds) of TR, MMR, MDA, NSS and MAR.
Fig. 3. The execution times (in seconds) of TR, MMR, MDA, NSS and MAR.
Please cite this article in press as: R. Mamat et al., MAR: Maximum Attribute Relhttp://dx.doi.org/10.1016/j.knosys.2013.05.009
the performance of the proposed technique when involving a highnumber of records as well as the high number of attributes. Somedatasets have been modified by removing instances that haveincomplete data and removing an attribute that only have one cat-egorical value. All techniques (TR, MMR, MDA, NSS and MAR) areimplemented using Ruby programming language version 1.9 underWindows 7 Home Edition operating system powered by Intel i5processor with 4 GB memory.
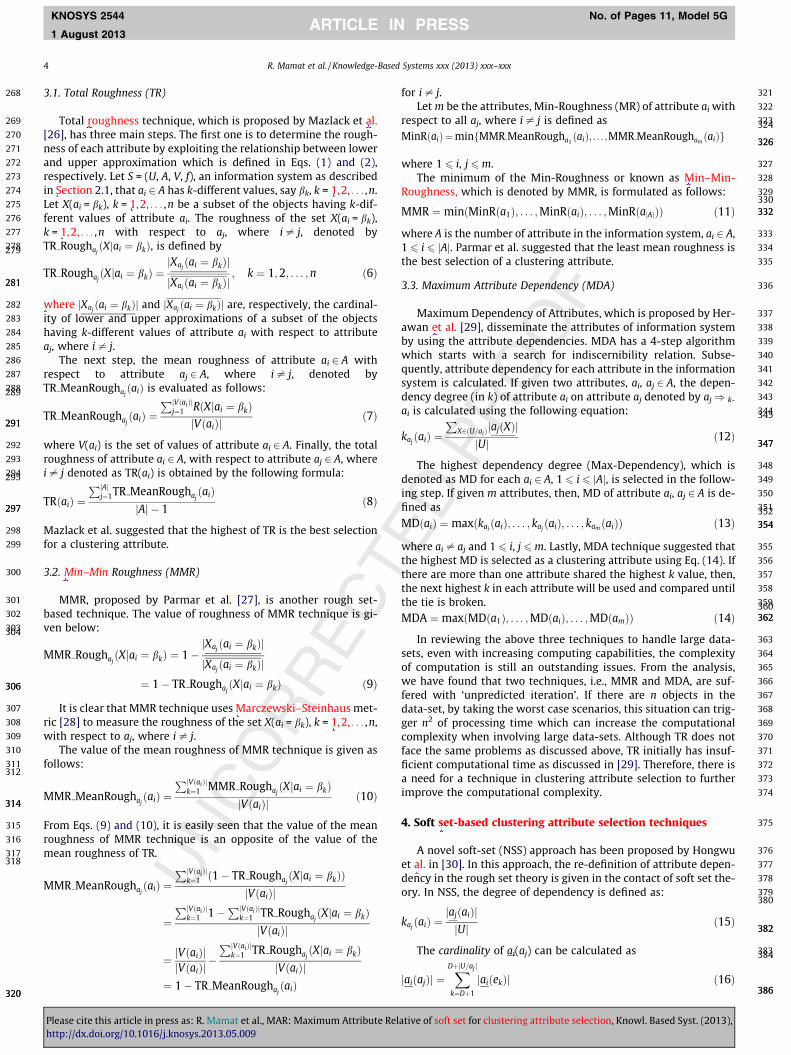
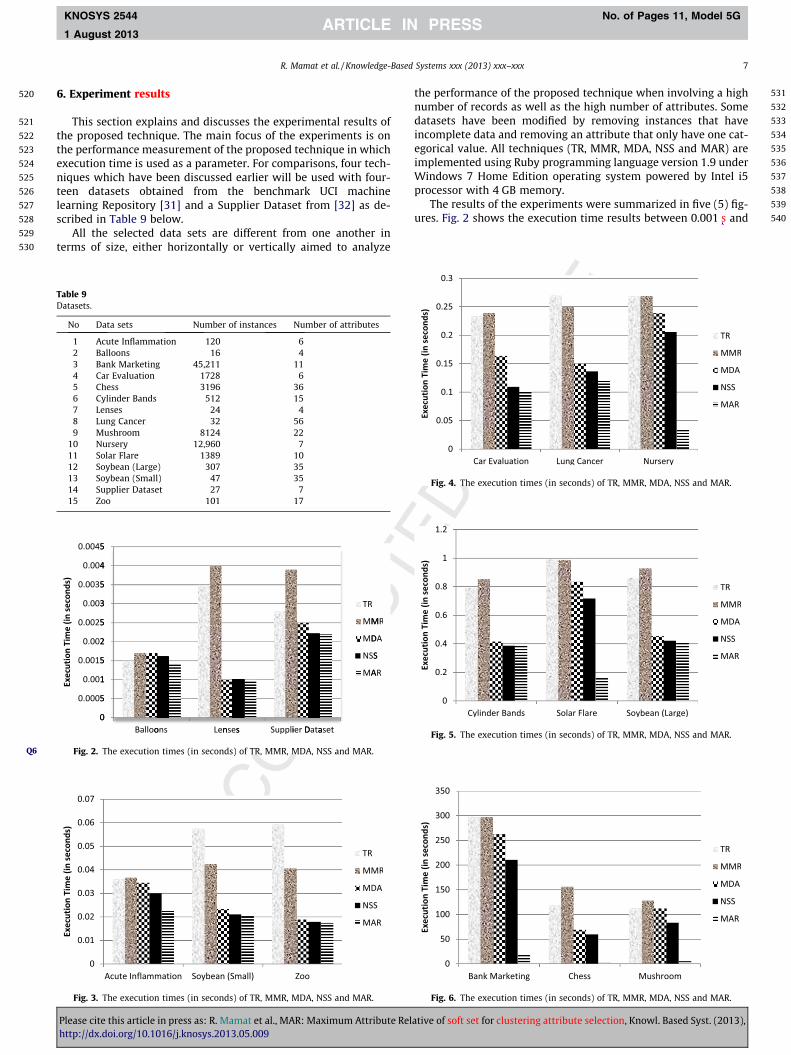
The results of the experiments were summarized in five (5) fig-ures. Fig. 2 shows the execution time results between 0.001 s and
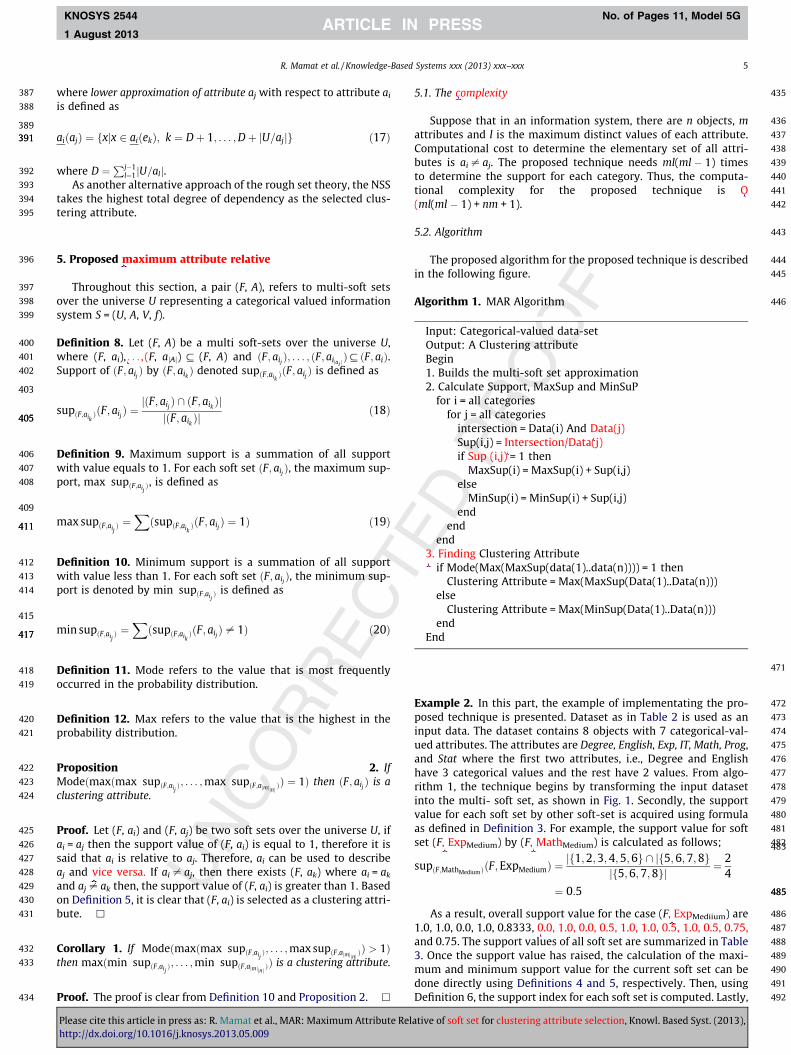
Fig. 4. The execution times (in seconds) of TR, MMR, MDA, NSS and MAR.
Fig. 5. The execution times (in seconds) of TR, MMR, MDA, NSS and MAR.
Fig. 6. The execution times (in seconds) of TR, MMR, MDA, NSS and MAR.
ative of soft set for clustering attribute selection, Knowl. Based Syst. (2013),
541
542
543
544
545
546
547
548
549
550
551
552
553
554
555
556
557
558
559
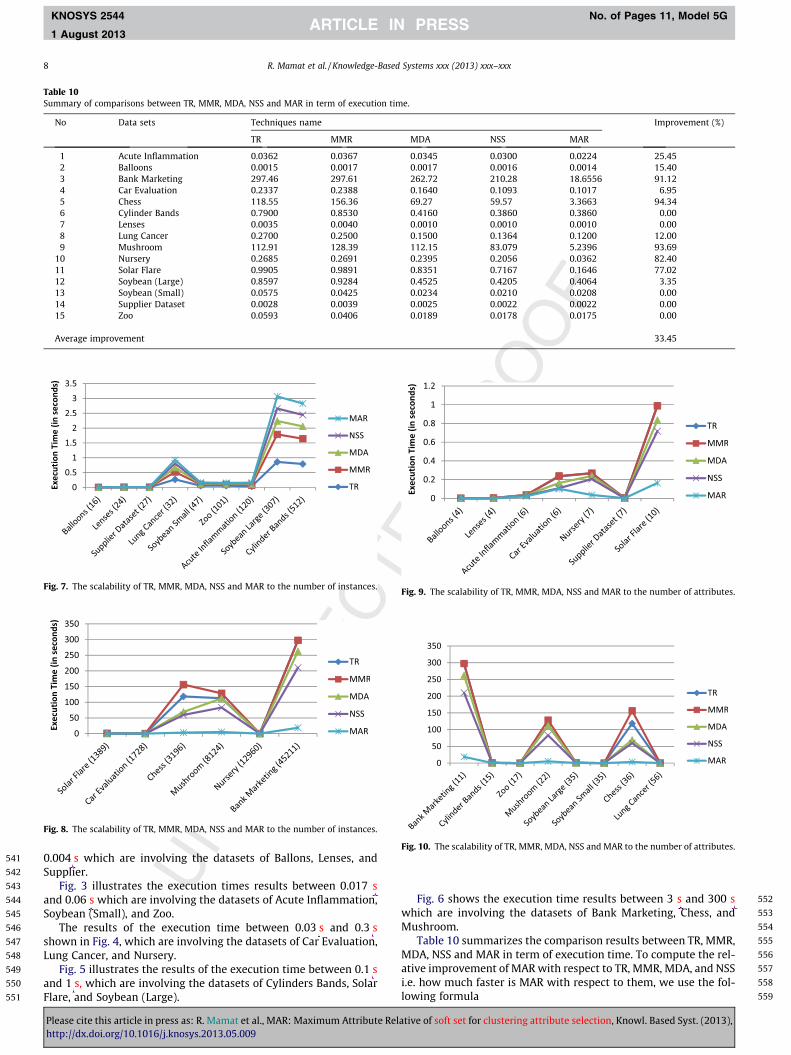
Table 10Summary of comparisons between TR, MMR, MDA, NSS and MAR in term of execution time.
No Data sets Techniques name Improvement (%)
TR MMR MDA NSS MAR
1 Acute Inflammation 0.0362 0.0367 0.0345 0.0300 0.0224 25.452 Balloons 0.0015 0.0017 0.0017 0.0016 0.0014 15.403 Bank Marketing 297.46 297.61 262.72 210.28 18.6556 91.124 Car Evaluation 0.2337 0.2388 0.1640 0.1093 0.1017 6.955 Chess 118.55 156.36 69.27 59.57 3.3663 94.346 Cylinder Bands 0.7900 0.8530 0.4160 0.3860 0.3860 0.007 Lenses 0.0035 0.0040 0.0010 0.0010 0.0010 0.008 Lung Cancer 0.2700 0.2500 0.1500 0.1364 0.1200 12.009 Mushroom 112.91 128.39 112.15 83.079 5.2396 93.69
10 Nursery 0.2685 0.2691 0.2395 0.2056 0.0362 82.4011 Solar Flare 0.9905 0.9891 0.8351 0.7167 0.1646 77.0212 Soybean (Large) 0.8597 0.9284 0.4525 0.4205 0.4064 3.3513 Soybean (Small) 0.0575 0.0425 0.0234 0.0210 0.0208 0.0014 Supplier Dataset 0.0028 0.0039 0.0025 0.0022 0.0022 0.0015 Zoo 0.0593 0.0406 0.0189 0.0178 0.0175 0.00
Average improvement 33.45
Fig. 7. The scalability of TR, MMR, MDA, NSS and MAR to the number of instances.
Fig. 8. The scalability of TR, MMR, MDA, NSS and MAR to the number of instances.
Fig. 9. The scalability of TR, MMR, MDA, NSS and MAR to the number of attributes.
Fig. 10. The scalability of TR, MMR, MDA, NSS and MAR to the number of attributes.
8 R. Mamat et al. / Knowledge-Based Systems xxx (2013) xxx–xxx
KNOSYS 2544 No. of Pages 11, Model 5G
1 August 2013
0.004 s which are involving the datasets of Ballons, Lenses, andSupplier.
Fig. 3 illustrates the execution times results between 0.017 sand 0.06 s which are involving the datasets of Acute Inflammation,Soybean (Small), and Zoo.
The results of the execution time between 0.03 s and 0.3 sshown in Fig. 4, which are involving the datasets of Car Evaluation,Lung Cancer, and Nursery.
Fig. 5 illustrates the results of the execution time between 0.1 sand 1 s, which are involving the datasets of Cylinders Bands, SolarFlare, and Soybean (Large).
Please cite this article in press as: R. Mamat et al., MAR: Maximum Attribute Relhttp://dx.doi.org/10.1016/j.knosys.2013.05.009
Fig. 6 shows the execution time results between 3 s and 300 swhich are involving the datasets of Bank Marketing, Chess, andMushroom.
Table 10 summarizes the comparison results between TR, MMR,MDA, NSS and MAR in term of execution time. To compute the rel-ative improvement of MAR with respect to TR, MMR, MDA, and NSSi.e. how much faster is MAR with respect to them, we use the fol-lowing formula
ative of soft set for clustering attribute selection, Knowl. Based Syst. (2013),
560
562562
563
564
565
566
567
568
569
570
571
572
573
574
575
576
577
578
579
580
581
582
583
584
585
586
587
588
589
590
591
592
593
594
595
596
597
598
599
600
601
602
603
604
605
606
607
608
609
610
611
612
613
614
615
616
617
618
619
620
621
622
623
624
625
626
627
628
629
630
631
632
633
634
635
636
637
638
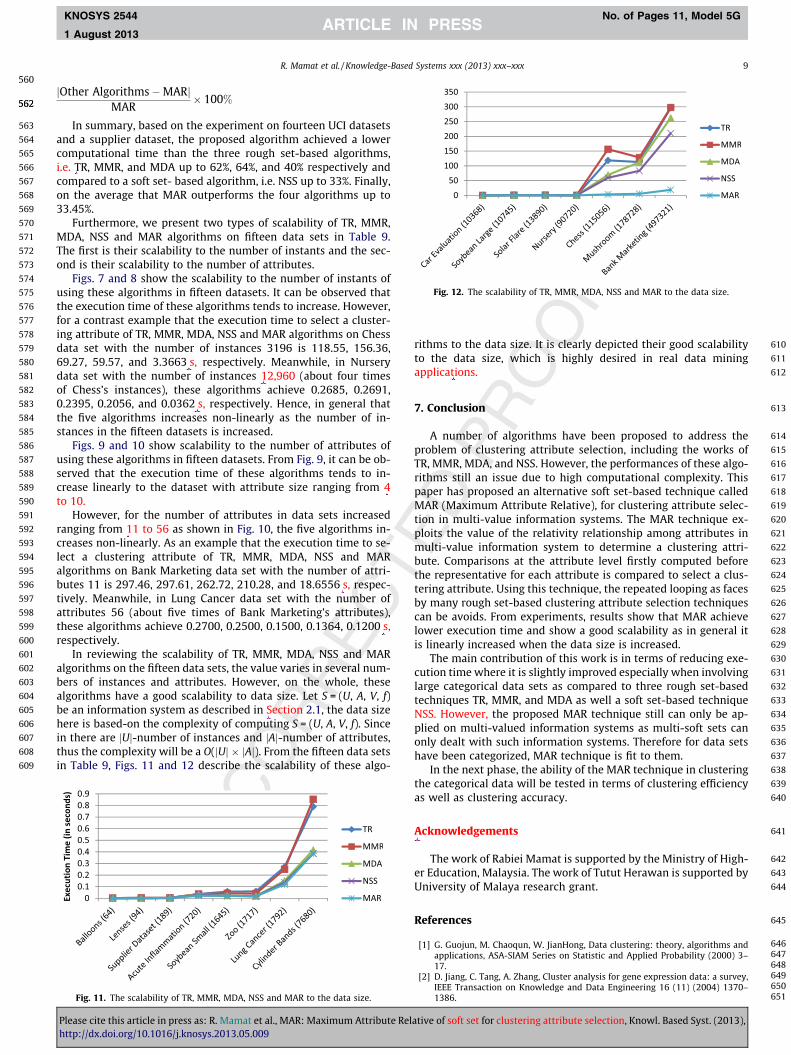
Fig. 12. The scalability of TR, MMR, MDA, NSS and MAR to the data size.
R. Mamat et al. / Knowledge-Based Systems xxx (2013) xxx–xxx 9
KNOSYS 2544 No. of Pages 11, Model 5G
1 August 2013
jOther Algorithms�MARjMAR
� 100%
In summary, based on the experiment on fourteen UCI datasetsand a supplier dataset, the proposed algorithm achieved a lowercomputational time than the three rough set-based algorithms,i.e. TR, MMR, and MDA up to 62%, 64%, and 40% respectively andcompared to a soft set- based algorithm, i.e. NSS up to 33%. Finally,on the average that MAR outperforms the four algorithms up to33.45%.
Furthermore, we present two types of scalability of TR, MMR,MDA, NSS and MAR algorithms on fifteen data sets in Table 9.The first is their scalability to the number of instants and the sec-ond is their scalability to the number of attributes.
Figs. 7 and 8 show the scalability to the number of instants ofusing these algorithms in fifteen datasets. It can be observed thatthe execution time of these algorithms tends to increase. However,for a contrast example that the execution time to select a cluster-ing attribute of TR, MMR, MDA, NSS and MAR algorithms on Chessdata set with the number of instances 3196 is 118.55, 156.36,69.27, 59.57, and 3.3663 s, respectively. Meanwhile, in Nurserydata set with the number of instances 12,960 (about four timesof Chess’s instances), these algorithms achieve 0.2685, 0.2691,0.2395, 0.2056, and 0.0362 s, respectively. Hence, in general thatthe five algorithms increases non-linearly as the number of in-stances in the fifteen datasets is increased.
Figs. 9 and 10 show scalability to the number of attributes ofusing these algorithms in fifteen datasets. From Fig. 9, it can be ob-served that the execution time of these algorithms tends to in-crease linearly to the dataset with attribute size ranging from 4to 10.
However, for the number of attributes in data sets increasedranging from 11 to 56 as shown in Fig. 10, the five algorithms in-creases non-linearly. As an example that the execution time to se-lect a clustering attribute of TR, MMR, MDA, NSS and MARalgorithms on Bank Marketing data set with the number of attri-butes 11 is 297.46, 297.61, 262.72, 210.28, and 18.6556 s, respec-tively. Meanwhile, in Lung Cancer data set with the number ofattributes 56 (about five times of Bank Marketing’s attributes),these algorithms achieve 0.2700, 0.2500, 0.1500, 0.1364, 0.1200 s,respectively.
In reviewing the scalability of TR, MMR, MDA, NSS and MARalgorithms on the fifteen data sets, the value varies in several num-bers of instances and attributes. However, on the whole, thesealgorithms have a good scalability to data size. Let S = (U, A, V, f)be an information system as described in Section 2.1, the data sizehere is based-on the complexity of computing S = (U, A, V, f). Sincein there are jUj-number of instances and jAj-number of attributes,thus the complexity will be a O(jUj � jAj). From the fifteen data setsin Table 9, Figs. 11 and 12 describe the scalability of these algo-
Fig. 11. The scalability of TR, MMR, MDA, NSS and MAR to the data size.
Please cite this article in press as: R. Mamat et al., MAR: Maximum Attribute Relhttp://dx.doi.org/10.1016/j.knosys.2013.05.009
rithms to the data size. It is clearly depicted their good scalabilityto the data size, which is highly desired in real data miningapplications.
639
640
7. Conclusion
A number of algorithms have been proposed to address theproblem of clustering attribute selection, including the works ofTR, MMR, MDA, and NSS. However, the performances of these algo-rithms still an issue due to high computational complexity. Thispaper has proposed an alternative soft set-based technique calledMAR (Maximum Attribute Relative), for clustering attribute selec-tion in multi-value information systems. The MAR technique ex-ploits the value of the relativity relationship among attributes inmulti-value information system to determine a clustering attri-bute. Comparisons at the attribute level firstly computed beforethe representative for each attribute is compared to select a clus-tering attribute. Using this technique, the repeated looping as facesby many rough set-based clustering attribute selection techniquescan be avoids. From experiments, results show that MAR achievelower execution time and show a good scalability as in general itis linearly increased when the data size is increased.
The main contribution of this work is in terms of reducing exe-cution time where it is slightly improved especially when involvinglarge categorical data sets as compared to three rough set-basedtechniques TR, MMR, and MDA as well a soft set-based techniqueNSS. However, the proposed MAR technique still can only be ap-plied on multi-valued information systems as multi-soft sets canonly dealt with such information systems. Therefore for data setshave been categorized, MAR technique is fit to them.
In the next phase, the ability of the MAR technique in clusteringthe categorical data will be tested in terms of clustering efficiencyas well as clustering accuracy.
641
642
643
644
Acknowledgements
The work of Rabiei Mamat is supported by the Ministry of High-er Education, Malaysia. The work of Tutut Herawan is supported byUniversity of Malaya research grant.
645
646647648649650651
References
[1] G. Guojun, M. Chaoqun, W. JianHong, Data clustering: theory, algorithms andapplications, ASA-SIAM Series on Statistic and Applied Probability (2000) 3–17.
[2] D. Jiang, C. Tang, A. Zhang, Cluster analysis for gene expression data: a survey,IEEE Transaction on Knowledge and Data Engineering 16 (11) (2004) 1370–1386.
ative of soft set for clustering attribute selection, Knowl. Based Syst. (2013),

652653654655656657658659660661662663664665666667668669670671672673674675676677678679680681682683684685686687
688689690691692693694695696697698699700701702703704705706707708709710711712713714715716717718719720721722723
10 R. Mamat et al. / Knowledge-Based Systems xxx (2013) xxx–xxx
KNOSYS 2544 No. of Pages 11, Model 5G
1 August 2013
[3] F. Giannotti, C. Gozzi, G. Manco, Clustering transactional data, in: Proceeding ofPractices of Knowledge Discovery in Database, 2002, pp. 175–187.
[4] R. Mathieu, J. Gibson, A methodology for large scale R&D planning based forcluster analysis, IEEE Transaction on Engineering Management 40 (3) (2004)283–292.
[5] S. Haimov et al., Classification of radar signatures by autoregressive modelfitting and cluster analysis, IEEE Transactions on Geo Science and RemoteSensing 8 (1) (1989) 606–610.
[6] S. Deng, Z. He, X. Hu, G-ANMI: a mutual information based genetic clusteringalgorithm for categorical data, Knowledge Based System 23 (2010) 144–149.
[7] K. Chen, L. Liu, K. Best, Critical clustering structures in categorical dataset,Knowledge Information System 20 (2009) 1–33.
[8] S. Wu et al., Cluster analysis of gene expression data based on self-splitting andmerging competitive learning, IEEE Transaction on Information Technology inBioMedicine 8 (1) (2004) 5–15.
[9] V. Ganti, J. Gehrke, R. Ramakrishnan, CACTUS – clustering categorical datausing summaries, in: Proc. 5th ACM Sigmod Intl. Conf. on Knowledge Discoveryin Databases, 1999, pp. 73–83.
[10] D. Gibson, J. Kleinberg, P. Raghavan, Clustering categorical data: an approachbased on dynamical systems, The Very Large Data Bases Journal 8 (3–4) (2000)222–236.
[11] S. Guha, R. Rastogi, K. Shim, CURE: an efficient clustering algorithm for largedatabases, in: Proc. of the ACM SIGMOD Conference on Management of Data,1998, pp. 73–84.
[12] M.J. Zaki et al., CLICKS: An effective algorithm for mining subspace clusters incategorical datasets, Data and Knowledge Discovery 60 (1) (2007) 51–70.
[13] Z. Pawlak, Rough sets, International Journal of Computer and InformationScience 11 (1982) 341–356.
[14] Z. Pawlak, Rough Sets – Theoretical Aspect of Reasoning about Data, KluwerAcademic Publisher, Boston, 1991.
[15] Z. Pawlak, A. Skowron, Rudiments of rough sets, International Journal ofComputer and Information Science 177 (1) (2007) 3–27.
[16] D. Molodtsov, Soft set theory – first results, Computer and Mathematics withApplications 37 (4/5) (1999) 19–31.
[17] P.K. Maji, A.R. Roy, R. Biswas, An application of soft sets in a decision makingproblem, Computer and Mathematics with Applications 44 (2002) 1077–1083.
724
Please cite this article in press as: R. Mamat et al., MAR: Maximum Attribute Relhttp://dx.doi.org/10.1016/j.knosys.2013.05.009
[18] D. Chen et al., The parameterization of soft sets and its application, Computerand Mathematics with Applications 49 (5-6) (2005) 757–763.
[19] Z. Kong et al., The normal parameter reductions of soft sets and its algorithm,Computer and Mathematics with Applications 56 (2008) 3029–3037.
[20] M.I. Ali et al., On some new operation in soft sets theory, Computer andMathematics with Applications 57 (9) (2009) 1547–1553.
[21] T. Herawan, M.M. Deris, Soft decision making for patients suspected influenza,in: ICCSA (Lecture Notes in Computer Science), Springer-Verlag, 2010, pp. 405–418.
[22] T. Herawan, M.M. Deris, Soft set theory for association rules mining,Knowledge Based Systems 24 (1) (2011) 186–195.
[23] T. Herawan, M.M. Deris, On multi-soft sets construction in informationsystems, in: ICIC (Lecture Notes in Computer Science), Springer-Verlag, 2009,pp. 101–110.
[24] T. Herawan, M.M. Deris, A direct proof of every rough sets is a soft sets, in:Third Asia International Conference on Modelling and Simulation (AMS 2009),IEEE Press, 2009, pp. 119–124.
[25] P.K. Maji, R. Biswas, A.R. Roy, Soft set theory, Computer and Mathematics withApplications 45 (2003) 555–562.
[26] L.J. Mazlack, et al., A rough sets approach in choosing partitioning attributes,in: Proceeding of ICSA 13th. International Conference, CAINE-2000, 2000, pp.1–6.
[27] D. Parmar, T. Wu, J. Blackhurst, MMR: an algorithm for clustering categoricaldata using rough set theory, Data and Knowledge Discovery 63 (3) (2007) 879–893.
[28] Y.Y. Yao, Constructive and algebraic methods of the theory of rough sets,Information Science 109 (1–4) (1998) 21–47.
[29] T. Herawan, M.M. Deris, J.H. Abawajy, A rough set approach for selectingclustering attribute, Knowledge-Based System 23 (3) (1998) 220–231.
[30] H. Qin, X. Ma, J.M. Zain, T. Herawan, A novel soft set approach in selectingclustering attribute, Knowledge-Based Systems 36 (2012) 139–145.
[31] UCI Repository of Machine Learning Database. <http://www.ics.uci.edu/�mlearn/MLRRepository.html>.
[32] D. Parmar, T. Wu, T. Callarman, J. Fowler, P. Wolfe, A clustering algorithm forsupplier base management, International Journal of Production Research 48(13) (2010) 3803–3821.
ative of soft set for clustering attribute selection, Knowl. Based Syst. (2013),