Embed Size (px)
Citation preview
AUTHOR QUERY FORM
Book: Brutin-1611200
Chapter: CH013
Please e-mail your responses and any
corrections to:
E-mail: [email protected]
Dear Author,
Any queries or remarks that have arisen during the processing of your manuscript are listed below
and are highlighted by flags in the proof. (AU indicates author queries; ED indicates editor quer-
ies; and TS/TY indicates typesetter queries.) Please check your proof carefully and answer all AU
queries. Mark all corrections and query answers at the appropriate place in the proof using on-
screen annotation in the PDF file. For a written tutorial on how to annotate PDFs, click http://
www.elsevier.com/__data/assets/pdf_file/0016/203560/Annotating-PDFs-Adobe-Reader-9-X-or-
XI.pdf. A video tutorial is also available at http://www.screencast.com/t/9OIDFhihgE9a.
Alternatively, you may compile them in a separate list and tick off below to indicate that you have
answered the query.
Please return your input as instructed by the project manager.
Uncited references: References that occur in the reference list but are not cited in the text.
Please position each reference in the text or delete it from the reference list.
Missing references: References listed below were noted in the text but are missing from the
reference list. Please make the reference list complete or remove the references from the text.
Location in Article Query / remark
AU:1, Page 185 Please provide the affiliation for the authors. ZQBX
AU:2, Page 187 Kindly indicate if Abstract is acceptable. ZQBX
AU:3, Page 187 Kindly indicate if key words are acceptable. ZQBX
Brutin-1611200 978-0-12-800722-8 00013
To protect the rights of the author(s) and publisher we inform you that this PDF is an uncorrected proof for internal business useonly by the author(s), editor(s), reviewer(s), Elsevier and typesetter MPS. It is not allowed to publish this proof online or inprint. This proof copy is the copyright property of the publisher and is confidential until formal publication.
Chap
ter13
c0013
SOLUBLESUBSTRATE AU:1
Christophe Pirat, Jean Colombani and Alexandra Mailleur
p0010 The studies of drop evaporation focus on the behavior of the liquid and on the
influence of the environment. The substrate always plays a role on the evapora-
tion, through heat exchange and via its wetting properties, but most of the time it
is chosen as inert. Generally two model situations can be envisaged with regard
to the evaporation of a sessile drop on an inert substrate. Either the contact line is
free to move, so that the contact angle remains constant as the radius of the drop
decreases, or the contact line is to be pinned, and then the contact angle decreases
over time. In both situations the loss of mass obeys a power law with different
exponents. In addition, mass loss due to evaporation, mainly at the contact line, is
compensated by an outward flow. When colloidal particles are initially present in
the liquid, the latter are deposited at the contact line, thus promoting the pinning.
s001013.1 Interplay between evaporation and dissolution
p0015 Yet, many situations exist in natural or industrial configurations, where liquid and
solid react during the evaporation of a sessile liquid drop. In the case of mineral
Droplet Wetting and Evaporation. DOI: http://dx.doi.org/10.1016/B978-0-12-800722-8.00013-8
© 2015 Elsevier Inc. All rights reserved.
173
Brutin-1611200 978-0-12-800722-8 00013
To protect the rights of the author(s) and publisher we inform you that this PDF is an uncorrected proof for internal business useonly by the author(s), editor(s), reviewer(s), Elsevier and typesetter MPS. It is not allowed to publish this proof online or inprint. This proof copy is the copyright property of the publisher and is confidential until formal publication.
solids, the reaction at stake is mainly dissolution, and it may lead to a substantial
modification for the solid surface as well as for the evaporation dynamics. This
topic is quite new, and no coherent view exists at the moment. We present in this
chapter the state-of-the-art of our knowledge on the evaporation of drops on a
dissolving substrate.
s001513.1.1 DISSOLUTION
p0020 Dissolution is a heterogeneous reaction of the form solid1 liquid-liquid. Its
driving force is the difference in chemical potential between the solid and the ini-
tial liquid. When the two chemical potentials equalize, the dissolved species
reaches the so-called solubility limit, or saturation concentration, of the solid in
the liquid, and the reaction stops.
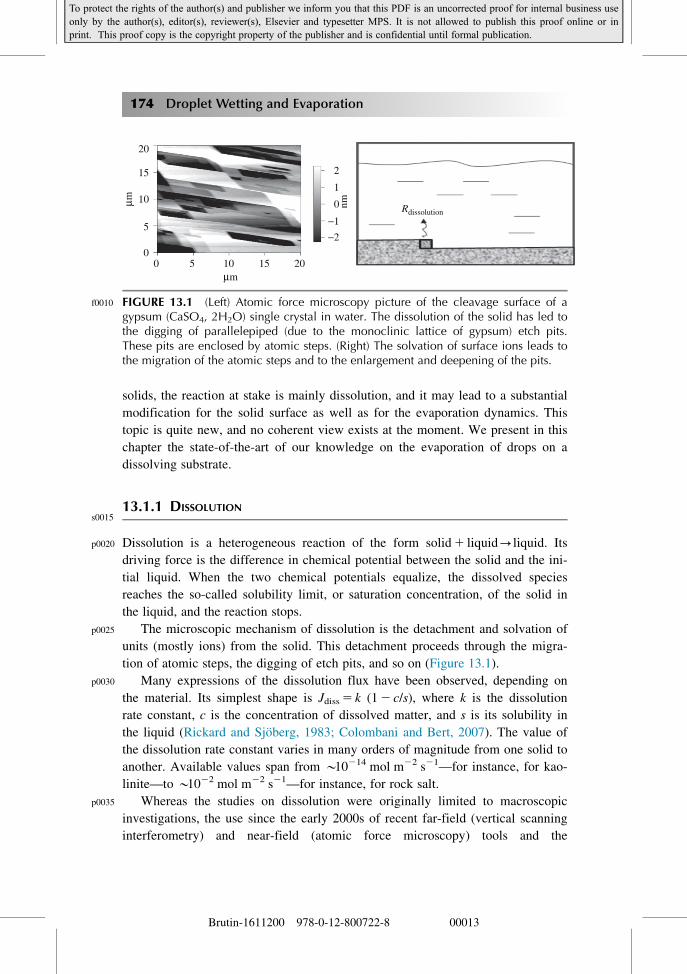
p0025 The microscopic mechanism of dissolution is the detachment and solvation of
units (mostly ions) from the solid. This detachment proceeds through the migra-
tion of atomic steps, the digging of etch pits, and so on (Figure 13.1).
p0030 Many expressions of the dissolution flux have been observed, depending on
the material. Its simplest shape is Jdiss5 k (12 c/s), where k is the dissolution
rate constant, c is the concentration of dissolved matter, and s is its solubility in
the liquid (Rickard and Sjoberg, 1983; Colombani and Bert, 2007). The value of
the dissolution rate constant varies in many orders of magnitude from one solid to
another. Available values span from B10214 mol m22 s21—for instance, for kao-
linite—to B1022 mol m22 s21—for instance, for rock salt.
p0035 Whereas the studies on dissolution were originally limited to macroscopic
investigations, the use since the early 2000s of recent far-field (vertical scanning
interferometry) and near-field (atomic force microscopy) tools and the
0
00
5
10
15
20
5 10 15 20
1
2
−1
−2
μm
nmμm Rdissolution
f0010 FIGURE 13.1 (Left) Atomic force microscopy picture of the cleavage surface of agypsum (CaSO4, 2H2O) single crystal in water. The dissolution of the solid has led tothe digging of parallelepiped (due to the monoclinic lattice of gypsum) etch pits.These pits are enclosed by atomic steps. (Right) The solvation of surface ions leads tothe migration of the atomic steps and to the enlargement and deepening of the pits.
174 Droplet Wetting and Evaporation
Brutin-1611200 978-0-12-800722-8 00013
To protect the rights of the author(s) and publisher we inform you that this PDF is an uncorrected proof for internal business useonly by the author(s), editor(s), reviewer(s), Elsevier and typesetter MPS. It is not allowed to publish this proof online or inprint. This proof copy is the copyright property of the publisher and is confidential until formal publication.
comparison with kinetic Monte Carlo molecular simulations have led to a better
understanding of the microscopic mechanisms of dissolution. Questions such as
“Why is the dissolution flux independent of the density of etch pits at the surface?
Why is the dissolution flux dependent on the history of the surface? How do the
atomic mechanisms combine to build a macroscopic matter flux?” have thereby
begun to find answers (Lasaga and Luttge, 2001; Arvidson and Luttge, 2010).
s002013.1.2 INTERACTION BETWEEN DISSOLUTION AND EVAPORATION KINETICS
p0040 Interaction between dissolution and evaporation will take place if the kinetics of
both phenomena are comparable. The evaporation flux of liquid water in normal
conditions is JeB1027 m3 m22 s21. The overall dissolution flux is not necessarily
the above-mentioned flux Jdiss. Indeed, this flux characterizes the transfer of mat-
ter from solid to liquid at the surface. But if the diffusion flux Jdiff of the
dissolved species from the surface to the bulk liquid is small compared to the
dissolution flux, these species will accumulate close to the surface, the concentra-
tion will increase, the driving force will decrease, and the reaction will slow
down. The overall flux will then be a combination of Jdiss and Jdiff (Colombani,
2008). Two limiting cases are usually defined. For slow-dissolving solids (like
oxides), dissolution is the slowest step and therefore drives the whole kinetics,
called reaction-driven or surface-driven, kinetics. On the contrary, for fast-
dissolving solids (like salts or sugars), diffusion is the slowest step, and it controls
the kinetics, so-called diffusion-driven or transport-driven, kinetics.
p0045 For the study of drop evaporation, fast-dissolving solids are preferred to guar-
antee a significant release of matter in the liquid. In this case, diffusion is
expected to drive the dynamics. The diffusion flux writes Jdiff B D Δc/h, where
D is the diffusion coefficient of the dissolved species, and Δc is the concentration
difference inside the drop of height h. If we consider the exemplifying case of a
water drop evaporating on NaCl, D is 1029 m2 s21, and Δc amounts at most to
the solubility of NaCl in water—that is, 17%. For a drop of height h B 1 mm,
this leads to a diffusion flux Jdiff B 23 1027 m3 m22 s21. Two conclusions can
be drawn from this order of magnitude computation:
u0010 � The dissolution kinetics of all fast-dissolving solids ($1029 m3 m22 s21)
should be faster than the mass transport flux Jdiff in the drop. Therefore, the
overall dynamics of dissolution should be governed by diffusion and be there-
fore quite identical for all these solids, D varying little from one material to
another.
u0015 � The evaporation and overall dissolution fluxes are comparable for fast-dissolving
solids, and both mechanisms should therefore interfere during drop evaporation
on a soluble substrate.
Soluble Substrate AU:1175
Brutin-1611200 978-0-12-800722-8 00013
To protect the rights of the author(s) and publisher we inform you that this PDF is an uncorrected proof for internal business useonly by the author(s), editor(s), reviewer(s), Elsevier and typesetter MPS. It is not allowed to publish this proof online or inprint. This proof copy is the copyright property of the publisher and is confidential until formal publication.
s002513.1.3 COUPLING MECHANISMS BETWEEN DISSOLUTION AND EVAPORATION
p0060 Dissolution is expected to have an influence on the behavior of the liquid and of the
solid. Dissolution will first induce the buildup of vertical concentration gradients
inside the drop. It is also likely to anchor the triple line. The divergence of the evapo-
ration flux at the pinned triple line will then lead to outward flows inside the drop, as
in the case of the evaporation of colloidal suspensions, therefore creating horizontal
concentration gradients. These matter gradients may create hydrodynamic instabil-
ities, leading either to gravitational convection (solutal Rayleigh�Benard) or
capillary convection (solutal Marangoni�Benard convection). These flows will in
turn modify the evaporation and dissolution kinetics.
p0065 In addition, these flows of matter inside the drop are expected to lead to a
transfer of matter from the center to the periphery of the drop, thereby inducing
the deposit of a ring at the end of the evaporation (like in the coffee stain situa-
tion; see Chapter 4). Because the dissolution proceeds via etch pitches deepening,
the roughness of the substrate is also likely to be largely increased.
p0070 In the following, we provide a short overview of recent works that deal with dis-
solution and/or solute concentration effects during the evaporation of a sessile drop.
s0030 13.2 Evaporation in presence of solute concentrationwith or without dissolution
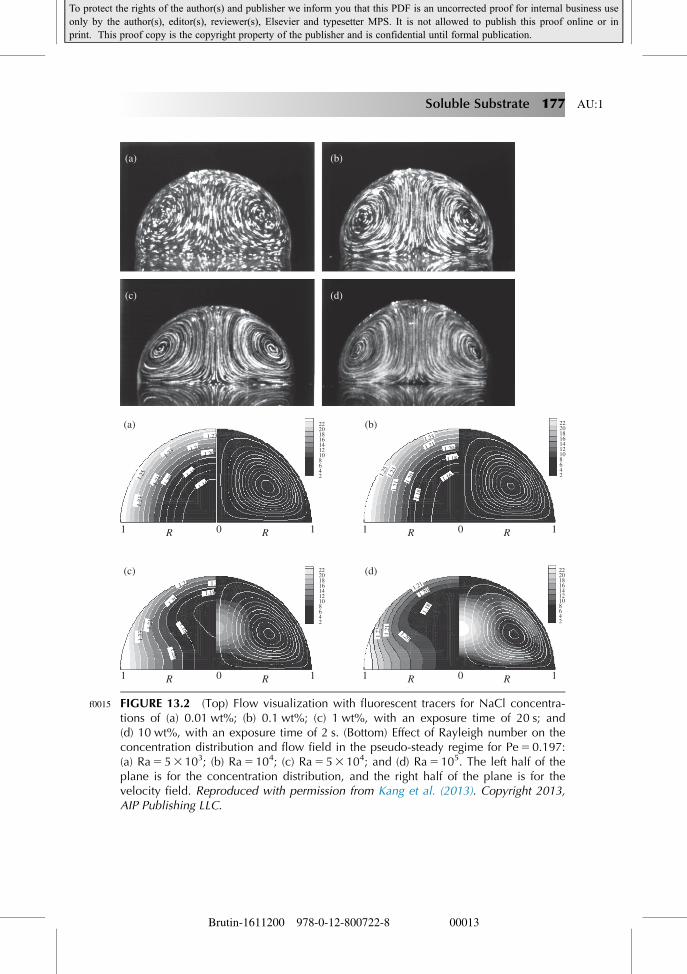
p0075 A study of the effect of saline Rayleigh convection on an evaporating sessile drop
deposited on a nonsoluble substrate was recently carried out by Kang et al. (2013).
The authors investigated the evaporation dynamics using NaCl aqueous drops on a
hydrophobic smooth substrate and showed that the evaporation-induced density gra-
dient affects the evaporation dynamics. Starting with a homogeneous concentration
for the solute, concentration and temperature gradients progressively build up due
to the fluid motion initiated by the evaporation at the drop surface. The resulting
surface tension gradient will be the cause of a Marangoni flow, while another type
of flow, due to the evaporation-induced density gradient (so-called evaporation-
induced Rayleigh convective flow) and the resulting spatially nonuniform buoyancy
force, will be generated as well. The internal flow in an almost hemispherical
evaporating drop was visualized by a particle image velocimetry technique. It was
shown that a stable toroidal vortex takes place, the flow being directed upward at
the center, whatever the initial concentration in the range 0.01�10.00 wt% mixture
(see Figure 13.2 (Left)).
p0080 Assuming that the problem is axially symmetric, a set of nondimensionalized
governing equations was derived for the mass, momentum, and solute conservation
176 Droplet Wetting and Evaporation
Brutin-1611200 978-0-12-800722-8 00013
To protect the rights of the author(s) and publisher we inform you that this PDF is an uncorrected proof for internal business useonly by the author(s), editor(s), reviewer(s), Elsevier and typesetter MPS. It is not allowed to publish this proof online or inprint. This proof copy is the copyright property of the publisher and is confidential until formal publication.
(a) (b)
(a)
(c)
1 0 1R R
1 0 1R R
1 0 1
222018161412108642
222018161412108642
222018161412108642
222018161412108642 1.
251.
23
1.23
1.21
1.211.20
1.20
1.18
1.23 1.21 1.20
1.21
1.20
1.18
1.16
1.18
1.25
1.23
1.23
1.23
1.21
1.211.20
1.20
1.18
1.16
1.23
1.2
1.21
1.21
1.18
1.20
1.18
1.20
R R
1 0 1R R
(b)
(d)
(c) (d)
f0015 FIGURE 13.2 (Top) Flow visualization with fluorescent tracers for NaCl concentra-tions of (a) 0.01 wt%; (b) 0.1 wt%; (c) 1 wt%, with an exposure time of 20 s; and(d) 10 wt%, with an exposure time of 2 s. (Bottom) Effect of Rayleigh number on theconcentration distribution and flow field in the pseudo-steady regime for Pe50.197:(a) Ra5 53 103; (b) Ra5104; (c) Ra5 53 104; and (d) Ra5105. The left half of theplane is for the concentration distribution, and the right half of the plane is for thevelocity field. Reproduced with permission from Kang et al. (2013). Copyright 2013,AIP Publishing LLC.
Soluble Substrate AU:1177
Brutin-1611200 978-0-12-800722-8 00013
To protect the rights of the author(s) and publisher we inform you that this PDF is an uncorrected proof for internal business useonly by the author(s), editor(s), reviewer(s), Elsevier and typesetter MPS. It is not allowed to publish this proof online or inprint. This proof copy is the copyright property of the publisher and is confidential until formal publication.
equations, introducing the nondimensional Peclet (Pe), salinity Rayleigh (Ra), and
Prandtl (Pr) numbers, respectively. Pe5 a0u0/D, Ra5 gβc0a03/νD, and Pr5 ν/D,
where a05 1023 m stands for the initial base radius of the drop, u05 1026 m s21 is
the constant contracting velocity of the drop surface, g5 9.81 m s22 is the acceler-
ation of gravity, β5 7.1023 wt%21 is the solutal expansion coefficient, c05 1 wt%
is the initial concentration, ν5 1026 m s22 is the kinematic viscosity, and
D5 1029 m s22 is the molecular diffusivity of the solute.
p0085 The main findings are as follows. Because almost no fluid motion was
observed during the evaporation of a drop of pure water, it was assumed that the
thermal contribution to the flow was negligible. Interestingly, it was observed that
the boundary condition at the drop surface was no slip instead of the free surface
condition. It is likely due to either the presence of a surfactant in the liquid or a
contaminant in the air, even if the experiments were carefully conducted in a
closed chamber at a temperature of 25�C and a relative humidity of 45%. This
effect has been recently debated for other systems where the slip condition at a
liquid�gas interface plays a crucial role (Bolognesi et al., 2014; Berkelaar et al.,
2014; Ybert and Di Meglio, 1998).
p0090 Because the convection time is greater than the molecular diffusion time, the
low flow field (of creeping-flow type) can be decoupled from the concentration
field. It follows that the body force (Ra(a/a0)2(c2 c0)/c0), where a is the base
radius, c is the concentration, and c0 is the concentration at the origin), propor-
tional to the effective concentration, is rapidly time-invariant and that this
pseudo-steady state is rapidly reached, even in the presence of convection, as
checked by the authors experimentally and numerically (Figure 13.2 (Right)).
Thus, in this configuration of Pr.. 1, the flow field can be considered by
neglecting its time history, and it is only governed by the Rayleigh number, while
the concentration field is driven by the Peclet number. As the body force deter-
mines the fluid motion, a scaling analysis shows that the flow velocity is propor-
tional to (RaPe) in the low Rayleigh-number-limit, while it scales approximately
as (Ra1/2) in the high Rayleigh-number-limit, probably because of the mixing
enhancement (see Figure 17 in Kang et al., 2013, for a comparison of computed
and measured velocity versus evaporation time for various Rayleigh numbers).
p0095 It is well known that a polymeric coating could affect the wettability of a substrate.
It is particularly the case for water drops deposited on substrates coated with a hydro-
philic soluble polymer (i.e., a good solvent for the drop). Tay et al. (2010) have exten-
sively studied the wetting dynamics and the drying of water drops deposited onto
soluble-polymer-coated silicon substrates, using either a neutral polymer (PDMA) or
two charged polymers—namely, a cationic poyelectrolyte (PDADMAC) or a zwitter-
ionic polymer (PZ). In all cases, around a 200 nm-thick coating is deposited by spin
coating. The authors conclude that both the spreading and the pinning dynamics
depend on the type of polymer used. Basically, they observe that after an initially
178 Droplet Wetting and Evaporation
Brutin-1611200 978-0-12-800722-8 00013
To protect the rights of the author(s) and publisher we inform you that this PDF is an uncorrected proof for internal business useonly by the author(s), editor(s), reviewer(s), Elsevier and typesetter MPS. It is not allowed to publish this proof online or inprint. This proof copy is the copyright property of the publisher and is confidential until formal publication.
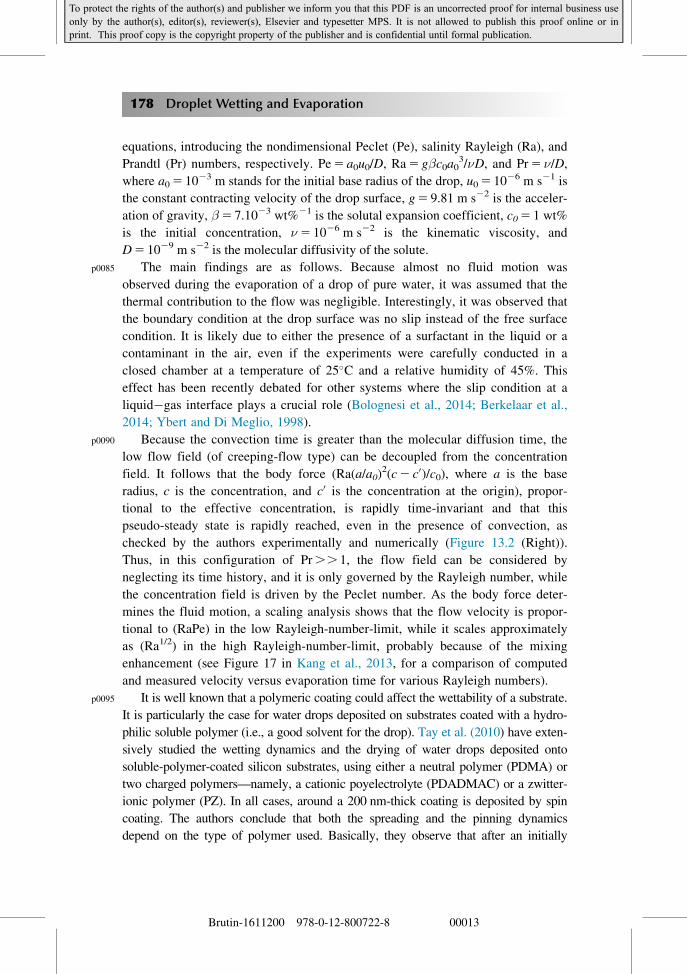
spreading stage, for charged polymers, the drop undergoes pinning and then recedes at
the very end of the evaporation, while it recedes immediately after the spreading for
PDMA (with a constant contact angle; Figure 13.3 (Top Left)).
p0100 Since the polymers are not chemically grafted onto the substrate, they are
essentially dissolved into the drop. A detailed characterization of the residual
deposit shows that, for charged polymers, it forms a ring-like accumulation at the
periphery of the drop, while it forms a crater at the center of the drop for the neu-
tral polymer (Figure 13.3 (Bottom)).
p0105 The spreading dynamics is similar for the three configurations, but the differ-
ence in the evaporation dynamics between neutral and charged polymers can be
explained as follows. Rapidly after the spreading, polymer molecules accumulate
in the vicinity of the contact line, resulting in a glassy zone that will not contribute
further to the evaporation. A concentration gradient builds up and makes a transi-
tion zone between the bulk and the glassy area, whose size will be essentially
driven by the nature of the polymer. The dynamics of the contact line will depend
on the relative strength of the evaporative flux (that will tend to make the contact
line recede), and the osmotic pressure present in the transition zone (that will tend
to promote a flux of water toward the edge; Figure 13.3 (Top Right)).
p0110 For the charged polymers, these two contributions equilibrate, which causes
the pinning of the contact line in conjunction with the formation of a deposit of
00
200 400 600 800
Time t (s)
Dro
p ra
dius
R (
μm)
Polymer coatinge0 = 240 nm
Silicon wafer
Schematic side view
1000
1000
2000
3000
4000
1200 1400
PDADMAC
1000100.1
tpinning
treceding
0.5
0.6
0.7
0.8
0.9
1
1.1
R/R
max
PDMAPZ
f0020 FIGURE 13.3 (Top Left) Radius evolution for a water drop with the tree polymersduring spreading, pinning, and receding. (Top Right) Schematic drawing of themechanisms at stake in the vicinity of the contact line during evaporation. (Bottom)After complete evaporation, top view and schematic height profile of the deposit fromleft to right PDMA, PDADMAC, and PZ polymers. Reproduced in part from Tay et al.(2010) with permission of The Royal Society of Chemistry.
Soluble Substrate AU:1179
Brutin-1611200 978-0-12-800722-8 00013
To protect the rights of the author(s) and publisher we inform you that this PDF is an uncorrected proof for internal business useonly by the author(s), editor(s), reviewer(s), Elsevier and typesetter MPS. It is not allowed to publish this proof online or inprint. This proof copy is the copyright property of the publisher and is confidential until formal publication.
polymer. For the neutral polymer, the osmotic pressure is negligible, because it
originates from the high concentration of electric charges. As a consequence, the
contact line starts to recede immediately after spreading, leaving a continuous
glassy deposit on the surface. It must be noted that when salt is added to charged
polymers, as expected, the pinning disappears because the osmotic pressure weak-
ens due to the induced screening of the charges in the transition zone. For a
detailed study of the spreading dynamics on soluble substrates, the reader can
refer to Dupas et al. (2013) and the references herein.
p0115 If we now focus on the evaporation of a drop deposited on an initially flat and
smooth soluble substrate (i.e., not a soluble coating), it is expected that the sol-
vent will quickly initiate a process of dissolution. The consequences are twofold.
First, a concentration gradient will be established inside of the drop. On the other
hand, the surface condition will be changed during evaporation.
p0120 Cordeiro and Pakula (2005) investigated numerically the behavior of evaporat-
ing nanometer-sized drops at nonsoluble and soluble surfaces. They performed in-
lattice Monte Carlo simulations to investigate the evaporation dynamics, as well
as the deposit formation. They used the cooperative motion algorithm method
with periodic boundary conditions by considering liquid drops on solid in equilib-
rium with a vapor phase. The details about the method can be found in Cordeiro
and Pakula (2005). Roughly, this method involves an ensemble of beads on a tri-
dimensional lattice. There is no empty site. Three kinds of beads are considered
in their approach: pure solvent particles, substrate particles, and vacuum. Each
bead can replace one of its neighbors. At each time step, the probability of a
jump for a bead is given by the boltzmann factor p5 exp(2E/kT), the sum of all
the displacements being zero. kT is the temperature at equilibrium, and E is the
energy of interaction of the moving bead given by Ei5 nijeij1 nikeik for the site i,
with e the interaction energy between two beads and n the number of interactions.
The jump is considered if and only if p is greater than a random number. To
account for evaporation, if a solvent bead is surrounded by vacuum beads, then it
is transformed in a vacuum bead. Gravity is not taken into account. When the
energy interactions are carefully set via an appropriate density function, it is pos-
sible to observe microwell and ring formation for a swelling substrate.
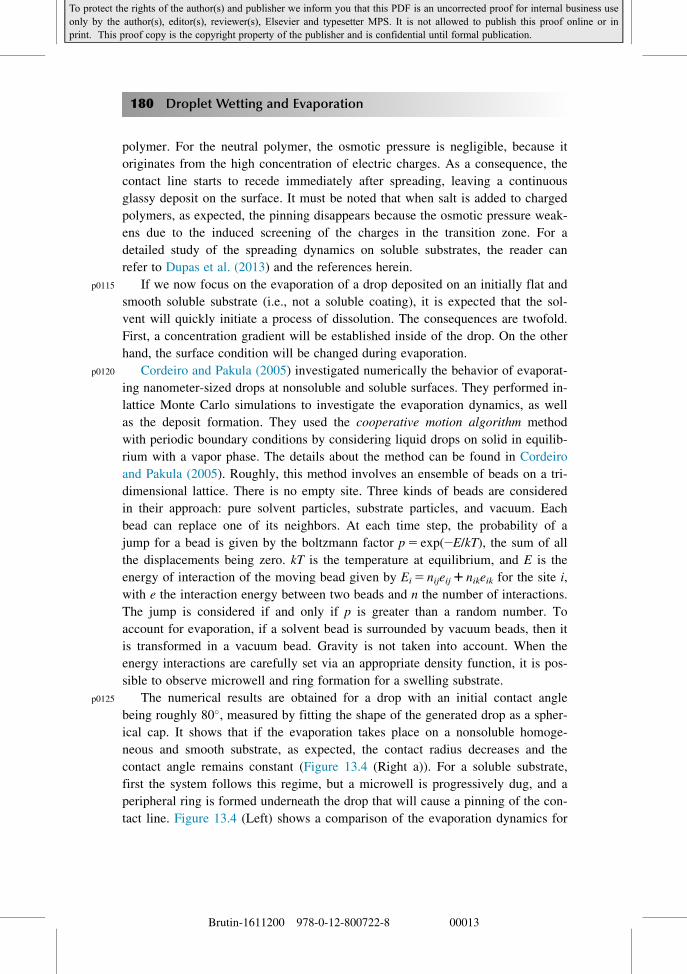
p0125 The numerical results are obtained for a drop with an initial contact angle
being roughly 80�, measured by fitting the shape of the generated drop as a spher-
ical cap. It shows that if the evaporation takes place on a nonsoluble homoge-
neous and smooth substrate, as expected, the contact radius decreases and the
contact angle remains constant (Figure 13.4 (Right a)). For a soluble substrate,
first the system follows this regime, but a microwell is progressively dug, and a
peripheral ring is formed underneath the drop that will cause a pinning of the con-
tact line. Figure 13.4 (Left) shows a comparison of the evaporation dynamics for
180 Droplet Wetting and Evaporation
Brutin-1611200 978-0-12-800722-8 00013
To protect the rights of the author(s) and publisher we inform you that this PDF is an uncorrected proof for internal business useonly by the author(s), editor(s), reviewer(s), Elsevier and typesetter MPS. It is not allowed to publish this proof online or inprint. This proof copy is the copyright property of the publisher and is confidential until formal publication.
nonsoluble and soluble substrates. As a result, the contact radius becomes con-
stant, and the contact angle starts to decrease (Figure 13.4 (Right b)).
p0130 This study supports that the evaporation/dissolution of a drop modifies the topog-
raphy of the surface and in turn affects the evaporation dynamics, partly because of
the induced pinning of the triple line. It must be noted that the authors claim that the
results can be extended to micrometer-sized or even millimeter-sized drops.
p0135 It should be pointed out that dissolution-induced watermarks can unexpectedly
occur during evaporation. Such an example is presented in Belmiloud et al. (2012).
The dynamics of the drying of a sessile drop of ultrapure water on silicon substrates
have been studied. The silicon surfaces were made by dHF-etching (0.5% HF for
5 min, so-called hereafter “hydrophobic”), while more hydrophilic surfaces were
obtained by exposing these surfaces to the air for 1 day (so-called hereafter hydro-
philic), allowing for the formation of a hydrophilic layer of oxidized Si. The experi-
ments have been conducted in a well-controlled ultra-clean environment (clean
room class 1, relative humidity of 40%, temperature of 22�C) with deoxygenated
water. Sessile drop evaporation was carried out in both hydrophobic (just after
dHF) and hydrophilic configurations. On a hydrophobic Si surface, a pinned phase
8977 8950
67996992
3964 3977
15022045
20
15
10
5
020151050
20151050
20
15
10
5
0
(a)
(b)
Dro
p he
ight
Dro
p he
ight
Distance
Distance
f0025 FIGURE 13.4 (Left) Snapshots of evaporating drops. Left: nonsoluble substrate, Right:soluble substrate. For each snapshot, the radial average is also shown, together withthe number of solvent beads remaining within the drop. (Right) Evolution during thedrop evaporation, and for each profile, the corresponding fit with a spherical cap.(a) Nonsoluble substrate, (b) soluble substrate. Reprinted with permission fromCordeiro and Pakula (2005). Copyright (2005) American Chemical Society.
Soluble Substrate AU:1181
Brutin-1611200 978-0-12-800722-8 00013
To protect the rights of the author(s) and publisher we inform you that this PDF is an uncorrected proof for internal business useonly by the author(s), editor(s), reviewer(s), Elsevier and typesetter MPS. It is not allowed to publish this proof online or inprint. This proof copy is the copyright property of the publisher and is confidential until formal publication.
was first observed (constant contact radius, decreasing contact angle starting from
70�), followed by a receding phase (contact angle of 32�, decreasing radius), as
shown in Figure 2 of Belmiloud et al. (2012).
p0140 By comparing the evaporation on Si and SiO2 surfaces in the receding phase, it
is observed, as expected, that smaller evaporating drops dry slower with a higher
receding contact angle. In both cases, the liquid-solid surface area decreases line-
arly with time. Focusing on the very last stage of evaporation, a similar behavior is
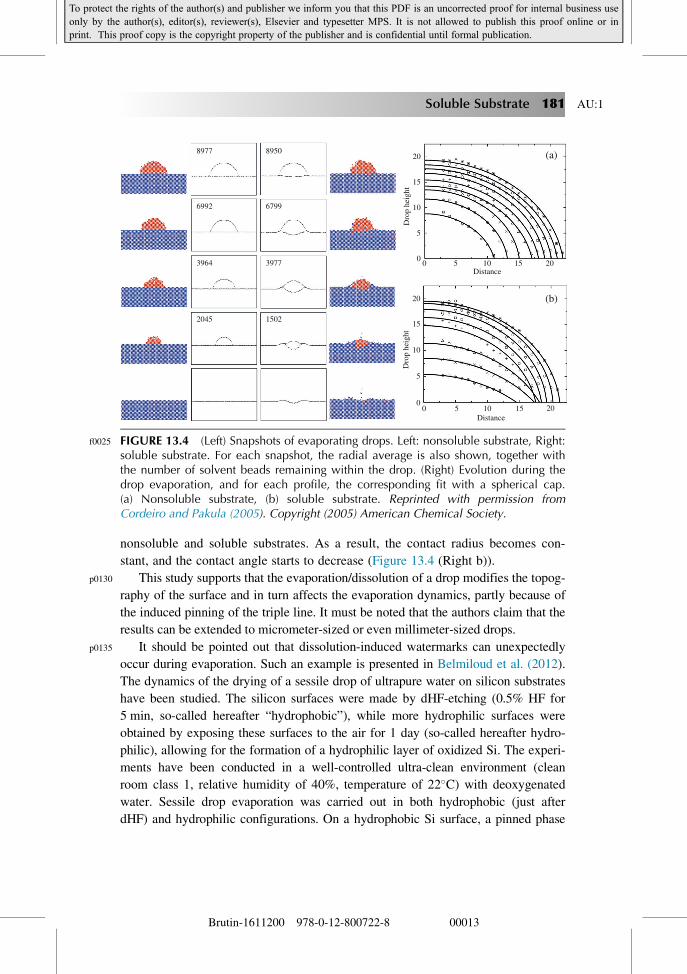
observed for Si and SiO2 wafers. Interestingly, it is shown that just before complete
evaporation, the contact line jumps due to the depinning on a residual ring, or
so-called watermark (Figure 13.5 (Left)).
p0145 After the depinning, the decrease in contact surface is faster than before the
pinning begins, while the contact angle is measured almost constant around 2� forboth Si and SiO2 surfaces. A high-resolution profilometry (HRP) of the surfaces
clearly shows a so-called coffee ring made of thin residues, while a cluster of big-
ger residues is visible at the center (Figure 13.5 (Right)).
p0150 The thickness of the ring is larger for SiO2 than for Si. In this specific case, the
deposits are known to be a result of chemical reactions. First, the ambient oxygen
that diffuses into the water drop will create silica and silicic acids. The resulting
Si(OH)4 molecules will form hydrated polymeric chains due to their rising concen-
tration throughout the evaporation. At the final stage, these silica-based residues of
very low solubility in water will precipitate and will show dynamics similar to those
observed with evaporating colloidal solutions.
p0155 Beyond this specific case, which shows how complex the cleaning process of
wafers for microelectronics applications can be, it must be pointed out that it is com-
mon for the process of evaporation of a sessile drop to involve some sort of reaction
with the substrate that might significantly affect both the evaporation dynamics and
the subtract integrity.
∅2
(mm
2 )
∅2 (m
m2 )
0.7
0.6
0.5
(a) (b)
0.4
0.3
0.2
0.1
0
0.8
1 200
150
100
Hei
ght (
nm)
50
0
0.4
0.6
0.2
0185 205 225
t (s) t (s)
245 60 65 70 75 80 0 200 400
Width (μm)
600
f0030 FIGURE 13.5 (Left) Evolution of the square diameter of a water drop deposited on aSi wafer (a) and a SiO2 wafer (b) at the end of the evaporation—that is, before andafter the formation of a watermark (plateau). (Right) Topology taken at the centeracross a ring-shaped watermark for a hydrophilic Si wafer. Reprinted with permissionfrom Belmiloud et al. (2012). Copyright 2012, The Electrochemical Society.
182 Droplet Wetting and Evaporation
Brutin-1611200 978-0-12-800722-8 00013
To protect the rights of the author(s) and publisher we inform you that this PDF is an uncorrected proof for internal business useonly by the author(s), editor(s), reviewer(s), Elsevier and typesetter MPS. It is not allowed to publish this proof online or inprint. This proof copy is the copyright property of the publisher and is confidential until formal publication.
s0035 13.3 Water drop evaporation on a flat crystal saltsubstrate
p0160 The evaporation of a pure water drop deposited on NaCl soluble single crystals of salt
has been explored. After the crystals have been cleaved (103 10 mm, 2 mm in
height), they are polished with sandpaper (grit size down to 3 μm). A water drop of a
few microliters is gently deposited on the substrate. A contact angle measurement
device is used to follow the evaporation dynamics. The drop evaporates at ambient
pressure inside a transparent closed cell (1003 1003 100 mm3) to avoid any
perturbations from the ambient. The side view is recorded throughout the evaporation
via a CCD camera fitted with a macro lens positioned laterally. To complete this
observation, an upright reflected light microscope fitted with a high-resolution camera
is used to observe surface modifications after evaporation.
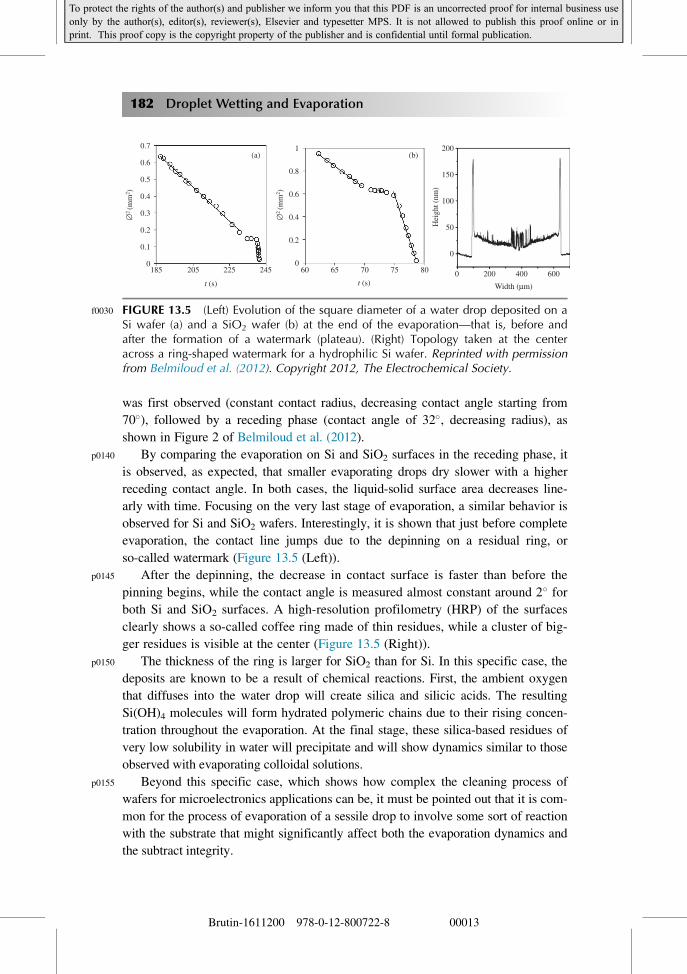
p0165 These preliminary experiments showed unambiguously the strong influence of
the substrate dissolution on the evaporation process for a water drop. After drop
deposition, it is observed that the contact line is nearly circular for well-polished
crystals substrates. First, it induces a pinning of the triple line during almost the
whole evaporation (Figure 13.6 (Left)), instead of a receding triple-line typical of
water drops on soft inert substrates. Second, the evaporation/dissolution interplay
leads to an increase of the roughness of the solid surface. Finally, like in colloidal
suspensions, the evaporation of a pure water drop on a soluble substrate results in
the deposit of a ring at the periphery of the drop. Top view observations clearly
reveal the accumulation of a ring-shaped deposit at the edge of the drop that
seems to be homogeneous at the end of the evaporation (Figure 13.6 (Right)).
A typical 3D profilometry of the surface is shown in Figure 13.7. It reveals a dig-
ging at the center as deep as 15 μm, while the deposit reaches around 15 μm
300 μm
t = 0 s t = 24 s t = 60 s
500 μm
t = 118 s t = 155 s t = 165 s
t = 0 s
t = 88 s
f0035 FIGURE 13.6 (Left) Side view of a 3 μL pure water drop deposited on a NaCl sub-strate at initial time and after complete evaporation (t 588 s). The initial contact angleis about 15�. (Right) Top view of a 3 μL pure water drop on a NaCl substrate at differ-ent times. The deposit is clearly visible.
Soluble Substrate AU:1183
Brutin-1611200 978-0-12-800722-8 00013
To protect the rights of the author(s) and publisher we inform you that this PDF is an uncorrected proof for internal business useonly by the author(s), editor(s), reviewer(s), Elsevier and typesetter MPS. It is not allowed to publish this proof online or inprint. This proof copy is the copyright property of the publisher and is confidential until formal publication.
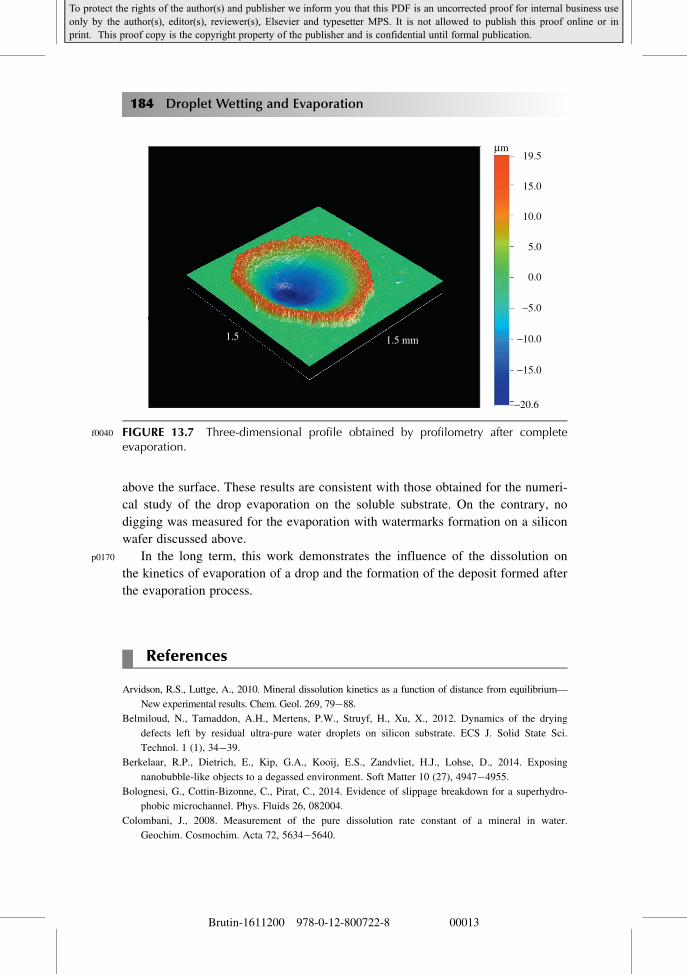
above the surface. These results are consistent with those obtained for the numeri-
cal study of the drop evaporation on the soluble substrate. On the contrary, no
digging was measured for the evaporation with watermarks formation on a silicon
wafer discussed above.
p0170 In the long term, this work demonstrates the influence of the dissolution on
the kinetics of evaporation of a drop and the formation of the deposit formed after
the evaporation process.
References
Arvidson, R.S., Luttge, A., 2010. Mineral dissolution kinetics as a function of distance from equilibrium—
New experimental results. Chem. Geol. 269, 79�88.
Belmiloud, N., Tamaddon, A.H., Mertens, P.W., Struyf, H., Xu, X., 2012. Dynamics of the drying
defects left by residual ultra-pure water droplets on silicon substrate. ECS J. Solid State Sci.
Technol. 1 (1), 34�39.
Berkelaar, R.P., Dietrich, E., Kip, G.A., Kooij, E.S., Zandvliet, H.J., Lohse, D., 2014. Exposing
nanobubble-like objects to a degassed environment. Soft Matter 10 (27), 4947�4955.
Bolognesi, G., Cottin-Bizonne, C., Pirat, C., 2014. Evidence of slippage breakdown for a superhydro-
phobic microchannel. Phys. Fluids 26, 082004.
Colombani, J., 2008. Measurement of the pure dissolution rate constant of a mineral in water.
Geochim. Cosmochim. Acta 72, 5634�5640.
−20.6
−15.0
−10.0
−5.0
1.5 1.5 mm
19.5
15.0
10.0
5.0
0.0
μm
f0040 FIGURE 13.7 Three-dimensional profile obtained by profilometry after completeevaporation.
184 Droplet Wetting and Evaporation
Brutin-1611200 978-0-12-800722-8 00013
To protect the rights of the author(s) and publisher we inform you that this PDF is an uncorrected proof for internal business useonly by the author(s), editor(s), reviewer(s), Elsevier and typesetter MPS. It is not allowed to publish this proof online or inprint. This proof copy is the copyright property of the publisher and is confidential until formal publication.
Colombani, J., Bert, J., 2007. Holographic interferometry study of the dissolution and diffusion of gyp-
sum in water. Geochim. Cosmochim. Acta 71, 1913�1920.
Cordeiro, R.M., Pakula, T., 2005. Behavior of evaporating droplets at nonsoluble and soluble surfaces:
modeling with molecular resolution. J. Phys. Chem. B 109, 4152�4161.
Dupas, J., Verneuil, E., Talini, L., Lequeux, F., Ramaioli, M., Forny, L., 2013. Diffusion and evapora-
tion control the spreading of volatile droplets onto soluble films. Interfacial Phenom. Heat Transf.
1 (3), 231�243.
Kang, K.H., Lim, H.C., Lee, H.W., Lee, S.J., 2013. Evaporation-induced saline Rayleigh convection
inside a colloidal droplet. Phys. Fluids 25, 042001.
Lasaga, A., Luttge, A., 2001. Variation in crystal dissolution rate based on a dissolution stepwave
model. Science 291, 2400�2404.
Rickard, D., Sjoberg, E.L., 1983. Mixed kinetic control of calcite dissolution rates. Am. J. Sci. 283,
815�830.
Tay, A., Lequeux, F., Bendejacq, D., Monteux, C., 2010. Wetting properties of charged and uncharged
polymeric coating—effect of the osmotic pressure at the contact line. Soft Matter 7 (10),
4715�4722.
Ybert, C., Di Meglio, J., 1998. Ascending air bubbles in protein solutions. Eur. Phys. J. B 4, 313�319.
Soluble Substrate AU:1185
Brutin-1611200 978-0-12-800722-8 00013
To protect the rights of the author(s) and publisher we inform you that this PDF is an uncorrected proof for internal business useonly by the author(s), editor(s), reviewer(s), Elsevier and typesetter MPS. It is not allowed to publish this proof online or inprint. This proof copy is the copyright property of the publisher and is confidential until formal publication.
NON-PRINT ITEM
Abstract
The AU:2studies of drop evaporation focus on the behavior of the liquid and on the
influence of the environment. The substrate always plays a role on the evapora-
tion, through heat exchange and via its wetting properties, but most of the time it
is chosen as inert. Generally two model situations can be envisaged with regard
to the evaporation of a sessile drop on an inert substrate. Either the contact line is
free to move, so that the contact angle remains constant as the radius of the drop
decreases, or the contact line is to be pinned, and then the contact angle decreases
over time. In both situations the loss of mass obeys a power law with different
exponents. In addition, mass loss due to evaporation, mainly at the contact line, is
compensated by an outward flow. When colloidal particles are initially present in
the liquid, the latter are deposited at the contact line, thus promoting the pinning.
Keywords: Dissolution; hydrophobic AU:3; interferometry; osmotic pressure; polymer;
substrate
Brutin-1611200 978-0-12-800722-8 00013
To protect the rights of the author(s) and publisher we inform you that this PDF is an uncorrected proof for internal business useonly by the author(s), editor(s), reviewer(s), Elsevier and typesetter MPS. It is not allowed to publish this proof online or inprint. This proof copy is the copyright property of the publisher and is confidential until formal publication.


![2 Index [perso.univ-rennes1.fr]](https://img.pdfslide.us/doc/110x75/61f0980b67f9be4300195d63/2-index-persouniv-.jpg)