Embed Size (px)
Citation preview
THE
PANCHAYATI RAJ & DRINKING WATER DEPARTMENT GOVERNMENT
OF ODISHA
www.odishapanchayat.gov.in.
AUTHOR NAME
MONTHLY
MASTER
REPORT (MMR)
(FEBRUARY-2021)
FINANCIAL & PHYSICAL ACHIEVEMENT UNDER
POVERTY ALLEVIATION PROGRAMMES
2021

CONTENTS
Sl.
No. Subject
Page
No.
Sl.
No. Subject
Page
No.
1 2 3 1 2 3
1. Basic Information on the Schemes A-D
11. Daily Progress Report on RH 27-32
2. Scheme-Wise State Summary Report 1
12. Employment Generation under MGNREGS-I 33
3. Graphical Presentation of Funds Available & Expenditure 2
13. Financial Performance under MGNREGS-II 34
4. Comparison of Scheme wise -Achievement 3
14. Information on Anganwadi Centre 35
5. MPR on Tribal Sub-Plan Area Districts 4
15. Drinking Water Supply & Sanitation 36-39
6. District-wise Financial and Physical Achievement under different Schemes
16. Financial and Physical achievement under GGY 40
Angul and Balasore 5
17. Financial and Physical achievement under 14th
Finance Commission 41
Baragarh and Bhadrak 6
18. Financial achievement under 15th
Finance Commission 42
Bolangir and Boudh 7
19. Financial and Physical achievement under 4th
State Finance Commission Award 43-57
Cuttack and Deogarh 8
20. Financial and Physical achievement under 4th
Non CFC / SFC 58-63
Dhenkanal and Gajapati 9
21. Financial & Physical Achievement under Rastriya Gram Swaraj Abhiyan (RGSA & CB) 64
Ganjam and Jagatsinghpur 10
22. Physical Infrastructure under CFC / SFC 65-66
Jajpur and Jharsuguda 11
23. Monthly Progress Report on Bonded Labour 67
Kalahandi and Kandhamal 12
24. GP/PS Road (CC Road) 68
Kendrapara and Keonjhar 13
25. Information on Concrete Drying Platform –cum-Threshing Floor 69
Khurda and Koraput 14
26. Ama Gaon Ama Bikash 70
Malkangiri and Mayurbhanj 15
27. Information About Kitchen Shed 71
Nabarangpur and Nayagarh 16
28. Information About LPG Connection 72
Nuapada and Puri 17
29. District wise Population of directly affected Villages under DMF 73-74
Rayagada and Sambalpur 18
30. Utilization Certificate Position 75-76
Subarnapur and Sundargarh 19
31. Monthly Progress Report on NRuM 77
7. Financial and Physical Achievement under NRLM 20-23
32. Monthly Progress Report to CM Office & Hon’ble Minister 78-79
8. Financial and Physical Achievement under DDU-GKY 24
33. Hon’ble Governor Report 80
9. Monthly performance report of NRLM & DDU-GKY 25
34. Livelihood Interventions to combat the COVID-19 81
10. Financial & Physical Achievement under PMAY (G) & BIJU PUCCA
GHAR (RH)
26
A
Over View of All Schemes
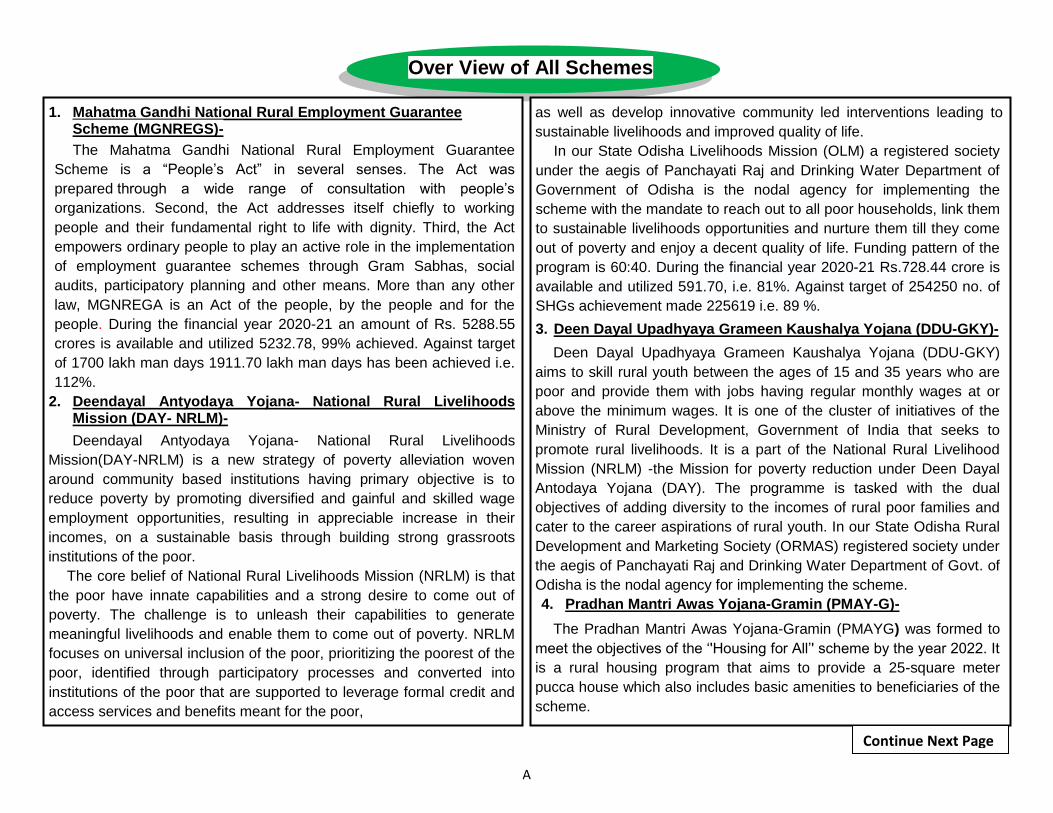
1. Mahatma Gandhi National Rural Employment Guarantee Scheme (MGNREGS)-
The Mahatma Gandhi National Rural Employment Guarantee
Scheme is a “People‟s Act” in several senses. The Act was
prepared through a wide range of consultation with people‟s
organizations. Second, the Act addresses itself chiefly to working
people and their fundamental right to life with dignity. Third, the Act
empowers ordinary people to play an active role in the implementation
of employment guarantee schemes through Gram Sabhas, social
audits, participatory planning and other means. More than any other
law, MGNREGA is an Act of the people, by the people and for the
people. During the financial year 2020-21 an amount of Rs. 5288.55
crores is available and utilized 5232.78, 99% achieved. Against target
of 1700 lakh man days 1911.70 lakh man days has been achieved i.e.
112%.
2. Deendayal Antyodaya Yojana- National Rural Livelihoods Mission (DAY- NRLM)-
Deendayal Antyodaya Yojana- National Rural Livelihoods
Mission(DAY-NRLM) is a new strategy of poverty alleviation woven
around community based institutions having primary objective is to
reduce poverty by promoting diversified and gainful and skilled wage
employment opportunities, resulting in appreciable increase in their
incomes, on a sustainable basis through building strong grassroots
institutions of the poor.
The core belief of National Rural Livelihoods Mission (NRLM) is that
the poor have innate capabilities and a strong desire to come out of
poverty. The challenge is to unleash their capabilities to generate
meaningful livelihoods and enable them to come out of poverty. NRLM
focuses on universal inclusion of the poor, prioritizing the poorest of the
poor, identified through participatory processes and converted into
institutions of the poor that are supported to leverage formal credit and
access services and benefits meant for the poor,
as well as develop innovative community led interventions leading to
sustainable livelihoods and improved quality of life.
In our State Odisha Livelihoods Mission (OLM) a registered society
under the aegis of Panchayati Raj and Drinking Water Department of
Government of Odisha is the nodal agency for implementing the
scheme with the mandate to reach out to all poor households, link them
to sustainable livelihoods opportunities and nurture them till they come
out of poverty and enjoy a decent quality of life. Funding pattern of the
program is 60:40. During the financial year 2020-21 Rs.728.44 crore is
available and utilized 591.70, i.e. 81%. Against target of 254250 no. of
SHGs achievement made 225619 i.e. 89 %.
3. Deen Dayal Upadhyaya Grameen Kaushalya Yojana (DDU-GKY)-
Deen Dayal Upadhyaya Grameen Kaushalya Yojana (DDU-GKY)
aims to skill rural youth between the ages of 15 and 35 years who are
poor and provide them with jobs having regular monthly wages at or
above the minimum wages. It is one of the cluster of initiatives of the
Ministry of Rural Development, Government of India that seeks to
promote rural livelihoods. It is a part of the National Rural Livelihood
Mission (NRLM) -the Mission for poverty reduction under Deen Dayal
Antodaya Yojana (DAY). The programme is tasked with the dual
objectives of adding diversity to the incomes of rural poor families and
cater to the career aspirations of rural youth. In our State Odisha Rural
Development and Marketing Society (ORMAS) registered society under
the aegis of Panchayati Raj and Drinking Water Department of Govt. of
Odisha is the nodal agency for implementing the scheme.
4. Pradhan Mantri Awas Yojana-Gramin (PMAY-G)-
The Pradhan Mantri Awas Yojana-Gramin (PMAYG) was formed to
meet the objectives of the „'Housing for All‟' scheme by the year 2022. It
is a rural housing program that aims to provide a 25-square meter
pucca house which also includes basic amenities to beneficiaries of the
scheme.
Continue Next Page

B
The houses are disaster-resilient, low cost, and take into
consideration the socio-cultural and geo-climatic factors. During
financial year 2020-21 total funds available 5182.04 and incurring
expenditure made 4124.95 i.e. 80%, similarly physical target 12,64,041
achievement 3,59,184 i.e. 28%.
The scheme was launched in January 1996 as Indira Awaas
Yojana. It was restructured in April 2016 as PMAYG (iay.nic.in).
5. Biju Pucca Ghar Yojana(BPGY)-
Biju Pucca Ghar Yojana is the State‟s own flagship programme. The
scheme was launched during the financial year, 2014-15 replacing the
old scheme “MO-KUDIA YOJANA” with a view to achieving the
objective of converting all the kutcha houses to pucca houses.
6. Nirman Shramik Pucca Ghar Yojana (NSPGY)-
In an attempt to cover more number of construction workers under a
housing scheme, the state government has revised the guidelines
for Nirman Shramik Pucca Ghar Yojana (NSPGY). Labour and
Employees‟ State Insurance department has issued the revised
guidelines after the approval of Chief Minister an official told.
7. Buxi Jagabandhu Assured Water Supply to Habitations (BASUDHA)-
The Chief Minister of Odisha Sri Naveen Patnaik launched the Buxi
Jagabandhu Assured Water Supply to Habitations (BASUDHA)
Scheme in 2017-18.The objective of the scheme is to provide safe and
adequate water through piped water Supply Systems to every rural
household. The drinking, cooking and other domestic needs will be met
through an enhanced supply of 70 LPCD (litre per capita per day).
The scheme also focuses on enhancing water quality and empowering
community for ownership of water assets to ensure operation and
maintenance sustainability.
8. Jal Jeevan Mission (JJM) -
Jal Jeevan Mission (JJM) launched in 2019-20 aims to provide a
functional household Tap Connection (FHTC) to every household and
achieving drinking water security.
JJM focuses on management of water at the lowest appropriate level
through decentralized integrated water resource management by the
Gram Panchayats, with a key focus on water conservation, source
sustainability and rainwater storage.
The broad components of JJM are.
Development of village piped water supply infrastructure to provide
tap water connection to every rural household.
Development of reliable drinking water sources and/ or
augmentation of existing sources to provide long-term sustainability of
water supply system.
Retrofitting of completed and ongoing schemes to provide FHTCs at
minimum service level of 55 lpcd.
Emphasis on IEC, HRD, training, development of utilities, water
quality laboratories, water quality testing & surveillance, R&D,
knowledge centre, capacity building of communities, etc.
9. Swachh Bharat Mission (Gramin) –
The Swachh Bharat Mission (Grameen) was launched on 2nd
October 2014, with an aim to provide safety, security and
convenience, especially for women and children, by eliminating the
habit of open defecation across the country and achieve Open
Defecation Free (ODF) villages. During the Phase-I of the programme,
more than 66 lakh eligible beneficiaries from rural Odisha were
provided with Individual Household Latrines (IHHLs) ensuring 100%
sanitation coverage as per the Government of India‟s Baseline list of
beneficiaries in Odisha. By October 2019, all villages across the state,
and consequently all 30 districts, had declared themselves as ODF.
The Phase-II of the SBM (G) programme was launched by the
Government of India in April 2020, aiming at sustaining the ODF
status of villages, along with focusing on Solid and Liquid Waste
Management in rural India, targeting ODF Plus status of all villages
of the country. This programme is targeted to be taken in a mission
mode during 2024-25.
Continue Next Page

C
10. Rural Infrastructure Development Fund (RIDF)-
Rural Infrastructure Development Fund (RIDF) was set up by the
Government in 1995-96 for financing ongoing rural Infrastructure
projects. The Fund is maintained by the National Bank for Agriculture
and Rural Development (NABARD).
11. 15th Central Finance Commission-
The 15th Central Finance Commission have submitted the interim
report for the year 2020-21 keeping fund allocation of Rs.2258.00
crore to be shared in a ratio of 70:20:10 in favour of the Gram
Panchayat, Panchayat Samiti and Zillar Parishad respectively. The
Commission also recommended 10% of additional allocation for the
TSP area GPs.
Out of the fund allocation of Rs.2258.00 crore, 50% is earmarked as Basic Untied Grant and remaining 50% is earmarked as Basic Tied Grant.
The basic Untied Grant is to be used as per need based of the locality with approval of the rural Local Bodies.
The basic Tied Grant is meant for the PRIs to be used for providing the basic services like supply of drinking water, sanitation and maintenance of open defecation free (ODF) status, solid waste management, rain water harvesting and water recycling.
The basic Tied fund will be used by the DWSC as per approval and
need based to cover all the above essential services.
12. 5th State Finance Commission –
The 5th State Finance commission have submitted the interim report
to be carried out from 2020-21 to 2025-26 with total fund allocation of
Rs.5490.54 crore. The fund sharing pattern is 60:30:10 in favour of the
Gram Panchayat, Panchayat Samiti and Zilla Parishad respectively
which will be distributed basing on the population criteria of the GPs in
4 categories i.e. 0 – 5000, 5001 – 7500, 7501 – 10000 and Above
10000.
25% of extra fund allocation is earmarked for the TSP areas GPs.
The Untied Grants can be used for location specific felt needs except salary or other establishment expenditure and
the Tied Grants can be used for the basic services like sanitation and maintenance of open defecation free (ODF) status, supply of drinking water, rain water harvesting and water recycling.
At the Block level, it has been proposed that 50% of the fund is to be used as untied fund and remaining 50% as Tied fund.
Besides the GPs, the PS and ZPs have also been advised to take up
drinking water projects, maintenance of Govt. Higher Secondary
Schools , Maintenance of SDH , DHH .payment of energy bills,
payment of honorarium of the SEMs and other need based
community driven projects as to be decided by the Zilla Parishad.
Preparation of GPDP, PFMS integrated with PFMs interface payment online audit are mainly suggested by the commission to be properly monitored.
13. District Mineral Foundation (DMF)-
In Section 9B of the Mines and Minerals (Development and
Regulation) Act, 1957 provides for establishment of a District Mineral
Foundation Trust by the State Government, a non-profit body, with an
objective to work for the interest and benefit of persons, and areas
affected by mining related operations in such manner as may be
prescribed by the State Government, and WHEREAS the SETTLOR for
this purpose has decided to set up a trust as an entity under the State
Government for “no profit” and for playing an important role for common
good of the community and for using the fund of the trust for the interest
and benefit of persons, and areas affected by mining related operations
in such manner as may be prescribed by the State Government.
14. Gopabandhu Gramin Yojajana (GGY)-
A new initiative called Gopabandhu Gramin Yojana (GGY) was
launched by the Government of Odisha during 2006-07 with a view to
provide additional developmental assistance to the targeted 11(Eleven)
districts of the State not covered under the Backward Regions Grant
Fund (BRGF). Due to inclusion of Bargarh district under BRGF Scheme
during 2012-13, the number of districts has been reduced to 10. With
this Scheme, Rural Connectivity and quality of rural life has undergone
tremendous change. Most of rural roads in the targeted districts have
been covered.
Continue Next Page

D
In order to further strengthen rural connectivity, both inter village
and intra village, in the targeted districts during the 12th Plan Period
with due importance to electrification and water supply, these revised
comprehensive guideline & are hereby issued. The GGY scheme is
being implemented in the following 10 number of districts.
15. National Rurban Mission (NRuM)-
The Shyama Prasad Mukherji Rurban Mission was conceived as
a scheme in the year 2016 within Ministry of Rural Development, with
the vision of developing Clusters of villages that preserve the essence
of rural life and does not compromise on the provisions that are
essentially urban in nature thus creating a Rurban cluster. It serves the
objective to stimulate local economic development, enhance basic
services and create well planned Rurban cluster. The scheme desires
to work for 21 components, that serves at household, village as well as
cluster level. The scheme aims to provide critical gap fund to the
existing schemes so as to meet the gap of infrastructural as well as
economic development within the selected clusters. And also takes up
projects in Convergence for the purpose of monitoring and better
implementation in the selected clusters. The selection of the desired
clusters has been done in accordance to the guidelines issued by the
Govt. Of India, and stands approved by the Empowered Committee at
Ministry level. For each cluster an Integrated Cluster Action Plan was
developed emphasizing on socio-economic planning and spatial
planning.
National Rurban Mission in Odisha has been implemented in
phased manner. With 14 clustersbeing selected in Phase 1, 2 and 3,
have been implementing the scheme to achieve cluster based
development. The clusters are divided into Tribal and Non-tribal with a
CGF (Critical Gap Fund) budget of 15 Cr. and 30 Cr. respectively. The
money for the clusters are disbursed in installments as per the
prerequisites of the MoRD.
And complementing it is the state share for every installment.
Combining both meets the required sum of money designated to
each cluster for taking up activities as planned. For Odisha, Rurban
has successfully been able to identify the clusters and complete their
Integrated Action Plans(ICAP) with proper consultation and approval
of all stakeholders. Accordingly, the Detail Project Report(DPR) has
been completed for all cluster and approved by the State Level
Empowered Committee chaired by the Chief Secretary to
Government of Odisha. Rurban Odisha has also been able to
complete notified planning of all 14 clusters and their respective
Spatial Plan is under process.
National Rurban Mission has marked its presence at cluster level with
many works being taken up including Connectivity through Roads
and provision of drain within the village and as source of connection
between all villages and panchayats within the cluster. Provision of
Piped Water Supply, Solar street lights, Rest shades, market
complexes, market pindis, digital classrooms and libraries, boundary
walls with nutrition gardens, milk collection centers etc. has been
made within the clusters. Apart from the infrastructural support, there
is enough thrust on economic activities within the clusters like
mushroom cultivation units, lemon grass oil, stitching units, dal and
maize processing units, hill broom and sabai grass unit, tamarind
processing unit etc., to name a few. This is to be done in technical
partnership with Odisha Rural Development and Marketing Society,
with an aim to economically strengthen the clusters under Rurban.
The scheme has been able to successfully complete an expenditure
in CGF of Rs.95.45 Cr out of sanctioned Rs.144 Cr. and aims to
complete the works for remaining work by the end period of the
scheme.
*** Any suggestion or addition please mail us:- [email protected]

1
SCHEME-WISE STATE SUMMARY REPORT UPTO END OF FEBRUARY, 2021 DURING 2020-21
Sl. No.
Name of the schemes
FINANCIAL (RS. IN CRORE) PHYSICAL
O.B. as on
01.04.20 Receipts
Other Receipts
Total Funds
Available
Expenditure % of Exp.
Closing Balance
Target
ACHIEVEMENT % of Ach.
UNIT Up to end of January
During the month
Up to end of
February
Up to end of January
During the
month
Up to end of
February
1 2 3 4 5 6 7 8 9 10 11 12 13 14 15 16 17
1 MGNREGS 54.35 5234.15 0.05 5288.55 4841.90 390.88 5232.78 99 55.77 1700.00 1743.57 168.13 1911.70 112 Lakh Person days
2 NRLM 135.61 588.86 3.97 728.44 507.74 83.96 591.70 81 136.74 254250 185804 39815 225619 89 No. of SHGs Credit linked
3 DDU-GKY 189.36 68.91 11.49 269.76 113.03 1.00 114.03 42 155.73 31179 3466 1034 4500 14 No. of youth trained
4 P.M.A.Y (G) 5182.04 3743.19 381.76 4124.95 80 1057.09 1264041 314529 44655 359184 28 No. of Houses
5 BPGY 493.77 315.50 119.07 434.57 88 59.20 14258 4694 417 5111 36 No. of Houses
6 BPGY (TITIL) 50.33 26.86 3.15 30.01 60 20.32 5199 3146 185 3331 64 No. of Houses
7 BPGY (MINING) 43.51 25.80 0.00 25.80 59 17.71 1479 180 17 197 13 No. of Houses
8 NSPGY 64.82 47.67 3.14 50.81 78 14.01 6011 4093 159 4252 71 No. of Houses
9 JJM 2240.00 810.72 63.62 874.34 39 1365.66 450 354 39 393 87
10 BASUDHA 2500.00 614.57 58.69 673.26 27 1826.74 650 551 38 589 91
11 RIDF 750.00 622.93 63.80 686.73 92 63.27 110 68 3 71 65 No. of PWS
12 4TH SFC(Mega PWS) 135.00 44.08 0.00 44.08 33 90.92 7 0 0 0 0
13 OMBADC 2732.10 1032.28 182.52 1214.80 44 1517.30 14 1 0 1 7
14 DMF 1319.48 423.63 236.75 660.38 50 659.10 476 106 0 106 22
TOTAL DRINKING WATER 9676.58 3548.21 605.38 4153.59 43 5522.99 1707 1080 80 1160 68
15 SBM (G) 619.70 599.27 15.21 614.48 99 5.22 244293 252370 116 252486 103 No of IHHL
16 GGY 143.40 8.09 3.27 154.76 60.09 4.20 64.29 42 90.47 6912 3632 317 3949 57 No. of Projects
17 14th CFC 2879.97 0.00 2.47 2882.44 1708.90 93.21 1802.11 63 1080.33 52498 24880 860 25740 49 No. of Projects
18 15th CFC 0.00 1693.47 0.00 1693.47 109.85 56.49 166.34 10 1527.13 0 0 0 0 0
19 4th SFC 1293.78 0.47 0.06 1294.31 280.73 16.11 296.84 23 997.47 17833 8582 538 9120 51 No. of Projects
20 4th Non-CFC/ SFC 163.24 0.00 0.00 163.24 16.84 1.52 18.36 11 144.88 871 216 25 241 28 No. of Projects
21 RGSA 18.22 1.00 0.58 19.80 9.54 0.00 9.54 48 10.26 163 117 0 117 72 No. of Building
22 RGSA(CB) 9.76 0.00 0.00 9.76 7.03 0.16 7.19 74 2.57 36700 34606 2200 36806 100 No. of Participants
23 NRuM 300.00 106.81 3.53 110.34 37 189.66 0 0
24 CDPTF 154.55 109.20 0.83 110.03 71 44.52 1747 1472 11 1483 85 No. of Projects
25 AGAB 1554.69 1126.97 27.16 1154.13 74 400.56 62747 44741 1133 45874 73 No. of Projects
26 LPG Connections in Primary & U.P. School
0.00 0.00 0.00 47177 42210 0 42210 89 No. of LPG Connection
27 Kitchen Sheds in Primary & Upper Primary School
0.00 0.00 0.00 44490 44490 0 44490 100 No. of Kitchen Shed
G. TOTAL 4887.69 7594.95 21.89 30644.52 17305.13 1806.76 19111.89 62.37 11532.63
BUDGET ESTIMATE SUPPLIMENTARY TOTAL RELEASE Balance Expenditure %
28 PLAN 13011.33 2041.34 15052.67 11431.23 3621.44 9517.44 63
29 SFCTLBS 4846.78 4.77 4851.55 4017.80 833.74 3377.37 70
30 RWSS 247.74 0.00 247.74 247.74 0.00 190.37 77
31 PR&DW Admn. 5094.52 4.77 5099.29 4265.56 833.73 3567.74 70
TOTAL 23200.37 2050.88 25251.25 19962.33 5288.91 16652.92 66

2
Sanitation, 2.02 GGY, 0.51
14th CFC, 9.41 15th CFC, 5.53
4th SFC, 4.22
RGSA, 0.10
CDPTF, 0.50
4th Non-CFC/SFC, 0.53
AGAB, 5.07
NRuM, 0.98
MGNREGS, 17.26
NRLM, 2.38 DDU-GKY, 0.88
PMAY(G), 16.91
BPGY, 1.61
BPGY (TITILI), 0.16
BPGY(Mining), 0.14
Drinking Water, 31.58
NSPGY, 0.21
% of Funds Available under different Schemes to TFA
PMAY (G), 21.77
DDU-GKY, 0.66
NRLM, 2.95
MGNREGS, 28.16
NRuM, 0.62 AGAB, 6.55 CDTF, 0.64
RGSA, 0.10
4th Non CFC/SFC, 0.10
4th SFC, 1.63
14th CFC, 9.94 GGY, 0.35
Sanitation, 3.49
BPGY (Mining), 0.15
BPGY (TITILI), 0.16
Drinking Water, 20.63
NSPGY, 0.28
BPGY, 1.83
% of Expenditure under different Schemes to total Expenditure

3
Comparison of Scheme-wise Achievement of February 2021 for the year 2020-21 and the same month of the corresponding period 2019-20
Sl. No.
SCHEME
FINANCIAL (Rs. in Crore) PHYSICAL
Up to February 2020 during 2019-20
Up to February 2021 during 2020-21
Up to February 2020 during 2019-20
Up to February 2021 during 2020-21 UNIT
TFA EXP. % TFA EXP. % Target Ach. % Target Ach. %
1 2 3 4 5 6 7 8 9 10 11 12 13 14 15
1 MGNREGS 2221.04 2439.79 110 5288.55 5232.78 99 1000.00 949.09 95 1700.00 1911.70 112 Lakh Person days 2 NRLM 452.58 417.95 92 728.44 591.70 81 164650 173200 105 254250 225619 89 No. of SHGs Credit linked 3 DDU-GKY 346.70 182.79 53 269.76 114.03 42 50000 39606 79 31179 4500 14 No. of youth trained 4 DRINKING WATER 6670.69 3522.31 53 9676.58 4153.59 43 2854 1125 39 1707 1160 68 NRDWP (PWS-Ongoing) 5 SANITATION 1847.70 1839.65 100 619.70 614.48 99 2011727 1263392 63 244293 252486 103 IHHL 6 P.M.A.Y (G) 5557.75 4641.99 84 5182.04 4124.95 80 756337 300682 40 126401 359184 284 No. of Houses 7 BIJU PUCCA GHAR YOJANA 1210.01 338.57 28 493.77 434.57 88 30192 14540 48 14258 5111 36 No. of Houses 8 BPGY (TITIL) 148.81 95.12 64 50.33 30.01 60 13105 6835 52 5199 3331 64 No. of Houses
9 BIJU PUCCA GHAR YOJANA (MINING)
51.80 2.48 5 43.51 25.80 59 3343 1710 51 1479 197 13 No. of Houses
10 NIRMAN SHRAMIK PUCCA GHARA YOJANA
199.79 133.73 67 64.82 50.81 78 17092 10056 59 6011 4252 71 No. of Houses
11 GGY 346.42 201.84 58 154.76 64.29 42 17491 12183 70 6912 3949 57 No. of works 12 14TH FINANCE COMMISSION 4367.54 1065.67 24 2882.44 1802.11 63 68022 34493 51 52498 25740 49 No. of projects 13 15TH FINANCE COMMISSION 0.00 0.00 0 1693.47 166.34 10 0 0 0 0 0 0 No. of projects 14 4TH SFC 1995.44 526.87 26 1294.31 296.84 23 26886 14769 55 17833 9120 51 No. of projects 15 4TH NON-CFC/ SFC 177.96 33.06 19 163.24 18.36 11 1476 751 51 871 241 28 No. of projects 16 RGSA 10.67 1.72 16 19.80 9.54 48 50 0 0 163 117 72 No. of Building 17 RGSA (CB) 19.86 19.26 97 9.76 7.19 74 62635 64027 102 36700 36806 100 No. of Building 18 NRuM 300.00 79.71 27 300.00 110.34 37 0 0
19 CONCRETE DRYING -CUM- TRESSING FLOOR (CDPTF)
145.53 93.56 64 154.55 110.03 71 1555 1244 80 1747 1483 85 No. of Projects
20 AMA GAON AMA BIKASH 1559.79 888.84 57 1554.69 1154.13 74 62743 33656 54 62747 45874 73 No. of Projects
21 LPG CONNECTIONS IN PRIMARY & U.P. SCHOOL
0 0 No. of LPG Connection
22 KITCHEN SHEDS IN PRIMARY & UPPER PRIMARY SCHOOL
0 0 No. of Kitchen Shed
TOTAL 27630.08 16524.91 60 30644.52 19111.89 62 - - - - -

4
MPR on Tribal Sub-Plan Area Districts up to the Month of February - 2021 during the Financial Year 2020-21
Sl. No.
Programme No. of Blocks
Financial (Rs. in lakh) Physical
Total Funds Available
Expenditure % of
Expenditure Target /
Taken up Ach.
% of Achievement
Unit
1 2 3 4 5 6 7 8 9 10
1 NRLM 118 19367.94 15747.17 81.31 70643 60586 85.76 No. of SHGs credit
2 MGNREGS 118 227380.01 239027.38 105.12 640.69 885.59 138.22 Lakh Persondays
3 GGY 118 11044.80 1838.22 16.64 3137 1003 31.97 No. of works

5
FINANCIAL AND PHYSICAL ACHIEVEMENT UNDER DIFFERENT SCHEMES DURING 2020-21
DISTRICT - ANGUL UP TO END OF FEBRUARY 2021
Sl. No.
Name of the
schemes
O.B. AS ON
01.04.20
FINANCIAL (Rs.IN LAKH) PHYSICAL
Receipts Other
Receipts
Total
Funds
Available
Exp. % of
Exp.
Closing
Balance Target
Achieve
ment
% of
Ach. Unit
1 2 3 4 5 6 7 8 9 10 11 12 13
1 MGNREGS -273.69 12302.07 0.00 12028.38 12302.61 102 -274.23 38.53 44.20 115 Lakh Person days
2 NRLM 0.00 3316.73 0.00 3316.73 3321.55 100 -4.82 10365 9930 96 No. of SHGs
3 GGY 196.68 0.00 0.00 196.68 0.00 0 196.68 0 0 0 No. of Projects
4 RGSA 218.00 0.00 0.00 218.00 215.27 99 2.73 5 0 0 No. of Buildings
5 14th FINANCE COMMISSION
8397.24 0.00 0.00 8397.24 5115.34 61 3281.89 1647 844 51 No. of Projects
6 4th SFC 5058.24 0.00 0.00 5058.24 1667.48 33 3390.76 839 560 67 No. of Projects
7 NON CFC/NON SFC 445.51 0.00 0.00 445.51 12.40 3 433.11 7 0 0 No. of Projects
G. TOTAL 14041.98 15618.80 0.00 29660.78 22634.66 76 7026.12
FINANCIAL AND PHYSICAL ACHIEVEMENT UNDER DIFFERENT SCHEMES DURING 2020-21
DISTRICT - BALASORE UP TO END OF FEBRUARY 2021
Sl. No.
Name of the
schemes
O.B. AS ON
01.04.20
FINANCIAL (Rs.IN LAKH) PHYSICAL
Receipts Other
Receipts
Total
Funds
Available
Exp. % of
Exp.
Closing
Balance Target
Achieve
ment
% of
Ach. Unit
1 2 3 4 5 6 7 8 9 10 11 12 13
1 MGNREGS 428.24 10414.74 0.00 10842.98 10415.71 96 427.27 31.52 37.48 119 Lakh Person days
2 NRLM 0.00 2553.65 0.00 2553.65 1628.52 64 925.13 16587 15063 91 No. of SHGs
3 GGY 547.75 0.00 0.00 547.75 207.93 38 339.82 228 207 91 No. of Projects
4 RGSA 243.00 0.00 0.00 243.00 0.00 0 243.00 6 6 100 No. of Buildings
5 14th FINANCE COMMISSION
21366.47 247.00 0.00 21613.47 10537.46 49 11076.00 3990 2001 50 No. of Projects
6 4th SFC 12373.71 0.00 0.00 12373.71 1314.27 11 11059.44 918 383 42 No. of Projects
7 NON CFC/NON SFC 1119.67 0.00 0.00 1119.67 41.90 4 1077.77 18 4 22 No. of Projects
G. TOTAL 36078.84 13215.39 0.00 49294.22 24145.79 49 25148.43

6
FINANCIAL AND PHYSICAL ACHIEVEMENT UNDER DIFFERENT SCHEMES DURING 2020-21
DISTRICT - BARAGARH UP TO END OF FEBRUARY 2021
Sl. No.
Name of the
schemes
O.B. AS ON
01.04.20
FINANCIAL (Rs.IN LAKH) PHYSICAL
Receipts Other
Receipts
Total
Funds
Available
Exp. % of
Exp.
Closing
Balance Target
Achieve
ment
% of
Ach. Unit
1 2 3 4 5 6 7 8 9 10 11 12 13
1 MGNREGS -297.50 16652.26 0.00 16354.76 16653.83 102 -299.07 44.21 51.40 116 Lakh Person days
2 NRLM 0.00 2074.51 0.00 2074.51 1205.39 58 869.12 6284 4766 76 No. of SHGs
3 GGY 182.58 0.00 0.00 182.58 121.76 67 60.82 92 26 28 No. of Projects
4 RGSA 0.00 0.00 0.00 0.00 0.00 0.00 0 0 No. of Buildings
5 14th FINANCE COMMISSION
6997.98 0.00 0.00 6997.98 4847.73 69 2150.25 398 256 64 No. of Projects
6 4th SFC 4123.45 22.88 0.00 4146.33 1803.17 43 2343.16 1063 592 56 No. of Projects
7 NON CFC/NON SFC 272.95 0.00 0.00 272.95 35.00 13 237.95 3 3 100 No. of Projects
G. TOTAL 11279.46 18749.65 0.00 30029.11 24666.88 82 5362.23
FINANCIAL AND PHYSICAL ACHIEVEMENT UNDER DIFFERENT SCHEMES DURING 2020-21
DISTRICT - BHADRAK UP TO END OF FEBRUARY 2021
Sl. No.
Name of the
schemes
O.B. AS ON
01.04.20
FINANCIAL (Rs.IN LAKH) PHYSICAL
Receipts Other
Receipts
Total
Funds
Available
Exp. % of
Exp.
Closing
Balance Target
Achieve
ment
% of
Ach. Unit
1 2 3 4 5 6 7 8 9 10 11 12 13
1 MGNREGS -294.79 8187.29 0.00 7892.50 8186.93 104 -294.43 27.24 30.66 113 Lakh Person days
2 NRLM 0.00 2088.63 0.00 2088.63 2882.52 138 -793.90 11574 10929 94 No. of SHGs
3 GGY 19.43 0.00 0.00 19.43 15.59 80 3.84 446 8 2 No. of Projects
4 RGSA 6.00 0.00 0.00 6.00 0.00 0 6.00 0 0 No. of Buildings
5 14th FINANCE COMMISSION
18592.38 0.00 0.00 18592.38 5822.43 31 12769.94 5538 3662 66 No. of Projects
6 4th SFC 5798.30 0.00 0.00 5798.30 1681.25 29 4117.05 859 629 73 No. of Projects
7 NON CFC/NON SFC 384.84 0.00 0.00 384.84 4.00 1 380.84 2 0 0 No. of Projects
G. TOTAL 24506.16 10275.92 0.00 34782.07 18592.73 53 16189.35
7
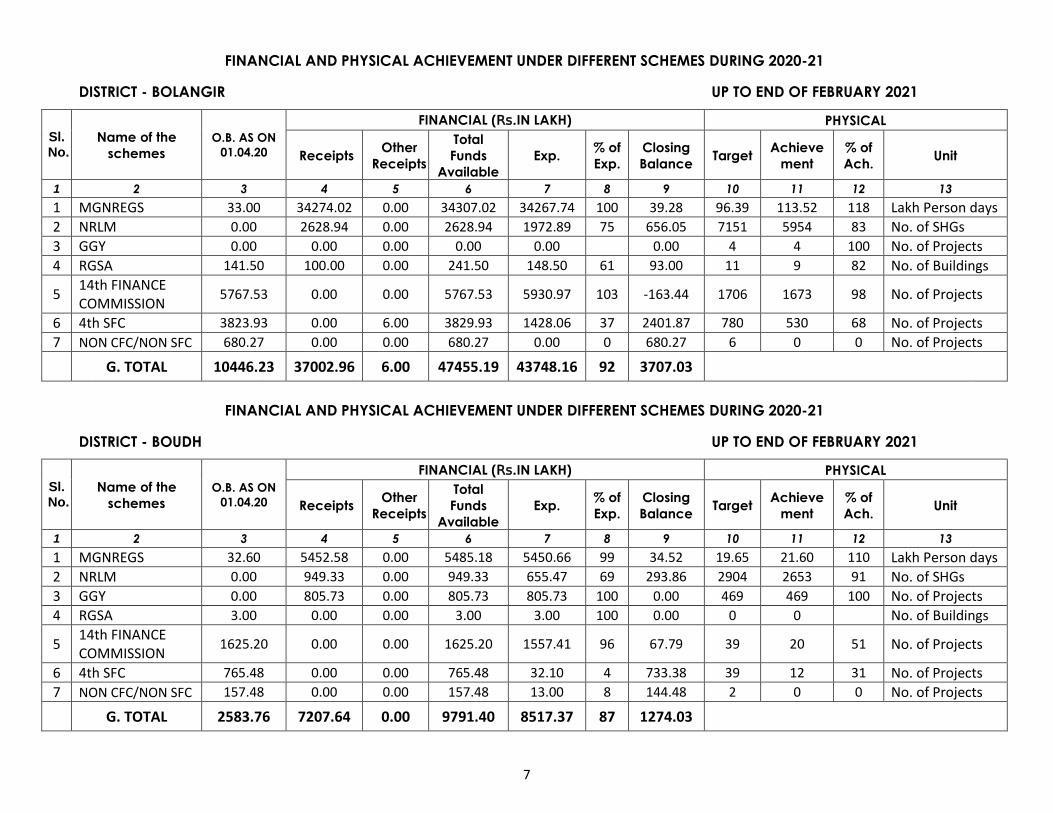
FINANCIAL AND PHYSICAL ACHIEVEMENT UNDER DIFFERENT SCHEMES DURING 2020-21
DISTRICT - BOLANGIR UP TO END OF FEBRUARY 2021
Sl. No.
Name of the
schemes
O.B. AS ON
01.04.20
FINANCIAL (Rs.IN LAKH) PHYSICAL
Receipts Other
Receipts
Total
Funds
Available
Exp. % of
Exp.
Closing
Balance Target
Achieve
ment
% of
Ach. Unit
1 2 3 4 5 6 7 8 9 10 11 12 13
1 MGNREGS 33.00 34274.02 0.00 34307.02 34267.74 100 39.28 96.39 113.52 118 Lakh Person days
2 NRLM 0.00 2628.94 0.00 2628.94 1972.89 75 656.05 7151 5954 83 No. of SHGs
3 GGY 0.00 0.00 0.00 0.00 0.00 0.00 4 4 100 No. of Projects
4 RGSA 141.50 100.00 0.00 241.50 148.50 61 93.00 11 9 82 No. of Buildings
5 14th FINANCE COMMISSION
5767.53 0.00 0.00 5767.53 5930.97 103 -163.44 1706 1673 98 No. of Projects
6 4th SFC 3823.93 0.00 6.00 3829.93 1428.06 37 2401.87 780 530 68 No. of Projects
7 NON CFC/NON SFC 680.27 0.00 0.00 680.27 0.00 0 680.27 6 0 0 No. of Projects
G. TOTAL 10446.23 37002.96 6.00 47455.19 43748.16 92 3707.03
FINANCIAL AND PHYSICAL ACHIEVEMENT UNDER DIFFERENT SCHEMES DURING 2020-21
DISTRICT - BOUDH UP TO END OF FEBRUARY 2021
Sl. No.
Name of the
schemes
O.B. AS ON
01.04.20
FINANCIAL (Rs.IN LAKH) PHYSICAL
Receipts Other
Receipts
Total
Funds
Available
Exp. % of
Exp.
Closing
Balance Target
Achieve
ment
% of
Ach. Unit
1 2 3 4 5 6 7 8 9 10 11 12 13
1 MGNREGS 32.60 5452.58 0.00 5485.18 5450.66 99 34.52 19.65 21.60 110 Lakh Person days
2 NRLM 0.00 949.33 0.00 949.33 655.47 69 293.86 2904 2653 91 No. of SHGs
3 GGY 0.00 805.73 0.00 805.73 805.73 100 0.00 469 469 100 No. of Projects
4 RGSA 3.00 0.00 0.00 3.00 3.00 100 0.00 0 0 No. of Buildings
5 14th FINANCE COMMISSION
1625.20 0.00 0.00 1625.20 1557.41 96 67.79 39 20 51 No. of Projects
6 4th SFC 765.48 0.00 0.00 765.48 32.10 4 733.38 39 12 31 No. of Projects
7 NON CFC/NON SFC 157.48 0.00 0.00 157.48 13.00 8 144.48 2 0 0 No. of Projects
G. TOTAL 2583.76 7207.64 0.00 9791.40 8517.37 87 1274.03

8
FINANCIAL AND PHYSICAL ACHIEVEMENT UNDER DIFFERENT SCHEMES DURING 2020-21
DISTRICT - CUTTACK UP TO END OF FEBRUARY 2021
Sl. No.
Name of the
schemes
O.B. AS ON
01.04.20
FINANCIAL (Rs.IN LAKH) PHYSICAL
Receipts Other
Receipts
Total
Funds
Available
Exp. % of
Exp.
Closing
Balance Target
Achieve
ment
% of
Ach. Unit
1 2 3 4 5 6 7 8 9 10 11 12 13
1 MGNREGS 414.46 9926.24 0.00 10340.70 9928.33 96 412.37 33.08 35.39 107 Lakh Person days
2 NRLM 0.00 3050.08 0.00 3050.08 2787.75 91 262.32 17049 13266 78 No. of SHGs
3 GGY 242.11 0.00 0.00 242.11 55.12 23 186.99 274 206 75 No. of Projects
4 RGSA 264.00 0.00 58.00 322.00 0.00 0 322.00 1 0 0 No. of Buildings
5 14th FINANCE COMMISSION
16483.48 0.00 0.00 16483.48 8062.07 49 8421.41 1824 1463 80 No. of Projects
6 4th SFC 11623.06 0.00 0.00 11623.06 1333.84 11 10289.22 785 490 62 No. of Projects
7 NON CFC/NON SFC 1247.89 0.00 0.00 1247.89 97.00 8 1150.89 37 12 32 No. of Projects
G. TOTAL 30275.00 12976.32 58.00 43309.32 22264.11 51 21045.21
FINANCIAL AND PHYSICAL ACHIEVEMENT UNDER DIFFERENT SCHEMES DURING 2020-21
DISTRICT - DEOGARH UP TO END OF FEBRUARY 2021
Sl. No.
Name of the
schemes
O.B. AS ON
01.04.20
FINANCIAL (Rs.IN LAKH) PHYSICAL
Receipts Other
Receipts
Total
Funds
Available
Exp. % of
Exp.
Closing
Balance Target
Achieve
ment
% of
Ach. Unit
1 2 3 4 5 6 7 8 9 10 11 12 13
1 MGNREGS -82.30 5947.50 0.00 5865.20 5947.44 101 -82.24 22.22 23.78 107 Lakh Person days
2 NRLM 0.00 1602.76 0.00 1602.76 985.57 61 617.18 3820 3207 84 No. of SHGs
3 GGY 23.19 0.00 0.00 23.19 0.00 0 23.19 0 0 No. of Projects
4 RGSA 3.00 0.00 0.00 3.00 0.00 0 3.00 0 0 No. of Buildings
5 14th FINANCE COMMISSION
2216.10 0.00 0.00 2216.10 1788.33 81 427.77 489 89 18 No. of Projects
6 4th SFC 456.53 0.00 0.00 456.53 45.00 10 411.53 74 10 14 No. of Projects
7 NON CFC/NON SFC 395.16 0.00 0.00 395.16 62.50 16 332.66 14 0 0 No. of Projects
G. TOTAL 3011.68 7550.26 0.00 10561.94 8828.85 84 1733.09

9
FINANCIAL AND PHYSICAL ACHIEVEMENT UNDER DIFFERENT SCHEMES DURING 2020-21
DISTRICT - DHENKANAL UP TO END OF FEBRUARY 2021
Sl. No.
Name of the
schemes
O.B. AS ON
01.04.20
FINANCIAL (Rs.IN LAKH) PHYSICAL
Receipts Other
Receipts
Total
Funds
Available
Exp. % of
Exp.
Closing
Balance Target
Achieve
ment
% of
Ach. Unit
1 2 3 4 5 6 7 8 9 10 11 12 13
1 MGNREGS 19.03 19795.81 5.00 19819.84 19788.73 100 31.11 66.39 73.63 111 Lakh Person days
2 NRLM 0.00 1806.43 0.00 1806.43 1283.96 71 522.48 7605 6646 87 No. of SHGs
3 GGY 0.01 0.00 0.00 0.01 0.00 0 0.01 0 0 No. of Projects
4 RGSA 3.00 0.00 0.00 3.00 0.00 0 3.00 0 0 No. of Buildings
5 14th FINANCE COMMISSION
3544.83 0.00 0.00 3544.83 3943.33 111 -398.50 1109 1005 91 No. of Projects
6 4th SFC 2979.67 0.00 0.00 2979.67 1982.36 67 997.31 648 498 77 No. of Projects
7 NON CFC/NON SFC 287.82 0.00 0.00 287.82 193.27 67 94.55 39 25 64 No. of Projects
G. TOTAL 6834.36 21602.24 5.00 28441.60 27191.65 96 1249.96
FINANCIAL AND PHYSICAL ACHIEVEMENT UNDER DIFFERENT SCHEMES DURING 2020-21
DISTRICT - GAJAPATI UP TO END OF FEBRUARY 2021
Sl. No.
Name of the
schemes
O.B. AS ON
01.04.20
FINANCIAL (Rs.IN LAKH) PHYSICAL
Receipts Other
Receipts
Total
Funds
Available
Exp. % of
Exp.
Closing
Balance Target
Achieve
ment
% of
Ach. Unit
1 2 3 4 5 6 7 8 9 10 11 12 13
1 MGNREGS -776.13 12945.98 0.00 12169.85 12938.76 106 -768.91 46.69 46.92 100 Lakh Person days
2 NRLM 0.00 2117.25 0.00 2117.25 1844.09 87 273.16 4265 4133 97 No. of SHGs
3 GGY 146.31 0.00 0.00 146.31 133.37 91 12.94 53 50 94 No. of Projects
4 RGSA 55.12 0.00 0.00 55.12 45.65 83 9.47 1 0 0 No. of Buildings
5 14th FINANCE COMMISSION
5577.54 0.00 0.00 5577.54 4248.75 76 1328.79 545 240 44 No. of Projects
6 4th SFC 1832.57 0.00 0.00 1832.57 456.85 25 1375.72 301 104 35 No. of Projects
7 NON CFC/NON SFC 163.48 0.00 0.00 163.48 41.45 25 122.03 25 10 40 No. of Projects
G. TOTAL 6998.89 15063.23 0.00 22062.12 19708.92 89 2353.20

10
FINANCIAL AND PHYSICAL ACHIEVEMENT UNDER DIFFERENT SCHEMES DURING 2020-21
DISTRICT - GANJAM UP TO END OF FEBRUARY 2021
Sl. No.
Name of the
schemes
O.B. AS ON
01.04.20
FINANCIAL (Rs.IN LAKH) PHYSICAL
Receipts Other
Receipts
Total
Funds
Available
Exp. % of
Exp.
Closing
Balance Target
Achieve
ment
% of
Ach. Unit
1 2 3 4 5 6 7 8 9 10 11 12 13
1 MGNREGS -129.73 44343.43 0.00 44213.70 44331.40 100 -117.70 153.20 218.06 142 Lakh Person days
2 NRLM 0.00 2729.91 0.00 2729.91 3951.02 145 -1221.10 16074 16678 104 No. of SHGs
3 GGY 82.07 0.00 0.00 82.07 69.27 84 12.80 146 90 62 No. of Projects
4 RGSA 3.00 0.00 0.00 3.00 0.00 0 3.00 0 0 No. of Buildings
5 14th FINANCE COMMISSION
15277.34 0.00 0.00 15277.34 17068.15 112 -1790.80 6050 1502 25 No. of Projects
6 4th SFC 6067.03 0.00 0.00 6067.03 2438.00 40 3629.03 1041 693 67 No. of Projects
7 NON CFC/NON SFC 713.87 0.00 0.00 713.87 222.00 31 491.87 56 5 9 No. of Projects
G. TOTAL 22013.58 47073.34 0.00 69086.93 68079.83 99 1007.09
FINANCIAL AND PHYSICAL ACHIEVEMENT UNDER DIFFERENT SCHEMES DURING 2020-21
DISTRICT - JAGATSINGHPUR UP TO END OF FEBRUARY 2021
Sl. No.
Name of the
schemes
O.B. AS ON
01.04.20
FINANCIAL (Rs.IN LAKH) PHYSICAL
Receipts Other
Receipts
Total
Funds
Available
Exp. % of
Exp.
Closing
Balance Target
Achieve
ment
% of
Ach. Unit
1 2 3 4 5 6 7 8 9 10 11 12 13
1 MGNREGS -87.51 4292.09 0.00 4204.58 4291.09 102 -86.51 17.42 16.85 97 Lakh Person days
2 NRLM 0.00 2021.28 0.00 2021.28 2047.75 101 -26.47 8586 7450 87 No. of SHGs
3 GGY 93.33 0.00 0.00 93.33 30.49 33 62.84 78 32 41 No. of Projects
4 RGSA 2.00 0.00 0.00 2.00 2.00 100 0.00 1 0 0 No. of Buildings
5 14th FINANCE COMMISSION
9894.59 0.00 0.00 9894.59 4522.89 46 5371.70 1484 939 63 No. of Projects
6 4th SFC 11703.41 0.00 0.00 11703.41 1120.21 10 10583.20 818 721 88 No. of Projects
7 NON CFC/NON SFC 699.32 0.00 0.00 699.32 60.00 9 639.32 18 18 100 No. of Projects
G. TOTAL 22305.15 6313.37 0.00 28618.52 12074.43 42 16544.08

11
FINANCIAL AND PHYSICAL ACHIEVEMENT UNDER DIFFERENT SCHEMES DURING 2020-21
DISTRICT - JAJPUR UP TO END OF FEBRUARY 2021
Sl. No.
Name of the
schemes
O.B. AS ON
01.04.20
FINANCIAL (Rs.IN LAKH) PHYSICAL
Receipts Other
Receipts
Total
Funds
Available
Exp. % of
Exp.
Closing
Balance Target
Achieve
ment
% of
Ach. Unit
1 2 3 4 5 6 7 8 9 10 11 12 13
1 MGNREGS 19.43 10787.49 0.00 10806.92 10785.29 100 21.63 26.05 32.48 125 Lakh Person days
2 NRLM 0.00 1917.22 0.00 1917.22 1827.18 95 90.04 11794 11190 95 No. of SHGs
3 GGY 126.26 0.00 0.00 126.26 0.00 0 126.26 384 219 57 No. of Projects
4 RGSA 0.00 0.00 0.00 0.00 0.00 0.00 74 74 100 No. of Buildings
5 14th FINANCE COMMISSION
5051.82 0.00 0.00 5051.82 8017.56 159 -2965.74 431 375 87 No. of Projects
6 4th SFC 1147.38 20.90 0.00 1168.28 489.72 42 678.56 297 212 71 No. of Projects
7 NON CFC/NON SFC 1190.72 0.00 0.00 1190.72 22.00 2 1168.72 14 14 100 No. of Projects
G. TOTAL 7535.61 12725.61 0.00 20261.22 21141.75 104 -880.53
FINANCIAL AND PHYSICAL ACHIEVEMENT UNDER DIFFERENT SCHEMES DURING 2020-21
DISTRICT - JHARSUGUDA UP TO END OF FEBRUARY 2021
Sl. No.
Name of the
schemes
O.B. AS ON
01.04.20
FINANCIAL (Rs.IN LAKH) PHYSICAL
Receipts Other
Receipts
Total
Funds
Available
Exp. % of
Exp.
Closing
Balance Target
Achieve
ment
% of
Ach. Unit
1 2 3 4 5 6 7 8 9 10 11 12 13
1 MGNREGS -44.77 6164.87 0.00 6120.10 6158.86 101 -38.76 15.39 17.46 113 Lakh Person days
2 NRLM 0.00 996.01 0.00 996.01 778.59 78 217.41 2964 2603 88 No. of SHGs
3 GGY 44.66 0.00 0.00 44.66 11.50 26 33.16 22 1 5 No. of Projects
4 RGSA 3.00 0.00 0.00 3.00 0.00 0 3.00 0 0 No. of Buildings
5 14th FINANCE COMMISSION
3030.70 0.00 0.00 3030.70 1684.73 56 1345.97 564 187 33 No. of Projects
6 4th SFC 1681.57 3.41 0.00 1684.98 431.68 26 1253.30 241 55 23 No. of Projects
7 NON CFC/NON SFC 303.54 0.00 0.00 303.54 0.00 0 303.54 2 0 0 No. of Projects
G. TOTAL 5018.70 7164.29 0.00 12182.98 9065.36 74 3117.62

12
FINANCIAL AND PHYSICAL ACHIEVEMENT UNDER DIFFERENT SCHEMES DURING 2020-21
DISTRICT - KALAHANDI UP TO END OF FEBRUARY 2021
Sl. No.
Name of the
schemes
O.B. AS ON
01.04.20
FINANCIAL (Rs.IN LAKH) PHYSICAL
Receipts Other
Receipts
Total
Funds
Available
Exp. % of
Exp.
Closing
Balance Target
Achieve
ment
% of
Ach. Unit
1 2 3 4 5 6 7 8 9 10 11 12 13
1 MGNREGS -208.02 27969.48 0.00 27761.46 27961.29 101 -199.83 78.55 89.88 114 Lakh Person days
2 NRLM 0.00 1735.34 0.00 1735.34 1749.30 101 -13.96 6254 4410 71 No. of SHGs
3 GGY 747.49 0.00 4.93 751.47 96.25 13 655.22 555 66 12 No. of Projects
4 RGSA 48.79 0.00 0.00 48.79 34.07 70 14.72 4 0 0 No. of Buildings
5 14th FINANCE COMMISSION
10662.41 0.00 0.00 10662.41 7252.08 68 3410.33 2826 435 15 No. of Projects
6 4th SFC 5616.78 0.00 0.00 5616.78 14.00 0 5602.78 771 0 0 No. of Projects
7 NON CFC/NON SFC 609.58 0.00 0.00 609.58 0.00 0 609.58 16 0 0 No. of Projects
G. TOTAL 17477.03 29704.82 4.93 47185.83 37106.99 79 10078.85
FINANCIAL AND PHYSICAL ACHIEVEMENT UNDER DIFFERENT SCHEMES DURING 2020-21
DISTRICT - KANDHAMAL UP TO END OF FEBRUARY 2021
Sl. No.
Name of the
schemes
O.B. AS ON
01.04.20
FINANCIAL (Rs.IN LAKH) PHYSICAL
Receipts Other
Receipts
Total
Funds
Available
Exp. % of
Exp.
Closing
Balance Target
Achieve
ment
% of
Ach. Unit
1 2 3 4 5 6 7 8 9 10 11 12 13
1 MGNREGS 61.86 19966.87 0.00 20028.73 19967.49 100 61.24 75.09 81.74 109 Lakh Person days
2 NRLM 0.00 1845.42 0.00 1845.42 1150.44 62 694.97 4566 4257 93 No. of SHGs
3 GGY 203.20 0.00 27.07 230.27 117.27 51 113.00 149 84 56 No. of Projects
4 RGSA 59.14 0.00 0.00 59.14 0.00 0 59.14 1 0 0 No. of Buildings
5 14th FINANCE COMMISSION
10003.56 0.00 0.00 10003.56 5540.48 55 4463.08 1893 302 16 No. of Projects
6 4th SFC 3864.80 0.00 0.00 3864.80 1043.20 27 2821.60 532 292 55 No. of Projects
7 NON CFC/NON SFC 687.78 0.00 0.00 687.78 0.00 0 687.78 12 0 0 No. of Projects
G. TOTAL 14880.34 21812.29 27.07 36719.70 27818.89 76 8900.81

13
FINANCIAL AND PHYSICAL ACHIEVEMENT UNDER DIFFERENT SCHEMES DURING 2020-21
DISTRICT - KENDRAPARA UP TO END OF FEBRUARY 2021
Sl. No.
Name of the
schemes
O.B. AS ON
01.04.20
FINANCIAL (Rs.IN LAKH) PHYSICAL
Receipts Other
Receipts
Total
Funds
Available
Exp. % of
Exp.
Closing
Balance Target
Achieve
ment
% of
Ach. Unit
1 2 3 4 5 6 7 8 9 10 11 12 13
1 MGNREGS -745.19 9225.58 0.00 8480.39 9227.12 109 -746.73 28.95 27.88 96 Lakh Person days
2 NRLM 0.00 2142.26 0.00 2142.26 1643.11 77 499.15 8118 7780 96 No. of SHGs
3 GGY 638.35 0.00 0.00 638.35 329.37 52 308.98 380 143 38 No. of Projects
4 RGSA 5.00 0.00 0.00 5.00 2.00 40 3.00 4 0 0 No. of Buildings
5 14th FINANCE COMMISSION
7851.03 0.00 0.00 7851.03 7027.68 90 823.35 3672 1201 33 No. of Projects
6 4th SFC 3263.73 0.00 0.00 3263.73 1053.86 32 2209.87 572 332 58 No. of Projects
7 NON CFC/NON SFC 633.33 0.00 0.00 633.33 86.53 14 546.80 64 23 36 No. of Projects
G. TOTAL 11646.24 11367.84 0.00 23014.09 19369.67 84 3644.41
FINANCIAL AND PHYSICAL ACHIEVEMENT UNDER DIFFERENT SCHEMES DURING 2020-21
DISTRICT - KEONJHAR UP TO END OF FEBRUARY 2021
Sl. No.
Name of the
schemes
O.B. AS ON
01.04.20
FINANCIAL (Rs.IN LAKH) PHYSICAL
Receipts Other
Receipts
Total
Funds
Available
Exp. % of
Exp.
Closing
Balance Target
Achieve
ment
% of
Ach. Unit
1 2 3 4 5 6 7 8 9 10 11 12 13
1 MGNREGS -28.60 36718.43 0.00 36689.83 36715.49 100 -25.66 103.37 115.99 112 Lakh Person days
2 NRLM 0.00 1711.96 0.00 1711.96 1234.81 72 477.15 10097 8888 88 No. of SHGs
3 GGY 1374.30 0.00 0.00 1374.30 1374.30 100 0.00 866 866 100 No. of Projects
4 RGSA 28.34 0.00 0.00 28.34 0.00 0 28.34 1 0 0 No. of Buildings
5 14th FINANCE COMMISSION
15183.09 0.00 0.00 15183.09 8389.91 55 6793.18 787 0 0 No. of Projects
6 4th SFC 5850.34 0.00 0.00 5850.34 0.00 0 5850.34 502 0 0 No. of Projects
7 NON CFC/NON SFC 493.02 0.00 0.00 493.02 0.00 0 493.02 42 0 0 No. of Projects
G. TOTAL 22900.49 38430.39 0.00 61330.89 47714.51 78 13616.38

14
FINANCIAL AND PHYSICAL ACHIEVEMENT UNDER DIFFERENT SCHEMES DURING 2020-21
DISTRICT - KHURDA UP TO END OF FEBRUARY 2021
Sl. No.
Name of the
schemes
O.B. AS ON
01.04.20
FINANCIAL (Rs.IN LAKH) PHYSICAL
Receipts Other
Receipts
Total
Funds
Available
Exp. % of
Exp.
Closing
Balance Target
Achieve
ment
% of
Ach. Unit
1 2 3 4 5 6 7 8 9 10 11 12 13
1 MGNREGS 146.37 5381.65 0.00 5528.02 5381.47 97 146.55 18.50 20.72 112 Lakh Person days
2 NRLM 0.00 2110.35 0.00 2110.35 1954.98 93 155.36 11106 10842 98 No. of SHGs
3 GGY 109.66 0.00 0.00 109.66 69.30 63 40.36 122 0 0 No. of Projects
4 RGSA 0.00 0.00 0.00 0.00 0.00 0.00 0 0 No. of Buildings
5 14th FINANCE COMMISSION
4584.10 0.00 0.00 4584.10 4587.10 100 -3.00 1517 1329 88 No. of Projects
6 4th SFC 2221.31 0.00 0.00 2221.31 1089.70 49 1131.61 727 418 57 No. of Projects
7 NON CFC/NON SFC 568.02 0.00 0.00 568.02 38.00 7 530.02 51 5 10 No. of Projects
G. TOTAL 7629.46 7492.00 0.00 15121.46 13120.55 87 2000.90
FINANCIAL AND PHYSICAL ACHIEVEMENT UNDER DIFFERENT SCHEMES DURING 2020-21
DISTRICT - KORAPUT UP TO END OF FEBRUARY 2021
Sl. No.
Name of the
schemes
O.B. AS ON
01.04.20
FINANCIAL (Rs.IN LAKH) PHYSICAL
Receipts Other
Receipts
Total
Funds
Available
Exp. % of
Exp.
Closing
Balance Target
Achieve
ment
% of
Ach. Unit
1 2 3 4 5 6 7 8 9 10 11 12 13
1 MGNREGS -324.71 27842.82 0.00 27518.11 27834.29 101 -316.18 109.20 113.24 104 Lakh Person days
2 NRLM 0.00 2823.94 0.00 2823.94 2442.68 86 381.26 6879 5820 85 No. of SHGs
3 GGY 1450.67 0.00 0.00 1450.67 293.00 20 1157.67 100 100 100 No. of Projects
4 RGSA 3.00 0.00 0.00 3.00 0.00 0 3.00 3 0 0 No. of Buildings
5 14th FINANCE COMMISSION
8131.79 0.00 0.00 8131.79 6415.07 79 1716.73 693 527 76 No. of Projects
6 4th SFC 2157.13 0.00 0.00 2157.13 940.35 44 1216.78 389 221 57 No. of Projects
7 NON CFC/NON SFC 228.56 0.00 0.00 228.56 73.99 32 154.57 24 4 17 No. of Projects
G. TOTAL 11646.45 30666.76 0.00 42313.20 37999.37 90 4313.83
15
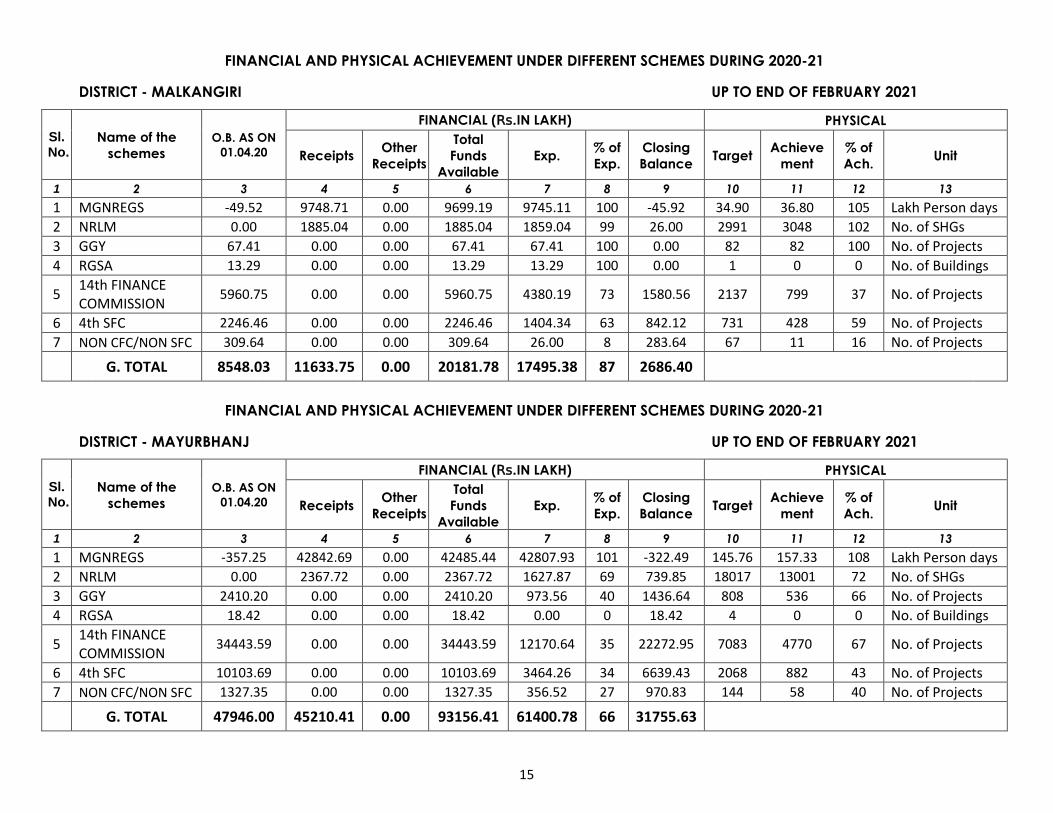
FINANCIAL AND PHYSICAL ACHIEVEMENT UNDER DIFFERENT SCHEMES DURING 2020-21
DISTRICT - MALKANGIRI UP TO END OF FEBRUARY 2021
Sl. No.
Name of the
schemes
O.B. AS ON
01.04.20
FINANCIAL (Rs.IN LAKH) PHYSICAL
Receipts Other
Receipts
Total
Funds
Available
Exp. % of
Exp.
Closing
Balance Target
Achieve
ment
% of
Ach. Unit
1 2 3 4 5 6 7 8 9 10 11 12 13
1 MGNREGS -49.52 9748.71 0.00 9699.19 9745.11 100 -45.92 34.90 36.80 105 Lakh Person days
2 NRLM 0.00 1885.04 0.00 1885.04 1859.04 99 26.00 2991 3048 102 No. of SHGs
3 GGY 67.41 0.00 0.00 67.41 67.41 100 0.00 82 82 100 No. of Projects
4 RGSA 13.29 0.00 0.00 13.29 13.29 100 0.00 1 0 0 No. of Buildings
5 14th FINANCE COMMISSION
5960.75 0.00 0.00 5960.75 4380.19 73 1580.56 2137 799 37 No. of Projects
6 4th SFC 2246.46 0.00 0.00 2246.46 1404.34 63 842.12 731 428 59 No. of Projects
7 NON CFC/NON SFC 309.64 0.00 0.00 309.64 26.00 8 283.64 67 11 16 No. of Projects
G. TOTAL 8548.03 11633.75 0.00 20181.78 17495.38 87 2686.40
FINANCIAL AND PHYSICAL ACHIEVEMENT UNDER DIFFERENT SCHEMES DURING 2020-21
DISTRICT - MAYURBHANJ UP TO END OF FEBRUARY 2021
Sl. No.
Name of the
schemes
O.B. AS ON
01.04.20
FINANCIAL (Rs.IN LAKH) PHYSICAL
Receipts Other
Receipts
Total
Funds
Available
Exp. % of
Exp.
Closing
Balance Target
Achieve
ment
% of
Ach. Unit
1 2 3 4 5 6 7 8 9 10 11 12 13
1 MGNREGS -357.25 42842.69 0.00 42485.44 42807.93 101 -322.49 145.76 157.33 108 Lakh Person days
2 NRLM 0.00 2367.72 0.00 2367.72 1627.87 69 739.85 18017 13001 72 No. of SHGs
3 GGY 2410.20 0.00 0.00 2410.20 973.56 40 1436.64 808 536 66 No. of Projects
4 RGSA 18.42 0.00 0.00 18.42 0.00 0 18.42 4 0 0 No. of Buildings
5 14th FINANCE COMMISSION
34443.59 0.00 0.00 34443.59 12170.64 35 22272.95 7083 4770 67 No. of Projects
6 4th SFC 10103.69 0.00 0.00 10103.69 3464.26 34 6639.43 2068 882 43 No. of Projects
7 NON CFC/NON SFC 1327.35 0.00 0.00 1327.35 356.52 27 970.83 144 58 40 No. of Projects
G. TOTAL 47946.00 45210.41 0.00 93156.41 61400.78 66 31755.63

16
FINANCIAL AND PHYSICAL ACHIEVEMENT UNDER DIFFERENT SCHEMES DURING 2020-21
DISTRICT - NABARANGPUR UP TO END OF FEBRUARY 2021
Sl. No.
Name of the
schemes
O.B. AS ON
01.04.20
FINANCIAL (Rs.IN LAKH) PHYSICAL
Receipts Other
Receipts
Total
Funds
Available
Exp. % of
Exp.
Closing
Balance Target
Achieve
ment
% of
Ach. Unit
1 2 3 4 5 6 7 8 9 10 11 12 13
1 MGNREGS 8.56 25019.82 0.00 25028.38 25000.57 100 27.81 96.99 100.20 103 Lakh Person days
2 NRLM 0.00 1416.86 0.00 1416.86 1139.77 80 277.09 5610 3932 70 No. of SHGs
3 GGY 120.21 0.00 0.00 120.21 115.75 96 4.46 45 31 69 No. of Projects
4 RGSA 100.00 0.00 0.00 100.00 6.87 7 93.13 1 0 0 No. of Buildings
5 14th FINANCE COMMISSION
6626.67 0.00 0.00 6626.67 6709.39 101 -82.73 1056 158 15 No. of Projects
6 4th SFC 1574.69 0.00 0.00 1574.69 788.85 50 785.84 512 204 40 No. of Projects
7 NON CFC/NON SFC 567.31 0.00 0.00 567.31 70.50 12 496.81 62 19 31 No. of Projects
G. TOTAL 8997.44 26436.68 0.00 35434.12 33831.70 95 1602.41
FINANCIAL AND PHYSICAL ACHIEVEMENT UNDER DIFFERENT SCHEMES DURING 2020-21
DISTRICT - NAYAGARH UP TO END OF FEBRUARY 2021
Sl. No.
Name of the
schemes
O.B. AS ON
01.04.20
FINANCIAL (Rs.IN LAKH) PHYSICAL
Receipts Other
Receipts
Total
Funds
Available
Exp. % of
Exp.
Closing
Balance Target
Achieve
ment
% of
Ach. Unit
1 2 3 4 5 6 7 8 9 10 11 12 13
1 MGNREGS 134.01 10838.31 0.00 10972.32 10832.11 99 140.21 36.58 37.19 102 Lakh Person days
2 NRLM 0.00 1876.04 0.00 1876.04 1463.49 78 412.55 8636 7396 86 No. of SHGs
3 GGY 447.99 0.00 0.00 447.99 268.75 60 179.24 186 99 53 No. of Projects
4 RGSA 0.00 0.00 0.00 0.00 0.00 0.00 3 0 0 No. of Buildings
5 14th FINANCE COMMISSION
5345.35 0.00 0.00 5345.35 5316.29 99 29.06 545 354 65 No. of Projects
6 4th SFC 2136.05 0.00 0.00 2136.05 562.00 26 1574.05 299 38 13 No. of Projects
7 NON CFC/NON SFC 425.30 0.00 0.00 425.30 0.00 0 425.30 0 0 No. of Projects
G. TOTAL 8488.70 12714.35 0.00 21203.05 18442.64 87 2760.41

17
FINANCIAL AND PHYSICAL ACHIEVEMENT UNDER DIFFERENT SCHEMES DURING 2020-21
DISTRICT - NUAPADA UP TO END OF FEBRUARY 2021
Sl. No.
Name of the
schemes
O.B. AS ON
01.04.20
FINANCIAL (Rs.IN LAKH) PHYSICAL
Receipts Other
Receipts
Total
Funds
Available
Exp. % of
Exp.
Closing
Balance Target
Achieve
ment
% of
Ach. Unit
1 2 3 4 5 6 7 8 9 10 11 12 13
1 MGNREGS -330.77 16950.31 0.00 16619.54 16945.45 102 -325.91 41.03 50.00 122 Lakh Person days
2 NRLM 0.00 1651.86 0.00 1651.86 885.93 54 765.93 3622 3089 85 No. of SHGs
3 GGY 184.70 3.50 17.00 188.20 151.46 80 36.74 47 40 85 No. of Projects
4 RGSA 121.00 0.00 0.00 121.00 93.32 77 27.68 5 0 0 No. of Buildings
5 14th FINANCE COMMISSION
5363.68 0.00 0.00 5363.68 3592.37 67 1771.31 176 68 39 No. of Projects
6 4th SFC 5888.96 0.00 0.00 5888.96 307.45 5 5581.51 286 92 32 No. of Projects
7 NON CFC/NON SFC 259.37 0.00 0.00 259.37 28.08 11 231.29 33 12 36 No. of Projects
G. TOTAL 11486.94 18605.67 17.00 30092.61 22004.06 73 8088.55
FINANCIAL AND PHYSICAL ACHIEVEMENT UNDER DIFFERENT SCHEMES DURING 2020-21
DISTRICT - PURI UP TO END OF FEBRUARY 2021
Sl. No.
Name of the
schemes
O.B. AS ON
01.04.20
FINANCIAL (Rs.IN LAKH) PHYSICAL
Receipts Other
Receipts
Total
Funds
Available
Exp. % of
Exp.
Closing
Balance Target
Achieve
ment
% of
Ach. Unit
1 2 3 4 5 6 7 8 9 10 11 12 13
1 MGNREGS 1.59 7380.02 0.00 7381.61 7385.59 100 -3.98 28.60 27.58 96 Lakh Person days
2 NRLM 0.00 2335.36 0.00 2335.36 2126.11 91 209.25 12579 11382 90 No. of SHGs
3 GGY 154.05 0.00 0.00 154.05 141.70 92 12.35 101 72 71 No. of Projects
4 RGSA 10.00 0.00 0.00 10.00 0.00 0 10.00 2 0 0 No. of Buildings
5 14th FINANCE COMMISSION
8188.21 0.00 0.00 8188.21 7134.90 87 1053.31 765 520 68 No. of Projects
6 4th SFC 4741.52 0.00 0.00 4741.52 1133.39 24 3608.13 289 200 69 No. of Projects
7 NON CFC/NON SFC 604.65 0.00 0.00 604.65 272.53 45 332.12 57 9 16 No. of Projects
G. TOTAL 13700.02 9715.38 0.00 23415.40 18194.22 78 5221.18

18
FINANCIAL AND PHYSICAL ACHIEVEMENT UNDER DIFFERENT SCHEMES DURING 2020-21
DISTRICT - RAYAGADA UP TO END OF FEBRUARY 2021
Sl. No.
Name of the
schemes
O.B. AS ON
01.04.20
FINANCIAL (Rs.IN LAKH) PHYSICAL
Receipts Other
Receipts
Total
Funds
Available
Exp. % of
Exp.
Closing
Balance Target
Achieve
ment
% of
Ach. Unit
1 2 3 4 5 6 7 8 9 10 11 12 13
1 MGNREGS -105.19 24242.51 0.00 24137.32 24238.47 100 -101.15 76.35 78.46 103 Lakh Person days
2 NRLM 0.00 2267.82 0.00 2267.82 1373.76 61 894.06 6364 5542 87 No. of SHGs
3 GGY 356.56 0.00 0.00 356.56 58.00 16 298.56 185 48 26 No. of Projects
4 RGSA 218.00 0.00 0.00 218.00 152.70 70 65.30 13 10 77 No. of Buildings
5 14th FINANCE COMMISSION
16554.94 0.00 0.00 16554.94 5413.07 33 11141.87 1284 64 5 No. of Projects
6 4th SFC 4975.45 0.00 0.00 4975.45 6.90 0 4968.55 764 2 0 No. of Projects
7 NON CFC/NON SFC 324.04 0.00 0.00 324.04 0.00 0 324.04 26 0 0 No. of Projects
G. TOTAL 22323.80 26510.33 0.00 48834.13 31242.90 64 17591.23
FINANCIAL AND PHYSICAL ACHIEVEMENT UNDER DIFFERENT SCHEMES DURING 2020-21
DISTRICT - SAMBALPUR UP TO END OF FEBRUARY 2021
Sl. No.
Name of the
schemes
O.B. AS ON
01.04.20
FINANCIAL (Rs.IN LAKH) PHYSICAL
Receipts Other
Receipts
Total
Funds
Available
Exp. % of
Exp.
Closing
Balance Target
Achieve
ment
% of
Ach. Unit
1 2 3 4 5 6 7 8 9 10 11 12 13
1 MGNREGS 140.41 12211.92 0.00 12352.33 12209.91 99 142.42 41.06 49.07 119 Lakh Person days
2 NRLM 0.00 2421.72 0.00 2421.72 1971.59 81 450.13 6589 6724 102 No. of SHGs
3 GGY 1590.58 0.00 278.00 1868.58 767.26 41 1101.32 936 371 40 No. of Projects
4 RGSA 14.73 0.00 0.00 14.73 0.00 0 14.73 3 0 0 No. of Buildings
5 14th FINANCE COMMISSION
8741.50 0.00 0.00 8741.50 4057.04 46 4684.46 1848 644 35 No. of Projects
6 4th SFC 1390.75 0.00 0.00 1390.75 660.15 47 730.60 465 336 72 No. of Projects
7 NON CFC/NON SFC 262.31 0.00 0.00 262.31 74.92 29 187.39 20 9 45 No. of Projects
G. TOTAL 12140.28 14633.64 278.00 27051.92 19740.86 73 7311.06
19
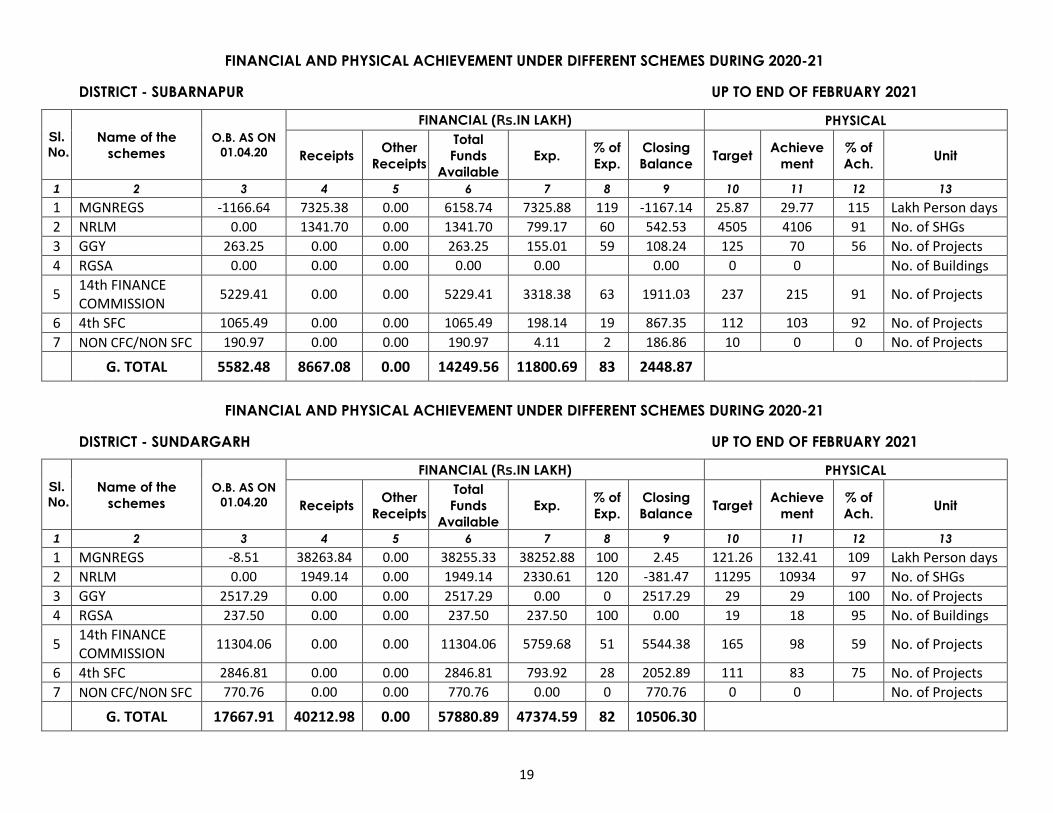
FINANCIAL AND PHYSICAL ACHIEVEMENT UNDER DIFFERENT SCHEMES DURING 2020-21
DISTRICT - SUBARNAPUR UP TO END OF FEBRUARY 2021
Sl. No.
Name of the
schemes
O.B. AS ON
01.04.20
FINANCIAL (Rs.IN LAKH) PHYSICAL
Receipts Other
Receipts
Total
Funds
Available
Exp. % of
Exp.
Closing
Balance Target
Achieve
ment
% of
Ach. Unit
1 2 3 4 5 6 7 8 9 10 11 12 13
1 MGNREGS -1166.64 7325.38 0.00 6158.74 7325.88 119 -1167.14 25.87 29.77 115 Lakh Person days
2 NRLM 0.00 1341.70 0.00 1341.70 799.17 60 542.53 4505 4106 91 No. of SHGs
3 GGY 263.25 0.00 0.00 263.25 155.01 59 108.24 125 70 56 No. of Projects
4 RGSA 0.00 0.00 0.00 0.00 0.00 0.00 0 0 No. of Buildings
5 14th FINANCE COMMISSION
5229.41 0.00 0.00 5229.41 3318.38 63 1911.03 237 215 91 No. of Projects
6 4th SFC 1065.49 0.00 0.00 1065.49 198.14 19 867.35 112 103 92 No. of Projects
7 NON CFC/NON SFC 190.97 0.00 0.00 190.97 4.11 2 186.86 10 0 0 No. of Projects
G. TOTAL 5582.48 8667.08 0.00 14249.56 11800.69 83 2448.87
FINANCIAL AND PHYSICAL ACHIEVEMENT UNDER DIFFERENT SCHEMES DURING 2020-21
DISTRICT - SUNDARGARH UP TO END OF FEBRUARY 2021
Sl. No.
Name of the
schemes
O.B. AS ON
01.04.20
FINANCIAL (Rs.IN LAKH) PHYSICAL
Receipts Other
Receipts
Total
Funds
Available
Exp. % of
Exp.
Closing
Balance Target
Achieve
ment
% of
Ach. Unit
1 2 3 4 5 6 7 8 9 10 11 12 13
1 MGNREGS -8.51 38263.84 0.00 38255.33 38252.88 100 2.45 121.26 132.41 109 Lakh Person days
2 NRLM 0.00 1949.14 0.00 1949.14 2330.61 120 -381.47 11295 10934 97 No. of SHGs
3 GGY 2517.29 0.00 0.00 2517.29 0.00 0 2517.29 29 29 100 No. of Projects
4 RGSA 237.50 0.00 0.00 237.50 237.50 100 0.00 19 18 95 No. of Buildings
5 14th FINANCE COMMISSION
11304.06 0.00 0.00 11304.06 5759.68 51 5544.38 165 98 59 No. of Projects
6 4th SFC 2846.81 0.00 0.00 2846.81 793.92 28 2052.89 111 83 75 No. of Projects
7 NON CFC/NON SFC 770.76 0.00 0.00 770.76 0.00 0 770.76 0 0 No. of Projects
G. TOTAL 17667.91 40212.98 0.00 57880.89 47374.59 82 10506.30

20
DISTRICT WISE FINANCIAL ACHIEVEMENT UNDER DAY-NRLM (NRLM & NRETP) DURING 2020-21 UP TO FEBRUARY, 2021
SL. NO. NAME OF THE DISTRICTS Revised Annual Target FY 2020-21 Expenditure
TOTAL EXP. % (Against Annual Target)
1 2 3 4 5
1 ANGUL 3,316.73 3,321.55 100.15
2 BALASORE 2,553.65 1,628.52 63.77
3 BARGARH 2,074.51 1,205.39 58.10
4 BHADRAK 2,088.63 2,882.52 138.01
5 BOLANGIR 2,628.94 1,972.89 75.05
6 BOUDH 949.33 655.47 69.05
7 CUTTACK 3,050.08 2,787.75 91.40
8 DEOGARH 1,602.76 985.57 61.49
9 DHENKANAL 1,806.43 1,283.96 71.08
10 GAJAPATI 2,117.25 1,844.09 87.10
11 GANJAM 2,729.91 3,951.02 144.73
12 JAGATSINGHPUR 2,021.28 2,047.75 101.31
13 JAJPUR 1,917.22 1,827.18 95.30
14 JHARSUGUDA 996.01 778.59 78.17
15 KALAHANDI 1,735.34 1,749.30 100.80
16 KANDHAMAL 1,845.42 1,150.44 62.34
17 KENDRAPARA 2,142.26 1,643.11 76.70
18 KEONJHAR 1,711.96 1,234.81 72.13
19 KHURDA 2,110.35 1,954.98 92.64
20 KORAPUT 2,823.94 2,442.68 86.50
21 MALKANGIRI 1,885.04 1,859.04 98.62
22 MAYURBHANJ 2,367.72 1,627.87 68.75
23 NABARANGPUR 1,416.86 1,139.77 80.44
24 NAYAGARH 1,876.04 1,463.49 78.01
25 NUAPADA 1,651.86 885.93 53.63
26 PURI 2,335.36 2,126.11 91.04
27 RAYAGADA 2,267.82 1,373.76 60.58
28 SAMBALPUR 2,421.72 1,971.59 81.41
29 SUBARNAPUR 1,341.70 799.17 59.56
30 SUNDERGARH 1,949.14 2,330.61 119.57
District Total 61,735.27 52,924.94 85.73
State Expenditure 16,623.74 6,245.47
Grand Total 78,359.01 59,170.41
* The annual target has been changed as per the allocation received from Govt. of India
21
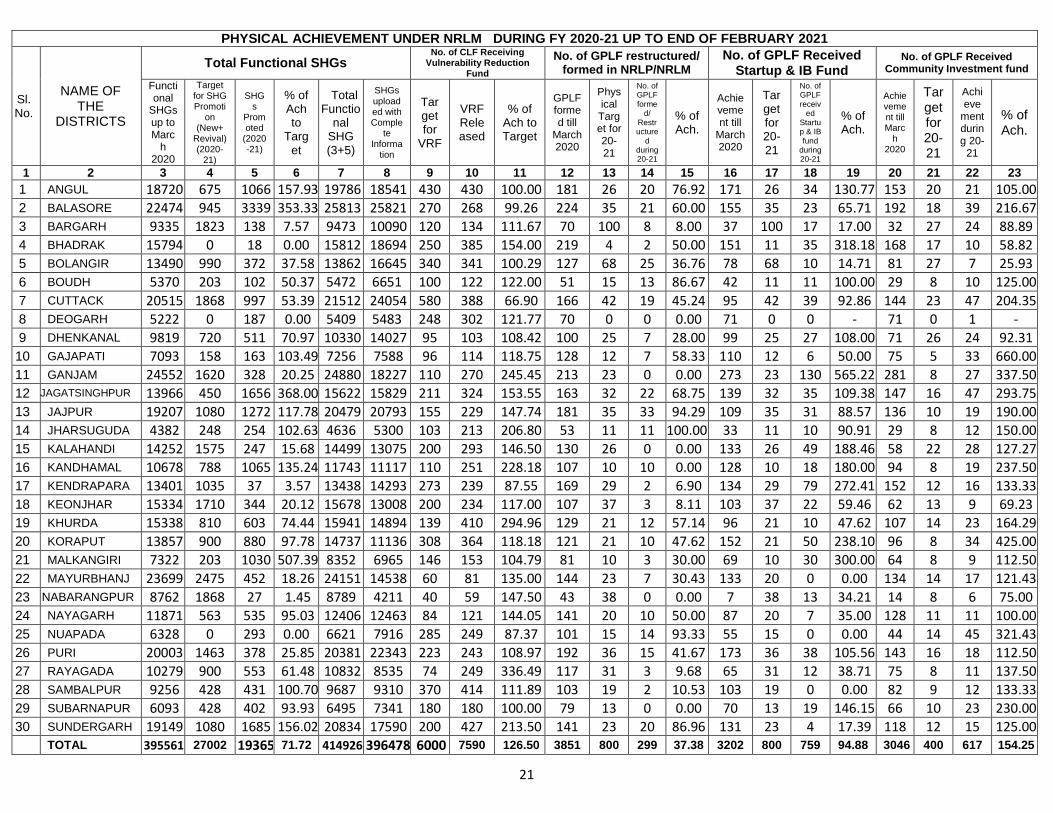
PHYSICAL ACHIEVEMENT UNDER NRLM DURING FY 2020-21 UP TO END OF FEBRUARY 2021
Sl. No.
NAME OF THE
DISTRICTS
Total Functional SHGs No. of CLF Receiving
Vulnerability Reduction Fund
No. of GPLF restructured/ formed in NRLP/NRLM
No. of GPLF Received Startup & IB Fund
No. of GPLF Received Community Investment fund
Functional
SHGs up to Marc
h 2020
Target for SHG Promoti
on (New+
Revival) (2020-
21)
SHGs
Promoted
(2020-21)
% of Ach to
Target
Total Functio
nal SHG (3+5)
SHGs uploaded with Comple
te Informa
tion
Target for
VRF
VRF Released
% of Ach to Target
GPLF formed till
March 2020
Physical Target for 20-21
No. of GPLF forme
d/ Restructure
d during 20-21
% of Ach.
Achievement till
March 2020
Target for 20-21
No. of GPLF receiv
ed Startup & IB fund
during 20-21
% of Ach.
Achievement till Marc
h 2020
Target for 20-21
Achieve
ment during 20-
21
% of Ach.
1 2 3 4 5 6 7 8 9 10 11 12 13 14 15 16 17 18 19 20 21 22 23
1 ANGUL 18720 675 1066 157.93 19786 18541 430 430 100.00 181 26 20 76.92 171 26 34 130.77 153 20 21 105.00 2 BALASORE 22474 945 3339 353.33 25813 25821 270 268 99.26 224 35 21 60.00 155 35 23 65.71 192 18 39 216.67
3 BARGARH 9335 1823 138 7.57 9473 10090 120 134 111.67 70 100 8 8.00 37 100 17 17.00 32 27 24 88.89
4 BHADRAK 15794 0 18 0.00 15812 18694 250 385 154.00 219 4 2 50.00 151 11 35 318.18 168 17 10 58.82
5 BOLANGIR 13490 990 372 37.58 13862 16645 340 341 100.29 127 68 25 36.76 78 68 10 14.71 81 27 7 25.93
6 BOUDH 5370 203 102 50.37 5472 6651 100 122 122.00 51 15 13 86.67 42 11 11 100.00 29 8 10 125.00
7 CUTTACK 20515 1868 997 53.39 21512 24054 580 388 66.90 166 42 19 45.24 95 42 39 92.86 144 23 47 204.35
8 DEOGARH 5222 0 187 0.00 5409 5483 248 302 121.77 70 0 0 0.00 71 0 0 - 71 0 1 - 9 DHENKANAL 9819 720 511 70.97 10330 14027 95 103 108.42 100 25 7 28.00 99 25 27 108.00 71 26 24 92.31
10 GAJAPATI 7093 158 163 103.49 7256 7588 96 114 118.75 128 12 7 58.33 110 12 6 50.00 75 5 33 660.00 11 GANJAM 24552 1620 328 20.25 24880 18227 110 270 245.45 213 23 0 0.00 273 23 130 565.22 281 8 27 337.50 12 JAGATSINGHPUR 13966 450 1656 368.00 15622 15829 211 324 153.55 163 32 22 68.75 139 32 35 109.38 147 16 47 293.75
13 JAJPUR 19207 1080 1272 117.78 20479 20793 155 229 147.74 181 35 33 94.29 109 35 31 88.57 136 10 19 190.00 14 JHARSUGUDA 4382 248 254 102.63 4636 5300 103 213 206.80 53 11 11 100.00 33 11 10 90.91 29 8 12 150.00 15 KALAHANDI 14252 1575 247 15.68 14499 13075 200 293 146.50 130 26 0 0.00 133 26 49 188.46 58 22 28 127.27
16 KANDHAMAL 10678 788 1065 135.24 11743 11117 110 251 228.18 107 10 10 0.00 128 10 18 180.00 94 8 19 237.50 17 KENDRAPARA 13401 1035 37 3.57 13438 14293 273 239 87.55 169 29 2 6.90 134 29 79 272.41 152 12 16 133.33 18 KEONJHAR 15334 1710 344 20.12 15678 13008 200 234 117.00 107 37 3 8.11 103 37 22 59.46 62 13 9 69.23 19 KHURDA 15338 810 603 74.44 15941 14894 139 410 294.96 129 21 12 57.14 96 21 10 47.62 107 14 23 164.29 20 KORAPUT 13857 900 880 97.78 14737 11136 308 364 118.18 121 21 10 47.62 152 21 50 238.10 96 8 34 425.00 21 MALKANGIRI 7322 203 1030 507.39 8352 6965 146 153 104.79 81 10 3 30.00 69 10 30 300.00 64 8 9 112.50
22 MAYURBHANJ 23699 2475 452 18.26 24151 14538 60 81 135.00 144 23 7 30.43 133 20 0 0.00 134 14 17 121.43
23 NABARANGPUR 8762 1868 27 1.45 8789 4211 40 59 147.50 43 38 0 0.00 7 38 13 34.21 14 8 6 75.00 24 NAYAGARH 11871 563 535 95.03 12406 12463 84 121 144.05 141 20 10 50.00 87 20 7 35.00 128 11 11 100.00 25 NUAPADA 6328 0 293 0.00 6621 7916 285 249 87.37 101 15 14 93.33 55 15 0 0.00 44 14 45 321.43 26 PURI 20003 1463 378 25.85 20381 22343 223 243 108.97 192 36 15 41.67 173 36 38 105.56 143 16 18 112.50
27 RAYAGADA 10279 900 553 61.48 10832 8535 74 249 336.49 117 31 3 9.68 65 31 12 38.71 75 8 11 137.50 28 SAMBALPUR 9256 428 431 100.70 9687 9310 370 414 111.89 103 19 2 10.53 103 19 0 0.00 82 9 12 133.33 29 SUBARNAPUR 6093 428 402 93.93 6495 7341 180 180 100.00 79 13 0 0.00 70 13 19 146.15 66 10 23 230.00
30 SUNDERGARH 19149 1080 1685 156.02 20834 17590 200 427 213.50 141 23 20 86.96 131 23 4 17.39 118 12 15 125.00 TOTAL 395561 27002 19365 71.72 414926 396478 6000 7590 126.50 3851 800 299 37.38 3202 800 759 94.88 3046 400 617 154.25
22
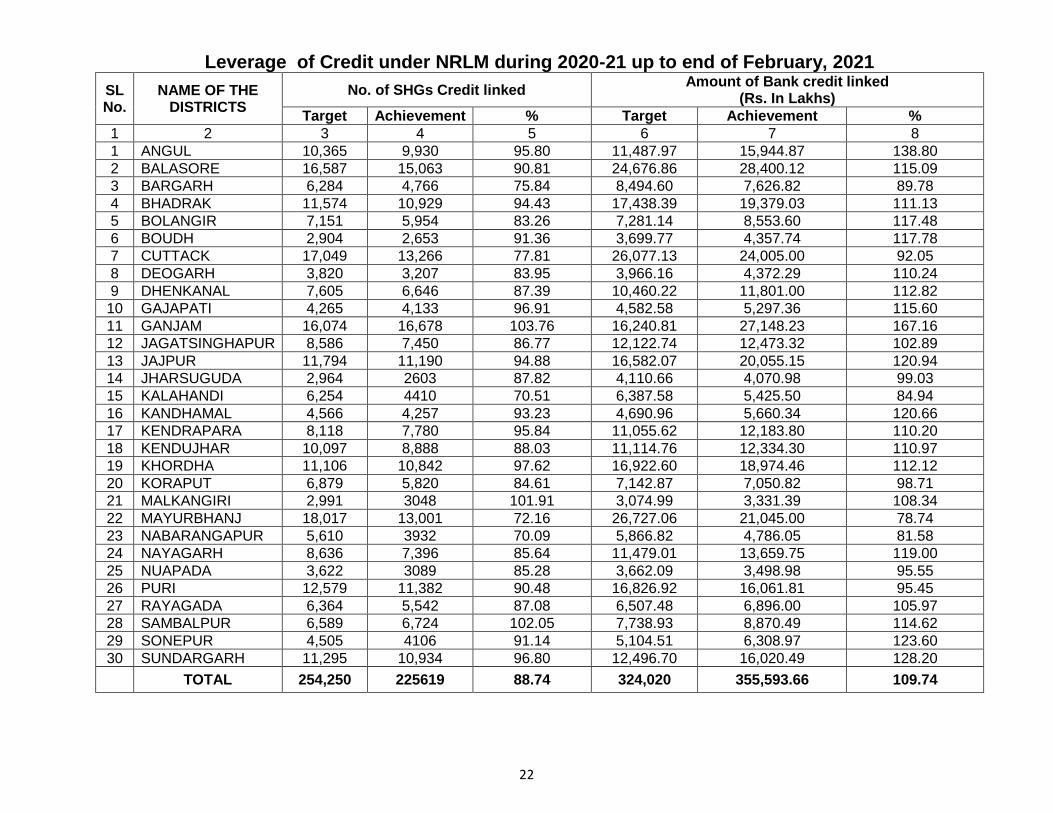
Leverage of Credit under NRLM during 2020-21 up to end of February, 2021
SL No.
NAME OF THE DISTRICTS
No. of SHGs Credit linked Amount of Bank credit linked
(Rs. In Lakhs)
Target Achievement % Target Achievement %
1 2 3 4 5 6 7 8
1 ANGUL 10,365 9,930 95.80 11,487.97 15,944.87 138.80
2 BALASORE 16,587 15,063 90.81 24,676.86 28,400.12 115.09
3 BARGARH 6,284 4,766 75.84 8,494.60 7,626.82 89.78
4 BHADRAK 11,574 10,929 94.43 17,438.39 19,379.03 111.13
5 BOLANGIR 7,151 5,954 83.26 7,281.14 8,553.60 117.48
6 BOUDH 2,904 2,653 91.36 3,699.77 4,357.74 117.78
7 CUTTACK 17,049 13,266 77.81 26,077.13 24,005.00 92.05
8 DEOGARH 3,820 3,207 83.95 3,966.16 4,372.29 110.24
9 DHENKANAL 7,605 6,646 87.39 10,460.22 11,801.00 112.82
10 GAJAPATI 4,265 4,133 96.91 4,582.58 5,297.36 115.60
11 GANJAM 16,074 16,678 103.76 16,240.81 27,148.23 167.16
12 JAGATSINGHAPUR 8,586 7,450 86.77 12,122.74 12,473.32 102.89
13 JAJPUR 11,794 11,190 94.88 16,582.07 20,055.15 120.94
14 JHARSUGUDA 2,964 2603 87.82 4,110.66 4,070.98 99.03
15 KALAHANDI 6,254 4410 70.51 6,387.58 5,425.50 84.94
16 KANDHAMAL 4,566 4,257 93.23 4,690.96 5,660.34 120.66
17 KENDRAPARA 8,118 7,780 95.84 11,055.62 12,183.80 110.20
18 KENDUJHAR 10,097 8,888 88.03 11,114.76 12,334.30 110.97
19 KHORDHA 11,106 10,842 97.62 16,922.60 18,974.46 112.12
20 KORAPUT 6,879 5,820 84.61 7,142.87 7,050.82 98.71
21 MALKANGIRI 2,991 3048 101.91 3,074.99 3,331.39 108.34
22 MAYURBHANJ 18,017 13,001 72.16 26,727.06 21,045.00 78.74
23 NABARANGAPUR 5,610 3932 70.09 5,866.82 4,786.05 81.58
24 NAYAGARH 8,636 7,396 85.64 11,479.01 13,659.75 119.00
25 NUAPADA 3,622 3089 85.28 3,662.09 3,498.98 95.55
26 PURI 12,579 11,382 90.48 16,826.92 16,061.81 95.45
27 RAYAGADA 6,364 5,542 87.08 6,507.48 6,896.00 105.97
28 SAMBALPUR 6,589 6,724 102.05 7,738.93 8,870.49 114.62
29 SONEPUR 4,505 4106 91.14 5,104.51 6,308.97 123.60
30 SUNDARGARH 11,295 10,934 96.80 12,496.70 16,020.49 128.20
TOTAL 254,250 225619 88.74 324,020 355,593.66 109.74

23
FINANCIAL ACHIEVEMENT UNDER NRLM DURING 2020-21 UP TO FEBRUARY-2021 (Amount in Lakh.)
Odisha Livelihoods Mission
Name of the Scheme
Allocation Opening Balance
Fund received (State + Centre)
Other Receipt (Misc. + Int.)
Total fund available
Expenditure % of
expenditure
1 2 3 4 5 7 8 9
NRLM - 6,620.87 54,825.80 283.04 61,729.71 53,205.04 86.19%
NRETP 3,608.45 3,010.00 75.43 6,693.88 4,018.79 60.04%
EOL - 500.00 6.59 506.59 - 0.00%
MKSP 993.45 - 2.34 995.79 410.13 41.19%
RSETI - 242.37 549.94 5.03 797.34 545.06 68.36%
SVEP 2,095.79 - 24.48 2,120.27 991.39 46.76%
TOTAL 13,560.93 58,885.74 396.90 72,843.57 59,170.41 81.23%

24
Financial Progress Report under DDU-GKY for the FY 2020-21
Month – February -21
Sl. No. Head Amount in crores
1 OB as on 01/04/20 189.36
2 Grant Receipts 68.91
3 Other receipts 11.49
4 Total fund available 269.76
5 Expenditure 114.03
6 Balance 155.73
25
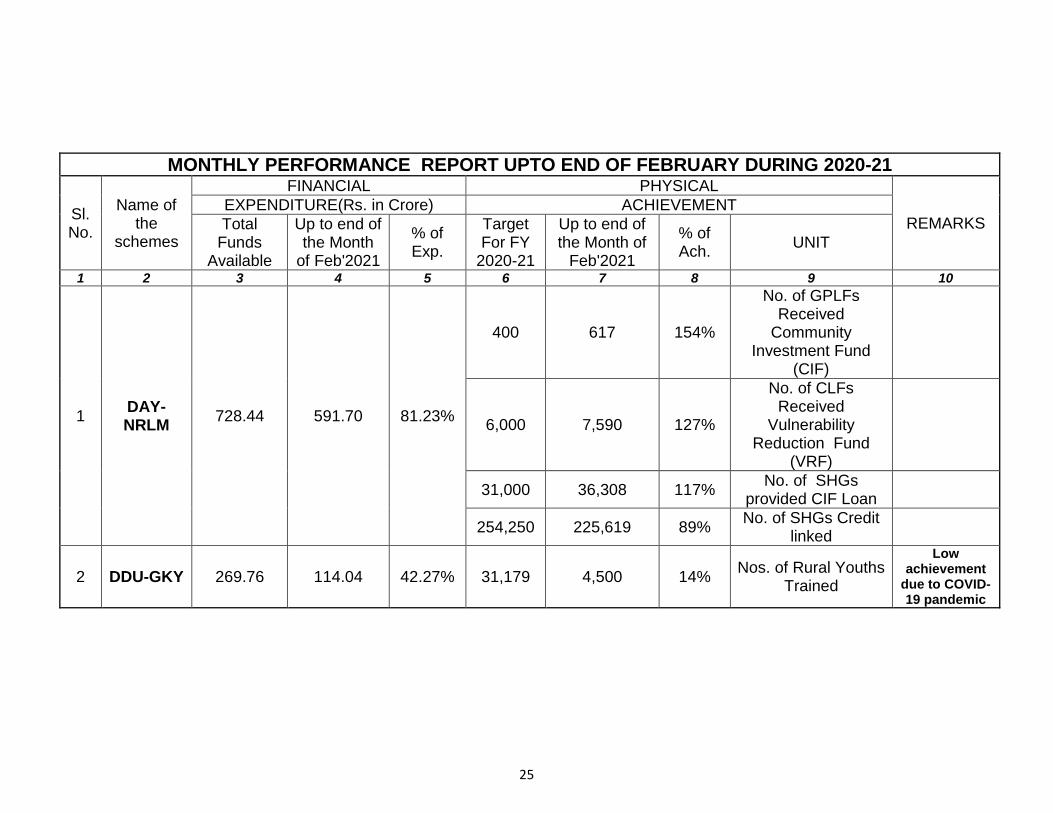
MONTHLY PERFORMANCE REPORT UPTO END OF FEBRUARY DURING 2020-21
Sl. No.
Name of the
schemes
FINANCIAL PHYSICAL
REMARKS EXPENDITURE(Rs. in Crore) ACHIEVEMENT
Total Funds
Available
Up to end of the Month
of Feb'2021
% of Exp.
Target For FY
2020-21
Up to end of the Month of
Feb'2021
% of Ach.
UNIT
1 2 3 4 5 6 7 8 9 10
1 DAY-NRLM
728.44 591.70 81.23%
400 617 154%
No. of GPLFs Received
Community Investment Fund
(CIF)
6,000 7,590 127%
No. of CLFs Received
Vulnerability Reduction Fund
(VRF)
31,000 36,308 117% No. of SHGs
provided CIF Loan
254,250 225,619 89% No. of SHGs Credit
linked
2 DDU-GKY 269.76 114.04 42.27% 31,179 4,500 14% Nos. of Rural Youths
Trained
Low achievement
due to COVID-19 pandemic
26
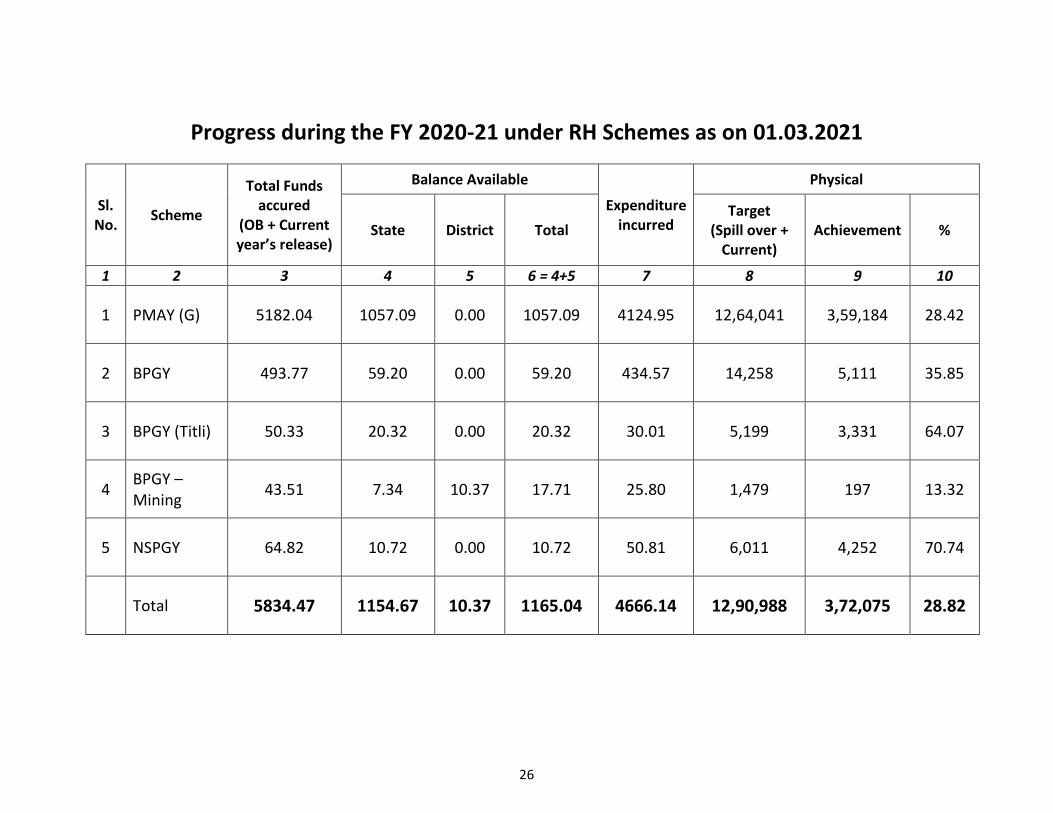
Progress during the FY 2020-21 under RH Schemes as on 01.03.2021
Sl. No.
Scheme
Total Funds accured
(OB + Current year’s release)
Balance Available
Expenditure incurred
Physical
State District Total Target
(Spill over + Current)
Achievement %
1 2 3 4 5 6 = 4+5 7 8 9 10
1 PMAY (G) 5182.04 1057.09 0.00 1057.09 4124.95 12,64,041 3,59,184 28.42
2 BPGY 493.77 59.20 0.00 59.20 434.57 14,258 5,111 35.85
3 BPGY (Titli) 50.33 20.32 0.00 20.32 30.01 5,199 3,331 64.07
4 BPGY – Mining
43.51 7.34 10.37 17.71 25.80 1,479 197 13.32
5 NSPGY 64.82 10.72 0.00 10.72 50.81 6,011 4,252 70.74
Total 5834.47 1154.67 10.37 1165.04 4666.14 12,90,988 3,72,075 28.82

27
Daily Progress Report on Rural Housing for the month of February-2021
Houses completed since FY 2014-15
Financial Year Houses Completed
2014-15 3,52,421
2015-16 6,16,818
2016-17 1,63,983
2017-18 5,32,254
2018-19 5,10,486
2019-20 3,94,212
2020-21 3,70,797
Total 29,40,971
Schemes Houses Completed
since FY 2014-15 Houses completed
during this FY
Biju Pucca Ghar 2,99,413 5,105
Pucca Ghar Yojana (Mining) 28,545 196
Nirman Shramik Pucca Ghar Yojana 21,844 4,248
Indira Awaas Yojana 10,61,950 -
PMAY - G 15,17,058 3,57,919
Matshyajibi Basagruha Yojana 942 -
BPGY (Titili) 11,219 3,329
Total Houses Completed 29,40,971 3,70,797
Completion since Yesterday 1326 Per day rate of House completion
Required Rate 12068 Current Rate 1114

28
Houses Completed during the FY-2020-21
Sl. No.
District
Target Achievement Total
PMAY- G BPGY,
Titli, Mining, NSPGY
PMAY- G BPGY,
Titli, Mining NSPGY
Tar. Ach. %age Completion
since Yesterday
Incomplete
1 2 3 4 5 6 7 8 9 10 11
1 SAMBALPUR 926 1448 528 1402 2,374 1,930 81.30 0 444
2 DHENKANAL 18616 210 13679 77 18,826 13,756 73.07 47 5070
3 JHARSUGUDA 3453 61 2376 33 3,514 2,409 68.55 0 1105
4 KORAPUT 15618 748 10205 347 16,366 10,552 64.48 14 5814
5 SUNDARGARH 19661 716 12815 141 20,377 12,956 63.58 39 7421
6 KANDHAMAL 3636 139 2309 46 3,775 2,355 62.38 4 1420
7 NABARANGAPUR 38182 1144 23763 657 39,326 24,420 62.10 58 14906
8 BOLANGIR 58115 278 35834 104 58,393 35,938 61.55 116 22455
9 MALKANGIRI 4136 430 2324 224 4,566 2,548 55.80 8 2018
10 GAJAPATI 4391 3817 2006 2403 8,208 4,409 53.72 7 3799
11 MAYURBHANJ 107447 2624 55978 756 1,10,071 56,734 51.54 84 53337
12 JAJPUR 25713 1381 12229 827 27,094 13,056 48.19 100 14038
13 GANJAM 6007 1946 2595 1216 7,953 3,811 47.92 0 4142
14 NUAPADA 27150 587 12874 317 27,737 13,191 47.56 113 14546
15 ANGUL 17290 835 8106 479 18,125 8,585 47.37 38 9540
16 PURI 13578 1001 6427 452 14,579 6,879 47.18 48 7700
17 SONEPUR 25076 258 11821 74 25,334 11,895 46.95 31 13439
18 DEOGARH 2985 89 1383 39 3,074 1,422 46.26 0 1652
19 NAYAGARH 10194 477 4673 211 10,671 4,884 45.77 8 5787
20 KENDUJHAR 36234 1969 16980 470 38,203 17,450 45.68 105 20753
21 BOUDH 26099 309 11898 100 26,408 11,998 45.43 21 14410
22 KALAHANDI 51577 543 23162 207 52,120 23,369 44.84 59 28751
23 CUTTACK 10710 1349 4693 702 12,059 5,395 44.74 8 6664
24 BHADRAK 39891 764 17765 257 40,655 18,022 44.33 97 22633
25 BARGARH 45466 685 19959 264 46,151 20,223 43.82 65 25928
26 RAYAGADA 15549 410 6538 194 15,959 6,732 42.18 24 9227
27 JAGATSINGHAPUR 5993 305 2394 118 6,298 2,512 39.89 0 3786
28 KHORDHA 5988 504 2046 198 6,492 2,244 34.57 27 4248
29 BALESHWAR 66426 1097 22994 260 67,523 23,254 34.44 154 44269
30 KENDRAPARA 23844 903 7565 303 24,747 7,868 31.79 51 16879
Total 729951 27027 357919 12878 7,56,978 3,70,797 48.98 1326 3,86,181
29
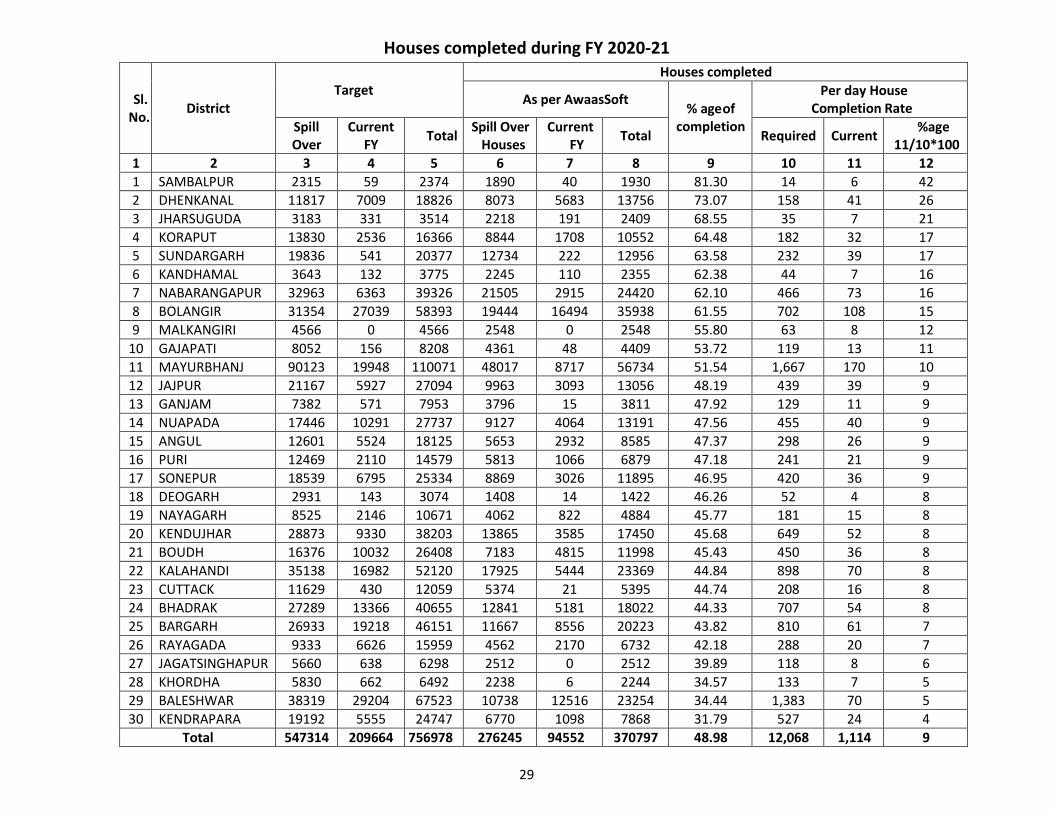
Houses completed during FY 2020-21
Sl. No.
District Target
Houses completed
As per AwaasSoft % age of
completion
Per day House Completion Rate
Spill Over
Current FY
Total Spill Over
Houses Current
FY Total Required Current
%age 11/10*100
1 2 3 4 5 6 7 8 9 10 11 12
1 SAMBALPUR 2315 59 2374 1890 40 1930 81.30 14 6 42
2 DHENKANAL 11817 7009 18826 8073 5683 13756 73.07 158 41 26
3 JHARSUGUDA 3183 331 3514 2218 191 2409 68.55 35 7 21
4 KORAPUT 13830 2536 16366 8844 1708 10552 64.48 182 32 17
5 SUNDARGARH 19836 541 20377 12734 222 12956 63.58 232 39 17
6 KANDHAMAL 3643 132 3775 2245 110 2355 62.38 44 7 16
7 NABARANGAPUR 32963 6363 39326 21505 2915 24420 62.10 466 73 16
8 BOLANGIR 31354 27039 58393 19444 16494 35938 61.55 702 108 15
9 MALKANGIRI 4566 0 4566 2548 0 2548 55.80 63 8 12
10 GAJAPATI 8052 156 8208 4361 48 4409 53.72 119 13 11
11 MAYURBHANJ 90123 19948 110071 48017 8717 56734 51.54 1,667 170 10
12 JAJPUR 21167 5927 27094 9963 3093 13056 48.19 439 39 9
13 GANJAM 7382 571 7953 3796 15 3811 47.92 129 11 9
14 NUAPADA 17446 10291 27737 9127 4064 13191 47.56 455 40 9
15 ANGUL 12601 5524 18125 5653 2932 8585 47.37 298 26 9
16 PURI 12469 2110 14579 5813 1066 6879 47.18 241 21 9
17 SONEPUR 18539 6795 25334 8869 3026 11895 46.95 420 36 9
18 DEOGARH 2931 143 3074 1408 14 1422 46.26 52 4 8
19 NAYAGARH 8525 2146 10671 4062 822 4884 45.77 181 15 8
20 KENDUJHAR 28873 9330 38203 13865 3585 17450 45.68 649 52 8
21 BOUDH 16376 10032 26408 7183 4815 11998 45.43 450 36 8
22 KALAHANDI 35138 16982 52120 17925 5444 23369 44.84 898 70 8
23 CUTTACK 11629 430 12059 5374 21 5395 44.74 208 16 8
24 BHADRAK 27289 13366 40655 12841 5181 18022 44.33 707 54 8
25 BARGARH 26933 19218 46151 11667 8556 20223 43.82 810 61 7
26 RAYAGADA 9333 6626 15959 4562 2170 6732 42.18 288 20 7
27 JAGATSINGHAPUR 5660 638 6298 2512 0 2512 39.89 118 8 6
28 KHORDHA 5830 662 6492 2238 6 2244 34.57 133 7 5
29 BALESHWAR 38319 29204 67523 10738 12516 23254 34.44 1,383 70 5
30 KENDRAPARA 19192 5555 24747 6770 1098 7868 31.79 527 24 4
Total 547314 209664 756978 276245 94552 370797 48.98 12,068 1,114 9

30
Abstract Progress under House Completion during the FY 2020-21
FY Scheme Target Achievement %age Incomplete
2016-17
PMAY(G) 33315 9128 27.40 24187
BPGY 6170 1391 22.54 4779
PGY(Mining) 1365 169 12.38 1196
NSPGY 452 149 32.96 303
2017-18
PMAY(G) 34757 11630 33.46 23127
BPGY 1439 544 37.80 895
PGY(Mining) 114 27 23.68 87
NSPGY 220 92 41.82 128
2018-19
PMAY(G) 37248 15291 41.05 21957
BPGY 5980 3058 51.14 2922
NSPGY 3372 2167 64.26 1205
BPGY (Titli) 5199 3329 64.03 1870
2019-20
PMAY(G) 414967 227318 54.78 187649
BPGY 749 112 14.95 637
NSPGY 1967 1840 93.54 127
2020-21 PMAY(G) 209664 94552 45.10 115112
Total 7,56,978 3,70,797 48.98 3,86,181

31
Achievement against February’21 Target Sl. No. District Target Achievement % age
1 2 3 4 5
1 MAYURBHANJ 21,802 4,937 22.6
2 BOLANGIR 9,374 4,115 43.9
3 BALESHWAR 15,599 4,016 25.7
4 KALAHANDI 12,842 3,424 26.7
5 KENDUJHAR 8,650 3,039 35.1
6 BHADRAK 8,603 2,690 31.3
7 BARGARH 8,569 2,628 30.7
8 NUAPADA 7,941 2,178 27.4
9 JAJPUR 3,292 2,091 63.5
10 NABARANGAPUR 7,120 2,025 28.4
11 BOUDH 6,843 1,496 21.9
12 SONEPUR 5,341 1,413 26.5
13 KENDRAPARA 6,307 1,309 20.8
14 PURI 3,634 1,135 31.2
15 ANGUL 2,438 1,092 44.8
16 KORAPUT 2,534 1,028 40.6
17 DHENKANAL 2,076 1,023 49.3
18 RAYAGADA 3,024 907 30.0
19 NAYAGARH 1,704 854 50.1
20 SUNDARGARH 2,963 630 21.3
21 KHORDHA 1,216 387 31.8
22 CUTTACK 2,338 369 15.8
23 GANJAM 1,264 277 21.9
24 JHARSUGUDA 416 262 63.0
25 GAJAPATI 1,817 229 12.6
26 MALKANGIRI 637 168 26.4
27 KANDHAMAL 572 161 28.1
28 JAGATSINGHAPUR 1,081 134 12.4
29 DEOGARH 496 107 21.6
30 SAMBALPUR 305 31 10.2
Total 1,50,798 44,155 29.3

32
Progress against 6 Lakh Target Rank District Target Achievement %age
1 2 3 4 5
1 SAMBALPUR 2,160 1,930 89
2 JHARSUGUDA 2,959 2,409 81
3 DHENKANAL 17,317 13,756 79
4 SUNDARGARH 17,762 12,956 73
5 KANDHAMAL 3,288 2,355 72
6 JAJPUR 18,329 13,056 71
7 KORAPUT 14,864 10,552 71
8 MALKANGIRI 3,635 2,548 70
9 BOLANGIR 51,334 35,938 70
10 ANGUL 12,320 8,585 70
11 NABARANGAPUR 35,673 24,420 68
12 NAYAGARH 7,204 4,884 68
13 GANJAM 5,866 3,811 65
14 DEOGARH 2,201 1,422 65
15 MAYURBHANJ 90,733 56,734 63
16 GAJAPATI 7,290 4,409 60
17 BARGARH 33,690 20,223 60
18 BHADRAK 30,063 18,022 60
19 CUTTACK 9,014 5,395 60
20 RAYAGADA 11,262 6,732 60
21 JAGATSINGHAPUR 4,238 2,512 59
22 SONEPUR 20,152 11,895 59
23 KENDUJHAR 29,588 17,450 59
24 KHORDHA 3,974 2,244 56
25 PURI 12,274 6,879 56
26 KALAHANDI 42,034 23,369 56
27 BOUDH 22,607 11,998 53
28 NUAPADA 25,081 13,191 53
29 BALESHWAR 46,123 23,254 50
30 KENDRAPARA 16,963 7,868 46
Total 6,00,000 3,70,797 62
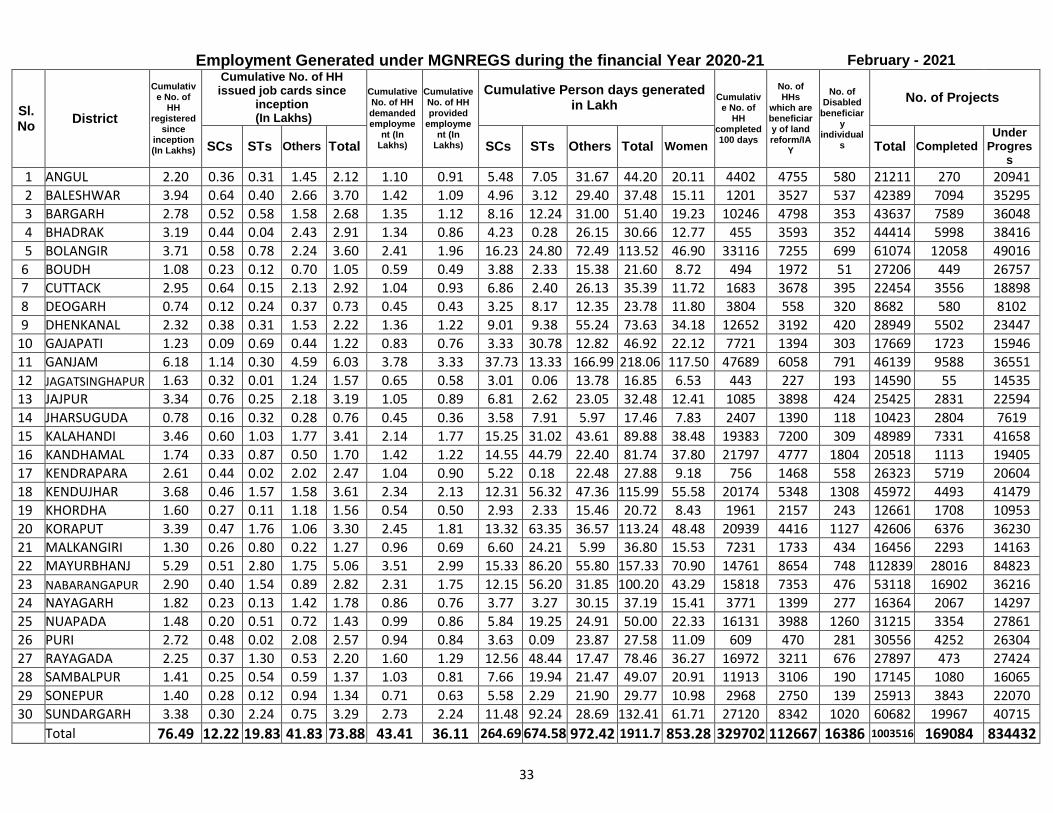
33
Employment Generated under MGNREGS during the financial Year 2020-21 February - 2021
Sl. No
District
Cumulative No. of
HH registered
since inception (In Lakhs)
Cumulative No. of HH issued job cards since
inception (In Lakhs)
Cumulative No. of HH demanded employme
nt (In Lakhs)
Cumulative No. of HH provided
employment (In
Lakhs)
Cumulative Person days generated in Lakh
Cumulative No. of
HH completed 100 days
No. of HHs
which are beneficiary of land reform/IA
Y
No. of Disabled
beneficiary
individuals
No. of Projects
SCs STs Others Total SCs STs Others Total Women Total Completed Under
Progress
1 ANGUL 2.20 0.36 0.31 1.45 2.12 1.10 0.91 5.48 7.05 31.67 44.20 20.11 4402 4755 580 21211 270 20941
2 BALESHWAR 3.94 0.64 0.40 2.66 3.70 1.42 1.09 4.96 3.12 29.40 37.48 15.11 1201 3527 537 42389 7094 35295
3 BARGARH 2.78 0.52 0.58 1.58 2.68 1.35 1.12 8.16 12.24 31.00 51.40 19.23 10246 4798 353 43637 7589 36048
4 BHADRAK 3.19 0.44 0.04 2.43 2.91 1.34 0.86 4.23 0.28 26.15 30.66 12.77 455 3593 352 44414 5998 38416
5 BOLANGIR 3.71 0.58 0.78 2.24 3.60 2.41 1.96 16.23 24.80 72.49 113.52 46.90 33116 7255 699 61074 12058 49016
6 BOUDH 1.08 0.23 0.12 0.70 1.05 0.59 0.49 3.88 2.33 15.38 21.60 8.72 494 1972 51 27206 449 26757
7 CUTTACK 2.95 0.64 0.15 2.13 2.92 1.04 0.93 6.86 2.40 26.13 35.39 11.72 1683 3678 395 22454 3556 18898
8 DEOGARH 0.74 0.12 0.24 0.37 0.73 0.45 0.43 3.25 8.17 12.35 23.78 11.80 3804 558 320 8682 580 8102
9 DHENKANAL 2.32 0.38 0.31 1.53 2.22 1.36 1.22 9.01 9.38 55.24 73.63 34.18 12652 3192 420 28949 5502 23447
10 GAJAPATI 1.23 0.09 0.69 0.44 1.22 0.83 0.76 3.33 30.78 12.82 46.92 22.12 7721 1394 303 17669 1723 15946
11 GANJAM 6.18 1.14 0.30 4.59 6.03 3.78 3.33 37.73 13.33 166.99 218.06 117.50 47689 6058 791 46139 9588 36551
12 JAGATSINGHAPUR 1.63 0.32 0.01 1.24 1.57 0.65 0.58 3.01 0.06 13.78 16.85 6.53 443 227 193 14590 55 14535
13 JAJPUR 3.34 0.76 0.25 2.18 3.19 1.05 0.89 6.81 2.62 23.05 32.48 12.41 1085 3898 424 25425 2831 22594
14 JHARSUGUDA 0.78 0.16 0.32 0.28 0.76 0.45 0.36 3.58 7.91 5.97 17.46 7.83 2407 1390 118 10423 2804 7619
15 KALAHANDI 3.46 0.60 1.03 1.77 3.41 2.14 1.77 15.25 31.02 43.61 89.88 38.48 19383 7200 309 48989 7331 41658
16 KANDHAMAL 1.74 0.33 0.87 0.50 1.70 1.42 1.22 14.55 44.79 22.40 81.74 37.80 21797 4777 1804 20518 1113 19405
17 KENDRAPARA 2.61 0.44 0.02 2.02 2.47 1.04 0.90 5.22 0.18 22.48 27.88 9.18 756 1468 558 26323 5719 20604
18 KENDUJHAR 3.68 0.46 1.57 1.58 3.61 2.34 2.13 12.31 56.32 47.36 115.99 55.58 20174 5348 1308 45972 4493 41479
19 KHORDHA 1.60 0.27 0.11 1.18 1.56 0.54 0.50 2.93 2.33 15.46 20.72 8.43 1961 2157 243 12661 1708 10953
20 KORAPUT 3.39 0.47 1.76 1.06 3.30 2.45 1.81 13.32 63.35 36.57 113.24 48.48 20939 4416 1127 42606 6376 36230
21 MALKANGIRI 1.30 0.26 0.80 0.22 1.27 0.96 0.69 6.60 24.21 5.99 36.80 15.53 7231 1733 434 16456 2293 14163
22 MAYURBHANJ 5.29 0.51 2.80 1.75 5.06 3.51 2.99 15.33 86.20 55.80 157.33 70.90 14761 8654 748 112839 28016 84823
23 NABARANGAPUR 2.90 0.40 1.54 0.89 2.82 2.31 1.75 12.15 56.20 31.85 100.20 43.29 15818 7353 476 53118 16902 36216
24 NAYAGARH 1.82 0.23 0.13 1.42 1.78 0.86 0.76 3.77 3.27 30.15 37.19 15.41 3771 1399 277 16364 2067 14297
25 NUAPADA 1.48 0.20 0.51 0.72 1.43 0.99 0.86 5.84 19.25 24.91 50.00 22.33 16131 3988 1260 31215 3354 27861
26 PURI 2.72 0.48 0.02 2.08 2.57 0.94 0.84 3.63 0.09 23.87 27.58 11.09 609 470 281 30556 4252 26304
27 RAYAGADA 2.25 0.37 1.30 0.53 2.20 1.60 1.29 12.56 48.44 17.47 78.46 36.27 16972 3211 676 27897 473 27424
28 SAMBALPUR 1.41 0.25 0.54 0.59 1.37 1.03 0.81 7.66 19.94 21.47 49.07 20.91 11913 3106 190 17145 1080 16065
29 SONEPUR 1.40 0.28 0.12 0.94 1.34 0.71 0.63 5.58 2.29 21.90 29.77 10.98 2968 2750 139 25913 3843 22070
30 SUNDARGARH 3.38 0.30 2.24 0.75 3.29 2.73 2.24 11.48 92.24 28.69 132.41 61.71 27120 8342 1020 60682 19967 40715
Total 76.49 12.22 19.83 41.83 73.88 43.41 36.11 264.69 674.58 972.42 1911.7 853.28 329702 112667 16386 1003516 169084 834432
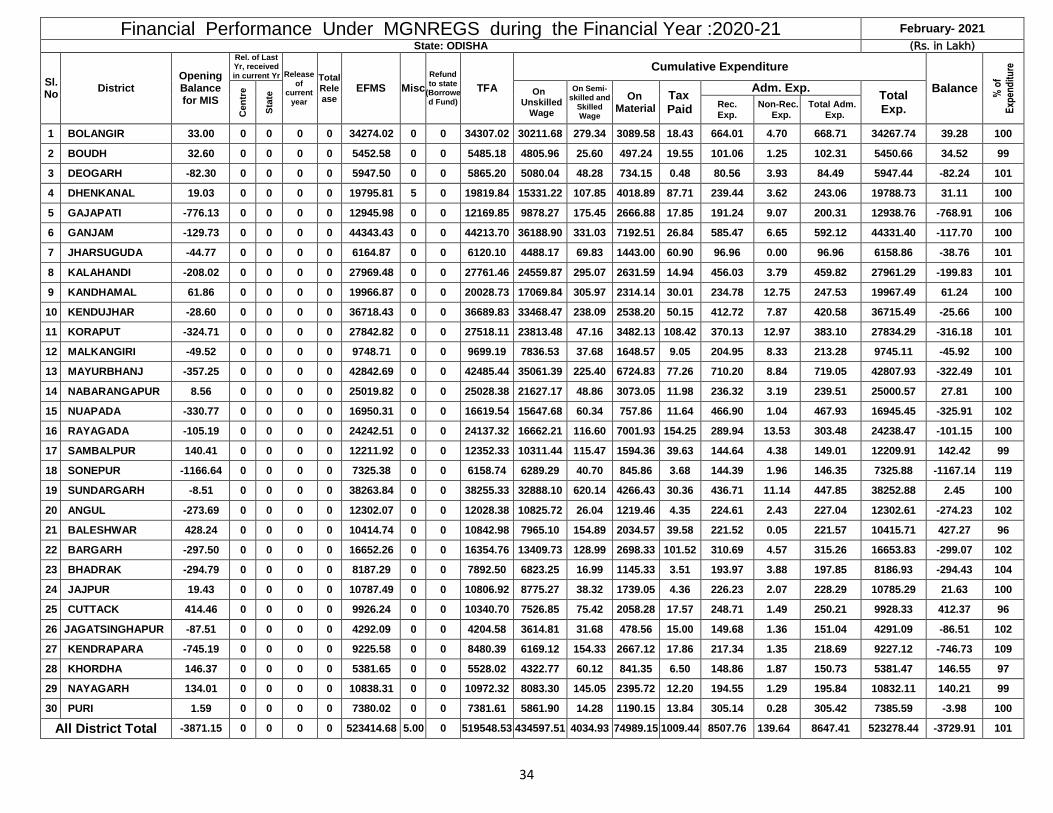
34
Financial Performance Under MGNREGS during the Financial Year :2020-21 February- 2021
State: ODISHA (Rs. in Lakh)
Sl. No
District Opening Balance for MIS
Rel. of Last Yr, received in current Yr Release
of current
year
Total Release
EFMS Misc
Refund to state
(Borrowed Fund)
TFA
Cumulative Expenditure
Balance
% o
f
Exp
end
itu
re
Cen
tre
Sta
te On
Unskilled Wage
On Semi-skilled and
Skilled Wage
On Material
Tax Paid
Adm. Exp. Total Exp.
Rec. Exp.
Non-Rec. Exp.
Total Adm. Exp.
1 BOLANGIR 33.00 0 0 0 0 34274.02 0 0 34307.02 30211.68 279.34 3089.58 18.43 664.01 4.70 668.71 34267.74 39.28 100
2 BOUDH 32.60 0 0 0 0 5452.58 0 0 5485.18 4805.96 25.60 497.24 19.55 101.06 1.25 102.31 5450.66 34.52 99
3 DEOGARH -82.30 0 0 0 0 5947.50 0 0 5865.20 5080.04 48.28 734.15 0.48 80.56 3.93 84.49 5947.44 -82.24 101
4 DHENKANAL 19.03 0 0 0 0 19795.81 5 0 19819.84 15331.22 107.85 4018.89 87.71 239.44 3.62 243.06 19788.73 31.11 100
5 GAJAPATI -776.13 0 0 0 0 12945.98 0 0 12169.85 9878.27 175.45 2666.88 17.85 191.24 9.07 200.31 12938.76 -768.91 106
6 GANJAM -129.73 0 0 0 0 44343.43 0 0 44213.70 36188.90 331.03 7192.51 26.84 585.47 6.65 592.12 44331.40 -117.70 100
7 JHARSUGUDA -44.77 0 0 0 0 6164.87 0 0 6120.10 4488.17 69.83 1443.00 60.90 96.96 0.00 96.96 6158.86 -38.76 101
8 KALAHANDI -208.02 0 0 0 0 27969.48 0 0 27761.46 24559.87 295.07 2631.59 14.94 456.03 3.79 459.82 27961.29 -199.83 101
9 KANDHAMAL 61.86 0 0 0 0 19966.87 0 0 20028.73 17069.84 305.97 2314.14 30.01 234.78 12.75 247.53 19967.49 61.24 100
10 KENDUJHAR -28.60 0 0 0 0 36718.43 0 0 36689.83 33468.47 238.09 2538.20 50.15 412.72 7.87 420.58 36715.49 -25.66 100
11 KORAPUT -324.71 0 0 0 0 27842.82 0 0 27518.11 23813.48 47.16 3482.13 108.42 370.13 12.97 383.10 27834.29 -316.18 101
12 MALKANGIRI -49.52 0 0 0 0 9748.71 0 0 9699.19 7836.53 37.68 1648.57 9.05 204.95 8.33 213.28 9745.11 -45.92 100
13 MAYURBHANJ -357.25 0 0 0 0 42842.69 0 0 42485.44 35061.39 225.40 6724.83 77.26 710.20 8.84 719.05 42807.93 -322.49 101
14 NABARANGAPUR 8.56 0 0 0 0 25019.82 0 0 25028.38 21627.17 48.86 3073.05 11.98 236.32 3.19 239.51 25000.57 27.81 100
15 NUAPADA -330.77 0 0 0 0 16950.31 0 0 16619.54 15647.68 60.34 757.86 11.64 466.90 1.04 467.93 16945.45 -325.91 102
16 RAYAGADA -105.19 0 0 0 0 24242.51 0 0 24137.32 16662.21 116.60 7001.93 154.25 289.94 13.53 303.48 24238.47 -101.15 100
17 SAMBALPUR 140.41 0 0 0 0 12211.92 0 0 12352.33 10311.44 115.47 1594.36 39.63 144.64 4.38 149.01 12209.91 142.42 99
18 SONEPUR -1166.64 0 0 0 0 7325.38 0 0 6158.74 6289.29 40.70 845.86 3.68 144.39 1.96 146.35 7325.88 -1167.14 119
19 SUNDARGARH -8.51 0 0 0 0 38263.84 0 0 38255.33 32888.10 620.14 4266.43 30.36 436.71 11.14 447.85 38252.88 2.45 100
20 ANGUL -273.69 0 0 0 0 12302.07 0 0 12028.38 10825.72 26.04 1219.46 4.35 224.61 2.43 227.04 12302.61 -274.23 102
21 BALESHWAR 428.24 0 0 0 0 10414.74 0 0 10842.98 7965.10 154.89 2034.57 39.58 221.52 0.05 221.57 10415.71 427.27 96
22 BARGARH -297.50 0 0 0 0 16652.26 0 0 16354.76 13409.73 128.99 2698.33 101.52 310.69 4.57 315.26 16653.83 -299.07 102
23 BHADRAK -294.79 0 0 0 0 8187.29 0 0 7892.50 6823.25 16.99 1145.33 3.51 193.97 3.88 197.85 8186.93 -294.43 104
24 JAJPUR 19.43 0 0 0 0 10787.49 0 0 10806.92 8775.27 38.32 1739.05 4.36 226.23 2.07 228.29 10785.29 21.63 100
25 CUTTACK 414.46 0 0 0 0 9926.24 0 0 10340.70 7526.85 75.42 2058.28 17.57 248.71 1.49 250.21 9928.33 412.37 96
26 JAGATSINGHAPUR -87.51 0 0 0 0 4292.09 0 0 4204.58 3614.81 31.68 478.56 15.00 149.68 1.36 151.04 4291.09 -86.51 102
27 KENDRAPARA -745.19 0 0 0 0 9225.58 0 0 8480.39 6169.12 154.33 2667.12 17.86 217.34 1.35 218.69 9227.12 -746.73 109
28 KHORDHA 146.37 0 0 0 0 5381.65 0 0 5528.02 4322.77 60.12 841.35 6.50 148.86 1.87 150.73 5381.47 146.55 97
29 NAYAGARH 134.01 0 0 0 0 10838.31 0 0 10972.32 8083.30 145.05 2395.72 12.20 194.55 1.29 195.84 10832.11 140.21 99
30 PURI 1.59 0 0 0 0 7380.02 0 0 7381.61 5861.90 14.28 1190.15 13.84 305.14 0.28 305.42 7385.59 -3.98 100
All District Total -3871.15 0 0 0 0 523414.68 5.00 0 519548.53 434597.51 4034.93 74989.15 1009.44 8507.76 139.64 8647.41 523278.44 -3729.91 101

35
Construction of AWC under MGNREGS upto February-2021
S No. Districts Taken up On going Completed
1 KHORDHA 327 308 19
2 KALAHANDI 198 179 19
3 BOUDH 86 82 4
4 DEOGARH 89 79 10
5 NUAPADA 65 60 5
6 KENDRAPARA 488 446 42
7 ANGUL 125 106 19
8 MALKANGIRI 56 49 7
9 RAYAGADA 233 202 31
10 CUTTACK 552 496 56
11 GANJAM 581 528 53
12 JAJPUR 411 336 75
13 NABARANGAPUR 190 166 24
14 PURI 401 355 46
15 GAJAPATI 473 426 47
16 SONEPUR 203 171 32
17 JAGATSINGHAPUR 177 146 31
18 KENDUJHAR 197 158 39
19 KANDHAMAL 429 346 83
20 KORAPUT 469 372 97
21 BARGARH 797 656 141
22 BOLANGIR 284 241 43
23 NAYAGARH 388 310 78
24 MAYURBHANJ 143 103 40
25 JHARSUGUDA 67 51 16
26 SAMBALPUR 45 36 9
27 BALESHWAR 671 497 174
28 BHADRAK 295 222 73
29 SUNDARGARH 127 70 57
30 DHENKANAL 148 74 74
Total 8715 7271 1444

36
WEEKLY INFORMATION ON DRINKING WATER SUPPLY As on February- 2021
Sl. No.
Name of the District
INFORMATION ON TUBEWELLs (TWs) INFORMATION ON PWSS No. of Water
Scarcity Villages/ Wards
No. of Villages/ Wards
Covered Water Tanker
No. of Water
Tankers Engaged
Remarks
Total No. of Functional Tube wells (Includes Col. No.5)
Cumulative No. of
Repairable Non-
functional Tube wells
Cumulative No. of
Tube wells Repaired (Out of
Col. No.4)
Total No. of TWs (Both
Functional & Non- functional)
[Col. No.3 + (Col. No.4 - Col. No.5)]
Percentage of Tube
wells Repaired
Total No. of Functional
PWSSs (Includes
Col. No.10)
Cumulative No. of
Repairable Non-
functional PWSSs
Cumulative No. of PWSSs repaired (Out of Col. No.9)
Total No. of PWSSs
(Both Functional & Non- functional) [Col. No.8 + (Col.
No.9 - Col. No.10)]
Percentage of Repaired
PWSSs
1 2 3 4 5 6 7 8 9 10 11 12 13 14 15 16
1 ANGUL 15490 9005 9005 15490 100.00 425 257 254 428 99.00 0 0 0
2 BALASORE 20025 1856 1849 20032 99.62 581 227 215 593 94.71 14 14 7
3 BALANGIR 21181 1562 1556 21187 99.62 541 241 237 545 98.34 0 0 2
4 BARGARH 15568 1660 1644 15584 99.04 468 9 7 470 77.78 53 12 11
5 BHADRAK 18103 3534 3527 18110 99.00 319 23 22 320 95.65 0 0 0
6 BOUDH 6723 1504 1499 6728 100.00 151 33 32 152 97.00 0 0 0
7 CUTTACK 23502 2686 2676 23512 99.63 573 431 416 588 96.52 42 21 22
8 DEOGARH 7050 2441 2435 7056 99.75 220 112 103 229 91.96 17 6 2
9 DHENKANAL 12655 2139 2125 12669 99.35 360 128 122 366 95.31 119 16 12
10 GAJAPATI 7472 813 804 7481 98.89 654 32 31 655 96.88 0 0 0
11 GANJAM 28839 5869 5802 28906 98.86 1535 282 259 1558 91.84 7 7 5
12 JAGATSINGHPUR 14327 135 135 14327 100.00 299 0 0 299 100.00 57 0 0
13 JAJPUR 17257 8339 8335 17261 100.00 318 254 245 327 96.00 19 0 0
14 JHARSUGUDA 6852 809 809 6852 100.00 194 50 48 196 96.00 113 50 44
15 KALAHANDI 20386 2116 2104 20398 99.43 281 42 32 291 76.19 7 1 1
16 KANDHAMAL 16988 3248 3237 16999 99.66 271 179 165 285 92.18 0 0 0
17 KENDRAPARA 16983 1148 1148 16983 100.00 294 68 67 295 98.53 6 6 5
18 KEONJHAR 20146 2082 2070 20158 99.42 503 127 123 507 96.85 49 49 24
19 KHURDA 15649 1095 1084 15660 99.00 451 191 186 456 97.38 21 6 5
20 KORAPUT 14936 2178 2107 15007 96.74 509 48 40 517 83.33 399 0 1
21 MALKANGIRI 12093 1259 1210 12142 96.11 342 45 13 374 28.89 0 0 0
22 MAYURBHANJ 30005 4989 4979 30015 99.80 581 70 65 586 92.86 36 36 33
23 NAWARANGPUR 17167 142 141 17168 99.30 346 121 119 348 98.35 0 0 0
24 NAYAGARH 12438 639 630 12447 98.59 434 533 524 443 98.31 2 0 0
25 NUAPADA 10320 84 84 10320 100.00 173 18 10 181 55.56 0 0 0
26 PURI 14259 1175 1164 14270 99.06 330 134 114 350 85.07 220 170 96
27 RAYAGADA 13171 6299 6299 13171 100.00 535 342 342 535 100.00 0 0 0
28 SAMBALPUR 13938 1270 1270 13938 100.00 235 30 30 235 100.00 0 129 58
29 SONEPUR 8718 1200 1198 8720 99.83 291 84 81 294 96.43 0 2 2
SUNDERGARH 28072 1181 1178 28075 99.75 416 100 91 425 91.00 0 0 0
Total 480313 72457 72104 480666 99.51 12630 4211 3993 12848 93.93 1181 525 330

37
MONTHLY PHYSICAL ACHIEVEMENT OF LOB & NOLB UNDER SBM-G PROGRAMME OF SANITATION FOR FY 2020-21. Reporting Month- February 2021 (As per SBM-G IMIS Data)
Sl. No. Name of the District
LOB & NoLB Physical Progress
Total Target for 2020-21
Achieved till end of January 2021
Achieved in February 2021
Total No. Achieved
% Achievement
1 2 3 4 5 6 = (4+5) 7= (6/3)*100
1 ANGUL 7,838 8,023 0 8,023 102.36%
2 BALANGIR 18,578 18,582 0 18,582 100.02%
3 BALESWAR 20,992 20603 8 20,611 98.19%
4 BARGARH 7,411 7,518 0 7,518 101.44%
5 BHADRAK 14,317 14,525 0 14,525 101.45%
6 BOUDH 0 0 0 0 -
7 CUTTACK 5,922 5,980 47 6,027 101.77%
8 DEBAGARH 1,946 1948 0 1,948 100.10%
9 DHENKANAL 763 763 0 763 100.00%
10 GAJAPATI 8,788 8,810 0 8,810 100.25%
11 GANJAM 10,511 13012 0 13,012 123.79%
12 JAGATSINGHAPUR 4,125 4,472 0 4,472 108.41%
13 JAJAPUR 23,343 23829 0 23829 102.08%
14 JHARSUGUDA 2,147 2,147 0 2,147 100.00%
15 KALAHANDI 13,399 13974 0 13,974 104.29%
16 KANDHAMAL 6,340 6,627 8 6,635 104.65%
17 KENDRAPARA 5,639 6,048 7 6,055 107.38%
18 KENDUJHAR 538 667 0 667 123.98%
19 KHORDHA 9,593 10,719 24 10,743 111.99%
20 KORAPUT 13,882 13,949 0 13,949 100.48%
21 MALKANGIRI 5,736 5737 0 5737 100.02%
22 MAYURBHANJ 23,884 24,438 21 24,459 102.41%
23 NABARANGAPUR 9,013 9,004 0 9,004 99.90%
24 NAYAGARH 3,026 3105 0 3,105 102.61%
25 NUAPADA 3,889 3,894 0 3,894 100.13%
26 PURI 2,658 3,522 0 3,522 132.51%
27 RAYAGADA 4,457 4,550 0 4,550 102.09%
28 SAMBALPUR 1,692 1,698 1 1,699 100.41%
29 SONEPUR 3359 3492 0 3492 103.96%
30 SUNDARGARH 10507 10734 0 10734 102.16%
Total 244,293 252,370 116 252,486 102.79 %
*The overall achievement exceeds 100% as some of the district will delete the ineligible Households from the IMIS.

38
Sanitation (SBM-G) Monthly Financial Achievement Report Period end of February-2021
SN Name of the District Financial Progress (in Lakhs)
Total funds Allocated (Target)
Expenditure till previous month
Expenditure in the month
Total expenditure % of Expenditure
1 2 3 4 5 6= (4+5) 7 = (6/3)*100
1 ANGUL 2050 1966.59 43.57 2010.16 98.06%
2 BALANGIR 3,950 3,864.03 68.65 3,932.68 99.56%
3 BALESWAR 3350 3225.15 103.50 3328.65 99.36%
4 BARGARH 2,300 2250.93 10.40 2261.33 98.32%
5 BHADRAK 3,200 2970.06 186.11 3,156.18 98.63%
6 BOUDH 500 453.18 3.98 457.16 91.43%
7 CUTTACK 2700 2535.85 136.01 2671.86 98.96%
8 DEBAGARH 550 505.99 18.00 523.99 95.27%
9 DHENKANAL 850 805.15 10.35 815.50 95.94%
10 GAJAPATI 1350 1323.04 0.27 1323.32 98.02%
11 GANJAM 2,050 2004.02 33.47 2,037.49 99.39%
12 JAGATSINGHAPUR 1650 1606.70 2.87 1609.57 97.55%
13 JAJAPUR 3,650 3550.67 82.81 3,633.48 99.55%
14 JHARSUGUDA 450 412.29 0.00 412.29 91.62%
15 KALAHANDI 2,950 2902.34 6.76 2,909.10 98.61%
16 KANDHAMAL 1350 1333.09 14.25 1347.34 99.80%
17 KENDRAPARA 2100 1982.18 111.53 2093.71 99.70%
18 KENDUJHAR 1400 1357.82 11.68 1369.49 97.82%
19 KHORDHA 2350 2242.67 95.89 2338.56 99.51%
20 KORAPUT 4,750 4635.96 74.57 4,710.53 99.17%
21 MALKANGIRI 1450 1436.56 7.55 1444.12 99.59%
22 MAYURBHANJ 4,600 4,504.13 66.48 4,570.60 99.36%
23 NABARANGAPUR 2100 2068.19 10.40 2078.59 98.98%
24 NAYAGARH 1200 1178.72 10.91 1189.63 99.14%
25 NUAPADA 1500 1371.19 121.91 1493.09 99.54%
26 PURI 2000 1981.47 5.02 1986.49 99.32%
27 RAYAGADA 900 872.14 17.78 889.92 98.88%
28 SAMBALPUR 450 440.22 0.02 440.24 97.83%
29 SONEPUR 600 572.22 5.81 578.03 96.34%
30 SUNDARGARH 3,100 3009.17 44.59 3053.75 98.51%
Total 61,400 59,361.72 1,305.15 60,666.86 98.81%
State HQ. 570 565.09 216.12 781.21 137.06%
Grand Total 61,970 59,926.81 1,521.27 61,448.08 99.16%

39
PANCHAYATI RAJ & DRINKING WATER DEPARTMENT
MONTHLY PERFORMANCE REPORT UP TO END OF FEBRUARY, 2021
Name of the Scheme
FINANCIAL
Target
PHYSICAL
Total Fund Available
Expenditure (Rs. in Crore)
ACHIEVEMENT
Up to end of the month
% of Exp. Up to end of the month
% of Ach. Unit
JJM 2240.00 874.34 39.03 450 393 87.33 No. of Projects
BASUDHA 2500.00 673.26 26.93 650 589 90.62 No. of Projects
RIDF 750.00 686.73 91.56 110 71 64.55 No. of Projects
4TH SFC (MEGA PWS) 135.00 44.08 32.65 7 0 0.00 No. of Projects
OMBADC 2732.10 1214.80 44.46 14 1 7.14 No. of Projects
DMF 1319.48 660.38 50.05 476 106 22.27 No. of Projects
TOTAL 9676.58 4153.59 42.92 1707 1160 67.96

40
PHYSICAL & FINANCIAL ACHIEVEMENT UNDER GOPABANDHU GRAMINA YOJANA (GGY) FEBRUARY- 2021
Sl. No
DRDAs
FINANCIAL (` in lakh) PHYSICAL (In No.) Man-days Generated
(In Lakh)
Length of
CC Road
(in Km)
O.B. as on 01.04.20
Received during 2019-20
Other
receipt
Total funds
Available
EXPENDITURE
%
Balance funds
(Col. 6-Col.11)
Spill
Over
Projects
Projects during FY
2019-20
Total Proje
cts Taken up
Works
Completed
%
Works in Progress Bijli Sadak Pani
Other works
Total
1 2 3 4 5 6 7 8 9 10 11 12 13 14 15 16 17 18 19 20 21
1 ANGUL 196.68 0.00 0.00 196.68 0.00 0.00 0.00 0.00 0.00 0.00 196.68 0 0 0 0 0.00 0 0.00 0.00
2 BALASORE 547.75 0.00 0.00 547.75 0.00 207.93 0.00 0.00 207.93 37.96 339.82 228 0 228 207 90.79 21 0.21 6.24 3 BARGARH 182.58 0.00 0.00 182.58 0.00 101.97 17.43 2.36 121.76 66.69 60.82 92 0 92 26 28.26 66 0.04 3.06 4 BHADRAK 19.43 0.00 0.00 19.43 0.00 15.59 0.00 0.00 15.59 80.24 3.84 446 0 446 8 1.79 438 0.90 0.47
5 BOLANGIR 0.00 0.00 0.00 0.00 0.00 0.00 0.00 0.00 0.00 0.00 0.00 4 0 4 4 100.00 0 0.00 0.00 6 BOUDH 0.00 805.73 0.00 805.73 109.30 529.79 166.64 0.00 805.73 100.00 0.00 469 0 469 469 100.00 0 1.92 14.33
7 CUTTACK 242.11 0.00 0.00 242.11 3.25 51.87 0.00 0.00 55.12 22.77 186.99 274 0 274 206 75.18 68 0.08 15.89 8 DEOGARH 23.19 0.00 0.00 23.19 0.00 0.00 0.00 0.00 0.00 0.00 23.19 0 0 0 0 0.00 0 0.00 0.00
9 DHENKANAL 0.01 0.00 0.00 0.01 0.00 0.00 0.00 0.00 0.00 0.00 0.01 0 0 0 0 0.00 0 0.00 0.00 10 GAJAPATI 146.31 0.00 0.00 146.31 9.05 100.88 23.44 0.00 133.37 91.16 12.94 53 0 53 50 94.34 3 0.11 7.83 11 GANJAM 82.07 0.00 0.00 82.07 5.50 63.77 0.00 0.00 69.27 84.40 12.80 146 0 146 90 61.64 56 0.00 0.00
12 JAGATSINGHPUR 93.33 0.00 0.00 93.33 0.65 29.84 0.00 0.00 30.49 32.67 62.84 47 31 78 32 41.03 46 0.02 0.87
13 JAJPUR 126.26 0.00 0.00 126.26 0.00 0.00 0.00 0.00 0.00 0.00 126.26 384 0 384 219 57.03 165 0.05 7.10
14 JHARSUGUDA 44.66 0.00 0.00 44.66 0.00 2.00 9.50 0.00 11.50 25.75 33.16 22 0 22 1 4.55 21 0.00 0.00
15 KALAHANDI 747.49 0.00 4.93 752.42 15.18 23.20 49.56 8.31 96.25 12.79 656.17 555 0 555 66 11.89 489 0.10 22.01 16 KANDHAMAL 203.20 0.00 27.07 230.27 50.41 48.20 18.66 0.00 117.27 50.93 113.00 141 8 149 84 56.38 65 0.32 3.96
17 KENDRAPARA 638.35 0.00 0.00 638.35 0.00 329.37 0.00 0.00 329.37 51.60 308.98 190 190 380 143 37.63 237 0.06 5.59 18 KEONJHAR 1374.30 0.00 0.00 1374.30 95.95 1230.06 48.29 0.00 1374.30 100.00 0.00 866 0 866 866 100.00 0 0.00 0.00
19 KHURDA 109.66 0.00 0.00 109.66 19.00 11.98 38.32 0.00 69.30 63.20 40.36 122 0 122 0 0.00 122 0.00 0.00
20 KORAPUT 1450.67 0.00 0.00 1450.67 0.00 93.00 200.00 0.00 293.00 20.20 1157.67 98 2 100 100 100.00 0 0.00 0.00 21 MALKANGIRI 67.41 0.00 0.00 67.41 41.50 9.65 16.26 0.00 67.41 100.00 0.00 82 0 82 82 100.00 0 8.44 0.00 22 MAYURBHANJ 2410.20 0.00 0.00 2410.20 244.68 242.51 486.37 0.00 973.56 40.39 1436.64 808 0 808 536 66.34 272 1.72 7.82
23 NAWARANGPUR 120.21 0.00 0.00 120.21 0.00 112.75 3.00 0.00 115.75 96.29 4.46 32 13 45 31 68.89 14 0.28 2.98
24 NAYAGARH 447.99 0.00 0.00 447.99 0.00 187.95 80.80 0.00 268.75 59.99 179.24 186 0 186 99 53.23 87 0.02 4.17
25 NUAPADA 184.70 3.50 17.00 205.20 0.00 89.06 5.00 57.40 151.46 73.81 53.74 47 0 47 40 85.11 7 1.00 2.00 26 PURI 154.05 0.00 0.00 154.05 0.00 135.70 6.00 0.00 141.70 91.98 12.35 101 0 101 72 71.29 29 0.04 4.52 27 RAYAGADA 356.56 0.00 0.00 356.56 6.50 37.30 14.20 0.00 58.00 16.27 298.56 185 0 185 48 25.95 137 1.46 29.80 28 SAMBALPUR 1590.58 0.00 278.00 1868.58 0.00 528.11 239.15 0.00 767.26 41.06 1101.32 936 936 371 39.64 565 0.00 14.41
29 SONEPUR 263.25 0.00 0.00 263.25 66.83 65.32 22.86 0.00 155.01 58.88 108.24 125 0 125 70 56.00 55 0.08 2.14
30 SUNDERGARH 2517.29 0.00 0.00 2517.29 0.00 0.00 0.00 0.00 0.00 0.00 2517.29 29 0 29 29 100.00 0 0.00 0.00
TOTAL 14340.30 809.23 327.00 15476.53 667.80 4247.80 1445.48 68.07 6429.15 41.54 9047.38 6668 244 6912 3949 57.13 2963 16.84 155.18

41
FINANCIAL AND PHYSICAL ACHIEVEMENT UNDER 14TH FINANCE COMMISSION DURING THE YEAR 2020-2021, Month:-February - 2021
SL. NO.
Name of the District
Financial Achievement (Rs. in Lakh) Physical Achievement
Project Completed
Under Progress
Remarks O.B. (As on 01.04.2020)
Other Receipt (int. etc.) 2020-21
Total Funds
Expenditure incurred
% exp.
Balance No. of Projects
Spill over
Taken up
Total
1 2 3 4 5 6 7 8 9 10 11 12 13 14
1 Angul 8397.24 0.00 8397.24 5115.34 61 3281.89 965 682 1647 844 803
2 Balasore 21366.47 247.00 21613.47 10537.46 22 11076.00 3129 861 3990 2001 1989
3 Bargarh 6997.98 0.00 6997.98 4847.73 83 2150.25 371 27 398 256 142
4 Bhadrak 18592.38 0.00 18592.38 5822.43 32 12769.94 5538 0 5538 3662 1876
5 Bolangir 5767.53 0.00 5767.53 5930.97 183 -163.44 1270 436 1706 1673 33
6 Boudh 1625.20 0.00 1625.20 1557.41 96 67.79 39 0 39 20 19
7 Cuttack 16483.48 0.00 16483.48 8062.07 49 8421.41 1743 81 1824 1463 361
8 Deogarh 2216.10 0.00 2216.10 1788.33 81 427.77 489 0 489 89 400
9 Dhenkanal 3544.83 0.00 3544.83 3943.33 111 -398.50 483 626 1109 1005 104
10 Gajapati 5577.54 0.00 5577.54 4248.75 76 1328.79 395 150 545 240 305
11 Ganjam 15277.34 0.00 15277.34 17068.15 112 -1790.80 6050 0 6050 1502 4548
12 Jagatsinghpur 9894.59 0.00 9894.59 4522.89 46 5371.70 938 546 1484 939 545
13 Jajpur 5051.82 0.00 5051.82 8017.56 159 -2965.74 146 285 431 375 56
14 Jharsuguda 3030.70 0.00 3030.70 1684.73 56 1345.97 381 183 564 187 377
15 Kalahandi 10662.41 0.00 10662.41 7252.08 68 3410.33 2558 268 2826 435 2391
16 Kandhamal 10003.56 0.00 10003.56 5540.48 55 4463.08 1893 0 1893 302 1591
17 Kendrapara 7851.03 0.00 7851.03 7027.68 90 823.35 3672 0 3672 1201 2471
18 Keonjhar 15183.09 0.00 15183.09 8389.91 55 6793.18 787 0 787 0 787
19 Khurda 4584.10 0.00 4584.10 4587.10 100 -3.00 847 670 1517 1329 188
20 Koraput 8131.79 0.00 8131.79 6415.07 79 1716.73 693 0 693 527 166
21 Malkangiri 5960.75 0.00 5960.75 4380.19 73 1580.56 2137 0 2137 799 1338
22 Mayurbhanj 34443.59 0.00 34443.59 12170.64 35 22272.95 1665 5418 7083 4770 2313
23 Nabarangapur 6626.67 0.00 6626.67 6709.39 101 -82.73 1056 0 1056 158 898
24 Nayagarh 5345.35 0.00 5345.35 5316.29 99 29.06 545 0 545 354 191
25 Nuapada 5363.68 0.00 5363.68 3592.37 67 1771.31 176 0 176 68 108
26 Puri 8188.21 0.00 8188.21 7134.90 87 1053.31 465 300 765 520 245
27 Rayagada 16554.94 0.00 16554.94 5413.07 33 11141.87 1233 51 1284 64 1220
28 Sambalpur 8741.50 0.00 8741.50 4057.04 46 4684.46 1848 0 1848 644 1204
29 Subarnapur 5229.41 0.00 5229.41 3318.38 63 1911.03 237 0 237 215 22
30 Sundargarh 11304.06 0.00 11304.06 5759.68 51 5544.38 53 112 165 98 67
State Total 287997.33 247.00 288244.33 180211.41 63 108032.92 41802 10696 52498 25740 26758

42
FINANCIAL ACHIEVEMENT UNDER 15TH FINANCE COMMISSION DURING THE YEAR 2020-2021, Month:-February 2021
Sl. No.
District Name Grant Receipt 2020-21 (in Lakhs) Total Funds
Available (in Lakhs)
Expenditure (in Lakhs) Total expenditure incurred
(in Lakhs) Zilla Parishads
Panchayat Samitis
Gram Panchayats
Zilla Parishads Panchayat
Samitis Gram
Panchayats
1 2 3 4 5 6 7 8 9 10
1 ANUGUL 431.00 1121.00 3742.38 5294.38 0.00 0.00 326.52 326.52
2 BALANGIR 755.00 1579.00 5071.26 7405.26 503.38 51.37 729.86 1284.60
3 BALESHWAR 647.00 1794.00 6453.96 8894.96 0.00 0.00 1226.69 1226.69
4 BARGARH 647.00 1261.00 4217.52 6125.52 0.00 0.00 691.65 691.65
5 BHADRAK 378.00 1086.00 3938.40 5402.40 0.00 41.88 1117.97 1159.85
6 BOUDH 162.00 344.00 1246.80 1752.80 0.00 0.00 200.20 200.20
7 CUTTACK 755.00 1858.00 6272.67 8885.67 0.00 0.00 1040.32 1040.32
8 DEOGARH 162.00 349.00 1110.24 1621.24 0.00 32.57 64.26 96.83
9 DHENKANAL 431.00 1056.00 3523.11 5010.11 0.00 0.00 277.54 277.54
10 GAJAPATI 378.00 742.00 2418.48 3538.48 251.69 0.00 283.61 535.30
11 GANJAM 1187.00 2506.00 8855.16 12548.16 0.00 142.90 1160.98 1303.88
12 JAGATSINGHAPUR 431.00 986.00 3347.34 4764.34 0.00 0.00 121.03 121.03
13 JAJAPUR 539.00 1549.00 5413.14 7501.14 0.00 0.00 355.11 355.11
14 JHARSUGUDA 269.00 389.00 1241.97 1899.97 0.00 72.12 134.90 207.02
15 KALAHANDI 701.00 1545.00 5110.65 7356.65 0.00 53.00 569.75 622.75
16 KANDHAMAL 647.00 852.00 2856.63 4355.63 0.00 9.78 657.86 667.64
17 KENDRAPARA 485.00 1241.00 4314.09 6040.09 0.00 0.00 324.09 324.09
18 KENDUJHAR 701.00 1480.00 5417.88 7598.88 0.00 16.52 366.23 382.75
19 KHORDHA 539.00 947.00 3583.02 5069.02 0.00 0.00 491.72 491.72
20 KORAPUT 755.00 1196.00 4317.39 6268.39 0.00 35.09 345.93 381.02
21 MALKANGIRI 378.00 553.00 2057.76 2988.76 0.00 63.53 25.94 89.46
22 MAYURBHANJ 1402.00 2013.00 7874.13 11289.13 0.00 0.00 1194.87 1194.87
23 NABARANGPUR 539.00 941.00 3797.88 5277.88 0.00 0.00 229.25 229.25
24 NAYAGARH 431.00 967.00 3119.43 4517.43 0.00 104.01 429.81 533.82
25 NUAPADA 270.00 652.00 2075.43 2997.43 0.00 27.95 218.71 246.66
26 PURI 593.00 1335.00 4577.76 6505.76 0.00 0.00 391.46 391.46
27 RAYAGADA 593.00 907.00 3252.93 4752.93 0.00 0.00 495.99 495.99
28 SAMBALPUR 485.00 688.00 2359.26 3532.26 0.00 16.75 374.12 390.87
29 SONEPUR 324.00 543.00 1822.41 2689.41 0.00 0.00 351.00 351.00
30 SUNDARGARH 917.00 1390.00 5155.59 7462.59 0.00 0.00 1013.83 1013.83
Total 16932.00 33870.00 118544.67 169346.67 755.06 667.47 15211.19 16633.72

43
ABSTRACT REPORT OF FINANCIAL AND PHYSICAL ACHIEVEMENT UNDER 4TH STATE FINANCE COMMISSION AWARD During the year 2020-21 up to the month of February'21
Sl.
No.
Name of the
District
Financial Achievement (Rs. in lakhs) Physical achievement Road (in Km.)
CC/BT/ Water Board
Macadam / earthen
OB as on 01.4.2020
Grant Recei
pt
(2020-21)
Other receipt (int. etc.)
2020-21
Total Funds
Expenditure
incurred
% Exp.
Balance UC
submitted
No. of projects Project
completed
Under progre
ss Spill Over
taken up
Total
1 2 3 4 5 6 7 8 9 10 11 12 13 14 15 16
1 Angul 5058.24 0.00 0.00 5058.24 1667.48 33 3390.76 0.00 488 351 839 560 279 0.76 2 Balasore 12373.71 0.00 0.00 12373.71 1314.27 11 11059.44 0.00 643 275 918 383 535 28.20
3 Bargarh 4123.45 22.88 0.00 4146.33 1803.17 43 2343.16 0.00 823 240 1063 592 471 12.40
4 Bhadrak 5798.30 0.00 0.00 5798.30 1681.25 29 4117.05 0.00 631 228 859 629 230 0.00
5 Balangir 3823.93 0.00 6.00 3829.93 1428.06 37 2401.87 0.00 614 166 780 530 250 0.00
6 Boudh 765.48 0.00 0.00 765.48 32.10 4 733.38 0.00 36 3 39 12 27 0.00 7 Cuttack 11623.06 0.00 0.00 11623.06 1333.84 11 10289.22 0.00 554 231 785 490 295 0.00
8 Deogarh 456.53 0.00 0.00 456.53 45.00 10 411.53 0.00 65 9 74 10 64 0.00
9 Dhenkanal 2979.67 0.00 0.00 2979.67 1982.36 67 997.31 0.00 374 274 648 498 150 0.00
10 Gajapati 1832.57 0.00 0.00 1832.57 456.85 25 1375.72 0.00 281 20 301 104 197 22.00
11 Ganjam 6067.03 0.00 0.00 6067.03 2438.00 40 3629.03 0.00 386 655 1041 693 348 0.00
12 Jagatsinghpur 11703.41 0.00 0.00 11703.41 1120.21 10 10583.20 0.00 174 644 818 721 97 0.95
13 Jajpur 1147.38 20.90 0.00 1168.28 489.72 42 678.56 0.00 215 82 297 212 85 0.00
14 Jharsuguda 1681.57 3.41 0.00 1684.98 431.68 26 1253.30 0.00 222 19 241 55 186 0.00
15 Kalahandi 5616.78 0.00 0.00 5616.78 14.00 0 5602.78 0.00 771 0 771 0 771 0.00
16 Kandhamal 3864.80 0.00 0.00 3864.80 1043.20 27 2821.60 0.00 532 0 532 292 240 0.00
17 Kendrapada 3263.73 0.00 0.00 3263.73 1053.86 32 2209.87 0.00 440 132 572 332 240 0.00 18 Keonjhar 5850.34 0.00 0.00 5850.34 0.00 0 5850.34 0.00 502 0 502 0 502 0.00
19 Khurda 2221.31 0.00 0.00 2221.31 1089.70 49 1131.61 0.00 278 449 727 418 309 30.15
20 Koraput 2157.13 0.00 0.00 2157.13 940.35 44 1216.78 0.00 389 0 389 221 168 0.00
21 Malkangiri 2246.46 0.00 0.00 2246.46 1404.34 63 842.12 0.00 439 292 731 428 303 0.00
22 Mayurbhanj 10103.69 0.00 0.00 10103.69 3464.26 34 6639.43 0.00 1654 414 2068 882 1186 0.00 23 Nawarangpur 1574.69 0.00 0.00 1574.69 788.85 50 785.84 0.00 512 0 512 204 308 0.00
24 Nayagarh 2136.05 0.00 0.00 2136.05 562.00 26 1574.05 0.00 290 9 299 38 261 0.00
25 Nuapada 5888.96 0.00 0.00 5888.96 307.45 5 5581.51 0.00 236 50 286 92 194 0.00
26 Puri 4741.52 0.00 0.00 4741.52 1133.39 24 3608.13 0.00 157 132 289 200 89 0.00
27 Rayagada 4975.45 0.00 0.00 4975.45 6.90 0 4968.55 0.00 764 0 764 2 762 0.00
28 Sambalpur 1390.75 0.00 0.00 1390.75 660.15 47 730.60 0.00 169 296 465 336 129 0.00
29 Subarnapur 1065.49 0.00 0.00 1065.49 198.14 19 867.35 0.00 108 4 112 103 9 0.00
30 Sundergarh 2846.81 0.00 0.00 2846.81 793.92 28 2052.89 0.00 21 90 111 83 28 0.00
Total 129378.29 47.19 6.00 129431.48 29684.50 23 99746.98 0.00 12768 5065 17833 9120 8713 94.46

44
Devolution of Funds to Z.P. under award of 4th SFC (ZP) During the year 2020-21 up to the month of February'21
Sl. No.
Name of the District
Financial Achievement (Rs. in lakhs) Physical achievement Road (in Km.)
CC/BT/ Water Board
Macadam / earthen
OB as on 01.4.2020
Grant
Receipt
(2020-21)
Other receipt (int. etc.) 2020-
21
Total Funds
Expenditure
incurred
% of
Exp. Balance
UC submit
ted
No. of projects Project
completed
Under progre
ss Spill Over
taken up
Total
1 2 3 4 5 6 7 8 9 10 11 12 13 14 15 16
1 Angul 88.83 0.00 0.00 88.83 39.01 44 49.82 0.00 6 40 46 43 3 0.00
2 Balasore 124.83 0.00 0.00 124.83 70.50 56 54.33 0.00 64 0 64 46 18 2.10
3 Bargarh 1.00 0.00 0.00 1.00 1.00 100 0.00 0.00 2 0 2 2 0 0.00 4 Bhadrak 42.00 0.00 0.00 42.00 42.00 100 0.00 0.00 11 11 22 22 0 0.00
5 Balangir 106.93 0.00 0.00 106.93 64.78 61 42.15 0.00 13 11 24 24 0 0.00
6 Boudh 4.15 0.00 0.00 4.15 2.00 48 2.15 0.00 3 0 3 1 2 0.00
7 Cuttack 46.02 0.00 0.00 46.02 46.02 100 0.00 0.00 63 0 63 63 0 0.00
8 Deogarh 30.75 0.00 0.00 30.75 0.00 0 30.75 0.00 5 0 5 0 5 0.00 9 Dhenkanal 41.67 0.00 0.00 41.67 41.67 100 0.00 0.00 27 8 35 35 0 0.00
10 Gajapati 35.60 0.00 0.00 35.60 6.20 17 29.40 0.00 4 0 4 3 1 0.00
11 Ganjam 130.54 0.00 0.00 130.54 78.00 60 52.54 0.00 79 0 79 15 64 0.00
12 Jagatsinghpur 149.16 0.00 0.00 149.16 131.47 88 17.69 0.00 8 90 98 96 2 0.22
13 Jajpur 83.89 0.00 0.00 83.89 83.89 100 0.00 0.00 0 1 1 1 0 0.00
14 Jharsuguda 53.09 0.00 0.00 53.09 10.19 19 42.90 0.00 9 2 11 3 8 0.00
23 Kalahandi 62.74 0.00 0.00 62.74 0.00 0 62.74 0.00 13 0 13 0 13 0.00
16 Kandhamal 82.95 0.00 0.00 82.95 55.30 67 27.65 0.00 26 0 26 17 9 0.00
17 Kendrapada 52.03 0.00 0.00 52.03 47.52 91 4.51 0.00 0 12 12 8 4 0.00
18 Keonjhar 42.98 0.00 0.00 42.98 0.00 0 42.98 0.00 9 0 9 0 9 0.00
19 Khurda 81.00 0.00 0.00 81.00 42.00 52 39.00 0.00 4 43 47 23 24 0.90 20 Koraput 60.30 0.00 0.00 60.30 35.70 59 24.60 0.00 10 0 10 6 4 0.00
21 Malkangiri 68.86 0.00 0.00 68.86 22.00 32 46.86 0.00 9 17 26 11 15 0.00
22 Mayurbhanj 492.50 0.00 0.00 492.50 95.27 19 397.23 0.00 135 27 162 27 135 0.00
23 Nawarangpur 23.00 0.00 0.00 23.00 14.00 61 9.00 0.00 7 0 7 4 3 0.00
24 Nayagarh 88.57 0.00 0.00 88.57 50.10 57 38.47 0.00 2 5 7 1 6 0.00 25 Nuapada 36.23 0.00 0.00 36.23 20.02 55 16.21 0.00 4 4 8 7 1 0.00
26 Puri 72.95 0.00 0.00 72.95 29.00 40 43.95 0.00 9 9 18 16 2 0.00
27 Rayagada 182.56 0.00 0.00 182.56 0.00 0 182.56 0.00 41 0 41 0 41 0.00
28 Sambalpur 1.73 0.00 0.00 1.73 1.73 100 0.00 0.00 18 0 18 18 0 0.00
29 Subarnapur 0.00 0.00 0.00 0.00 0.00 0 0.00 0.00 0 0 0 0 0 0.00 30 Sundergarh 0.00 0.00 0.00 0.00 0.00 0 0.00 0.00 0 0 0 0 0 0.00
Total 2286.86 0.00 0.00 2286.86 1029.37 45 1257.49 0.00 581 280 861 492 369 3.22

45
Mega Piped Water Supply (ZP) under award of 4th SFC During the year 2020-21 up to the month of February'21
Sl. No.
Name of the District
Financial Achievement (Rs. in lakhs) Physical achievement Road (in Km.)
CC/BT/ Water Board
Macadam / earthen
OB as on 01.4.2020
Grant
Receipt
(2020-21)
Other receipt (int. etc.)
2020-21
Total Funds
Expenditure
incurred
% of
Exp. Balance
UC submit
ted
No. of projects Project
completed
Under progre
ss Spill Over
taken up
Total
1 2 3 4 5 6 7 8 9 10 11 12 13 14 15 16
1 Angul 0.00 0.00 0.00 0.00 0.00 0 0.00 0.00 0 0 0 0 0 0
2 Balasore 3236.00 0.00 0.00 3236.00 0.00 0 3236.00 0.00 0 0 0 0 0 0 3 Bargarh 0.00 0.00 0.00 0.00 0.00 0 0.00 0.00 0 0 0 0 0 0
4 Bhadrak 1610.00 0.00 0.00 1610.00 0.00 0 1610.00 0.00 1 0 1 0 1 0
5 Balangir 525.50 0.00 0.00 525.50 0.00 0 525.50 0.00 1 0 1 0 1 0
6 Boudh 0.00 0.00 0.00 0.00 0.00 0 0.00 0.00 0 0 0 0 0 0
7 Cuttack 5491.38 0.00 0.00 5491.38 0.00 0 5491.38 0.00 0 0 0 0 0 0
8 Deogarh 0.00 0.00 0.00 0.00 0.00 0 0.00 0.00 0 0 0 0 0 0
9 Dhenkanal 0.00 0.00 0.00 0.00 0.00 0 0.00 0.00 0 0 0 0 0 0
10 Gajapati 0.00 0.00 0.00 0.00 0.00 0 0.00 0.00 0 0 0 0 0 0
11 Ganjam 0.00 0.00 0.00 0.00 0.00 0 0.00 0.00 0 0 0 0 0 0
12 Jagatsinghpur 7700.00 0.00 0.00 7700.00 0.00 0 7700.00 0.00 1 0 1 0 1 0
13 Jajpur 0.00 0.00 0.00 0.00 0.00 0 0.00 0.00 0 0 0 0 0 0 14 Jharsuguda 0.00 0.00 0.00 0.00 0.00 0 0.00 0.00 0 0 0 0 0 0
15 Kalahandi 0.00 0.00 0.00 0.00 0.00 0 0.00 0.00 0 0 0 0 0 0
16 Kandhamal 0.00 0.00 0.00 0.00 0.00 0 0.00 0.00 0 0 0 0 0 0
17 Kendrapada 0.00 0.00 0.00 0.00 0.00 0 0.00 0.00 0 0 0 0 0 0
18 Keonjhar 1504.00 0.00 0.00 1504.00 0.00 0 1504.00 0.00 0 0 0 0 0 0 19 Khurda 0.00 0.00 0.00 0.00 0.00 0 0.00 0.00 0 0 0 0 0 0
20 Koraput 0.00 0.00 0.00 0.00 0.00 0 0.00 0.00 0 0 0 0 0 0
21 Malkangiri 0.00 0.00 0.00 0.00 0.00 0 0.00 0.00 0 0 0 0 0 0
22 Mayurbhanj 0.00 0.00 0.00 0.00 0.00 0 0.00 0.00 0 0 0 0 0 0
23 Nawarangpur 0.00 0.00 0.00 0.00 0.00 0 0.00 0.00 0 0 0 0 0 0 24 Nayagarh 0.00 0.00 0.00 0.00 0.00 0 0.00 0.00 0 0 0 0 0 0
25 Nuapada 3792.00 0.00 0.00 3792.00 0.00 0 3792.00 0.00 1 0 1 0 1 0
26 Puri 1315.00 0.00 0.00 1315.00 150.00 11 1165.00 0.00 1 0 1 0 1 0
27 Rayagada 0.00 0.00 0.00 0.00 0.00 0 0.00 0.00 0 0 0 0 0 0
28 Sambalpur 0.00 0.00 0.00 0.00 0.00 0 0.00 0.00 0 0 0 0 0 0
29 Subarnapur 0.00 0.00 0.00 0.00 0.00 0 0.00 0.00 0 0 0 0 0 0 30 Sundergarh 0.00 0.00 0.00 0.00 0.00 0 0.00 0.00 0 0 0 0 0 0
Total 25173.88 0.00 0.00 25173.88 150.00 1 25023.88 0.00 5 0 5 0 5 0

46
Maintenance/ improvement of road infrastructure under the award of 4th SFC Zilla Parishad (Motor Vehicle Tax) (ZP) During the year 2020-21 up to the month of February'21
Sl. No.
Name of the District
Financial Achievement (Rs. in lakhs) Physical achievement Road (in Km.)
CC/BT/ Water Board
Macadam / earthen
OB as on 01.4.2019O
B as on 01.4.2020
Grant Receipt (2020-
21)
Other receipt (int. etc.)
2020-21
Total Funds
Expenditure
incurred
% of
Exp. Balance
UC submit
ted
No. of projects Proje
ct completed
Under progre
ss Spill Over
taken up
Total
1 2 3 4 5 6 7 8 9 10 11 12 13 14 15 16 1 Angul 759.32 0.00 0.00 759.32 119.61 16 639.71 0.00 19 24 43 33 10 0.00
31 Balasore 929.12 0.00 0.00 929.12 55.79 6 873.33 0.00 39 0 39 25 14 0.00 3 Bargarh 239.15 0.00 0.00 239.15 234.97 98 4.18 0.00 62 0 62 58 4 7.05
4 Bhadrak 255.34 0.00 0.00 255.34 252.50 99 2.84 0.00 29 100 129 128 1 0.00
5 Balangir 526.09 0.00 0.00 526.09 96.55 18 429.54 0.00 22 15 37 37 0 0.00
6 Boudh 33.92 0.00 0.00 33.92 12.60 37 21.32 0.00 4 3 7 2 5 0.00
7 Cuttack 683.13 0.00 0.00 683.13 181.00 26 502.13 0.00 58 0 58 49 9 0.00
8 Deogarh 22.39 0.00 0.00 22.39 0.00 0 22.39 0.00 6 0 6 0 6 0.00 9 Dhenkanal 145.45 0.00 0.00 145.45 122.23 84 23.22 0.00 34 20 54 44 10 0.00
10 Gajapati 144.19 0.00 0.00 144.19 0.00 0 144.19 0.00 0 0 0 0 0 0.00
11 Ganjam 718.07 0.00 0.00 718.07 40.00 6 678.07 0.00 37 0 37 10 27 0.00
12 Jagatsinghpur 578.77 0.00 0.00 578.77 0.00 0 578.77 0.00 22 0 22 0 22 0.00
13 Jajpur 0.00 0.00 0.00 0.00 0.00 0 0.00 0.00 0 0 0 0 0 0.00 14 Jharsuguda 139.59 0.00 0.00 139.59 21.44 15 118.15 0.00 14 3 17 5 12 0.00
15 Kalahandi 400.60 0.00 0.00 400.60 0.00 0 400.60 0.00 78 0 78 0 78 0.00
16 Kandhamal 294.49 0.00 0.00 294.49 15.50 5 278.99 0.00 20 0 20 10 10 0.00
17 Kendrapada 322.88 0.00 0.00 322.88 20.19 6 302.69 0.00 101 0 101 32 69 0.00
18 Keonjhar 356.81 0.00 0.00 356.81 0.00 0 356.81 0.00 11 0 11 0 11 0.00 19 Khurda 315.90 0.00 0.00 315.90 164.50 52 151.40 0.00 6 125 131 60 71 5.28
20 Koraput 68.62 0.00 0.00 68.62 52.55 77 16.07 0.00 20 0 20 13 7 0.00
21 Malkangiri 195.69 0.00 0.00 195.69 139.85 71 55.84 0.00 15 59 74 50 24 0.00
22 Mayurbhanj 711.24 0.00 0.00 711.24 331.85 47 379.39 0.00 99 56 155 91 64 0.00
23 Nawarangpur 102.97 0.00 0.00 102.97 52.20 51 50.77 0.00 5 0 5 3 2 0.00
24 Nayagarh 434.92 0.00 0.00 434.92 50.10 12 384.82 0.00 4 0 4 0 4 0.00
25 Nuapada 121.81 0.00 0.00 121.81 98.20 81 23.61 0.00 19 31 50 49 1 0.00
26 Puri 409.55 0.00 0.00 409.55 50.20 12 359.35 0.00 4 18 22 18 4 0.00
27 Rayagada 454.00 0.00 0.00 454.00 6.90 2 447.10 0.00 27 0 27 2 25 0.00
28 Sambalpur 70.61 0.00 0.00 70.61 70.61 100 0.00 0.00 16 55 71 71 0 0.00
29 Subarnapur 0.00 0.00 0.00 0.00 0.00 0 0.00 0.00 0 0 0 0 0 0.00 30 Sundergarh 49.96 0.00 0.00 49.96 5.60 11 44.36 0.00 8 0 8 0 8 0.00
Total 9484.58 0.00 0.00 9484.58 2194.94 23 7289.64 0.00 779 509 1288 790 498 12.33
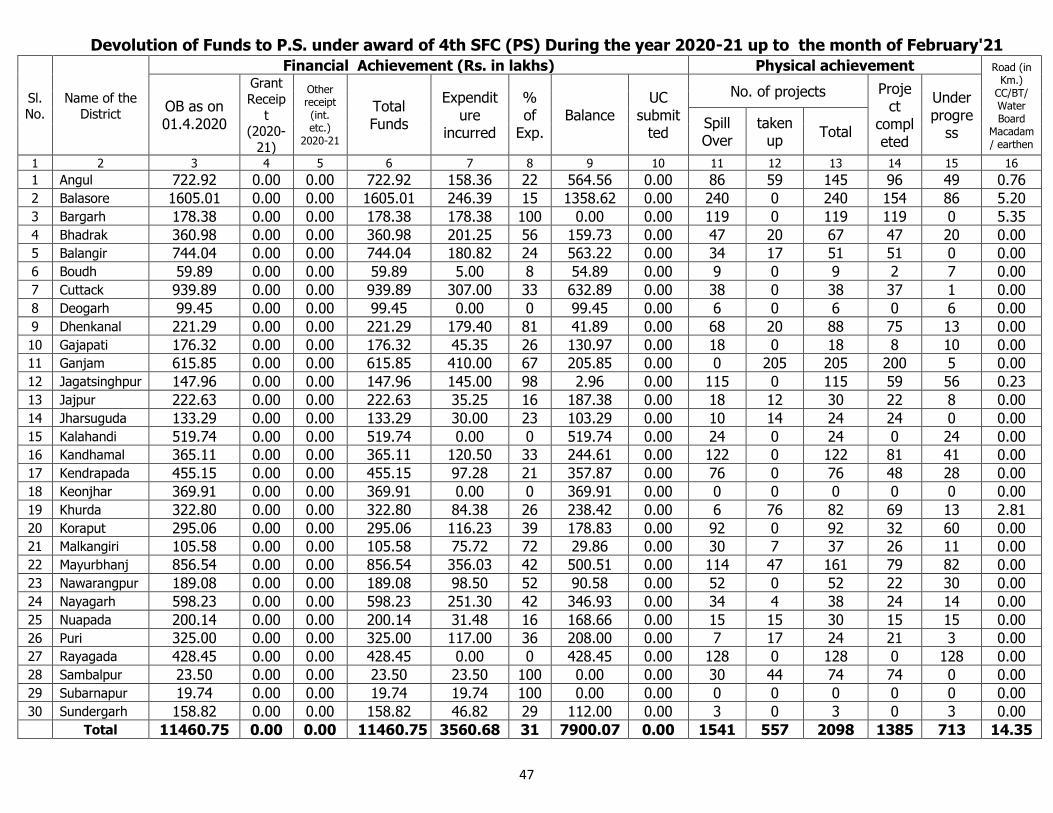
47
Devolution of Funds to P.S. under award of 4th SFC (PS) During the year 2020-21 up to the month of February'21
Sl. No.
Name of the District
Financial Achievement (Rs. in lakhs) Physical achievement Road (in Km.)
CC/BT/ Water Board
Macadam / earthen
OB as on 01.4.2020
Grant
Receip
t (2020-
21)
Other receipt (int. etc.)
2020-21
Total Funds
Expenditure
incurred
% of
Exp. Balance
UC submit
ted
No. of projects Project
completed
Under progre
ss Spill Over
taken up
Total
1 2 3 4 5 6 7 8 9 10 11 12 13 14 15 16
1 Angul 722.92 0.00 0.00 722.92 158.36 22 564.56 0.00 86 59 145 96 49 0.76
2 Balasore 1605.01 0.00 0.00 1605.01 246.39 15 1358.62 0.00 240 0 240 154 86 5.20
3 Bargarh 178.38 0.00 0.00 178.38 178.38 100 0.00 0.00 119 0 119 119 0 5.35
4 Bhadrak 360.98 0.00 0.00 360.98 201.25 56 159.73 0.00 47 20 67 47 20 0.00 5 Balangir 744.04 0.00 0.00 744.04 180.82 24 563.22 0.00 34 17 51 51 0 0.00
6 Boudh 59.89 0.00 0.00 59.89 5.00 8 54.89 0.00 9 0 9 2 7 0.00
7 Cuttack 939.89 0.00 0.00 939.89 307.00 33 632.89 0.00 38 0 38 37 1 0.00
8 Deogarh 99.45 0.00 0.00 99.45 0.00 0 99.45 0.00 6 0 6 0 6 0.00
9 Dhenkanal 221.29 0.00 0.00 221.29 179.40 81 41.89 0.00 68 20 88 75 13 0.00
10 Gajapati 176.32 0.00 0.00 176.32 45.35 26 130.97 0.00 18 0 18 8 10 0.00 11 Ganjam 615.85 0.00 0.00 615.85 410.00 67 205.85 0.00 0 205 205 200 5 0.00
12 Jagatsinghpur 147.96 0.00 0.00 147.96 145.00 98 2.96 0.00 115 0 115 59 56 0.23
13 Jajpur 222.63 0.00 0.00 222.63 35.25 16 187.38 0.00 18 12 30 22 8 0.00
14 Jharsuguda 133.29 0.00 0.00 133.29 30.00 23 103.29 0.00 10 14 24 24 0 0.00
15 Kalahandi 519.74 0.00 0.00 519.74 0.00 0 519.74 0.00 24 0 24 0 24 0.00 16 Kandhamal 365.11 0.00 0.00 365.11 120.50 33 244.61 0.00 122 0 122 81 41 0.00
17 Kendrapada 455.15 0.00 0.00 455.15 97.28 21 357.87 0.00 76 0 76 48 28 0.00
18 Keonjhar 369.91 0.00 0.00 369.91 0.00 0 369.91 0.00 0 0 0 0 0 0.00
19 Khurda 322.80 0.00 0.00 322.80 84.38 26 238.42 0.00 6 76 82 69 13 2.81
20 Koraput 295.06 0.00 0.00 295.06 116.23 39 178.83 0.00 92 0 92 32 60 0.00 21 Malkangiri 105.58 0.00 0.00 105.58 75.72 72 29.86 0.00 30 7 37 26 11 0.00
22 Mayurbhanj 856.54 0.00 0.00 856.54 356.03 42 500.51 0.00 114 47 161 79 82 0.00
23 Nawarangpur 189.08 0.00 0.00 189.08 98.50 52 90.58 0.00 52 0 52 22 30 0.00
24 Nayagarh 598.23 0.00 0.00 598.23 251.30 42 346.93 0.00 34 4 38 24 14 0.00
25 Nuapada 200.14 0.00 0.00 200.14 31.48 16 168.66 0.00 15 15 30 15 15 0.00
26 Puri 325.00 0.00 0.00 325.00 117.00 36 208.00 0.00 7 17 24 21 3 0.00
27 Rayagada 428.45 0.00 0.00 428.45 0.00 0 428.45 0.00 128 0 128 0 128 0.00
28 Sambalpur 23.50 0.00 0.00 23.50 23.50 100 0.00 0.00 30 44 74 74 0 0.00
29 Subarnapur 19.74 0.00 0.00 19.74 19.74 100 0.00 0.00 0 0 0 0 0 0.00
30 Sundergarh 158.82 0.00 0.00 158.82 46.82 29 112.00 0.00 3 0 3 0 3 0.00
Total 11460.75 0.00 0.00 11460.75 3560.68 31 7900.07 0.00 1541 557 2098 1385 713 14.35

48
Staff Quarters (P.S.) under the award of 4th SFC(P.S.) During the year 2020-21 up to the month of February'21
Sl.
No.
Name of the
District
Financial Ahievement (Rs. in lakhs) Physical achievement Road (in Km.)
CC/BT/ Water Board
Macadam / earthen
OB as on 01.4.2020
Grant Receip
t (2020-
21)
Other receipt (int. etc.) 2020-
21
Total Funds
Expenditure
incurred
% of
Exp. Balance
UC submit
ted
No. of projects Project
completed
Under progre
ss Spill Over
taken up
Total
1 2 3 4 5 6 7 8 9 10 11 12 13 14 15 16
1 Angul 207.43 0.00 0.00 207.43 79.85 38 127.58 0.00 11 5 16 6 10 0
2 Balasore 81.10 0.00 0.00 81.10 50.00 62 31.10 0.00 3 0 3 3 0 0
3 Bargarh 222.50 0.00 0.00 222.50 160.50 72 62.00 0.00 32 0 32 24 8 0
4 Bhadrak 90.00 0.00 0.00 90.00 0.00 0 90.00 0.00 0 0 0 0 0 0
5 Balangir 308.29 0.00 0.00 308.29 8.29 3 300.00 0.00 14 0 14 0 14 0 6 Boudh 82.00 0.00 0.00 82.00 0.00 0 82.00 0.00 0 0 0 0 0 0
7 Cuttack 322.95 0.00 0.00 322.95 60.95 19 262.00 0.00 4 11 15 10 5 0
8 Deogarh 72.00 0.00 0.00 72.00 15.00 21 57.00 0.00 0 9 9 4 5 0
9 Dhenkanal 83.80 0.00 0.00 83.80 48.00 57 35.80 0.00 9 0 9 4 5 0
10 Gajapati 87.80 0.00 0.00 87.80 38.95 44 48.85 0.00 13 0 13 5 8 0
11 Ganjam 145.00 0.00 0.00 145.00 28.00 19 117.00 0.00 35 0 35 2 33 0
12 Jagatsinghpur 152.96 0.00 0.00 152.96 7.73 5 145.23 0.00 1 0 1 0 1 0
13 Jajpur 161.35 0.00 0.00 161.35 33.45 21 127.90 0.00 2 0 2 1 1 0
14 Jharsuguda 54.39 0.00 0.00 54.39 0.00 0 54.39 0.00 3 0 3 0 3 0
15 Kalahandi 271.19 0.00 0.00 271.19 0.00 0 271.19 0.00 16 0 16 0 16 0
16 Kandhamal 320.30 0.00 0.00 320.30 80.30 25 240.00 0.00 15 0 15 8 7 0 17 Kendrapada 80.83 0.00 0.00 80.83 10.25 13 70.58 0.00 6 0 6 0 6 0
18 Keonjhar 183.50 0.00 0.00 183.50 0.00 0 183.50 0.00 13 0 13 0 13 0
19 Khurda 91.55 0.00 0.00 91.55 11.55 13 80.00 0.00 11 0 11 1 10 0
20 Koraput 234.08 0.00 0.00 234.08 42.88 18 191.20 0.00 14 0 14 8 6 0
21 Malkangiri 139.29 0.00 0.00 139.29 80.12 58 59.17 0.00 18 2 20 12 8 0 22 Mayurbhanj 477.60 0.00 0.00 477.60 111.00 23 366.60 0.00 55 0 55 13 42 0
23 Nawarangpur 145.30 0.00 0.00 145.30 82.60 57 62.70 0.00 7 0 7 3 4 0
24 Nayagarh 73.18 0.00 0.00 73.18 0.00 0 73.18 0.00 0 0 0 0 0 0
25 Nuapada 132.79 0.00 0.00 132.79 26.88 20 105.91 0.00 12 0 12 2 10 0
26 Puri 83.64 0.00 0.00 83.64 3.50 4 80.14 0.00 5 6 11 3 8 0 27 Rayagada 131.61 0.00 0.00 131.61 0.00 0 131.61 0.00 7 0 7 0 7 0
28 Sambalpur 133.50 0.00 0.00 133.50 33.00 25 100.50 0.00 19 0 19 8 11 0
29 Subarnapur 12.00 0.00 0.00 12.00 12.00 100 0.00 0.00 8 0 8 6 2 0
30 Sundergarh 122.00 0.00 0.00 122.00 28.50 23 93.50 0.00 0 2 2 2 0 0
Total 4703.93 0.00 0.00 4703.93 1053.30 22 3650.63 0.00 333 35 368 125 243 0

49
Grants to P.S. towards Salary of Computer Programmers (P.S.) OF 4TH SFC During the year 2020-21 upto the month of February'21
Sl.
No.
Name of the
District
Financial Achievement (Rs. in lakhs) Physical achievement Road (in Km.)
CC/BT/ Water Board
Macadam / earthen
OB as on 01.4.2020
Grant Receip
t (2020-
21)
Other receipt (int. etc.)
2020-21
Total Funds
Expenditure
incurred
% of
Exp. Balance
UC submit
ted
No. of Projects Project
completed
Under progre
ss Spill Over
taken up
Total
1 2 3 4 5 6 7 8 9 10 11 12 13 14 15
1 Angul 8.06 0.00 0.00 8.06 1.59 20 6.47 0.00 0 0 0 0 0 0 2 Balasore 19.03 0.00 0.00 19.03 0.00 0 19.03 0.00 0 0 0 0 0 0
3 Bargarh 17.50 22.88 0.00 40.38 40.38 100 0.00 0.00 0 0 0 0 0 0
4 Bhadrak 10.13 0.00 0.00 10.13 0.00 0 10.13 0.00 0 0 0 0 0 0
5 Balangir 19.73 0.00 0.00 19.73 0.00 0 19.73 0.00 0 0 0 0 0 0
6 Boudh 4.28 0.00 0.00 4.28 0.00 0 4.28 0.00 0 0 0 0 0 0 7 Cuttack 21.87 0.00 0.00 21.87 21.87 100 0.00 0.00 0 0 0 0 0 0
8 Deogarh 4.76 0.00 0.00 4.76 0.00 0 4.76 0.00 0 0 0 0 0 0
9 Dhenkanal 12.21 0.00 0.00 12.21 0.00 0 12.21 0.00 0 0 0 0 0 0
10 Gajapati 10.63 0.00 0.00 10.63 0.00 0 10.63 0.00 0 0 0 0 0 0
11 Ganjam 32.95 0.00 0.00 32.95 0.00 0 32.95 0.00 0 0 0 0 0 0 12 Jagatsinghpur 33.85 0.00 0.00 33.85 0.00 0 33.85 0.00 0 0 0 0 0 0
13 Jajpur 0.00 0.00 0.00 0.00 0.00 0 0.00 0.00 0 0 0 0 0 0
14 Jharsuguda 8.80 0.00 0.00 8.80 1.10 13 7.70 0.00 0 0 0 0 0 0
15 Kalahandi 15.30 0.00 0.00 15.30 0.00 0 15.30 0.00 0 0 0 0 0 0
16 Kandhamal 17.50 0.00 0.00 17.50 0.00 0 17.50 0.00 0 0 0 0 0 0
17 Kendrapada 13.22 0.00 0.00 13.22 0.00 0 13.22 0.00 0 0 0 0 0 0
18 Keonjhar 19.51 0.00 0.00 19.51 0.00 0 19.51 0.00 0 0 0 0 0 0
19 Khurda 16.00 0.00 0.00 16.00 0.00 0 16.00 0.00 0 0 0 0 0 0
20 Koraput 0.01 0.00 0.00 0.01 0.00 0 0.01 0.00 0 0 0 0 0 0
21 Malkangiri 18.27 0.00 0.00 18.27 0.00 0 18.27 0.00 0 0 0 0 0 0
22 Mayurbhanj 57.92 0.00 0.00 57.92 37.59 65 20.33 0.00 0 0 0 0 0 0 23 Nawarangpur 0.00 0.00 0.00 0.00 0.00 0 0.00 0.00 0 0 0 0 0 0
24 Nayagarh 11.78 0.00 0.00 11.78 0.00 0 11.78 0.00 0 0 0 0 0 0
25 Nuapada 9.04 0.00 0.00 9.04 2.38 26 6.66 0.00 0 0 0 0 0 0
40 Puri 28.12 0.00 0.00 28.12 9.09 32 19.03 0.00 0 0 0 0 0 0
27 Rayagada 14.80 0.00 0.00 14.80 0.00 0 14.80 0.00 0 0 0 0 0 0 28 Sambalpur 17.41 0.00 0.00 17.41 0.74 4 16.67 0.00 0 0 0 0 0 0
29 Subarnapur 7.41 0.00 0.00 7.41 0.00 0 7.41 0.00 0 0 0 0 0 0
30 Sundergarh 0.00 0.00 0.00 0.00 0.00 0 0.00 0.00 0 0 0 0 0 0
Total 450.09 22.88 0.00 472.97 114.74 24 358.23 0.00 0 0 0 0 0 0

50
Devolution of Funds to G.P. under award of 4th SFC (GP) During the year 2020-21 upto the month of February'21
Sl. No.
Name of the District
Financial Achievement (Rs. in lakhs) Physical achievement Road (in Km.) CC/BT/ Water Board
Macadam/ earthen
OB as on 01.4.2020
Grant
Receip
t (2020-
21)
Other receipt (int. etc.)
2020-21
Total Funds
Expenditure
incurred
% of
Exp. Balance
UC submit
ted
No. of projects Project
completed
Under progre
ss Spill Over
taken up
Total
1 2 3 4 5 6 7 8 9 10 12 13 14 15 16 17
1 Angul 1020.47 0.00 0.00 1020.47 687.53 67 332.94 0.00 261 157 418 297 121 0.00
2 Balasore 3671.72 0.00 0.00 3671.72 624.38 17 3047.34 0.00 100 267 367 141 226 17.70
3 Bargarh 923.06 0.00 0.00 923.06 81.25 9 841.81 0.00 62 240 302 290 12 0.00
4 Bhadrak 1602.47 0.00 0.00 1602.47 883.25 55 719.22 0.00 443 0 443 406 37 0.00 5 Balangir 208.23 0.00 0.00 208.23 208.23 100 0.00 0.00 261 45 306 100 206 0.00
6 Boudh 205.55 0.00 0.00 205.55 9.50 5 196.05 0.00 12 0 12 5 7 0.00
7 Cuttack 970.77 0.00 0.00 970.77 402.00 41 568.77 0.00 197 205 402 291 111 0.00
8 Deogarh 0.00 0.00 0.00 0.00 0.00 0 0.00 0.00 0 0 0 0 0 0.00
9 Dhenkanal 483.00 0.00 0.00 483.00 392.49 81 90.51 0.00 108 58 166 144 22 0.00 10 Gajapati 702.38 0.00 0.00 702.38 215.30 31 487.08 0.00 213 0 213 65 148 22.00
11 Ganjam 2269.20 0.00 0.00 2269.20 1280.00 56 989.20 0.00 0 450 450 450 0 0.00
12 Jagatsinghpur 773.53 0.00 0.00 773.53 773.53 100 0.00 0.00 13 550 563 560 3 0.50
13 Jajpur 71.52 0.00 0.00 71.52 71.52 100 0.00 0.00 167 0 167 144 23 0.00
14 Jharsuguda 640.94 0.00 0.00 640.94 219.19 34 421.75 0.00 32 0 32 23 9 0.00
15 Kalahandi 1601.51 0.00 0.00 1601.51 0.00 0 1601.51 0.00 534 0 534 0 534 0.00 16 Kandhamal 903.40 0.00 0.00 903.40 420.30 47 483.10 0.00 208 0 208 96 112 0.00
17 Kendrapada 965.86 0.00 0.00 965.86 558.21 58 407.65 0.00 100 120 238 211 27 0.00
18 Keonjhar 1813.25 0.00 0.00 1813.25 0.00 0 1813.25 0.00 42 0 42 0 42 0.00
19 Khurda 733.80 0.00 0.00 733.80 635.52 87 98.28 0.00 149 187 336 253 83 21.16
20 Koraput 564.11 0.00 0.00 564.11 495.99 88 68.12 0.00 97 0 97 67 30 0.00 21 Malkangiri 1014.75 0.00 0.00 1014.75 709.93 70 304.82 0.00 163 200 363 239 124 0.00
22 Mayurbhanj 3529.91 0.00 0.00 3529.91 1501.42 43 2028.49 0.00 494 267 761 424 337 0.00
23 Nawarangpur 522.31 0.00 0.00 522.31 263.20 50 259.11 0.00 315 0 315 113 202 0.00
24 Nayagarh 0.00 0.00 0.00 0.00 0.00 0 0.00 0.00 0 0 0 0 0 0.00
25 Nuapada 708.19 0.00 0.00 708.19 31.48 4 676.71 0.00 63 0 63 0 63 0.00 26 Puri 1333.32 0.00 0.00 1333.32 450.20 34 883.12 0.00 80 20 100 68 32 0.00
27 Rayagada 1863.62 0.00 0.00 1863.62 0.00 0 1863.62 0.00 372 0 372 0 372 0.00
28 Sambalpur 394.52 0.00 0.00 394.52 394.52 100 0.00 0.00 0 150 150 142 8 0.00
29 Subarnapur 647.53 0.00 0.00 647.53 100.80 16 546.73 0.00 73 0 73 73 0 0.00
30 Sundergarh 1428.32 0.00 0.00 1428.32 650.00 46 778.32 0.00 8 82 90 75 15 0.00
Total 31567.24 0.00 0.00 31567.24 12059.74 38 19507.50 0.00 4567 2998 7565 4677 2888 61.36

51
Grants for Creation of Capital Assets of G.P. for Revenue Generation (GP) OF 4TH SFC
During the year 2020-21 upto the month of February'21
Sl.
No.
Name of the
District
Financial Achievement (Rs. in lakhs) Physical achievement Road (in Km.) CC/BT/ Water Board
Macadam/ earthen
OB as on 01.4.2020
Grant Receip
t (2020-
21)
Other receipt (int. etc.)
2020-21
Total Funds
Expenditure
incurred
% of
Exp. Balance
UC submit
ted
No. of projects Project
completed
Under progre
ss Spill Over
taken up
Total
1 2 3 4 5 6 7 8 9 10 12 13 14 15 16 17
1 Angul 778.53 0.00 0.00 778.53 281.19 36 497.34 0.00 43 8 51 27 24 0.00
2 Balasore 1341.02 0.00 0.00 1341.02 105.50 8 1235.52 0.00 89 0 89 8 81 3.20
3 Bargarh 785.94 0.00 0.00 785.94 553.44 70 232.50 0.00 126 0 126 46 80 0.00
4 Bhadrak 889.20 0.00 0.00 889.20 193.25 22 695.95 0.00 53 14 67 8 59 0.00
5 Balangir 467.97 0.00 0.00 467.97 463.80 99 4.17 0.00 50 27 77 77 0 0.00 6 Boudh 124.00 0.00 0.00 124.00 2.00 2 122.00 0.00 5 0 5 1 4 0.00
7 Cuttack 938.52 0.00 0.00 938.52 180.00 19 758.52 0.00 12 13 25 23 2 0.00
8 Deogarh 75.63 0.00 0.00 75.63 30.00 40 45.63 0.00 39 0 39 6 33 0.00
9 Dhenkanal 514.12 0.00 0.00 514.12 388.43 76 125.69 0.00 49 82 131 86 45 0.00
10 Gajapati 252.95 0.00 0.00 252.95 55.60 22 197.35 0.00 10 0 10 6 4 0.00 11 Ganjam 780.50 0.00 0.00 780.50 315.00 490 465.50 0.00 134 0 134 12 122 0.00
12 Jagatsinghpur 1077.25 0.00 0.00 1077.25 23.00 2 1054.25 0.00 8 0 8 1 7 0.00
13 Jajpur 42.94 0.00 0.00 42.94 42.94 100 0.00 0.00 15 50 65 32 33 0.00
14 Jharsuguda 223.50 0.00 0.00 223.50 80.83 36 142.67 0.00 3 0 3 0 3 0.00
15 Kalahandi 1286.69 0.00 0.00 1286.69 0.00 0 1286.69 0.00 46 0 46 0 46 0.00 16 Kandhamal 873.92 0.00 0.00 873.92 120.50 14 753.42 0.00 30 0 30 20 10 0.00
17 Kendrapada 362.70 0.00 0.00 362.70 70.59 19 292.11 0.00 47 0 47 8 39 0.00
18 Keonjhar 813.00 0.00 0.00 813.00 0.00 0 813.00 0.00 93 0 93 0 93 0.00
19 Khurda 265.50 0.00 0.00 265.50 99.00 37 166.50 0.00 40 0 40 7 33 0.00
20 Koraput 403.80 0.00 0.00 403.80 67.00 17 336.80 0.00 5 0 5 3 2 0.00
21 Malkangiri 184.18 0.00 0.00 184.18 163.02 89 21.16 0.00 40 1 41 23 18 0.00 22 Mayurbhanj 1355.60 0.00 0.00 1355.60 302.70 22 1052.90 0.00 122 6 128 47 81 0.00
23 Nawarangpur 338.32 0.00 0.00 338.32 196.80 58 141.52 0.00 38 0 38 21 17 0.00
24 Nayagarh 279.09 0.00 0.00 279.09 110.10 39 168.99 0.00 26 0 26 11 15 0.00
25 Nuapada 403.47 0.00 0.00 403.47 16.67 4 386.80 0.00 36 0 36 0 36 0.00
26 Puri 561.70 0.00 0.00 561.70 175.20 31 386.50 0.00 5 20 25 22 3 0.00 27 Rayagada 1231.81 0.00 0.00 1231.81 0.00 0 1231.81 0.00 89 0 89 0 89 0.00
28 Sambalpur 309.15 0.00 0.00 309.15 88.00 28 221.15 0.00 0 46 46 11 35 0.00
29 Subarnapur 185.00 0.00 0.00 185.00 45.00 24 140.00 0.00 14 0 14 7 7 0.00
30 Sundergarh 350.00 0.00 0.00 350.00 20.00 6 330.00 0.00 1 2 3 2 1 0.00
Total 17496.00 0.00 0.00 17496.00 4189.56 24 13306.44 0.00 1268 269 1537 515 1022 3.20

52
Maintenance of Capital Assets of G.P. under award of 4th SFC During the year 2020-21 up to the month of February'21
Sl.
No.
Name of the
District
Financial Achievement (Rs. in lakhs) Physical achievement Road (in Km.) CC/BT/ Water Board
Macadam/ earthen
OB as on 01.4.2020
Grant Receipt (2020-
21)
Other receipt (int. etc.)
2020-21
Total Funds
Expenditure
incurred
% of
Exp. Balance
UC submit
ted
No. of projects Project
completed
Under progre
ss Spill Over
taken up
Total
1 2 3 4 5 6 7 8 9 10 12 13 14 15 16 17
1 Angul 575.34 0.00 0.00 575.34 37.64 7 537.70 0.00 16 6 22 7 15 0.00
2 Balasore 268.98 0.00 0.00 268.98 44.50 17 224.48 0.00 101 0 101 2 99 0.00
3 Bargarh 487.25 0.00 0.00 487.25 321.00 66 166.25 0.00 81 0 81 15 66 0.00
4 Bhadrak 409.85 0.00 0.00 409.85 23.50 6 386.35 0.00 5 0 5 3 2 0.00
5 Balangir 305.83 0.00 0.00 305.83 110.83 36 195.00 0.00 17 2 19 17 2 0.00 6 Boudh 238.00 0.00 0.00 238.00 0.00 0 238.00 0.00 0 0 0 0 0 0.00
7 Cuttack 1201.70 0.00 0.00 1201.70 135.00 11 1066.70 0.00 33 2 35 17 18 0.00
8 Deogarh 86.20 0.00 0.00 86.20 0.00 0 86.20 0.00 1 0 1 0 1 0.00
9 Dhenkanal 407.75 0.00 0.00 407.75 311.62 76 96.13 0.00 21 26 47 35 12 0.00
10 Gajapati 104.00 0.00 0.00 104.00 0.00 0 104.00 0.00 0 0 0 0 0 0.00
11 Ganjam 747.50 0.00 0.00 747.50 145.00 19 602.50 0.00 41 0 41 3 38 0.00 12 Jagatsinghpur 650.00 0.00 0.00 650.00 23.00 4 627.00 0.00 1 1 2 1 1 0.00
13 Jajpur 96.47 0.00 0.00 96.47 96.47 100 0.00 0.00 3 13 16 2 14 0.00
14 Jharsuguda 202.04 0.00 0.00 202.04 16.00 8 186.04 0.00 38 0 38 0 38 0.00
15 Kalahandi 510.21 0.00 0.00 510.21 14.00 3 496.21 0.00 3 0 3 0 3 0.00
16 Kandhamal 419.37 0.00 0.00 419.37 30.20 7 389.17 0.00 43 0 43 27 16 0.00 17 Kendrapada 609.55 0.00 0.00 609.55 130.25 21 479.30 0.00 26 0 26 15 11 0.00
18 Keonjhar 310.50 0.00 0.00 310.50 0.00 0 310.50 0.00 22 0 22 0 22 0.00
19 Khurda 86.00 0.00 0.00 86.00 25.00 29 61.00 0.00 16 0 16 2 14 0.00
20 Koraput 74.20 0.00 0.00 74.20 34.50 46 39.70 0.00 5 0 5 2 3 0.00
21 Malkangiri 142.87 0.00 0.00 142.87 96.07 67 46.80 0.00 27 0 27 23 4 0.00 22 Mayurbhanj 1065.03 0.00 0.00 1065.03 382.10 36 682.93 0.00 206 1 207 77 130 0.00
23 Nawarangpur 149.60 0.00 0.00 149.60 46.40 31 103.20 0.00 21 0 21 9 12 0.00
24 Nayagarh 296.98 0.00 0.00 296.98 100.20 34 196.78 0.00 27 0 27 2 25 0.00
25 Nuapada 178.90 0.00 0.00 178.90 37.47 21 141.43 0.00 39 0 39 0 39 0.00
26 Puri 393.60 0.00 0.00 393.60 65.00 17 328.60 0.00 6 10 16 14 2 0.00
27 Rayagada 147.60 0.00 0.00 147.60 0.00 0 147.60 0.00 13 0 13 0 13 0.00 28 Sambalpur 108.83 0.00 0.00 108.83 33.57 31 75.26 0.00 5 1 6 1 5 0.00
29 Subarnapur 89.00 0.00 0.00 89.00 20.00 22 69.00 0.00 0 4 4 4 0 0.00
30 Sundergarh 112.00 0.00 0.00 112.00 20.00 18 92.00 0.00 0 0 0 0 0 0.00
Total 10475.15 0.00 0.00 10475.15 2299.32 22 8175.83 0.00 817 66 883 278 605 0.00
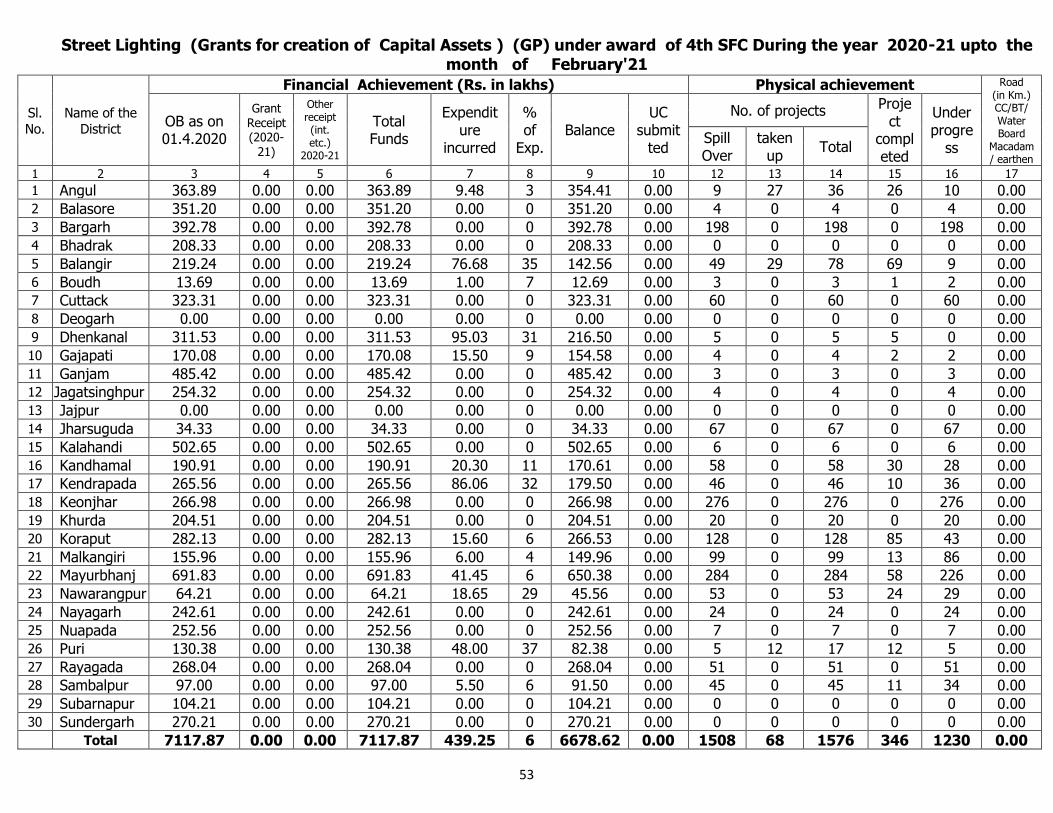
53
Street Lighting (Grants for creation of Capital Assets ) (GP) under award of 4th SFC During the year 2020-21 upto the month of February'21
Sl.
No.
Name of the
District
Financial Achievement (Rs. in lakhs) Physical achievement Road (in Km.) CC/BT/ Water Board
Macadam/ earthen
OB as on 01.4.2020
Grant Receipt (2020-
21)
Other receipt (int. etc.)
2020-21
Total Funds
Expenditure
incurred
% of
Exp. Balance
UC submit
ted
No. of projects Project
completed
Under progre
ss Spill Over
taken up
Total
1 2 3 4 5 6 7 8 9 10 12 13 14 15 16 17
1 Angul 363.89 0.00 0.00 363.89 9.48 3 354.41 0.00 9 27 36 26 10 0.00
2 Balasore 351.20 0.00 0.00 351.20 0.00 0 351.20 0.00 4 0 4 0 4 0.00
3 Bargarh 392.78 0.00 0.00 392.78 0.00 0 392.78 0.00 198 0 198 0 198 0.00
4 Bhadrak 208.33 0.00 0.00 208.33 0.00 0 208.33 0.00 0 0 0 0 0 0.00
5 Balangir 219.24 0.00 0.00 219.24 76.68 35 142.56 0.00 49 29 78 69 9 0.00
6 Boudh 13.69 0.00 0.00 13.69 1.00 7 12.69 0.00 3 0 3 1 2 0.00 7 Cuttack 323.31 0.00 0.00 323.31 0.00 0 323.31 0.00 60 0 60 0 60 0.00
8 Deogarh 0.00 0.00 0.00 0.00 0.00 0 0.00 0.00 0 0 0 0 0 0.00
9 Dhenkanal 311.53 0.00 0.00 311.53 95.03 31 216.50 0.00 5 0 5 5 0 0.00
10 Gajapati 170.08 0.00 0.00 170.08 15.50 9 154.58 0.00 4 0 4 2 2 0.00
11 Ganjam 485.42 0.00 0.00 485.42 0.00 0 485.42 0.00 3 0 3 0 3 0.00 12 Jagatsinghpur 254.32 0.00 0.00 254.32 0.00 0 254.32 0.00 4 0 4 0 4 0.00
13 Jajpur 0.00 0.00 0.00 0.00 0.00 0 0.00 0.00 0 0 0 0 0 0.00
14 Jharsuguda 34.33 0.00 0.00 34.33 0.00 0 34.33 0.00 67 0 67 0 67 0.00
15 Kalahandi 502.65 0.00 0.00 502.65 0.00 0 502.65 0.00 6 0 6 0 6 0.00
16 Kandhamal 190.91 0.00 0.00 190.91 20.30 11 170.61 0.00 58 0 58 30 28 0.00 17 Kendrapada 265.56 0.00 0.00 265.56 86.06 32 179.50 0.00 46 0 46 10 36 0.00
18 Keonjhar 266.98 0.00 0.00 266.98 0.00 0 266.98 0.00 276 0 276 0 276 0.00
19 Khurda 204.51 0.00 0.00 204.51 0.00 0 204.51 0.00 20 0 20 0 20 0.00
20 Koraput 282.13 0.00 0.00 282.13 15.60 6 266.53 0.00 128 0 128 85 43 0.00
21 Malkangiri 155.96 0.00 0.00 155.96 6.00 4 149.96 0.00 99 0 99 13 86 0.00
22 Mayurbhanj 691.83 0.00 0.00 691.83 41.45 6 650.38 0.00 284 0 284 58 226 0.00
23 Nawarangpur 64.21 0.00 0.00 64.21 18.65 29 45.56 0.00 53 0 53 24 29 0.00
24 Nayagarh 242.61 0.00 0.00 242.61 0.00 0 242.61 0.00 24 0 24 0 24 0.00
25 Nuapada 252.56 0.00 0.00 252.56 0.00 0 252.56 0.00 7 0 7 0 7 0.00
26 Puri 130.38 0.00 0.00 130.38 48.00 37 82.38 0.00 5 12 17 12 5 0.00
27 Rayagada 268.04 0.00 0.00 268.04 0.00 0 268.04 0.00 51 0 51 0 51 0.00 28 Sambalpur 97.00 0.00 0.00 97.00 5.50 6 91.50 0.00 45 0 45 11 34 0.00
29 Subarnapur 104.21 0.00 0.00 104.21 0.00 0 104.21 0.00 0 0 0 0 0 0.00
30 Sundergarh 270.21 0.00 0.00 270.21 0.00 0 270.21 0.00 0 0 0 0 0 0.00
Total 7117.87 0.00 0.00 7117.87 439.25 6 6678.62 0.00 1508 68 1576 346 1230 0.00

54
Construction of Staff Quarters of G.P. under award of 4th SFC During the year 2020-21 upto the month of February'21
Sl. No.
Name of the District
Financial Achievement (Rs. in lakhs) Physical achievement Road (in Km.) CC/BT/ Water Board
Macadam/ earthen
OB as on 01.4.2020
Grant Receipt (2020-
21)
Other receipt (int. etc.)
2020-21
Total Funds
Expenditure
incurred
% of
Exp. Balance
UC submit
ted
No. of projects Proje
ct completed
Under progre
ss Spill Over
taken up
Total
1 2 3 4 5 6 7 8 9 10 12 13 14 15 16
1 Angul 162.97 0.00 0.00 162.97 73.00 45 89.97 0.00 15 5 20 7 13 0
2 Balasore 89.27 0.00 0.00 89.27 26.50 30 62.77 0.00 2 8 10 4 6 0 3 Bargarh 158.95 0.00 0.00 158.95 71.90 45 87.05 0.00 32 0 32 20 12 0
4 Bhadrak 89.00 0.00 0.00 89.00 57.50 65 31.50 0.00 19 0 19 3 16 0
5 Balangir 44.40 0.00 0.00 44.40 44.40 100 0.00 0.00 28 1 29 29 0 0
6 Boudh 0.00 0.00 0.00 0.00 0.00 0 0.00 0.00 0 0 0 0 0 0
7 Cuttack 163.09 0.00 0.00 163.09 0.00 0 163.09 0.00 16 0 16 0 16 0 8 Deogarh 4.75 0.00 0.00 4.75 0.00 0 4.75 0.00 2 0 2 0 2 0
9 Dhenkanal 140.99 0.00 0.00 140.99 97.89 69 43.10 0.00 16 4 20 11 9 0
10 Gajapati 10.55 0.00 0.00 10.55 10.25 97 0.30 0.00 5 0 5 2 3 0
11 Ganjam 142.00 0.00 0.00 142.00 142.00 100 0.00 0.00 46 0 46 1 45 0
12 Jagatsinghpur 0.00 0.00 0.00 0.00 0.00 0 0.00 0.00 0 0 0 0 0 0
13 Jajpur 408.58 0.00 0.00 408.58 45.30 11 363.28 0.00 10 0 10 4 6 0
14 Jharsuguda 93.08 0.00 0.00 93.08 44.17 47 48.91 0.00 46 0 46 0 46 0
15 Kalahandi 196.46 0.00 0.00 196.46 0.00 0 196.46 0.00 34 0 34 0 34 0
16 Kandhamal 396.85 0.00 0.00 396.85 180.30 45 216.55 0.00 10 0 10 3 7 0
17 Kendrapada 0.08 0.00 0.00 0.08 0.00 0 0.08 0.00 15 0 15 0 15 0
18 Keonjhar 58.50 0.00 0.00 58.50 0.00 0 58.50 0.00 9 0 9 0 9 0 19 Khurda 15.25 0.00 0.00 15.25 2.00 13 13.25 0.00 5 0 5 0 5 0
20 Koraput 24.07 0.00 0.00 24.07 12.00 50 12.07 0.00 3 0 3 1 2 0
21 Malkangiri 103.23 0.00 0.00 103.23 103.23 100 0.00 0.00 24 6 30 30 0 0
22 Mayurbhanj 174.41 0.00 0.00 174.41 24.18 14 150.23 0.00 32 0 32 18 14 0
23 Nawarangpur 29.50 0.00 0.00 29.50 13.50 46 16.00 0.00 10 0 10 4 6 0 24 Nayagarh 65.01 0.00 0.00 65.01 0.00 0 65.01 0.00 6 0 6 0 6 0
25 Nuapada 19.98 0.00 0.00 19.98 19.98 100 0.00 0.00 19 0 19 19 0 0
26 Puri 28.60 0.00 0.00 28.60 12.00 42 16.60 0.00 8 8 16 10 6 0
27 Rayagada 241.22 0.00 0.00 241.22 0.00 0 241.22 0.00 36 0 36 0 36 0
28 Sambalpur 199.07 0.00 0.00 199.07 5.76 3 193.31 0.00 6 0 6 0 6 0 29 Subarnapur 0.60 0.00 0.00 0.60 0.60 100 0.00 0.00 13 0 13 13 0 0
30 Sundergarh 280.00 0.00 0.00 280.00 13.00 5 267.00 0.00 1 2 3 2 1 0
Total 3340.46 0.00 0.00 3340.46 999.46 30 2341.00 0.00 468 34 502 181 321 0.00

55
Own Source of Revenue collected by GP During the year 2020-21 upto the month of February'21
Sl. No.
Name of the District
Financial Achievement (Rs. in lakhs) Physical achievement Road (in Km.) CC/BT/ Water Board
Macadam/ earthen
OB as on 01.4.2020
Grant Receipt (2020-
21)
Other receipt (int. etc.)
2020-21
Total Funds
Expenditure
incurred
% of
Exp. Balance
UC submit
ted
No. of projects Proje
ct completed
Under progre
ss Spill Over
taken up
Total
1 2 3 4 5 6 7 8 9 10 12 13 14 15 16 17
1 Angul 0.00 0.00 0.00 0.00 0.00 0 0.00 0.00 0 0 0 0 0 0.00
2 Balasore 3.94 0.00 0.00 3.94 0.00 0 3.94 0.00 1 0 1 0 1 0.00 3 Bargarh 0.00 0.00 0.00 0.00 0.00 0 0.00 0.00 0 0 0 0 0 0.00
4 Bhadrak 0.00 0.00 0.00 0.00 0.00 0 0.00 0.00 0 0 0 0 0 0.00
5 Balangir 16.18 0.00 0.00 16.18 16.18 100 0.00 0.00 89 0 89 89 0 0.00
6 Boudh 0.00 0.00 0.00 0.00 0.00 0 0.00 0.00 0 0 0 0 0 0.00
7 Cuttack 3.90 0.00 0.00 3.90 0.00 0 3.90 0.00 10 0 10 0 10 0.00 8 Deogarh 0.79 0.00 0.00 0.79 0.00 0 0.79 0.00 1 0 1 0 1 0.00
9 Dhenkanal 20.74 0.00 0.00 20.74 0.00 0 20.74 0.00 0 0 0 0 0 0.00
10 Gajapati 89.47 0.00 0.00 89.47 39.15 44 50.32 0.00 0 15 15 5 10 0.00
11 Ganjam 0.00 0.00 0.00 0.00 0.00 0 0.00 0.00 0 0 0 0 0 0.00
12 Jagatsinghpur 59.00 0.00 0.00 59.00 0.00 0 59.00 0.00 0 0 0 0 0 0.00
13 Jajpur 0.00 20.90 0.00 20.90 20.90 100 0.00 0.00 0 0 0 0 0 0.00
14 Jharsuguda 0.00 3.41 0.00 3.41 3.41 100 0.00 0.00 0 0 0 0 0 0.00
15 Kalahandi 0.00 0.00 0.00 0.00 0.00 0 0.00 0.00 0 0 0 0 0 0.00
16 Kandhamal 0.00 0.00 0.00 0.00 0.00 0 0.00 0.00 0 0 0 0 0 0.00
17 Kendrapada 0.00 0.00 0.00 0.00 0.00 0 0.00 0.00 0 0 0 0 0 0.00
18 Keonjhar 0.00 0.00 0.00 0.00 0.00 0 0.00 0.00 0 0 0 0 0 0.00 19 Khurda 0.00 0.00 0.00 0.00 0.00 0 0.00 0.00 0 0 0 0 0 0.00
20 Koraput 0.00 0.00 0.00 0.00 0.00 0 0.00 0.00 0 0 0 0 0 0.00
21 Malkangiri 0.28 0.00 0.00 0.28 0.00 0 0.28 0.00 0 0 0 0 0 0.00
22 Mayurbhanj 0.00 0.00 0.00 0.00 0.00 0 0.00 0.00 0 0 0 0 0 0.00
23 Nawarangpur 0.00 0.00 0.00 0.00 0.00 0 0.00 0.00 0 0 0 0 0 0.00 24 Nayagarh 32.50 0.00 0.00 32.50 0.00 0 32.50 0.00 163 0 163 0 163 0.00
25 Nuapada 0.00 0.00 0.00 0.00 0.00 0 0.00 0.00 0 0 0 0 0 0.00
26 Puri 0.00 0.00 0.00 0.00 0.00 0 0.00 0.00 0 0 0 0 0 0.00
27 Rayagada 11.74 0.00 0.00 11.74 0.00 0 11.74 0.00 0 0 0 0 0 0.00
28 Sambalpur 35.43 0.00 0.00 35.43 3.22 9 32.21 0.00 30 0 30 0 30 0.00 29 Subarnapur 0.00 0.00 0.00 0.00 0.00 0 0.00 0.00 0 0 0 0 0 0.00
30 Sundergarh 0.00 0.00 0.00 0.00 0.00 0 0.00 0.00 0 0 0 0 0 0.00
Total 273.97 24.31 0.00 298.28 82.86 28 215.42 0.00 294 15 309 94 215 0.00

56
Construction of new GP Building-cum-PEO- Quarter (GP) During the year 2020-21 upto the month of February'21
Sl. No.
Name of the District
Financial Achievement (Rs. in lakhs) Physical achievement Road (in Km.) CC/BT/ Water Board
Macadam/ earthen
OB as on 01.4.2020
Grant Receipt (2020-
21)
Other receipt (int. etc.)
2020-21
Total Funds
Expenditure
incurred
% of
Exp. Balance
UC submit
ted
No. of projects Proje
ct completed
Under progre
ss Spill Over
taken up
Total
1 2 3 4 5 6 7 8 9 10 12 13 14 15 16 17
1 Angul 248.55 0.00 0.00 248.55 123.72 50 124.83 0.00 13 17 30 8 22 0.00
2 Balasore 586.49 0.00 0.00 586.49 90.71 15 495.78 0.00 0 0 0 0 0 0.00 3 Bargarh 165.35 0.00 0.00 165.35 142.35 86 23.00 0.00 26 0 26 12 14 0.00
4 Bhadrak 159.00 0.00 0.00 159.00 6.50 4 152.50 0.00 23 0 23 0 23 0.00
5 Balangir 289.50 0.00 0.00 289.50 109.50 38 180.00 0.00 26 0 26 8 18 0.00
6 Boudh 0.00 0.00 0.00 0.00 0.00 0 0.00 0.00 0 0 0 0 0 0.00
7 Cuttack 453.53 0.00 0.00 453.53 0.00 0 453.53 0.00 15 0 15 0 15 0.00 8 Deogarh 41.81 0.00 0.00 41.81 0.00 0 41.81 0.00 5 0 5 0 5 0.00
9 Dhenkanal 44.10 0.00 0.00 44.10 24.40 55 19.70 0.00 8 0 8 3 5 0.00
10 Gajapati 30.90 0.00 0.00 30.90 20.50 66 10.40 0.00 11 0 11 2 9 0.00
11 Ganjam 0.00 0.00 0.00 0.00 0.00 0 0.00 0.00 11 0 11 0 11 0.00
12 Jagatsinghpur 87.61 0.00 0.00 87.61 16.48 19 71.13 0.00 1 3 4 4 0 0.00
13 Jajpur 0.00 0.00 0.00 0.00 0.00 0 0.00 0.00 0 0 0 0 0 0.00
14 Jharsuguda 68.52 0.00 0.00 68.52 2.83 4 65.69 0.00 0 0 0 0 0 0.00
15 Kalahandi 203.22 0.00 0.00 203.22 0.00 0 203.22 0.00 12 0 12 0 12 0.00
16 Kandhamal 0.00 0.00 0.00 0.00 0.00 0 0.00 0.00 0 0 0 0 0 0.00
17 Kendrapada 86.05 0.00 0.00 86.05 10.25 12 75.80 0.00 17 0 17 0 17 0.00
18 Keonjhar 90.40 0.00 0.00 90.40 0.00 0 90.40 0.00 15 0 15 0 15 0.00 19 Khurda 75.00 0.00 0.00 75.00 15.75 21 59.25 0.00 13 0 13 0 13 0.00
20 Koraput 99.75 0.00 0.00 99.75 67.90 68 31.85 0.00 12 0 12 4 8 0.00
21 Malkangiri 90.50 0.00 0.00 90.50 5.40 6 85.10 0.00 3 0 3 0 3 0.00
22 Mayurbhanj 501.23 0.00 0.00 501.23 202.54 40 298.69 0.00 86 0 86 29 57 0.00
23 Nawarangpur 10.40 0.00 0.00 10.40 3.00 29 7.40 0.00 4 0 4 1 3 0.00 24 Nayagarh 9.79 0.00 0.00 9.79 0.00 0 9.79 0.00 1 0 1 0 1 0.00
25 Nuapada 18.97 0.00 0.00 18.97 11.03 58 7.94 0.00 15 0 15 0 15 0.00
26 Puri 14.46 0.00 0.00 14.46 8.60 59 5.86 0.00 25 6 31 8 23 0.00
27 Rayagada 0.00 0.00 0.00 0.00 0.00 0 0.00 0.00 0 0 0 0 0 0.00
28 Sambalpur 0.00 0.00 0.00 0.00 0.00 0 0.00 0.00 0 0 0 0 0 0.00 29 Subarnapur 0.00 0.00 0.00 0.00 0.00 0 0.00 0.00 0 0 0 0 0 0.00
30 Sundergarh 75.50 0.00 0.00 75.50 10.00 13 65.50 0.00 0 2 2 2 0 0.00
Total 3450.63 0.00 0.00 3450.63 871.46 25 2579.17 0.00 342 28 370 81 289 0.00

57
Incentive Grants to GP During the year 2020-21 upto the month of February'21
Sl. No.
Name of the District
Financial Achievement (Rs. in lakhs) Physical achievement Road (in Km.) CC/BT/ Water Board
Macadam/ earthen
OB as on 01.4.2020
Grant
Receipt
(2020-21)
Other receipt (int. etc.)
2020-21
Total Funds
Expenditure
incurred
% of
Exp. Balance
UC submit
ted
No. of projects Proje
ct completed
Under progre
ss Spill Over
taken up
Total
1 2 3 4 5 6 7 8 9 10 12 13 14 15 16 17
1 Angul 121.93 0.00 0.00 121.93 56.50 46 65.43 0.00 9 3 12 10 2 0.00
2 Balasore 66.00 0.00 0.00 66.00 0.00 0 66.00 0.00 0 0 0 0 0 0.00 3 Bargarh 551.59 0.00 0.00 551.59 18.00 3 533.59 0.00 83 0 83 6 77 0.00
4 Bhadrak 72.00 0.00 0.00 72.00 21.50 30 50.50 0.00 0 83 83 12 71 0.00
5 Balangir 42.00 0.00 6.00 48.00 48.00 100 0.00 0.00 10 19 29 29 0 0.00
6 Boudh 0.00 0.00 0.00 0.00 0.00 0 0.00 0.00 0 0 0 0 0 0.00
7 Cuttack 63.00 0.00 0.00 63.00 0.00 0 63.00 0.00 48 0 48 0 48 0.00 8 Deogarh 18.00 0.00 0.00 18.00 0.00 0 18.00 0.00 0 0 0 0 0 0.00
9 Dhenkanal 553.02 0.00 0.00 553.02 281.20 51 271.82 0.00 29 56 85 56 29 0.00
10 Gajapati 17.70 0.00 0.00 17.70 10.05 57 7.65 0.00 3 5 8 6 2 0.00
11 Ganjam 0.00 0.00 0.00 0.00 0.00 0 0.00 0.00 0 0 0 0 0 0.00
12 Jagatsinghpur 39.00 0.00 0.00 39.00 0.00 0 39.00 0.00 0 0 0 0 0 0.00
13 Jajpur 60.00 0.00 0.00 60.00 60.00 100 0.00 0.00 0 6 6 6 0 0.00
14 Jharsuguda 30.00 0.00 0.00 30.00 2.52 8 27.48 0.00 0 0 0 0 0 0.00
15 Kalahandi 46.47 0.00 0.00 46.47 0.00 0 46.47 0.00 5 0 5 0 5 0.00
16 Kandhamal 0.00 0.00 0.00 0.00 0.00 0 0.00 0.00 0 0 0 0 0 0.00
17 Kendrapada 49.82 0.00 0.00 49.82 23.26 47 26.56 0.00 6 0 6 0 6 0.00
18 Keonjhar 21.00 0.00 0.00 21.00 0.00 0 21.00 0.00 12 0 12 0 12 0.00 19 Khurda 14.00 0.00 0.00 14.00 10.00 71 4.00 0.00 8 18 26 3 23 0.00
20 Koraput 51.00 0.00 0.00 51.00 0.00 0 51.00 0.00 3 0 3 0 3 0.00
21 Malkangiri 27.00 0.00 0.00 27.00 3.00 11 24.00 0.00 11 0 11 1 10 0.00
22 Mayurbhanj 189.88 0.00 0.00 189.88 78.13 41 111.75 0.00 27 10 37 19 18 0.00
23 Nawarangpur 0.00 0.00 0.00 0.00 0.00 0 0.00 0.00 0 0 0 0 0 0.00 24 Nayagarh 3.39 0.00 0.00 3.39 0.20 6 3.19 0.00 3 0 3 0 3 0.00
25 Nuapada 14.88 0.00 0.00 14.88 11.86 80 3.02 0.00 6 0 6 0 6 0.00
26 Puri 45.20 0.00 0.00 45.20 15.60 35 29.60 0.00 2 6 8 8 0 0.00
27 Rayagada 0.00 0.00 0.00 0.00 0.00 0 0.00 0.00 0 0 0 0 0 0.00
28 Sambalpur 0.00 0.00 0.00 0.00 0.00 0 0.00 0.00 0 0 0 0 0 0.00 29 Subarnapur 0.00 0.00 0.00 0.00 0.00 0 0.00 0.00 0 0 0 0 0 0.00
30 Sundergarh 0.00 0.00 0.00 0.00 0.00 0 0.00 0.00 0 0 0 0 0 0.00
Total 2096.88 0.00 6.00 2102.88 639.82 30 1463.06 0.00 265 206 471 156 315 0.00

58
ABSTRACT REPORT OF FINANCIAL AND PHYSICAL ACHIEVEMENT UNDER Non-CFC & 4th SFC
During the year 2020-21 upto the month of February'21
Sl. No.
Name of the District
Financial Achievement (Rs. in lakhs) Physical achievement Road (in Km.) CC/BT/ Water Board
Macadam/ earthen
OB as on 01.4.2020
Grant Receipt (2020-
21)
Other receipt (int. etc.)
2020-21
Total Funds
Expenditure
incurred
% of
Exp. Balance
UC submit
ted
No. of projects Proje
ct completed
Under progre
ss Spill Over
taken up
Total
1 2 3 4 5 6 7 8 9 10 11 12 13 14 15 16
1 Angul 445.51 0.00 0.00 445.51 12.40 3 433.11 0.00 5 2 7 0 7 0.00
2 Balasore 1119.67 0.00 0.00 1119.67 41.90 4 1077.77 0.00 17 1 18 4 14 0.00
3 Bargarh 272.95 0.00 0.00 272.95 35.00 13 237.95 0.00 0 3 3 3 0 0.00 4 Bhadrak 384.84 0.00 0.00 384.84 4.00 1 380.84 0.00 2 0 2 0 2 0.00
5 Balangir 680.27 0.00 0.00 680.27 0.00 0 680.27 0.00 6 0 6 0 6 0.00
6 Boudh 157.48 0.00 0.00 157.48 13.00 8 144.48 0.00 2 0 2 0 2 0.00
7 Cuttack 1247.89 0.00 0.00 1247.89 97.00 8 1150.89 0.00 14 23 37 12 25 0.00
8 Deogarh 395.16 0.00 0.00 395.16 62.50 16 332.66 0.00 13 1 14 0 14 0.00 9 Dhenkanal 287.82 0.00 0.00 287.82 193.27 67 94.55 0.00 29 10 39 25 14 0.00
10 Gajapati 163.48 0.00 0.00 163.48 41.45 25 122.03 0.00 19 6 25 10 15 5.50
11 Ganjam 713.87 0.00 0.00 713.87 222.00 31 491.87 0.00 18 38 56 5 51 0.00
12 Jagatsinghpur 699.32 0.00 0.00 699.32 60.00 9 639.32 0.00 10 8 18 18 0 3.00
13 Jajpur 1190.72 0.00 0.00 1190.72 22.00 2 1168.72 0.00 0 14 14 14 0 0.00 14 Jharsuguda 303.54 0.00 0.00 303.54 0.00 0 303.54 0.00 2 0 2 0 2 0.00
15 Kalahandi 609.58 0.00 0.00 609.58 0.00 0 609.58 0.00 16 0 16 0 16 0.00
16 Kandhamal 687.78 0.00 0.00 687.78 0.00 0 687.78 0.00 12 0 12 0 12 0.00
17 Kendrapada 633.33 0.00 0.00 633.33 86.53 14 546.80 0.00 64 0 64 23 41 0.00
18 Keonjhar 493.02 0.00 0.00 493.02 0.00 0 493.02 0.00 42 0 42 0 42 0.00
19 Khurda 568.02 0.00 0.00 568.02 38.00 7 530.02 0.00 51 0 51 5 46 0.47
20 Koraput 228.56 0.00 0.00 228.56 73.99 32 154.57 0.00 22 2 24 4 20 0.00
21 Malkangiri 309.64 0.00 0.00 309.64 26.00 8 283.64 0.00 50 17 67 11 56 0.00
22 Mayurbhanj 1327.35 0.00 0.00 1327.35 356.52 27 970.83 0.00 133 11 144 58 86 0.00
23 Nawarangpur 567.31 0.00 0.00 567.31 70.50 12 496.81 0.00 57 5 62 19 43 0.00
24 Nayagarh 425.30 0.00 0.00 425.30 0.00 0 425.30 0.00 0 0 0 0 0 0.00 25 Nuapada 259.37 0.00 0.00 259.37 28.08 11 231.29 0.00 33 0 33 12 21 0.00
26 Puri 604.65 0.00 0.00 604.65 272.53 45 332.12 0.00 19 38 57 9 48 0.00
27 Rayagada 324.04 0.00 0.00 324.04 0.00 0 324.04 0.00 26 0 26 0 26 0.00
28 Sambalpur 262.31 0.00 0.00 262.31 74.92 29 187.39 0.00 8 12 20 9 11 0.00
29 Subarnapur 190.97 0.00 0.00 190.97 4.11 2 186.86 0.00 10 0 10 0 10 0.00 30 Sundergarh 770.76 0.00 0.00 770.76 0.00 0 770.76 0.00 0 0 0 0 0 0.00
Total 16324.51 0.00 0.00 16324.51 1835.70 11 14488.81 0.00 680 191 871 241 630 8.97

59
Improvement/Repair/ Maintenance of Roads & Bridges (Panchayat Roads) (ZP & PS)
During the year 2020-21 upto the month of February'21
Sl.
No.
Name of the
District
Financial Achievement (Rs. in lakhs) Physical achievement Road (in Km.) CC/BT/ Water Board
Macadam/ earthen
OB as on 01.4.2020
Grant Receipt (2020-
21)
Other receipt (int. etc.)
2020-21
Total Funds
Expenditure
incurred
% of
Exp. Balance
UC submit
ted
No. of projects Project
completed
Under progre
ss Spill Over
taken up
Total
1 2 3 4 5 6 7 8 9 10 11 12 13 14 15 16
1 Angul 331.86 0.00 0.00 331.86 10.00 3 321.86 0.00 5 2 7 0 7 0.00
2 Balasore 965.03 0.00 0.00 965.03 9.40 1 955.63 0.00 17 0 17 3 14 0.00
3 Bargarh 47.00 0.00 0.00 47.00 0.00 0 47.00 0.00 0 0 0 0 0 0.00
4 Bhadrak 239.20 0.00 0.00 239.20 4.00 2 235.20 0.00 2 0 2 0 2 0.00 5 Balangir 473.50 0.00 0.00 473.50 0.00 0 473.50 0.00 5 0 5 0 5 0.00
6 Boudh 105.00 0.00 0.00 105.00 0.00 0 105.00 0.00 0 0 0 0 0 0.00
7 Cuttack 962.95 0.00 0.00 962.95 97.00 10 865.95 0.00 10 23 33 12 21 0.00
8 Deogarh 73.92 0.00 0.00 73.92 0.00 0 73.92 0.00 1 0 1 0 1 0.00
9 Dhenkanal 208.32 0.00 0.00 208.32 156.22 75 52.10 0.00 23 5 28 20 8 0.00 10 Gajapati 96.75 0.00 0.00 96.75 35.40 37 61.35 0.00 15 2 17 8 9 5.50
11 Ganjam 648.50 0.00 0.00 648.50 220.00 34 428.50 0.00 0 36 36 5 31 0.00
12 Jagatsinghpur 440.50 0.00 0.00 440.50 43.00 10 397.50 0.00 10 6 16 16 0 3.00
13 Jajpur 880.65 0.00 0.00 880.65 22.00 2 858.65 0.00 0 14 14 14 0 0.00
14 Jharsuguda 278.02 0.00 0.00 278.02 0.00 0 278.02 0.00 2 0 2 0 2 0.00 15 Kalahandi 303.07 0.00 0.00 303.07 0.00 0 303.07 0.00 8 0 8 0 8 0.00
16 Kandhamal 551.00 0.00 0.00 551.00 0.00 0 551.00 0.00 0 0 0 0 0 0.00
17 Kendrapada 452.25 0.00 0.00 452.25 46.28 10 405.97 0.00 55 0 55 21 34 0.00
18 Keonjhar 300.84 0.00 0.00 300.84 0.00 0 300.84 0.00 29 0 29 0 29 0.00
19 Khurda 209.99 0.00 0.00 209.99 38.00 18 171.99 0.00 34 0 34 5 29 0.47
20 Koraput 102.50 0.00 0.00 102.50 25.00 24 77.50 0.00 19 0 19 4 15 0.00 21 Malkangiri 204.44 0.00 0.00 204.44 2.00 1 202.44 0.00 46 0 46 4 42 0.00
22 Mayurbhanj 761.98 0.00 0.00 761.98 278.50 37 483.48 0.00 82 11 93 47 46 0.00
23 Nawarangpur 493.85 0.00 0.00 493.85 67.50 14 426.35 0.00 56 0 56 18 38 0.00
24 Nayagarh 331.00 0.00 0.00 331.00 0.00 0 331.00 0.00 0 0 0 0 0 0.00
25 Nuapada 115.03 0.00 0.00 115.03 24.00 21 91.03 0.00 15 0 15 10 5 0.00 26 Puri 325.41 0.00 0.00 325.41 124.91 38 200.50 0.00 6 18 24 6 18 0.00
27 Rayagada 244.92 0.00 0.00 244.92 0.00 0 244.92 0.00 24 0 24 0 24 0.00
28 Sambalpur 197.55 0.00 0.00 197.55 48.50 25 149.05 0.00 5 5 10 6 4 0.00
29 Subarnapur 44.00 0.00 0.00 44.00 0.00 0 44.00 0.00 10 0 10 0 10 0.00
30 Sundergarh 582.00 0.00 0.00 582.00 0.00 0 582.00 0.00 0 0 0 0 0 0.00
Total 10971.03 0.00 0.00 10971.03 1251.71 11 9719.32 0.00 479 122 601 199 402 8.97

60
Maintenance and repair of Residential Building of PRIs (ZP, PS & DPO ) During the year 2020-21 upto the month of February'21
Sl. No.
Name of the District
Financial Achievement (Rs. in lakhs) Physical achievement
OB as on 01.4.2020
Grant
Receipt
(2020-21)
Other receipt (int. etc.)
2020-21
Total Funds
Expenditure
incurred
% of
Exp. Balance
UC submit
ted
No. of projects Project
completed
Under progre
ss Spill Over
taken up
Total
1 2 3 4 5 6 7 8 9 10 11 12 13 14 15
1 Angul 19.65 0.00 0.00 19.65 2.40 12 17.25 0.00 0 0 0 0 0
2 Balasore 46.58 0.00 0.00 46.58 0.00 0 46.58 0.00 0 0 0 0 0
3 Bargarh 13.95 0.00 0.00 13.95 1.00 7 12.95 0.00 0 0 0 0 0 4 Bhadrak 10.14 0.00 0.00 10.14 0.00 0 10.14 0.00 0 0 0 0 0
5 Balangir 33.27 0.00 0.00 33.27 0.00 0 33.27 0.00 0 0 0 0 0
6 Boudh 4.48 0.00 0.00 4.48 3.00 67 1.48 0.00 1 0 1 0 1
7 Cuttack 49.78 0.00 0.00 49.78 0.00 0 49.78 0.00 0 0 0 0 0
8 Deogarh 42.99 0.00 0.00 42.99 10.00 23 32.99 0.00 11 1 12 0 12 9 Dhenkanal 18.30 0.00 0.00 18.30 12.05 66 6.25 0.00 1 4 5 5 0
10 Gajapati 26.13 0.00 0.00 26.13 2.05 8 24.08 0.00 0 1 1 0 1
11 Ganjam 32.47 0.00 0.00 32.47 0.00 0 32.47 0.00 16 0 16 0 16
12 Jagatsinghpur 88.82 0.00 0.00 88.82 8.00 9 80.82 0.00 0 1 1 1 0
13 Jajpur 65.07 0.00 0.00 65.07 0.00 0 65.07 0.00 0 0 0 0 0
14 Jharsuguda 13.42 0.00 0.00 13.42 0.00 0 13.42 0.00 0 0 0 0 0 15 Kalahandi 126.95 0.00 0.00 126.95 0.00 0 126.95 0.00 2 0 2 0 2
16 Kandhamal 22.78 0.00 0.00 22.78 0.00 0 22.78 0.00 0 0 0 0 0
17 Kendrapada 62.02 0.00 0.00 62.02 40.25 65 21.77 0.00 4 0 4 2 2
18 Keonjhar 105.81 0.00 0.00 105.81 0.00 0 105.81 0.00 11 0 11 0 11
17 Khurda 15.48 0.00 0.00 15.48 0.00 0 15.48 0.00 14 0 14 0 14 20 Koraput 63.11 0.00 0.00 63.11 48.99 78 14.12 0.00 0 2 2 0 2
21 Malkangiri 43.00 0.00 0.00 43.00 11.56 27 31.44 0.00 3 17 20 7 13
22 Mayurbhanj 142.92 0.00 0.00 142.92 10.52 7 132.40 0.00 14 0 14 7 7
23 Nawarangpur 30.46 0.00 0.00 30.46 0.00 0 30.46 0.00 0 0 0 0 0
24 Nayagarh 17.30 0.00 0.00 17.30 0.00 0 17.30 0.00 0 0 0 0 0 25 Nuapada 9.34 0.00 0.00 9.34 4.08 44 5.26 0.00 6 0 6 2 4
26 Puri 20.75 0.00 0.00 20.75 4.13 20 16.62 0.00 4 8 12 2 10
27 Rayagada 22.12 0.00 0.00 22.12 0.00 0 22.12 0.00 2 0 2 0 2
28 Sambalpur 36.46 0.00 0.00 36.46 14.42 40 22.04 0.00 3 6 9 3 6
29 Subarnapur 46.97 0.00 0.00 46.97 0.00 0 46.97 0.00 0 0 0 0 0
30 Sundergarh 69.76 0.00 0.00 69.76 0.00 0 69.76 0.00 0 0 0 0 0
Total 1300.28 0.00 0.00 1300.28 172.45 13 1127.83 0.00 92 40 132 29 103

61
Maintenance of Non-Residential Building of PRIs (ZP, PS & DPO ) During the year 2020-21 upto the month of February'21
Sl.
No.
Name of the
District
Financial Achievement (Rs. in lakhs) Physical achievement
OB as on 01.4.2020
Grant
Receipt (2020-
21)
Other receipt (int. etc.)
2020-21
Total Funds
Expenditure
incurred
% of
Exp. Balance
UC submit
ted
No. of projects Project
completed
Under progre
ss Spill Over
taken up
Total
1 2 3 4 5 6 7 8 9 10 11 12 13 14 15
1 Angul 30.00 0.00 0.00 30.00 0.00 0 30.00 0.00 0 0 0 0 0
2 Balasore 73.46 0.00 0.00 73.46 0.00 0 73.46 0.00 0 0 0 0 0
34 Bargarh 34.00 0.00 0.00 34.00 34.00 100 0.00 0.00 0 3 3 3 0
4 Bhadrak 47.00 0.00 0.00 47.00 0.00 0 47.00 0.00 0 0 0 0 0
5 Balangir 139.00 0.00 0.00 139.00 0.00 0 139.00 0.00 1 0 1 0 1
6 Boudh 30.00 0.00 0.00 30.00 10.00 33 20.00 0.00 1 0 1 0 1
7 Cuttack 160.61 0.00 0.00 160.61 0.00 0 160.61 0.00 0 0 0 0 0 8 Deogarh 22.75 0.00 0.00 22.75 0.00 0 22.75 0.00 1 0 1 0 1
9 Dhenkanal 36.20 0.00 0.00 36.20 0.00 0 36.20 0.00 4 0 4 0 4
10 Gajapati 8.10 0.00 0.00 8.10 4.00 49 4.10 0.00 1 3 4 2 2
11 Ganjam 5.90 0.00 0.00 5.90 0.00 0 5.90 0.00 2 0 2 0 2
12 Jagatsinghpur 148.00 0.00 0.00 148.00 9.00 6 139.00 0.00 0 1 1 1 0 13 Jajpur 222.00 0.00 0.00 222.00 0.00 0 222.00 0.00 0 0 0 0 0
14 Jharsuguda 12.10 0.00 0.00 12.10 0.00 0 12.10 0.00 0 0 0 0 0
15 Kalahandi 66.92 0.00 0.00 66.92 0.00 0 66.92 0.00 4 0 4 0 4
16 Kandhamal 75.00 0.00 0.00 75.00 0.00 0 75.00 0.00 12 0 12 0 12
17 Kendrapada 92.06 0.00 0.00 92.06 0.00 0 92.06 0.00 4 0 4 0 4 18 Keonjhar 74.37 0.00 0.00 74.37 0.00 0 74.37 0.00 1 0 1 0 1
19 Khurda 312.55 0.00 0.00 312.55 0.00 0 312.55 0.00 3 0 3 0 3
20 Koraput 40.00 0.00 0.00 40.00 0.00 0 40.00 0.00 1 0 1 0 1
21 Malkangiri 35.20 0.00 0.00 35.20 0.00 0 35.20 0.00 1 0 1 0 1
22 Mayurbhanj 229.10 0.00 0.00 229.10 35.00 2 194.10 0.00 20 0 20 3 17
23 Nawarangpur 25.00 0.00 0.00 25.00 3.00 12 22.00 0.00 1 5 6 1 5 24 Nayagarh 50.00 0.00 0.00 50.00 0.00 0 50.00 0.00 0 0 0 0 0
25 Nuapada 57.00 0.00 0.00 57.00 0.00 0 57.00 0.00 2 0 2 0 2
26 Puri 125.00 0.00 0.00 125.00 15.00 12 110.00 0.00 5 9 14 0 14
27 Rayagada 57.00 0.00 0.00 57.00 0.00 0 57.00 0.00 0 0 0 0 0
28 Sambalpur 28.30 0.00 0.00 28.30 12.00 42 16.30 0.00 0 1 1 0 1 29 Subarnapur 100.00 0.00 0.00 100.00 4.11 4 95.89 0.00 0 0 0 0 0
30 Sundergarh 83.00 0.00 0.00 83.00 0.00 0 83.00 0.00 0 0 0 0 0
Total 2419.62 0.00 0.00 2419.62 126.11 5 2293.51 0.00 64 22 86 10 76

62
Construction of Residential Building (ZP / PS) During the year 2020-21 upto the month of February'21
Sl.
No.
Name of the
District
Financial Achievement (Rs. in lakhs) Physical achievement
OB as on 01.4.2020
Grant Receipt (2020-
21)
Other receipt
(int. etc.) 2020-21
Total Funds
Expenditure
incurred
% of
Exp. Balance
UC submit
ted
No. of projects Proje
ct completed
Under progre
ss Spill Over
taken up
Total
1 2 3 4 5 6 7 8 9 10 11 12 13 14 15
1 Angul 18.00 0.00 0.00 18.00 0.00 0 18.00 0.00 0 0 0 0 0 2 Balasore 0.00 0.00 0.00 0.00 0.00 0 0.00 0.00 0 0 0 0 0
3 Bargarh 18.00 0.00 0.00 18.00 0.00 0 18.00 0.00 0 0 0 0 0
4 Bhadrak 38.00 0.00 0.00 38.00 0.00 0 38.00 0.00 0 0 0 0 0
5 Balangir 27.00 0.00 0.00 27.00 0.00 0 27.00 0.00 0 0 0 0 0
6 Boudh 18.00 0.00 0.00 18.00 0.00 0 18.00 0.00 0 0 0 0 0 7 Cuttack 13.80 0.00 0.00 13.80 0.00 0 13.80 0.00 2 0 2 0 2
8 Deogarh 229.00 0.00 0.00 229.00 27.50 12 201.50 0.00 0 0 0 0 0
9 Dhenkanal 18.00 0.00 0.00 18.00 18.00 100 0.00 0.00 0 0 0 0 0
10 Gajapati 32.50 0.00 0.00 32.50 0.00 0 32.50 0.00 3 0 3 0 3
11 Ganjam 27.00 0.00 0.00 27.00 2.00 7 25.00 0.00 0 2 2 0 2
12 Jagatsinghpur 18.00 0.00 0.00 18.00 0.00 0 18.00 0.00 0 0 0 0 0
13 Jajpur 18.00 0.00 0.00 18.00 0.00 0 18.00 0.00 0 0 0 0 0
14 Jharsuguda 0.00 0.00 0.00 0.00 0.00 0 0.00 0.00 0 0 0 0 0
15 Kalahandi 45.00 0.00 0.00 45.00 0.00 0 45.00 0.00 0 0 0 0 0
16 Kandhamal 18.00 0.00 0.00 18.00 0.00 0 18.00 0.00 0 0 0 0 0
17 Kendrapada 27.00 0.00 0.00 27.00 0.00 0 27.00 0.00 1 0 1 0 1 18 Keonjhar 5.00 0.00 0.00 5.00 0.00 0 5.00 0.00 1 0 1 0 1
19 Khurda 27.00 0.00 0.00 27.00 0.00 0 27.00 0.00 0 0 0 0 0
20 Koraput 0.00 0.00 0.00 0.00 0.00 0 0.00 0.00 0 0 0 0 0
21 Malkangiri 27.00 0.00 0.00 27.00 12.44 46 14.56 0.00 0 0 0 0 0
22 Mayurbhanj 59.25 0.00 0.00 59.25 0.00 0 59.25 0.00 8 0 8 0 8 23 Nawarangpur 18.00 0.00 0.00 18.00 0.00 0 18.00 0.00 0 0 0 0 0
24 Nayagarh 27.00 0.00 0.00 27.00 0.00 0 27.00 0.00 0 0 0 0 0
25 Nuapada 78.00 0.00 0.00 78.00 0.00 0 78.00 0.00 10 0 10 0 10
26 Puri 89.40 0.00 0.00 89.40 84.40 94 5.00 0.00 2 3 5 1 4
27 Rayagada 0.00 0.00 0.00 0.00 0.00 0 0.00 0.00 0 0 0 0 0
28 Sambalpur 0.00 0.00 0.00 0.00 0.00 0 0.00 0.00 0 0 0 0 0
29 Subarnapur 0.00 0.00 0.00 0.00 0.00 0 0.00 0.00 0 0 0 0 0
30 Sundergarh 36.00 0.00 0.00 36.00 0.00 0 36.00 0.00 0 0 0 0 0
Total 931.95 0.00 0.00 931.95 144.34 15 787.61 0.00 27 5 32 1 31

63
Construction of Non-Residential Building (ZP / PS ) During the year 2020-21 upto the month of February'21
Sl.
No.
Name of the
District
Financial Achievement (Rs. in lakhs) Physical achievement
OB as on 01.4.2020
Grant Receip
t
(2020-21)
Other receipt (int. etc.)
2020-21
Total Funds
Expenditure
incurred
% of
Exp. Balance
UC submit
ted
No. of projects Project
completed
Under progre
ss Spill Over
taken up
Total
1 2 3 4 5 6 7 8 9 10 11 12 13 14 15
1 Angul 46.00 0.00 0.00 46.00 0.00 0 46.00 0.00 0 0 0 0 0
2 Balasore 34.60 0.00 0.00 34.60 32.50 94 2.10 0.00 0 1 1 1 0 3 Bargarh 160.00 0.00 0.00 160.00 0.00 0 160.00 0.00 0 0 0 0 0
4 Bhadrak 50.50 0.00 0.00 50.50 0.00 0 50.50 0.00 0 0 0 0 0
5 Balangir 7.50 0.00 0.00 7.50 0.00 0 7.50 0.00 0 0 0 0 0
6 Boudh 0.00 0.00 0.00 0.00 0.00 0 0.00 0.00 0 0 0 0 0
7 Cuttack 60.75 0.00 0.00 60.75 0.00 0 60.75 0.00 2 0 2 0 2 8 Deogarh 26.50 0.00 0.00 26.50 25.00 94 1.50 0.00 0 0 0 0 0
9 Dhenkanal 7.00 0.00 0.00 7.00 7.00 100 0.00 0.00 1 1 2 0 2
10 Gajapati 0.00 0.00 0.00 0.00 0.00 0 0.00 0.00 0 0 0 0 0
11 Ganjam 0.00 0.00 0.00 0.00 0.00 0 0.00 0.00 0 0 0 0 0
12 Jagatsinghpur 4.00 0.00 0.00 4.00 0.00 0 4.00 0.00 0 0 0 0 0
13 Jajpur 5.00 0.00 0.00 5.00 0.00 0 5.00 0.00 0 0 0 0 0
14 Jharsuguda 0.00 0.00 0.00 0.00 0.00 0 0.00 0.00 0 0 0 0 0
15 Kalahandi 67.64 0.00 0.00 67.64 0.00 0 67.64 0.00 2 0 2 0 2
16 Kandhamal 21.00 0.00 0.00 21.00 0.00 0 21.00 0.00 0 0 0 0 0
17 Kendrapada 0.00 0.00 0.00 0.00 0.00 0 0.00 0.00 0 0 0 0 0
18 Keonjhar 7.00 0.00 0.00 7.00 0.00 0 7.00 0.00 0 0 0 0 0 19 Khurda 3.00 0.00 0.00 3.00 0.00 0 3.00 0.00 0 0 0 0 0
20 Koraput 22.95 0.00 0.00 22.95 0.00 0 22.95 0.00 2 0 2 0 2
21 Malkangiri 0.00 0.00 0.00 0.00 0.00 0 0.00 0.00 0 0 0 0 0
22 Mayurbhanj 134.10 0.00 0.00 134.10 32.50 24 101.60 0.00 9 0 9 1 8
23 Nawarangpur 0.00 0.00 0.00 0.00 0.00 0 0.00 0.00 0 0 0 0 0 24 Nayagarh 0.00 0.00 0.00 0.00 0.00 0 0.00 0.00 0 0 0 0 0
25 Nuapada 0.00 0.00 0.00 0.00 0.00 0 0.00 0.00 0 0 0 0 0
26 Puri 44.09 0.00 0.00 44.09 44.09 100 0.00 0.00 2 0 2 0 2
27 Rayagada 0.00 0.00 0.00 0.00 0.00 0 0.00 0.00 0 0 0 0 0
28 Sambalpur 0.00 0.00 0.00 0.00 0.00 0 0.00 0.00 0 0 0 0 0 29 Subarnapur 0.00 0.00 0.00 0.00 0.00 0 0.00 0.00 0 0 0 0 0
30 Sundergarh 0.00 0.00 0.00 0.00 0.00 0 0.00 0.00 0 0 0 0 0
Total 701.63 0.00 0.00 701.63 141.09 20 560.54 0.00 18 2 20 2 18

64
Financial & Physical Achievements made under Rashtriya Grama Swaraj Abhiyan (RGSA) during 2019-20 up to February-2021
Sl. No.
Name of the District
Financial (Rs. In lakh) Physical (in No.)
Remarks
O.B. as on
01.04.20
Funds received
during the year.
Other receipt
Total Funds
Available
Expenditure
% Balance Construction of
New G.P. Building
Repair / Renovation of G.P.
Bhawan
Construction of BPRC Building
Construction of DPRC Building
No. of participants
Target Completed Target Completed Target Completed Target Completed Target Ach.
1 2 3 4 5 6 7 8 9 10 11 12 13 14 15 16 17 18 19 20
1 Angul 218.00 0.00 0.00 218.00 215.27 99 2.73 1 0 0 0 3 0 1 0 - -
2 Balasore 243.00 0.00 0.00 243.00 0.00 0 243.00 1 1 0 0 4 4 1 1 - -
3 Bargarh 0.00 0.00 0.00 0.00 0.00 0 0.00 0 0 0 0 0 0 0 0 - -
4 Bhadrak 6.00 0.00 0.00 6.00 0.00 0 6.00 0 0 0 0 0 0 0 0 - -
5 Bolangir 141.50 100.00 0.00 241.50 148.50 61 93.00 1 1 10 8 0 0 0 - -
6 Boudh 3.00 0.00 0.00 3.00 3.00 100 0.00 0 0 0 0 0 0 0 0 - -
7 Cuttack 264.00 0.00 58.00 322.00 0.00 0 322.00 0 0 0 0 0 0 1 0 - -
8 Deogarh 3.00 0.00 0.00 3.00 0.00 0 3.00 0 0 0 0 0 0 0 0 - -
9 Dhenkanal 3.00 0.00 0.00 3.00 0.00 0 3.00 0 0 0 0 0 0 0 0 - -
10 Gajapati 55.12 0.00 0.00 55.12 45.65 83 9.47 0 0 0 0 0 0 1 0 - -
11 Ganjam 3.00 0.00 0.00 3.00 0.00 0 3.00 0 0 0 0 0 0 0 0 - -
12 Jagatsinghpur 2.00 0.00 0.00 2.00 2.00 100 0.00 1 0 0 0 0 0 0 0 - -
13 Jajpur 0.00 0.00 0.00 0.00 0.00 0 0.00 6 6 64 64 3 3 1 1 - -
14 Jharsuguda 3.00 0.00 0.00 3.00 0.00 0 3.00 0 0 0 0 0 0 0 0 - -
15 Kalahandi 48.79 0.00 0.00 48.79 34.07 70 14.72 2 0 0 0 2 0 0 0 21 21
16 Kandhamal 59.14 0.00 0.00 59.14 0.00 0 59.14 0 0 0 0 0 0 1 0 - -
17 Kendrapara 5.00 0.00 0.00 5.00 2.00 40 3.00 1 0 3 0 0 0 0 0 - -
18 Keonjhar 28.34 0.00 0.00 28.34 0.00 0 28.34 1 0 0 0 0 0 0 0 - -
19 Khurda 0.00 0.00 0.00 0.00 0.00 0 0.00 0 0 0 0 0 0 0 0 - -
20 Koraput 3.00 0.00 0.00 3.00 0.00 0 3.00 1 0 0 0 2 0 0 0 - -
21 Malkangiri 13.29 0.00 0.00 13.29 13.29 100 0.00 0 0 0 0 0 0 1 0 - -
22 Mayurbhanj 18.42 0.00 0.00 18.42 0.00 0 18.42 0 0 0 0 3 0 1 0 - -
23 Nabarangpur 100.00 0.00 0.00 100.00 6.87 7 93.13 0 0 0 0 0 0 1 0 - -
24 Nayagarh 0.00 0.00 0.00 0.00 0.00 0 0.00 2 0 0 0 0 0 1 0 - -
25 Nuapada 121.00 0.00 0.00 121.00 93.32 77 27.68 4 0 0 0 0 0 1 0 - -
26 Puri 10.00 0.00 0.00 10.00 0.00 0 10.00 0 0 0 0 2 0 0 0 - -
27 Rayagada 218.00 0.00 0.00 218.00 152.70 70 65.30 0 0 6 5 1 0 6 5 - -
28 Sambalpur 14.73 0.00 0.00 14.73 0.00 0 14.73 0 0 0 0 2 0 1 0 - -
29 Subarnapur 0.00 0.00 0.00 0.00 0.00 0 0.00 0 0 0 0 0 0 0 0 - -
30 Sundergarh 237.50 0.00 0.00 237.50 237.50 100 0.00 1 1 17 17 0 0 1 0 - -
TOTAL 1821.83 100.00 58.00 1979.83 954.17 48 1025.66 22 9 100 94 22 7 19 7 21 21
31 SIRD 976.00 0.00 0.00 976.00 719.00 74 257.00 - - - - - - - - 36700 36806
G. Total 2797.83 100.00 58.00 2955.83 1673.17 57 1282.66 22 9 100 94 22 7 19 7 36721 36827
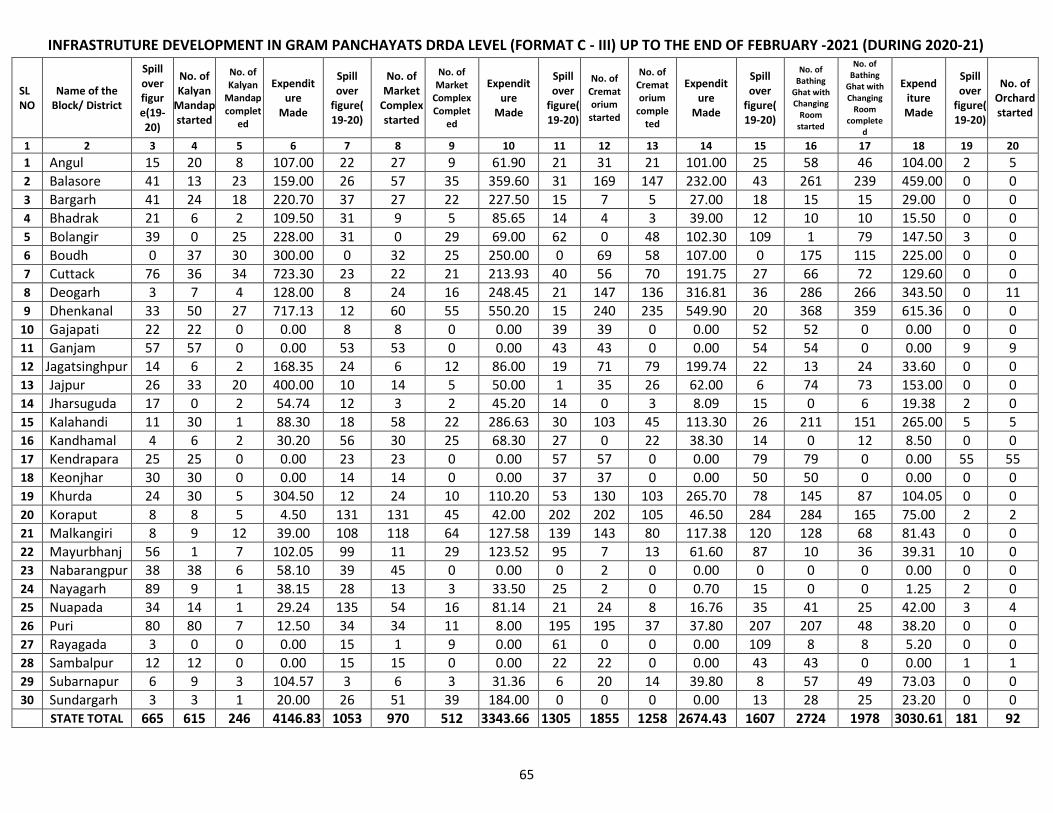
65
INFRASTRUTURE DEVELOPMENT IN GRAM PANCHAYATS DRDA LEVEL (FORMAT C - III) UP TO THE END OF FEBRUARY -2021 (DURING 2020-21)
SL NO
Name of the Block/ District
Spill over figure(19-20)
No. of Kalyan
Mandap started
No. of Kalyan
Mandap complet
ed
Expenditure
Made
Spill over
figure(19-20)
No. of Market
Complex started
No. of Market
Complex Complet
ed
Expenditure
Made
Spill over
figure(19-20)
No. of Crematorium
started
No. of Crematorium
completed
Expenditure
Made
Spill over
figure(19-20)
No. of Bathing
Ghat with Changing
Room started
No. of Bathing
Ghat with Changing
Room complete
d
Expenditure Made
Spill over
figure(19-20)
No. of Orchard started
1 2 3 4 5 6 7 8 9 10 11 12 13 14 15 16 17 18 19 20
1 Angul 15 20 8 107.00 22 27 9 61.90 21 31 21 101.00 25 58 46 104.00 2 5 2 Balasore 41 13 23 159.00 26 57 35 359.60 31 169 147 232.00 43 261 239 459.00 0 0
3 Bargarh 41 24 18 220.70 37 27 22 227.50 15 7 5 27.00 18 15 15 29.00 0 0 4 Bhadrak 21 6 2 109.50 31 9 5 85.65 14 4 3 39.00 12 10 10 15.50 0 0 5 Bolangir 39 0 25 228.00 31 0 29 69.00 62 0 48 102.30 109 1 79 147.50 3 0 6 Boudh 0 37 30 300.00 0 32 25 250.00 0 69 58 107.00 0 175 115 225.00 0 0 7 Cuttack 76 36 34 723.30 23 22 21 213.93 40 56 70 191.75 27 66 72 129.60 0 0 8 Deogarh 3 7 4 128.00 8 24 16 248.45 21 147 136 316.81 36 286 266 343.50 0 11 9 Dhenkanal 33 50 27 717.13 12 60 55 550.20 15 240 235 549.90 20 368 359 615.36 0 0
10 Gajapati 22 22 0 0.00 8 8 0 0.00 39 39 0 0.00 52 52 0 0.00 0 0 11 Ganjam 57 57 0 0.00 53 53 0 0.00 43 43 0 0.00 54 54 0 0.00 9 9 12 Jagatsinghpur 14 6 2 168.35 24 6 12 86.00 19 71 79 199.74 22 13 24 33.60 0 0 13 Jajpur 26 33 20 400.00 10 14 5 50.00 1 35 26 62.00 6 74 73 153.00 0 0 14 Jharsuguda 17 0 2 54.74 12 3 2 45.20 14 0 3 8.09 15 0 6 19.38 2 0 15 Kalahandi 11 30 1 88.30 18 58 22 286.63 30 103 45 113.30 26 211 151 265.00 5 5 16 Kandhamal 4 6 2 30.20 56 30 25 68.30 27 0 22 38.30 14 0 12 8.50 0 0 17 Kendrapara 25 25 0 0.00 23 23 0 0.00 57 57 0 0.00 79 79 0 0.00 55 55 18 Keonjhar 30 30 0 0.00 14 14 0 0.00 37 37 0 0.00 50 50 0 0.00 0 0 19 Khurda 24 30 5 304.50 12 24 10 110.20 53 130 103 265.70 78 145 87 104.05 0 0
20 Koraput 8 8 5 4.50 131 131 45 42.00 202 202 105 46.50 284 284 165 75.00 2 2 21 Malkangiri 8 9 12 39.00 108 118 64 127.58 139 143 80 117.38 120 128 68 81.43 0 0 22 Mayurbhanj 56 1 7 102.05 99 11 29 123.52 95 7 13 61.60 87 10 36 39.31 10 0 23 Nabarangpur 38 38 6 58.10 39 45 0 0.00 0 2 0 0.00 0 0 0 0.00 0 0 24 Nayagarh 89 9 1 38.15 28 13 3 33.50 25 2 0 0.70 15 0 0 1.25 2 0 25 Nuapada 34 14 1 29.24 135 54 16 81.14 21 24 8 16.76 35 41 25 42.00 3 4 26 Puri 80 80 7 12.50 34 34 11 8.00 195 195 37 37.80 207 207 48 38.20 0 0 27 Rayagada 3 0 0 0.00 15 1 9 0.00 61 0 0 0.00 109 8 8 5.20 0 0 28 Sambalpur 12 12 0 0.00 15 15 0 0.00 22 22 0 0.00 43 43 0 0.00 1 1 29 Subarnapur 6 9 3 104.57 3 6 3 31.36 6 20 14 39.80 8 57 49 73.03 0 0 30 Sundargarh 3 3 1 20.00 26 51 39 184.00 0 0 0 0.00 13 28 25 23.20 0 0
STATE TOTAL 665 615 246 4146.83 1053 970 512 3343.66 1305 1855 1258 2674.43 1607 2724 1978 3030.61 181 92

66
INFRASTRUTURE DEVELOPMENT IN GRAM PANCHAYATS DRDA LEVEL (FORMAT C - III) UP TO THE END OF FEBRUARY -2021 (DURING 2020-21)
SL NO
Name of the Block/ District
No. of Orchard completed
Expenditure Made
Spillover figure(19-20)
No. of Street Light started
No. of Street Light completed
Expenditure Made
Spillover figure(19-20)
No. of Hata started
No. of Hata completed
Expenditure Made
Spillover figure(19-20)
No. of Development of Play Field started
No. of Development of Play Field completed
Expenditure Made
Spillover figure(19-20)
No. of Info Theatre started
No. of Info Theatre completed
Expenditure Made
Total Expenditure
Remarks
1 2 21 22 23 24 25 26 27 28 29 30 31 32 33 34 35 36 37 38 39 40
1 Angul 3 11.00 4 8 4 4.00 3 7 4 9.20 6 14 6 20.90 0 0 0 0.00 419.00
2 Balasore 0 0.00 7 135 133 83.50 4 19 18 8.50 15 61 34 64.50 0 0 0 0.00 1366.10
3 Bargarh 0 0.00 9 0 0 0.00 4 3 3 15.00 26 4 4 18.00 0 0 0 0.00 469.20
4 Bhadrak 0 0.00 9 6 4 6.75 2 0 0 0.00 11 1 0 12.00 0 0 0 0.00 268.40
5 Bolangir 0 0.00 24 0 24 30.50 29 0 22 30.00 10 0 8 20.00 1 0 0 0.00 627.30
6 Boudh 0 0.00 100 250 180 90.00 1 69 36 160.00 0 15 9 27.00 0 0 0 0.00 1159.00
7 Cuttack 0 0.00 54 13 13 35.00 8 4 7 48.00 14 10 4 16.30 0 0 0 0.00 1357.88
8 Deogarh 11 30.70 12 122 113 203.00 11 34 31 35.48 15 92 87 120.45 0 0 0 0.00 1426.39
9 Dhenkanal 0 7.70 20 172 192 38.49 9 28 25 55.25 1 40 27 98.00 0 0 0 0.00 2632.03
10 Gajapati 0 0.00 0 0 0 0.00 0 0 0 0.00 1 1 0 0.00 25 25 0 0.00 0.00
11 Ganjam 0 0.00 50 50 0 0.00 8 8 0 0.00 44 44 0 0.00 0 0 0 0.00 0.00
12 Jagatsinghpur 0 0.00 21 1 1 1.50 4 0 2 6.50 7 0 0 0.00 0 0 0 0.00 495.69
13 Jajpur 0 0.00 0 0 0 0.00 0 6 3 20.00 0 5 5 19.00 0 0 0 0.00 704.00
14 Jharsuguda 0 4.53 4 0 0 0.00 8 2 5 15.67 1 0 0 2.00 0 0 0 0.00 149.61
15 Kalahandi 0 0.00 84 119 75 71.22 4 4 0 0.00 8 14 1 4.23 0 0 0 0.00 828.68
16 Kandhamal 0 0.00 58 10 50 75.03 0 0 0 0.00 23 2 5 15.30 0 0 0 0.00 235.90
17 Kendrapara 0 0.00 727 727 0 0.00 0 0 0 0.00 25 25 0 0.00 14 14 0 0.00 0.00
18 Keonjhar 0 0.00 0 0 0 0.00 41 41 0 0.00 48 48 0 0.00 157 157 0 0.00 0.00
19 Khurda 0 0.00 59 437 419 63.10 1 1 0 0.00 3 4 2 14.50 1 1 0 0.00 862.05
20 Koraput 0 0.00 0 0 0 0.00 0 0 0 0.00 30 30 0 0.00 0 0 0 0.00 168.00
21 Malkangiri 0 0.00 168 168 51 88.50 1 1 0 0.00 3 3 0 0.00 0 0 0 0.00 422.39
22 Mayurbhanj 1 18.50 333 0 47 47.67 28 4 12 64.94 113 22 31 136.26 0 0 0 0.00 593.85
23 Nabarangpur 0 0.00 0 0 0 0.00 0 0 0 0.00 0 0 0 0.00 0 0 0 0.00 58.10
24 Nayagarh 0 0.00 36 0 0 0.00 0 0 0 0.00 2 0 0 0.00 2 0 0 0.00 73.60
25 Nuapada 4 12.80 10 28 27 72.86 8 15 9 18.90 1 1 1 2.00 0 24 24 43.80 319.50
26 Puri 0 0.00 138 138 40 20.00 22 22 9 8.00 31 31 10 19.00 0 0 0 0.00 143.50
27 Rayagada 0 0.00 0 0 0 0.00 2 0 0 0.00 6 0 0 0.00 0 0 0 0.00 5.20
28 Sambalpur 0 0.00 29 29 0 0.00 8 8 0 0.00 5 5 0 0.00 6 6 0 0.00 0.00
29 Subarnapur 0 0.00 0 5 5 15.48 3 4 1 11.00 6 10 4 8.51 0 0 0 0.00 283.75
30 Sundargarh 0 0.00 224 224 117 14.60 10 22 19 17.50 0 0 0 0.00 8 8 0 0.00 259.30
STATE TOTAL 19 85.23 2180 2642 1495 961.20 287 302 206 523.94 526 482 238 617.95 256 235 24 43.80 15427.65

67
Monthly Progress Report on Bonded Labour for the month of February-2021
Sl. No
Name of the District.
No. of Meetings of
vigilance committee.
No. of Survey
conducted
No. of Bonded labour
identified
No. of Bonded Labour
Released.
Budget provision for rehabilitation
of freed bonded
labours. (In Rs.)
Re-imbursement claimed from
the Central Govt. (In Rs.)
Re-imbursement made by the Central Govt.
(In Rs.)
No. of Bonded Labour for whom state share
of rehabilitation Amount
released.
No. of Bonded Labour for
whom Request for Release
of Central Share Sent.
Remark
1 2 3 4 5 6 7 8 9 10 11
1 Angul 4 1 0 0 0 0 0 0 0 894,04.03.2021
2 Bolangir 0 0 0 0 2300000 0 0 0 19
3 Balasore 0 0 0 0 0 0 0 0 0
4 Bargarh 0 0 0 0 0 0 0 0 0 577,03.03.2021
5 Bhadrak 0 0 0 0 0 0 0 0 0
6 Boudh 0 0 0 0 0 0 0 0 0
7 Cuttack 0 0 0 0 0 0 0 0 0
8 Deogarh 0 0 0 0 0 0 0 0 0
9 Dhenkanal 0 0 0 0 0 0 0 0 0 762,02.03.2021
10 Gajapati 0 0 0 0 0 0 0 0 0
11 Ganjam 1 0 0 0 0 0 0 0 0
12 Jagatsinghpur 0 0 0 0 0 0 0 0 0 865,04.03.2021
13 Jajpur 0 0 0 0 0 0 0 0 14 354,09.03.2021
14 Jharsuguda 0 0 0 0 0 0 0 0 0
15 Kalahandi 0 0 0 0 0 0 0 0 0 1382,09.032021
16 Kandhamal 0 0 0 0 0 0 0 0 0
17 Kendrapara 0 0 0 0 0 0 0 0 0
18 Keonjhar 0 0 0 0 0 0 0 0 0 1012,02.03.2021
19 Khurda 0 0 0 0 0 0 0 0 0 697,12.03.2021
20 Koraput 0 0 0 0 0 0 0 0 0
21 Malkangiri 0 0 0 0 0 0 0 0 0
22 Mayurbhanj 0 0 0 0 0 0 0 0 0 1876,12.03.2021
23 Nawarangpur 0 0 0 0 0 0 0 0 0
24 Nayagarh 0 0 0 0 0 0 0 0 0 878,09.03.2021
25 Nuapada 0 0 0 0 0 0 0 0 0
26 Puri 0 0 0 0 17980000 0 0 56 899
27 Rayagada 0 0 0 0 0 0 0 0 0
28 Sambalpur 0 0 0 0 0 280000 240000 12 14
29 Subarnpur 0 0 0 0 420000 0 0 0 21
30 Sundargarh 4 0 0 0 0 0 0 0 0
Total 9 1 0 0 20700000 280000 240000 68 967

68
G.P./P.S. ROAD LENGTH (IN K.M. ) As on 31.03.2020
Sl. No
Name of the District
No. of
Block
Inter Village Road Intra Village Road Total
Length(4+9)
Surfaced Un
surfaced
Total Length in
Km
Length already
Executed
WBM/WMM
Un-Surfaced
Length to be
Executed
Total Length in
Km
Length already
Executed
WBM/WMM
Un-Surfaced
Length to be
Executed
WBM/ WMM(6
+11)
BT &CC(5+1
0)
Total(15+16)
(7+12)
1 2 3 4 5 6 7 8 9 10 11 12 13 14 15 16 17 18
1 Angul 8 2093.93 928.62 73.72 1091.59 1165.31 2298.06 985.50 44.32 1268.24 1312.56 4391.99 118.04 1914.12 2032.16 2359.83
2 Balasore 12 1826.81 961.87 841.36 23.58 864.94 2208.65 1045.86 873.68 1556.22 1162.79 4035.46 1715.04 2007.73 3722.77 1579.80
3 Bargarh 12 2682.08 1256.72 0.00 1425.36 1425.36 2295.83 1297.36 0.00 998.46 998.47 4977.91 0.00 2554.08 2554.08 2423.82
4 Bhadrak 7 1713.65 1009.24 307.49 396.92 704.41 1524.83 797.91 209.63 517.29 726.92 3238.48 517.12 1807.15 2324.27 914.21
5 Bolangir 14 5803.39 2171.70 1185.55 2446.14 3631.69 2317.80 1445.15 130.77 673.04 872.65 8121.19 1316.32 3616.85 4933.17 3119.18
6 Boudh 3 1715.92 206.05 15.80 1494.07 1509.87 1030.57 476.16 0.00 554.41 554.41 2746.49 15.80 682.21 698.01 2048.48
7 Cuttack 14 2224.31 1267.62 303.29 653.40 956.69 1797.48 1050.11 265.89 494.17 747.37 4021.79 569.18 2317.73 2886.91 1147.57
8 Deogarh 3 2288.22 868.52 166.92 1252.78 1419.70 1429.38 708.30 41.02 680.06 721.08 3717.60 207.94 1576.82 1784.76 1932.84
9 Dhenkanal 8 1891.26 1038.03 334.49 518.74 853.23 2016.32 1178.76 150.15 690.01 837.56 3907.58 484.64 2216.79 2701.43 1208.75
10 Ganjam 22 5692.63 1899.83 393.37 3399.43 3792.80 3024.95 1160.42 240.24 1624.29 1864.53 8717.58 633.61 3060.25 3693.86 5023.72
11 Gajpati 7 3595.34 1556.99 315.96 1722.39 2038.35 2846.52 793.15 371.70 1681.67 2053.37 6441.86 687.66 2350.14 3037.80 3404.06
12 J.singhpur 8 1605.36 850.95 279.60 474.81 754.41 1533.62 767.89 310.26 455.47 765.73 3138.98 589.86 1618.84 2208.70 930.28
13 Jajpur 10 2337.74 1563.65 220.26 594.43 774.09 1789.49 1156.12 202.09 466.66 633.37 4127.23 422.35 2719.77 3142.12 1061.09
14 Jharsuguda 5 1024.64 389.26 179.23 456.15 635.38 1025.57 528.75 140.06 356.76 496.82 2050.21 319.29 918.01 1237.30 812.91
15 Kalahandi 13 4750.45 1841.42 668.55 2240.48 2909.03 3209.55 1245.95 271.41 1692.19 1963.60 7960.00 939.96 3087.37 4027.33 3932.67
16 Kandhamal 12 3954.15 1240.67 190.96 2522.52 2713.48 3076.87 822.52 500.91 1753.44 2254.35 7031.02 691.87 2063.19 2755.06 4275.96
17 Kendrapada 9 1320.53 785.02 223.53 311.98 535.51 1612.96 802.65 385.44 424.87 810.31 2933.49 608.97 1587.67 2196.64 736.85
18 Keonjhar 13 3930.23 1856.45 783.83 1289.95 2073.78 2964.06 1296.96 783.88 883.22 1667.10 6894.29 1567.71 3153.41 4721.12 2173.17
19 Khurda 10 2424.00 1646.65 195.63 581.72 777.35 1471.81 723.03 187.38 561.40 748.78 3895.81 383.01 2369.68 2752.69 1143.12
20 Koraput 14 5165.55 2206.81 2184.09 774.65 2958.74 3398.10 1662.32 846.78 1200.20 1735.78 8563.65 3030.87 3869.13 6900.00 1974.85
21 Malkangiri 7 2789.55 1709.20 836.99 243.36 1080.35 1212.60 678.89 150.90 533.71 533.71 4002.15 987.89 2388.09 3375.98 777.07
22 Mayurbhanj 26 6058.10 2226.64 793.97 3037.49 3831.46 5328.87 1999.38 612.48 2717.01 3329.49 11386.97 1406.45 4226.02 5632.47 5754.50
23 Nabarangpur 10 3822.17 734.55 989.09 2098.53 3087.62 2351.57 857.14 789.25 705.18 1494.43 6173.74 1778.34 1591.69 3370.03 2803.71
24 Nayagarh 8 2596.92 1269.54 134.05 1193.33 1327.38 1784.83 1198.82 58.30 527.71 586.01 4381.75 192.35 2468.36 2660.71 1721.04
25 Nuapada 5 1854.99 556.67 466.71 831.61 1298.32 947.57 510.33 159.45 273.80 437.24 2802.56 626.16 1067.00 1693.16 1105.41
26 Puri 11 2037.78 1060.94 79.85 896.99 976.84 1923.11 959.03 77.95 886.13 964.08 3960.89 157.80 2019.97 2177.77 1783.12
27 Rayagada 11 3812.36 1309.94 678.23 1824.19 2502.42 2537.12 1400.10 498.26 985.07 1137.02 6349.48 1176.49 2710.04 3886.53 2809.26
28 Sambalpur 9 2730.64 1323.33 119.27 1288.04 1407.31 2348.11 1251.83 85.34 1010.94 1096.28 5078.75 204.61 2575.16 2779.77 2298.98
29 Subarnapur 6 2068.66 673.65 175.77 1219.24 1395.01 1506.40 624.62 114.62 539.21 881.78 3575.06 290.39 1298.27 1588.65 1758.45
30 Sundargarh 17 6871.77 3205.63 900.34 2755.79 3666.14 3795.99 1831.20 445.37 1519.42 1964.79 10667.76 1345.71 5036.83 6382.54 4275.21
Total 314 92683.13 39616.16 14037.90 39029.07 53066.96 66608.59 31256.21 8947.53 26404.86 35352.38 159291.72 22985.42 70872.37 93857.79 65433.93

69
Information on Concrete Drying Platform -cum-Threshing Floor (CDPTF) up to the month ending of February-2021
Sl. No
Name of District
Financial (Rs in lakh) Physical(in Nos)
Funds placed Total funds
available Expenditur
e
Funds received Total funds
available
Cumulative Expenditure (since May,2018)
% of exp.
Total target
received from Agrl.
Deptt.
No. of CDPTF sanctioned Tota
l
No. of CDPTF tender
finalised/taken up
No. of CDPTF
completed
Work under
progress
Balance for completion (Col. 11-
Col-13) 2016-17
2017-18
2016-17
2017-18
2019-20
1 2 3 4 5 6 7 8 9 10 11 12 13 14 15 16
1 Angul 219.6 585.60 805.20 631.81 78.47 59 30 80 110 110 90 20 20
2 Balasore 183.00 439.00 622.00 452.7 72.78 95 25 60 85 76 62 14 23
3 Bargarh 409.92 292.80 702.72 580.96 82.67 102 56 40 52 148 91 80 11 68
4 Bhadrak 146.40 219.60 366.00 321.26 87.78 64 20 30 50 50 43 7 7
5 Bolangir 329.40 0.00 329.40 302.65 91.88 92 56 0 56 46 43 3 13
6 Boudh 109.80 0.00 109.80 98.00 89.25 15 15 0 15 15 15 0 0
7 Cuttack 256.20 366.00 622.20 362.75 58.3 107 35 50 85 52 39 13 46
8 Dhenkanal 146.40 146.40 292.80 594.76 203.1 49 20 66 86 86 82 4 4
9 Gajapati 73.20 292.80 366.00 145.90 39.86 51 10 41 51 39 17 22 34
10 Ganjam 1098.00 1581.12 2679.12 1863 69.54 267 150 216 366 265 246 19 120
11 Jagatsinghpur 329.40 527.04 856.44 523.12 61.08 151 45 46 12 103 87 70 17 33
12 Jajpur 402.60 1207.00 1609.60 686.14 42.63 218 55 165 220 112 85 27 135
13 Jharsuguda 73.20 65.88 139.08 51.24 36.84 19 10 9 19 7 7 0 12
14 Kalahandi 475.80 483.12 958.92 844.85 88.1 131 65 60 125 125 121 4 4
15 Kandhamal 161.04 0.00 161.04 158.40 98.36 22 22 0 22 22 22 0 0
16 Kendrapada 278.16 907.68 1185.84 700.5 59.07 158 38 120 158 96 92 4 66
17 Keonjhar 366.00 366.00 732.00 483.12 66 101 50 50 100 84 66 18 34
18 Khurda 36.60 0.00 36.60 29.28 80 5 5 0 5 37 4 33 1
19 Koraput 476.75 0.00 476.75 476.75 100 65 65 0 65 65 65 0 0
20 Malkangiri 73.20 0.00 73.20 73.20 100 10 10 0 10 10 10 0 0
21 Mayurbhanj 109.80 73.20 183.00 109.80 60 25 15 10 25 18 12 6 13
22 Nawarangpur 483.12 0.00 483.12 439.2 90.91 66 66 0 66 66 63 3 3
23 Nayagarh 204.96 183.00 387.96 182.42 47.02 82 28 25 53 28 21 7 32
24 Nuapada 73.20 376.05 449.25 314.36 69.97 39 10 62 0 72 63 43 20 29
25 Puri 183.00 183.00 366.00 212.00 57.92 50 25 25 50 35 30 5 20
26 Rayagada 0.00 7.32 7.32 0.00 0 1 0 1 1 0 0 0 1
27 Sambalpur 183.00 0.00 183.00 145.38 79.44 25 25 0 25 25 25 0 0
28 Subarnapur 36.60 0.00 36.60 36.60 100 5 5 0 5 5 5 0 0
29 Sundergarh 234.24 0.00 234.24 183.00 78.13 32 32 0 32 32 25 7 7
Total 7152.59 8302.61 15455.20 11003.15 71.19 2106 988 1156 64 2208 1747 1483 264 725
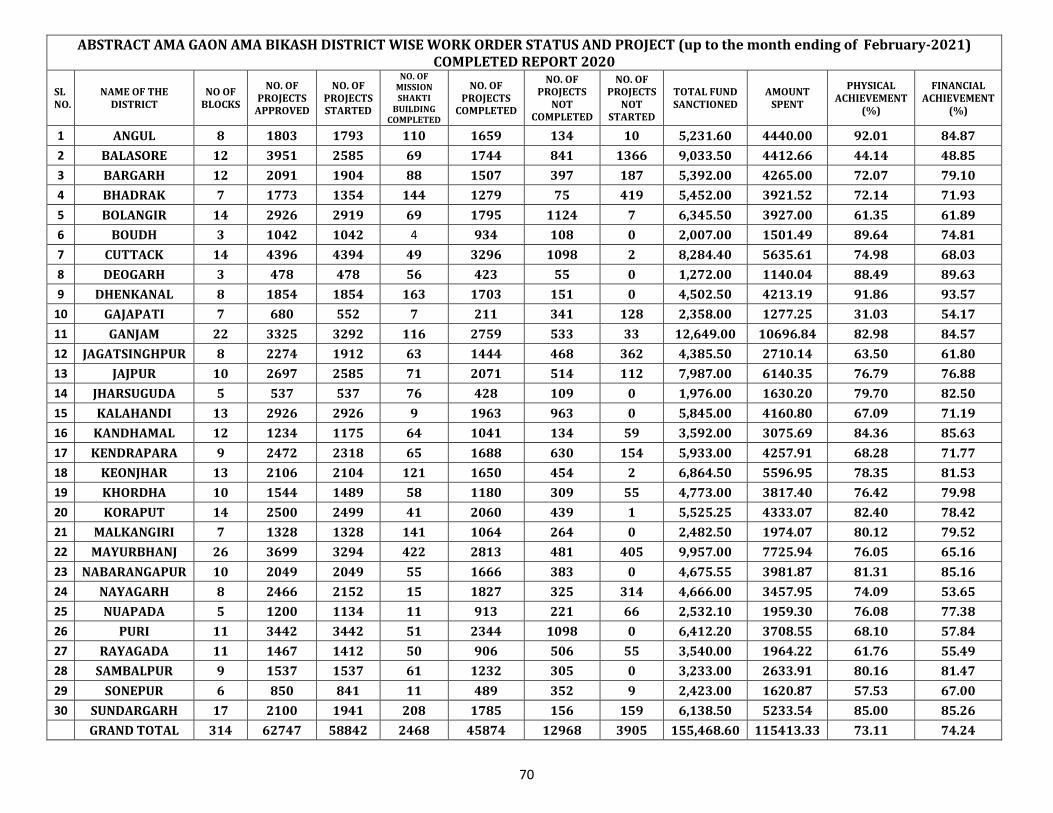
70
ABSTRACT AMA GAON AMA BIKASH DISTRICT WISE WORK ORDER STATUS AND PROJECT (up to the month ending of February-2021) COMPLETED REPORT 2020
SL NO.
NAME OF THE DISTRICT
NO OF BLOCKS
NO. OF PROJECTS
APPROVED
NO. OF PROJECTS STARTED
NO. OF MISSION SHAKTI
BUILDING COMPLETED
NO. OF PROJECTS
COMPLETED
NO. OF PROJECTS
NOT COMPLETED
NO. OF PROJECTS
NOT STARTED
TOTAL FUND SANCTIONED
AMOUNT SPENT
PHYSICAL ACHIEVEMENT
(%)
FINANCIAL ACHIEVEMENT
(%)
1 ANGUL 8 1803 1793 110 1659 134 10 5,231.60 4440.00 92.01 84.87
2 BALASORE 12 3951 2585 69 1744 841 1366 9,033.50 4412.66 44.14 48.85
3 BARGARH 12 2091 1904 88 1507 397 187 5,392.00 4265.00 72.07 79.10
4 BHADRAK 7 1773 1354 144 1279 75 419 5,452.00 3921.52 72.14 71.93
5 BOLANGIR 14 2926 2919 69 1795 1124 7 6,345.50 3927.00 61.35 61.89
6 BOUDH 3 1042 1042 4 934 108 0 2,007.00 1501.49 89.64 74.81
7 CUTTACK 14 4396 4394 49 3296 1098 2 8,284.40 5635.61 74.98 68.03
8 DEOGARH 3 478 478 56 423 55 0 1,272.00 1140.04 88.49 89.63
9 DHENKANAL 8 1854 1854 163 1703 151 0 4,502.50 4213.19 91.86 93.57
10 GAJAPATI 7 680 552 7 211 341 128 2,358.00 1277.25 31.03 54.17
11 GANJAM 22 3325 3292 116 2759 533 33 12,649.00 10696.84 82.98 84.57
12 JAGATSINGHPUR 8 2274 1912 63 1444 468 362 4,385.50 2710.14 63.50 61.80
13 JAJPUR 10 2697 2585 71 2071 514 112 7,987.00 6140.35 76.79 76.88
14 JHARSUGUDA 5 537 537 76 428 109 0 1,976.00 1630.20 79.70 82.50
15 KALAHANDI 13 2926 2926 9 1963 963 0 5,845.00 4160.80 67.09 71.19
16 KANDHAMAL 12 1234 1175 64 1041 134 59 3,592.00 3075.69 84.36 85.63
17 KENDRAPARA 9 2472 2318 65 1688 630 154 5,933.00 4257.91 68.28 71.77
18 KEONJHAR 13 2106 2104 121 1650 454 2 6,864.50 5596.95 78.35 81.53
19 KHORDHA 10 1544 1489 58 1180 309 55 4,773.00 3817.40 76.42 79.98
20 KORAPUT 14 2500 2499 41 2060 439 1 5,525.25 4333.07 82.40 78.42
21 MALKANGIRI 7 1328 1328 141 1064 264 0 2,482.50 1974.07 80.12 79.52
22 MAYURBHANJ 26 3699 3294 422 2813 481 405 9,957.00 7725.94 76.05 65.16
23 NABARANGAPUR 10 2049 2049 55 1666 383 0 4,675.55 3981.87 81.31 85.16
24 NAYAGARH 8 2466 2152 15 1827 325 314 4,666.00 3457.95 74.09 53.65
25 NUAPADA 5 1200 1134 11 913 221 66 2,532.10 1959.30 76.08 77.38
26 PURI 11 3442 3442 51 2344 1098 0 6,412.20 3708.55 68.10 57.84
27 RAYAGADA 11 1467 1412 50 906 506 55 3,540.00 1964.22 61.76 55.49
28 SAMBALPUR 9 1537 1537 61 1232 305 0 3,233.00 2633.91 80.16 81.47
29 SONEPUR 6 850 841 11 489 352 9 2,423.00 1620.87 57.53 67.00
30 SUNDARGARH 17 2100 1941 208 1785 156 159 6,138.50 5233.54 85.00 85.26
GRAND TOTAL 314 62747 58842 2468 45874 12968 3905 155,468.60 115413.33 73.11 74.24
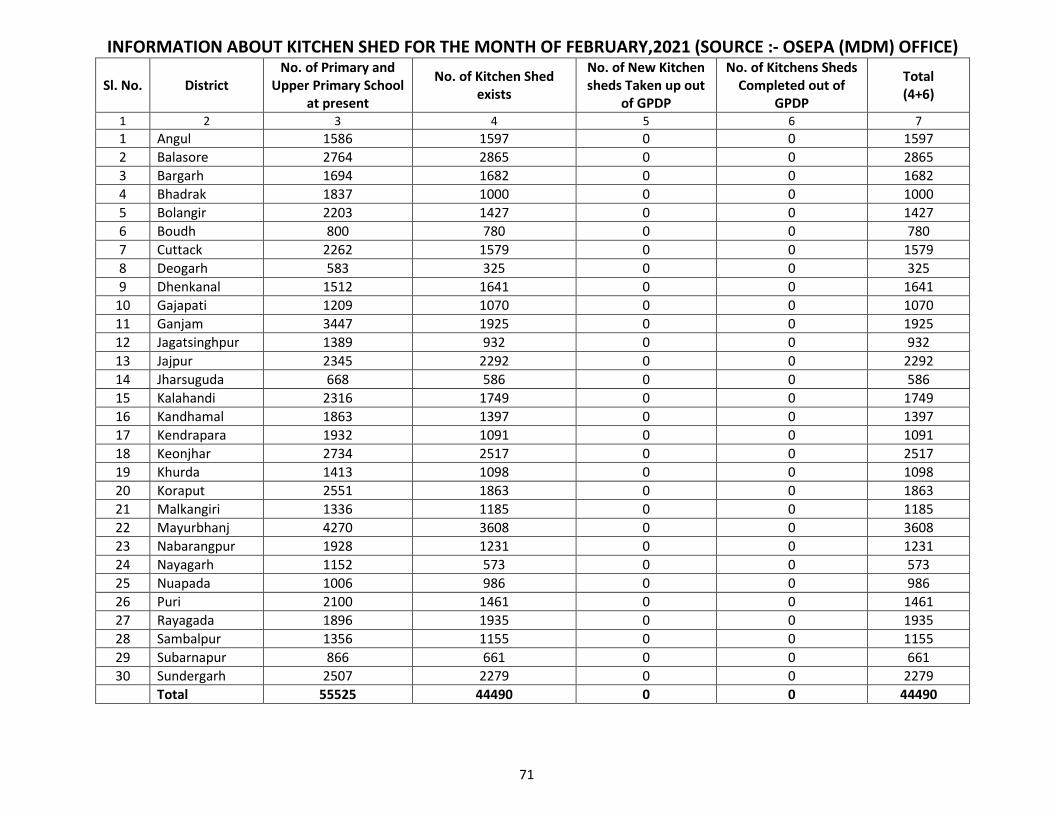
71
INFORMATION ABOUT KITCHEN SHED FOR THE MONTH OF FEBRUARY,2021 (SOURCE :- OSEPA (MDM) OFFICE)
Sl. No. District No. of Primary and
Upper Primary School at present
No. of Kitchen Shed exists
No. of New Kitchen sheds Taken up out
of GPDP
No. of Kitchens Sheds Completed out of
GPDP
Total (4+6)
1 2 3 4 5 6 7
1 Angul 1586 1597 0 0 1597
2 Balasore 2764 2865 0 0 2865
3 Bargarh 1694 1682 0 0 1682
4 Bhadrak 1837 1000 0 0 1000
5 Bolangir 2203 1427 0 0 1427
6 Boudh 800 780 0 0 780
7 Cuttack 2262 1579 0 0 1579
8 Deogarh 583 325 0 0 325
9 Dhenkanal 1512 1641 0 0 1641
10 Gajapati 1209 1070 0 0 1070
11 Ganjam 3447 1925 0 0 1925
12 Jagatsinghpur 1389 932 0 0 932
13 Jajpur 2345 2292 0 0 2292
14 Jharsuguda 668 586 0 0 586
15 Kalahandi 2316 1749 0 0 1749
16 Kandhamal 1863 1397 0 0 1397
17 Kendrapara 1932 1091 0 0 1091
18 Keonjhar 2734 2517 0 0 2517
19 Khurda 1413 1098 0 0 1098
20 Koraput 2551 1863 0 0 1863
21 Malkangiri 1336 1185 0 0 1185
22 Mayurbhanj 4270 3608 0 0 3608
23 Nabarangpur 1928 1231 0 0 1231
24 Nayagarh 1152 573 0 0 573
25 Nuapada 1006 986 0 0 986
26 Puri 2100 1461 0 0 1461
27 Rayagada 1896 1935 0 0 1935
28 Sambalpur 1356 1155 0 0 1155
29 Subarnapur 866 661 0 0 661
30 Sundergarh 2507 2279 0 0 2279
Total 55525 44490 0 0 44490

72
INFORMATION ABOUT LPG CONNECTION FOR MDM PROGRAMME UPTO THE MONTH OF FEBRUARY, 2021 (Source :- OSEPA (MDM) Office)
Sl. No.
District
No. of LPG Connection required to be given to
Primary and Upper Primary School under MDM
Programme (Target)
No. of LPG Connection to MDM Programme given by the end
of the previous month
No. of LPG Connection for MDM
Programme given during the Month
Total LPG Connections given
(4+5)
Left out Schools for LPG Connection
(3-6) Remarks
1 2 3 4 5 6 7 8
1 Angul 1416 1258 0 1258 158
2 Balasore 2545 2298 0 2298 247
3 Bargarh 1435 1294 0 1294 141
4 Bhadrak 1510 1391 0 1391 119
5 Bolangir 1927 1735 0 1735 192
6 Boudh 665 590 0 590 75
7 Cuttack 1427 1323 0 1323 104
8 Deogarh 504 434 0 434 70
9 Dhenkanal 1294 1200 0 1200 94
10 Gajapati 783 686 0 686 97
11 Ganjam 2693 2450 0 2450 243
12 Jagatsinghpur 1389 1185 0 1185 204
13 Jajpur 2033 1843 0 1843 190
14 Jharsuguda 564 494 0 494 70
15 Kalahandi 2316 2013 0 2013 303
16 Kandhamal 1439 1237 0 1237 202
17 Kendrapara 1932 1684 0 1684 248
18 Keonjhar 2496 2371 0 2371 125
19 Khurda 828 828 0 828 0
20 Koraput 1736 1591 0 1591 145
21 Malkangiri 1336 1146 0 1146 190
22 Mayurbhanj 4270 3678 0 3678 592
23 Nabarangpur 1793 1575 0 1575 218
24 Nayagarh 909 825 0 825 84
25 Nuapada 851 766 0 766 85
26 Puri 1514 1346 0 1346 168
27 Rayagada 1896 1665 0 1665 231
28 Sambalpur 1142 1002 0 1002 140
29 Subarnapur 729 648 0 648 81
30 Sundergarh 1805 1654 0 1654 151
Total 47177 42210 0 42210 4967
In col. 3, the total number of Schools shown except ( Consolidation Schools and Central kitchen covered Schools)
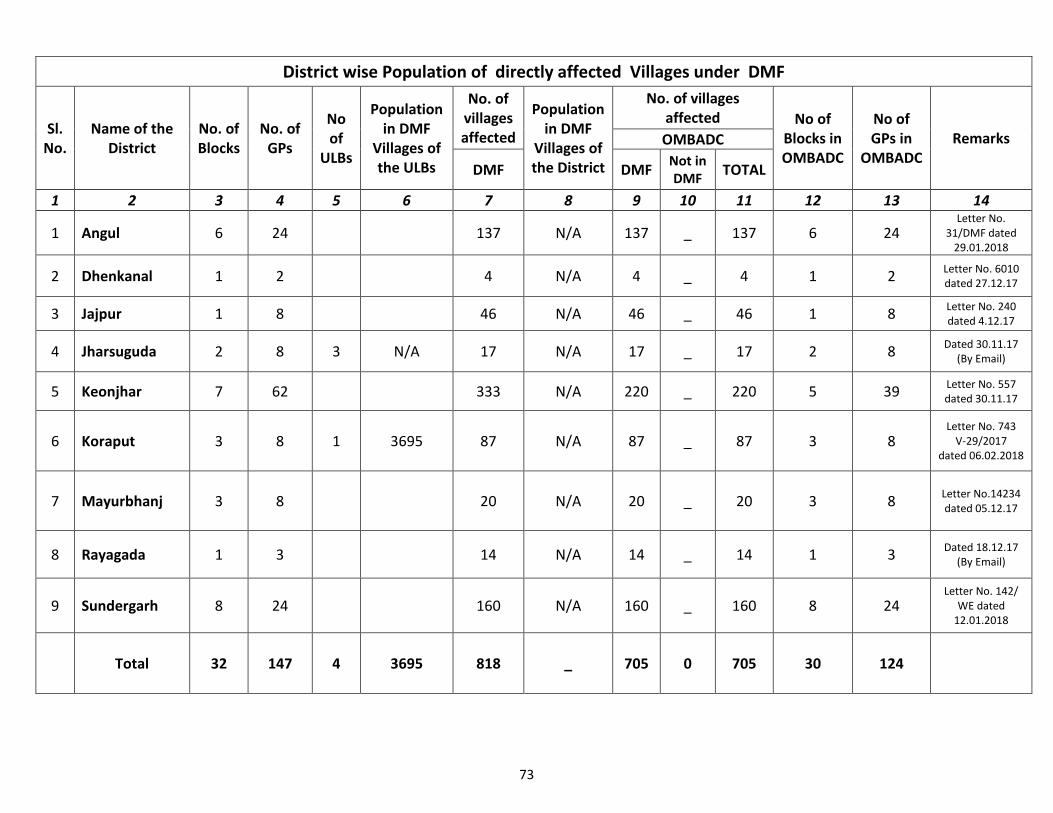
73
District wise Population of directly affected Villages under DMF
Sl. No.
Name of the District
No. of Blocks
No. of GPs
No of
ULBs
Population in DMF
Villages of the ULBs
No. of villages affected
Population in DMF
Villages of the District
No. of villages affected No of
Blocks in OMBADC
No of GPs in
OMBADC Remarks OMBADC
DMF DMF Not in DMF
TOTAL
1 2 3 4 5 6 7 8 9 10 11 12 13 14
1 Angul 6 24 137 N/A 137 _ 137 6 24 Letter No.
31/DMF dated 29.01.2018
2 Dhenkanal 1 2 4 N/A 4 _ 4 1 2 Letter No. 6010 dated 27.12.17
3 Jajpur 1 8 46 N/A 46 _ 46 1 8 Letter No. 240 dated 4.12.17
4 Jharsuguda 2 8 3 N/A 17 N/A 17 _ 17 2 8 Dated 30.11.17
(By Email)
5 Keonjhar 7 62 333 N/A 220 _ 220 5 39 Letter No. 557 dated 30.11.17
6 Koraput 3 8 1 3695 87 N/A 87 _ 87 3 8 Letter No. 743
V-29/2017 dated 06.02.2018
7 Mayurbhanj 3 8 20 N/A 20 _ 20 3 8 Letter No.14234 dated 05.12.17
8 Rayagada 1 3 14 N/A 14 _ 14 1 3 Dated 18.12.17
(By Email)
9 Sundergarh 8 24 160 N/A 160 _ 160 8 24 Letter No. 142/
WE dated 12.01.2018
Total 32 147 4 3695 818 _ 705 0 705 30 124

74
Name of Blocks under DMF & OMBADC
Sl. No.
Name of the District
No. of Blocks
Name of Blocks under DMF
No. of ULBs
Name of ULB under DMF No. of Blocks
Name of Blocks under OMBADC
1 2 3 4 5 6 7 8
1 Angul 6 Athmallik, Banarpal,
Chhendipada, Kaniha, Kishorenagar, Talcher
_ _ 6 Athmallik, Banarpal, Chhendipada, Kaniha, Kishornagar, Talcher
2 Dhenkanal 1 Kankadahad _ _ 1 Kankadahad
3 Jajpur 1 Sukinda _ _ 1 Sukinda
4 Jharsuguda 2 Lakhanpur, Jharsuguda
Sadar 3
Brajaraj Nagar Municipality, Jharsuguda
Municipality, Belpahar Municipality
2 Lakhanpur, Jharsuguda Sadar
5 Keonjhar 7
Banspal, Champua, Harichandanpur, Hatadihi,
Jhumpura, Joda, KeonjharSadar
_ _ 5 Banspal, Harichandanpur, Hatadihi, Jhumpura, Joda
6 Koraput 3 Koraput, Pottangi,
Laxmipur 1 Sunabeda Municipality 3 Koraput, Pottangi, Laxmipur
7 Mayurbhanj 3 Jashipur, Kusumi,
Rairangpur _ _ 3 Jashipur, Kusumi, Rairangpur
8 Rayagada 1 Kashipur _ _ 1 Kashipur
9 Sundergarh 8
Gurundia, Hemgiri, Koira, Kuarmunda, Kutra,
Lahunipada, Nuagaon, Rajgangpur
_ _ 8 Gurundia, Hemgiri, Koira, Kuarmunda, Kutra, Lahunipada, Nuagaon, Rajgangpur
TOTAL 32 4 30

75
Year wise outstanding position of U.C, as on "JANUARY- 2021" Report of A.G (O)
Sl. No. Financial Year Outstanding Amount
(Rs. in Crore)
1 2003 - 04 59.42
2 2004 - 05 32.65
3 2005 - 06 31.10
4 2006 - 07 40.13
5 2007 - 08 74.51
6 2008 - 09 65.80
7 2009 - 10 89.67
8 2010 - 11 95.54
9 2011 - 12 81.26
Sub Total 570.08
10 2012 - 13 62.47
11 2013 - 14 212.12
12 2014 - 15 658.57
13 2015- 16 844.25
Sub Total 2347.49
14 2016- 17 740.04
15 2017- 18 865.10
16 2018- 19 2390.72
17 2019-20 4455.63
Sub Total 10798.98
18 2020-21 6639.74
Grand Total 17438.72

76
Outstanding U.C position of schemes as reported by AG(O) as for the month of January -2021 (Rs. in Cr.)
Sl. No.
Name of the Schemes
2003 -04
2004 -05
2005 -06
2006 -07
2007 -08
2008 -09
2009 -10
2010-11
2011-12
2012-13
2013-14
2014-15
2015-16
2016-17
2017-18
2018 -19
2019 -20
Total
1 Non Plan
(CFC / SFC) 40.64 3.75 5.33 27.15 56.46 54.16 73.16 88.12 68.37 46.73 173.98 492.45 373.86 456.92 636.49 1204.69 937.42 4739.68
2 SBM - G 0.00 0.00 0.00 0.00 0.00 0.00 0.00 0.00 0.00 0.00 0.00 0.00 0.00 0.00 0.00 233.19 3024.26 3257.45
3 Rural Housing (IAY / PMAY &
Mo-Kudia / BPGY) 0.22 5.22 2.60 0.00 0.00 0.00 0.00 0.00 0.00 0.26 0.15 0.46 459.58 115.80 162.69 745.90 177.29 1670.17
4 NRLM 0.00 0.00 0.00 0.00 0.00 0.00 0.00 0.00 0.00 0.00 0.00 12.73 0.17 4.89 4.13 126.72 294.33 442.97
5 GGY 0.00 0.00 0.00 0.05 0.01 0.14 12.96 0.57 1.01 2.34 4.53 5.79 0.00 82.85 4.70 63.42 0.00 178.37
6 BRGF 0.00 0.00 0.00 0.00 0.00 0.00 0.00 0.00 0.00 0.00 0.00 129.02 0.00 0.00 0.00 0.00 0.00 129.02
7 NRuM 0.00 0.00 0.00 0.00 0.00 0.00 0.00 0.00 0.00 0.00 0.00 0.00 0.00 56.10 42.99 16.80 9.00 124.89
8 CC Road 0.00 0.00 0.00 0.00 0.00 0.00 0.00 1.50 0.25 10.60 31.97 9.99 10.64 0.00 0.00 0.00 0.00 64.95
9 SGRY 7.48 16.14 17.15 9.95 4.60 0.00 0.00 0.00 0.00 0.00 0.00 0.00 0.00 0.00 0.00 0.00 0.00 55.32
10 SGSY 3.36 4.76 1.03 0.28 0.36 1.52 3.55 5.35 10.58 0.41 1.17 1.06 0.00 0.00 0.00 0.00 0.00 33.43
11 RGSY,RGPSY &
RGSA 0.00 0.00 0.00 0.00 0.00 0.00 0.00 0.00 1.05 2.13 0.00 6.08 0.00 0.00 0.00 0.00 13.33 22.59
12 Interest
Subvention for WSHGs
0.00 0.00 0.00 0.00 0.00 0.00 0.00 0.00 0.00 0.00 0.00 0.00 0.00 8.33 14.00 0.00 0.00 22.33
13 MGNREGS 0.00 0.00 0.00 2.65 0.00 1.49 0.00 0.00 0.00 0.00 0.00 0.00 0.00 13.89 0.00 0.00 0.00 18.03
14 Cluster Housing 0.00 0.00 0.00 0.00 6.45 8.49 0.00 0.00 0.00 0.00 0.00 0.00 0.00 0.00 0.00 0.00 0.00 14.94
15 PMGY 6.89 2.73 0.73 0.00 0.00 0.00 0.00 0.00 0.00 0.00 0.00 0.00 0.00 0.00 0.00 0.00 0.00 10.35
16 Rural Sanitation 0.09 0.00 1.08 0.00 6.63 0.00 0.00 0.00 0.00 0.00 0.00 0.00 0.00 0.00 0.00 0.00 0.00 7.80
17 RLTAP 0.00 0.00 3.13 0.00 0.00 0.00 0.00 0.00 0.00 0.00 0.00 0.00 0.00 0.00 0.00 0.00 0.00 3.13
18 RBL 0.00 0.00 0.00 0.00 0.00 0.00 0.00 0.00 0.00 0.00 0.00 0.00 0.00 1.26 0.10 0.00 0.00 1.36
19 GSSK 0.00 0.00 0.00 0.00 0.00 0.00 0.00 0.00 0.00 0.00 0.32 0.99 0.00 0.00 0.00 0.00 0.00 1.31
20 DPAP 0.68 0.05 0.00 0.00 0.00 0.00 0.00 0.00 0.00 0.00 0.00 0.00 0.00 0.00 0.00 0.00 0.00 0.73
21 IRDP 0.00 0.00 0.05 0.05 0.00 0.00 0.00 0.00 0.00 0.00 0.00 0.00 0.00 0.00 0.00 0.00 0.00 0.10
22 JGSY 0.06 0.00 0.00 0.00 0.00 0.00 0.00 0.00 0.00 0.00 0.00 0.00 0.00 0.00 0.00 0.00 0.00 0.06
Total 59.42 32.65 31.10 40.13 74.51 65.80 89.67 95.54 81.26 62.47 212.12 658.57 844.25 740.04 865.10 2390.72 4455.63 10798.98
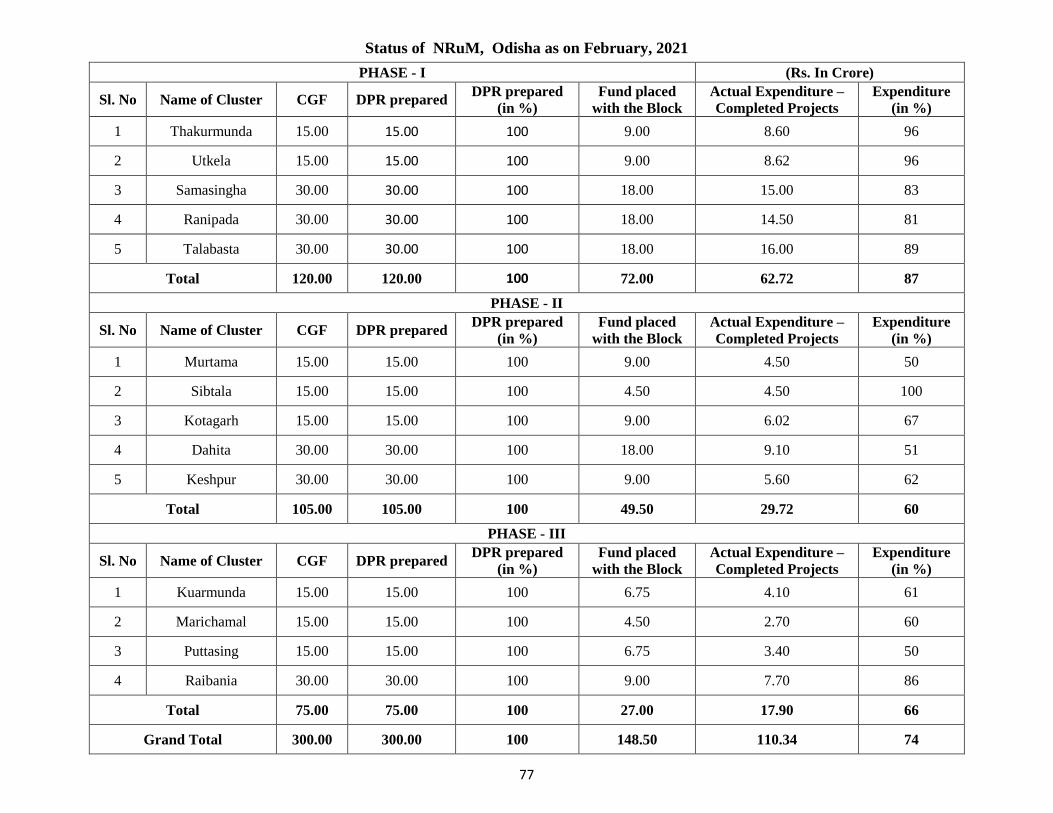
77
Status of NRuM, Odisha as on February, 2021
PHASE - I (Rs. In Crore)
Sl. No Name of Cluster CGF DPR prepared DPR prepared
(in %)
Fund placed
with the Block
Actual Expenditure –
Completed Projects
Expenditure
(in %)
1 Thakurmunda 15.00 15.00 100 9.00 8.60 96
2 Utkela 15.00 15.00 100 9.00 8.62 96
3 Samasingha 30.00 30.00 100 18.00 15.00 83
4 Ranipada 30.00 30.00 100 18.00 14.50 81
5 Talabasta 30.00 30.00 100 18.00 16.00 89
Total 120.00 120.00 100 72.00 62.72 87
PHASE - II
Sl. No Name of Cluster CGF DPR prepared DPR prepared
(in %)
Fund placed
with the Block
Actual Expenditure –
Completed Projects
Expenditure
(in %)
1 Murtama 15.00 15.00 100 9.00 4.50 50
2 Sibtala 15.00 15.00 100 4.50 4.50 100
3 Kotagarh 15.00 15.00 100 9.00 6.02 67
4 Dahita 30.00 30.00 100 18.00 9.10 51
5 Keshpur 30.00 30.00 100 9.00 5.60 62
Total 105.00 105.00 100 49.50 29.72 60
PHASE - III
Sl. No Name of Cluster CGF DPR prepared DPR prepared
(in %)
Fund placed
with the Block
Actual Expenditure –
Completed Projects
Expenditure
(in %)
1 Kuarmunda 15.00 15.00 100 6.75 4.10 61
2 Marichamal 15.00 15.00 100 4.50 2.70 60
3 Puttasing 15.00 15.00 100 6.75 3.40 50
4 Raibania 30.00 30.00 100 9.00 7.70 86
Total 75.00 75.00 100 27.00 17.90 66
Grand Total 300.00 300.00 100 148.50 110.34 74

78
PANCHAYATI RAJ & DRINKING WATER DEPARTMENT MONTHLY PERFORMANCE REPORT UPTO END OF FEBRUARY, 2021
Sl
No Name of the schemes
FINANCIAL PHYSICAL
Total Funds
Available
EXPENDITURE(RS. IN
CRORE) Target
ACHIEVEMENT
Upto end of
the month
% of
Exp.
Upto end of
the month
% of
Ach. UNIT
1 2 3 4 5 6 7 8 9
1
RU
RA
L
HO
USIN
G
P.M.A.Y (G) 5182.04 4124.95 79.60 1264041 359184 28.42 No. of Houses
BPGY 493.77 434.57 88.01 14258 5111 35.85 No. of Houses
BPGY (TITLI) 50.33 30.01 59.63 5199 3331 64.07 No. of Houses
BPGY (MINING) 43.51 25.80 59.30 1479 197 13.32 No. of Houses
NSPGY 64.82 50.81 78.39 6011 4252 70.74 No. of Houses
SUB TOTAL 5834.47 4666.14 79.98 1290988 372075 28.82 No. of Houses
2 MGNREGS 5195.49 5232.78 100.72 1700.00 1911.70 112.45 Lakh persondays
3 DAY-NRLM 728.44 591.70 81.23 254250 225619 88.74 No. of SHGs credit linked
4 DDU-GKY 269.76 114.04 42.27 31179 4500 14.43 No. of Youth trained
5
Drin
kin
g W
ater
JJM 2240.00 874.34 39.03 450 393 87.33 No. of Projects
BASUDHA 2500.00 673.26 26.93 650 589 90.62 No. of Projects
RIDF 750.00 686.73 91.56 110 71 64.55 No. of Projects
4th SFC(Mega PWS) 135.00 44.08 32.65 7 0 0.00 No. of Projects
OMBADC 2732.10 1214.80 44.46 14 1 7.14 No. of Projects
DMF 1319.48 660.38 50.05 476 106 22.27
SUB TOTAL 9676.58 4153.59 42.92 1707 1160 67.96 No. of Projects
6 SBM (G) 1450.00 614.48 42.38 244293 252486 103.35 IHHL
7 GGY 154.76 60.09 38.83 6911 3632 52.55 No. of projects
8 14th CFC 2882.44 1802.11 62.52 52498 25501 48.58 No. of projects
9 4th SFC 1294.28 291.32 22.51 17760 8898 50.10 No. of projects
10 RGSA 19.80 9.54 48.19 184 138 75.00 No. of projects
11 RGSA(CB) 9.76 7.03 72.03 36700 34606 94.29 No. of participants
12 AMA GAON AMA BIKASH 1554.69 1127.49 72.52 62747 44771 71.35 No. of projects
13 CRF (FANI) 246.61 246.61 100.00 13403 2375 17.72 No. of projects
GRAND TOTAL 29317.07 18916.92 64.53

79
MANIFESTO HIGHLIGHTS, PR & DW DEPARTMENT, 2020-21
Sl. No.
Manifesto Highlights Achievement (Upto end of February, 2021)
1
Conversion of the left out KUTCHA houses into PUCCA houses will be continued as a priority of the Government
Universe – 1. All eligible HH who are yet to be covered under any of RH Schemes. Achievement – 1. Survey to identify eligible but left out families from Permanent Wait List of PMAY(G) is complete. The list was published in all villages and web hosted in www.rhodisha.gov.in for public information. 2. Objections on the published list was held up due to COVID-19 pandemic. It will commence after COVID situation improves. 3. All these identified families will be provided Pucca houses by FY 2023-24.
2 Ama Gaon Ama Bikash along with PEETHA to be continued as a process of 5T in Governance.
“Ama Gaon Ama Bikash” scheme has been launched by State Government to give thought on taking up small and essential projects of local importance and providing missing links to the existing development infrastructure as well as repair, modernization and expansion works in rural areas. The selection of the projects under the scheme shall be made by the Local people, Community Organisations, Public representative and other Stake holders involving special nature of problems which are directly approved by the Hon’ble Chief Minister through interaction in Video Conferences with local people. Total 62747 no. of projects with cost of Rs.1554.69 crore have been approved covering 6798 no. of Gram Panchayats of 314 Blocks. Till date 44771 projects have been completed with expenditure of Rs. 1127.49 crore under the scheme. Government has also launched a new sub-scheme named as Peoples Empowerment Enabling Transparency & Enhancing Accountability on Odisha Initiatives (PEETHA) to create awareness among the people towards individual benefits and different schemes of the State Govt. like MMKPY, MBPY, Electric Connection, Mission Shakti Digital Empowerment, Ama LED, Sunetra etc. from December 2018 to February 2019 at each Gram Panchayat. Total 9505724 nos. of people were benefitted during the PEETHA camp. Total 3830 no. of Mission Shakti buildings have been approved under AGAB scheme out of which 2397 no. of Mission Shakti buildings completed till date.

80
Target & Achievements under different Poverty Alleviation Programmes in current Financial Year 2020-21 for February-2021 against the corresponding period of the previous year-2019-20
Sl. No.
Programme
Target for the current year 2020-2021
Achievement made up to February 2021
Target for the year 2019-2020 Achievement made up to
February 2020
Physical Financial
(Rs. in Lakh) Physical
Financial (Rs. in Lakh)
Physical Financial
(Rs. in Lakh) Physical
Financial (Rs. in Lakh)
1 2 3 4 5 6 7 8 9 10
1 NRLM 254250
(No of SHG ) 72843.57
225619 (No. of SHG
Credit Linked ) 59170.41
164650 (No of SHG )
45258.00 173200
(No of SHG Credit Linked)
41795.00
2 MGNREGS 1700 .00
(Lakh Persondays)
519548.53 1911.70
(Lakh Persondays)
523278.44 1000.00 ( Lakh
Persondays) 222104.00
949.09 (Lakh
Persondays) 243979.00
3 PMAY(G) 1264041 (No. of houses)
518204.00 359184 (No. of houses)
412495.00 756337 598710.00 300682
(No. of house) 466762.00
4 BIJU PUCCA
GHAR
14258 (No. of houses)
49377.00 5111
(No. of houses)
43457.00 30192
( No. of houses)
78066.00 14540 (No. of houses)
31294.00
5 GGY 6911
(No of works) 15475.58
3632 ( No of works )
6009.00 17491
(No of works) 34641.54
12183 ( No of works )
20184.00

81
Progress on Livelihood Interventions to combat the COVID-19 Pandemic Situation for the month of February-2021
Sl. No.
Name of the Component
Physical Achievement upto 01.03.2021(in Crore) Financial Achievement upto 01.03.2021
(Rs. In Crore)
Remarks Annual Target
Persondays (WLB)
Proportional LB upto
February, 2021
Achievement Achievement
in (%age)
No. of Persons
Provided Employment
Funds Available
Achievement Achievement
(%age)
1
Employment Generation for 20 Crore man-days
20.04 17.75 19.05 107.31 5,961,850 4448.94 5214.56 117.21
2
Skill Development of Migrant Workers (Training as mason for 45 days)
Total of 54631 of Returnee Migrant Workers have been mapped from 15 districts. These identified construction Workers and Masons are being enrolled and trained under Mason Training, 45-days Skill Development programme.
Till now 22998 Masons have trained.
3
Creation of 1.05 Lakh Farm Pond under "Mo Pokhari" initiative
1.05 Lakh
37,028 (Taken up)
upto 01.03.2021
33,419 (On-going)
upto 01.03.2021
3,609 (Completed)
upto 01.03.2021
4 Creation of 5 lakh Nutri-Garden
5.00 Lakh 5.09 lakh HH
identified
5.09 lakh HH Nutri garden
established up to
01.03.2021
Technical/Financial sanction of additional 178348 projects completed. 500 SHGs started raising community nurseries

THE
PANCHAYATI RAJ & DRINKING WATER DEPARTMENT
GOVERNMENT OF ODISHA
AUTHOR NAME
Email id:-
![The Monthly Musical Record 1871- · PDF fileThe Monthly Musical Record (1871-1960) The Monthly Musical Record [MMR] was published in London from 1 January 1871 to 1 December 1960](https://img.pdfslide.us/doc/110x75/5a776e807f8b9a1b688df62c/the-monthly-musical-record-1871-a-the-monthly-musical-record-1871-1960.jpg)