Embed Size (px)
Citation preview

1
Daniel Newton
School of Engineering and Energy
ENG460 Engineering Thesis
A Remote Area Power Supply (RAPS) Training Facility utilising SMA Sunny Island
Inverter technology and National Instruments measurement package.
“A report submitted to the School of Engineering and Energy, Murdoch University in
partial fulfilment of the requirements for the degree of Bachelor of Engineering”
November 2010
AUTHOR:
Daniel Newton, Student Number: 30477487
ACADEMIC SUPERVISOR:
Dr Martina Calais
UNIT COORDINATOR:
Professor Parisa Bahri

2
Daniel Newton
Declaration of Originality of Research:
I certify that the research described in this report has not already been submitted for
any other degree.
I certify that to the best of my knowledge, all sources used and any help received in the
preparation of this dissertation have been acknowledged.
Signed:__________________________________

3
Daniel Newton
Abstract
RAPS systems can sometimes be a cheaper alternative for supplying power than
connection to a distant utility. Most assuredly it is a cleaner method of producing
electricity than coal or gas constituents, provided the diesel generator is used
minimally. A modern RAPS system will generally have several sources of
generation, typically they might be; solar, wind and a diesel/petrol generator
coupled with a battery to store excess power. The RAPS 2 system at Murdoch
University was selected for an overhaul early in 2010. The system was
redesigned to include new inverter technology from SMA. The new system relies
on 3 separate inverters to convert the sources directly into grid quality electricity,
as opposed to some traditional RAPS systems that would have most of its
elements feed a DC bus that connected to a single inverter. This novel way of
setting up a mini grid finds its niche in situations when the terrain or
meteorological conditions make it impractical to have generation equipment all
localised and a DC bus would have higher associated cable losses.
For such a system to be of educational benefit to tertiary students, the variables
within the system must be able to be monitored. To this end an advanced
measurement system has been designed and procured so that every measurable
point in the upgraded system is available for display.
The measurement system was designed using National Instruments compact
DAQ (data acquisition) hardware, one of the first of its type to be introduced to
the university. The compact DAQ unit has been coupled with isolation equipment
supplied by Dataforth, which already has an existing prevalence throughout the
engineering department. The subsequent measurement program monitors 31
system variables at a high sampling rate to provide real time information on the
state of the system. The measurement program also monitors relevant
meteorological aspects such as the solar irradiance and local wind speed.
This report documents and details the steps taken to set up a new and novel
RAPS system. Discussed are the approaches taken throughout the semester to
project manage and facilitate progress. A detailed description is also given of the

4
Daniel Newton
measurement and protection system that has been designed to allow students
and the general public to get a good grasp on the performance of the system.

5
Daniel Newton
Acknowledgements
Undertaking a large project such as a final year project is no slight task, particularly if
attempting to go solo. Nevertheless the academic and technical support that was made
available throughout the length of the project was invaluable. There are a number of
people I would like to thank:
Dr. Martina Calais, for her source of motivation and clearing up the picture when
it seemed I was to be overwhelmed by the vast number of small details involved
in the project, without her help the project would have stagnated and never
progressed as it did.
Professor Parisa Bahri, for her ongoing academic support and encouragement.
Associate Professor Graeme Cole for his guidance and expertise when
specifying equipment.
I would like to thank the technical staff of Murdoch University, who were more than
happy to help with anything I needed. Will Stirling in particular for still providing valuable
assistance when he was laid up in bed. I wish to express gratitude to Mr. Wayne Clarke
who always had the answer, usually before I knew the question; he has been worth his
weight in gold with providing help on the physical aspects of the system.
Other help came from other various technical and professional staff at Murdoch
University and I would like to thank the following:
John Boulton,
Daniel Jones from the National Small Wind Turbine Test centre,
Dr Mehulbhai Patel and Houman Pezeshki from RISE.
During the course I had cause to approach the local branch of National Instruments,
during which time I was helped by NI‟s Field Applications Engineer Bhavin Desai and his
time and guidance in choosing the right tools for the job was greatly appreciated.
Lastly I would like to thank the classmates who were also doing their final projects and
shared „office space‟ with me. They have helped make the final semester at university a
memorable one.

6
Daniel Newton
Contents
ABSTRACT 3
ACKNOWLEDGEMENTS 5
LIST OF TABLES .................................................................................................................... 8
LIST OF FIGURES .................................................................................................................. 8
GLOSSARY/ ABBREVIATED DEFINITIONS 9
1. INTRODUCTION 11
1.1 RENEWABLE INSTITUTE FOR SUSTAINABLE ENERGY .................................................. 11
1.2 FURTHER APPLICATIONS – MICRO GRIDS ................................................................... 14
1.3 PROPOSED SYSTEM CHANGES .................................................................................. 16
2. PROJECT MANAGEMENT 19
2.1 PROCUREMENT OF EQUIPMENT .................................................................................. 19
2.2 INITIATING CONTACT WITH CONTRACTORS ................................................................. 20
2.3 INVITATION TO OFFER ................................................................................................ 21
3. THE MEASUREMENT SYSTEM 23
3.1 RATIONALE ................................................................................................................ 23
3.2 NATIONAL INSTRUMENTS HARDWARE ........................................................................ 25
3.3 ISOLATING EQUIPMENT .............................................................................................. 29
3.4 CURRENT SHUNT ....................................................................................................... 34
3.5 VOLTAGE DIVISION THEORY ....................................................................................... 36
3.6 MISCELLANEOUS MEASUREMENTS ............................................................................ 38
4. LABVIEW PROGRAM 39
4.1 PROGRAM DESIGN ..................................................................................................... 39
4.2 GRAPHICAL USER INTERFACE .................................................................................... 40
4.3 PROGRAM ARCHITECTURE ......................................................................................... 42
4.4 THE USER INTERFACE................................................................................................ 43
4.4.1 TASK DEFINITION .................................................................................................... 43
4.4.2 MAIN PROGRAM ...................................................................................................... 45
5. FUTURE DEVELOPMENTS 48
5.1 COMMISSIONING ........................................................................................................ 48
5.2 OTHER POTENTIAL DEVELOPMENTS .......................................................................... 52
6. CONCLUSIONS 53

7
Daniel Newton
7. REFERENCES 55
8. APPENDICES 57
APPENDIX 1: SUNNY BOY SB1100 TECHNICAL DATA .......................................................... 57
APPENDIX 2: SMA WINDY BOY WB1700 SPECIFICATIONS ................................................. 59
APPENDIX 3: SMA SUNNY ISLAND SPECIFICATIONS ............................................................ 60
APPENDIX 4: GINLONG SHOW 15A TECHNICAL SPECIFICATIONS ......................................... 61
APPENDIX 5: FORTIS PASSAAT 1.3KW TECHNICAL SPECIFICATIONS ................................... 62
APPENDIX 6: EXIDE BATTERY DATASHEET .......................................................................... 63
APPENDIX 7: INVITATION TO OFFER DOCUMENT .................................................................. 64
APPENDIX 8: NI-9205 SPECIFICATIONS .............................................................................. 64
APPENDIX 9: DATAFORTH 5B AMPLIFIER SPECIFICATIONS .................................................. 65
APPENDIX 10: MODULE AND CHANNEL ASSIGNMENT .......................................................... 66
8
Daniel Newton
List of Tables
Table 1: Channel allocation for the user interface ....................................................................... 47
List of Figures
Figure 1: RAPS 1 system configuration [3] ...................................................................... 12
Figure 2: RAPS 3 system configuration [6] ...................................................................... 13
Figure 3 RAPS 2 system configuration [8] ....................................................................... 14
Figure 4: Typical centralised DC grid [9] .......................................................................... 15
Figure 5: Typical SMA AC coupled architecture [10] ....................................................... 16
Figure 6: Turbine footing ................................................................................................... 21
Figure 7: measurement system points in the RAPS 2 system......................................... 23
Figure 8: NI cDAQ-9174 ................................................................................................... 26
Figure 9: NI-9205 .............................................................................................................. 27
Figure 10: 37pin connector to Pigtail ................................................................................ 28
Figure 11: Module installed in chassis with DSUB connection. ....................................... 28
Figure 12: Isolation Amplifier diagram [20] ....................................................................... 30
Figure 13: Isolation Amplifier Backplane .......................................................................... 31
Figure 14: Isolated signal architecture ............................................................................. 32
Figure 15: Fused test point ............................................................................................... 33
Figure 16: Proposed protection solution........................................................................... 33
Figure 17: A typical current shunt. [21] ............................................................................. 34
Figure 18: A simple Voltage divider circuit ....................................................................... 36
Figure 19: A simple LabVIEW program ............................................................................ 39
Figure 20: Graphical User Interface ................................................................................. 40
Figure 21: Detailed user information ................................................................................ 41
Figure 22: Example LabVIEW program [24] .................................................................... 42
Figure 23: Task definition in MAX..................................................................................... 44
Figure 24: Options available when configuring a task ..................................................... 45
Figure 25: Unbundling of the data .................................................................................... 46
9
Daniel Newton
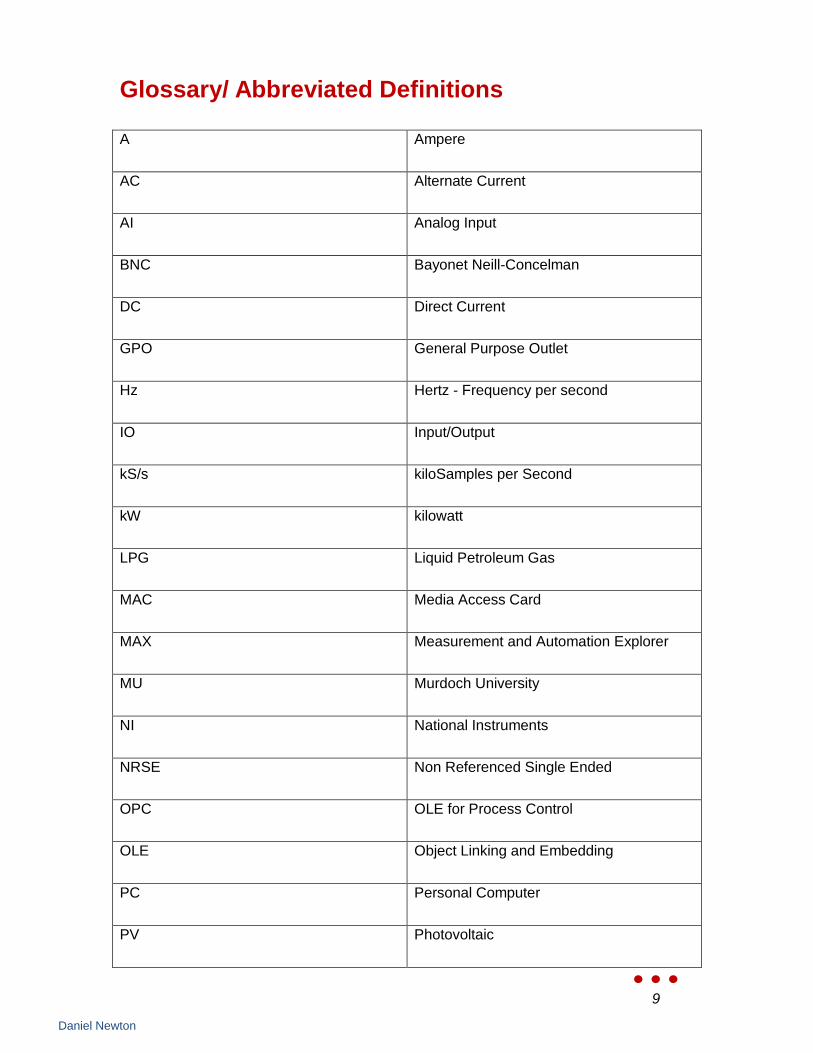
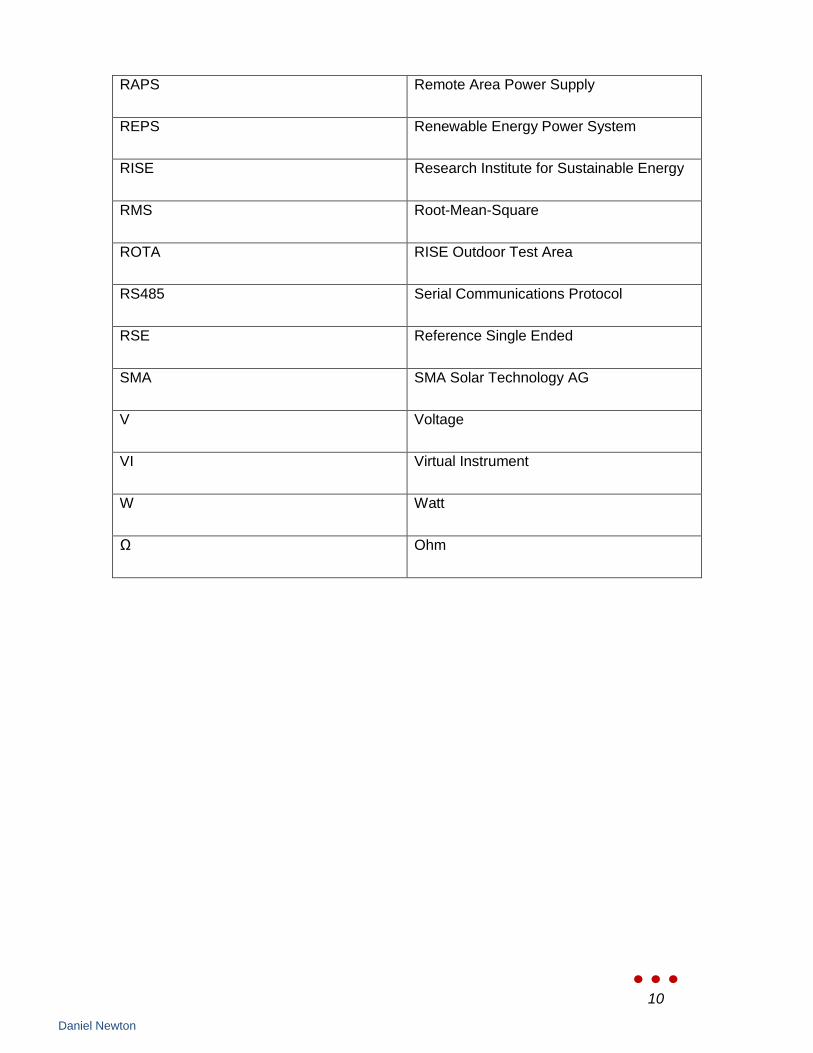
Glossary/ Abbreviated Definitions
A Ampere
AC Alternate Current
AI Analog Input
BNC Bayonet Neill-Concelman
DC Direct Current
GPO General Purpose Outlet
Hz Hertz - Frequency per second
IO Input/Output
kS/s kiloSamples per Second
kW kilowatt
LPG Liquid Petroleum Gas
MAC Media Access Card
MAX Measurement and Automation Explorer
MU Murdoch University
NI National Instruments
NRSE Non Referenced Single Ended
OPC OLE for Process Control
OLE Object Linking and Embedding
PC Personal Computer
PV Photovoltaic
10
Daniel Newton
RAPS Remote Area Power Supply
REPS Renewable Energy Power System
RISE Research Institute for Sustainable Energy
RMS Root-Mean-Square
ROTA RISE Outdoor Test Area
RS485 Serial Communications Protocol
RSE Reference Single Ended
SMA SMA Solar Technology AG
V Voltage
VI Virtual Instrument
W Watt
Ω Ohm
11
Daniel Newton
1. Introduction
A RAPS (Remote Area Power Supply) system is generally a system that cannot be
connected to the main utility grid due to reasons of remoteness and the cost of grid
connection infrastructure. A potential feature of RAPS systems is the potential to
harness methods of renewable power generation, sometimes consisting of an
amalgamation of solar power, wind power and hydro power. These configurations can
be found in places where access to a power generation utility is not readily available. [1]
Presently, there exists an increasing precedence whereby traditional RAPS systems that
rely on the combustion of hydrocarbons as a power source to be supplemented by a
renewable energy source. Most commonly solar arrays are incorporated because of the
ever reducing cost of solar panels, and the lack of moving parts that lends itself to
increased life spans over their rotating counterparts. Such a configuration is termed a
hybrid system due to the use of both hydrocarbons and renewable energies. The RISE
facility on Murdoch University‟s campus is suitably equipped to research into these
aforementioned systems.
1.1 Research Institute for Sustainable Energy (RISE)
The RISE facilities were originally started to research, test and develop new
technologies with a focus on renewable energy (sustainable energy). The capabilities of
RISE included photovoltaic module testing, wind turbine testing, battery testing, inverter
tests and battery charge controller testing, to name but a few. [2] The people who
worked at RISE conducted research and studies into improving the technology for
renewable power generation, helping make these systems commercially and
domestically viable.
RISE operated 3 remote area power supplies in its purpose built RAPS display operating
in a demountable building in the ROTA field. The purpose of this display is to
demonstrate the characteristics of renewable power devices and systems and elements
to both students and the general public.
12
Daniel Newton
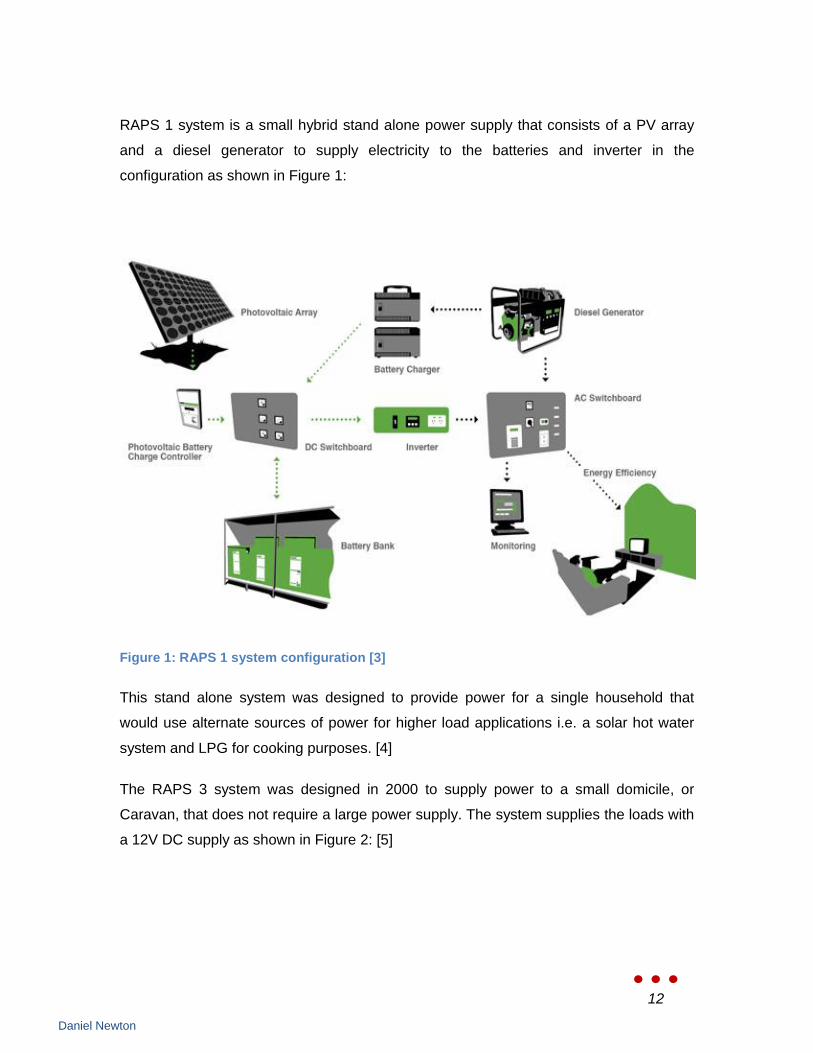
RAPS 1 system is a small hybrid stand alone power supply that consists of a PV array
and a diesel generator to supply electricity to the batteries and inverter in the
configuration as shown in Figure 1:
Figure 1: RAPS 1 system configuration [3]
This stand alone system was designed to provide power for a single household that
would use alternate sources of power for higher load applications i.e. a solar hot water
system and LPG for cooking purposes. [4]
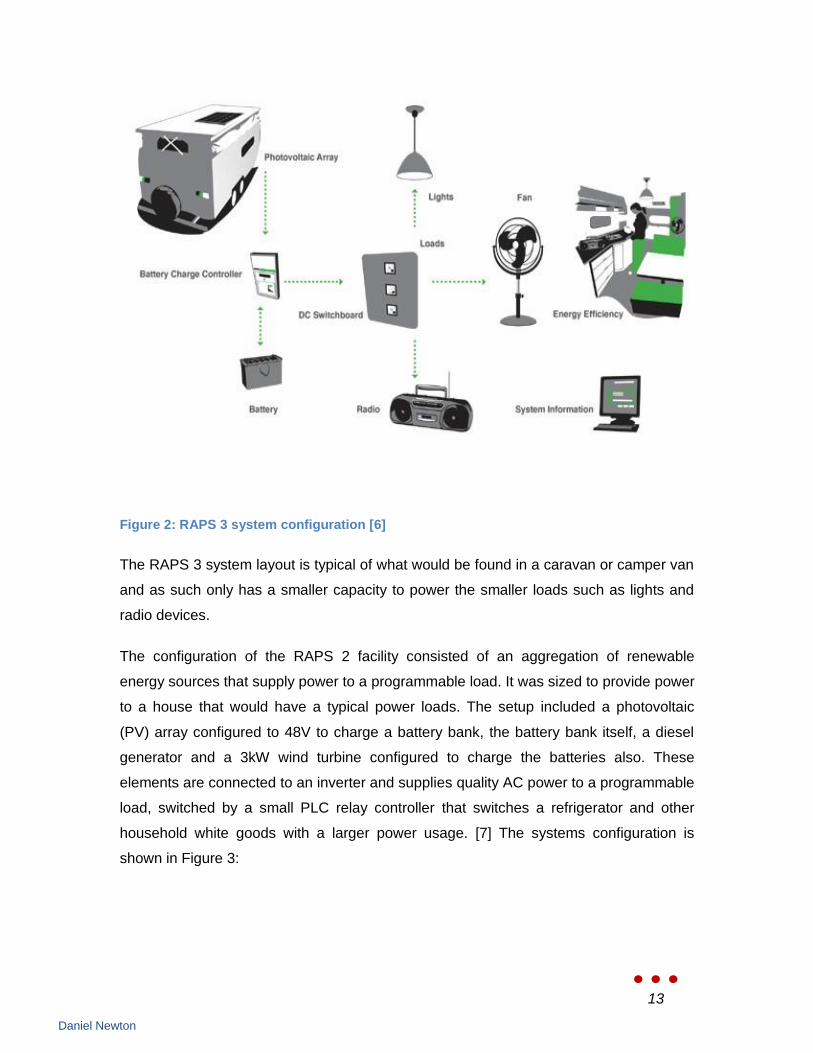
The RAPS 3 system was designed in 2000 to supply power to a small domicile, or
Caravan, that does not require a large power supply. The system supplies the loads with
a 12V DC supply as shown in Figure 2: [5]
13
Daniel Newton
Figure 2: RAPS 3 system configuration [6]
The RAPS 3 system layout is typical of what would be found in a caravan or camper van
and as such only has a smaller capacity to power the smaller loads such as lights and
radio devices.
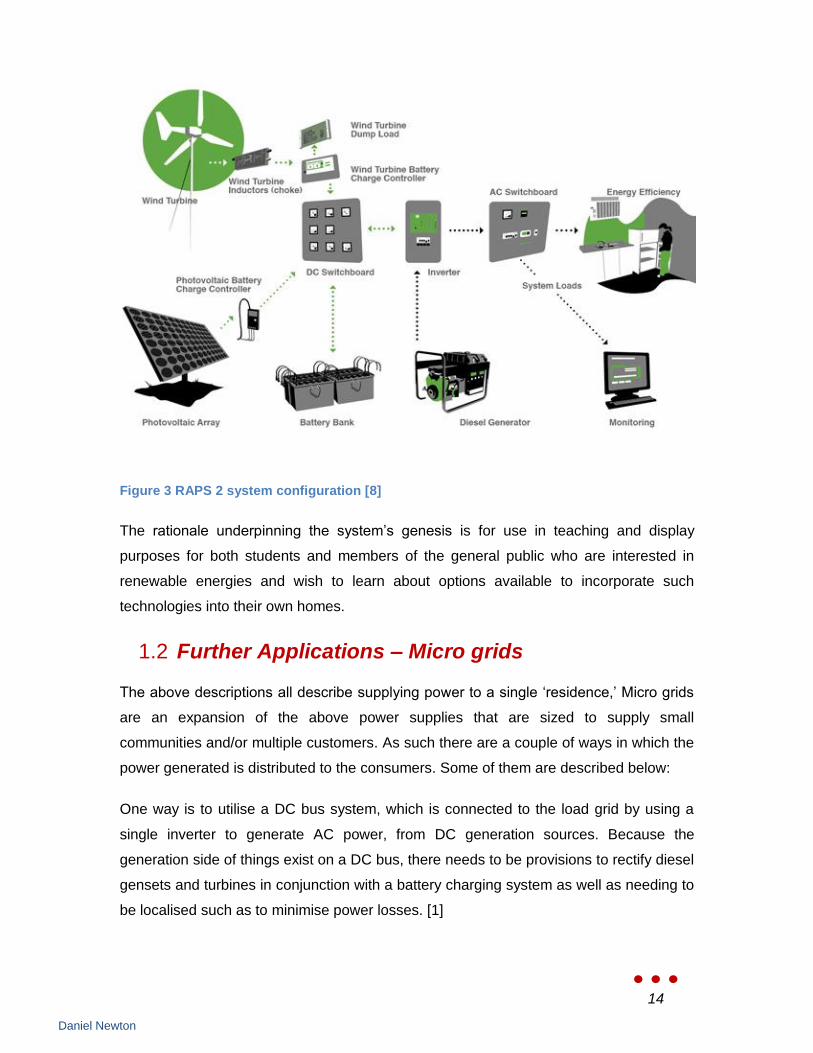
The configuration of the RAPS 2 facility consisted of an aggregation of renewable
energy sources that supply power to a programmable load. It was sized to provide power
to a house that would have a typical power loads. The setup included a photovoltaic
(PV) array configured to 48V to charge a battery bank, the battery bank itself, a diesel
generator and a 3kW wind turbine configured to charge the batteries also. These
elements are connected to an inverter and supplies quality AC power to a programmable
load, switched by a small PLC relay controller that switches a refrigerator and other
household white goods with a larger power usage. [7] The systems configuration is
shown in Figure 3:
14
Daniel Newton
Figure 3 RAPS 2 system configuration [8]
The rationale underpinning the system‟s genesis is for use in teaching and display
purposes for both students and members of the general public who are interested in
renewable energies and wish to learn about options available to incorporate such
technologies into their own homes.
1.2 Further Applications – Micro grids
The above descriptions all describe supplying power to a single „residence,‟ Micro grids
are an expansion of the above power supplies that are sized to supply small
communities and/or multiple customers. As such there are a couple of ways in which the
power generated is distributed to the consumers. Some of them are described below:
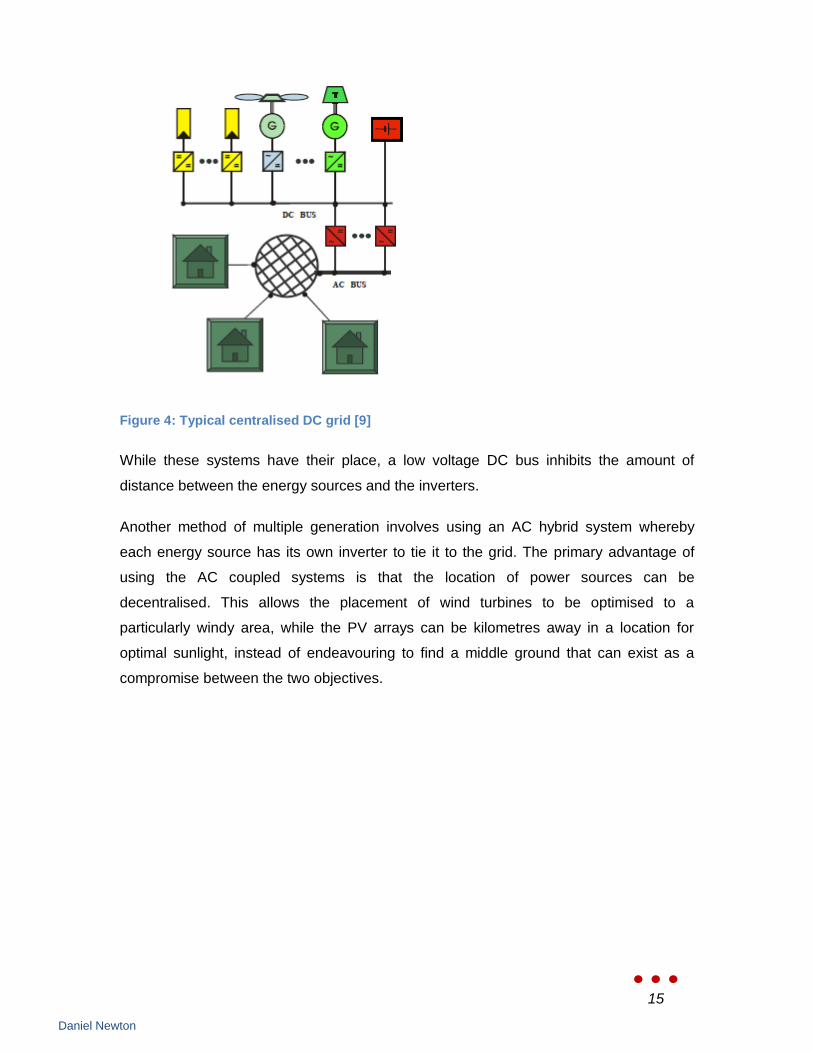
One way is to utilise a DC bus system, which is connected to the load grid by using a
single inverter to generate AC power, from DC generation sources. Because the
generation side of things exist on a DC bus, there needs to be provisions to rectify diesel
gensets and turbines in conjunction with a battery charging system as well as needing to
be localised such as to minimise power losses. [1]
15
Daniel Newton
Figure 4: Typical centralised DC grid [9]
While these systems have their place, a low voltage DC bus inhibits the amount of
distance between the energy sources and the inverters.
Another method of multiple generation involves using an AC hybrid system whereby
each energy source has its own inverter to tie it to the grid. The primary advantage of
using the AC coupled systems is that the location of power sources can be
decentralised. This allows the placement of wind turbines to be optimised to a
particularly windy area, while the PV arrays can be kilometres away in a location for
optimal sunlight, instead of endeavouring to find a middle ground that can exist as a
compromise between the two objectives.
16
Daniel Newton
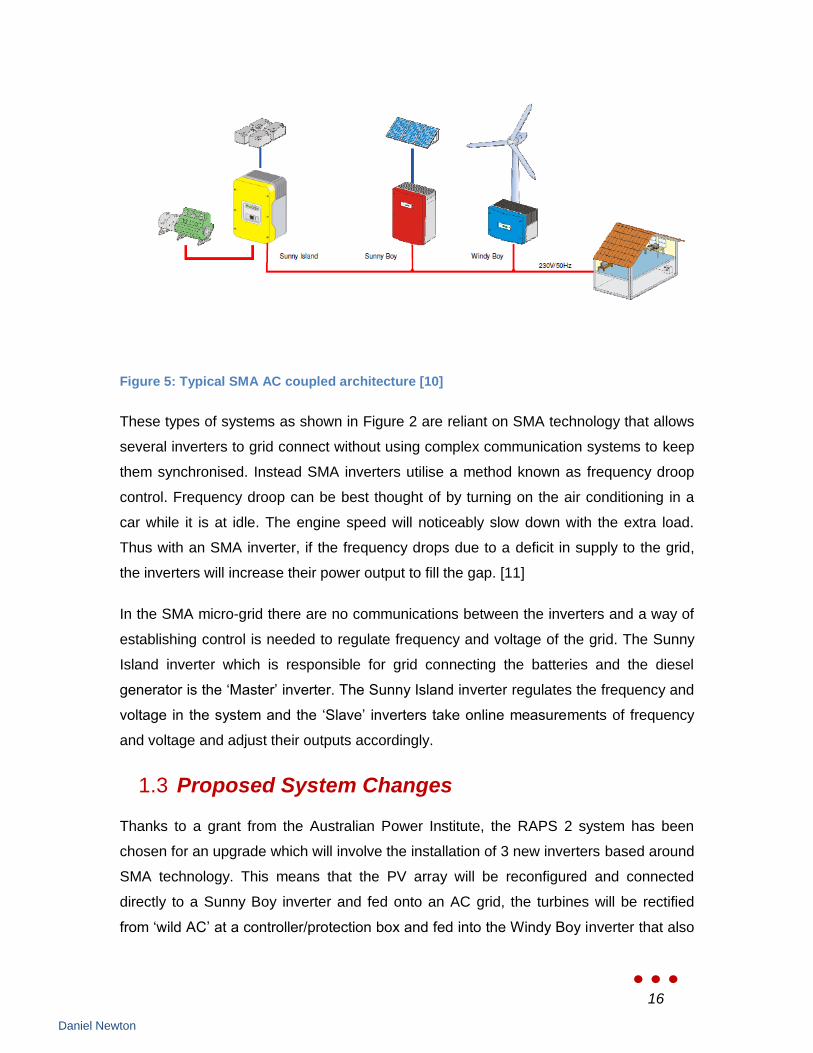
Figure 5: Typical SMA AC coupled architecture [10]
These types of systems as shown in Figure 2 are reliant on SMA technology that allows
several inverters to grid connect without using complex communication systems to keep
them synchronised. Instead SMA inverters utilise a method known as frequency droop
control. Frequency droop can be best thought of by turning on the air conditioning in a
car while it is at idle. The engine speed will noticeably slow down with the extra load.
Thus with an SMA inverter, if the frequency drops due to a deficit in supply to the grid,
the inverters will increase their power output to fill the gap. [11]
In the SMA micro-grid there are no communications between the inverters and a way of
establishing control is needed to regulate frequency and voltage of the grid. The Sunny
Island inverter which is responsible for grid connecting the batteries and the diesel
generator is the „Master‟ inverter. The Sunny Island inverter regulates the frequency and
voltage in the system and the „Slave‟ inverters take online measurements of frequency
and voltage and adjust their outputs accordingly.
1.3 Proposed System Changes
Thanks to a grant from the Australian Power Institute, the RAPS 2 system has been
chosen for an upgrade which will involve the installation of 3 new inverters based around
SMA technology. This means that the PV array will be reconfigured and connected
directly to a Sunny Boy inverter and fed onto an AC grid, the turbines will be rectified
from „wild AC‟ at a controller/protection box and fed into the Windy Boy inverter that also

17
Daniel Newton
feeds into the AC grid. Finally a new diesel generator, coupled with the existing battery
bank will connect to the Sunny Island inverter. [12]
As the RAPS 2 system is intended to be a teaching aid, there is a requirement to monitor
and measure certain aspects of the system, such that students and, indeed anybody can
view the voltages and currents instantaneously in the system. The main goal of this
particular project is to implement and commission a system that will measure and record
the specific voltages and currents at every point in the new system that are subject to
change. This is to provide latitude in a of experiments that can be set up, looking at the
interactions and relationships between the equipment that makes up the power supply.
The equipment used to implement this are products from National Instruments data
acquisition catalogue and NI‟s LabVIEW architecture.
The inverters to be utilised in Murdoch University‟s RAPS 2 system, are a Sunny Boy
SB1100, Windy Boy WB1700 and a Sunny Island SI5048. The Sunny Boy inverter is
designed for DC input between the ranges of 139V-400V and has facilities for RS485
network connections to other grid connect inverters or SMA data acquisition devices.
[13] The SB1100 is sized for small power requirements that use a novel power source
and educational purposes for solar set ups, with power ratings up to 1kW. The
photovoltaic array (PV array) is to be reconfigured from an input voltage of 48V to a
higher voltage that will be specified by contractor Solar Matrix, who have the necessary
experience in setting up PV arrays. (See Appendices 1, 2 & 3)
The inverter for the wind turbines is in actual fact a Sunny Boy SB1700 that has been
configured for use with wind turbines. The upgraded RAPS 2 system will have 2 wind
turbines; one of the turbines is a Ginlong Show 15A. It is a 5 bladed 1.55kW turbine that
connects to a Ginlong protection box that rectifies the voltage for supply to the inverter
(See Appendix 4 for Show 15A technical data).
The other turbine is a Fortis Passaat 1.3kW turbine. It is a 3 bladed turbine that outputs
3 phase voltage at a nominal 350V. The Fortis turbine connects to a SMA Windy Boy
protection box that rectifies the voltage for connection to the inverter. (See Appendix 5
for Fortis Passaat 1.3kW technical data)
Both turbines are supplied with their own dump load resistors that bleed excess energy
generated to provide protection to the inverter. However at any one time, only one of the
turbines will be connected to the inverter. The wind turbine controller modules are
18
Daniel Newton
connected to the dump load resistors and bleed excess power supplied by the wind
turbines through the resistors.
The Sunny Island inverter is rated to 5kW and as such connects to the battery bank
which is specified at a total rated capacity of 1080Ah at the C100 rate. The battery bank
has been designed for 3 days storage (based on the summer load of 9.6kWh/day) and a
60% maximum depth of discharge. (See Appendix 6)
The principal scope of this thesis is to facilitate the progression of the RAPS 2 project.
The basis of the project has previously been specified and some work had already been
taken in moving it forward. The initial aim for this project was to get the new RAPS
system commissioned and running before the end of semester 2. There is however,
always an opportunity for the project to be expanded upon in the future. The tasks to be
completed included the conception of a measurement system that accurately records
parameters within the system and make them safe so that students can record the
signals using oscilloscopes. The thesis outline also describes an approach that ensured
the project moved forward.
This included organising meetings to facilitate the project moving forward, specifying and
procuring the hardware required to implement the system, writing a user interface, and
helping to facilitate the works to be carried out in reconfiguring the RAPS 2 system.
The report that follows includes the steps taken in a project management aspect to help
the RAPS 2 project reach fruition, as well as specifying the measurement system design
and the LabVIEW program that forms the user interface.

19
Daniel Newton
2. Project Management
When the thesis project was first undertaken, there was to be a project management
aspect involved in the work to help the project on its way.
It soon became apparent that at the current stage of the project there was a large
amount of work to be done to get to the stage of writing a program and commissioning a
measurement system.
This section of the report shall document the tasks and steps undertaken to ensure that
there the progression of the project maintained forward momentum.
2.1 Procurement of Equipment
From the work undertaken previously by student Luca Castelli in early 2010, the
reconfiguration of the RAPS 2 system has been specified, namely the inverter hardware
and the general scope of works needed to be completed for the RAPS 2 upgrade. Luca
has also specified the points in the system to be measured and revisited the method in
which the previous measurements were taken. [12]
To move on from this, a list of points that were to be measured was devised along with
the expected voltages and currents. At this point it was known what the measurement
system would be designed to do and so research into the types of equipment available
could take place so that orders could be placed and good received in a timely manner.
Quotes were requested for the hardware, consisting of data acquisition devices, isolating
equipment and a replacement PC that would host the data from several vendors
including; National Instruments, Scientific Devices Pty Ltd, and Dell computers.
It was decided that some of the following components would be ordered first, as there
was little indication of the lead times involved in supplying these products, namely the
data acquisition devices, the isolating amplifiers and backplanes and a replacement PC
for the data acquisition system to connect to. Several requisition orders were prepared
and the orders placed to the vendors.
Preparation of the requisition orders brought to attention common project specification
problems such as providing flexibility if the scope of the project is to change, and the

20
Daniel Newton
associated need to cater for the requirements and engender a proactive approach by
taking into account any issues that could be raised in the future. This included ensuring
that there were enough isolation amplifiers, as well as available channels on the
backplane and also looking at the number of spare channels available on the data
acquisition modules. Fortuitously, due to the speed of variable sampling required, there
happened to be plenty of spare channels available on the data acquisition modules to
negate any accidental damage to channels and amplifiers that may occur.
The items that have been procured include:
National Instruments cDAQ-9174, 4 slot chassis,
National Instruments cDAQ-9205 Voltage input module,
Dataforth SCMBP01 non-multiplexed backplane,
A combined total of 34 Dataforth SCM5B40/41-03 wideband isolated
voltage and millivoltage input modules.
Standard Dell PC as supplied to Murdoch University.
Resistors and current shunts for appropriate scaling of the voltages and
currents.
Further information on the equipment selected and the reasoning behind the decision is
given in section 3.
2.2 Initiating Contact with Contractors
The nature of the work to be carried out meant that it needed to be outsourced to
contractors outside the employ of Murdoch University. This is because of the level of
manpower freely available was not sufficient for the work to go ahead, and from a need
to have adequately experienced individuals capable of the project.
Solar Matrix Pty Ltd. was the contractor recommended for the task by the inverter
company, SMA. As such, a meeting was set up with David Feeney from Solar Matrix to
discuss the nature of work to be done. Before the meeting could take place, however,
the tasks that needed to be completed necessitated their allocation either as work the
University would undertake, or as tasks that would be outsourced.
21
Daniel Newton
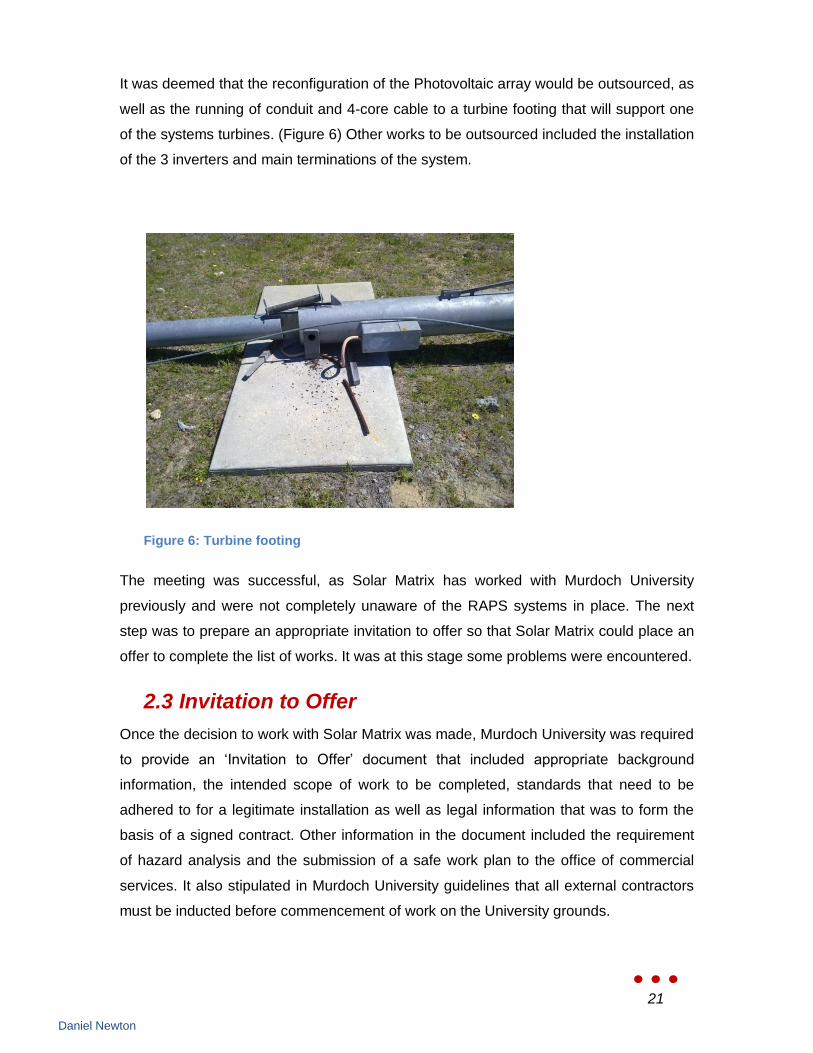
It was deemed that the reconfiguration of the Photovoltaic array would be outsourced, as
well as the running of conduit and 4-core cable to a turbine footing that will support one
of the systems turbines. (Figure 6) Other works to be outsourced included the installation
of the 3 inverters and main terminations of the system.
Figure 6: Turbine footing
The meeting was successful, as Solar Matrix has worked with Murdoch University
previously and were not completely unaware of the RAPS systems in place. The next
step was to prepare an appropriate invitation to offer so that Solar Matrix could place an
offer to complete the list of works. It was at this stage some problems were encountered.
2.3 Invitation to Offer
Once the decision to work with Solar Matrix was made, Murdoch University was required
to provide an „Invitation to Offer‟ document that included appropriate background
information, the intended scope of work to be completed, standards that need to be
adhered to for a legitimate installation as well as legal information that was to form the
basis of a signed contract. Other information in the document included the requirement
of hazard analysis and the submission of a safe work plan to the office of commercial
services. It also stipulated in Murdoch University guidelines that all external contractors
must be inducted before commencement of work on the University grounds.

22
Daniel Newton
The scope of work to be completed has been alluded to previously and the complete
scope of the work up for offer has been taken directly from the Invitation to Offer
document. The document in Appendix 7 is a modified version of the Invitation to Offer
prepared for the PV installation on the North roof of Murdoch University‟s library. [14, 15]
(Also see Appendix 7 in electronic copy.)
Because of the type of work being outsourced it was imperative that all matters
concerning the required standards and terms of the impending contract were correct and
free of any discrepancies. To this end, the document was based upon a template initially
prepared by the Office of Commercial Services and was worked on extensively by a
number of people before being given to Solar Matrix. Suffice to say the effort paid off
and the modified document is itself being used as a template by other people within
Murdoch University for similar projects where work is being outsourced.
Solar Matrix placed an offer, which was subsequently accepted and have started putting
their resources into the project. It is expected that work on the University grounds will
commence within a week or two of submission of this report.
23
Daniel Newton
3. The Measurement System
3.1 Rationale
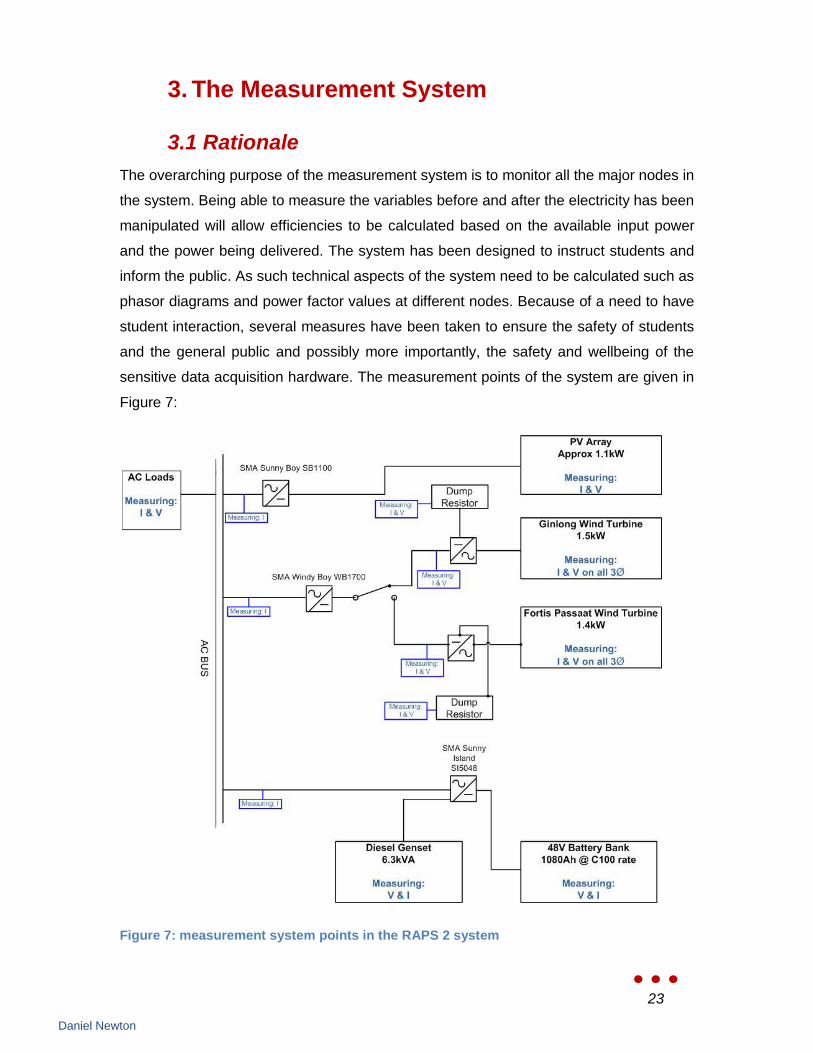
The overarching purpose of the measurement system is to monitor all the major nodes in
the system. Being able to measure the variables before and after the electricity has been
manipulated will allow efficiencies to be calculated based on the available input power
and the power being delivered. The system has been designed to instruct students and
inform the public. As such technical aspects of the system need to be calculated such as
phasor diagrams and power factor values at different nodes. Because of a need to have
student interaction, several measures have been taken to ensure the safety of students
and the general public and possibly more importantly, the safety and wellbeing of the
sensitive data acquisition hardware. The measurement points of the system are given in
Figure 7:
Figure 7: measurement system points in the RAPS 2 system

24
Daniel Newton
Above, Figure 7 shows the measurements that are taken. This gives a detailed picture of
what each particular element is doing in the system. Conversion efficiencies are
calculated from the power flows before and after the devices. The devices include the
Windy-Boy Protection Box, the Ginlong turbine controller and the 3 inverters associated
with the system.
The Windy Boy Protection Box acts to rectify the 3-Phase voltage coming from the Fortis
Passaat wind turbine and divert excess energy into a dump load element, which
dissipates the energy as heat. The output of the protection box is a rectified DC current
that feeds directly into the Windy Boy Inverter. The Ginlong turbine controller has the
same function as the windy boy protection box.
The way the system is set up, only one of the turbines will be able to connect to the
inverter at any one time. It was also decided that the turbines will not be swapped very
often, and thus a manual terminations switching method is acceptable. A lockable box
will be supplied by Solar Matrix to restrict access to the switching terminals. The turbines
will be swapped by qualified staff following a safe working procedure to ensure the
controller outputs are de-energised when the swap takes place. It is envisaged that
although only one of the turbines will be connected to the AC bus, the secondary turbine
will be allowed to spin freely, so that the energy flowing through the dump resistor can
be monitored. Alternatively, the unused turbine can have the terminals short circuited to
act as a brake to prevent the turbine from spinning (This information will provide
information as to which turbine is more efficient under different conditions).
The three inverters are the Sunny Boy, Windy Boy and Sunny Island. These 3 inverters
do not communicate with each other; as such the Sunny Island inverter is the „Master
inverter,‟ setting the voltage output and voltage frequency so that the other inverters can
take online measurements and follow suit. The Sunny Island controls the power flow in
the system by changing the voltage frequency on the grid.
The method in which the power usage is monitored from each element will allow the
calculation of the proportion of energy versus the cost associated with each method of
renewable energy, as well as being able to cost out the supply of energy for a household
use. Monitoring the parameters within the RAPS 2 system allows students and the public

25
Daniel Newton
to see which elements provide greater proportions of energy in different prevailing
weather conditions.
3.2 National Instruments Hardware
National Instruments was founded in Texas in 1976 and since then has been
manufacturing products to help design, measure, test and control in a diverse range of
industries. In the present day National Instruments allows fast and easy development of
systems using their own open graphical programming language and provide support for
the large range of industries utilising NI equipment. [16]
National Instruments was chosen as the vendor of choice because of familiarisation with
NI products and the graphical programming environment, LabVIEW. LabVIEW allows
quick and easy programming for a range of different measurement and control tasks and
Murdoch University students are familiarised with the programming environment from
their 2nd year onward of study and is the program of choice for datalogging in Laboratory
environments for both the Industrial Computing Systems and Instrumentation and
Control Engineering majors.
As specified in Luca Castelli‟s thesis paper, it was determined that for accurate trending
and displaying, a sample rate of at least 100 samples per cycle was required. At 50Hz
and 100 samples/period the required sample rate for each measurement was 5kS/s
(kilosamples/second). This high sample rate means that for 31 channels, a combined
sample rate of 155kS/s is required. [12]
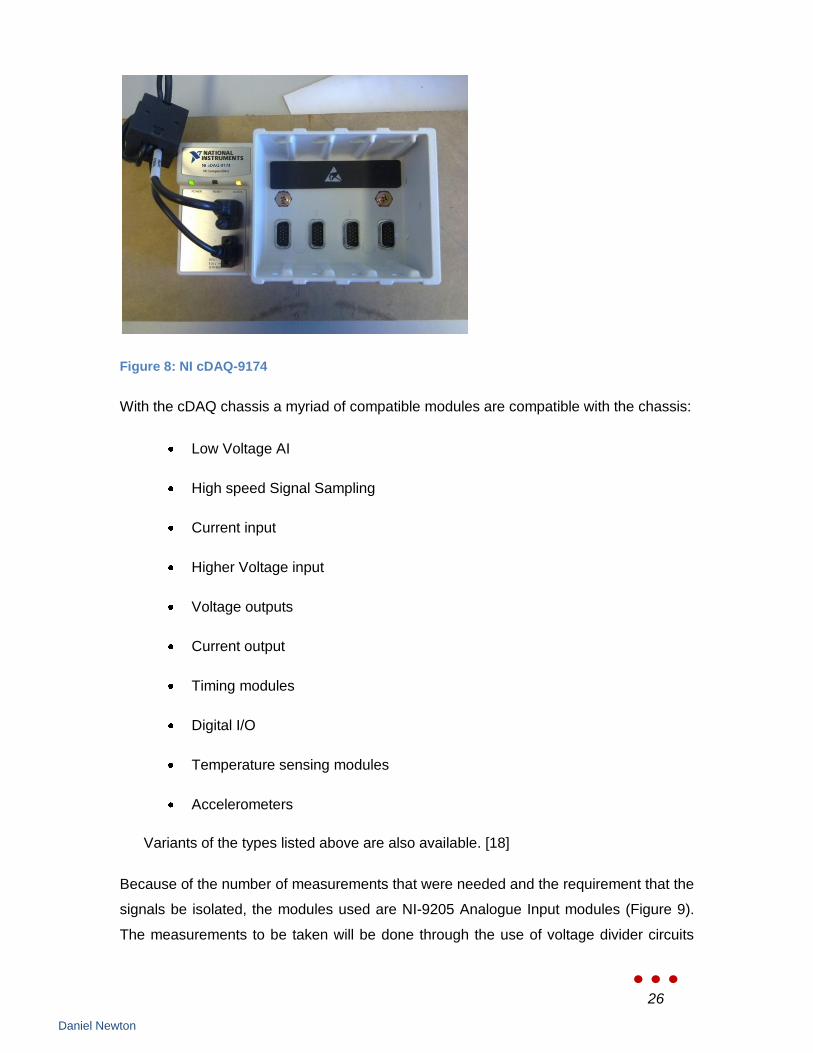
National Instruments compact DAQ devices offer several solutions for this problem. One
such solution is the cDAQ – 9174 chassis (Figure 8). It is a 4 slot chassis that connects
to a PC via USB cable for measurement and control purposes. Because the cDAQ is
compatible with USB2.0 a range of up to 5 metres is possible from the PC. There is also
a similar device that connects to a network via Ethernet and has its own MAC address,
this device can allow for „true‟ Remote IO and can handle much higher transmission
volumes depending on the need and there is also a wireless version available. [17] For
the relatively low amounts of data being monitored, it was determined that the USB
enabled chassis was suitable for the RAPS 2 monitoring system.
26
Daniel Newton
Figure 8: NI cDAQ-9174
With the cDAQ chassis a myriad of compatible modules are compatible with the chassis:
Low Voltage AI
High speed Signal Sampling
Current input
Higher Voltage input
Voltage outputs
Current output
Timing modules
Digital I/O
Temperature sensing modules
Accelerometers
Variants of the types listed above are also available. [18]
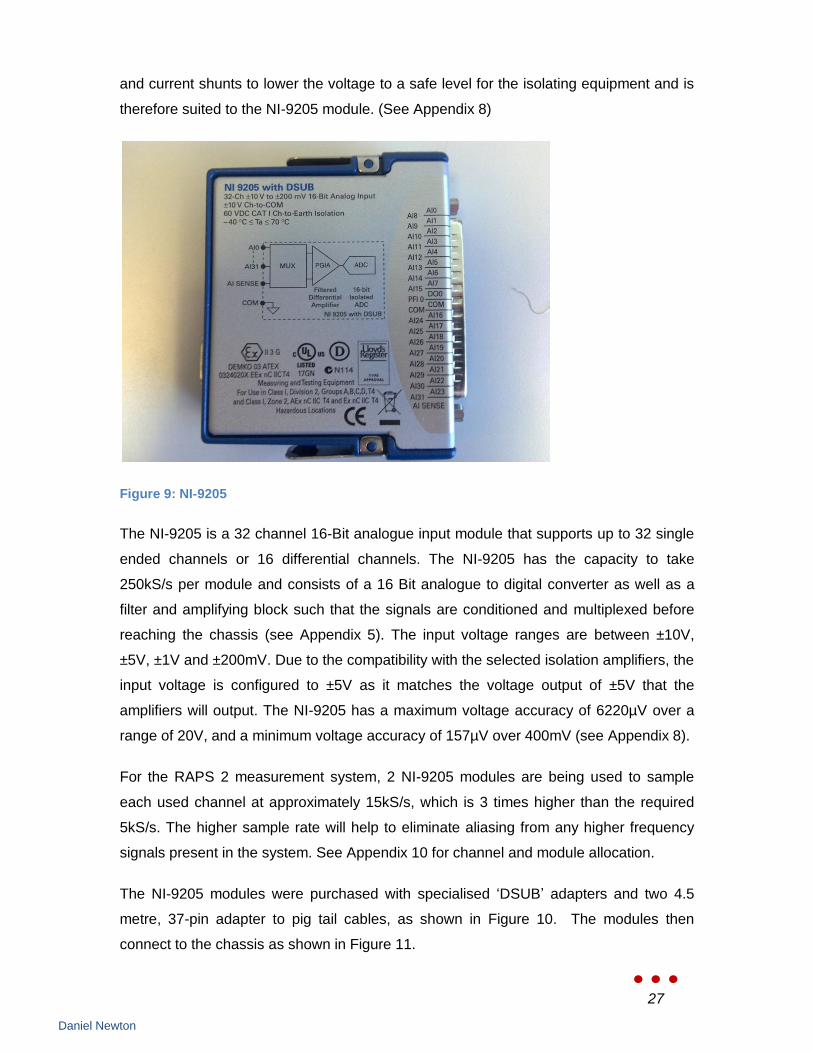
Because of the number of measurements that were needed and the requirement that the
signals be isolated, the modules used are NI-9205 Analogue Input modules (Figure 9).
The measurements to be taken will be done through the use of voltage divider circuits
27
Daniel Newton
and current shunts to lower the voltage to a safe level for the isolating equipment and is
therefore suited to the NI-9205 module. (See Appendix 8)
Figure 9: NI-9205
The NI-9205 is a 32 channel 16-Bit analogue input module that supports up to 32 single
ended channels or 16 differential channels. The NI-9205 has the capacity to take
250kS/s per module and consists of a 16 Bit analogue to digital converter as well as a
filter and amplifying block such that the signals are conditioned and multiplexed before
reaching the chassis (see Appendix 5). The input voltage ranges are between ±10V,
±5V, ±1V and ±200mV. Due to the compatibility with the selected isolation amplifiers, the
input voltage is configured to ±5V as it matches the voltage output of ±5V that the
amplifiers will output. The NI-9205 has a maximum voltage accuracy of 6220µV over a
range of 20V, and a minimum voltage accuracy of 157µV over 400mV (see Appendix 8).
For the RAPS 2 measurement system, 2 NI-9205 modules are being used to sample
each used channel at approximately 15kS/s, which is 3 times higher than the required
5kS/s. The higher sample rate will help to eliminate aliasing from any higher frequency
signals present in the system. See Appendix 10 for channel and module allocation.
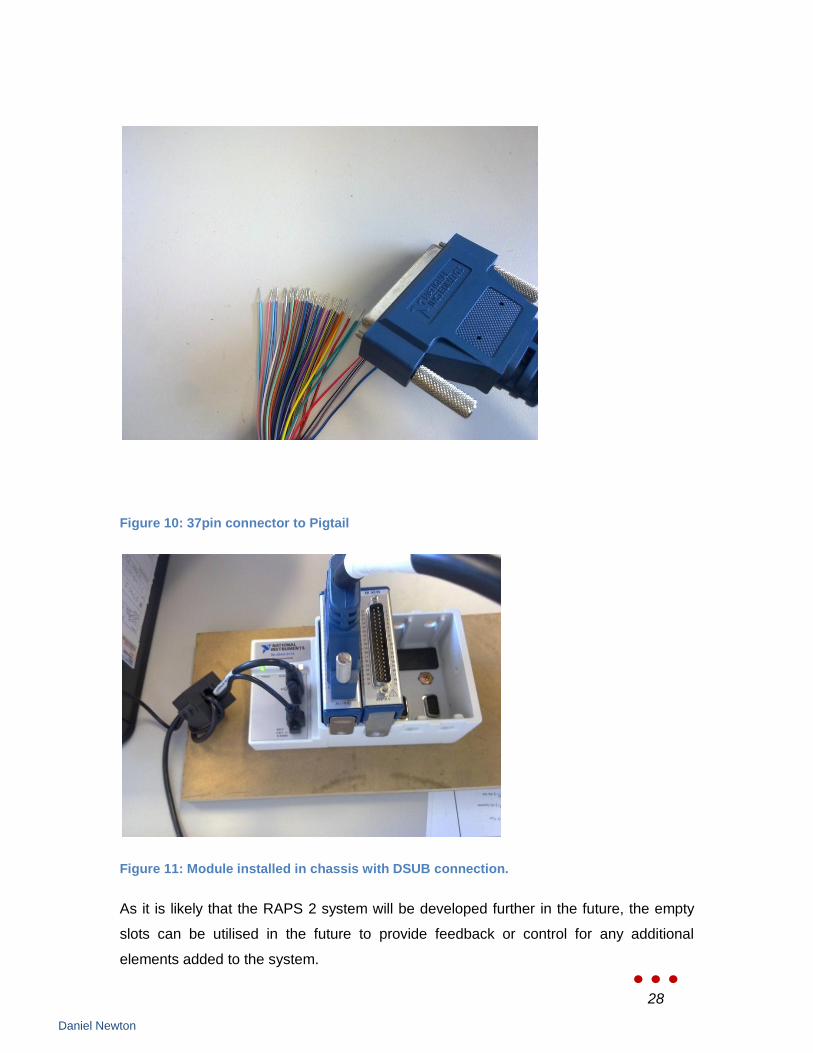
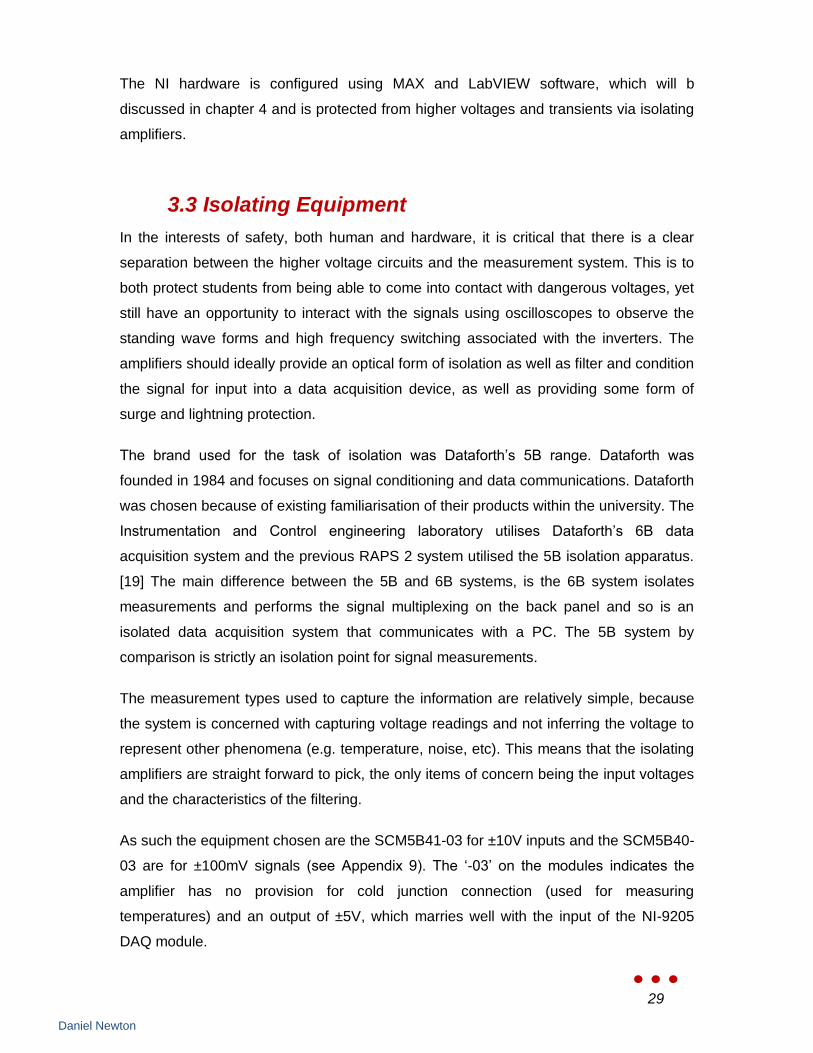
The NI-9205 modules were purchased with specialised „DSUB‟ adapters and two 4.5
metre, 37-pin adapter to pig tail cables, as shown in Figure 10. The modules then
connect to the chassis as shown in Figure 11.
28
Daniel Newton
Figure 10: 37pin connector to Pigtail
Figure 11: Module installed in chassis with DSUB connection.
As it is likely that the RAPS 2 system will be developed further in the future, the empty
slots can be utilised in the future to provide feedback or control for any additional
elements added to the system.
29
Daniel Newton
The NI hardware is configured using MAX and LabVIEW software, which will b
discussed in chapter 4 and is protected from higher voltages and transients via isolating
amplifiers.
3.3 Isolating Equipment
In the interests of safety, both human and hardware, it is critical that there is a clear
separation between the higher voltage circuits and the measurement system. This is to
both protect students from being able to come into contact with dangerous voltages, yet
still have an opportunity to interact with the signals using oscilloscopes to observe the
standing wave forms and high frequency switching associated with the inverters. The
amplifiers should ideally provide an optical form of isolation as well as filter and condition
the signal for input into a data acquisition device, as well as providing some form of
surge and lightning protection.
The brand used for the task of isolation was Dataforth‟s 5B range. Dataforth was
founded in 1984 and focuses on signal conditioning and data communications. Dataforth
was chosen because of existing familiarisation of their products within the university. The
Instrumentation and Control engineering laboratory utilises Dataforth‟s 6B data
acquisition system and the previous RAPS 2 system utilised the 5B isolation apparatus.
[19] The main difference between the 5B and 6B systems, is the 6B system isolates
measurements and performs the signal multiplexing on the back panel and so is an
isolated data acquisition system that communicates with a PC. The 5B system by
comparison is strictly an isolation point for signal measurements.
The measurement types used to capture the information are relatively simple, because
the system is concerned with capturing voltage readings and not inferring the voltage to
represent other phenomena (e.g. temperature, noise, etc). This means that the isolating
amplifiers are straight forward to pick, the only items of concern being the input voltages
and the characteristics of the filtering.
As such the equipment chosen are the SCM5B41-03 for ±10V inputs and the SCM5B40-
03 are for ±100mV signals (see Appendix 9). The „-03‟ on the modules indicates the
amplifier has no provision for cold junction connection (used for measuring
temperatures) and an output of ±5V, which marries well with the input of the NI-9205
DAQ module.

30
Daniel Newton
The isolator works by taking a differential voltage signal and passing it through a signal
conditioner before isolating the data acquisition hardware from the field instrument side.
The conditioned signal is then referenced to an I/O common on the acquisition side of
the measuring device.
Figure 12: Isolation Amplifier diagram [20]
The isolators have 3- way transformer isolation, meaning the field side of the
measurement is isolated from both the computer side and the isolators own power
supply.
The Backplane used to house the isolators is a SCMPB01 (shown, Figure 13). It is a 16
channel back plane that has provision that will mount the 5B signal conditioners and
isolators.
The backplane has provisions for a cold junction connection in the event that
temperature measurements are taken.

31
Daniel Newton
Figure 13: Isolation Amplifier Backplane
The devices are continuous in the way in which they work and do not multiplex any of
the channels.
The output of the backplane is up to 16 isolated voltage channels that are referenced to
the IO common continuously available. This lack of analog to digital conversion within
the isolators means that there is a better signal being measured by the data acquisition
hardware that will reduce chances of aliasing.
The SCMPB01 operates from a separate 5V power supply.
The isolation components work together by plugging the signal isolator bricks into an
available slot and placing the input into the terminal screw blocks on the adjacent left of
the backplane. The isolated signal is then accessible via the 26-pin male connections at
the base of the backplane.
Due to the number of measurements being taken, 2 backplanes have been acquired,
one will house only the SCM5B40-03 mV modules for current measurements, and the
other backplane will be housing all the SCM5B41-03 Voltage modules for taking voltage
readings and one of the current measurement modules. The second backplane will also
have 1 spare slot.
The 26-pin connection mates with the appropriate ribbon cables and terminal ending that
will form the node to meet the data acquisition input. This node is to be broken into 3
parts, the signal isolator output, data acquisition devices input, and a connection terminal
for BNC plugs, such that oscilloscopes can be connected to view the isolated signal.
This point in the system represents the most risk to the measurement hardware, as it is
the point where students and indeed anybody can physically interact with the system.
32
Daniel Newton
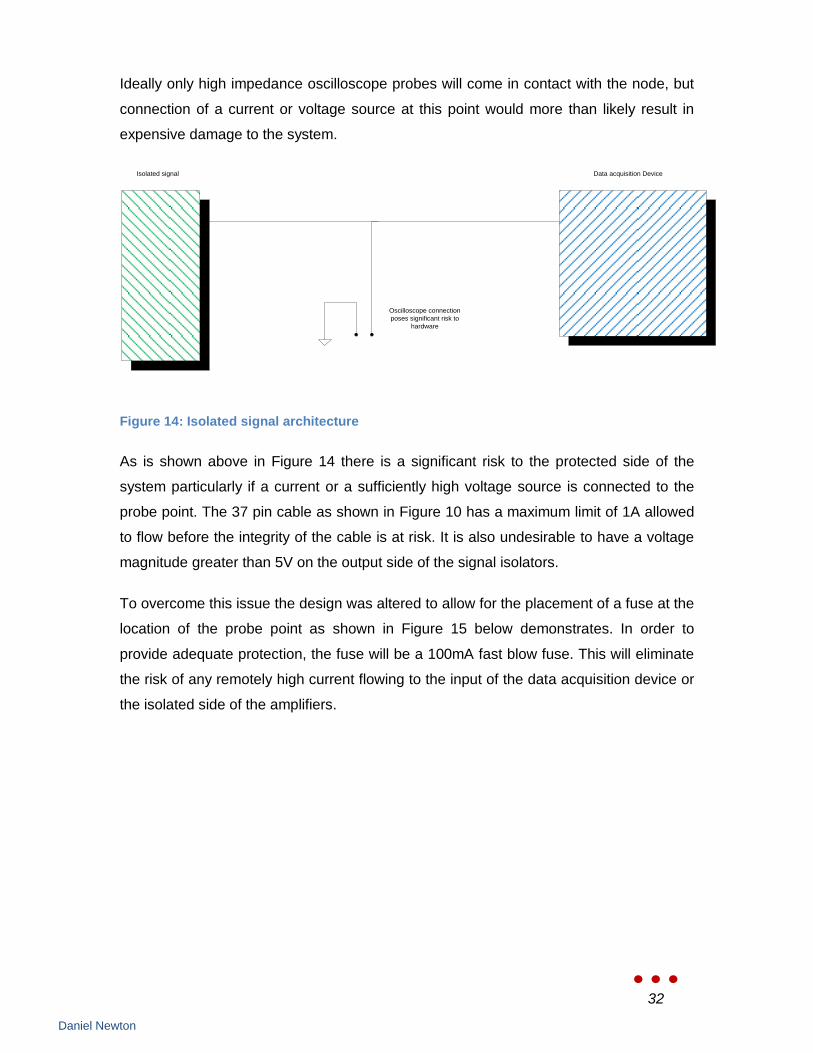
Ideally only high impedance oscilloscope probes will come in contact with the node, but
connection of a current or voltage source at this point would more than likely result in
expensive damage to the system.
Data acquisition DeviceIsolated signal
Oscilloscope connection
poses significant risk to
hardware
Figure 14: Isolated signal architecture
As is shown above in Figure 14 there is a significant risk to the protected side of the
system particularly if a current or a sufficiently high voltage source is connected to the
probe point. The 37 pin cable as shown in Figure 10 has a maximum limit of 1A allowed
to flow before the integrity of the cable is at risk. It is also undesirable to have a voltage
magnitude greater than 5V on the output side of the signal isolators.
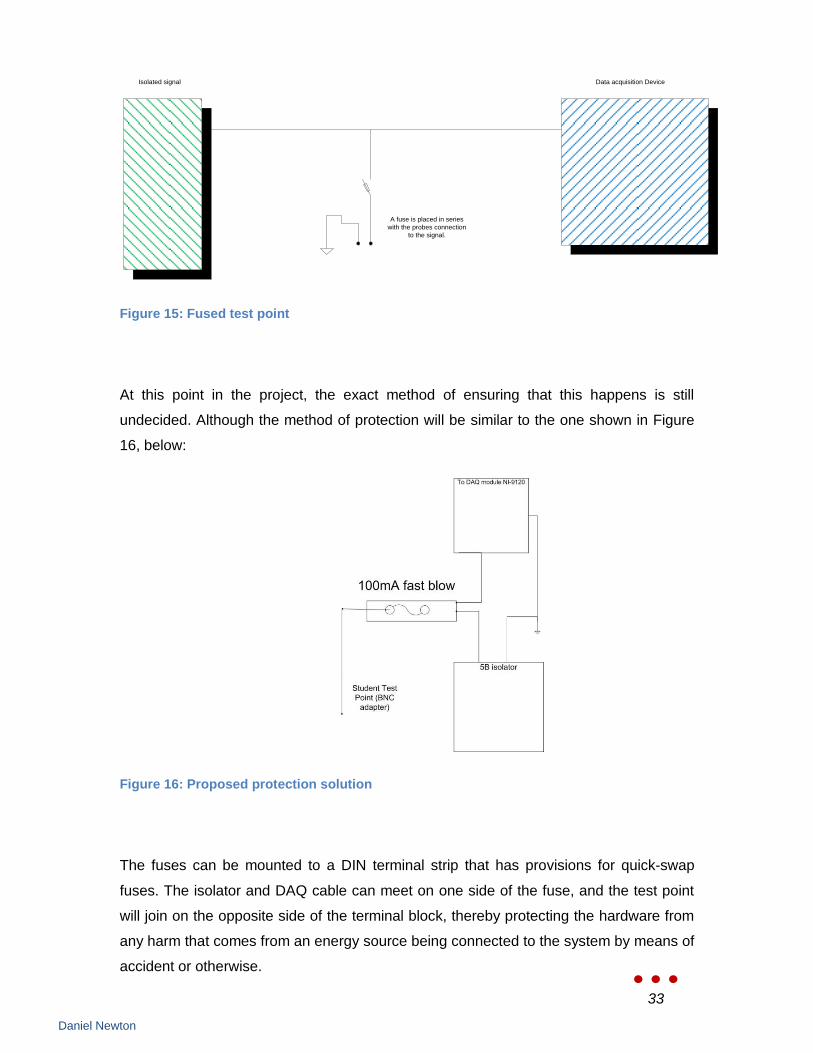
To overcome this issue the design was altered to allow for the placement of a fuse at the
location of the probe point as shown in Figure 15 below demonstrates. In order to
provide adequate protection, the fuse will be a 100mA fast blow fuse. This will eliminate
the risk of any remotely high current flowing to the input of the data acquisition device or
the isolated side of the amplifiers.
33
Daniel Newton
Figure 15: Fused test point
At this point in the project, the exact method of ensuring that this happens is still
undecided. Although the method of protection will be similar to the one shown in Figure
16, below:
Figure 16: Proposed protection solution
The fuses can be mounted to a DIN terminal strip that has provisions for quick-swap
fuses. The isolator and DAQ cable can meet on one side of the fuse, and the test point
will join on the opposite side of the terminal block, thereby protecting the hardware from
any harm that comes from an energy source being connected to the system by means of
accident or otherwise.
Data acquisition DeviceIsolated signal
A fuse is placed in series
with the probes connection
to the signal.

34
Daniel Newton
3.4 Current Shunt
A current shunt is a device that allows current measurement of powered circuits, without
inhibiting the operation of the circuit. In essence it is a very small valued resistor that has
a known voltage difference across it when a particular current flows. Typically a current
shunt is a flat copper strip similar to the one in Figure 17 below:
Figure 17: A typical current shunt. [21]
Using Ohm‟s Law it is simple to calculate the current flowing via the voltage difference
across it.
Ohm‟s Law can be expressed as:
Where:V is the voltage difference expressed in volts
I is the current expressed in amperes
R is the resistance of the shunt, measured in ohms
The shunts are specified at 150% of the maximum expected capacity to reduce the
likelihood that the conductor will deform in the event current exceeds the operational
maximum. Once a shunt deforms due to high temperature the electrical properties will
change and the calibration will no longer be valid.

35
Daniel Newton
The measurement system uses 17 current measurements and so 17 current shunts will
be used. A large disadvantage is the large amount of space taken up by the current
shunts will take up. Yet this is still the simplest method of measuring current flow for both
AC and DC measurements while remaining cheap to do so.
A typical calculation is shown as follows to calculate for the Sunny Island inverter output,
where:
V = 240V
P = 5.048kW
I=?
Specifying the shunt also involves giving a desirable millivolt drop across the shunt.
Since the isolation amplifiers for the current input have an input range of ±100mV, it
follows that the current shunts should be specified to have a calibrated 100mV drop at
the maximum current.
The power leakage from the previous example is then calculated as the product of the
rated current and the desired voltage drop of 100mV.
Since the Sunny Island inverter is one of the largest current draw bar the diesel
generator and the aggregate of all the inverted currents, it can be assumed that the
figure calculated is in the higher end of the power losses.

36
Daniel Newton
3.5 Voltage Division Theory
In order to condition the voltage signal for input to the data acquisition system, it is
important to reduce the voltages to a safe level. Voltage division is a way of
appropriately scaling down the voltage so that the isolating amplifier input is not at risk to
potentially harmful levels. By knowing the scaling factor used by the ratio of the resistors
it is possible to calculate the actual voltages. The relationship used will be based on
voltage division from the circuit shown in Figure 18.
Figure 18: A simple Voltage divider circuit
In the case for the measurement system, it is known that V2 should not exceed a
magnitude of 10Vpeak.
Using the following mathematical relationship, Kirchhoff‟s Voltage Law:

37
Daniel Newton
[22]
Since Vcc can be assumed to be the maximum voltage produced at a given node, and
R1 and R3 can be preselected to reduce current leakage to ground, R2 can be
calculated such that the maximum value of V2 is equal to 10V.
R1 and R3 were selected to be 2.7MΩ. These are high in order to reduce the current
leakage to ground. In the case of the largest voltage of 1000V from the wind turbines
(see appendix 5). This gives a worst case scenario of (assuming R2 is a short circuit);
V= 1000V
R = 2.7MΩ
I = ?
This equates to a power loss of 0.18W, which in the scheme of the system is a minimal
energy loss. Multiplying this number by 14, for the number of voltage division
measurements equates to an approximate upper figure of 2.52W (From the relationship
“P = VI”) maximum foreseeable power loss from the voltage divider circuits
The total power loss due to the measurement system being the sum of power leakages
for both the shunts and divider circuits. As a measure of total system loss, the combined
capacity of the system, excluding the diesel generator is 7.85kW. A power loss of 2.52W
equates to a percentage loss of 0.0032% of the total capacity. While this is only an
estimate of the ceiling values of the voltage divider losses, it does show that losses are a
very small proportion of the total capacity.

38
Daniel Newton
Resistor types will be the typical 5% tolerance resistors, with resistor power ratings at
2W to account for any spike in the supply voltage. A 5% tolerance is an acceptable
rating as the ratio of the divider will be calculated during commissioning to accurately
work out the appropriate software scaling values.
3.6 Miscellaneous Measurements
Recycled from the previous RAPS 2 system are 2 pyronometers for quantifying the
strength of the sun. The 2 instruments are mounted such that 1 is vertically mounted,
pointing straight up, while the secondary pyronometer is mounted along the plane of the
solar panels.
Also recycled is a thermocouple probe used for monitoring thermal loading of the battery
banks. This will connect directly to the Sunny Island inverter for the internal control of the
battery charging circuit.
There are also facilities to measure wind speed that will be incorporated into the
measurement program.
39
Daniel Newton
4. LabVIEW Program
LabVIEW is a graphically based programming environment. It is used by scientists and
engineers for measurement and control applications across a range of industry in its
simple to use block programming method. The program follows that of a flowchart and in
Western contexts will typically follow a left to right sequence of events.
Writing a program in LabVIEW is done by firstly creating a user interface, called a Front
Panel, and then building the program behind the scenes in the block diagram. LabVIEW
is capable of running model based simulations, communicating with and setting up of
OPC servers, sharing variables and communicating via serial or Ethernet ports with
other computers. It is also capable of controlling real world hardware through use of
appropriate data acquisition and control modules. [23]
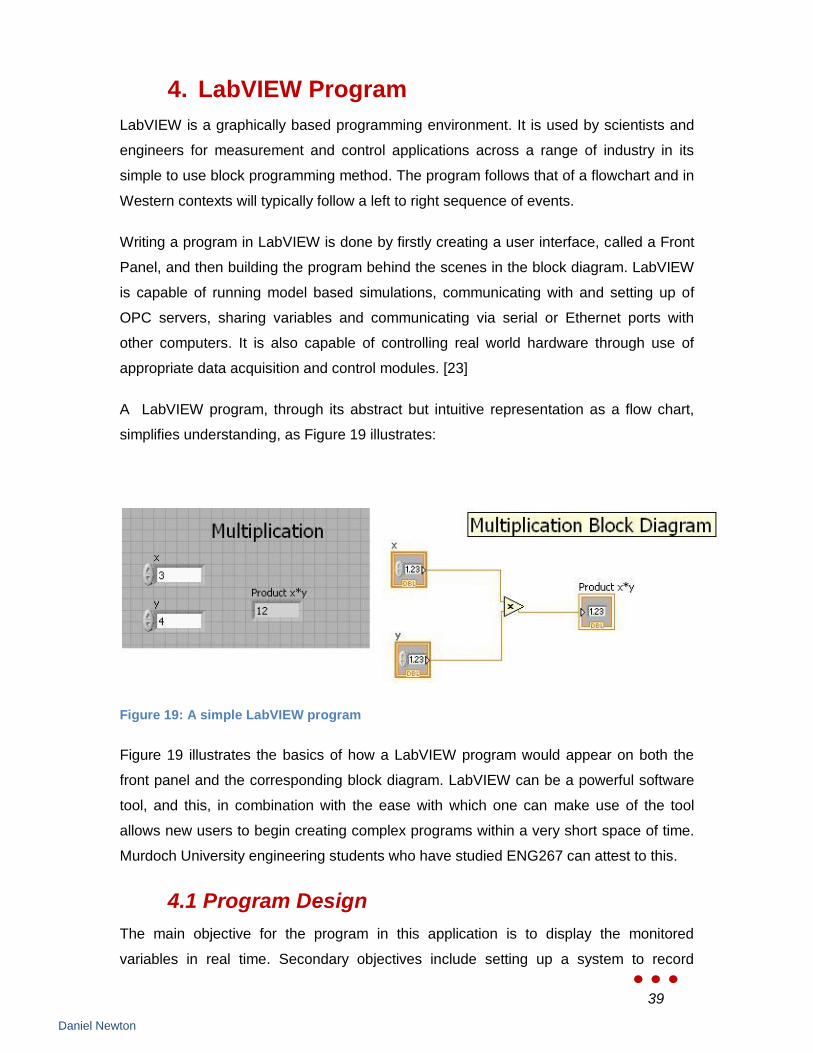
A LabVIEW program, through its abstract but intuitive representation as a flow chart,
simplifies understanding, as Figure 19 illustrates:
Figure 19: A simple LabVIEW program
Figure 19 illustrates the basics of how a LabVIEW program would appear on both the
front panel and the corresponding block diagram. LabVIEW can be a powerful software
tool, and this, in combination with the ease with which one can make use of the tool
allows new users to begin creating complex programs within a very short space of time.
Murdoch University engineering students who have studied ENG267 can attest to this.
4.1 Program Design
The main objective for the program in this application is to display the monitored
variables in real time. Secondary objectives include setting up a system to record
40
Daniel Newton
Islanding tests as per AS4777, the Australian standard for grid connection of energy
systems via inverters, and reading in data from the Sunny Sensorbox for display in the
LabVIEW program.
The design was made to be as simple as possible, with the display clear and easy to
read. Pictures of the actual devices being monitored were added to the program
interface, again to help reduce confusion.
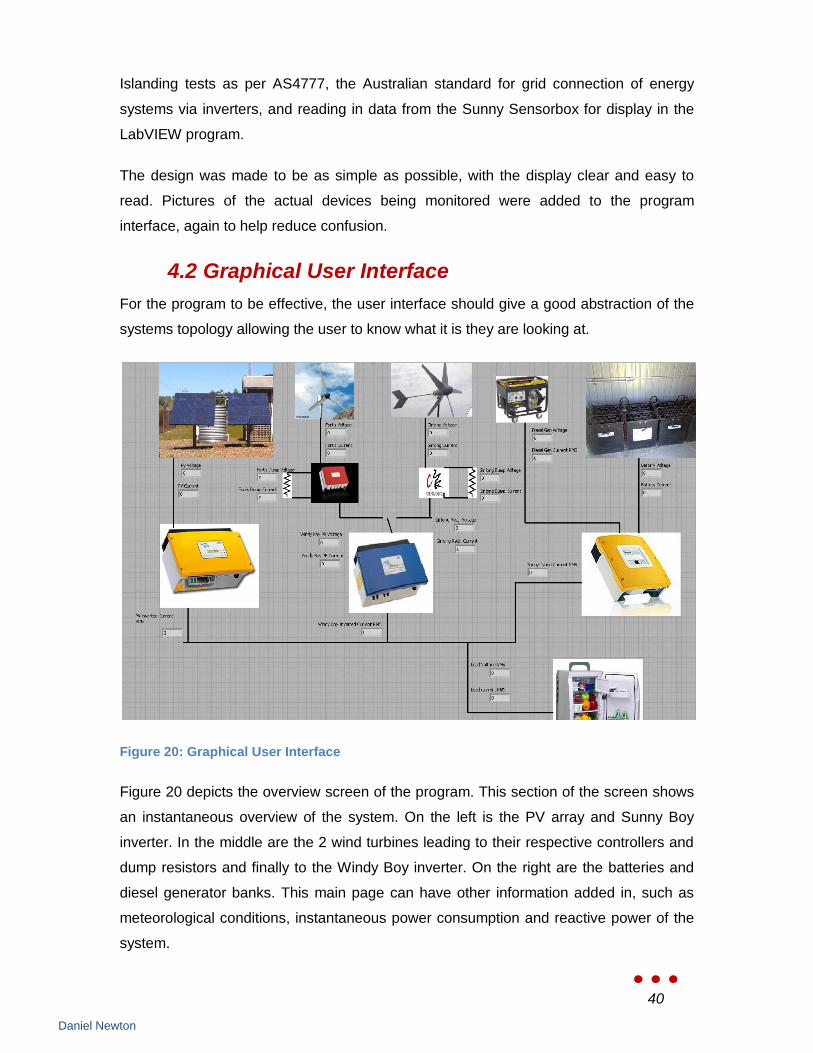
4.2 Graphical User Interface
For the program to be effective, the user interface should give a good abstraction of the
systems topology allowing the user to know what it is they are looking at.
Figure 20: Graphical User Interface
Figure 20 depicts the overview screen of the program. This section of the screen shows
an instantaneous overview of the system. On the left is the PV array and Sunny Boy
inverter. In the middle are the 2 wind turbines leading to their respective controllers and
dump resistors and finally to the Windy Boy inverter. On the right are the batteries and
diesel generator banks. This main page can have other information added in, such as
meteorological conditions, instantaneous power consumption and reactive power of the
system.
41
Daniel Newton
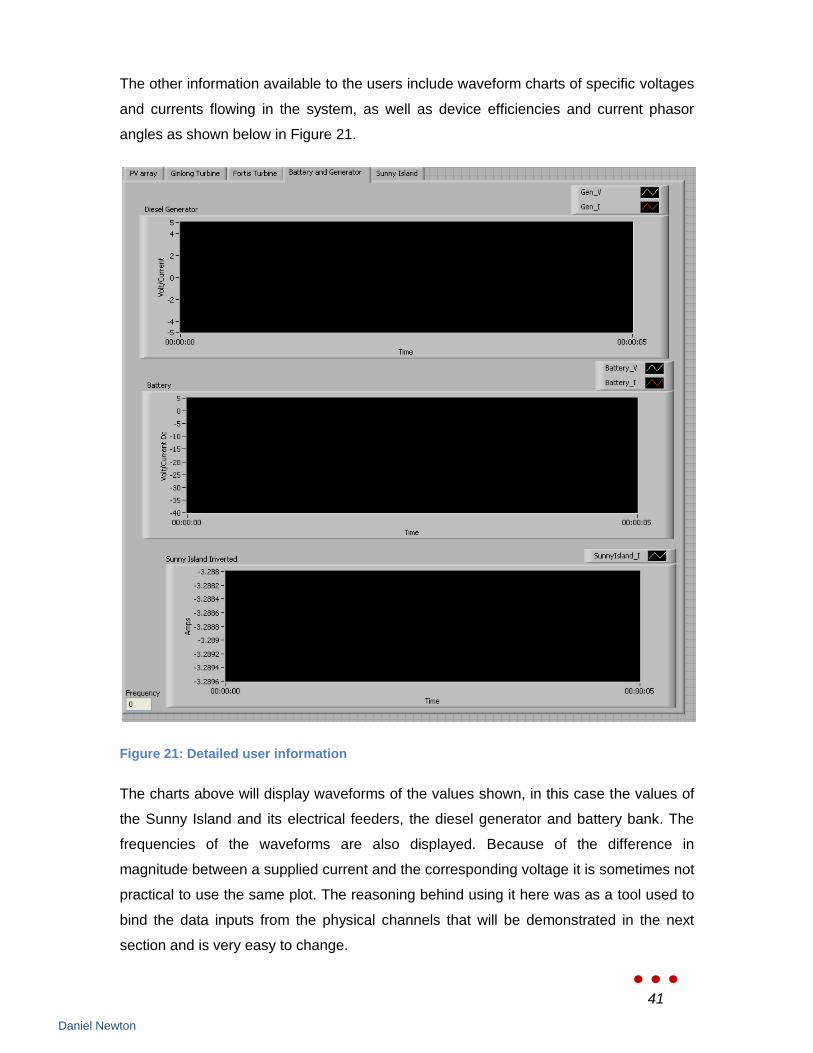
The other information available to the users include waveform charts of specific voltages
and currents flowing in the system, as well as device efficiencies and current phasor
angles as shown below in Figure 21.
Figure 21: Detailed user information
The charts above will display waveforms of the values shown, in this case the values of
the Sunny Island and its electrical feeders, the diesel generator and battery bank. The
frequencies of the waveforms are also displayed. Because of the difference in
magnitude between a supplied current and the corresponding voltage it is sometimes not
practical to use the same plot. The reasoning behind using it here was as a tool used to
bind the data inputs from the physical channels that will be demonstrated in the next
section and is very easy to change.
42
Daniel Newton
Once the project reaches the commissioning stage, the charts will be altered to better
represent what is happening in the system. As well as the numeric boxes will be set up
to represent RMS values where appropriate.
4.3 Program Architecture
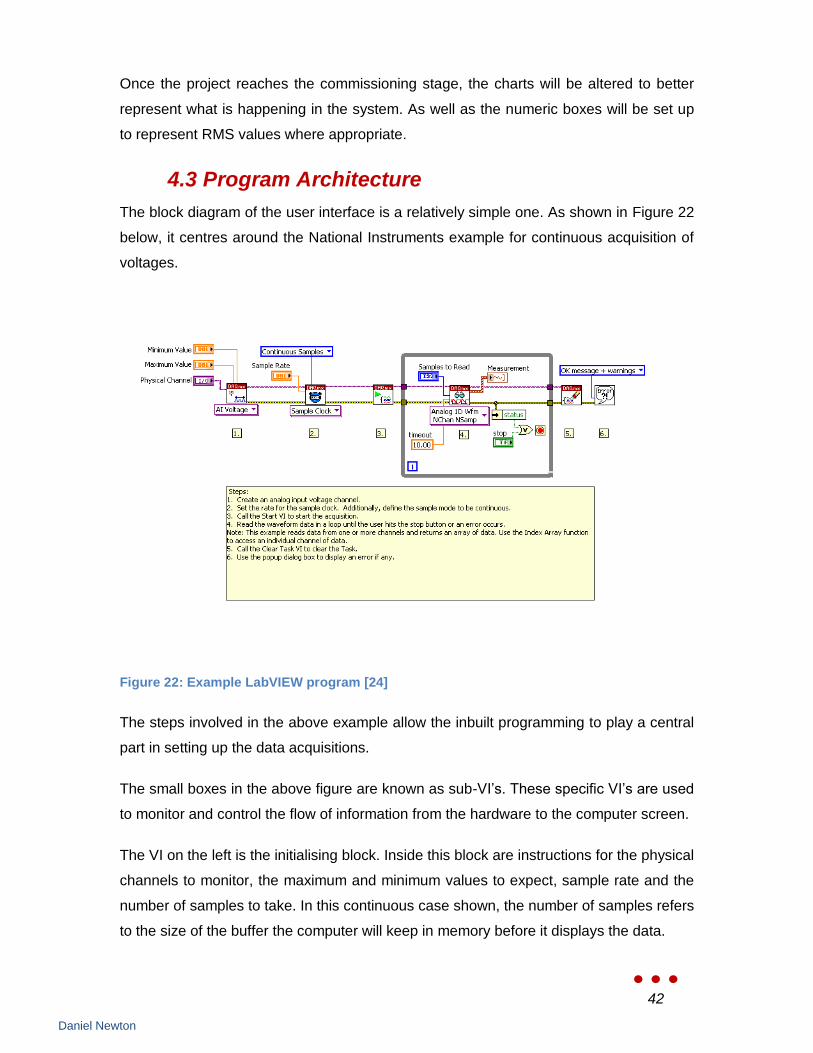
The block diagram of the user interface is a relatively simple one. As shown in Figure 22
below, it centres around the National Instruments example for continuous acquisition of
voltages.
Figure 22: Example LabVIEW program [24]
The steps involved in the above example allow the inbuilt programming to play a central
part in setting up the data acquisitions.
The small boxes in the above figure are known as sub-VI‟s. These specific VI‟s are used
to monitor and control the flow of information from the hardware to the computer screen.
The VI on the left is the initialising block. Inside this block are instructions for the physical
channels to monitor, the maximum and minimum values to expect, sample rate and the
number of samples to take. In this continuous case shown, the number of samples refers
to the size of the buffer the computer will keep in memory before it displays the data.
43
Daniel Newton
The „Sample Clock‟ VI sets the sample rate, but can also be used to fix the number of
samples per channel and whether or not the initial measurement is taken on a rising or
falling edge trigger.
The next task is a „Start Task‟ and initiates the sampling process within the program, the
task is passed directly into a „While‟ or „For‟ loop. It is at this point the task passes out
the measurements being taken as an array. Once inside the loop the program will
continue to measure the predefined channels until the user presses a stop button, or the
task detects an error.
Once the loop has been exited, the task will close in the following „Stop Task‟ VI. The
„Stop Task‟ VI clears any memory buffers that were in use and relinquishes any of the
computers resources that were reserved for the measurement task.
The last VI is an error block that pops up an error message if the task is aborted
prematurely for any number of reasons. The error message communicates the reason
for the task to end prematurely.
Connecting the blocks together are two strings. The top string is the task itself being
passed from node to node and contains all the information about the task. The bottom
string is the error string, that initiates the abort if the task is interrupted for any reason. If
the abort is not from a user input, the error block will give an error message to the user.
The topography of the block diagram within the RAPS 2 program is almost a carbon
copy. There are however some significant differences between the basic sample
program and the program that will measure and display the system variables. They are
explored below.
4.4 The User Interface
4.4.1 Task Definition
Using the National Instruments software tool, Measurement and Automation Explorer
(MAX), it was possible to first test and see if the data acquisition device was successfully
installed on the computer for taking basic measurements, and second, to define the task
so that each channel was named and would sample in the correct range.
To set up the task, each measurement point was assigned a physical channel slot.
Because there are 2 NI-9205 modules, and roughly equal current and voltage
44
Daniel Newton
measurements, one module is responsible for current measurements only, and the other
is responsible for voltage measurements. Splitting the measurements as such means
that a combined sample capacity of 500kS/s can be distributed evenly among 31
measurements. This results in an average of about 16kS/s for each measurement.
Among the specification of sample rates, the setting up of the task also needs to be
specified with the voltage input range, whether it relies on an external or internal clock to
synchronise.
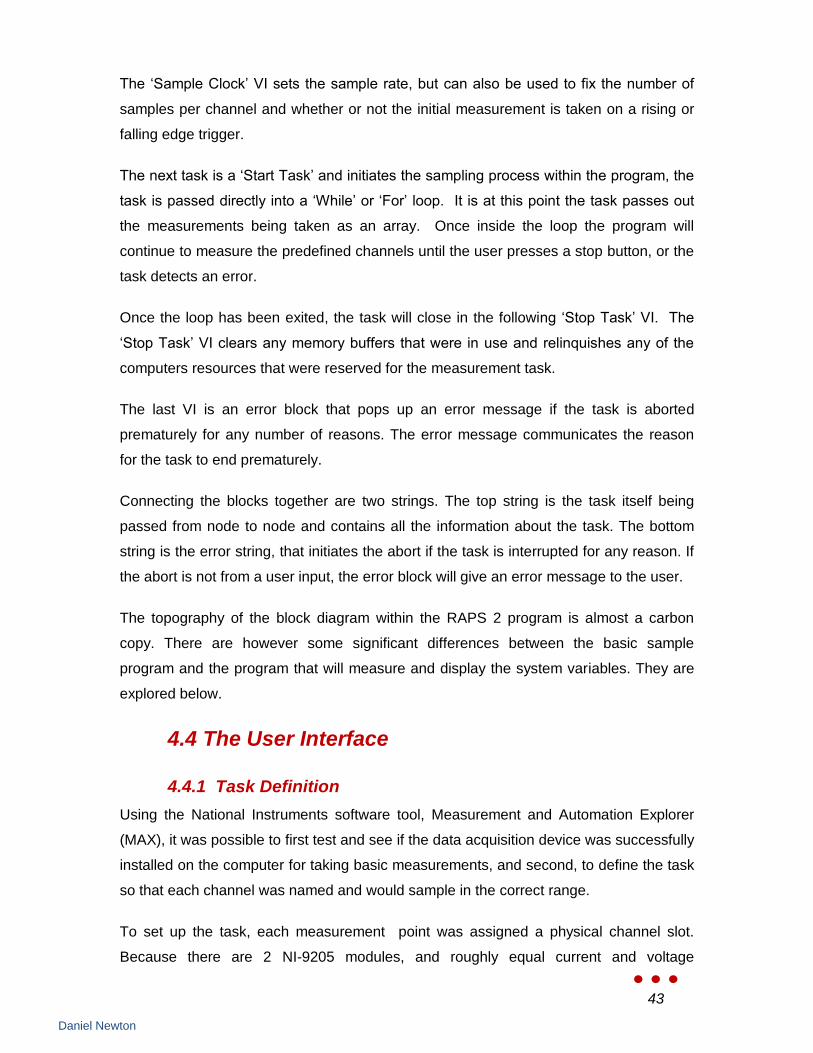
Figure 23: Task definition in MAX
Figure 23 above, is the user panel in MAX. It is at this stage the task is configured to the
way in which it is expected. The external terminal configuration is configured to either
RSE (Referenced single ended) or NRSE (nonreferenced single ended), which denotes
that all measurements are single ended with respect to a common IO reference voltage.
The difference between the 2 configuration settings is that the NRSE measurement is
made in respect to the AI SENSE pin, while the RSE mode uses the reference as the
45
Daniel Newton
ground potential. It has been suggested in some online forums that using a configuration
of NRSE and then connecting the AI SENSE terminal to ground can help reduce noise.
This can be further investigated during commissioning.
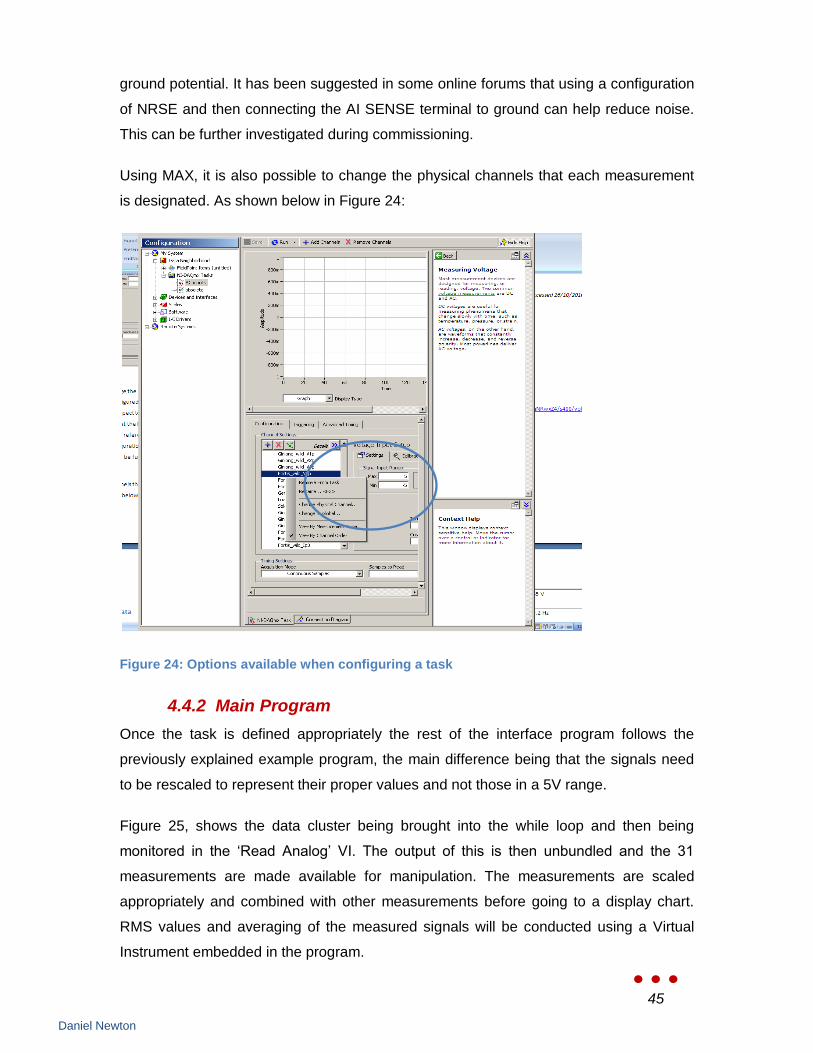
Using MAX, it is also possible to change the physical channels that each measurement
is designated. As shown below in Figure 24:
Figure 24: Options available when configuring a task
4.4.2 Main Program
Once the task is defined appropriately the rest of the interface program follows the
previously explained example program, the main difference being that the signals need
to be rescaled to represent their proper values and not those in a 5V range.
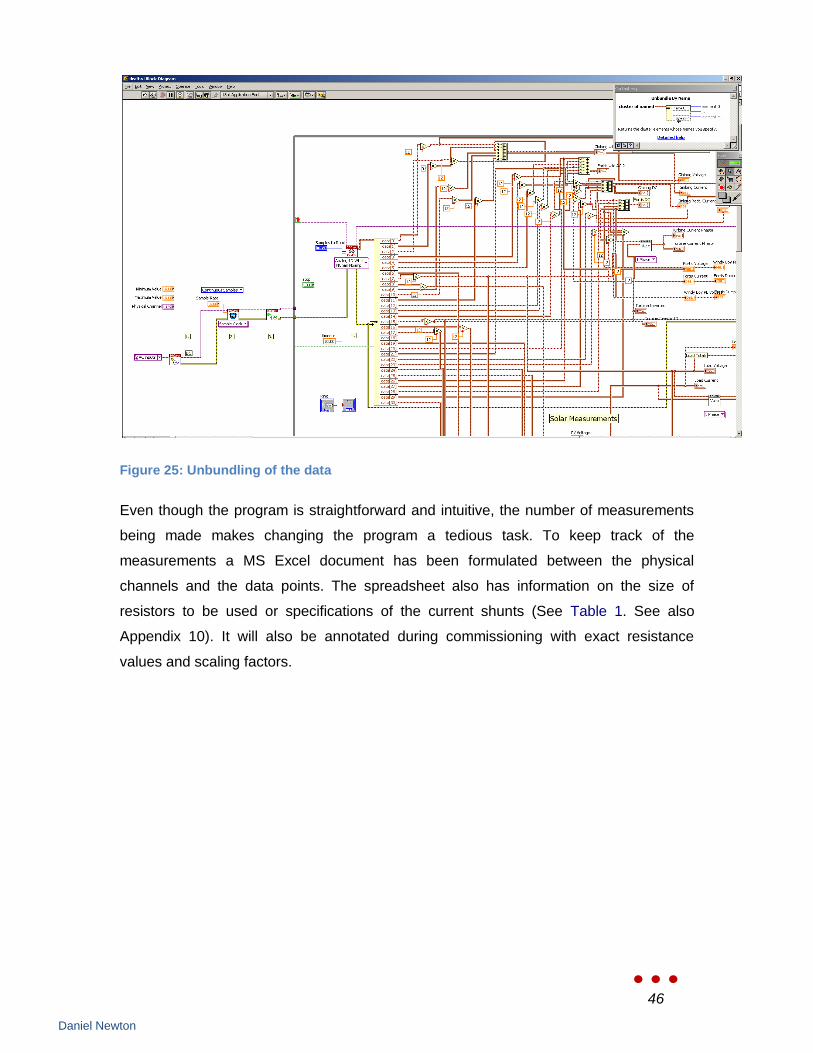
Figure 25, shows the data cluster being brought into the while loop and then being
monitored in the „Read Analog‟ VI. The output of this is then unbundled and the 31
measurements are made available for manipulation. The measurements are scaled
appropriately and combined with other measurements before going to a display chart.
RMS values and averaging of the measured signals will be conducted using a Virtual
Instrument embedded in the program.
46
Daniel Newton
Figure 25: Unbundling of the data
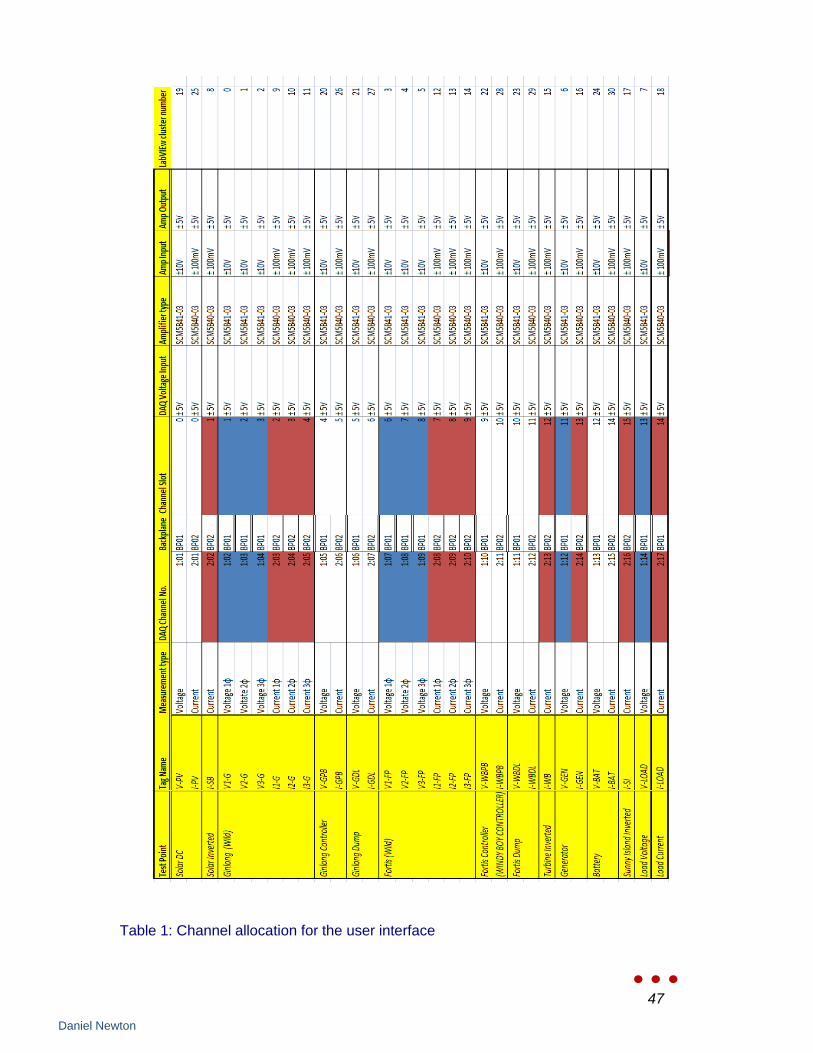
Even though the program is straightforward and intuitive, the number of measurements
being made makes changing the program a tedious task. To keep track of the
measurements a MS Excel document has been formulated between the physical
channels and the data points. The spreadsheet also has information on the size of
resistors to be used or specifications of the current shunts (See Table 1. See also
Appendix 10). It will also be annotated during commissioning with exact resistance
values and scaling factors.
47
Daniel Newton
Table 1: Channel allocation for the user interface

48
Daniel Newton
5. Future Developments
As the project stands, Solar Matrix are looking to begin work on the RAPS 2 installation
within a fortnight of this report‟s submission. The time taken for the installation should be
3 or 4 days. David Feeney is quite confident the work will go ahead quite easily, as he
has worked on this type of system for many years. The main foreseeable issue is the
integration of the measurement system that is being installed at the same time. More
critical to the success is that the voltage dividers and current shunts are installed at the
same time as the inverters. Less critical are the isolation boards and the marshalling of
the measurement signals. The less important aspects of the installation can be
completed by the technical staff, or even a competent student for that matter. Any issues
in the setting up of the measurement system can be resolved during the commissioning
phase.
At the present time, the electrical work is expected to be finished by the 11th of February
2011, with the monitoring system to follow soon after due to a supply issue with the
current shunts.
5.1 Commissioning
The commissioning stage is envisaged as a two part procedure.
The first part involves the commissioning and setting up of the stand alone system. Each
aspect of the installation is expected to be commissioned in line with relevant standards
with documentation supplied by Solar Matrix and signed by both a representative of
Solar Matrix and Murdoch University.
These include but are not limited to:
For the Solar Array;
Open circuit voltage
Short circuit current
Circuit breaker and isolation documentation
Sunny Boy inverter set up and specified output voltage and
frequencies

49
Daniel Newton
Connection diagrams including the signals to the 5B isolation board.
For the Wind Turbines;
Total list of works performed
Maximum recorded voltages and current from turbines
Details of the load breakers and isolation provisions
Procedures on safely swapping connection of supplying controller to
Windy Boy inverter
Set up of Windy Boy inverter and specified voltage and operating
frequencies
Connection diagrams including signals to the 5B isolation board
For the battery and diesel generator;
Specify the isolation and breakers supplied
Test for battery voltage
Record voltage output from diesel generator
Ensure diesel generator is in good working condition prior to
connection
Set up of Sunny Island and specified output voltage and operating
frequencies
Set up of Sunny Sensorbox and Sunny Webbox
Connection diagrams including signals to the 5B isolation board
The second part involves commissioning the measurement system. It is hoped that I can
arrange time to come back to the University at this time to assist with this phase of the
operation; both because it would be satisfying to see a semester‟s work come all the
way to fruition and also I am more familiar with the topology of the system and the
changes that will need to be made to the program.

50
Daniel Newton
Nevertheless, the tasks for the second part are as follows:
Recording and comparison of resistor values with measured impedance
Measure and record the resistor values and line impedance of the signalling wires for
every single measurement. The ohmic resistance must be accurately recorded to
minimise measurement inaccuracies within the LabVIEW program. These values will be
appended to Table 1 and added into the design folder that is a compilation of all the
documents related to the completed project. Ideally, this would have been done before
installation however the components were only procured just prior to the date of
installation.
Scaling of the measurements in LabVIEW
The LabVIEW code will need to be updated to reflect the correct voltage or current
reading. This is a simple task of changing the measured value by multiplying by the
inverse of the down scaling. This is why knowing the resistance values are of significant
importance.
User interface revision
The LabVIEW front panel will also need to be updated to better reflect the desired
information. The front panel display currently used was created from an interpretation of
what the academic supervisor hoped it would display. The display makes use of
indicators and no control aspects are present at this stage in the project, and it is a trivial
task to alter the display. Once feedback is given as to the display, it will be altered as per
requested until all parties are satisfied with the presentation of the display.
Islanding test
A method of automatically logging inverter parameters is required for the instances of
islanding tests. The concept is fairly simple, whereby once the test is triggered, the
LabVIEW program must begin recording for at least a second before the islanding is
activated. The LabVIEW program shall record the parameters of the inverter outputs for
approximately 10 seconds after the test has commenced. There are several issues
involved with the synchronising of the logging to the commencement of the test. The
main issue concerns the initialisation of the program to begin logging while physically

51
Daniel Newton
breaking the power flow. The measurement system has no capacity for digital inputs or
outputs, making it difficult to actuate the test.
There is a small array of options available by which to achieve this:
1) Purchase a digital IO module that will allow for software enabling of the
islanding. A control handle in the LabVIEW program will have the appropriate
delay to begin datalogging and use the digital output to drive open the
appropriately loaded switch.
2) A digital input signal could be used to trigger a hardware start of the logging
in the LabVIEW program. The digital input would also need to be linked to a
hardware timing circuit to allow sufficient time for the prelogging of the
inverter parameters. This adds more complexity to the wiring and set up of
the system.
3) Option 3 is the same as option 2, however instead of using a digital input, a
spare analog channel could be utilised and using comparator tools within
LabVIEW be viewed as a digital signal. I.e., a 5V signal would be monitored
in the LabVIEW program and the low signal could be calculated as a voltage
reading below 3V and drive the required logic to begin logging.
The above options are open to permutations in order to achieve the stated objective.
Option 1 appears to be the more elegant solution, though likely the more expensive one.
It is hoped a solution can be devised during commissioning lest it becomes a preferred
task for future expansion of the RAPS 2 system.
The recorded data will be appended to a spreadsheet file that will be accessible in a
specific folder for recording island test data.
Documentation of the Commissioning Process
The task of commissioning the measurement system itself will need to be appropriately
documented, as will any anomalies or occasional errors and fixes that may be
encountered during this stage.

52
Daniel Newton
5.2 Other Potential Developments
Other tasks possibly worthy of consideration for the future development of this project
include importing the Sunny Sensorbox data to be displayed in the LabVIEW program.
Currently, it will run in a separate proprietary display for purposes of monitoring the
average power drawn from the PV array as well as some information about the solar
strength. The protocol that the Sunny Sensorbox and Sunny Webbox utilise is readily
available and National Instruments provides example programs that allow the
information required to be extracted.
The PC running in the RAPS display building has a serial communications network card
for connection to the Sunny Sensorbox.

53
Daniel Newton
6. Conclusions
The lessons and experience gained throughout the duration of the semester that began
with an initial steep learning curve. The biggest challenge faced was being overwhelmed
by the often complex nature of managing a project, where you are trying to do too many
things at once. The key to being able to make progress is to take a big task and break it
down into smaller, more manageable components. It also helped me grasp the
importance of keeping a diary, particularly when trying to juggle several jobs involving
meetings with vendors and making sure the project is moving forward at a reasonable
pace.
There was a high level of personal growth associated with tackling the above
challenges. This project has taught me the value of being able to communicate on a
professional level, including the ability to adjust my use of formal language and conduct
to suit different situations. This was particularly important when dealing with the high
number of professional contacts that I made throughout the semester. I have also
realised that I enjoyed the type of work that I undertook, especially the design and
research into different methods of measurement and automation from all the available
vendors and solution providers.
The outcomes of the project have several achievements worthy of being mentioned, the
first being the work about to begin in the RAPS building, that includes the installation of a
new system that will avail itself to be a new and innovative teaching aid. If everything
proceeds unhindered then the revamped RAPS 2 system will be completed at a time
coinciding with the beginning of the academic year. Further to this, Murdoch University
has also been fortunate enough to be chosen by SMA to be the location of the Sunny
Island Road show and is quite an achievement for everybody involved in the project, the
monitoring system designed has been specified such that it can be readily expanded
upon to perform a number of experiments that can be used in future teaching
environments.
The project is still progressing forwards, and will need to be carefully coordinated with
MU staff and Solar Matrix. I hope that I am able to be kept in the loop as there are strong
feelings of ownership associated with the project. There is still a mountain of work to be
completed, by both Solar Matrix and by someone representing the interests of MU.

54
Daniel Newton
Once completed, the RAPS 2 upgrade will be a useful tool for students and teachers to
work with and see how real stand alone power supplies work within a home and the
energy uses associated with it.

55
Daniel Newton
7. References
[1] Vandenbergh M, Beverungen S, Buchholz B, Colin H, Ketjoy N, Kininger F, Mayer D,
Merten J, Reekers J, Strauss P, Suwannakum T, Vallve X, 2001, Expandable Hybrid
Systems For Multi-User Mini-Grids, 17th European Photoboltaic Solar Energy
Conference and Exhibition, Munich 2001 [online] http://www.re.e-technik.uni-
kassel.de/photos/documents/40-Expandable%20Hybrid%20Systems%20For%20Multi-
User%20Mini-Grids.pdf [accessed 16/02/2011]
[2] McHenry, M 2008, About Us – RISE, [online]
http://www.rise.org.au/about/?PageInfo=1 [accessed 16/02/2011]
[3] image source: http://www.rise.org.au/info/Demo/sys1/index.html#S1Inverter
[accessed 16/02/2011]
[4] Wilmot, N 2008, Rise Information Portal – Renewable Energy System Demonstration
System 1, [online] http://www.rise.org.au/info/Demo/sys1/index.html [accessed
16/02/2011]
[5] Wilmot, N 2008, Information Portal – Renewable Energy System Demonstration
System 3, [online] http://www.rise.org.au/info/Demo/sys3/index.html [accessed
16/02/2011]
[6] image source: http://www.rise.org.au/info/Demo/sys3/Sys3graphicedited.jpg
[accessed 16/02/2011]
[7] Wilmot, N 2008, RISE Information Portal – Renewable Energy System Demonstration
System 2, [online] http://www.rise.org.au/info/Demo/sys2/index.html [accessed
16/02/2011]
[8] image sourced: http://www.rise.org.au/info/Demo/sys2/RAPS2.jpg [accessed
16/02/2011]
[9]Image source: http://www.smart-
powershop.com/images/power_sets/sma_power_set_m_scheme_en.jpg [accessed
06/02/2011]

56
Daniel Newton
[10] Image source: http://www.casanogaldelasbrujas.com/blog/wp-
content/uploads/2009/05/accoupling.png [accessed 06/02/2011]
[11] Engler A, Hardt C, Strauss P, Vandenbergh M, 2001, “PARALLEL OPERATION OF GENERATORS FOR STAND-ALONE SINGLE-PHASE HYBRID SYSTEMS - FIRST IMPLEMENTATION OF A NEW CONTROL TECHNOLOGY,” Institut für Solare
Energieversorgungstechnik (ISET) e.V, Kassel, Germany
[12] Castelli, L 2010, A Power engineering and renewable energy engineering training
facility utilising SMA‟s Sunny Island Inverter, Murdoch University, Perth WA.
[13] No Author cited, 2004, Sunny Boy / Sunny Mini Central User manual, SMA Solar
Technology AG, Niestetal, Germany
[14] Calais, M & Newton D 2010, „Invitation to Offer‟ Murdoch University, Perth WA
[15] Ruscoe, A. on behalf of Commercial Services 2009, „Invitation to Offer for the
Provision of Photovoltaic Panels to North Elevation of Library, Murdoch University, Perth
WA
[16] No Author Cited, „Company Information, [online] http://ni.com/company [accessed
26/10/2010]
[17] No author cited, „ NI compactDAQ Wireless System‟ [online] available:
http://sine.ni.com/nips/cds/view/p/lang/en/nid/209088 [accessed 17/11/2010]
[18] No Author cited, C Series I/O Modules for NI CompactDAQ, [online] available:
http://sine.ni.com/nips/cds/view/p/lang/en/nid/202551, [accessed 18/11/2010]
[19] No Author cited, About Dataforth, [online] available:
http://www.dataforth.com/about.aspx, [accessed 26/10/2010]
[20] Image source: http://www.dataforth.com/g%5Cdiagram%5Cscm5b40_41.gif
[accessed 06/02/2011]
[21] Image source: http://eolsurplus.com/images/UnknownCurrentShunt200A.jpg
[accessed 06/02/2011]
[22] Hambley, Allan R, „Electrical Engineering: Principles and Applications 4th Edition‟,
McGraw-Hill, Boston 2007.
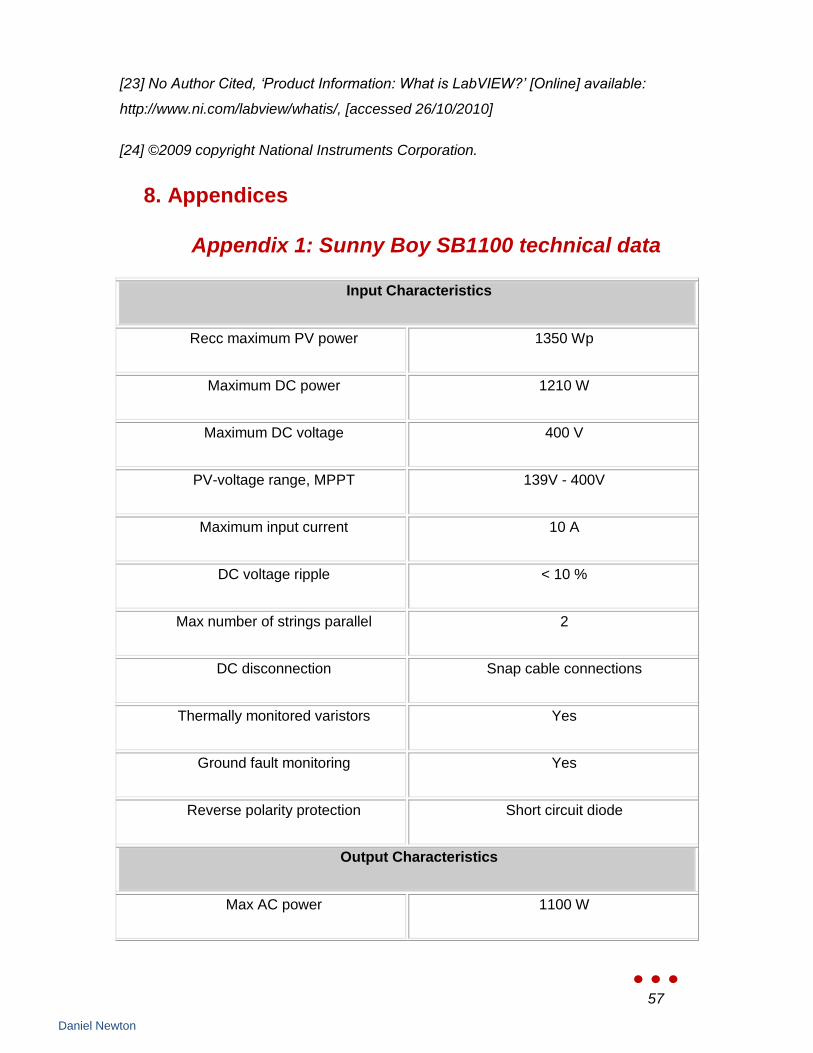
57
Daniel Newton
[23] No Author Cited, „Product Information: What is LabVIEW?‟ [Online] available:
http://www.ni.com/labview/whatis/, [accessed 26/10/2010]
[24] ©2009 copyright National Instruments Corporation.
8. Appendices
Appendix 1: Sunny Boy SB1100 technical data
Input Characteristics
Recc maximum PV power 1350 Wp
Maximum DC power 1210 W
Maximum DC voltage 400 V
PV-voltage range, MPPT 139V - 400V
Maximum input current 10 A
DC voltage ripple < 10 %
Max number of strings parallel 2
DC disconnection Snap cable connections
Thermally monitored varistors Yes
Ground fault monitoring Yes
Reverse polarity protection Short circuit diode
Output Characteristics
Max AC power 1100 W
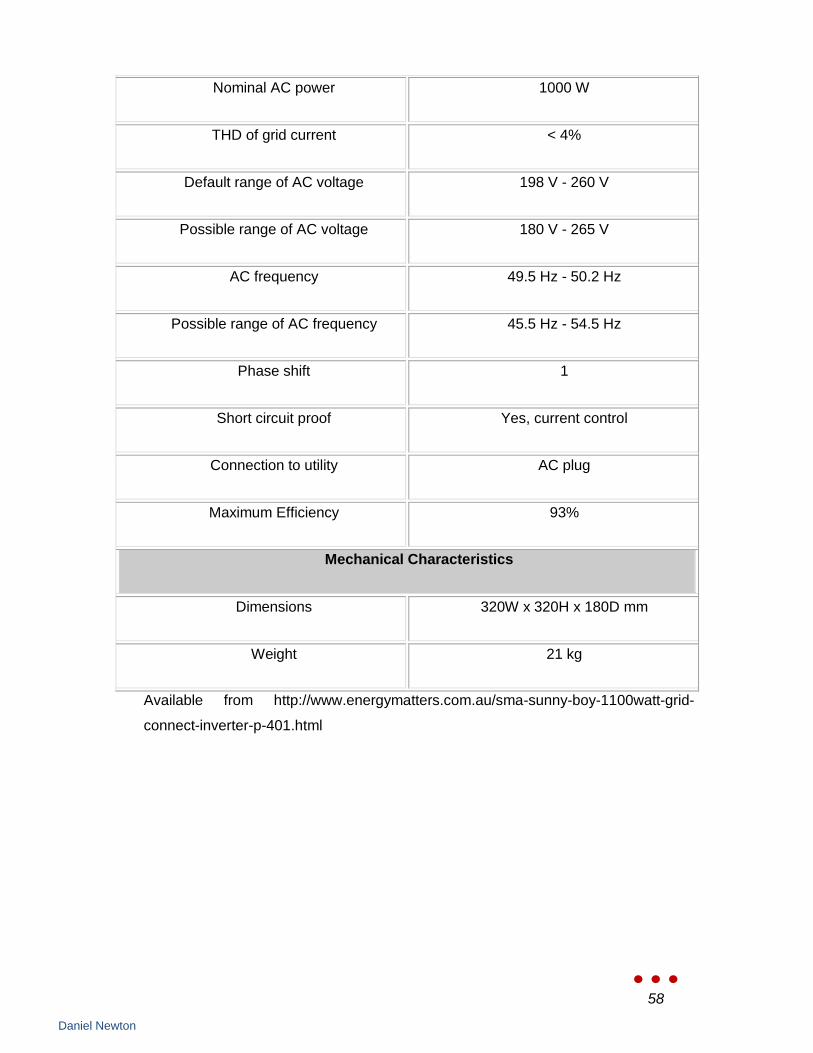
58
Daniel Newton
Nominal AC power 1000 W
THD of grid current < 4%
Default range of AC voltage 198 V - 260 V
Possible range of AC voltage 180 V - 265 V
AC frequency 49.5 Hz - 50.2 Hz
Possible range of AC frequency 45.5 Hz - 54.5 Hz
Phase shift 1
Short circuit proof Yes, current control
Connection to utility AC plug
Maximum Efficiency 93%
Mechanical Characteristics
Dimensions 320W x 320H x 180D mm
Weight 21 kg
Available from http://www.energymatters.com.au/sma-sunny-boy-1100watt-grid-
connect-inverter-p-401.html
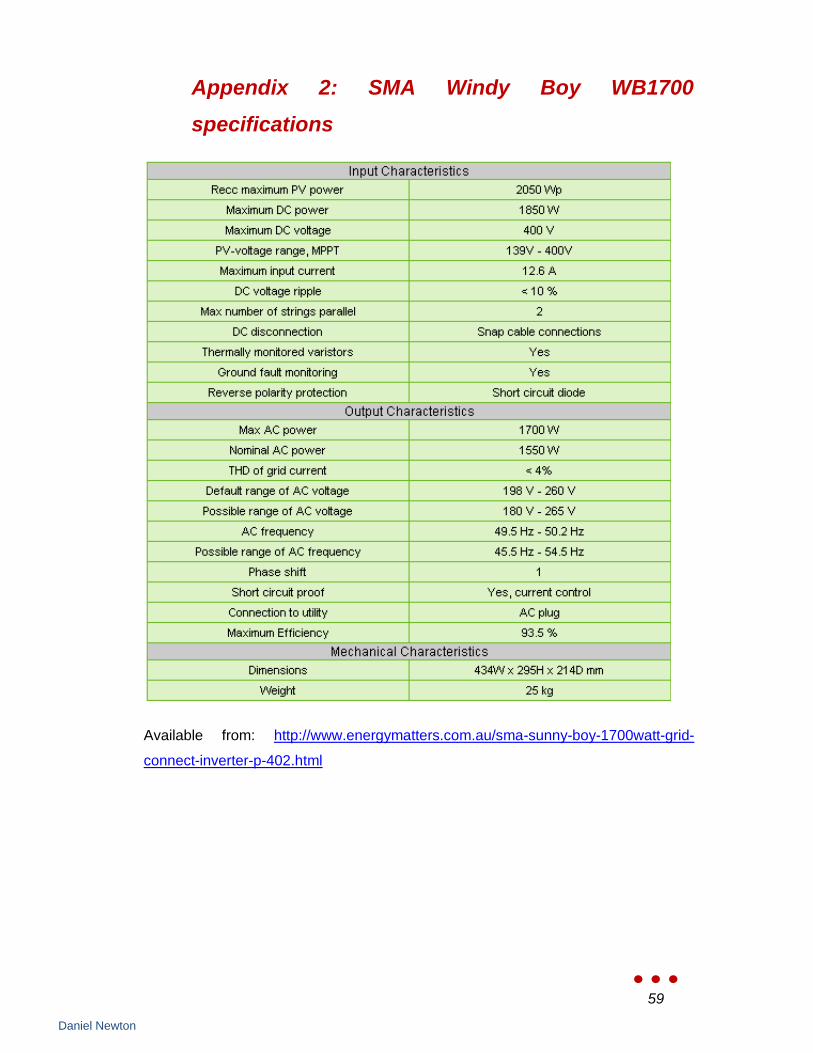
59
Daniel Newton
Appendix 2: SMA Windy Boy WB1700
specifications
Available from: http://www.energymatters.com.au/sma-sunny-boy-1700watt-grid-
connect-inverter-p-402.html
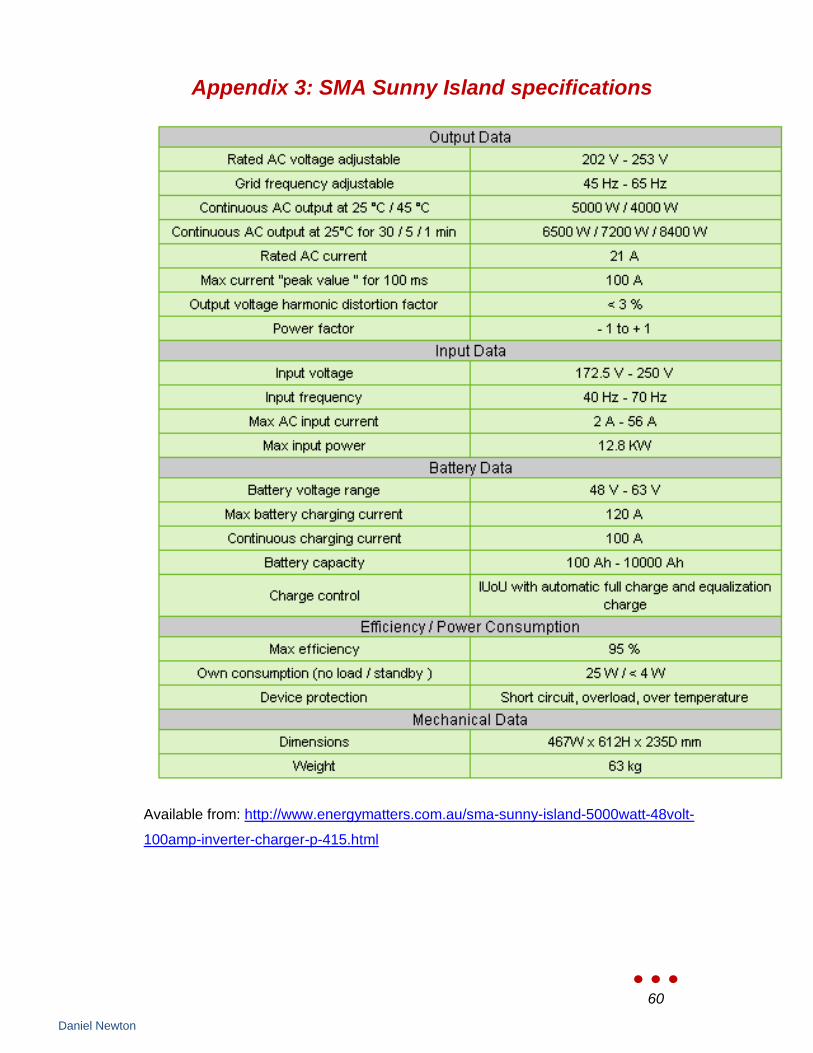
60
Daniel Newton
Appendix 3: SMA Sunny Island specifications
Available from: http://www.energymatters.com.au/sma-sunny-island-5000watt-48volt-
100amp-inverter-charger-p-415.html
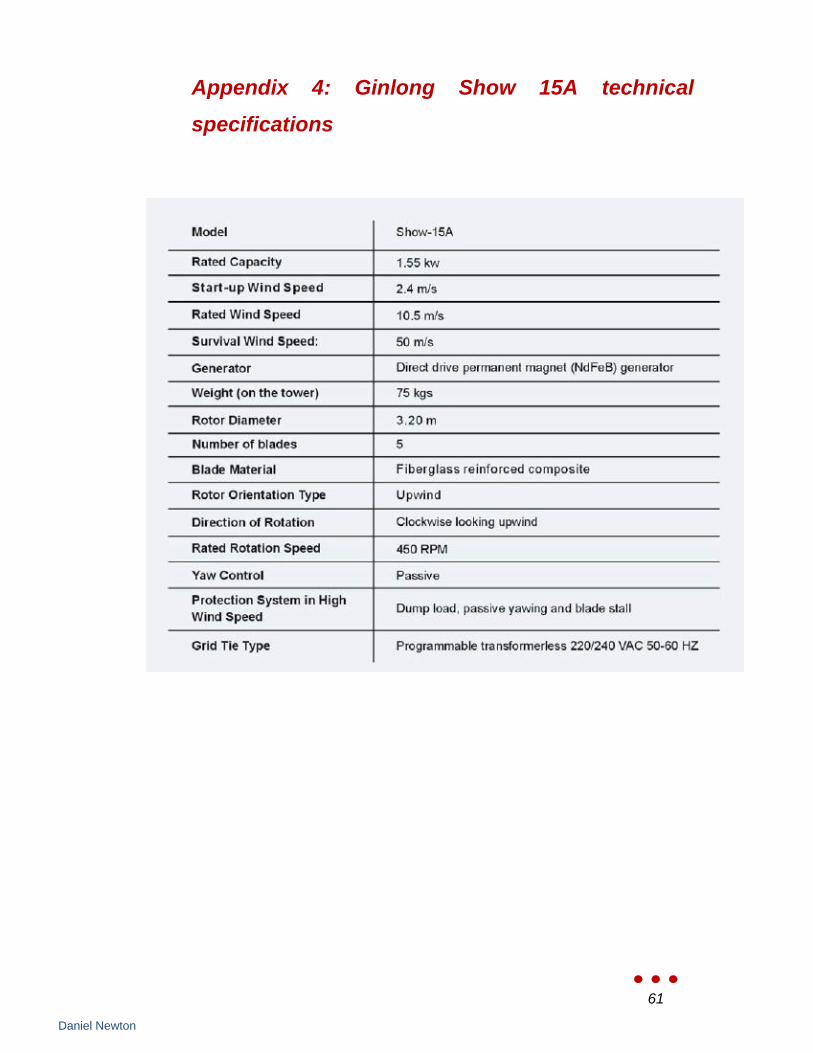
61
Daniel Newton
Appendix 4: Ginlong Show 15A technical
specifications

62
Daniel Newton
Appendix 5: Fortis Passaat 1.3kW technical
specifications
FORTIS Passaat (1400) 350VAC wind turbine specifications
Electrical parameters
Max power Pmax1600 Watt
Short circuit current Isc at 700 rpmA10
Open circuit Voltage Voc at 700 rpm, V 1000
Nominal voltage Vnm, VAC 3 x 275
Nominal voltage Vnm, 350 VDC
Nominal current Anm at 700 rpm5 A
Operating values
Speed range 180 – 750 rpm
Output frequency 18 – 75 Hz
Cut in speed 180 rpm
Max frequency 75Hz
Max permissible speed 750 rpm
Weight 27kg
Limit values
Optimum ambient temperature- 40 to + 90 °C
Humidity at 90 °C 95% relative
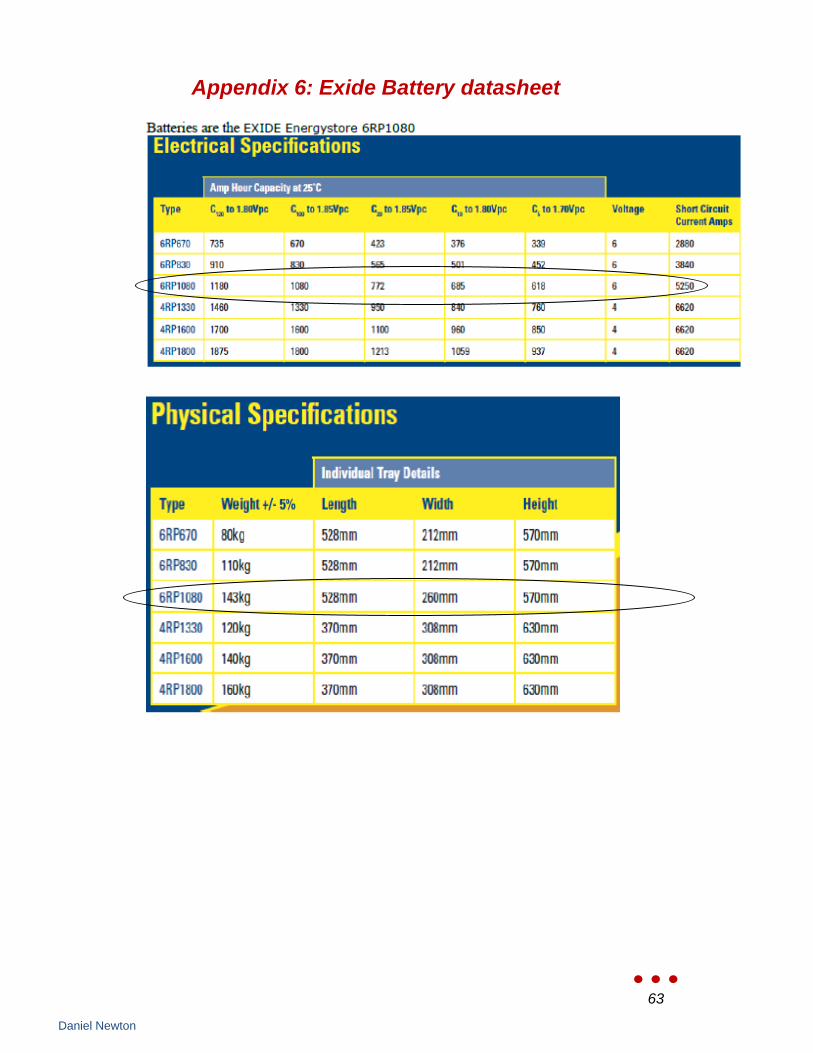
63
Daniel Newton
Appendix 6: Exide Battery datasheet

64
Daniel Newton
Appendix 7: Invitation to Offer document
Please refer to electronic copy of report for the document in full.
Appendix 8: NI-9205 Specifications
Please refer to electronic copy for the NI-9205 User manual and operating
instructions.
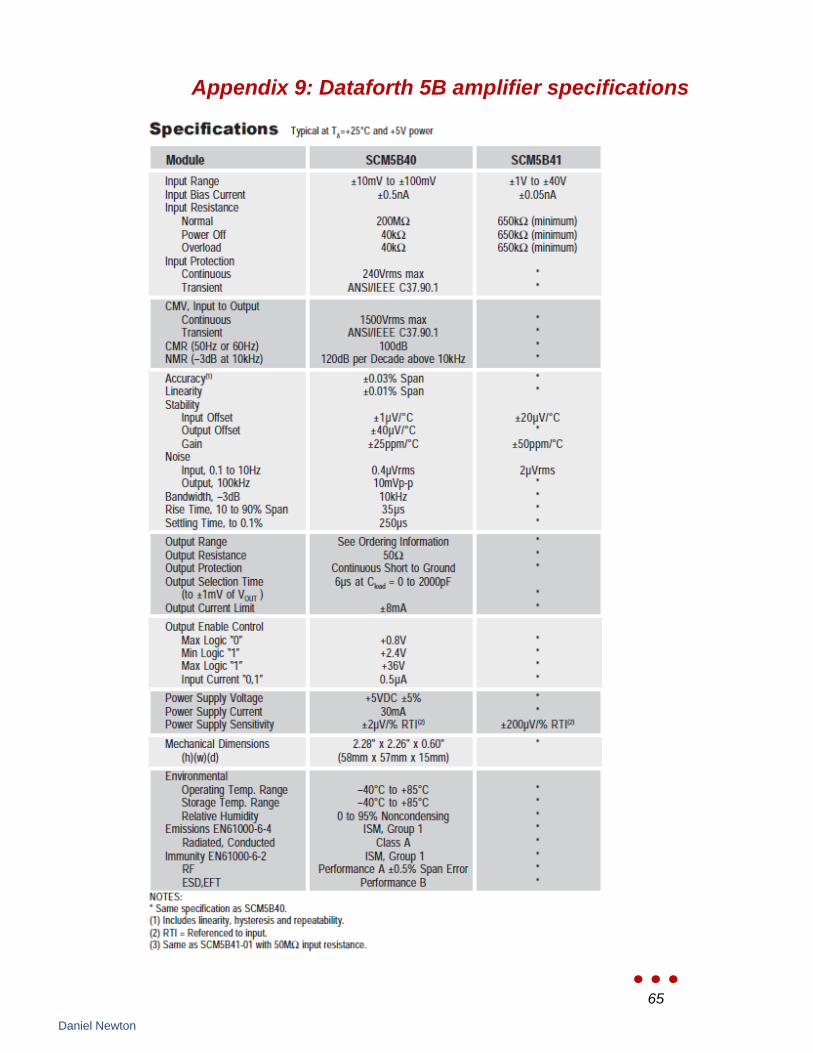
65
Daniel Newton
Appendix 9: Dataforth 5B amplifier specifications

66
Daniel Newton
Appendix 10: Module and channel assignment
Please refer to electronic document „Measurement configuration.xlsx‟ for all data on
channel selection, amplifier pairing and shunt & resistor specifications.