Embed Size (px)
Citation preview

DOCUMENT RESUME
ED 323 643 EA 022 222
AUTHOR McIntyre, Walter G.; Marion, Scott F.
TITLE The Relationship of Class Size to Student
. Achievement: What the Research Says.sOccasional PaperSeries No. 3.
INSTITUTION Maine Univ., Orono. Coll. of Education.
PUB DATE 89NOTE 15p.; Revision of paper presented at the Annual
Meeting of the Penquis Superintendent's Association(Orono, ME, October 20, 1988).
PUB TYPE Collected Works - Serials (022) -- Viewpoints (120)
EDRS PRICE MF01/PC01 Plus Postage.
DESCRIPTORS *Academic Achievement; Class Organization; ClassroomEnvironment; *Class Size; Educational Environment;Elementary Secondary Education; Meta Analysis; SchoolStatistics; Teacher Effectiveness; Teacher StudentRelationship; Teaching Conditions
IDENTIFIERS *Laine
ABSTRACTThe relationship between class size and scholastic
outcomes is addressed in this paper. A literature review focuses onthe research of Glass and Smith (1978) and Larkin and Keeves (1984).Contradictory and inconclusive research findings about teachereffectiveness in relation to class size indicate that emphasis shouldbe placed on training teachers in instructional strategies mostappropriate for a variety of class sizes. A recommendation is thatrather than establishing an absolute class size policy, class sizesshould be lowered in those subjects which require more teacher/pupilinteraction and which have high workloads. Overall findings do notsupport the cost associated with universal class size reduction andindicate that smaller investments in other educational strategies mayyield similar or greater achievement gains. Two figures illustratethe research of Glass and Smith, and one table presentsstudent/teacher ratios by state. (22 references) (LMI)
Reproductions supplied by EDRS are the best that can be madefrom the original document.
*****/

)
NIPANTIEENT OP EDUCATIONOnce of Educational Reseerch end Improvement
EDUCAPONAL REROURCES INFORMATIONCENTER IERIO
/nis document nes boon reproduced ureceived frorn the person or orpemzetionworming it
0 Minor changes neve boon made to improve- reproduction quality
Points of view or opmtons stated in this Occu-ment do not noceesenly regiment officialOEM Position or policy
"PERMISSION TO REPRODUCE THISMATERIAL HAS SEEN GRANTED BY
7/22-ilsvvTO THE EDUCATIONAL RESOURCESINFORMATION CENTER (ERIC)."
Occasional Paper Series
No. 3
The Relationship of Class Size to Student Achievement:
What the Research Says
By
Walter G. McIntireScott F. Marion
The Occasional Paper Series is intended to place before the educational leadership inMaine informadon which can assist them as they ponder solutions to complex problemsconfronting their communities, educational systems, or their students. Papers will bedistributed periodically as topks vital to educational improvement are addressed byresearchers at the University of Maine.
College of Education
University of Maine
Spring 1989
2

THE RELATIONSHIP OF CLASS SIZE TO STUDENT ACHIEVEMENT:
WHAT THE RESEARCH SAYS
Walter G. McIntireScott F. Marion
Center for Research and EvaluationCollege of EducationUniversity of Maine
This is a revision of a paper presented at the Penquis Superintendents Association
Meeting (Orono, Maine October 20, 1988) The authors are grateful to Dr. Russ
()walla, Dr. John Skehan, Dr. Robert Cobb. find Holly Devaul for their helpful comments
and contributions.
3

Walter G. McIntire is Director of the Center for Research and Evaluation, andProfessor of Education, in the College of Education, University of Maine, Orono.
He received his BA. degree from the University of New Hampshire and his M.S.and Ph.D. from the University of North Dakota. He has been at the University of Mainesince 1973. Prior to that he taught at the University of Connecticut and was a highschool science teacher in New Hampshire.
He has published extensively and presented papers at national conferences, ineducation, psychology and family relations and he is currently editor of Research in
Rural Education.
Scott Marion is a Research Associate in the Center for Research and Evaluation,College of Education at the University of Maine. Mr. Marion received his B.S. In zoologyand wildlife biology in 1979 from the State University of New York, College ofEnvironmental Science and Forestry, before working as a field biologist ahd outdooreducator for 8 years.
He completed Maine Secondary Science Teacher Certification requirements in1986 and is presently enrolled in a Science Education graduate program at theUniversity of Maine. Scott Marion has published articles in the Journal ofEnvironmental Education and The Journal of the American Cetacean Society, and haspresented papers at meetings of the New England Educational Research Organization.
4
2

Class Size
The relationship of class size to scholastic outcomes has been the subject of
scientific inquiry for at least the last 80 years. Since the publication of itligkaitallsin 1983, the quality of public education in America has received increased scrutiny and
political attention, and the class size argument has been brought to the forefront again.
Many states have recently considered reducing class size as part of school improvement
programs.
Few teachers disagree with this latest educational reform. The largest
professional association, the National Education Association, has been lobbying for years
for an even greater reduction: "The Association urges its affiliates to seek an optimum
class size of 15 students" (NEA,1986). Proponents of smaller classes usually cite the
work of Glass and Smith (1978), because it provided the first scientft evidence
indicating that higher achievement can be expected in smaller classes.
While Glass and Smith (1978) sought to settle the class size issue, their WO*
has caused a sharp increase in class size research, and strong criticism of their work
can be found in the educational literature (ERS,1980; Tomlinson, 1988; Slavin,
1988). While educational researchers carry on lofty discourses in prestigious
journals, the public continues to wonder about the importance of the relationship of
class size to achievement. So do legislators, governors, and administrators.
What do teachers and students do in class that makes the number of pupils so
important? Do teachers do things differently in smaller classes that result in increased
educational outcomes? Could improved classroom management work as well as
mandating smaller classes? Does reducing class size from 25 to 10 students per teacher
have the same effect reducing class size from 40 to 25 studentslteacher? Educators are
often trapped between several sets of contradictory research findings, or worse, are
faced with a set of inconclusive resul3 when they had hoped to find data that could be
used as the basis for policy decisions. School boards and administrators need answers to
these and other questions before policy can be formulefed. This paper was designed to
review the existing research and to help clarify this complicated issue br Maine's
policymakers and practitioners.
53
4

The Research Evidence
Coleman (1966) reported that student-teacher ratios were not related to
achievement for any group under any condition. Many people familiar with Coleman's
work are not surprised by this finding, for this is the same researcher who stated that a
student's ability was the only important predictor of achievement (Coleman. 1966). A
problem with the majority of the class size-achievement research is the failure to
control for many other important factors. To examine any achievement question without
controlling for ability or prior achievement, socioeconomic status, or several other
predictor variables is misleading. We do not live in a two-dimensional work!, and class
size is only one of many factors related to academic achievement. This paper reports on
only those studies that have controlled for other independent variables, either
experimentally or statistically.
The NEA's desired optimum class size of 15 is the class size that first provides a
statistically defensible gain in achievement according to Glass and Smith (1978). They
used a statistical technique called if:Ma-analysis to elicit a general conclusion from the
conflicting reports. Meta-analysis enables researchers to quantify and combine the
findings of many related studies. An "effect-size' is calculated for each comparison
between dass size and achievement (in this cas4, and then these effect-sizes are
statistically combined to produce a general result (for a more detailed explanation of
meta-analysis see Glass, 1978).
Glass and Smith examined 80 studies which yielded 725 comparisons between
class size and achievement. On the average, the difference in achievement between the
smaller and larger classes favored the smaller classes by about one-tenth of a standard
deviation. Overall. approximately 60% of the comparisons favored smaller classes,
while 40% showed achievement gains in the larger classes. Without meta-analysis, the
review by Glass bind Smith would leave us just as confused as before. But, the studies
favoring smaller classes produced a stronger inverse relationship between class size and
achievement than the direct relationships yielded by studies supporting large classes. In
this instance we would expect the overall relationship to be inverse (in the direction of
smaller classes), which is what Glass and Smith reported. The regression curve fitted to
their distribution of effect sizes Is the graph that is most often fomd in documents
discussing the class size issue (see Figure 1).
The results presented by Glass and Smith were widely accepted by teachers,
probabty because it was the conclusion that was intuitively expected. But. Glass and
Smith's results have been severely criticized, originally by the Educational Research
Service (1980a) and later by Tomlinson (1988) and Slavin (1988). Glass answered
6
,)

Class Size
much of the original (ERS, 1980a) criticism in a follow-up Phi Delta Kappan article
(Glass,1980), which was poorly rebutted by the ERS (1980b). Glass's strongest point
was that although the body of research evidence contains mixed findings, it does not mean
that we should refuse to try to conclude anything from all of these efforts. Hedges and
Stock (1983) provided the most useful criticism of Glass and Smith's work. They
criticized the statistical methods used by Glass and Smith and then re-analyzed the data
using new sampling distributions developed by Hedges (1981). The improved Meta-
analysis technique did not greatly change the results of the original work by Glass and
Smith. Glass and Smith (1978) were also criticized for only using the 14 most well-
controlled studies to produce their now-famous graph (ERS, 1980). Glass answered
this criticism by stating that the 14 most well-controlied studies agreed with their
general findings, but to fit a regression carve that will have policy implications, they
wanted to use the data in which they felt the most confidence (Glass, 1980). Having
spent a great deal of time sifting through volumes of poorly conducted or poorly reported
class sizelachlevement studies, we can understand Glass and Smith's reluctance to
incorporate these more flawsd data into their graph. For practical purposes we should
look at the graph usin, a realistic range (15-35 students) for class size over the
complete distribution of percentile ranks (see Figure 2). It is still apparent that
smaller classes tend to predict higher achievement, although this graph does not contain
the same shock yak* as the original. The key point Is that smaller class sizes correlate
with increased achievement, they do not 'rause' achievement gains.
An extremely thorough study conducted by Loth and Keeves (1984) in
Australia helps to explain the relationship of several important predictor variables,
including class size, to a final achievement measure in math and science. Liuldn and
Keeves also realized that the present literature was inconclusive, due in large part to the
lack of well-controlled studies. Their feeling from the literature was that the
advantages of small classes are restricted to those students who are the most vulnerable,
particularly the very young or those of low ability (Larkin and Keeves. 1984). Their
data were derived from the Educational Environment and Student Achievement study
focusing on Year 7 students in the Australian Capital Territory (Moves, 1972). They
used multiple regression and path-analysis techniques to test the Influence of several
independent variables in a theoretical model. The advantage of this method is that the
effect of each independent variable on the outcome measure can be calculated while
statistically controlling for the effects of all of the other predictors in the model. In this
case, It allowed Larkin and Keeves to examine the effect of class size on achievement,
while holding many other important factors constant
57

figure 1.Relationship Between Achievement and Class Size (Data Integrated AcrossApproximately 101:Comparisons From Studies Exercising Good Experimental Control).
Achievement in Percentile Ranks
70
50
o i0 20 30 4
Class Size
Source: Glass. G. V. and Smith. M.1... Meta-Analysis of the Search on the Relationship of Class Size and Achievement. Far WestLaboratory of Educational Research and Development, San Francisco. CA . 1S78.
100
80Achievement inPercentile Ranks 70
60
50
40
30
20
10
Figure 2. Modified Glass and Smith graph.=IMP.
.11111
0
15 20 25 30 35
Class Size
6

,
Class Size
Larkin and Keeves (1984) described their variables as either belonging to a
structural or a process dimension. Class size, teacher training and experience, student
socioeconomic status (SES), and amount of time each student spends on homework, are
structural variables. Process factors are centered around the various types of
interactions that occur between the teacher and the student in a given classroom. Laikin
and Keeves' (1984) initial correlation between achievement and class size was positive,
which contradicted the meta-analysis of Glass and Smith (1978). One way of explaining
this outcome was that SES was also positively correlated with class size, indicating that.
for the most part, more able students were being placed in larger classes. These simple
correlations, while interesting, do not explain the interaction of the various factors.
In light of Glass and Smith's study (1978) the results of Larldn and Keeves
(1984) are surprising. It appears that after controlling for the presence of prior
achievement, SES, classroom practices, student attitudes, and other independent
measures, larger classes showed enhanced achievement levels. On the average students
in larger classes also experienced greater educational and occupational aspirations, and
these enhanced aspirations contributed to the higher average achievement. While these
results may seem shocking at first, they can be partially explained by the finding that
classroom practices did not vary greatly with class size. Teachers do not often have the
training necessary to exploit the opportunities presented by smaller classes (Shapson,
et al., 1980). Larkin and Keeves (1984) reached similar conclusions in their study.
Even if teachers were not using different instructional strategies in the smaller
classes, how can.we explain the achievement gains in the larger classes? In the larger
classes the mean achievement did increase, but the divergence in the scores between the
higher ability and lower ability students also increased. The smaller classes produced
more equal educational outcomes, but a lower average achievement. Because regression
analysis is based on the variability in a certain group of scores, the Increased
variability in the larger classes helps to strengthen the regression wefficient. There
may also be some types of student-student interactions occurring in the larger classes
(possibly increased competition) that are related to tha enhanced aspirationsl and
achievement outcomes (Larkin and Keeves, 1984).
Although Larkin and Keeves (1984) reported that, in general, classroom
practices were not altered as class size decreased, their study uncovered some
interesting attitudinal relationsnips. Among the strongest predictors for 'positive
attitudes in math and science were the amount of positive suppotl, time spent on
homework, the amount of laughter, and the number of invitations for students to
participate or inquire. They found that time spent on mathematics, time spent ort.
.. 7 s
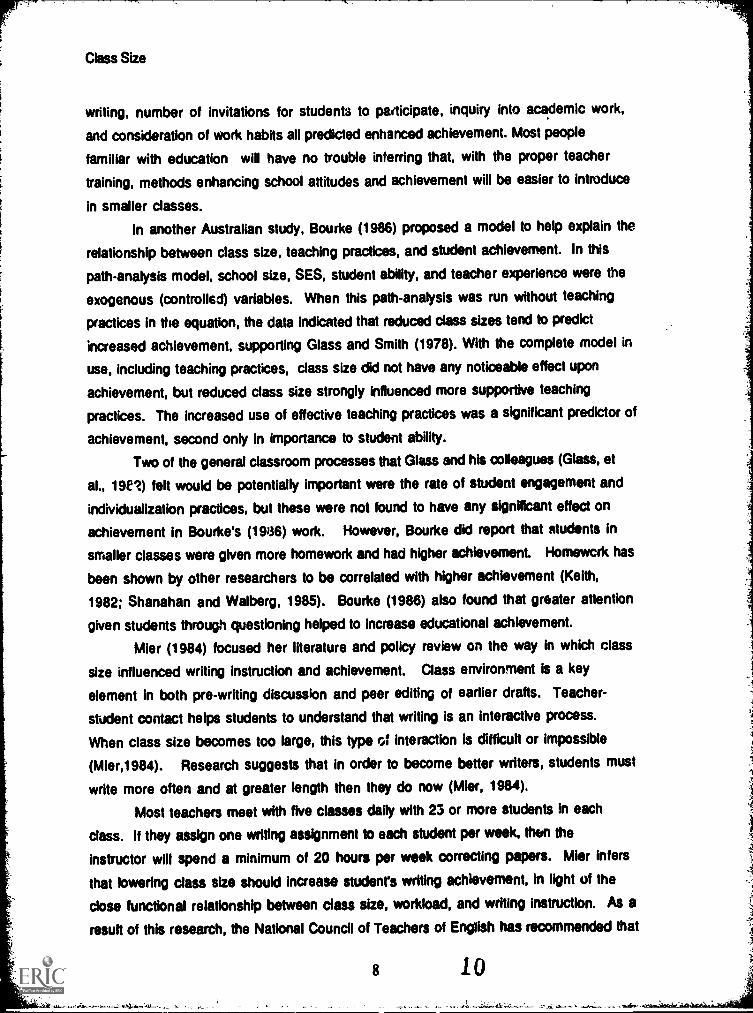
Class Size
writing, number of invitations for students to participate, inquiry into academic work,
and consideration of work habits all predicted enhanced achievement. Most people
familiar with education will have no trouble interring that, with the proper teacher
training, methods enhancing school attitudes and achievement will be easier to introduce
in smaller classes.
In another Australian study, Bourke (1986) proposed a model to help explain the
relationship between class size, teaching practices, and student achievement. In this
path-analysis model, school size, SES, student ability, and teacher experience were the
exogenous (controlled) variables. When this path-analysis was run without teaching
practices in the equation, the data indicated that reduced class sizes tend to predict
increased achievement, supporting Glass and Smith (1978). With the complete model in
use, including teaching practices, class size did not have any noticeable effect upon
achievement, but reduced class size strongly influenced more supportive teaching
practices. The increased use of effective teaching practices was a significant predictor of
achievement, second only in importance to student ability.
Two of the general classroom processes that Glass and his colleagues (Glass, et
al., 19E?) felt would be potentially important were the rate of student engagement and
individualization practices, but these were not found to have any significant effect on
achievement in Bourke's (1986) work. However, Bourke did report that students in
smaller classes were given more homework and had higher achievement. Homewcrk has
been shown by other researchers to be correlated with higher achievement (Keith,
1982; Shanahan and Walberg, 1985). Bourke (1986) also found that greater attention
given students through questioning helped to increase educational achievement.
Mier (1984) focused her literature and policy review on the way in which class
size influenced writing instruction and achievement. Class environment is a key
element in both pre-writing discussion and peer editing of earlier drafts. Teacher-
student contact helps students to understand that writing is an interactive process.
When class size becomes too large, this type of interaction is difficult or impossible
(Mier,1984). Research suggests that in order to become better writers, students must
write more often and at greater length then they do now (Mier, 1984).
Most teachers meet with five classes daily with 25 or more students In each
class. If they assign one writing assignment to each student per week, then the
instructor will spend a minimum of 20 hours per week correcting papers. Mier infers
that lowering class size should increase student's writing achievement, in light of the
close functional relationship between class size, workload, and writing instruction. As a
result of this research, the National Council of Teachers of English has recommended that
8 1 0

Class Size
secondary-level English teachers have no more than 4 classes per term with 25 or
fewer students per class. For elementary teachers involved with writing instruction,
the council recommends that classes should not exceed 25 students (Mier, 1984).
ImplicationsTeachers commonly see class size as a key indicator of the quality of the work
environment, which in turn influences job satisfaction and perceptions of job
effectiveness. In a 1969 NEA survey, teachers ranked class size as their second largest
source of problems, and the Queensland Teachers Union found that class size did affect
workload and, consequently *eacher job satisfaction (Larkin and Keeves, 1984).
Shapson, et al. (1980) also found that teachers believe that their experiences In
smaller classes are better. These results seem obvious. If teachers are asked if they feel
better about small or large classes, the majority will likely choose smaller classes.
However, in one study where three teacher efficacy measures were correlated with class
size, no clear pattern emerged (Fink, 1988). It appears that teachers who are positive
about being teachers will be so whether or not they are in small or large classes.
We are not trying to discount teachers* feeling about dais laza; we do not doubt
that teachers prefer to work in smaller classes where they feel that they have more
management control. But the question remains, will the majority of teachers change
from the lecture style to teaching methods that can take advantage of reduced class sizes
(Tomdnson, 1988)7 Larkin and Keeves (1984) reported that many teachers failed to
exploit the alleged opportunities available in smaller classes. It seems that only
reducing class size does not necessarily result in dramatic changes in teacher behavior.
They found that the teachers own style is a more important determinant of classroom
activities than class size (Larkin and Keeves, 1984). As mentioned previously, Bourke
(1986) found that certain teacher behaviors related to achievement were easier to
implement in smaller classes. The results of Bourke's study and others (Shapson, et al..
1980; Tomlinson, 1988; Mier, 1984) indicate that emphasis should be placed on
providing teachers with training in instructional strategies most appropriate for a
variety of class sizes.
inecarlasalialmziance.Maine has one of the lowest average pupil-teacher ratios in the nation (see Table
1), with a ratio of approximately 15.5 pupils for each teacher (Tomlinson,1988). A
pupil-teacher ratio that is based on the total number of students divided by the total
number of instructional personnel in that same entity (school, school district, state)
9 1.1
111111Morassom....a.,_ aadmts--wevarealiiiii

produces an under-estimate because many instructional specialists are responsible for
very few students. The more realistic figure of pupils per class is probably beween
20-25 students in most, if not all, Maine schools. Maine is one of approximately 20
states that has adopted a maximum allowable class size ratio, with a 25:1 student-
teacher ratio permitted in grades K-8, and 30:1 in grades 9-12 (Tomlinson 1988,
M.R.S.A. Chap. 125, undateu).
How much more do we need tojeckrce the size of our classes and can we afford to
go m, ich lower? Glass and Smith (1978) feel that while small class size is a desirable
and effective pedagogic device, minor changes in the sizes of classes which commonly
occur, do not produce significant effects. Using Glass and Smith's Q978) graph (see
Figure 1), decreasing class size from 25 to 20 Oupils would produce an increase in
achievement by approximately two percentile ranks and decreasing class size from 25 to
15 students per class would likely result in an achievement increase of 6 percentile
ranks. The costs that would accompany a 40% reduction in class size would be
enormous, money that could likely be spent on more effective educational reforms.
Until the recent NEA push for 15 students per class, most educational
researchers and teacher groups would have been happy with the present state of affairs.
The N.Y. Teachers Association in 1959 concluded that smaller classes would allow
teachers to employ better teaching practices. They suggested an optimum class size of
25:1 (Tomlinson, 1988). As a matter of fart The PRIME TIME PROJECT in Indiana has
reported noticeable improvement in achievement by lowering their class size from
approximately 24 students to almost 19 per class. After controlling for 10 and matching
control and experimental groups as carefully as possible, the PRIME TIME PROJECT
reported statistically significant gains in achievement in the elementary grades (Swan,
et al., 1985). We are already close to the 19:1 ratio here in Maine.
In an ideal world, every educater would desire small classes. Instead of fixing
absolute numbers for every type of class, our efforts might prove more effective if we
tried to lower class size in those subjects where high teacher - pupil contact rates are
important and where there is a relatively high workload. Classes such as writing,
foreign language instruction, art, and science laboratories would likely benefit from
smaller classes, while the numbers in lecture type courses with high achieving students
might be allowed to creep up. Implementing a flexible class size policy may be a
politically difficult task to accomplish. The research does not appear to support the cost
associated with an across-the-boaid reduction to 15 pupils per class. Smaller
investments in other oducational strategies may yield similar or greater achievement
gains.
10 1 2

Table I.Pupil-teacherratio and staff in public elementary end secondary schcolst 1all 1956
Stat.
Pupil-teachirratio,fall 1906
United States
AlabamaAlaska
16.7
Arizonm18.4
Arkansas17.5
Calikenia23.0
Colorado18.2
Connecticut4/13.2
Delaware16.0
District of Columbia14.3
Florida17.5
Georgia18.9
Hawaii22.6
Idaho20.4
Illinois17.4
Indiana18.3
Iowa15.5
Kansas15.4
Kentucky18.6
Louisiana18.5
Maine15.5
Maryland17.1
Massachusetts14.4
Michigan20.2
Minnesota17.4
Mississippi5/19.0
Missouri .16.4
Moncona5/15.6
Nebraska15.1
Nevada5/20.4
New Hampshire15.9
New Jersey14.7
New Mexico19.0
New York15.4
North Carolina5/18.7
North Coker",15.3
Ohio18.1
Oklahors16.9
Dreyer18.3
Penny! Ale 16.3
Rhoda Island15.0
South Carolina17.3
South Dakota15.6
Tennessee19.9
Texas17.3
Utah73.4
VermontVirginia
16.8
Washington70.5
West Virginia15.3
Wisconsin16.3
Wyoming14.0
1/Includes guidanceservices staff.2/Includes officials,
administrators, ond admin'strative support staff.
3/U.S. total includesimputations for Connecticut,
Mississippi, Montana, Nevada,North Carolina, and Venmont, which are
not reflected in State totals.
4/Support staff not reported.5/Support staff underreported.6/Data not reported.-Oats not available or not applicable.
MACE: U.S. Department of Education, Center for Education Statistics,"Comm Core of Data" survey; and
unpublished estimates.(This table was prepared January 1988.)
cac sta
Total
3/4,247,437
9,81056,20746,372385,24458,53739,28410,59711,945177,639
111,31715,89216,039185,572104,482
56,82547,22767,72188,59122,966
72,931101,905171,93169,83640,68791,60912,61331,5769,11218,352
139,54128,548317,782105,04713,693182,29665,25346,598197,86114,317
61,84713,90380,968324,72130,501
(6/)108,45565,95541,65379,08614,326
Teikhers
eizarlpr-TOW total staff
2,243,370
-----31747T-6,44829,10424,944190,48430,70434,2525,1183
5,98491,969
52,8817,29110,?34104,60952,89630,95827,06434,50742,92913,685
39,49158,06683,13040,95726,21948,9029,81817,7487,90810,300
75,55814,876168,94058,1037,77998,89435,04124,615102,9938,916
35,3498,03141,103185,31017,752
(6/)58,14137,06522,93147,0397,201
--srr---srn
65.751.853.849.452.587.255.550.151.8
52.045.963.856.450.634.557.351.048.559.6
54.157.048.458.664.453.477.856.285.856.1
54.152.153.255.356.854.153.752.852.162.3
57.257.850.849.558.2(6/)53.656.255.159.550.3
ans, ins Cii-riaruonades, schoo
Other staff1/
Total
1,657,170
2,62620,38417,930130,93622,3932,5683,8365,00777,750
45,4248,0294,56674,91746,99322,97516,22726,35938,6036,548
28,88033,95861,00822,63111,68237,8642,11910,758
7406,797
44,31411,860115,44941,5204,84968,13626,81718,10676,0434,088
21,7824,68534,921166,35910,841
(6/)45,31423,58815,22126,9016,169
and library
Administrativestaff 2/
ercent odecent o
total staff Total total staff
--Iry --Nuor 172-
-----7375- ---1757617-
26.11 736 7.5
36.3 6,719 12.0
38.7 3,498 7.5
39.2 43,824 11.4
38.3 5,440 9.3
6.5 2,464 6.3
36.2 878 8.3
41.9 954 8.0
43.8 7,920 4.5
40.8 8,012 7.2
50.5 572 3.6
28.5 1,239 7.7
40.4 6,046 3.3
45.0 4,393 4.4
40.4 2,892 3.1
34.4 3,936 8.3
38.9 6,855 10.1
43.6 7,039 8.0
28.5 2,233 11.9
39.6 4,560 6.3
33.3 9.881 9.7
35.5 27,793 16.2
32.4 6,248 8.9
28.7 2,786 6.8
41.3 4,843 5.3
16.8 676 5.4
34.1 3,070 9.7
8.0 564 6.1
37.0 1,255 6.8
31.8 19,669 14.1
41.5 1,812 6.3
36.3 33,393 10.5
39.5 5,424 5.2
35.4 1,065 7.8
37.3 15,766 8.6
41.1 3,393 5.2
38.9 3,877 8.3
38.4 18,825 9.5
28.6 1,313 9.2
35.2 4,716 7.6
33.7 1,187 5.5
43.1 4,944 6.1
44.4 23,052 6.2
35.5 1,908 6.3
(6/) (6/) (6/)
41.8 5,000 4.6
35.8 5,302 8.0
36.5 3,501 8.4
34.0 5,146 6.5
43.1 956 6.7
suitWriii17,76VIREP support
ii

Class Size
References
Bourke, S. (1986) How smaller is better: some relationships between class size,teaching practices, and student achievement. American Educational ResearchJournal, 23, 558471.
Coleman, J.S., et al. (1968). Equility of Education& Opportunity. Washington: U.S.Government Printing Office.
Educational Research Service (1980 a.). Class size research: A critique of recent meta-analyses (Arlington, Va.: ERS, ). Deoember.
Educational Research Service (1980 b.). ERS Response to the Glass Rebuttal Phi DeltaKappan, December pp. 242-244.
Fink, David (1988) Teacher Efficacy Scales: Convergent and Disaiminant Validity andAdditional Correlates. Doctoral Dissertation. University of Maine, Orono, ME
Glass, G.V (1978). Integrating findings: The meta-analysis of research. In L Shulman(Ed.), Review of Research in Education vol.5, Itasca. IL: Peacock.
Glass, G.V. and Smith, M.L. (1978). Meta-Anaksis of Research on The Relations* ofClass-Size and Achievement Far West Laboratory for Educational Research andDevelopment.
Glass, G.V, Cahen, LS., Smith, M.L, and Fiby, N.N. (1982). School Class Size. BeverlyHills, CA: Sage Publishing.
Glass, G V. (1980). On criticism of our class size/student achievement research: nopoints conceded. Phi Delta Kappan, December, pp.242-244.
Hedges, LV. (1981). Distribution theory for Glass's estimator of effect size and relatedestimators. Journal of Educational Stalled= 6(2), 107-128.
Hedges, LV. & Stock, W. (1983). The effects of class size: an examination of rivalhypotheses. American Educational Research Journal, 20, 63-85.
Keeves, J.P. (1972). Educational Environment and Student Achievement. Hawthorn,Victoria: Australian Council for Educational Research.
Keith, T.Z. (1982). Time spend on homework and high school grades: A large sample pathanalysis. Journal of Educational Psychology, 74, 248-253
Larkin, A.I. & Keeves, J.P. (1984). The class size question: A study at different levelsof analysis. Australian Council for Educational Research. ED 261 017.
Mier, M. (1984). Class- size and writing instruction. ERIC, ED no 689.
M.S.R.A. (undated) Chapter 125.
National Education Association (1986). Resolution adopted by the NEA RepresentativeAssembly, Washington, D.C.
I 412
,N

Class Size
Shanahan. T. and Wa berg, H.J. (1985). Productive influences on high school student
achievement. Journal of Educational Research, 78(6), 357-363.
Shapson, S.M.. Wnht, E.N., Eason, G. & Fitzgerald, J. (1980). An experimental study
of the effects of class size. American Educational Research Journal, 17, 141-152.
Slavin, R. (1988). Achievement effects of substantial reductions in class size. In:
Slavin, R. (ed.) School and Classroom Organizations . Hiisdale, NJ: Erlbaum
Associaes
Swan. E. & Others. (1985). The educational effects of a state supported reduced class
size program. A comprehensive evaluation of Indiana's Project PRIME TIME at the
North Gibson School Corporation. ERIC, ED 276 109.
Tomlinson, T. M. (1988). Class size and Public Pofty: Politics and Panacea Office of
Educational Improvement. U.S. Department of Education. U.S. Government Printing
Office 1988-208-953/80182
I 3 5