Embed Size (px)
Citation preview
Spatiotemporal Mapping the Neural Correlates of Acupuncturewith MEG
Rupali P. Dhond1,2, Thomas Witzel1, Matti Hämäläinen1, Norman Kettner2, and VitalyNapadow1,2
1MGH/MIT/HMS Martinos Center for Biomedical Imaging, Charlestown, MA 02129
2Logan College of Chiropractic, Department of Radiology, Chesterfield, MO 63017
AbstractAcupuncture is an ancient Eastern healing modality with putative therapeutic applications.Unfortunately, little is known about the central mechanisms by which acupuncture may exert itseffects. In this study, fifteen healthy subjects were evaluated with magnetoencephalography (MEG)to map the location and timing of brain activity during low frequency electroacupuncture (EA) and,mechanical, non-insertive, sham acupuncture (SA) given at acupoint PC-6. Both EA and SA evokedbrain responses that localized to contralateral primary somatosensory (SI) cortex. However, initialresponses for EA peaked slightly earlier than those for SA and were located inferiorly within SI.Average equivalent current dipole (ECD) strength was stronger (particularly at latencies >60ms) forSA. These spatiotemporal differences between activations elicited by EA and SA are likelyattributable to stimulus modality (electrical vs. mechanical) and differences in the underlyingsomatosensory fibers transmitting these signals. The present data confirm that acupuncture modulatesactivity within somatosensory cortex, providing support for previous studies which suggest thatacupunctures therapeutic effects are linked to SI modulation. Thus, MEG provides excellentspatiotemporal characterization of the somatosensory component of acupuncture, and future studiescan contrast derived brain response parameters in healthy controls with those found in a diseasedstate.
Keywordsacupuncture; magnetoencephalography; MEG; EEG; MRI; fMRI; somatosensory; SEP; SEF; SI;SII; prefrontal; limbic; pain; alternative; complimentary; medicine; imaging; non-invasive; non-pharmacological
INTRODUCTIONNeuroimaging techniques such as functional magnetic resonance imaging (fMRI),electroencephalography (EEG), and magnetoencephalography (MEG) allow us to non-invasively monitor the effects of acupuncture in the human brain. Recent fMRI datademonstrate that acupuncture modulates a distributed network of cortical, subcortical/limbicand brainstem regions [for a review see 1]. However, fMRI only measures hemodynamicchanges which are slow (>1 second) and cannot directly track neuronal electrical activityfollowing an acupuncture stimulus on a millisecond timescale. Fortunately, both EEG andMEG may be used to reveal the time-course of these rapid somatosensory responses. Althoughthere are no previously published data utilizing MEG to evaluate the effects of acupuncture on
Address Correspondence To: Polly Dhond, Ph.D., [email protected].
NIH Public AccessAuthor ManuscriptJ Altern Complement Med. Author manuscript; available in PMC 2008 September 29.
Published in final edited form as:J Altern Complement Med. 2008 July ; 14(6): 679–688. doi:10.1089/acm.2007.0824.
NIH
-PA Author Manuscript
NIH
-PA Author Manuscript
NIH
-PA Author Manuscript
brain activity, EEG has been used extensively to study the effects of manual acupuncture (MA)and electroacupuncture (EA) on somatosensory evoked potentials 1 (SEPs) to both non-painfuland painful stimuli.
EEG studies investigating the effects of MA on non-painful SEPs evoked by stimulation ofleg acupoints found that 20 minutes of MA decreased amplitude of early latency SEPssuggesting that acupuncture may modulate activity within spinal nerves and/or primarysomatosensory cortex [2]. Yet, similar studies did not find early modulation with arm/hand[3, 4] or facial acupoint stimulation [5]. Studies utilizing EA have less methodologicalvariability associated with needling than MA and have demonstrated that the time-course ofSEPs generated by EA given at hand acupoints are similar to median nerve SEPs [6, 7].Furthermore, to help determine whether acupuncture modulates early sensory/discriminativeor late cognitive/affective components of SEPs previous studies have combined administrationof acupuncture and anesthetics. One study argued that acupuncture modulates attentionalmechanisms as it decreased amplitude of the P250 pain component [8]. However, modulationof pain SEPs may occur even when subjects are unconscious under anesthesia [9] and althoughconfounding effects may occur when acupuncture is combined with some anesthetics [10] otherdata found no effect of acupuncture on pain regardless of whether anesthesia is given prior toof following EA [11] but again the results varied. Finally, the time-courses of EA SEPs andtheir effects on both non-painful and painful sensory stimuli has been found to be highlydependant on the inter-stimulus interval (ISI) used, with short intervals (<2 seconds),commonly used in clinical settings, resulting in an overlap of long-latency components [6,12, 13] thus making it difficult to interpret many of these studies.
Collectively, studies of acupuncture effects on non-painful and painful SEPs has producedmixed results and are confounded by the need to use long (>2 second, which is uncommon forclinical EA) inter-stimulus intervals when multiple stimuli are used. It is also unclear whetheracupuncture acts similarly on experimental pain as on chronic pain and difficulties interpretingthe effects of anesthetics combined with EA, demonstrates that their concurrent use provideslittle additional information regarding acupuncture’s neural mechanisms. Finally, althoughprevious EEG studies provide some useful information regarding the timing of acupunctureeffects, all of them lack information regarding the anatomical location of the underlying brainactivity.In the present study, we used anatomically constrained MEG to spatiotemporally mapsomatosensory evoked brain response to EA and sham acupuncture (SA) given at a clinicallyrelevant frequency (2Hz) without confounding measurements with other somatosensory/painstimuli or the use of anesthetics. To further mimic clinical intervention procedures, acupuncturestimulation was given continuously for 15 minutes while MEG was recorded. To ourknowledge this is the first MEG investigation of acupuncture, thus providing novel insight intothe spatiotemporal dynamics of neural responses underlying this healing modality.
METHODSSubjects and Experimental Paradigm
Data was collected for 15 healthy, right handed [14] adults, 20-54 years of age (mean 28 ±9yrs). Subjects were recruited via fliers/newsletters adhering to MGH guidelines fordistribution at neighboring academic institutions and hospitals. Subjects were screened toassure their safety and compatibility for MEG and MRI recordings. All participants gavewritten informed consent and the study was approved by the Human Research Committee atMassachusetts General Hospital.
1Somatosensory EEG and MEG studies often utilize paradigms in which sensory stimuli are given repeatedly. Trials are averaged sothat evoked brain responses which are time locked to the stimulus event become visible against background noise. For EEG, theseresponses are called “somatosensory evoked potentials” (SEPs) and for MEG they are called “somatosensory evoked fields” (SEFs).
Dhond et al. Page 2
J Altern Complement Med. Author manuscript; available in PMC 2008 September 29.
NIH
-PA Author Manuscript
NIH
-PA Author Manuscript
NIH
-PA Author Manuscript

The experiment consisted of 5 runs (3 rest runs and 2 acupuncture runs, see Figure 1A) duringwhich subjects were seated within the MEG system and instructed to fixate on a centrallypresented “+” sign. During each 10 minute rest run (i.e. Run 1, Run 3, Run 5) there was noacupuncture intervention and subjects are required to sit quietly. Rest runs were used in orderto reduce residual sensations before the second acupuncture run. Data were recorded duringrest runs to allow for the future evaluation of possible changes in heart rate variability and brainactivity before vs. after stimulation. The order of EA and SA runs was randomized acrosssubjects. Both EA and SA consisted of 15 minutes continuous low-frequency (2Hz) stimulationgiven on the left medial forearm at acupoint PC-6 (pericardium-6, neiguan). All acupuncturewas performed by the same licensed (and experienced) acupuncturist. Subjects wore earplugsthroughout the experiment to attenuate any sounds heard from outside the MEG room or fromstimulation equipment.
In the current studies we employed stimulation at PC-6 which has traditionally been used inthe treatment of cardiovascular diseases and nausea [15]. Importantly, because MEG is biasedtowards superficial brain activity, SI responses for points on the forearm are more confidentlymapped with MEG than those of the leg (e.g. ST-36) which are located medially in the brain[16].
Electroacupuncture ProceduresDuring both SA and EA subjects wore a plastic brace (Figure 1B, C) on their forearm to preventpotential fist clenching and excessive hand movement. A rectangular opening over the medialforearm provided access to acupoints. Following needle insertion and initial manipulation (toelicit deqi sensation), electrical current was delivered. Current amplitude was set to the levelat which subjects indicated feeling a “strong but not painful” sensation. Current was deliveredas a monophasic rectangular, constant-current pulse (pulse width: 0.2ms at 2Hz) using aGRASS stimulator (S88 Dual Output Square Pulse Stimulator, Grass Telefactor, WestWarrwick, RI).
Sham Acupuncture ProceduresOur sham acupuncture was chosen to simulate a typical, mechanical, non-insertive stimulationbut be given with millisecond temporal precision needed for MEG studies. Thus, the plasticbrace was equipped with a piezo-electric cantilever beam (Piezo Bender Q-503B, PiezoSystems, Cambridge MA). The piezo was positioned over the acupoint for each subject priorto SA. The device was battery powered and controlled with National Instruments (NI) Labviewprogram in combination with the 6100 DAQ card (NI) located in a laptop with Labviewsoftware. The digital signal was converted with a D/A converter and amplified (Low CostLinear Amplifier, Piezo Systems Inc.) prior to reaching the piezo. The stimulus waveform wasa single lobe from a 100 Hz half-sine wave (pulse width 5ms).
To promote adequate blinding, participants were told they would receive “two different types”of acupuncture. Subjects were prevented from viewing all acupuncture insertion andstimulation procedures through the use of an opaque screen. Subjects were intentionally shownwrapped needles and Q-tips during both runs. Importantly, in order to most closely match activestimulation in the EA run, the SA procedure was two-fold:
1. Sham Insertion: As with EA, subjects were first palpated near the acupoint to mimicacupoint localization. Insertion was then simulated using a wooden toothpickpositioned on the acupoint with a guide tube [17]. The toothpick was manipulated andsubjects were asked what sensations they felt and if there was any pain. During thistime the piezo-stimulator tip was lowered onto the acupoint.
Dhond et al. Page 3
J Altern Complement Med. Author manuscript; available in PMC 2008 September 29.
NIH
-PA Author Manuscript
NIH
-PA Author Manuscript
NIH
-PA Author Manuscript
2. Stimulation: The stimulator-tip touched the skin over the acupoint and stimulationconsisted of a 2Hz mechanical pecking to mimic EA frequency. Stimulation was setto a level at which subjects indicated feeling a “strong” (not painful) sensation.
A tactile SA control was chosen over non-invasive electrical stimulation for multiple reasons.First, we felt that surface electrical stimulation would not qualify as sham but insteadapproximate TEAS acupuncture. Secondly, the use of surface electrodes does not guaranteethat deep nerve or muscle fiber stimulation would not occur (as expected with needles). Finally,we felt that non-invasive sham could be used as a viable control if insertion was emulated andthe mechanical stimulation was at the same frequency as the EA. A similar “tapping” procedurehas been conducted manually in acupuncture fMRI studies [18]. Manual acupuncture andmanual sham procedures are adequate in fMRI studies which measure brain activity in seconds,however, they are not appropriate for MEG studies evaluating SEFs which require precisiontiming (millisecond accuracy) of stimuli, as provided by EA and our piezo driven SA device.
Psychophysical Data Collection and Analysis—Prior to each experiment subjects weregiven a questionnaire, aimed at assessing their somatosensory expectancy for acupuncture,consisted of a list of thirteen words (taken from the survey below) and asked:
“Which (if any) of the following sensations do you expect that you will feel duringacupuncture? Give your answers as ‘Yes’ or ‘No’. Briefly state what knowledge youare basing these expectations on (i.e. book, friends, web etc.)”.
Following the MEG recording session, subjects rated the intensity of sensations they felt duringeach acupuncture run. Subjects were presented with a 10 point visual analog scale (VAS), 0indicating no sensation and 10 indicating the strongest sensation possible. Responses wereacquired with a laptop and Labview Software. Subjects were asked to rate the extent to whichthey felt sensations commonly associated with the experience of deqi (i.e. aching, soreness,pressure, heaviness, fullness, warmth, cool, numbness, tingling, and dull pain etc.). These werethe same words used in the pre-scan expectancy questionnaire. Subjects were asked to assessthe extent of sharp pain and the extent of “spreading” that may have occurred for any of thelisted sensations. In order to quantify the total amplitude of deqi experienced we used the MGHAcupuncture Sensation Scale Index (MASS-Index) which aims to give weight to sensationseverity along with multiplicity or variability [19]. In other words, this index gives weightingto the amplitude score for any particular sensation, as well as the number of different sensationschosen by the subject. For every experiment run, one can calculate the MASS index as follows:
where S1 is the highest intensity score for any deqi sensation, S2 is the second highest intensityscore for a different sensation, S3 is the third highest, and so on. Frequency counts of differentsensations was also compared between different groups with a Chi-squared test, significant atα<0.05.
Following the MEG recording session subjects were given a questionnaire to assess whichstimulation type (verum or sham acupuncture) best matched their initial expectation of whatacupuncture should feel like. Subjects were asked:
“During the session you experienced different types of acupuncture which may haveproduced different sensations. Which of the different types of acupuncture (1st or2nd acupuncture run) most closely matched your initial expectations of whatacupuncture would feel like? Briefly explain why. Refer to you initial questionnaireif necessary.”
Dhond et al. Page 4
J Altern Complement Med. Author manuscript; available in PMC 2008 September 29.
NIH
-PA Author Manuscript
NIH
-PA Author Manuscript
NIH
-PA Author Manuscript
Methods for MEG and Structural MRI Data CollectionMEG Data Collection: MEG signals were recorded with a 306-channel VectorviewBiomagnetometer (Elekta Neuromag Oy, Helsinki, Finland). The head position was monitoredduring the measurement using head position indicator coils (HPI). The subject’s head and theHPI coils were digitized using a Polhemus FastTrak digitizer to allow for accurate alignmentof the MEG sensor array with the subjects MRI scan. The acquisition bandwidth was 0-400Hz with a 1200 Hz digitization rate. The subject’s electrocardiogram (ECG) and electro-occulogram (EOG) were recorded simultaneously to control and if necessary remove influencefrom physiological noise sources such as heart beat, eye blinks and eye saccading.
High-Resolution, Structural MRI Data Collection: Individual MRI scans are necessary toassure accurate localization of MEG signals. Each subject underwent an MRI scan which wasco-registered with the MEG data. The anatomical MRI was used for creation of boundaryelement models and visualization of the cortical surface anatomy. Each subject was scannedin a Siemens Avanto 1.5T MRI (Siemens Medical, Erlangen, Germany). Two high-resolutionMPRAGE (256×256 matrix (256mm FOV),128 slices, 1.33mm slice thickness, TE=3.39ms,TR=2530ms, TI=1100ms, flip=7deg) images (averaged offline) and a multi-echo 3D-FLASHscan (256×256 matrix (256mm FOV), 128 slices, 1.33mm slice thickness, TE=5.91, TR=20ms,3 echos, echo spacing=100 μs, flip=5deg) were acquired.
MEG Data AnalysisMEG Equivalent Current Dipole (ECD) Analysis: Many MEG studies of somatosensoryprocessing utilize single dipole analysis with the assumption that only a single or relativelyfew sources of activity. In general, ECD fitting is performed through least-squares fitting forthe MEG sensor data to potential source locations within either a spherical or realistic headmodel, the later of which is constructed from individual subject MRI’s [16]. In the currentstudy we utilized the XFit software (Elekta Neuromag Oy, Helsinki, Finland) with a sphericallysymmetric head model fitted to the shape of the inner skull surface. The distance between EAand SA ECD’s was computed as the Euclidean distance between the corresponding dipolelocations. For final visualization, the ECD locations in each subject were projected onto theirinflated cortical surfaces.
MEG Distributed Source Estimates: To confirm the results of ECD analysis, as well as toreadily visualize potential simultaneous activity within multiple locations, distributed sourcemodeling was employed. A minimum norm estimate (MNE) [20] was used to solve the ill-posed inverse problem of assigning time-courses measured with relatively few channels (306)to many source locations (∼6000). To further constrain the inverse solution, we made theassumption that the generators of the measured field be located in the cortical mantle and thatthe currents producing the MEG and EEG signals were approximately orthogonal to the corticalsurface [21].
The geometry of the cortical surface employed as a constraint was generated by the FreeSurfer[22, 23] software and used each subject’s MRI scan (reconstructed from high resolutionMPRAGE images). For purposes of inter-subject averaging, the reconstructed surface for eachsubject was morphed into an average spherical representation, optimally aligning sulcal andgyral features across subjects while minimizing metric distortions and shear [24] and MEGresponse amplitude was mapped onto an average sulcal-gyral pattern. For the MEG forwardcalculation we employed the boundary element method (BEM), which assumes the head iscomposed of arbitrarily-shaped compartments with constant electrical conductivity. Weemployed in-house developed software for extracting the surfaces separating the relevantcompartments (scalp, skull and brain) from anatomical MRI data. The BEM was then used forcalculating the signal expected at each MEG sensor, for each dipole location [25, 26].
Dhond et al. Page 5
J Altern Complement Med. Author manuscript; available in PMC 2008 September 29.
NIH
-PA Author Manuscript
NIH
-PA Author Manuscript
NIH
-PA Author Manuscript

To estimate the timecourses of cortical response, we used the noise-normalized, anatomicallyconstrained linear estimation approach described by Dale et al [27]. This approach is similarto the generalized least-squares or weighted minimum norm solution [20], except that themodeled sources were constrained to lie in the cortical surface [28], and the estimate wasnormalized for noise sensitivity such that source signal to noise ratio rather than current dipolemoment was mapped [27]. The noise normalization also has the effect of greatly reducing thevariation in the point-spread function between locations [29]. This approach provides statisticalparametric maps of cortical response, similar to the statistical maps typically generated usingfMRI, or PET data, but with a temporal resolution of 5ms or less.
The maps were calculated every 5 ms for every condition and every individual. The squareroots of these values were then averaged on the cortical surface across individuals after aligningtheir sulcal-gyral patterns. The square root was used in order to de-emphasize outliers andensure that the result is linearly proportional to the magnitude of the estimated sources [27,30]. The source signals for each individual were smoothed on the cortical surface using a heat-kernel iterative smoothing algorithm (sigma=1, 10 iterations) prior to across subject averaging[31]. Thresholds for activity maps were calculated by sampling the maximum statistic of 10000permutations of data points within the average baseline and evoked response for eachindividual, an adaptation of a previously demonstrated thresholding method [32]. Themaximum statistic was calculated across all sources (in space) for each permutation. Thethreshold was selected to control the family wise error rate (FWER) to be at 5%. The thresholdwas determined using this method for each condition and time point separately, using non-overlapping baseline samples for the different time points.
Analysis of Potential Correlations between Subjective Sensations and BrainResponse—To assess the possible relation between deqi ratings and brain response weperformed a correlation analysis. To do this, the ECD magnitude at the second somatosensorypeak (equivalent to M30 or M35) was determined for each subject. In order to provide readilycomparable values across subjects the magnitude of these peaks was “normalized” by dividingthe average absolute value of response occurring between 50-70ms post-stimulus. This wasdone for both EA and SA. The correlation between these values and ratings for the MASS-Index as well as the most commonly reported sensations (i.e. those which >60% of subjectsreported feeling) was then assessed.
RESULTSSEF’s to EA and SA localize to contralateral SI
MEG data were collected from 15 healthy, right-handed [14] subjects. Each subject underwent15 min continuous low frequency (2 Hz) EA and 15 minutes of continuous low frequency (2Hz) SA. In order to spatiotemporally map evoked brain responses to EA and SA, bothequivalent current dipole (ECD) analysis [33] and anatomically constrained, noise normalized,distributed source modeling was employed [27]. Source localization with ECD analysis (Figure2A) demonstrated that the strongest source of cortical response, at all latencies, for both EAand SA lay within contralateral primary somatosensory (SI) cortex (∼BA 3b). This wasconsistent across multiple subjects with EA and SA sources neighboring one another along SI.These findings were further corroborated by distributed source modeling methods asdemonstrated by averaged activity for EA and SA (Figure 2B). Furthermore, in 11 of 15subjects SA sources mapped more dorsally along the homunculus than those for EA, possiblydue to differences in the underlying afferent pathways. For ECD dipole placements the meanEuclidean distance of separation between EA and SA sources (mean ± stdev) was significant10.79 ± 5.7 mm (2-tailed, t(15) = 7.38 p<.001).
Dhond et al. Page 6
J Altern Complement Med. Author manuscript; available in PMC 2008 September 29.
NIH
-PA Author Manuscript
NIH
-PA Author Manuscript
NIH
-PA Author Manuscript

Temporal Differences in Brain Response to EA and SAAveraged SI dipole time-courses for EA and SA (Figure 2D), showed clear differences in thetiming of early (< 40ms) peaks. Response to EA first peaked at 20.95 ±1.6 ms post-stimulusand was followed by another peak at 31.7 ±3.2 ms. The spatiotemporal distribution of theseearly peaks appeared similar to the M20 and M30 components evoked by median nervestimulation [34, 35]. Similar to the M20, the early (20ms) EA ECD was oriented anteriorlywhile the M30 orientation was reversed. The M20 may reflect information propagating fromlayer 4 to layers 2/3 in cortex [36-38] and the M30 return currents oriented back towards layer5 [36] or possibly a combination of activity within areas 3b and 3a or 1 [39].
No clear peaks were seen at ∼20ms for SA. Instead the first clear peak occurred 38.8 ± 2.8 mspost-stimulus. This peak was similar in orientation but significantly longer in latency than thecorresponding M30 seen for EA (paired t-test, t(15) = 8.14, p<.001). Furthermore, both EAand SA demonstrated corresponding peaks at ∼55ms, ∼70ms and ∼120ms all delayed slightlyfor SA. These peaks are likely to be analogous to those seen during median nerve stimulation.Finally, it should be noted that, early ECD responses to EA and SA were slightly larger inmagnitude for SA, however, differences were largest between ∼80-250ms (paired t-test ofaverage value 80-250ms, t(15) = 2.18, p<0.045).
Psychophysical AssessmentAnalysis of the sensation expectancy questionnaires indicated that subjects most oftenexpected to feel tingling sensations (13/16 subjects reported ‘Yes’) during acupuncture. Thiswas followed by expectancy for deep pressure (6 subjects), aching (5 subjects) and sharp pain(5 subjects). Only four subjects based their expectations on prior experience with acupuncturewhile three indicated their expectations were based on media (i.e. books, TV, or magazines)and conversations with friends. Finally, seven subjects indicated they had no particular sourceof information guiding their expectations and two indicated that their rating was based ongeneral perceptions of how a needle would feel.
Following MEG recordings, subjects were asked to evaluate the sensations they felt duringboth EA and SA by rating their intensity (10pt VAS). The MASS-Index was 4.1 ± 2.0 for EAand 3.4 ± 2.1 for SA (Figure 3A). Although the score was on not significantly different betweenEA and SA, there was a trend for stronger sensation under EA (paired t-test, t(15) = 1.813, p< 0.09).
When considering the percentage of subjects reporting any given sensation (Figure 3B)pressure, tingling, aching, dull pain, numbness and spreading were the most commonly felt (inthat order). Of these sensations, pressure, numbness and spreading were more often indicatedfor SA although had a lower mean intensity as indicated above. Some subjects also reportedfeeling “other” sensations which included a “tapping” sensation, “tiredness/fatigue”.
Evaluation of post-stimulus questionnaires regarding expectancy showed that 7 subjects feltthat neither acupuncture run matched their initial expectations of what acupuncture would feellike. While 8 subjects reported the EA run as most closely matching their expectations due togreater sensations of either tingling, numbness, heaviness and or pricking due to needleinsertion. One subject reported that the SA run most matched their expectations due to a feelingof pressure.
Correlation analysis of Sensory Experience and Brain ResponsesIn the current study sensory ratings were assessed for correlation with MEG data. We did notfind any significant correlations between subjective sensory experience and the magnitude ofearly peaks in MEG response.
Dhond et al. Page 7
J Altern Complement Med. Author manuscript; available in PMC 2008 September 29.
NIH
-PA Author Manuscript
NIH
-PA Author Manuscript
NIH
-PA Author Manuscript
DISCUSSIONThe present investigation spatiotemporally mapped MEG SEFs to 15 minutes of continuous,low frequency (2Hz) EA and SA. ECD and distributed source analysis of brain activitydemonstrated that during both conditions the only consistent source of activity across subjectswas the contralateral SI cortex. EA and SA sources were located proximal to one another withthose of SA tending to map more dorsally. The spatiotemporal distribution of SEFs to EAdemonstrated similarities to those evoked by electrical stimulation of the median nerve;response first peaked at ∼21 ms and then ∼32 ms post-stimulus mimicking the median nerveM20 and M30 deflections [34, 35]. However, the first clear peak for SA appeared slightly later(∼38 ms) and long latency responses (> 60ms) were stronger for SA than EA. Evaluation ofthe somatosensory deqi experience with the MASS Index demonstrated that there was a trendtoward stronger EA evoked deqi than for SA. Collectively, EA and SA evoked clearspatiotemporal differences in brain activity as indicated by MEG SEFs.
Basis of Spatiotemporal Differences in Brain Responses to EA and SAFirst, there was a general tendency for SA sources to map dorsally to those of EA. Onepossibility is that deep electrical stimulation (EA) evoked signaling within the median nervewhile superficial stimulation during SA primarily recruited afferents carried within theantebrachial cutaneous nerve [40]. The cortical distribution of median nerve afferents whichcarry sensory information from the first four digits of the hand are likely to map inferiorly tothose of the antebrachial nerve (carrying signals from superficial, medial forearm receptors)as predicted by the distribution of arm/hand areas along the SI homunculus [41-46]
Secondly, differences in the timing of early EA and SA responses may be due the nature ofthese stimuli, i.e. electrical vs. mechanical. Specifically, unlike EA, the first clear response toSA peaks at ∼38ms. The lack of a clear ∼20 ms peak, as seen with EA, is likely due to temporaldispersion of early SA signals. During electrical stimulation, underlying receptors/afferentsare recruited simultaneously thus, signaling is not spread over time. However, during SA, themechanical stimulation creates gradual skin indentation (2.5 ms until maximum tip deflection)which may evoke a graded/cumulative recruitment of sensory fibers. Thus, the lack of clearpeak at ∼20ms and a slight difference in the slope of response leading to the secondary peak(32ms for EA and 38ms for SA) may have resulted from temporal dispersion of afferent sensorysignals during SA. Similarly, studies utilizing EEG to investigate differences in brain responseto mechanical vs. electrical stimuli have found that early components (< 30ms) evoked bymechanical stimulation are often less pronounced and have slightly longer peak latencies[47] than those for electrical stimulation. This has also been noted when comparing SEF’s toelectrical stimuli with those evoked by airpuffs [48].
Additionally, SA evoked on average a stronger brain response than EA, particularly at longlatencies (> 80ms). This may have resulted from differences in the number and/or type ofsomatosensory fibers recruited. Although, the relatively rapid onset of sensory SEFs (< 40 ms)suggests that both EA and SA signals are carried at least in part by fast Aβ sensory fibers, it ispossible that the relatively larger surface area of the SA tip excited more superficial sensoryfibers than EA. Furthermore, EA (because of its electrical and invasive nature) may have moreoften resulted in concurrent activation of superficial and/or deep pain fibers, thus, decreasingthe dynamic range between a qualitatively “strong but not painful” and a painful stimulus.Differences in the magnitude of brain response to acupuncture vs. non-invasive controlstimulation have also been noted in fMRI studies and attributed to possible differences insignaling pathways [18, 49].
Analysis of the deqi experience during acupuncture was determined using the MASS indexSubjects tended to report stronger deqi for EA than SA. To assess the possible relation between
Dhond et al. Page 8
J Altern Complement Med. Author manuscript; available in PMC 2008 September 29.
NIH
-PA Author Manuscript
NIH
-PA Author Manuscript
NIH
-PA Author Manuscript
differences in intensity ratings for different sensations and individual brain responses weperformed a correlation analysis. However, no significant correlation was found. Furthermore,the similarity of deqi sensations experienced were similar for both SA and EA regardless ofwhich sensations subjects expected to be feel (as reported in pre-scan questionnaires).Similarly, previous acupuncture research has demonstrated that expectancy does notsignificantly bias which sensations subjects will actually experience during acupuncture [50].
Potential relevance of differences in brain responses to EA and SAAlthough the present study does not test the clinical efficacy of EA and SA, previous clinicaldata demonstrate that acupuncture may have therapeutic effects on chronic pain [51, 52].Recent fMRI studies propose that acupuncture efficacy in carpal tunnel syndrome (CTS) issupported by the somatosensory stimulation provided during acupuncture treatment [53]. Morespecifically, aberrant sensory signaling resulting from nerve entrapment in CTS may causemaladaptive plasticity within SI cortex, symptoms of pain and allodynia, and SI hyperactivitydemonstrated by stronger fMRI signals. One possibility is that the somatosensory signalsarising from acupuncture stimulation counteract these effects by providing a more constantsensory input to promote normal/healthy plasticity [53].
The present study demonstrates that brain SEFs to EA and SA strongly involve SI cortex.Potential differences in efficacy between these modalities may be linked to their respectivetemporal dynamics and how they may influence mechanisms of neuronal plasticity. Forexample, early SEFs to EA demonstrate temporally succinct activity (peaks), thus it is possiblethat EA provides a more temporally synchronous firing of sensory cells leading to moreefficient Hebbian type plasticity. It is also possible that EA may be more effective than SA asit evokes response within deep as well as superficial receptors which may all be affected inchronic pain syndromes. However, there are no clinical electrophysiological data to supportthis assumption. Furthermore, there is no consensus on what form of sham acupuncture is mostappropriate and thus other forms may be more or less similar to verum acupuncture, leadingto variable clinical response.
Interpreting SEFs in the context of acupuncture fMRI dataIn order to elucidate brain processing of acupuncture stimuli, researchers have also utilizedfMRI. Data from these studies demonstrate that acupuncture stimulation elicits response withinmultiple cortical, subcortical, limbic and brainstem areas [for review see1, 18, 49, 54-58].Although, it may appear that the present data demonstrating localization of evoked MEG brainresponse to SI cortex conflicts with previous fMRI findings of distributed brain response toacupuncture, it is important to acknowledge differences in imaging modality and experimentaldesign/analysis that may affect which brain areas appear to be active during acupuncture. Forinstance, differences may have resulted both from the short inter-stimulus interval employed[34, 36] as well as the fact that fMRI and MEG observe different aspects of brain “activity” [fora brief review see 1]. Furthermore, to evaluate potential MEG activity outside of SI at thepresent stimulation frequency, different analysis approaches may also be needed. Indeed ourpreliminary data assessing oscillatory (rhythmic) brain activity in different frequency bandssuggests that during EA there is a strong decrease in induced mu rhythms (8-30Hz) from∼50-350 ms post-stimulus within the contralateral SI, bilateral SII, parieto-occipital regionsand in some cases frontal areas [59, 60] all overlapping with cortical areas implicated inacupuncture fMRI studies.
CONCLUSIONThe present data offer insights into spatiotemporal differences in brain response to EA and SA.Both EA and SA evoked brain responses that were located within the contralateral primary
Dhond et al. Page 9
J Altern Complement Med. Author manuscript; available in PMC 2008 September 29.
NIH
-PA Author Manuscript
NIH
-PA Author Manuscript
NIH
-PA Author Manuscript
somatosensory (SI) cortex. However, initial responses for EA peaked slightly earlier than thosefor SA and were located inferiorly within SI. The average equivalent current dipole (ECD)strength was stronger (particularly at latencies > 100ms) for SA. These spatiotemporaldifferences between EA and SA are likely attributable to stimulus modality (electrical vs.mechanical) and differences in the underlying somatosensory fibers transmitting these signals.
AcknowledgementsThis research was supported by grants from NIH-NCCAM (K01-AT004481, P01-AT002048, K01-AT002166),NCRR (P41-RR14075), and the Mental Illness and Neuroscience Discovery (MIND) Institute. We thank SimonSigalovsky for help constructing the sham acupuncture device and Bruce Rosen, Dimitrios Pantazis and Richard Leahyfor helpful discussion on this manuscript.
References1. Dhond RP, Kettner N, Napadow V. Neuroimaging acupuncture effects in the human brain. J Altern
Complement Med 2007;13(6):603–16. [PubMed: 17718643]2. Ikezono E, et al. The effects of acupuncture needling on the evoked responses of brain, spinal cord and
muscle in man. Am J Chin Med (Gard City N Y) 1976;4(1):53–9. [PubMed: 1266801]3. Kang DX, Ma BR, Lundervold A. The effect of acupuncture on somatosensory evoked potentials. Clin
Electroencephalogr 1983;14(1):53–6. [PubMed: 6831735]4. Chen RC, Hung TP. Acupuncture: its effect on somatosensory cerebral evoked potentials in man.
Taiwan Yi Xue Hui Za Zhi 1975;74(5):341–4. [PubMed: 1059727]5. Litscher G. Effects of acupressure, manual acupuncture and Laserneedle acupuncture on EEG
bispectral index and spectral edge frequency in healthy volunteers. Eur J Anaesthesiol 2004;21(1):13–9. [PubMed: 14768918]
6. Yamauchi N, et al. Effects of electrical acupuncture on human somatosensory evoked potentials.Yonago Acta Med 1976;20(3):158–66. [PubMed: 1032856]
7. Wei H, et al. Early-latency somatosensory evoked potentials elicited by electrical acupuncture afterneedling acupoint LI-4. Clin Electroencephalogr 2000;31(3):160–4. [PubMed: 10923205]
8. Chapman CR, et al. Event-related potential correlates of analgesia; comparison of fentanyl,acupuncture, and nitrous oxide. Pain 1982;14(4):327–37. [PubMed: 7162837]
9. Meissner W, et al. Acupuncture decreases somatosensory evoked potential amplitudes to noxiousstimuli in anesthetized volunteers. Anesth Analg 2004;98(1):141–7. [PubMed: 14693608]table ofcontents
10. Chapman CR, et al. Effects of nitrous oxide, transcutaneous electrical stimulation, and theircombination on brain potentials elicited by painful stimulation. Anesthesiology 1983;58(3):250–6.[PubMed: 6600887]
11. Chernyak G, et al. The timing of acupuncture stimulation does not influence anesthetic requirement.Anesth Analg 2005;100(2):387–92. [PubMed: 15673863]
12. Yamauchi N, et al. The effects of electrical acupuncture on human somatosensory evoked potentialsand spontaneous brain waves. Yonago Acta Med 1976;20(2):88–100. [PubMed: 1025937]
13. Xu X, Shibasaki H, Shindo K. Effects of acupuncture on somatosensory evoked potentials: a review.J Clin Neurophysiol 1993;10(3):370–7. [PubMed: 8408602]
14. Oldfield RC. The assessment and analysis of handedness: the Edinburgh inventory. Neuropsychologia1971;9(1):97–113. [PubMed: 5146491]
15. Xinnong, C. Chinese Acupuncture and Moxibustion. Beijing Foreign Languages Press; Beijing: 1996.p. 590
16. Hamalainen, M.; Hari, R. Magnetoencephalographic Characterization of Dynamic Brain Activation:Basic Principles and Methods of Data Collection and Source Analysis. In: Toga, AW.; Mazziotta,JC., editors. Brain Mapping: The Methods. Academic Press; San Diego: 2002. Ch 10
17. Sherman KJ, et al. Description and validation of a noninvasive placebo acupuncture procedure. JAltern Complement Med 2002;8(1):11–9. [PubMed: 11890429]
Dhond et al. Page 10
J Altern Complement Med. Author manuscript; available in PMC 2008 September 29.
NIH
-PA Author Manuscript
NIH
-PA Author Manuscript
NIH
-PA Author Manuscript
18. Napadow V, et al. Effects of electroacupuncture versus manual acupuncture on the human brain asmeasured by fMRI. Hum Brain Mapp 2005;24(3):193–205. [PubMed: 15499576]
19. Kong J, et al. Acupuncture deqi, from qualitative history to quantitative measurement. J AlternComplement Med. 2007In Press
20. Hamalainen, MS.; Ilmoniemi, RJ. Interpreting measured magnetic fields of the brain: Estimates ofcurrent distribution. University of Technology, Dept. of Technical Physics Report TKK-F-A559;Helsinki: 1984.
21. Lin FH, et al. Assessing and improving the spatial accuracy in MEG source localization by depth-weighted minimum-norm estimates. Neuroimage 2006;31(1):160–71. [PubMed: 16520063]
22. Dale AM, Fischl B, Sereno MI. Cortical surface-based analysis I: Segmentation and surfacereconstruction. NeuroImage 1999;9(2):179–94. [PubMed: 9931268]
23. Fischl B, Sereno MI, Dale AM. Cortical surface-based analysis. II: Inflation, flattening, and a surface-based coordinate system. Neuroimage 1999;9(2):195–207. [PubMed: 9931269]
24. Fischl B, et al. High-resolution intersubject averaging and a coordinate system for the cortical surface.Hum Brain Mapp 1999;8(4):272–84. [PubMed: 10619420]
25. deMunck JC. A linear dicretization of the volume conductor boundary integral equation usinganalytically integrated elements. IEEE Transactions on Biomedical Engineering 1992;39:986–990.[PubMed: 1473829]
26. Oostendorp, TF.; Van Oosterom, A.; Nenonen, J. Source parameter estimation using realisticgeometry in bioelectricity and biomagnetism, in Biomagnetic Localization and 3D Modeling. Rajala,HM.; Katila, T., editors. Helsinky Univ. of Technology, Rport TKK-F-A689; Helsinki: 1992.
27. Dale AM, et al. Dynamic statistical parametric mapping: combining fMRI and MEG for high-resolution imaging of cortical activity. Neuron 2000;26(1):55–67. [PubMed: 10798392]
28. Dale AM, Sereno MI. Improved localization of cortical activity by combining EEG and MEG withMRI cortical surface reconstruction: A linear approach. Journal of Cognitive Neuroscience1993;5:162–176.
29. Liu AK, Belliveau JW, Dale AM. Spatiotemporal imaging of human brain activity using fMRIconstrained MEG data: Monte Carlo simulations. Proceedings of the National Academy of Sciencesof the United States of America 1998;95:8945–8950. [PubMed: 9671784]
30. Dhond RP, et al. Spatiotemporal maps of brain activity underlying word generation and theirmodification during repetition priming. J Neurosci 2001;21(10):3564–71. [PubMed: 11331385]
31. Chung MK, et al. Cortical thickness analysis in autism with heat kernel smoothing. Neuroimage2005;25(4):1256–65. [PubMed: 15850743]
32. Pantazis D, et al. A comparison of random field theory and permutation methods for the statisticalanalysis of MEG data. Neuroimage 2005;25(2):383–94. [PubMed: 15784416]
33. Hämäläinen MS, et al. Magnetoencephalography - theory, instrumentation, and applications tononinvasive studies of the working human brain. Reviews of Modern Physics 1993;65:413–497.
34. Mauguiere F, et al. Activation of a distributed somatosensory cortical network in the human brain: adipole modelling study of magnetic fields evoked by median nerve stimulation. Part II: Effects ofstimulus rate, attention and stimulus detection. Electroencephalogr Clin Neurophysiol 1997;104(4):290–5. [PubMed: 9246066]
35. Mauguiere F, et al. Activation of a distributed somatosensory cortical network in the human brain.A dipole modelling study of magnetic fields evoked by median nerve stimulation. Part I: Locationand activation timing of SEF sources. Electroencephalogr Clin Neurophysiol 1997;104(4):281–9.[PubMed: 9246065]
36. Wikstrom H, et al. Effects of interstimulus interval on somatosensory evoked magnetic fields (SEFs):a hypothesis concerning SEF generation at the primary sensorimotor cortex. Electroencephalogr ClinNeurophysiol 1996;100(6):479–87. [PubMed: 8980411]
37. Allison T, et al. Cortical somatosensory evoked potentials. II. Effects of excision of somatosensoryor motor cortex in humans and monkeys. J Neurophysiol 1991;66(1):64–82. [PubMed: 1919677]
38. Tiihonen J, Hari R, Hamalainen M. Early deflections of cerebral magnetic responses to median nervestimulation. Electroencephalogr Clin Neurophysiol 1989;74(4):290–6. [PubMed: 2471630]
Dhond et al. Page 11
J Altern Complement Med. Author manuscript; available in PMC 2008 September 29.
NIH
-PA Author Manuscript
NIH
-PA Author Manuscript
NIH
-PA Author Manuscript
39. Allison T, McCarthy G, Wood CC. The relationship between human long-latency somatosensoryevoked potentials recorded from the cortical surface and from the scalp. Electroencephalogr ClinNeurophysiol 1992;84(4):301–14. [PubMed: 1377999]
40. Netter, FH. Atlas of Human Anatomy. Colacino, S., editor. Ciba-Geigy Corporation; Summit, NewJersey: 1995. p. 550
41. Penfield W, Boldrey E. Somatic motor and sensory representationin the cerebral cortex of man asstudied by electrical stimulation. Brain 1937;60:389–443.
42. Woolsey CN, Erickson TC, Gilson WE. Localization in somatic sensory and motor areas of humancerebral cortex as determined by direct recording of evoked potentials and electrical stimulation. JNeurosurg 1979;51(4):476–506. [PubMed: 479934]
43. Narici L, et al. Neuromagnetic somatosensory homunculus: a non-invasive approach in humans.Neurosci Lett 1991;121(12):51–4. [PubMed: 2020390]
44. Kakigi R, et al. The somatosensory evoked magnetic fields. Prog Neurobiol 2000;61(5):495–523.[PubMed: 10748321]
45. Nakamura A, et al. Somatosensory homunculus as drawn by MEG. Neuroimage 1998;7(4 Pt 1):377–86. [PubMed: 9626677]
46. Yang TT, et al. Noninvasive somatosensory homunculus mapping in humans by using a large-arraybiomagnetometer. Proc Natl Acad Sci U S A 1993;90(7):3098–102. [PubMed: 8464929]
47. Kakigi R, Shibasaki H. Scalp topography of the short latency somatosensory evoked potentialsfollowing posterior tibial nerve stimulation in man. Electroencephalogr Clin Neurophysiol 1983;56(5):430–7. [PubMed: 6194959]
48. Forss N, Salmelin R, Hari R. Comparison of somatosensory evoked fields to airpuff and electricstimuli. Electroencephalogr Clin Neurophysiol 1994;92(6):510–7. [PubMed: 7527769]
49. Hui KK, et al. Acupuncture modulates the limbic system and subcortical gray structures of the humanbrain: evidence from fMRI studies in normal subjects. Hum Brain Mapp 2000;9(1):13–25. [PubMed:10643726]
50. Park H, Park J, Lee H. Does Deqi (needle sensation) exist? Am J Chin Med 2002;30(1):45–50.[PubMed: 12067096]
51. Berman BM, et al. Effectiveness of acupuncture as adjunctive therapy in osteoarthritis of the knee: arandomized, controlled trial. Ann Intern Med 2004;141(12):901–10. [PubMed: 15611487]
52. Manheimer E, et al. Acupuncture for knee osteoarthritis--a randomised trial using a novel sham.Acupunct Med 2006;24(Suppl):S7–14. [PubMed: 17308513]
53. Napadow V, et al. Somatosensory cortical plasticity in carpal tunnel syndrome treated by acupuncture.Hum Brain Mapp 2007;28(3):159–71. [PubMed: 16761270]
54. Hsieh JC, et al. Brain activation by acupuncture with “de-qi”: a PET study. J Nuc Med 1998;39(5suppl):205p.
55. Wu MT, et al. Central nervous pathway for acupuncture stimulation: localization of processing withfunctional MR imaging of the brain--preliminary experience. Radiology 1999;212(1):133–41.[PubMed: 10405732]
56. Pariente J, et al. Expectancy and belief modulate the neuronal substrates of pain treated byacupuncture. Neuroimage 2005;25(4):1161–7. [PubMed: 15850733]
57. Wu MT, et al. Neuronal specificity of acupuncture response: a fMRI study with electroacupuncture.Neuroimage 2002;16(4):1028–37. [PubMed: 12202090]
58. Cho ZH, et al. Acupuncture: the search for biologic evidence with functional magnetic resonanceimaging and positron emission tomography techniques. J Altern Complement Med 2002;8(4):399–401. [PubMed: 12230898]
59. Dhond, R., et al. Society for Acupuncture Research. Baltimore, USA: 2007. Mapping the NeuralCorrelates of Acupuncture with Magnetoencephalography.
60. Dhond, R., et al. Human Brain Mapping. Chicago, USA: 2007. Spatiotemporal Mapping the NeuralCorrelates of Acupuncture.
Dhond et al. Page 12
J Altern Complement Med. Author manuscript; available in PMC 2008 September 29.
NIH
-PA Author Manuscript
NIH
-PA Author Manuscript
NIH
-PA Author Manuscript

FIGURE 1. Experimental Design and the Arm Brace(A) Each MEG scan consisted of 3 rest runs and 2 acupuncture runs (EA and SA). Acupuncturerun order was randomized across subjects and consisted of 15 minutes continuous lowfrequency (2Hz) stimulation. During each 10 minute rest run MEG was recorded while subjectssat quietly. (B) During EA and SA subjects wore an MEG compatible arm brace to reduce handmovement. The brace was equipped with a piezo-driven stimulator (dashed black circle).(C) An enlarged image of the piezo-driven stimulator. The stimulator was anchored to the armbut adjustable so that the stimulation-tip (black arrow) could be placed at the correct positionon the skin surface. A rectangular opening in the brace allowed access to underlying acupoints.
Dhond et al. Page 13
J Altern Complement Med. Author manuscript; available in PMC 2008 September 29.
NIH
-PA Author Manuscript
NIH
-PA Author Manuscript
NIH
-PA Author Manuscript
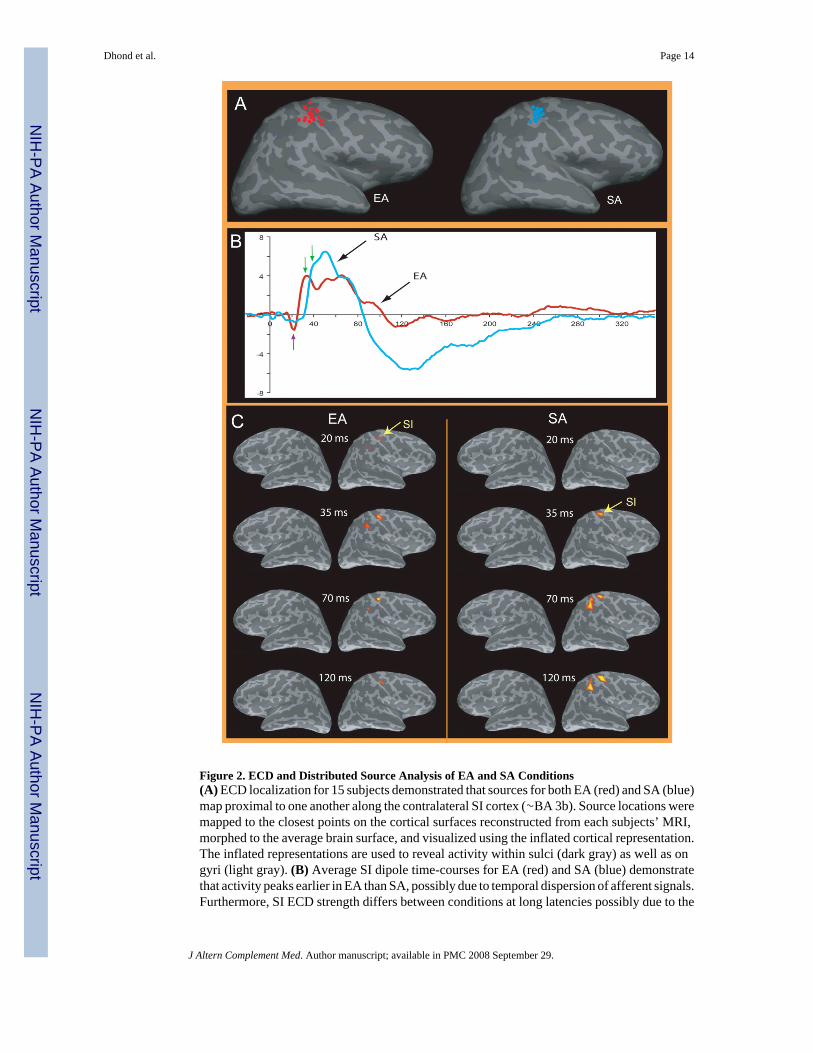
Figure 2. ECD and Distributed Source Analysis of EA and SA Conditions(A) ECD localization for 15 subjects demonstrated that sources for both EA (red) and SA (blue)map proximal to one another along the contralateral SI cortex (∼BA 3b). Source locations weremapped to the closest points on the cortical surfaces reconstructed from each subjects’ MRI,morphed to the average brain surface, and visualized using the inflated cortical representation.The inflated representations are used to reveal activity within sulci (dark gray) as well as ongyri (light gray). (B) Average SI dipole time-courses for EA (red) and SA (blue) demonstratethat activity peaks earlier in EA than SA, possibly due to temporal dispersion of afferent signals.Furthermore, SI ECD strength differs between conditions at long latencies possibly due to the
Dhond et al. Page 14
J Altern Complement Med. Author manuscript; available in PMC 2008 September 29.
NIH
-PA Author Manuscript
NIH
-PA Author Manuscript
NIH
-PA Author Manuscript
number and/or type of somatosensory fibers recruited. (C) The image shows distributed sourcemodelling results averaged across subjects and displayed on an average brain surface. Thesedata confirm that the primary sources of MEG activity are within the contralateral centralsulcus. The first significant peak for EA (∼20ms) occurs earlier than that for SA (∼35-40ms)and is located in a slightly more inferior position along the posterior bank of the central sulcus.Response peaks are also seen at ∼70ms and ∼120ms within SI cortex for both EA and SA.Activity returns to baseline by ∼250ms. Thresholds for the activity shown were selected tocontrol the family wise error rate (FWER) to be at 5%.
Dhond et al. Page 15
J Altern Complement Med. Author manuscript; available in PMC 2008 September 29.
NIH
-PA Author Manuscript
NIH
-PA Author Manuscript
NIH
-PA Author Manuscript
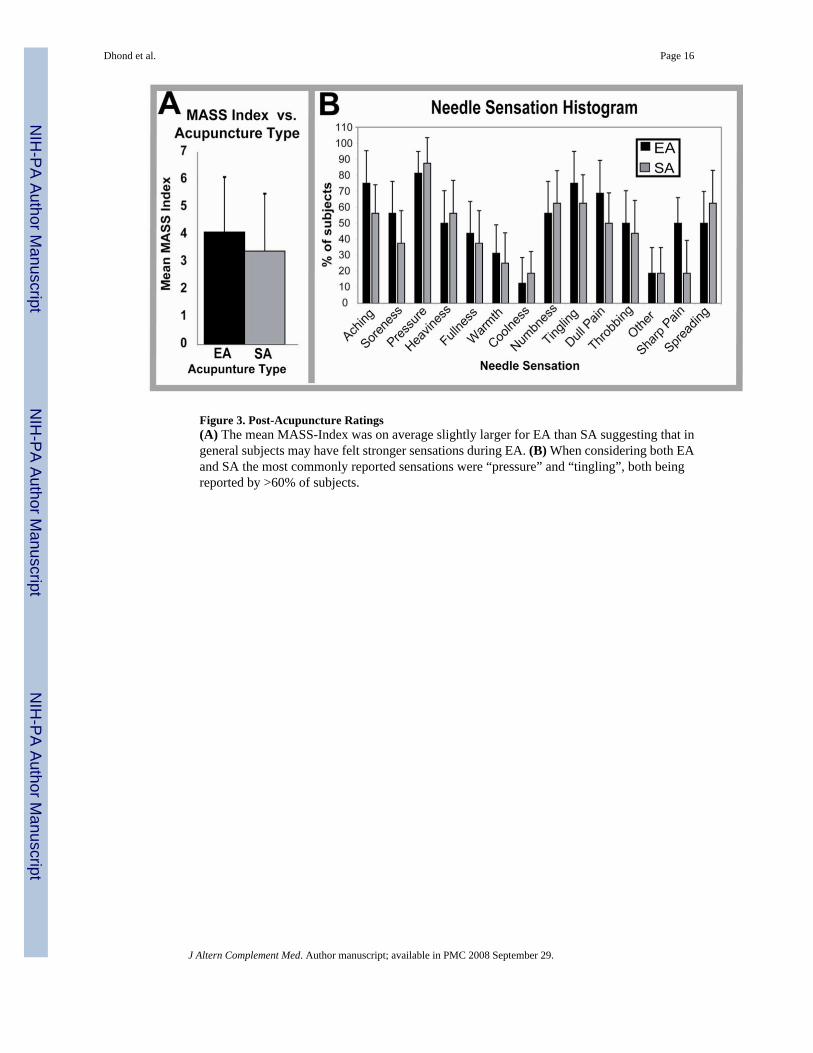
Figure 3. Post-Acupuncture Ratings(A) The mean MASS-Index was on average slightly larger for EA than SA suggesting that ingeneral subjects may have felt stronger sensations during EA. (B) When considering both EAand SA the most commonly reported sensations were “pressure” and “tingling”, both beingreported by >60% of subjects.
Dhond et al. Page 16
J Altern Complement Med. Author manuscript; available in PMC 2008 September 29.
NIH
-PA Author Manuscript
NIH
-PA Author Manuscript
NIH
-PA Author Manuscript