Embed Size (px)
Citation preview
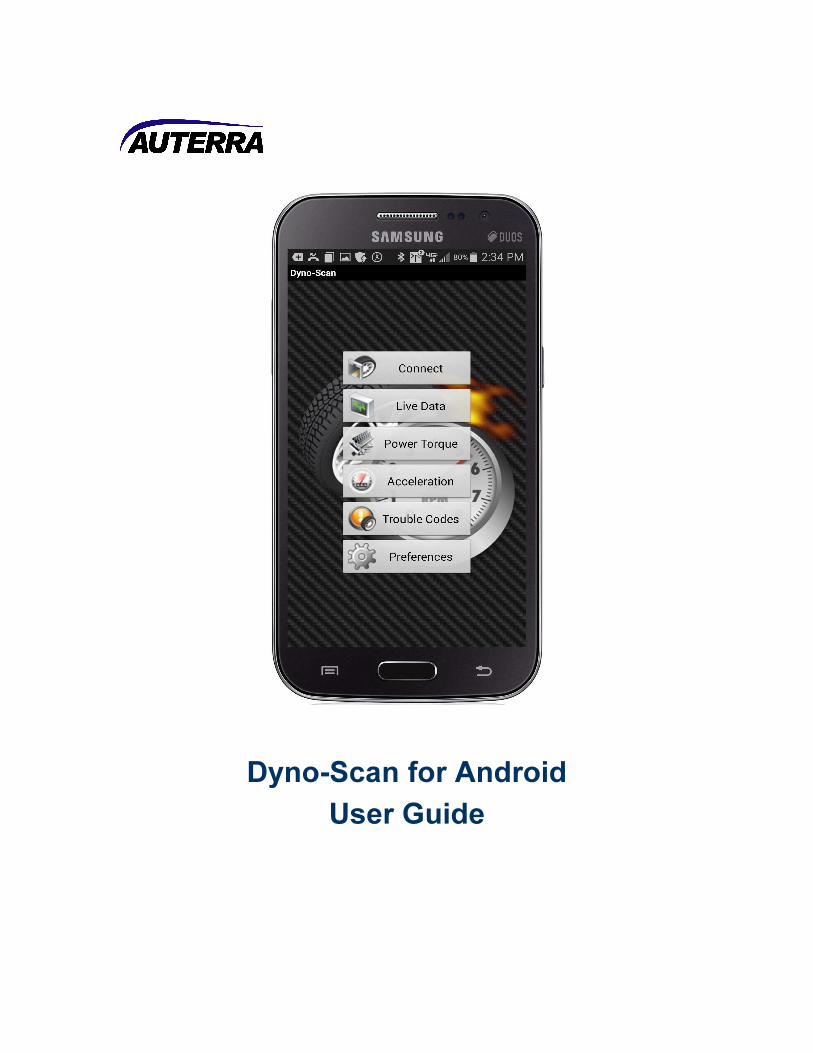
Dyno-Scan for Android
User Guide
ii
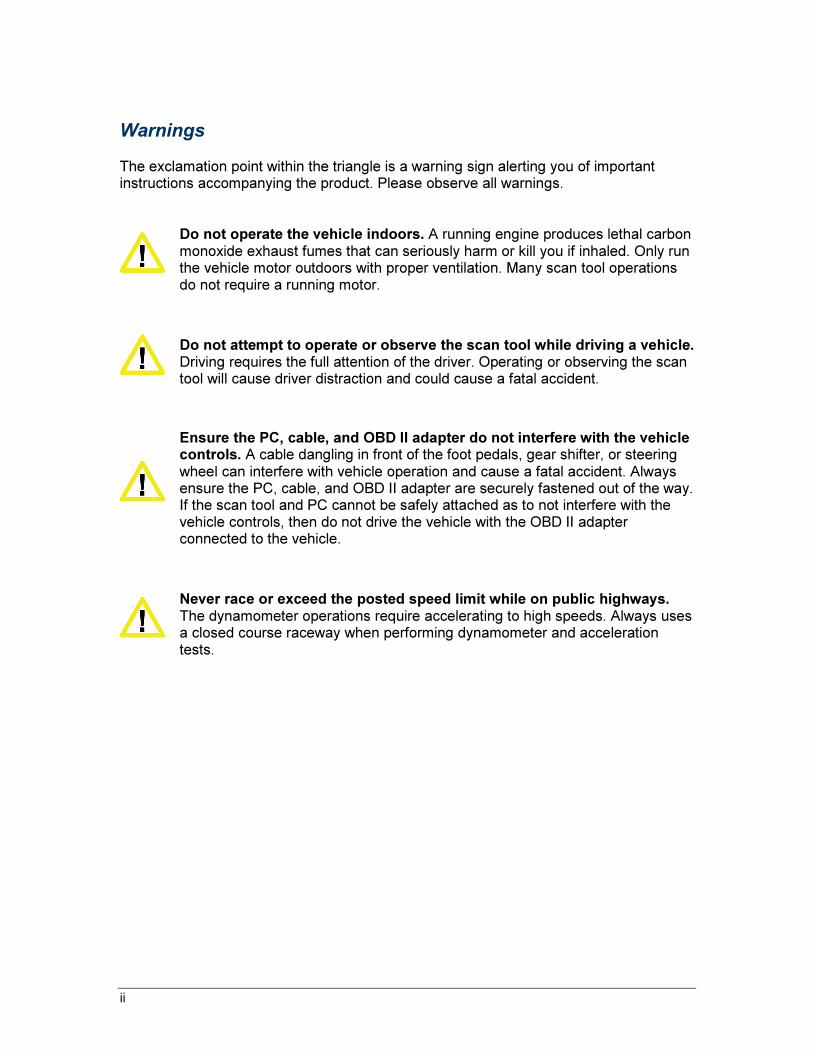
Warnings The exclamation point within the triangle is a warning sign alerting you of important instructions accompanying the product. Please observe all warnings.
Do not operate the vehicle indoors. A running engine produces lethal carbon monoxide exhaust fumes that can seriously harm or kill you if inhaled. Only run the vehicle motor outdoors with proper ventilation. Many scan tool operations do not require a running motor.
Do not attempt to operate or observe the scan tool while driving a vehicle. Driving requires the full attention of the driver. Operating or observing the scan tool will cause driver distraction and could cause a fatal accident.
Ensure the PC, cable, and OBD II adapter do not interfere with the vehicle controls. A cable dangling in front of the foot pedals, gear shifter, or steering wheel can interfere with vehicle operation and cause a fatal accident. Always ensure the PC, cable, and OBD II adapter are securely fastened out of the way. If the scan tool and PC cannot be safely attached as to not interfere with the vehicle controls, then do not drive the vehicle with the OBD II adapter connected to the vehicle.
Never race or exceed the posted speed limit while on public highways. The dynamometer operations require accelerating to high speeds. Always uses a closed course raceway when performing dynamometer and acceleration tests.
iii Table of Contents
Terms of Use
The Software contains proprietary and confidential information that is protected by applicable intellectual property and other laws. You may not modify or sell works based on the Software.
The Software is for your personal use. We grant you a personal and non-exclusive license to use the object code version of the Software on a single Windows-based personal computer; provided that you do not (and do not allow any third party to) copy, modify, reverse engineer, create derivative works from, assign or otherwise transfer any right in the Software; and you will not modify the Software by any means.
Disclaimer
The “Product” is the complete Dyno-Scan for Windows product including hardware, software, user manual, and packaging.
Auterra, LLC assumes no responsibility for any loss or claim by third parties which arise through the use of this Product. Auterra, LLC assumes no responsibility for any damage or loss caused by deletion of data as a result of a Product malfunction. Be sure to backup copies of all important data on other media to protect against data loss.
The Software, and all accompanying files, data and materials, are provided "as is" without warranty of any kind, either expressed or implied, including, but not limited to, the implied warranties of merchantability and fitness for a particular purpose. The entire risk as to the quality and performance of the Software is with you. Should the Software prove defective, you assume the cost of all necessary servicing, repair or correction.
AUTERRA, OR ITS PRINCIPALS, SHAREHOLDERS, OFFICERS, EMPLOYEES, AFFILIATES, CONTRACTORS, SUBSIDIARIES, OR PARENT ORGANIZATIONS, SHALL NOT BE LIABLE FOR ANY INCIDENTAL, INDIRECT OR CONSEQUENTIAL DAMAGES OR OTHER DAMAGES INCLUDING BUT NOT LIMITED TO, LOSS OF PROFITS, LOSS OF REVENUE, LOSS OF DATA, LOSS OF USE OF THE PRODUCT OR ANY ASSOCIATED EQUIPMENT, DOWNTIME AND CONSUMER’S TIME OR FOR BREACH OF ANY EXPRESS OR IMPLIED WARRANTY OR CONDITION, DAMAGE TO THE VEHICLE, BREACH OF CONTRACT, NEGLIGENCE, STRICT LIABILITY OR ANY OTHER LEGAL THEORY RELATED TO THIS PRODUCT.
Copyright
1998-2014 Auterra, LLC. All rights reserved.
Trademarks
Windows® is a registered trademark of Microsoft Corporation. Google and Google Earth are trademarks of Google Inc.
i
Table of Contents
Table of Contents i
Preface 1
Key Features 1
Minimum Android Requirements 2
Installing Android Software 3
Software Installation 3
OBD II Adapter Connections 3
Bluetooth Pairing 3
Live Data 5
Connect to Vehicle 5
Sleep Disabled 6
Options Menu 6
Switching Screens 7
Live Data Screen 7
Live Data Options Menu 8
Live Data Options Context Menu 11
Live Data Screen Gestures 16
Graph Widget Gestures 16
Gauge Widget Gestures 17
Meter Widget Gestures 17
Supported Parameters 17
Dyno Operation 25
Theory of Operation 25
Dyno-Scan for Android 26
Dynamometer Getting Started 26
Dyno Files 27
Dyno Run Screen 27
ii Table of Contents
Edit Dyno Setup File Screen 30
Measure Gear Ratio Screen 31
Adjusting Dyno Setup Parameters after Recording 34
Drag Coefficient and Frontal Area 34
Calculation of Frontal Area 35
Automatic Transmissions 35
Trouble Codes 36
View Trouble Codes 36
Clear Trouble Codes 37
Stored and Pending Diagnostic Trouble Codes 38
Preferences 40
Vehicle Speed Correction 41
Distance Correction 42
MPG Correction 42
Boost Calibration 43
Engine Size 44
Windows PC Software 45
File Types 45
Copy Files to PC 45
Open Live Data File on PC 46
Open Power Torque File on PC 47
Open Acceleration File on PC 47
Open Dyno Setup File on PC 48
Troubleshooting 49
Scan Tool Connects but No Live Data 49
No Communication (Scan Tool) 49
No Communication (Vehicle) 49
Lost Communication 49
Live Data Screen Is Blank 50
Clearing Codes Did Not Work or MIL Didn’t Turn Off 50
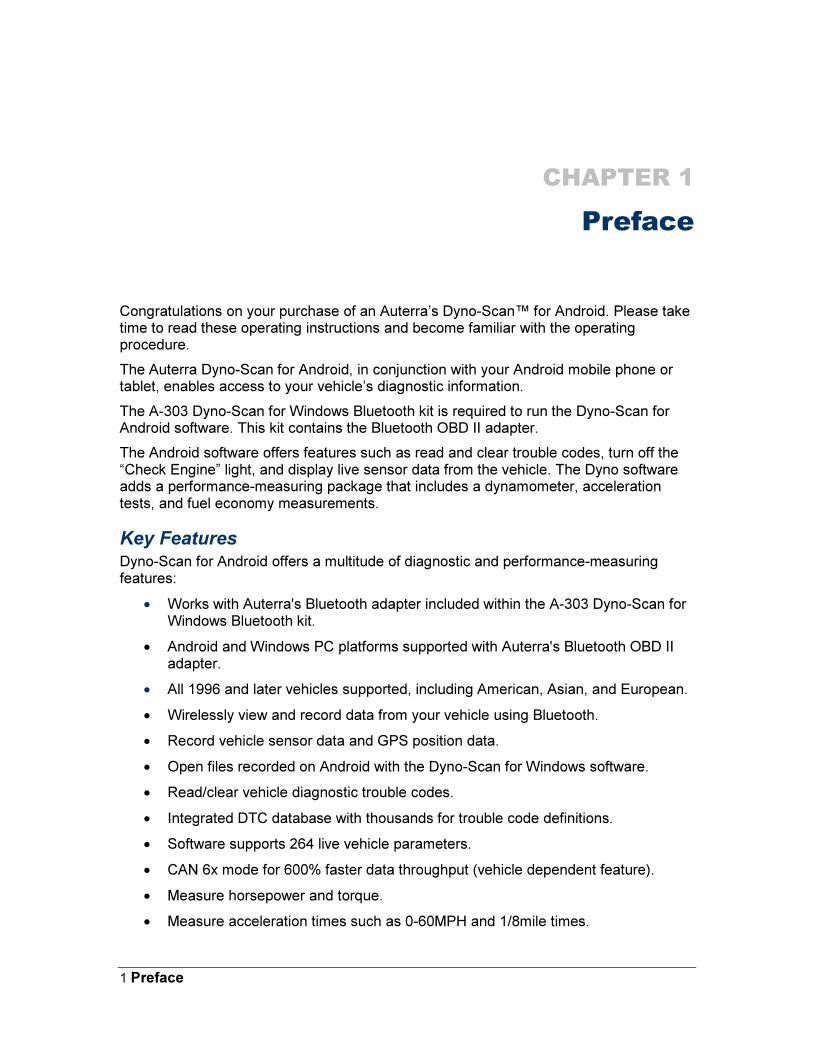
1 Preface
CHAPTER 1
Preface
Congratulations on your purchase of an Auterra’s Dyno-Scan™ for Android. Please take time to read these operating instructions and become familiar with the operating procedure.
The Auterra Dyno-Scan for Android, in conjunction with your Android mobile phone or tablet, enables access to your vehicle’s diagnostic information.
The A-303 Dyno-Scan for Windows Bluetooth kit is required to run the Dyno-Scan for Android software. This kit contains the Bluetooth OBD II adapter.
The Android software offers features such as read and clear trouble codes, turn off the “Check Engine” light, and display live sensor data from the vehicle. The Dyno software adds a performance-measuring package that includes a dynamometer, acceleration tests, and fuel economy measurements.
Key Features Dyno-Scan for Android offers a multitude of diagnostic and performance-measuring features:
• Works with Auterra's Bluetooth adapter included within the A-303 Dyno-Scan for Windows Bluetooth kit.
• Android and Windows PC platforms supported with Auterra's Bluetooth OBD II adapter.
• All 1996 and later vehicles supported, including American, Asian, and European.
• Wirelessly view and record data from your vehicle using Bluetooth.
• Record vehicle sensor data and GPS position data.
• Open files recorded on Android with the Dyno-Scan for Windows software.
• Read/clear vehicle diagnostic trouble codes.
• Integrated DTC database with thousands for trouble code definitions.
• Software supports 264 live vehicle parameters.
• CAN 6x mode for 600% faster data throughput (vehicle dependent feature).
• Measure horsepower and torque.
• Measure acceleration times such as 0-60MPH and 1/8mile times.
2 Preface
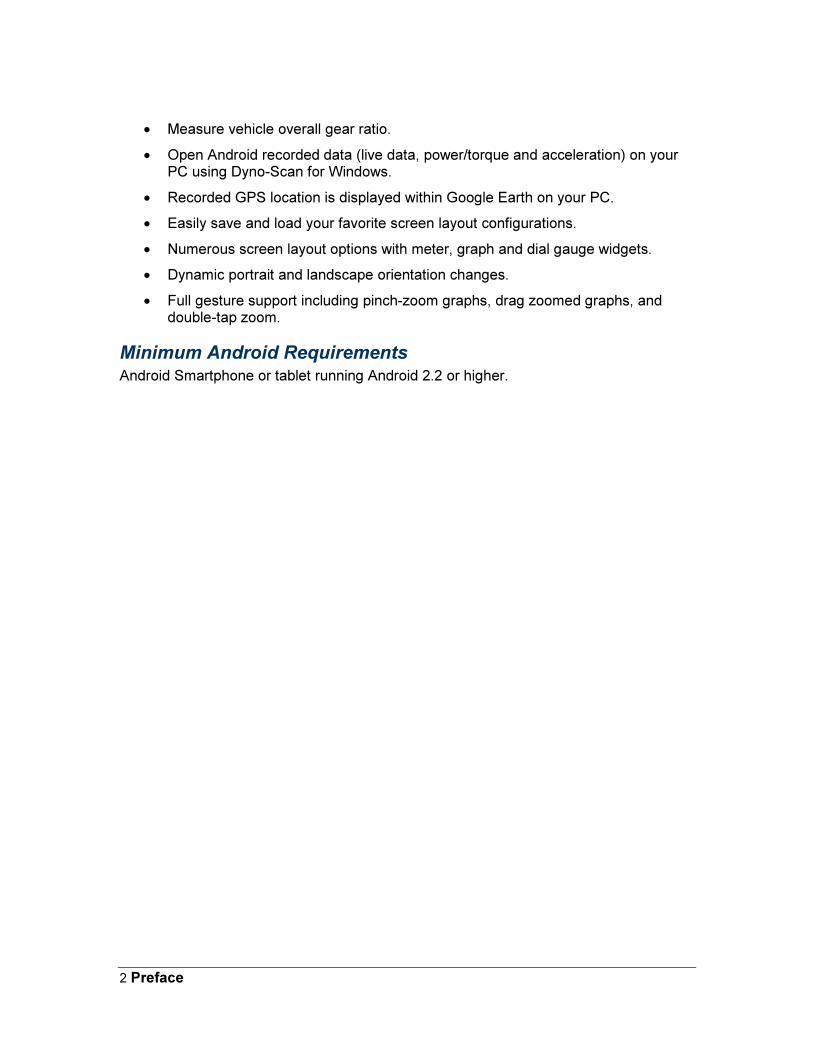
• Measure vehicle overall gear ratio.
• Open Android recorded data (live data, power/torque and acceleration) on your PC using Dyno-Scan for Windows.
• Recorded GPS location is displayed within Google Earth on your PC.
• Easily save and load your favorite screen layout configurations.
• Numerous screen layout options with meter, graph and dial gauge widgets.
• Dynamic portrait and landscape orientation changes.
• Full gesture support including pinch-zoom graphs, drag zoomed graphs, and double-tap zoom.
Minimum Android Requirements Android Smartphone or tablet running Android 2.2 or higher.

3 Installing Android Software
CHAPTER 2
Installing Android Software
Installing the Dyno-Scan for Android software and pairing the OBD II adapter is easy. This section shows you how.
Software Installation
The Dyno-Scan for Android software is loaded onto your Android device using the Google Play Store application on your smart device.
1 Start the Google Play Store application on your Android.
2 Search for "DynoScan".
3 Install the free Dyno-Scan application.
http://play.google.com/store/apps/details?id=com.auterra.dynoscan
OBD II Adapter Connections 1 Plug the OBD II cable and Bluetooth OBD II adapter together using the 9-pin
connector.
2 Plug the OBD II cable into the vehicle's OBD II connector. The 16-pin OBD II connector is usually located in plain sight underneath the dash near the driver’s seat. It may also be located behind ashtrays.
3 Turn the vehicle ignition ON (the vehicle does not have to be running). The Bluetooth OBD II is now powered and ready for use.
Bluetooth Pairing Auterra's Bluetooth OBD II adapter must be paired with your Android device in order to communicate. The pairing process is as follows:
1 Plug the Bluetooth OBD II adapter into your vehicle’s OBD II connector.
2 Turn the vehicle ignition ON (the vehicle does not have to be running). The Bluetooth OBD II adapter is now automatically placed into discovery mode.
3 Go to the Bluetooth settings on your Android device.
4 Turn on the Bluetooth feature.

4 Installing Android Software
5 Select "Scan" to scan for new devices. The OBD II adapter device name is either BT42-nnnn or RN42-nnnn (where nnnn is a letter/number combination unique to each Bluetooth OBD II adapter).
6 Select the new device and pair the Bluetooth OBD II adapter. If prompted, the passkey (or pairing key) is: 1234
7 Your OBD II adapter is connected and ready for use. Note, you only need to pair one time and not each time you use the OBD II adapter.
5 Live Data
CHAPTER 3
Live Data
Getting started with your Dyno-Scan for Android software is easy and this section shows you how.
Connect to Vehicle
The Android device must be already paired with the Auterra OBD II Bluetooth adapter. If you have not paired already, please refer to section Bluetooth Pairing.
1 Ensure your Android device has the Bluetooth option enabled.
2 Plug the Bluetooth OBD II adapter into your vehicle’s OBD II connector.
3 Turn the vehicle ignition ON (the vehicle does not have to be running).
4 Start the Dyno-Scan application on your Android.
5 Press the Preferences button.
6 Ensure the Demo Mode checkbox is unchecked.
7 Go back to the Main Menu screen.
8 Press the Connect button. The software will then connect to the vehicle.
6 Live Data
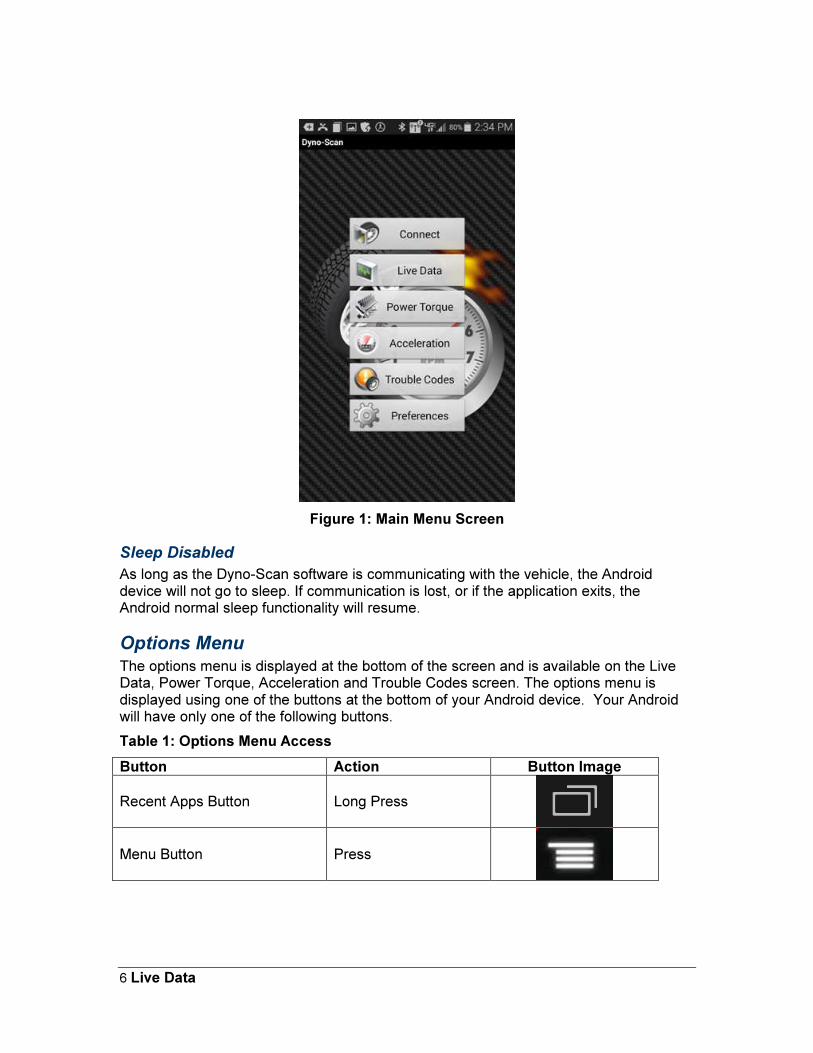
Figure 1: Main Menu Screen
Sleep Disabled
As long as the Dyno-Scan software is communicating with the vehicle, the Android device will not go to sleep. If communication is lost, or if the application exits, the Android normal sleep functionality will resume.
Options Menu The options menu is displayed at the bottom of the screen and is available on the Live Data, Power Torque, Acceleration and Trouble Codes screen. The options menu is displayed using one of the buttons at the bottom of your Android device. Your Android will have only one of the following buttons.
Table 1: Options Menu Access
Button Action Button Image
Recent Apps Button Long Press
Menu Button Press
7 Live Data
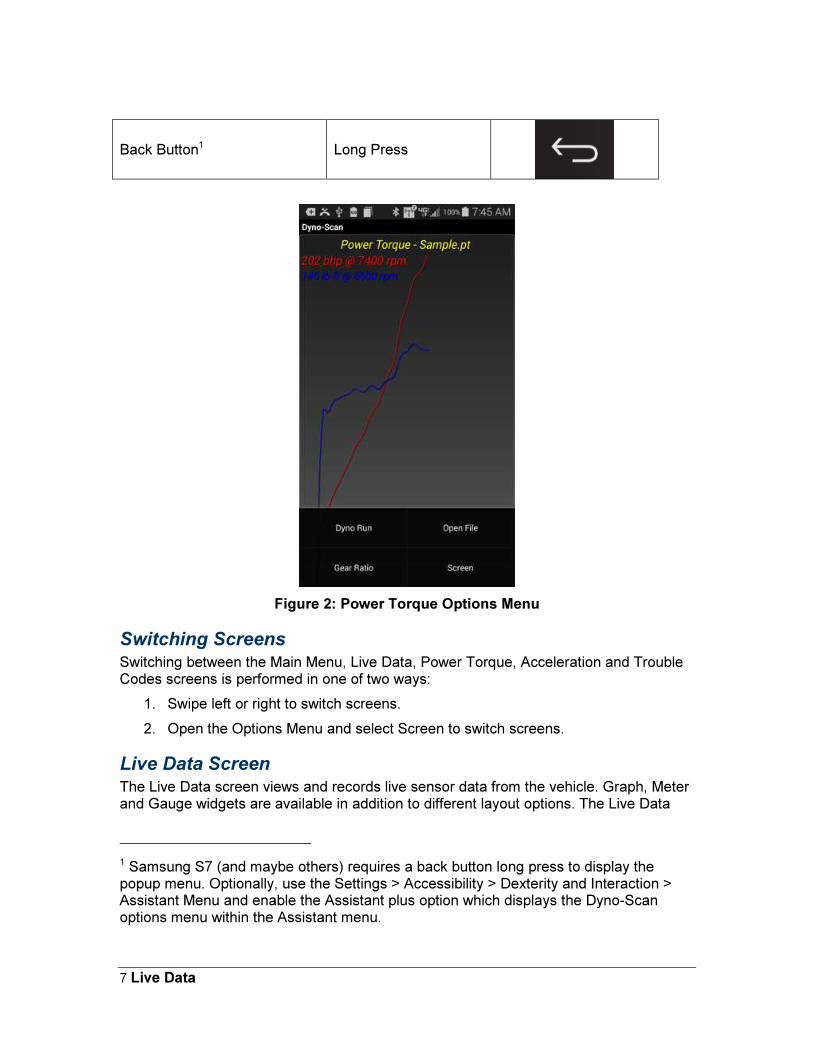
Back Button1 Long Press
Figure 2: Power Torque Options Menu
Switching Screens Switching between the Main Menu, Live Data, Power Torque, Acceleration and Trouble Codes screens is performed in one of two ways:
1. Swipe left or right to switch screens.
2. Open the Options Menu and select Screen to switch screens.
Live Data Screen The Live Data screen views and records live sensor data from the vehicle. Graph, Meter and Gauge widgets are available in addition to different layout options. The Live Data
1 Samsung S7 (and maybe others) requires a back button long press to display the popup menu. Optionally, use the Settings > Accessibility > Dexterity and Interaction > Assistant Menu and enable the Assistant plus option which displays the Dyno-Scan options menu within the Assistant menu.

8 Live Data
screen supports multiple gestures such as long press, double tap, pinch zoom, drag and swipe.
Figure 3: Live Data Screen
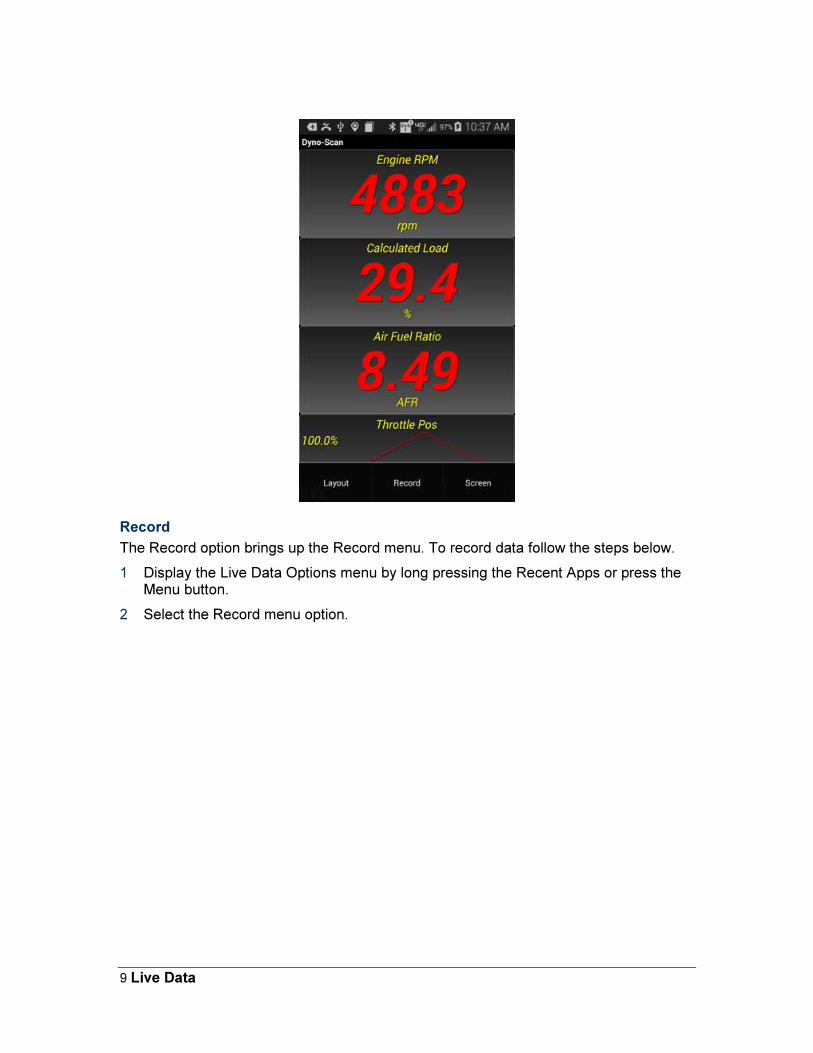
Live Data Options Menu
The Live Data options menu is displayed by long pressing the Recent Apps or Menu button. This menu has three options: Layout, Record and Screen.
9 Live Data
Record
The Record option brings up the Record menu. To record data follow the steps below.
1 Display the Live Data Options menu by long pressing the Recent Apps or press the Menu button.
2 Select the Record menu option.
10 Live Data
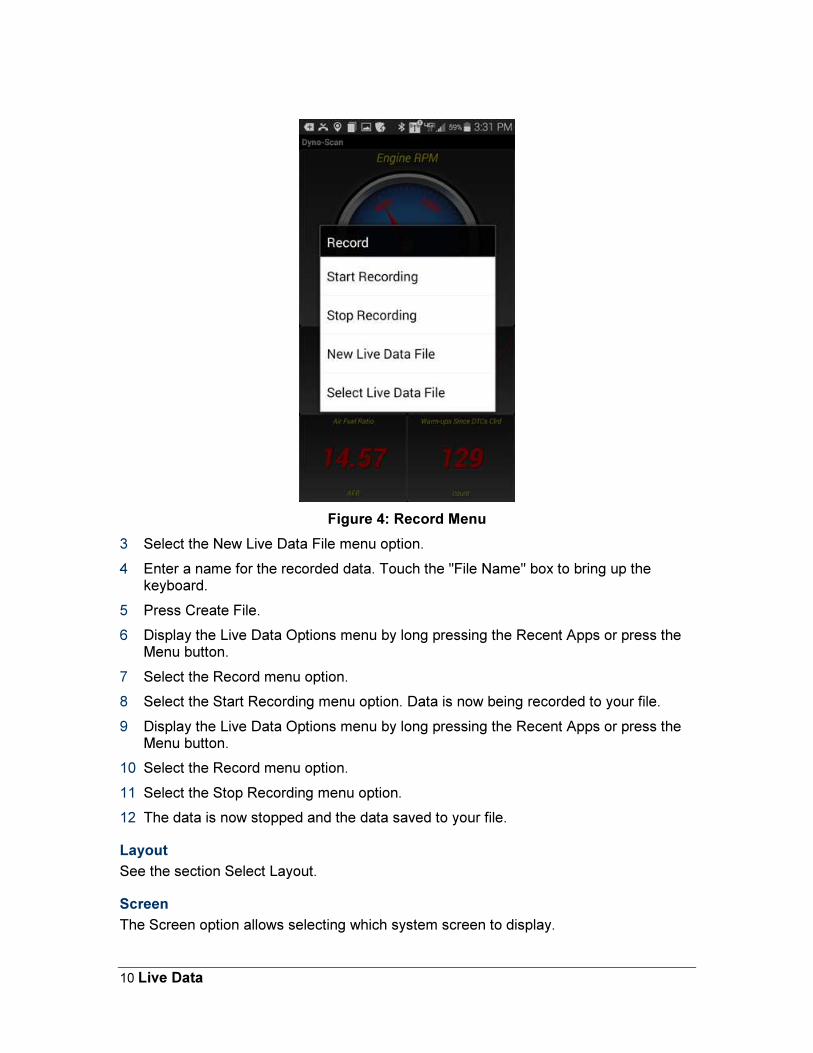
Figure 4: Record Menu
3 Select the New Live Data File menu option.
4 Enter a name for the recorded data. Touch the "File Name" box to bring up the keyboard.
5 Press Create File.
6 Display the Live Data Options menu by long pressing the Recent Apps or press the Menu button.
7 Select the Record menu option.
8 Select the Start Recording menu option. Data is now being recorded to your file.
9 Display the Live Data Options menu by long pressing the Recent Apps or press the Menu button.
10 Select the Record menu option.
11 Select the Stop Recording menu option.
12 The data is now stopped and the data saved to your file.
Layout
See the section Select Layout.
Screen
The Screen option allows selecting which system screen to display.
11 Live Data
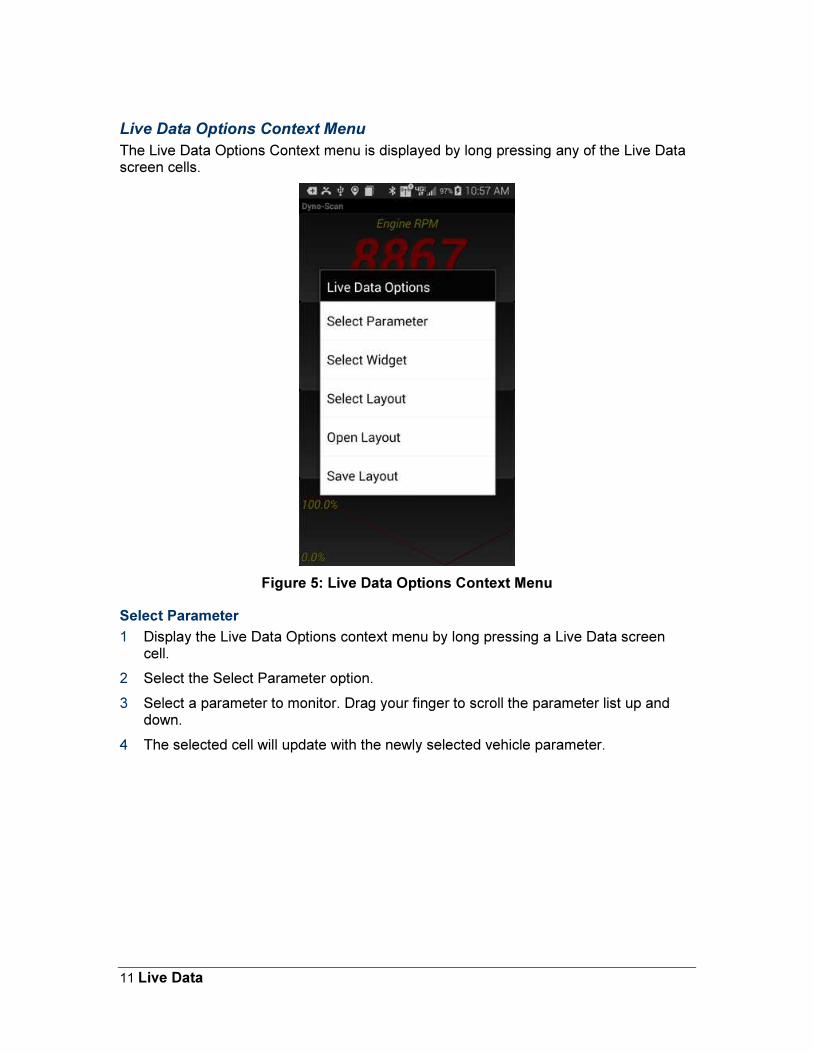
Live Data Options Context Menu
The Live Data Options Context menu is displayed by long pressing any of the Live Data screen cells.
Figure 5: Live Data Options Context Menu
Select Parameter
1 Display the Live Data Options context menu by long pressing a Live Data screen cell.
2 Select the Select Parameter option.
3 Select a parameter to monitor. Drag your finger to scroll the parameter list up and down.
4 The selected cell will update with the newly selected vehicle parameter.
12 Live Data
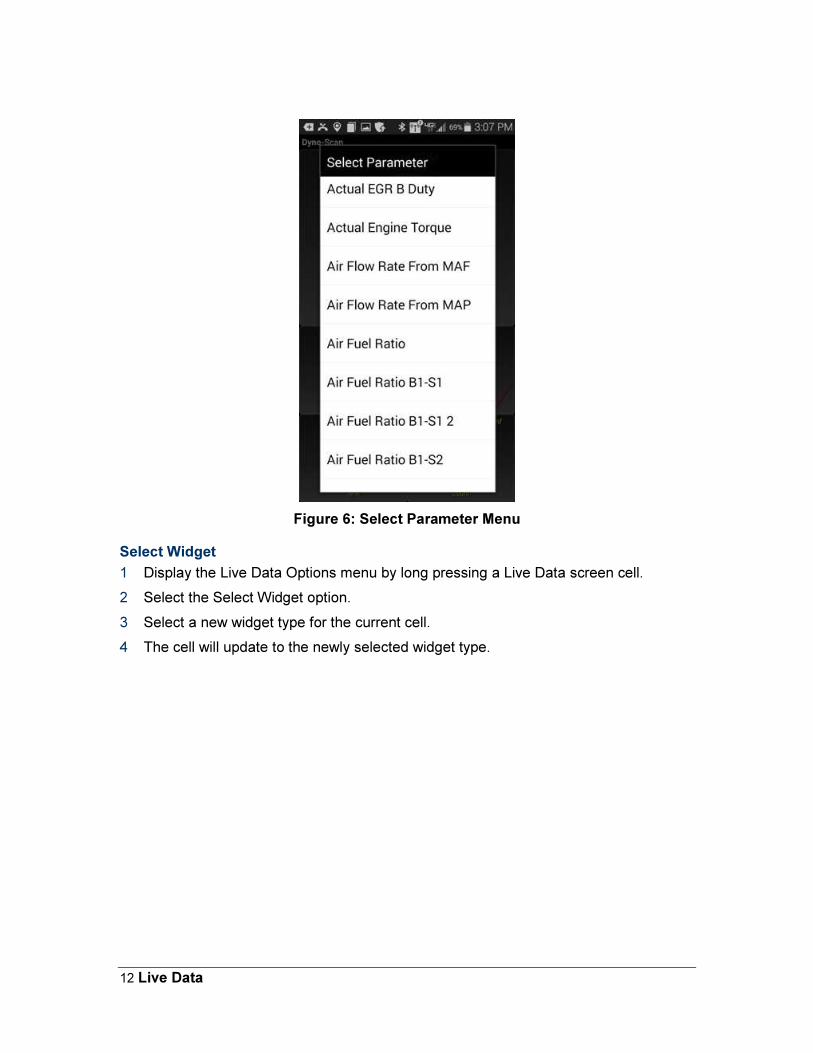
Figure 6: Select Parameter Menu
Select Widget
1 Display the Live Data Options menu by long pressing a Live Data screen cell.
2 Select the Select Widget option.
3 Select a new widget type for the current cell.
4 The cell will update to the newly selected widget type.
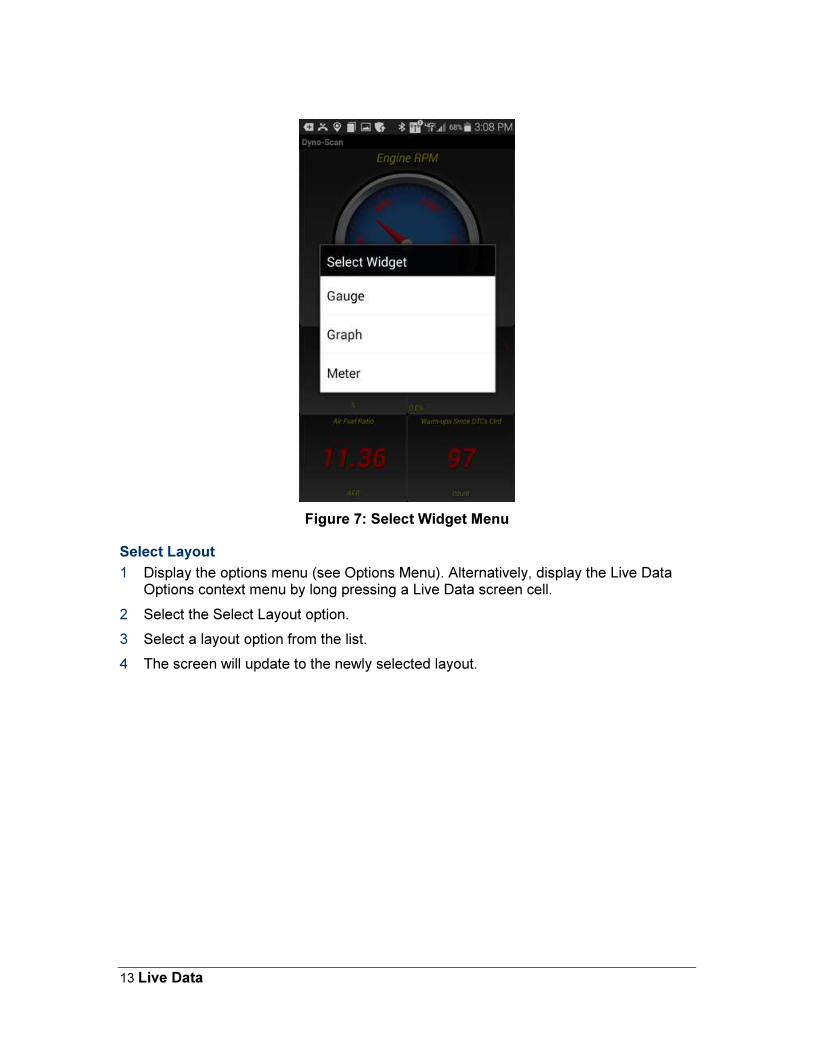
13 Live Data
Figure 7: Select Widget Menu
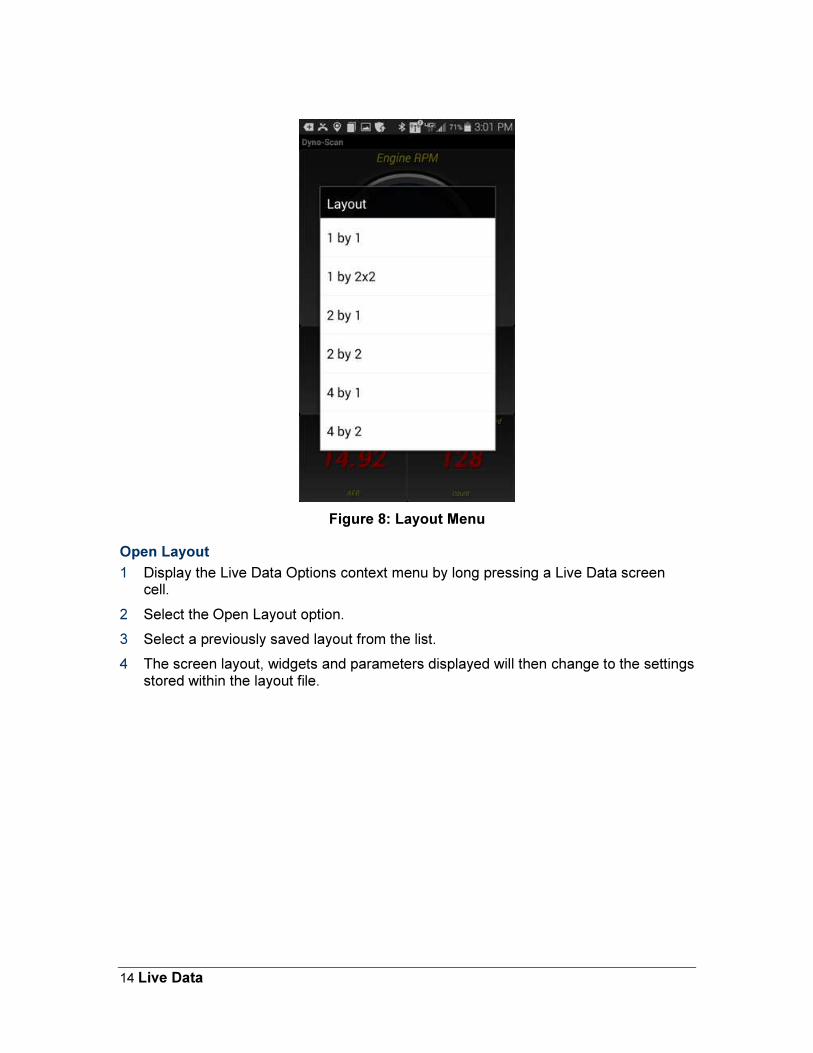
Select Layout
1 Display the options menu (see Options Menu). Alternatively, display the Live Data Options context menu by long pressing a Live Data screen cell.
2 Select the Select Layout option.
3 Select a layout option from the list.
4 The screen will update to the newly selected layout.
14 Live Data
Figure 8: Layout Menu
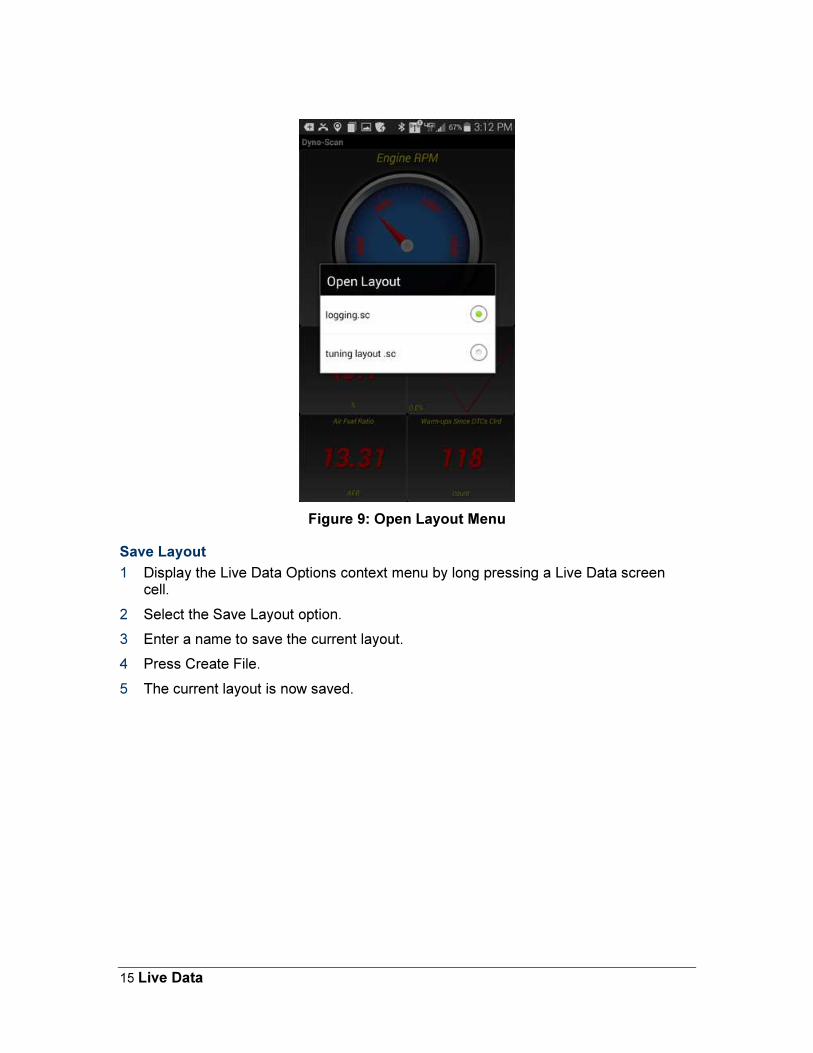
Open Layout
1 Display the Live Data Options context menu by long pressing a Live Data screen cell.
2 Select the Open Layout option.
3 Select a previously saved layout from the list.
4 The screen layout, widgets and parameters displayed will then change to the settings stored within the layout file.
15 Live Data
Figure 9: Open Layout Menu
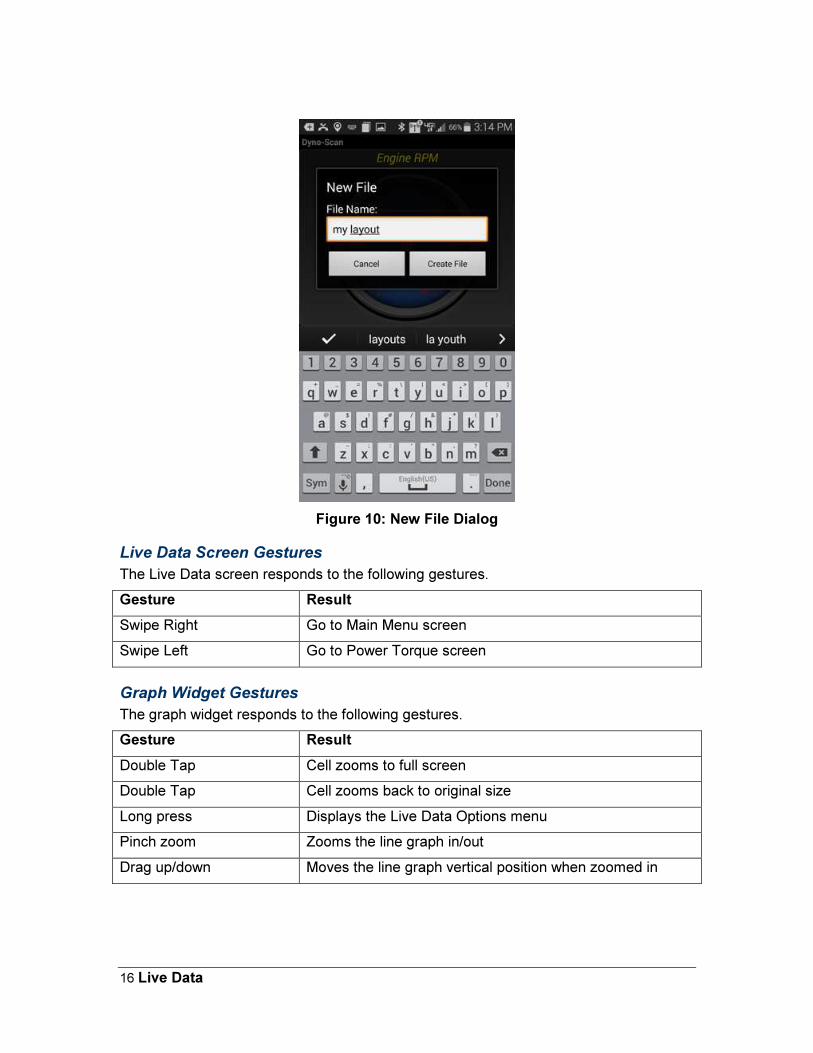
Save Layout
1 Display the Live Data Options context menu by long pressing a Live Data screen cell.
2 Select the Save Layout option.
3 Enter a name to save the current layout.
4 Press Create File.
5 The current layout is now saved.
16 Live Data
Figure 10: New File Dialog
Live Data Screen Gestures
The Live Data screen responds to the following gestures.
Gesture Result
Swipe Right Go to Main Menu screen
Swipe Left Go to Power Torque screen
Graph Widget Gestures
The graph widget responds to the following gestures.
Gesture Result
Double Tap Cell zooms to full screen
Double Tap Cell zooms back to original size
Long press Displays the Live Data Options menu
Pinch zoom Zooms the line graph in/out
Drag up/down Moves the line graph vertical position when zoomed in
17 Live Data
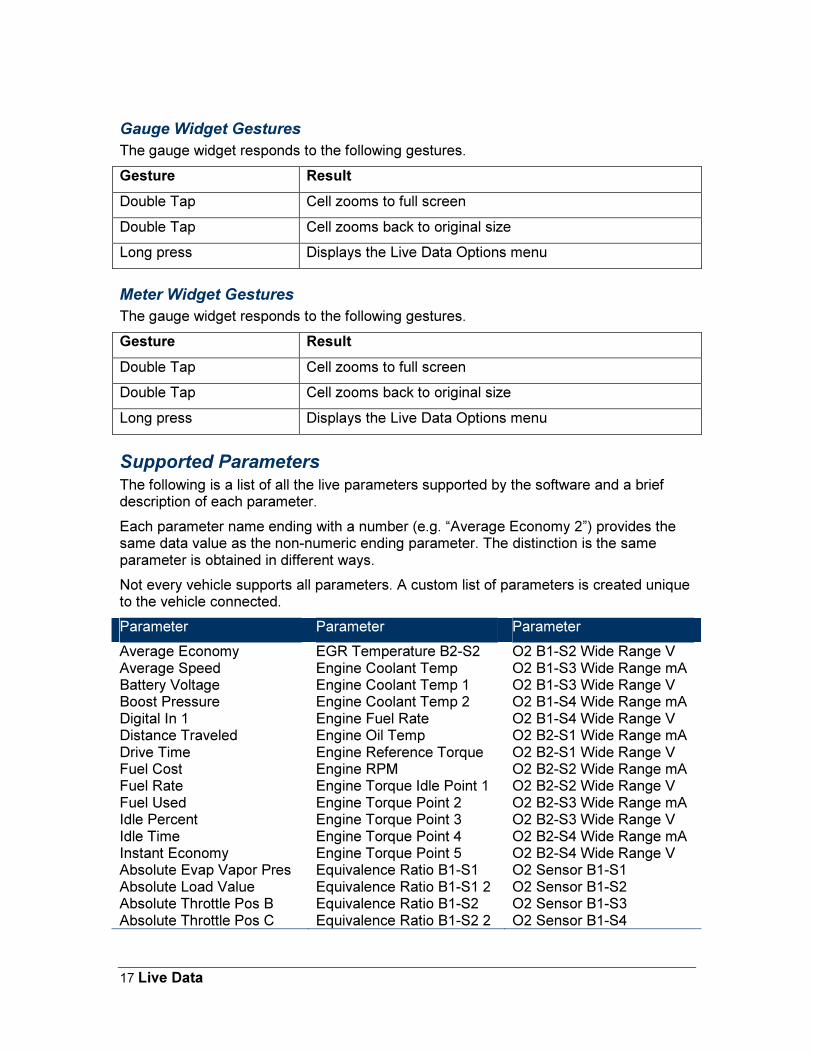
Gauge Widget Gestures
The gauge widget responds to the following gestures.
Gesture Result
Double Tap Cell zooms to full screen
Double Tap Cell zooms back to original size
Long press Displays the Live Data Options menu
Meter Widget Gestures
The gauge widget responds to the following gestures.
Gesture Result
Double Tap Cell zooms to full screen
Double Tap Cell zooms back to original size
Long press Displays the Live Data Options menu
Supported Parameters The following is a list of all the live parameters supported by the software and a brief description of each parameter.
Each parameter name ending with a number (e.g. “Average Economy 2”) provides the same data value as the non-numeric ending parameter. The distinction is the same parameter is obtained in different ways.
Not every vehicle supports all parameters. A custom list of parameters is created unique to the vehicle connected.
Parameter Parameter Parameter
Average Economy Average Speed Battery Voltage Boost Pressure Digital In 1 Distance Traveled Drive Time Fuel Cost Fuel Rate Fuel Used Idle Percent Idle Time Instant Economy Absolute Evap Vapor Pres Absolute Load Value Absolute Throttle Pos B Absolute Throttle Pos C
EGR Temperature B2-S2 Engine Coolant Temp Engine Coolant Temp 1 Engine Coolant Temp 2 Engine Fuel Rate Engine Oil Temp Engine Reference Torque Engine RPM Engine Torque Idle Point 1 Engine Torque Point 2 Engine Torque Point 3 Engine Torque Point 4 Engine Torque Point 5 Equivalence Ratio B1-S1 Equivalence Ratio B1-S1 2 Equivalence Ratio B1-S2 Equivalence Ratio B1-S2 2
O2 B1-S2 Wide Range V O2 B1-S3 Wide Range mA O2 B1-S3 Wide Range V O2 B1-S4 Wide Range mA O2 B1-S4 Wide Range V O2 B2-S1 Wide Range mA O2 B2-S1 Wide Range V O2 B2-S2 Wide Range mA O2 B2-S2 Wide Range V O2 B2-S3 Wide Range mA O2 B2-S3 Wide Range V O2 B2-S4 Wide Range mA O2 B2-S4 Wide Range V O2 Sensor B1-S1 O2 Sensor B1-S2 O2 Sensor B1-S3 O2 Sensor B1-S4
18 Live Data
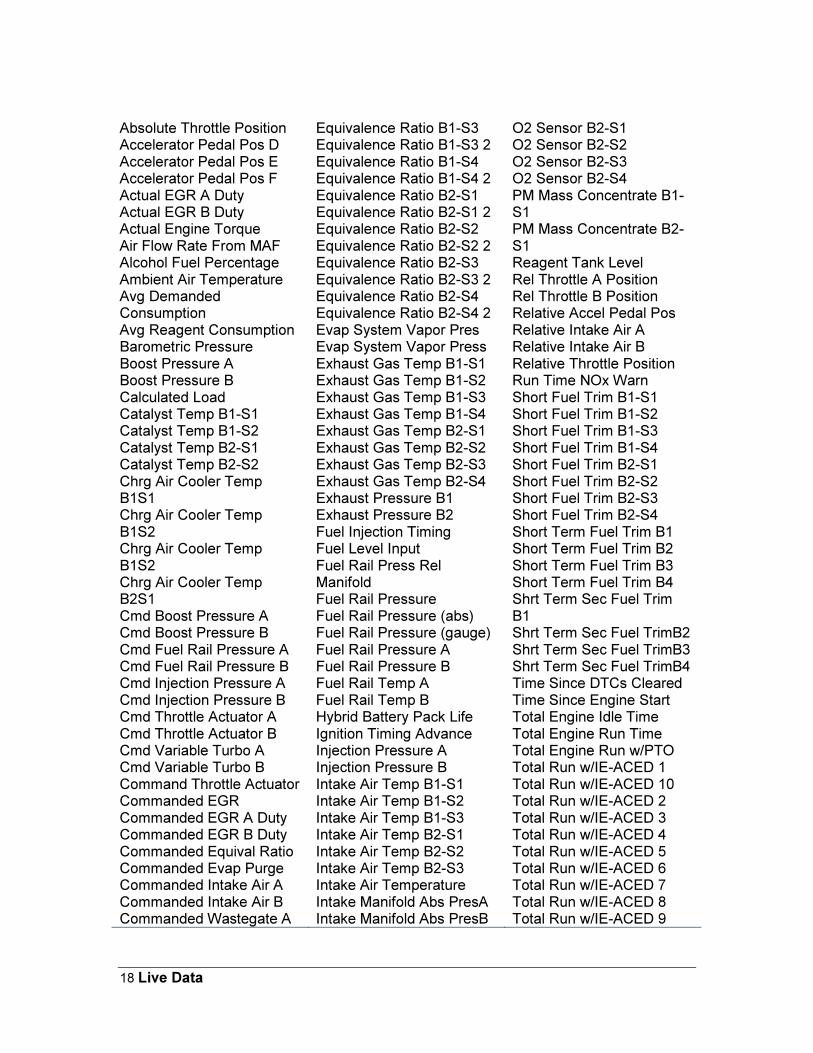
Absolute Throttle Position Accelerator Pedal Pos D Accelerator Pedal Pos E Accelerator Pedal Pos F Actual EGR A Duty Actual EGR B Duty Actual Engine Torque Air Flow Rate From MAF Alcohol Fuel Percentage Ambient Air Temperature Avg Demanded Consumption Avg Reagent Consumption Barometric Pressure Boost Pressure A Boost Pressure B Calculated Load Catalyst Temp B1-S1 Catalyst Temp B1-S2 Catalyst Temp B2-S1 Catalyst Temp B2-S2 Chrg Air Cooler Temp B1S1 Chrg Air Cooler Temp B1S2 Chrg Air Cooler Temp B1S2 Chrg Air Cooler Temp B2S1 Cmd Boost Pressure A Cmd Boost Pressure B Cmd Fuel Rail Pressure A Cmd Fuel Rail Pressure B Cmd Injection Pressure A Cmd Injection Pressure B Cmd Throttle Actuator A Cmd Throttle Actuator B Cmd Variable Turbo A Cmd Variable Turbo B Command Throttle Actuator Commanded EGR Commanded EGR A Duty Commanded EGR B Duty Commanded Equival Ratio Commanded Evap Purge Commanded Intake Air A Commanded Intake Air B Commanded Wastegate A
Equivalence Ratio B1-S3 Equivalence Ratio B1-S3 2 Equivalence Ratio B1-S4 Equivalence Ratio B1-S4 2 Equivalence Ratio B2-S1 Equivalence Ratio B2-S1 2 Equivalence Ratio B2-S2 Equivalence Ratio B2-S2 2 Equivalence Ratio B2-S3 Equivalence Ratio B2-S3 2 Equivalence Ratio B2-S4 Equivalence Ratio B2-S4 2 Evap System Vapor Pres Evap System Vapor Press Exhaust Gas Temp B1-S1 Exhaust Gas Temp B1-S2 Exhaust Gas Temp B1-S3 Exhaust Gas Temp B1-S4 Exhaust Gas Temp B2-S1 Exhaust Gas Temp B2-S2 Exhaust Gas Temp B2-S3 Exhaust Gas Temp B2-S4 Exhaust Pressure B1 Exhaust Pressure B2 Fuel Injection Timing Fuel Level Input Fuel Rail Press Rel Manifold Fuel Rail Pressure Fuel Rail Pressure (abs) Fuel Rail Pressure (gauge) Fuel Rail Pressure A Fuel Rail Pressure B Fuel Rail Temp A Fuel Rail Temp B Hybrid Battery Pack Life Ignition Timing Advance Injection Pressure A Injection Pressure B Intake Air Temp B1-S1 Intake Air Temp B1-S2 Intake Air Temp B1-S3 Intake Air Temp B2-S1 Intake Air Temp B2-S2 Intake Air Temp B2-S3 Intake Air Temperature Intake Manifold Abs PresA Intake Manifold Abs PresB
O2 Sensor B2-S1 O2 Sensor B2-S2 O2 Sensor B2-S3 O2 Sensor B2-S4 PM Mass Concentrate B1-S1 PM Mass Concentrate B2-S1 Reagent Tank Level Rel Throttle A Position Rel Throttle B Position Relative Accel Pedal Pos Relative Intake Air A Relative Intake Air B Relative Throttle Position Run Time NOx Warn Short Fuel Trim B1-S1 Short Fuel Trim B1-S2 Short Fuel Trim B1-S3 Short Fuel Trim B1-S4 Short Fuel Trim B2-S1 Short Fuel Trim B2-S2 Short Fuel Trim B2-S3 Short Fuel Trim B2-S4 Short Term Fuel Trim B1 Short Term Fuel Trim B2 Short Term Fuel Trim B3 Short Term Fuel Trim B4 Shrt Term Sec Fuel Trim B1 Shrt Term Sec Fuel TrimB2 Shrt Term Sec Fuel TrimB3 Shrt Term Sec Fuel TrimB4 Time Since DTCs Cleared Time Since Engine Start Total Engine Idle Time Total Engine Run Time Total Engine Run w/PTO Total Run w/IE-ACED 1 Total Run w/IE-ACED 10 Total Run w/IE-ACED 2 Total Run w/IE-ACED 3 Total Run w/IE-ACED 4 Total Run w/IE-ACED 5 Total Run w/IE-ACED 6 Total Run w/IE-ACED 7 Total Run w/IE-ACED 8 Total Run w/IE-ACED 9
19 Live Data
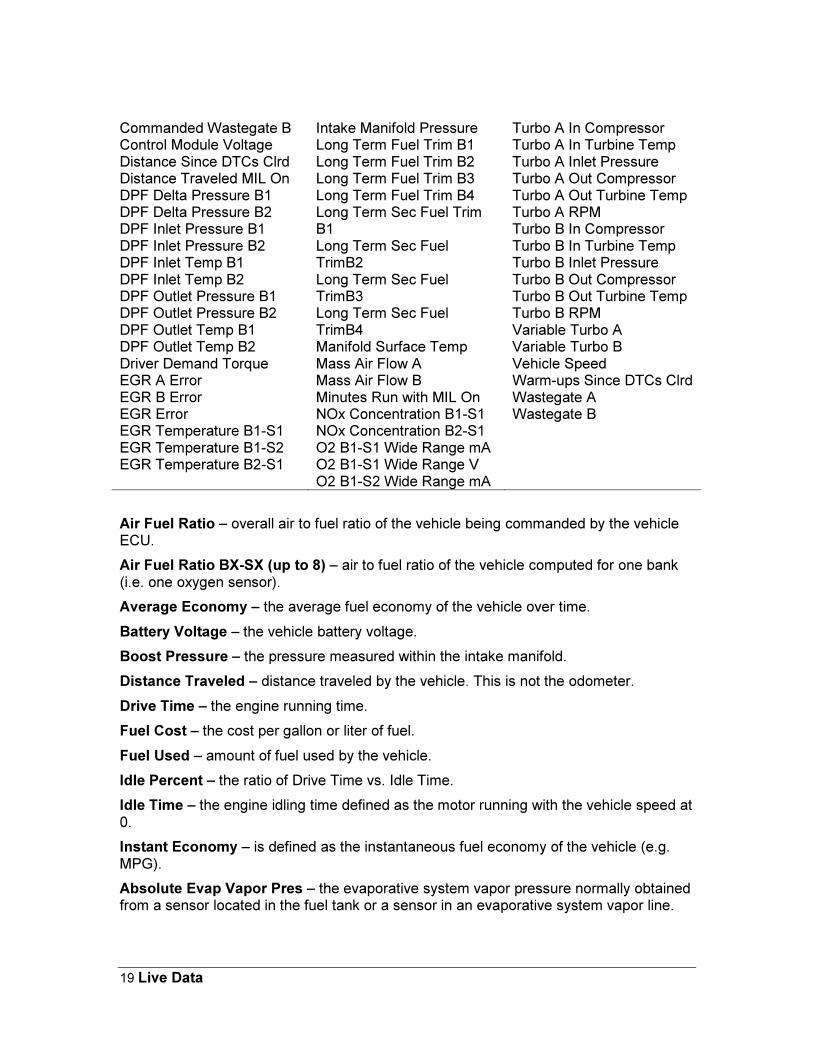
Commanded Wastegate B Control Module Voltage Distance Since DTCs Clrd Distance Traveled MIL On DPF Delta Pressure B1 DPF Delta Pressure B2 DPF Inlet Pressure B1 DPF Inlet Pressure B2 DPF Inlet Temp B1 DPF Inlet Temp B2 DPF Outlet Pressure B1 DPF Outlet Pressure B2 DPF Outlet Temp B1 DPF Outlet Temp B2 Driver Demand Torque EGR A Error EGR B Error EGR Error EGR Temperature B1-S1 EGR Temperature B1-S2 EGR Temperature B2-S1
Intake Manifold Pressure Long Term Fuel Trim B1 Long Term Fuel Trim B2 Long Term Fuel Trim B3 Long Term Fuel Trim B4 Long Term Sec Fuel Trim B1 Long Term Sec Fuel TrimB2 Long Term Sec Fuel TrimB3 Long Term Sec Fuel TrimB4 Manifold Surface Temp Mass Air Flow A Mass Air Flow B Minutes Run with MIL On NOx Concentration B1-S1 NOx Concentration B2-S1 O2 B1-S1 Wide Range mA O2 B1-S1 Wide Range V O2 B1-S2 Wide Range mA
Turbo A In Compressor Turbo A In Turbine Temp Turbo A Inlet Pressure Turbo A Out Compressor Turbo A Out Turbine Temp Turbo A RPM Turbo B In Compressor Turbo B In Turbine Temp Turbo B Inlet Pressure Turbo B Out Compressor Turbo B Out Turbine Temp Turbo B RPM Variable Turbo A Variable Turbo B Vehicle Speed Warm-ups Since DTCs Clrd Wastegate A Wastegate B
Air Fuel Ratio – overall air to fuel ratio of the vehicle being commanded by the vehicle ECU.
Air Fuel Ratio BX-SX (up to 8) – air to fuel ratio of the vehicle computed for one bank (i.e. one oxygen sensor).
Average Economy – the average fuel economy of the vehicle over time.
Battery Voltage – the vehicle battery voltage.
Boost Pressure – the pressure measured within the intake manifold.
Distance Traveled – distance traveled by the vehicle. This is not the odometer.
Drive Time – the engine running time.
Fuel Cost – the cost per gallon or liter of fuel.
Fuel Used – amount of fuel used by the vehicle.
Idle Percent – the ratio of Drive Time vs. Idle Time.
Idle Time – the engine idling time defined as the motor running with the vehicle speed at 0.
Instant Economy – is defined as the instantaneous fuel economy of the vehicle (e.g. MPG).
Absolute Evap Vapor Pres – the evaporative system vapor pressure normally obtained from a sensor located in the fuel tank or a sensor in an evaporative system vapor line.
20 Live Data
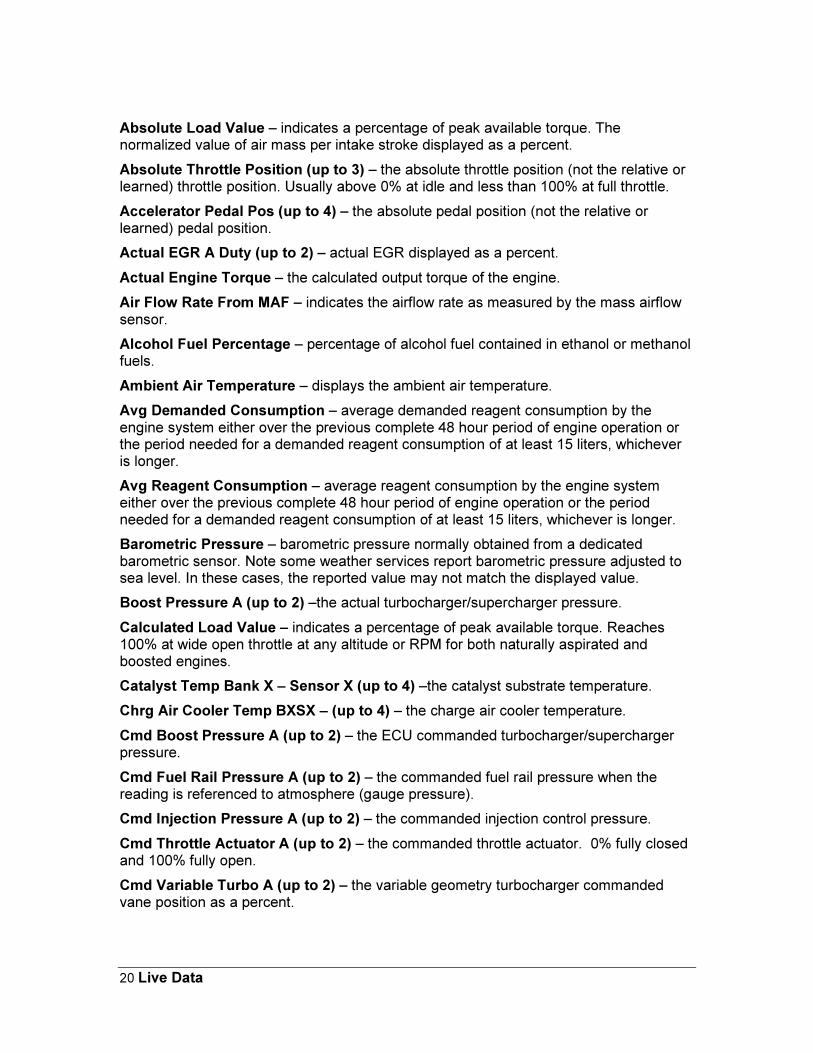
Absolute Load Value – indicates a percentage of peak available torque. The normalized value of air mass per intake stroke displayed as a percent.
Absolute Throttle Position (up to 3) – the absolute throttle position (not the relative or learned) throttle position. Usually above 0% at idle and less than 100% at full throttle.
Accelerator Pedal Pos (up to 4) – the absolute pedal position (not the relative or learned) pedal position.
Actual EGR A Duty (up to 2) – actual EGR displayed as a percent.
Actual Engine Torque – the calculated output torque of the engine.
Air Flow Rate From MAF – indicates the airflow rate as measured by the mass airflow sensor.
Alcohol Fuel Percentage – percentage of alcohol fuel contained in ethanol or methanol fuels.
Ambient Air Temperature – displays the ambient air temperature.
Avg Demanded Consumption – average demanded reagent consumption by the engine system either over the previous complete 48 hour period of engine operation or the period needed for a demanded reagent consumption of at least 15 liters, whichever is longer.
Avg Reagent Consumption – average reagent consumption by the engine system either over the previous complete 48 hour period of engine operation or the period needed for a demanded reagent consumption of at least 15 liters, whichever is longer.
Barometric Pressure – barometric pressure normally obtained from a dedicated barometric sensor. Note some weather services report barometric pressure adjusted to sea level. In these cases, the reported value may not match the displayed value.
Boost Pressure A (up to 2) –the actual turbocharger/supercharger pressure.
Calculated Load Value – indicates a percentage of peak available torque. Reaches 100% at wide open throttle at any altitude or RPM for both naturally aspirated and boosted engines.
Catalyst Temp Bank X – Sensor X (up to 4) –the catalyst substrate temperature.
Chrg Air Cooler Temp BXSX – (up to 4) – the charge air cooler temperature.
Cmd Boost Pressure A (up to 2) – the ECU commanded turbocharger/supercharger pressure.
Cmd Fuel Rail Pressure A (up to 2) – the commanded fuel rail pressure when the reading is referenced to atmosphere (gauge pressure).
Cmd Injection Pressure A (up to 2) – the commanded injection control pressure.
Cmd Throttle Actuator A (up to 2) – the commanded throttle actuator. 0% fully closed and 100% fully open.
Cmd Variable Turbo A (up to 2) – the variable geometry turbocharger commanded vane position as a percent.
21 Live Data
Commanded Throttle Actuator – displays 0% when the throttle is commanded closed and 100% when the throttle commanded open.
Commanded EGR (up to 3) – display 0% when the EGR is commanded off, 100% when the EGR system is commanded on, and if the EGR is duty cycled somewhere between 0% and 100%.
Commanded Equival Ratio – the commanded equivalence ratio (also known as lambda) while the fuel system. Fuel systems that use conventional oxygen sensors display the commanded open loop equivalence ratio while the system is in open loop. Should report 100% when in closed loop fuel. Fuel systems that utilize wide-range/linear oxygen sensors shall display the commanded ratio in both open-loop and closed-loop operation.
Commanded Evap Purge – displays 0% when no evaporative purge is commanded and 100% at the maximum commanded purge position/flow.
Commanded Intake Air A (up to 2) – the commanded air intake displayed as a percent. Also known as EGR Throttle on compression ignition engineers.
Commanded Wastegate A (up to 2) – the commanded wastegate position as a percent. 0% is fully closed (full boost) and 100% fully open (dump boost).
Control Module Voltage – power input to the control module. Normally the battery voltage, less any voltage drop between the battery and the control module.
Distance Since DTCs Cleared – distance accumulated since DTCs where cleared with a scan tool.
Distance Traveled MIL On – accumulates the vehicle distance traveled while the MIL light is illuminated.
DPF Delta Pressure BX (up to 2) – diesel particulate filter delta pressure.
DPF Inlet Pressure BX (up to 2) – diesel particulate filter inlet pressure.
DPF Inlet Temp BX (up to 2) – diesel particulate filter inlet temperature.
DPF Outlet Pressure BX (up to 2) – diesel particulate filter outlet pressure.
DPF Outlet Temp BX (up to 2) – diesel particulate filter outlet temperature.
Driver Demand Torque – the requested torque output of the engine by the driver.
EGR Error (up to 3) – error as percent of actual commanded EGR. Negative percent is less than commanded and positive is more than commanded.
EGR Temperature BX-SX (up to 4) – the EGR gas temperature.
Engine Coolant Temp (up to 3) – engine coolant temperature derived from an engine coolant temperature sensor or a cylinder head temperature sensor.
Engine Fuel Rate – amount of fuel consumed by the engine per unit of time in liters per hour.
Engine Oil Temp – engine oil temperature.
22 Live Data
Engine Reference Torque – display the engine reference torque value. This value does not change.
Engine RPM – displays the current engine revolutions per minute value.
Engine Torque Idle Point – the torque limit that indicates the available engine torque that can be provided by the engine at idle speed.
Engine Torque Point X (up to 4) – the torque limit that indicates the available engine torque that can be provided by the engine point X of the engine map.
Equivalence Ratio BX-SX (up to 16) - is defined as the ratio of the fuel-to-oxidizer ratio to the stoichiometric fuel-to-oxidizer ratio.
Evap System Vapor Press – evaporative system vapor pressure normally obtained from a sensor located in the fuel tank.
Exhaust Gas Temp BX-SX – exhaust gas temperature.
Exhaust Gas Pressure BX – exhaust gas pressure.
Fuel Injection Timing – the start of the mail fuel injection relative to Top Dead Center (TDC). Positive degrees indicate before TDC. Negative degrees indicate after TDC.
Fuel Level Input – indicates the nominal fuel tank liquid fill capacity as a percent of maximum.
Fuel Rail Press Rel Manifold – displays the fuel rail pressure referenced to the manifold vacuum (relative pressure).
Fuel Rail Pressure – indicates the fuel rail pressure at the engine referenced to atmosphere (gauge pressure).
Fuel Rail Pressure (abs) – fuel rail pressure at the engine when the reading is absolute.
Fuel Rail Pressure (gauge) – displays the fuel injection rail pressure at the engine when the reading is referenced to atmosphere (gauge pressure).
Fuel Rail Pressure A (up to 2) – fuel rail pressure when the reading is referenced to atmosphere (gauge pressure).
Fuel Rail Temp A (up to 2) – the fuel rail temperature.
Fuel Rate – the rate at which fuel is consumed by the engine in gallons/hour or liters/hour.
Hybrid Battery Pack Life – the percent remaining life for the hybrid battery pack.
Ignition Timing Advance – ignition timing advance for #1 cylinder (not including any mechanical advance).
Injection Pressure A (up to 2) - the injection control pressure.
Intake Air Temp BX-SX – displays the intake manifold air temperature.
Intake Air Temperature – displays the intake manifold air temperature.
Intake Manifold Abs PresA (up to 2) – intake manifold absolute pressure.
23 Live Data
Intake Manifold Pressure – indicates the manifold pressure derived from a Manifold Absolute Pressure sensor.
Long Term Fuel Trim-BX (up to 4) – indicates the correction being used by the fuel control system in both open and closed loop modes of operation.
Long Term Fuel Trim BX-SX (up to 8) - indicates the correction being used by the fuel control system in both open and closed loop modes of operation.
Manifold Surface Temp – intake manifold surface temperature.
Mass Air Flow A (up to 2) – airflow rate as measured by a vehicle MAF sensor or an equivalent source.
Minutes Run with MIL On – accumulated minutes of engine run time while the MIL light is on.
NOx Concentration BX-SX (up to 2) – NOx concentration.
O2 Sensor BX-SX Wide Range mA (up to 8) – shows milliamps for linear or wide-ratio oxygen sensors.
O2 Sensor BX-SX Wide Range V (up to 8) – shows voltage for linear or wide-ratio oxygen sensors.
O2 Sensor BX-SX (up to 8) – indicates the voltage for conventional 0 to 1V oxygen sensors. O2 sensors with a different full-scale voltage shall be normalized to this range or, if a wide range sensor, may use the wide range parameters instead.
PM Mass Concentration BX-SX (up to 2) – particulate matter mass concentration.
Reagent Tank Level – nominal reagent tank liquid fill capacity as a percent of maximum.
Rel Throttle A Position (up to 2) - relative or “learned” throttle position.
Relative Throttle Position – relative or “learned” throttle position.
Relative Accel Pedal Pos - relative or “learned” pedal position.
Relative Intake Air A (up to 2) – actual intake airflow position displayed as a percent. Also knows as EGR Throttle Position on compression ignition engines.
Run Time NOx Warn – run time of the engine while NOx warning mode is activated.
Short Term Fuel Trim-BX (up to 4) – indicates the correction being used by the closed loop fuel algorithm. If the fuel system is open loop, 0% correction should be reported.
Short Term Fuel Trim BX-SX (up to 8) - indicates the correction being used by the closed loop fuel algorithm. If the fuel system is open loop, 0% correction should be reported.
Short Term Sec Fuel Trim BX (up to 4) – short term secondary O2 sensor fuel trim shall indicate the correction being utilized by the closed-loop fuel algorithm. If the fuel system is open loop, 0% correction should be reported.
Time Since DTCs Cleared – engine run time accumulated since DTCs were cleared.

24 Live Data
Time Since Engine Start – indicates the elapsed time since the engine was started while the engine is running.
Total Engine Idle Time – total engine idle time for the life of vehicle.
Total Engine Run Time – total engine run time for the life of vehicle.
Total Engine Run w/PTO – total engine run time with PTO (power take off) engaged for the life of the vehicle.
Total Run w/IE-ACED X (up to 10) – total engine run time with Emission Increasing Auxiliary Emission Control Device active for the life of the vehicle.
Turbo A In Compressor (up to 2) – turbocharger compressor inlet temperature.
Turbo A In Turbine Temp (up to 2) – turbocharger turbine inlet temperature.
Turbo A Inlet Pressure (up to 2) – turbocharger inlet pressure.
Turbo A Out Compressor (up to 2) – turbocharger compressor outlet temperature.
Turbo A Out Turbine Temp (up to 2) – turbocharger turbine outlet temperature.
Turbo A RPM (up to 2) – turbocharger revolutions per minute.
Variable Turbo A (up to 2) – variable geometry turbocharger actual vane position as a percent. 0% when vanes are fully bypassed and 100% when the vanes are fully utilized.
Vehicle Speed – displays the vehicle road speed.
Warm-ups Since DTCs Cleared – number of warm-up cycles since all DTCs were cleared via a scan tool. A warm-up is defined as the coolant temperature rising by at
least 22°C (40°F) and the engine temperature reaches at a minimum 70°C (160°F)
(60°C (140°F) for diesels).
Wastegate A (up to 2) – actual wastegate position as a percent. 0% wastegate is off (allow full boost) and 100% fully open (dump boost).
25 Dyno Operation
CHAPTER 4
Dyno Operation
The Dyno software is designed for easy operation. This section provides a detailed instructions on how to operate the Dyno features.
Dyno operations require driving the vehicle while the software records performance data. For increased safety, the software does not require user intervention during the test runs. All data is recorded for later analysis and audible tones are used to convey instructions to the user while driving.
Ensure the Android, cable, and OBD II adapter do not interfere with the vehicle controls. A cable dangling in front of the foot pedals, gear shifter, or steering wheel can interfere with vehicle operation and cause a fatal accident. Always ensure the PC, cable, and OBD II adapter are securely fastened out of the way. If the scan tool cannot be safely attached as to not interfere with the vehicle controls, then do not drive the vehicle with the OBD II adapter connected to the vehicle.
Never race or exceed the posted speed limit while on public highways. The dynamometer operations require accelerating to high speeds. Always uses a closed course raceway when performing dynamometer and acceleration tests.
Do not attempt to operate or observe the scan tool while driving a vehicle. Driving requires the full attention of the driver. Operating or observing the scan tool will cause driver distraction and could cause a fatal accident.
Theory of Operation A dynamometer, or dyno for short, is used to measure the power produced by an engine. Until now, automotive dynos were either crankshaft dynamometers or chassis dynamometers.
Crankshaft dynos require the motor to be removed from the vehicle. The power is measured directly at the crankshaft, or flywheel, and is not affected by transmission and
26 Dyno Operation
axle powertrain losses. Vehicle manufacturers spec crankshaft power on new cars and trucks.
Chassis dynos test the entire vehicle. The vehicle is tied down to a large machine and the drive wheels are placed over a rotating drum. The chassis dyno tests the entire powertrain system, not just the crankshaft power. This is a more realistic test since it measures the power delivered to the wheels, not just the crankshaft. As such, the power figures measured are always less than with a crankshaft dyno since the powertrain robs some power from the vehicle.
Dyno-Scan for Android
The Auterra Dyno-Scan for Android software is designed expressly for the automotive enthusiast. It uses the OBD II computer port located on all 1996 and newer automobiles to compute engine power, acceleration times, fuel economy, and more.
The Dyno-Scan for Android tests the vehicle in a completely real world situation that includes powertrain losses, drag from disk brakes and wheel bearings, tire rolling resistance, etc. – everything a vehicle sees on the street.
Aerodynamic drag is compensated for within the calculations. So, whether your vehicle has the aerodynamics of a Chevy Suburban or a Porsche 911, the power calculations can correct for losses due to wind drag.
Weather conditions affect the output of an internal combustion motor. A correction factor is applied to compensate the measurements for weather conditions and elevation. The industry standard document for horsepower and torque corrections is SAE J1349. The Dyno-Scan™ for Windows software applies this correction factor to all horsepower and torque measurements.
By applying these correction factors to the dyno results, a vehicle dyno'd in Denver on a hot day will give the same results as a chilly day in San Diego. Using the Dyno-Scan™ for Windows, measurements generated are comparable with one another the world over.
The dyno runs are performed in a single gear. Any gear will work, however increased accuracy is obtained if the software has an increased measurement duration. For instance, the time to accelerate from 1000 RPM to 5000 RPM in 1st gear is a shorter duration than it would be in 3rd gear. Therefore, using 2nd or 3rd gear for dyno runs offers longer test durations for greater accuracy.
Extensive comparison testing on a Dynojet chassis dynamometer has shown the Dyno-Scan™ to be extremely accurate.
Dynamometer Getting Started Using the dynamometer features requires a few one-time configurations. This section summarizes those steps.
1 Obtain the drag coefficient, frontal area and vehicle weight.
2 Measure gear ratio of your vehicle.
3 Create a Dyno Setup file.
4 Create a Power Torque or Acceleration file.
27 Dyno Operation
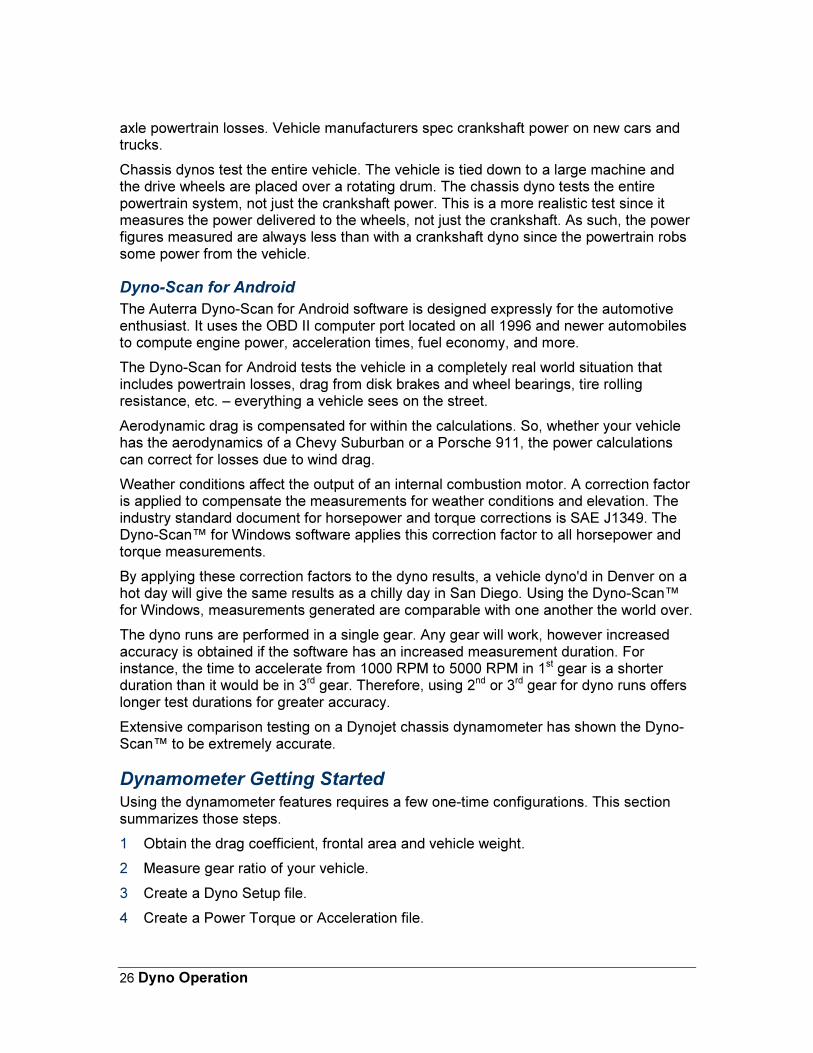
Dyno Files The Dyno feature use three storage file types:
Power Torque – stores Power Torque run data.
Acceleration – stores Acceleration run data.
Dyno Setup – stores Dyno setup variables such as vehicle weight, elevation, humidity, etc.
Dyno Run Screen A Dyno Run is performed on either the Power Torque or Acceleration screens.
1 Display the Power Torque Options or Acceleration Options menu by long pressing the Recent Apps or press the Menu button.
Figure 11: Power Torque Options Menu
2 Select Dyno Run from the options menu.
28 Dyno Operation
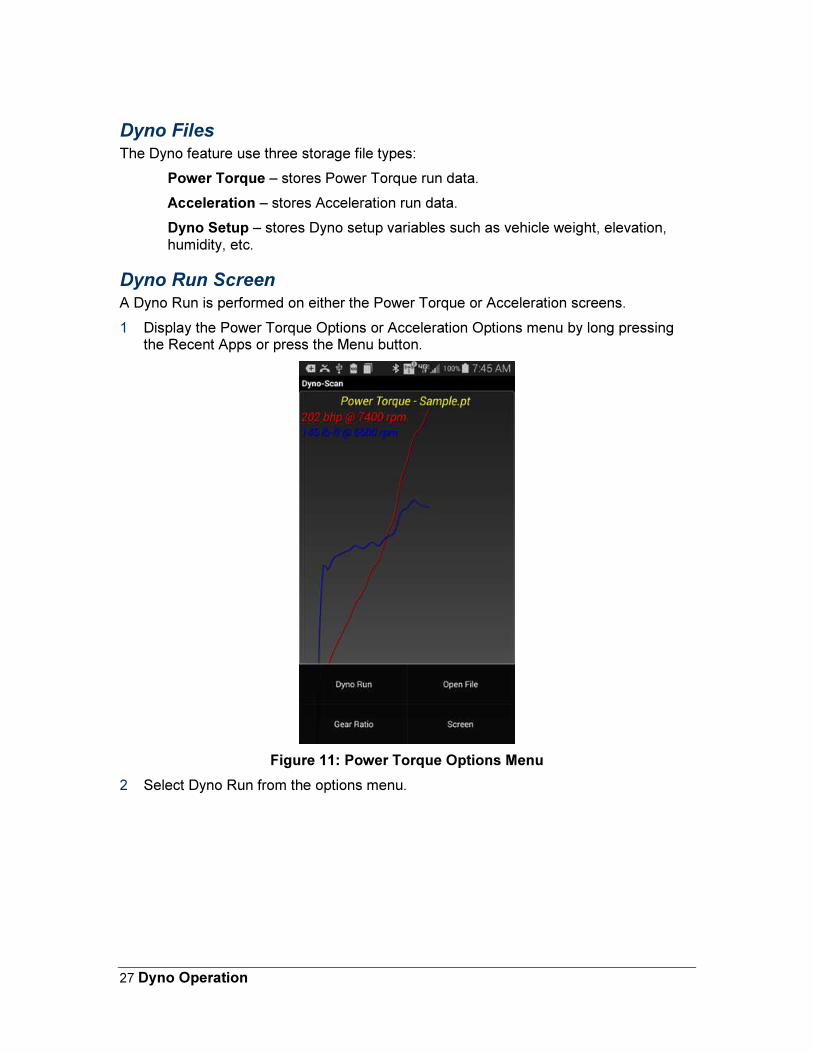
Figure 12: Dyno Run Dialog
3 Select an existing Run Destination File in the dropdown or press New to create a new file.
4 Select an existing Dyno Setup File in the dropdown or press New to create a new file.
5 Optionally, press Edit Dyno Setup File to edit the dyno setup parameters for the currently selected Dyno Setup File.
29 Dyno Operation
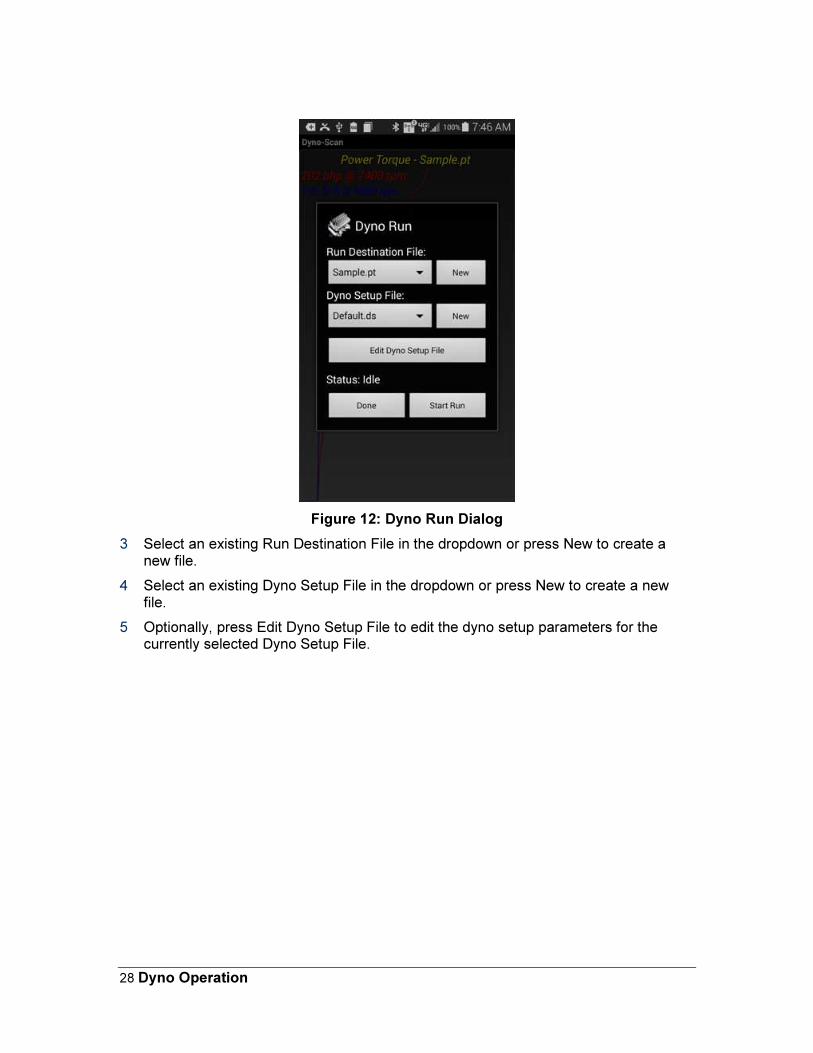
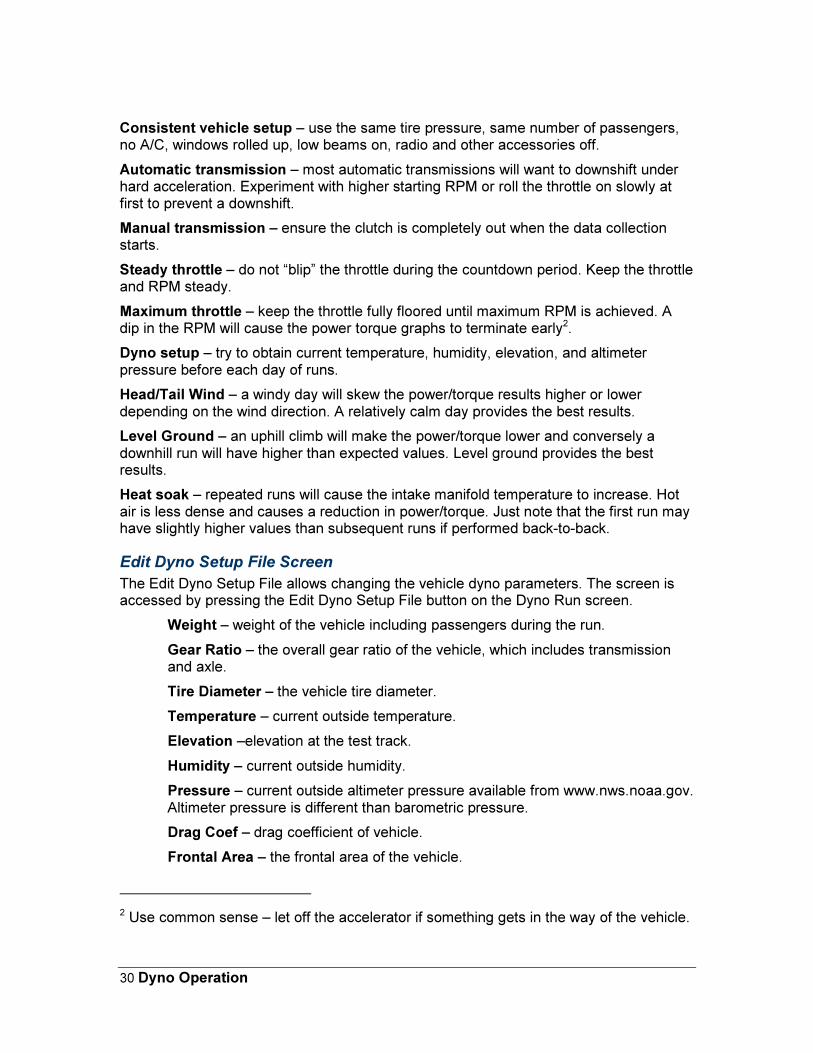
Figure 13: Edit Dyno Setup Dialog
6 Press Start Run to start a 10-second countdown.
7 During the countdown, start driving the vehicle in the gear the run is going to be performed in (e.g. 2nd gear). The vehicle RPM during the countdown should be relatively low, under 2000 RPM, the throttle steady, and clutch out (if a manual transmission).
8 At the end of the countdown, the software will beep. At the beep, floor the accelerator to achieve maximum acceleration.
9 Once maximum RPM is reached, either shift to the next higher gear or decelerate the vehicle by letting off the accelerator. Bring the vehicle to a complete stop and press Done to stop data collection.
10 The Power Torque or Acceleration graph will be automatically displayed.
Power Torque Run Do’s and Don’ts
For safety and the most accuracy from the Dyno software, please follow the guidelines below.
Keep your attention on driving – the software is designed to require no user intervention when a run is performed. Start the power torque run while the vehicle is stopped. During the countdown, accelerate to the correct gear and starting RPM. Audible tones signal when to accelerate the vehicle.
30 Dyno Operation
Consistent vehicle setup – use the same tire pressure, same number of passengers, no A/C, windows rolled up, low beams on, radio and other accessories off.
Automatic transmission – most automatic transmissions will want to downshift under hard acceleration. Experiment with higher starting RPM or roll the throttle on slowly at first to prevent a downshift.
Manual transmission – ensure the clutch is completely out when the data collection starts.
Steady throttle – do not “blip” the throttle during the countdown period. Keep the throttle and RPM steady.
Maximum throttle – keep the throttle fully floored until maximum RPM is achieved. A dip in the RPM will cause the power torque graphs to terminate early2.
Dyno setup – try to obtain current temperature, humidity, elevation, and altimeter pressure before each day of runs.
Head/Tail Wind – a windy day will skew the power/torque results higher or lower depending on the wind direction. A relatively calm day provides the best results.
Level Ground – an uphill climb will make the power/torque lower and conversely a downhill run will have higher than expected values. Level ground provides the best results.
Heat soak – repeated runs will cause the intake manifold temperature to increase. Hot air is less dense and causes a reduction in power/torque. Just note that the first run may have slightly higher values than subsequent runs if performed back-to-back.
Edit Dyno Setup File Screen
The Edit Dyno Setup File allows changing the vehicle dyno parameters. The screen is accessed by pressing the Edit Dyno Setup File button on the Dyno Run screen.
Weight – weight of the vehicle including passengers during the run.
Gear Ratio – the overall gear ratio of the vehicle, which includes transmission and axle.
Tire Diameter – the vehicle tire diameter.
Temperature – current outside temperature.
Elevation –elevation at the test track.
Humidity – current outside humidity.
Pressure – current outside altimeter pressure available from www.nws.noaa.gov. Altimeter pressure is different than barometric pressure.
Drag Coef – drag coefficient of vehicle.
Frontal Area – the frontal area of the vehicle.
2 Use common sense – let off the accelerator if something gets in the way of the vehicle.
31 Dyno Operation
Note – an optional text note.
Figure 14: Edit Dyno Setup Dialog
The software can measure the gear ratio and compute the tire diameter for you. See the Measure Gear Ratio Screen section.
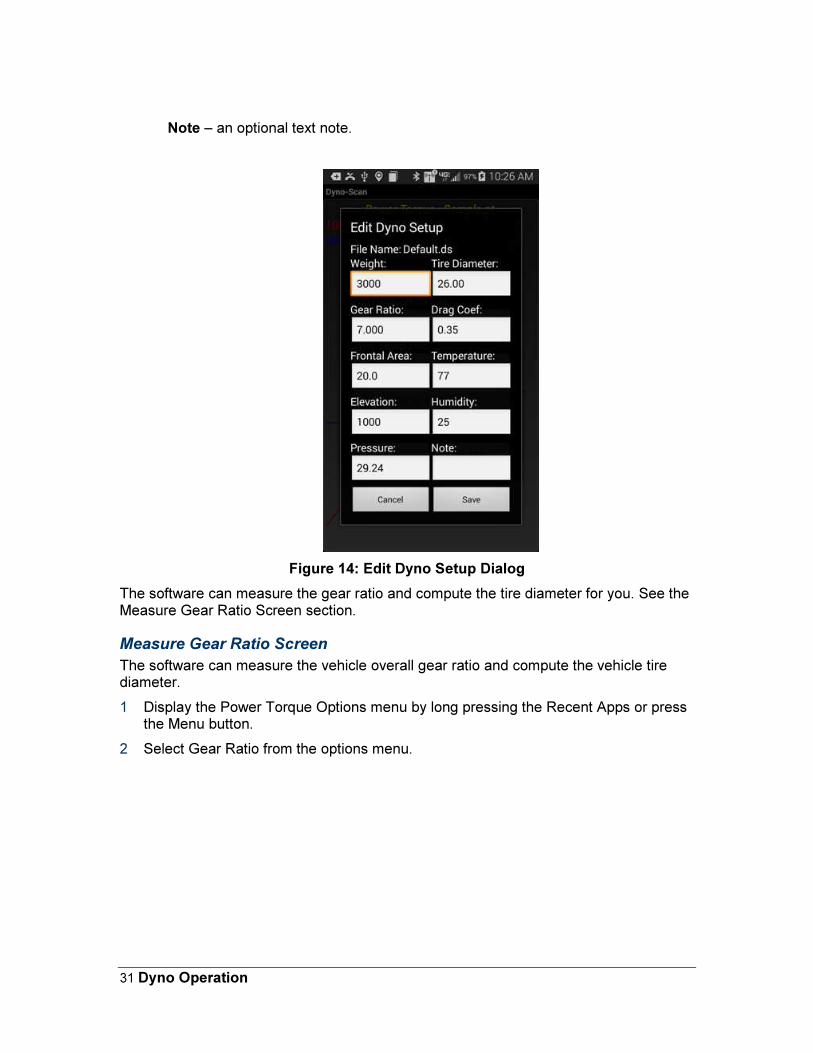
Measure Gear Ratio Screen
The software can measure the vehicle overall gear ratio and compute the vehicle tire diameter.
1 Display the Power Torque Options menu by long pressing the Recent Apps or press the Menu button.
2 Select Gear Ratio from the options menu.
32 Dyno Operation
Figure 15: Measure Gear Ratio Dialog
3 Either enter the Tire Diameter into the box or press the Compute button.
33 Dyno Operation
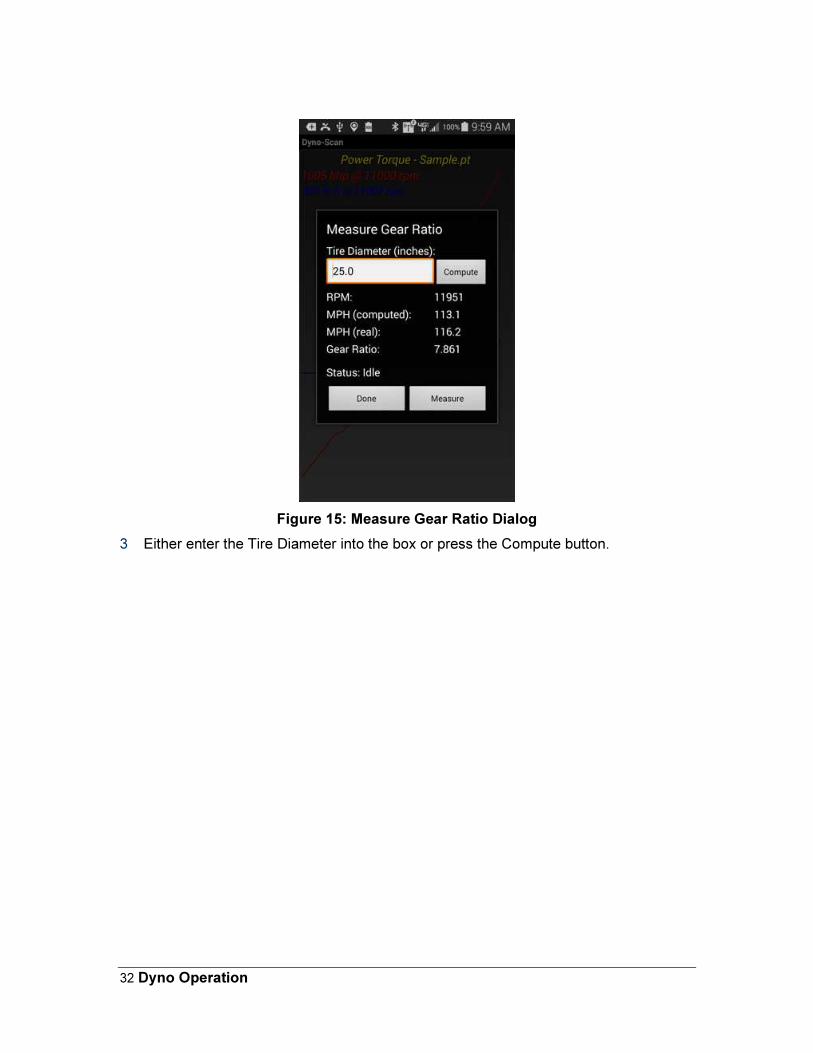
Figure 16: Compute Tire Diameter Dialog
4 On the Compute Tire Diameter screen, enter the tire width, tire ratio and rim diameter. Press OK.
5 Press the Measure button.
6 A 10-second countdown starts.
7 During the countdown, start driving the vehicle in the gear the gear ratio is to be measured (e.g. 2nd gear). The vehicle RPM should be between 3000 and 4000 RPM for best results. Once the gear and RPM is achieved, keep the throttle steady and clutch out (if a manual transmission).
8 At the end of the countdown, the software will measure the gear ratio and display the result.
Confirming Gear Ratio Result
On the Measure Gear Ratio screen are three live values:
RPM – current measured RPM.
MPH (computed) – computed MPH using only RPM and the gear ratio.
MPH (real) – real MPH measured via the vehicle’s on-board computer.
MPH (computed) will only display if values are entered into the Tire Diameter and Gear Ratio fields. If the computed MPH and real MPH values match throughout the RPM range then the gear ratio and tire diameter values are correct for this vehicle. If they do
34 Dyno Operation
not match, adjust the Gear Ratio field up or down until the computed and real MPH match.
A computed verses real MPH check in a single gear might be:
1. Keep a steady speed at 2000 RPM.
2. Confirm the computed and real MPH values match.
3. Increase speed to a steady 4000 RPM.
4. Confirm the computed and real MPH values match.
Always have a passenger confirm the computed and real MPH readings match. Driving requires the full attention of the driver. Operating or observing the scan tool while driving will cause driver distraction and could cause a fatal accident.
Computing a gear ratio requires an accurate speedometer. If the vehicle’s tire size is either smaller or larger than stock and the speedometer has not been recalibrated to the new wheel size, then the computed gear ratio will be incorrect. This will make the horsepower and torque figures higher or lower than expected.
Calculating Overall Gear Ratio
The overall gear ratio can also be computed if the tire diameter and RPM at a speed is known. The following formula computes the overall vehicle gear ratio used by the dyno software:
overall gear ratio = RPM x tire diameter / MPH x 336
Example car:
3.57 = 3000 RPM x 26” / 65 MPH x 336
The preferred method is to use the Dyno-Scan™ to compute the overall gear ratio.
Adjusting Dyno Setup Parameters after Recording
The recorded files can be opened using the Dyno-Scan for Windows PC software. In the case of the Power Torque files, the dyno setup parameters (e.g. gear ratio or elevation) can be dynamically changed on the File Properties pane on your PC and a new HP/torque curve drawn with the newly entered parameters.
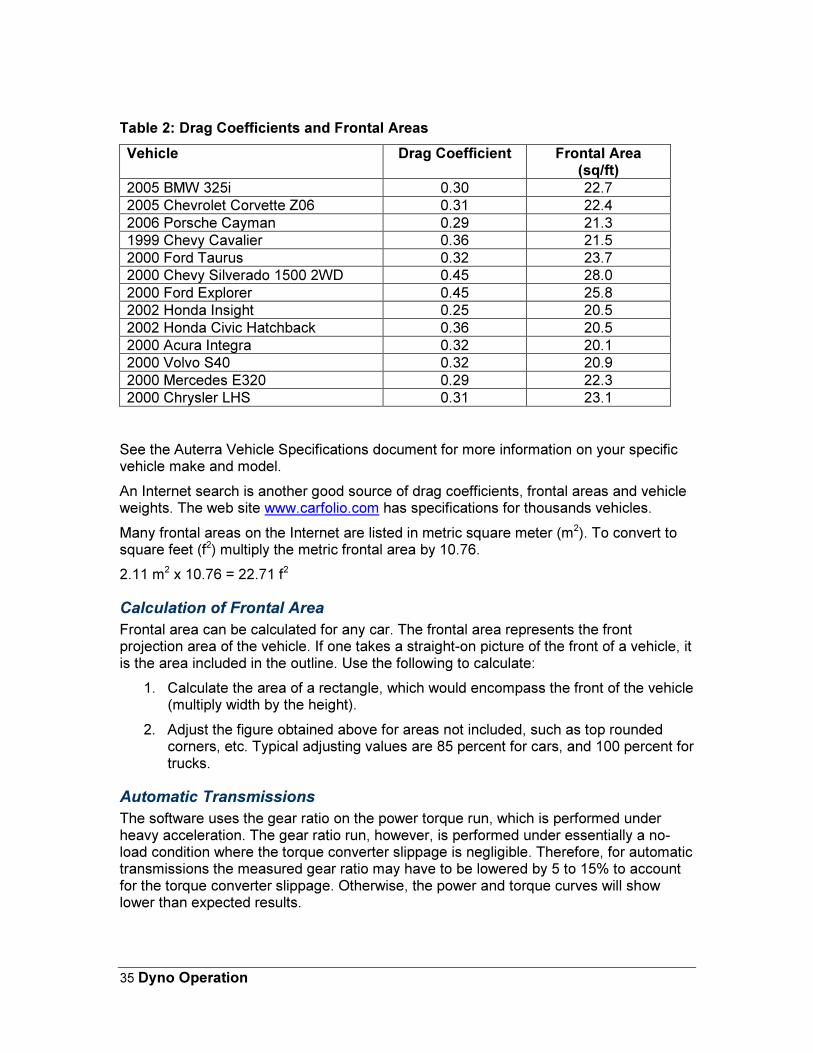
Drag Coefficient and Frontal Area Common drag coefficients are usually in the range of 0.25 to 0.45 – the lower the number the less wind drag on the vehicle.
Frontal areas are usually in the range of 17 to 28 sq. ft – the lower the number the less frontal area. Smaller vehicles have lower frontal areas.
To get an understanding for these numbers, refer to the table below.
35 Dyno Operation
Table 2: Drag Coefficients and Frontal Areas
Vehicle Drag Coefficient Frontal Area (sq/ft)
2005 BMW 325i 0.30 22.7
2005 Chevrolet Corvette Z06 0.31 22.4
2006 Porsche Cayman 0.29 21.3
1999 Chevy Cavalier 0.36 21.5
2000 Ford Taurus 0.32 23.7
2000 Chevy Silverado 1500 2WD 0.45 28.0
2000 Ford Explorer 0.45 25.8
2002 Honda Insight 0.25 20.5
2002 Honda Civic Hatchback 0.36 20.5
2000 Acura Integra 0.32 20.1
2000 Volvo S40 0.32 20.9
2000 Mercedes E320 0.29 22.3
2000 Chrysler LHS 0.31 23.1
See the Auterra Vehicle Specifications document for more information on your specific vehicle make and model.
An Internet search is another good source of drag coefficients, frontal areas and vehicle weights. The web site www.carfolio.com has specifications for thousands vehicles.
Many frontal areas on the Internet are listed in metric square meter (m2). To convert to square feet (f2) multiply the metric frontal area by 10.76.
2.11 m2 x 10.76 = 22.71 f2
Calculation of Frontal Area
Frontal area can be calculated for any car. The frontal area represents the front projection area of the vehicle. If one takes a straight-on picture of the front of a vehicle, it is the area included in the outline. Use the following to calculate:
1. Calculate the area of a rectangle, which would encompass the front of the vehicle (multiply width by the height).
2. Adjust the figure obtained above for areas not included, such as top rounded corners, etc. Typical adjusting values are 85 percent for cars, and 100 percent for trucks.
Automatic Transmissions
The software uses the gear ratio on the power torque run, which is performed under heavy acceleration. The gear ratio run, however, is performed under essentially a no-load condition where the torque converter slippage is negligible. Therefore, for automatic transmissions the measured gear ratio may have to be lowered by 5 to 15% to account for the torque converter slippage. Otherwise, the power and torque curves will show lower than expected results.
36 Trouble Codes
CHAPTER 5
Trouble Codes
The Trouble Codes screen shows the vehicle diagnostic trouble code (DTC) number and the code definition. You can also clear trouble codes on this screen. This section shows you how.
View Trouble Codes 1 Press Connect on the Main Menu to connect to the vehicle.
2 Press the Trouble Codes button.
3 Wait about 30 seconds and any stored trouble codes will automatically be displayed.

37 Trouble Codes
Figure 17: Trouble Codes Screen
Clear Trouble Codes 1 Press Connect on the Main Menu to connect to the vehicle.
2 Press the Trouble Codes button.
3 Display the Trouble Codes Options menu by long pressing the Recent Apps or press the Menu button.

38 Trouble Codes
Figure 18: Trouble Codes Options Menu
4 Select Clear Codes from the options menu.
5 The code are cleared from the vehicle memory and the Check Engine light is turned off. Sometimes you need to turn the vehicle ignition key off then on to see the light turn off.
Stored and Pending Diagnostic Trouble Codes The Stored and Pending Diagnostic Trouble Codes display the vehicle’s pending and stored Diagnostic Trouble Codes (DTC), if any. The Diagnostic Trouble Codes screen continually scans for new DTCs, even if some DTCs are already shown.
All DTCs are displayed within 10 to 20 seconds. If the vehicle’s Check Engine or Service Engine Soon light on the instrument panel is illuminated, a stored DTC will be displayed. Pending DTCs do not necessarily indicate a faulty component/system. If the vehicle’s test results indicate a failure after additional driving, then the Check Engine light is illuminated and a DTC is set in the stored DTC pane.
Two categories of trouble codes exist: generic and enhanced. Generic codes are standardized and common to all vehicle manufacturers. Enhanced codes are not uniquely defined and may overlap with another manufacture, or even the same manufacturer. For instance, multiple definitions may exist for code P1234. Ford may define it as “Engine Oil Pressure Too Low”, but Toyota’s definition could mean something different like “System Voltage Unstable”. The Diagnostic Trouble Codes screen reads and clears both generic and enhanced codes.

39 Trouble Codes
There are four types of trouble codes: P (Powertrain), B (Body), C (Chassis), and U (Network Communication). The scan tool reads and clears all P-codes and, depending on the vehicle, B, C, and U-codes as well3.
3 Not all vehicles support retrieving and clearing B, C, and U-codes.
40 Preferences
CHAPTER 6
Preferences
Preferences allow you to set the global system settings.
Preference Function
Metric English or Metric units of measure.
Fast Sampling Allows faster data sampling on some vehicle protocols.
CAN 6x Allows querying 6 sensors at a time on CAN bus equipped vehicles.
MPG Correction Percent correction factor of the computed MPG.
Distance Correction Percent correction factor of the distance traveled.
Vehicle Speed Correction Percent correction factor for the vehicle speed. Used to correct for an inaccurate speedometer due to non-stock tires sizes.
Boost Calibration Boost pressure calibration.
Engine Size Engine size in liters.
Demo Mode Enables simulation of all vehicle data. Useful to test the product without connection to a vehicle.
Hide Welcome Screen Hides the opening welcome screen
41 Preferences
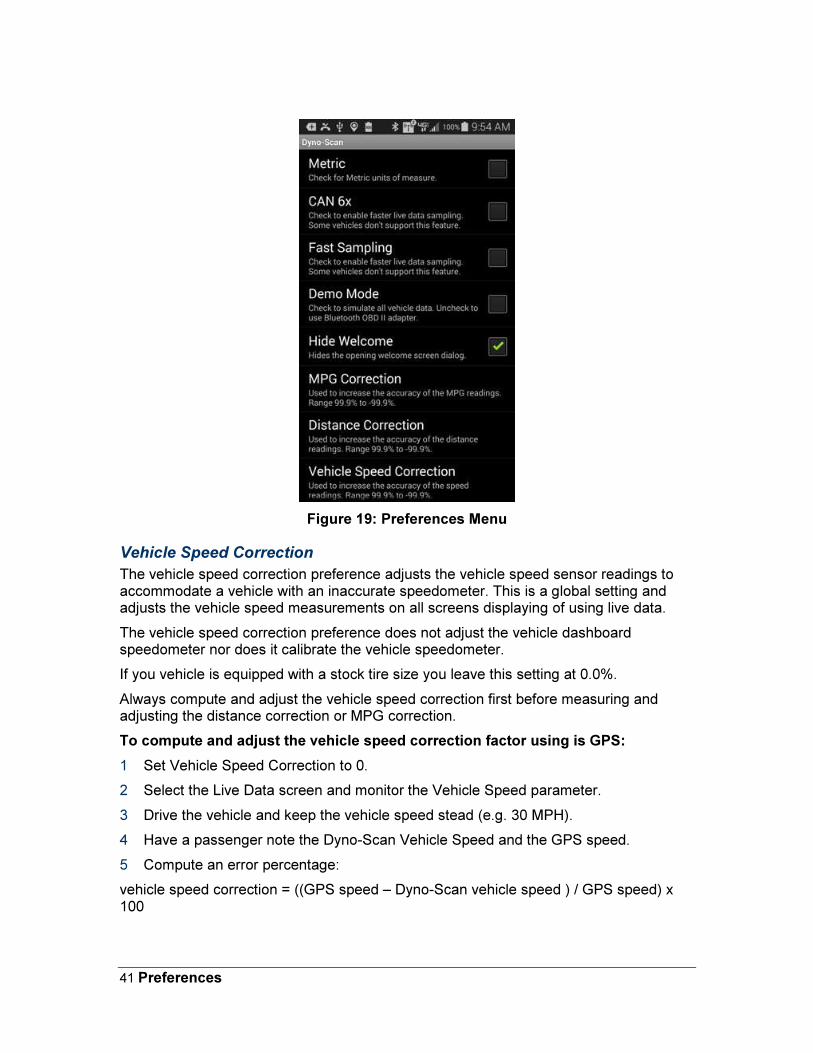
Figure 19: Preferences Menu
Vehicle Speed Correction
The vehicle speed correction preference adjusts the vehicle speed sensor readings to accommodate a vehicle with an inaccurate speedometer. This is a global setting and adjusts the vehicle speed measurements on all screens displaying of using live data.
The vehicle speed correction preference does not adjust the vehicle dashboard speedometer nor does it calibrate the vehicle speedometer.
If you vehicle is equipped with a stock tire size you leave this setting at 0.0%.
Always compute and adjust the vehicle speed correction first before measuring and adjusting the distance correction or MPG correction.
To compute and adjust the vehicle speed correction factor using is GPS:
1 Set Vehicle Speed Correction to 0.
2 Select the Live Data screen and monitor the Vehicle Speed parameter.
3 Drive the vehicle and keep the vehicle speed stead (e.g. 30 MPH).
4 Have a passenger note the Dyno-Scan Vehicle Speed and the GPS speed.
5 Compute an error percentage:
vehicle speed correction = ((GPS speed – Dyno-Scan vehicle speed ) / GPS speed) x 100
42 Preferences
Example:
7.3% = ((30.0 MPH – 27.8 MPH) / 30.0 MPH) x 100
6 Set the Vehicle Speed Correction to the computed correction factor.
Distance Correction
The distance correction preference fine-tunes the accuracy of the Distance Traveled parameter, if necessary.
The distance correction preference does not adjust the vehicle odometer nor does it calibrate the vehicle speedometer.
The Distance Traveled parameter is used within the Instant MPG and Average MPG parameter computations. Therefore, an accurate Distance Traveled parameter ensures greatest accuracy of these parameters.
To compute and adjust the distance correction preference using your vehicle odometer:
1 Set the Distance Correction to 0.
2 Go to the Live Data screen and monitor the Distance Traveled parameter.
3 Drive the vehicle for 25 to 50 miles.
4 Compare the Dyno-Scan trip computer Distance Traveled value and the vehicle’s odometer mileage. Compute an error percentage:
distance correction = ((odometer distance – Dyno-Scan distance ) / odometer distance) x 100
Example:
3.3% = ((27.5 miles – 26.6 miles) / 27.5 miles) x 100
5 Set the Distance Correction to the computed correction factor.
Alternatively a GPS may be used in place of the odometer in the above procedure if the vehicle speedometer is not accurate.
MPG Correction
The MPG correction preference fine-tunes the accuracy of the Instant MPG, Average MPG and Fuel Used parameters due to different fuels or minor vehicle sensor variances.
The MPG correction preference does not adjust the amount of fuel used by the vehicle.
Always compute and adjust the distance correction first before measuring and adjusting MPG correction.
To compute and adjust the MPG correction preference:
1 Set the MPG Correction to 0.
2 Fill up your vehicle gas tank.
3 On the Tools > Options menu press the Reset Fuel Used button then press OK.
43 Preferences
4 Go to the Live Data screen and monitor the Fuel Used parameter.
5 Drive the vehicle normally until the tank is near empty. Always have the Average Fuel Economy screen displayed when driving the vehicle.
6 Fill up the vehicle and note the gallons used to fill up the vehicle.
7 Compute the error in the Dyno-Scan Fuel Used parameter and the gallons used to fill up the gas tank.
MPG correction = ((Dyno-Scan fuel used - gas pump gallons) / gas pump gallons) x 100
Example:
-1.2% = ((25.3 gallons – 25.6 gallons) / 25.6 gallons) x 100
8 Set the MPG Correction to the computed correction factor.
Boost Calibration
Two different methods are used for expressing pressure: gauge pressure and absolute pressure. Gauge pressure is referenced to atmospheric pressure. The atmospheric pressure at sea level is about 14.7psi and changes slightly with atmospheric conditions. Absolute pressure is referenced to 0psi. The relationship between the pressures can be expressed as follows:
absolute pressure = gauge pressure + atmospheric pressure
The Boost Pressure parameter measures the absolute pressure within the vehicle’s intake manifold. To measure gauge pressure, enter a Boost Calibration offset. Gauge pressure can be expressed as follows:
gauge pressure = absolute pressure – atmospheric pressure
The Boost Calibration allows entering the atmospheric pressure, in psi, such that a gauge pressure reading may be obtained.
boost pressure = absolute pressure – Boost Calibration
Two factors affect the Boost Calibration accuracy: weather conditions and elevation changes, the later being more significant. Enter a new Boost Calibration for the most accurate gauge pressure measurements.
The boost calibration does not adjust the turbo boost pressure of the vehicle.
To compute a Boost Calibration correction factor:
1 Connect Dyno-Scan to your vehicle.
2 Ensure your vehicle is not running.
3 Select the Boost Calibration option to 0.
4 Go to the Live Data screen and monitor the Boost Pressure parameter.
5 The Boost Pressure parameter will display. This is your Boost Calibration correction factor. With the Boost Calibration preference at 0 and the vehicle off, the Boost Pressure value shown is atmospheric pressure.
6 Set the Boost Calibration to the value measured above.

44 Preferences
Engine Size
The Engine Size preference is used in the following parameters: Instant Economy 2, Average Economy 2, Fuel Used 2 and Air Flow Rate From MAP. Ensure you enter an accurate engine size (in liters) if you use these parameters.
45 Windows PC Software
CHAPTER 7
Windows PC Software
Auterra's Windows and Android software share the same file format. Files save on Android can be opened using the Dyno-Scan for Windows PC software.
Refer to the Dyno-Scan for Windows User Guide for detailed information on how to use the PC software.
File Types The software uses these different files extensions.
Table 3: File Types
File Type File Extension
Description
Live Data File .ld Live data files store live parameter recordings.
Power Torque File .pt Stores power torque run data.
Acceleration File .ac Stores acceleration run data.
Dyno Setup File .ds Stores vehicle and environmental setup information.
Screen Config .sc Screen configuration file.
Copy Files to PC To copy the recorded data from your Android to a Windows PC follow the procedure below.
1 Plug the Android device into your Windows PC using a USB cable.
2 Ensure you are logged into your Android device.
3 Go to the Phone > Auterra directory.
4 Copy the recorded data from the phone to somewhere on your Windows PC.
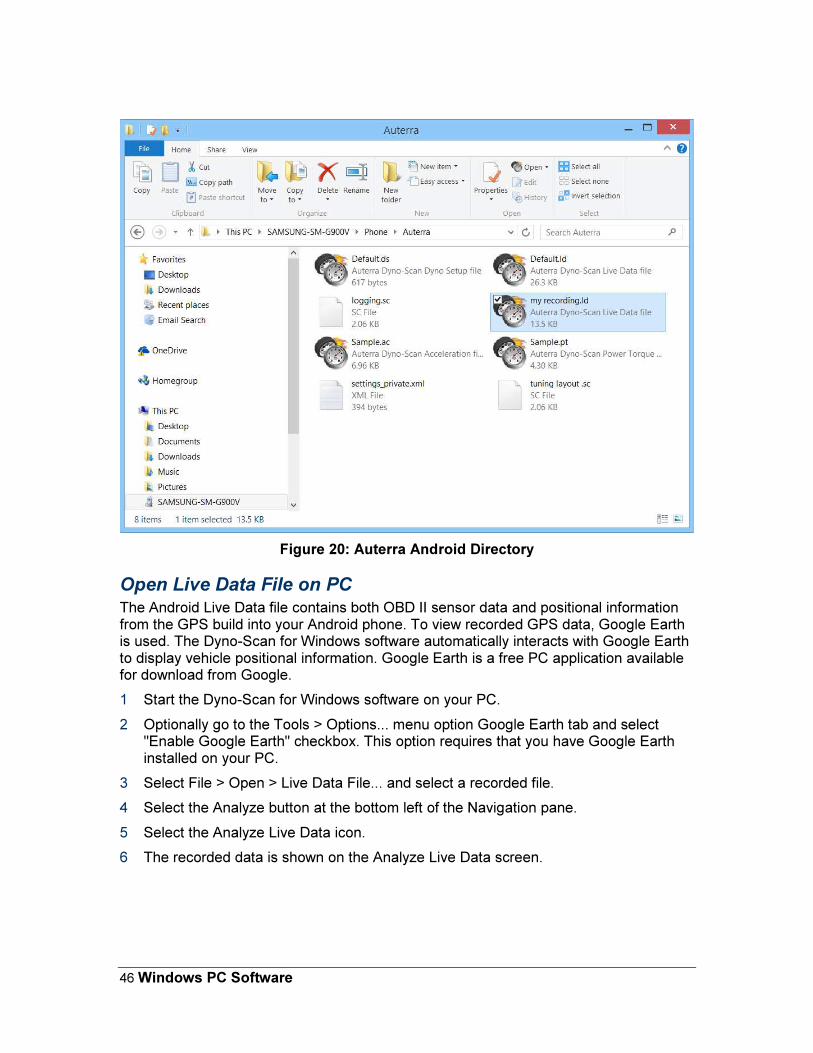
46 Windows PC Software
Figure 20: Auterra Android Directory
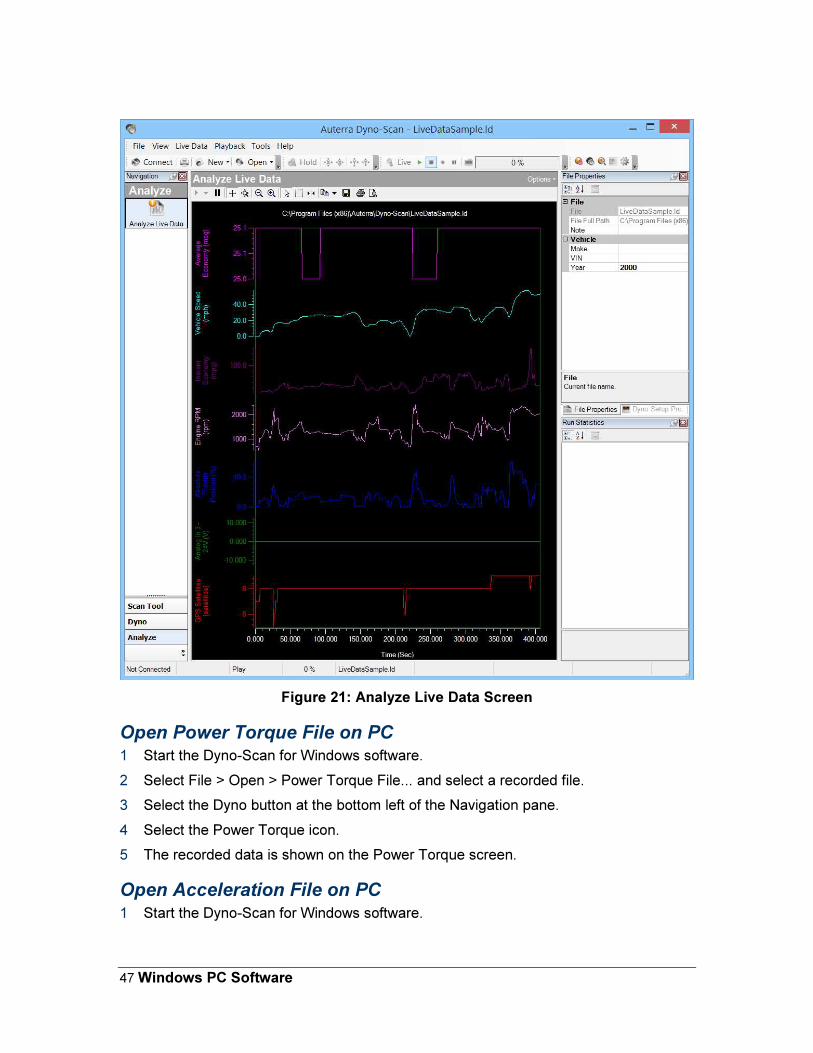
Open Live Data File on PC The Android Live Data file contains both OBD II sensor data and positional information from the GPS build into your Android phone. To view recorded GPS data, Google Earth is used. The Dyno-Scan for Windows software automatically interacts with Google Earth to display vehicle positional information. Google Earth is a free PC application available for download from Google.
1 Start the Dyno-Scan for Windows software on your PC.
2 Optionally go to the Tools > Options... menu option Google Earth tab and select "Enable Google Earth" checkbox. This option requires that you have Google Earth installed on your PC.
3 Select File > Open > Live Data File... and select a recorded file.
4 Select the Analyze button at the bottom left of the Navigation pane.
5 Select the Analyze Live Data icon.
6 The recorded data is shown on the Analyze Live Data screen.
47 Windows PC Software
Figure 21: Analyze Live Data Screen
Open Power Torque File on PC 1 Start the Dyno-Scan for Windows software.
2 Select File > Open > Power Torque File... and select a recorded file.
3 Select the Dyno button at the bottom left of the Navigation pane.
4 Select the Power Torque icon.
5 The recorded data is shown on the Power Torque screen.
Open Acceleration File on PC
1 Start the Dyno-Scan for Windows software.
48 Windows PC Software
2 Select File > Open > Acceleration File... and select a recorded file.
3 Select the Dyno button at the bottom left of the Navigation pane.
4 Select the Acceleration icon.
5 The recorded data is shown on the Acceleration screen.
Open Dyno Setup File on PC 1 Start the Dyno-Scan for Windows software.
2 Select File > Open > Dyno Setup File... and select the setup file.
3 The dyno setup data is shown in the Dyno Setup Properties pane typically on the right side of the screen. If hidden, select the View > Dyno Setup Properties menu to display the pane.

49 Troubleshooting
CHAPTER 8
Troubleshooting
This section contains solutions for common problems encountered with the scan tool.
Scan Tool Connects but No Live Data If no live data is displayed in the Live Data screens, try the following remedies:
1 Disable the Fast Sampling option in the Preferences menu.
2 Disable the CAN 6x Communication option in the Preferences menu.
No Communication (Scan Tool) If the No Communication (Scan Tool) dialog appears, this means the software cannot communicate with the vehicle. Try the following remedies:
1 Ensure the vehicle ignition is turned on. Vehicle does not have to be running; however, it can be.
2 Ensure the Bluetooth is paired with the Android device.
3 Try pressing the “Connect to Vehicle” button again.
4 Ensure the OBD II Adapter is securely plugged into the vehicle’s OBD II connector.
5 Ensure the vehicle is OBD II compliant.
6 Ensure no vehicle fuses are blown. OBD II adapter power is derived from the vehicle and a blown fuse could prevent power from reaching the scan tool. Sometimes the OBD II connector and cigarette lighter share the same fuse.
No Communication (Vehicle) If the No Communication (Vehicle) dialog appears, see No Communication (Scan Tool).
Lost Communication If the Lost Communication dialog appears, this means the software initially established communication but subsequently lost it. Try the following remedies:
1 Ensure the OBD II Adapter is securely plugged into the vehicle’s OBD II connector.
2 Ensure your Android is within range of the OBD II Bluetooth adapter.
50 Troubleshooting
Live Data Screen Is Blank Long press any Live Data screen cell and a popup menu will display to select parameters.
Clearing Codes Did Not Work or MIL Didn’t Turn Off There are a few possible causes for the check engine light not to extinguish or the DTCs to reappear on the scan tool. First, if the problem is not fixed the DTC may return immediately for problems such as misfires, open or shorted sensors, etc. Second, some vehicles cannot be running when the memory is cleared. In these cases, ensure the key is on but the engine is off before attempting to clear the memory. Last, some vehicles require, after the codes are cleared, for the ignition key to be turned off and then on again before the MIL light actually turns off.