Embed Size (px)
Citation preview
Please refer to page 11 for important disclosures and analyst certification, or on our website
www.macquarie.com/research/disclosures.
AUSTRALIA/UNITED KINGDOM/SOUTH AFRICA
BHP AU/BLT LN/BIL SJ Outperform
Price (at 05:28, 25 Jan 2017 GMT) A$27.89/£14.81/R249.42
Valuation A$21.84/£13.10/R229.42 - DCF (WACC 7.4%, beta 1.2, ERP 5.0%, RFR 3.3%)
12-month target A$31.00/£16.70/R290.00
12-month TSR % +14.2
Volatility Index Medium
GICS sector Materials
30-day avg turnover A$m 151.9
Combined market cap US$m 105,264
Number shares on issue m 3,212
Investment fundamentals Year end 30 Jun 2016A 2017E 2018E 2019E
Revenue m 30,912 39,554 37,943 38,125 EBIT m 3,469 12,861 9,533 8,721 Reported profit m -6385 7,352 5,189 4,779 Adjusted profit m 1,215 6,988 5,189 4,779 Gross cashflow m 10,264 15,667 14,172 14,044 CFPS ¢ 192.9 294.3 266.3 263.8 CFPS growth % -45.5 52.6 -9.5 -0.9 PGCFPS x 11.0 7.2 7.9 8.0 PGCFPS rel x 0.99 0.76 0.82 0.85 EPS adj ¢ 22.8 131.3 97.5 89.8 EPS adj growth % -81.0 475.1 -25.7 -7.9 PER adj x 92.7 16.1 21.7 23.6 PER rel x 4.99 1.03 1.40 1.56 Total DPS ¢ 30.0 71.0 49.0 45.0 Total div yield % 1.4 3.4 2.3 2.1 Franking % 100 100 100 100 ROA % 2.8 10.5 7.5 6.7 ROE % 2.0 12.4 8.6 7.6 EV/EBITDA x 10.6 6.3 7.3 7.5 Net debt/equity % 43.5 33.0 27.6 22.7 P/BV x 2.1 1.9 1.8 1.7
BHP AU vs ASX 100, & rec history
Note: Recommendation timeline - if not a continuous line, then there was no Macquarie coverage at the time or there was an embargo period.
Source: FactSet, Macquarie Research, January 2017
(all figures in USD unless noted, TP in AUD)
25 January 2017
BHP Billiton Production guidance under pressure Event
BHP’s 2QFY17 production result was soft with misses in metallurgical coal,
energy coal and copper. BHP has cut copper guidance by 2% but maintained
FY17 production guidance for other commodities.
Impact
Soft 2QFY17 production result: BHP’s 2QFY17 production result was soft.
Copper and energy coal were the main weak spots, with output missing our
forecasts by 11% for both commodities. Metallurgical coal output was 7%
weaker than forecast while iron-ore and petroleum production was broadly in
line with our expectations.
Strong finish needed to hit guidance: Production guidance for iron-ore,
metallurgical coal energy coal and petroleum was maintained despite the soft
2QFY17 production result with only copper guidance seeing a modest
reduction. We note that BHP needs to deliver a material uplift in production
rates in the 2HFY17 for copper, energy coal, metallurgical coal and US
Onshore if the upper end of guidance ranges are to be achieved.
Major projects down to two but set to rise this year: The completion of the
Bass Strait Longford Gas Conditioning Plant and the Escondida Water Supply
projects during the quarter has left BHP with just two major projects in
development, the North West Shelf Greater Western Flank B and Jansen
Potash. We expect the pipeline to grow in FY17 with formal approval for Mad
Dog 2 likely in the 3QFY17 while the Spence Growth Option likely to be
approved in 2017.
Earnings and target price revision
We make only modest changes to our production and earnings forecasts after
incorporating the 2QFY17 result. Our EPS forecasts move less than 1% for
the next five years and we keep our A$31.00/£16.70/ZAR290 price targets
unchanged as a result.
Price catalyst
12-month price target: A$31.00 based on a NPV - 7.5x EV/Ebitda blend
methodology.
Catalyst: BHP is set to report its 1HFY17 earnings result on 21 February.
Updates on Samarco also present a potential catalyst in coming months.
Action and recommendation
Maintain Outperform: BHP’s 2QFY17 production result was soft and while
we have not made any meaningful changes to our earnings forecasts, we
believe some of the groups’ FY17 production targets could be at risk,
particularly if a major strike at Escondida or above average wet season in the
Pilbara or Queensland occurs. The company continues to benefit from
buoyant commodity prices, dominated by iron-ore. At spot prices, the stock is
trading on +11% free cash flow yields and generates earnings double our
current forecasts. On our forecasts, BHP’s gearing is expected to fall to 22%
by FY18, but this falls to 17% using spot prices.
Macquarie Wealth Management BHP Billiton
25 January 2017 2
2QFY17 production result was soft
BHP’s 2QFY17 production result was soft with in line results in iron-ore and petroleum offset by
weaker volume in copper, metallurgical coal and energy coal. BHP’s share of iron-ore production
was broadly in line with our forecasts as was total petroleum output. Sequentially, only iron-ore
reported a stronger result, which is in line with seasonal patterns, while petroleum and energy coal
saw sequential declines in production.
Fig 1 Headline production misses for copper, metallurgical coal and energy coal
Quarterly Production 1QFY17a 2QFY17e 2QFY17a Variance QoQ
Petroleum (MMboe) 54.5 52.5 51.4 (2%) (6%) Copper (mt) 0.4 0.401 0.357 (11%) 1% Iron-ore (mt) 58 59.3 60.0 1% 4% Metallurgical Coal (mt) 10.6 11.4 10.6 (7%) 0% Energy Coal (mt) 7.3 7.5 6.7 (11%) (9%)
Source: BHP, Macquarie Research, January 2017
Partially offsetting the weaker results from copper and coal, we note that most of BHP’s minor
commodities reported stronger volumes. Nickel West production was up strongly both sequentially
and compared to our estimates while the product mix at Antamina drove higher lead and
molybdenum output. By-product output at Olympic Dam and Escondida was also well ahead of
our expectations.
Fig 2 Minor commodities provided a positive boost
Quarterly Production 1QFY17a 2QFY17e 2QFY17a Variance QoQ
Petroleum Division Crude oil, condensate and NGL (Mboe) 24,247 23,908 23,911 0% (1%) Natural Gas (bcf) 181.7 171.8 165.9 (3%) (9%) Total petroleum products (MMboe) 54.5 52.5 51.4 (2%) (6%) Copper Division Copper (kt) 354.6 401.4 357.1 (11%) 1% Lead (t) 1,146 511 1,220 139% 6% Zinc (t) 15,367 22,907 22,406 (2%) 46% Gold (ozs) 51,927 31,331 67,435 115% 30% Silver (koz) 2,737 2,085 2,957 42% 8% Uranium (t) 916 806 1,060 31% 16% Molybdenum (t) 561 178 225 27% (60%) Iron-ore Division Iron-ore (mt) 57,587 59,261 60,049 1% 4% Coal Division Metallurgical Coal (mt) 10,631 11,440 10,640 (7%) 0% Energy Coal (mt) 7,331 7,485 6,651 (11%) (9%) Other Nickel (kt) 18.8 16.1 22.1 37% 18%
Source: BHP, Macquarie Research, January 2017
Headline production from the Petroleum division was broadly in line with our expectations with the
weak spot US shale gas volumes, which declined at a greater rate than we were anticipating. In
the conventional business, stronger production result from Mad Dog, the North West Shelf and
Trinidad and Tobago offset weaker volumes at Bass Strait and Atlantis.
The 11% miss in copper production reflected weaker concentrate production at Escondida and
lower cathode output at Pampa Norte. We had already factored in the impact of the power outage
at Olympic Dam and note that the 2QFY17 production result was actually better than we had
expected. Realised copper prices for the 1HFY17 were ~5% higher than we had expected.
Antamina delivered a strong result with broadly in line output for copper and zinc boosted by
significant beast in lead, silver and molybdenum production. We note that Escondida and Olympic
Dam both reported materially higher gold and silver production than we were forecasting while
Olympic Dam also reported better uranium production.
Iron-ore production was broadly in line with our expectations with better volume from Newman and
Wheelarra offsetting softer production at Area C and Jimblebar. Sequentially production growth
was driven by Yandi and Wheelarra. BHP reported an average realised price of US$55/wmt (FOB)
for the 1QFY17, which was in line with our expectations.
Macquarie Wealth Management BHP Billiton
25 January 2017 3
The weaker result from the metallurgical coal division was attributable to lower volumes from
Blackwater, Goonyella/Riverside/Broadmeadow and Caval Ridge, which more than offset better
performances from Peak Downs, Saraji and Poitrel. Coal shipments were 8% lower than forecast
with the mix of hard coking coal marginally better than we had expected. We note that BHP’s
realised metallurgical coal prices for the period were around 20% better than we had anticipated.
Thermal coal production was mixed with a better-than-expected result from Cerrejón offset by a
weaker result in the Hunter Valley. Realised thermal coal prices for the 1HFY17 were also lower
than we had expected. Nickel West delivered a strong production beat as debottlenecking
activities translated to a record result for the Kwinana refinery.
Fig 3 Core asset production breakdown
Quarterly Production 1QFY17a 2QFY17e 2QFY17a Variance QoQ
Petroleum Crude oil, condensate and NGL (Mboe) Onshore US 8,288 8,028 8,143 1% (2%) Conventional 15,959 15,880 15,768 (1%) (1%) Total 24,247 23,908 23,911 0% (1%) Natural Gas (bcf) Onshore US 73.9 68.7 68.8 0% (7%) Conventional 107.8 103.1 97.1 (6%) (10%) Total 181.7 171.8 165.9 (3%) (9%) Copper Payable metal in concentrate (kt) Escondida 147.0 197.6 162.6 (18%) 11% Antamina 34.1 31.1 32.0 3% (6%) Total 181.1 228.7 194.6 (15%) 7% Cathode (kt) Escondida 70.5 71.4 71.5 0% 1% Pampa Norte 62.1 67.0 53.8 (20%) (13%) Olympic Dam 40.9 34.2 37.2 9% (9%) Total 173.5 172.7 162.5 (6%) (6%) Copper total (kt) 354.6 401.4 357.1 (11%) 1% Lead in concentrate (t) Antamina 1,146 511 1,220 139% 6% Zinc in concentrate (t) Antamina 15,367 22,907 22,406 (2%) 46% Gold in concentrate (ozs) Escondida 27,561 16,204 37,784 133% 37% Olympic Dam 24,366 15,127 29,651 96% 22% Total 51,927 31,331 67,435 115% 30% Silver in concentrate (ozs) Escondida 1,229 1,053 1,323 26% 8% Antamina 1,345 883 1,446 64% 8% Olympic Dam 163 149 188 26% 15% Total 2,737 2,085 2,957 42% 8% Uranium in concentrate (t) Olympic Dam 916 806 1,060 31% 16% Molybdenum in concentrate (t) Antamina 561 178 225 27% (60%) Iron-ore (kt) Newman 18,008 17,238 17,751 3% (1%) Area C 12,384 13,260 12,179 (8%) (2%) Yandi 15,729 17,680 17,555 (1%) 12% Jimblebar 6,057 6,000 5,178 (14%) (15%) Wheelarra 5,409 5,083 7,386 45% 37% Total WAIO 57,587 59,261 60,049 1% 4% Samarco Total Iron-ore 57,587 59,261 60,049 1% 4% Metallurgical coal (kt) BHP Billiton Mitsubishi Alliance 8,384 9,360 8,684 (7%) 4% BHP Billiton Mitsui 2,145 2,080 1,929 (7%) (10%) Haju 102 27 (74%) Total 10,631 11,440 10,640 (7%) 0% Energy Coal (kt) USA 451 500 (100%) (100%) Australia 3,952 4,345 3,851 (11%) (3%) Colombia 2,928 2,640 2,800 6% (4%) Total 7,331 7,485 6,651 (11%) (9%) Nickel (kt) Nickel West 18.8 16.1 22.1 37% 18%
Source: BHP, Macquarie Research, January 2017
Macquarie Wealth Management BHP Billiton
25 January 2017 4
Production guidance cut for copper but unchanged for other commodities
BHP has cut its production guidance for copper from 1.66mt to 1.62mt to reflect the power outage
at Olympic Dam. Production guidance for all other copper mines and the rest of BHP’s core
commodities remains unchanged. We note that in order to achieve guidance ranges, BHP will
need to deliver material uplifts in production rates from the 1HFY17 averages.
Fig 4 Guidance cut for copper, all others unchanged
Production Guidance 1HFY17a 2HFY17e FY17 - Low 2HFY17e FY17 - High
WAIO (mt) - 100% basis 136 129 265 139 275 Iron-ore (mt) - BHP share 118 110 228 119 237 Metallurgical coal (mt) 21 23 44 23 44 Energy coal (mt) 14 16 30 16 30 Copper (kt) - Total 712 908 1,620 908 1,620 Copper (kt) - Escondida 452 618 1,070 618 1,070 Copper (kt) - other 260 290 550 290 550 Petroleum (Mmboe) - Total 106 94 200 104 210 Petroleum (Mmboe) - Conventional 66 57 123 61 127 Petroleum (Mmboe) - US Onshore 40 37 77 43 83
Source: BHP, Macquarie Research, January 2017
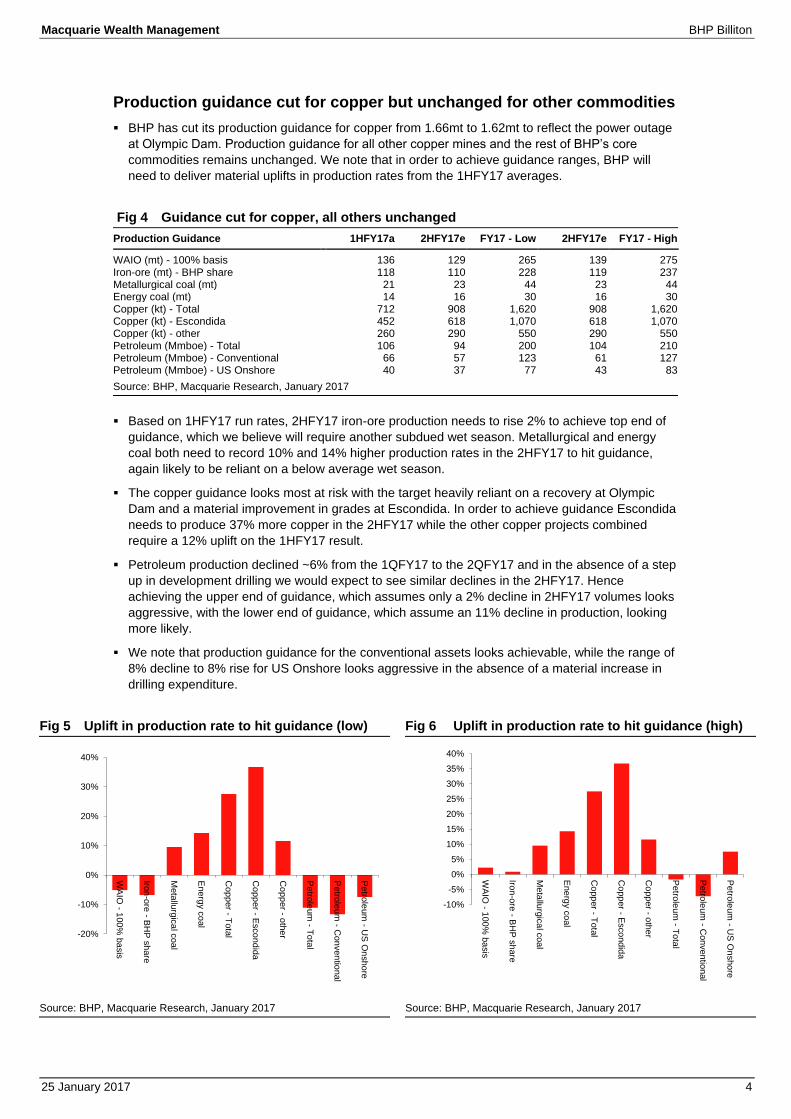
Based on 1HFY17 run rates, 2HFY17 iron-ore production needs to rise 2% to achieve top end of
guidance, which we believe will require another subdued wet season. Metallurgical and energy
coal both need to record 10% and 14% higher production rates in the 2HFY17 to hit guidance,
again likely to be reliant on a below average wet season.
The copper guidance looks most at risk with the target heavily reliant on a recovery at Olympic
Dam and a material improvement in grades at Escondida. In order to achieve guidance Escondida
needs to produce 37% more copper in the 2HFY17 while the other copper projects combined
require a 12% uplift on the 1HFY17 result.
Petroleum production declined ~6% from the 1QFY17 to the 2QFY17 and in the absence of a step
up in development drilling we would expect to see similar declines in the 2HFY17. Hence
achieving the upper end of guidance, which assumes only a 2% decline in 2HFY17 volumes looks
aggressive, with the lower end of guidance, which assume an 11% decline in production, looking
more likely.
We note that production guidance for the conventional assets looks achievable, while the range of
8% decline to 8% rise for US Onshore looks aggressive in the absence of a material increase in
drilling expenditure.
Fig 5 Uplift in production rate to hit guidance (low) Fig 6 Uplift in production rate to hit guidance (high)
Source: BHP, Macquarie Research, January 2017 Source: BHP, Macquarie Research, January 2017
-20%
-10%
0%
10%
20%
30%
40%
WA
IO - 1
00
% b
asis
Iron
-ore
- BH
P s
hare
Meta
llurg
ica
l coa
l
Ene
rgy c
oal
Co
pp
er - T
ota
l
Co
pp
er - E
sco
nd
ida
Co
pp
er - o
the
r
Petro
leum
- To
tal
Petro
leum
- Con
ven
tional
Petro
leum
- US
On
sho
re
-10%
-5%
0%
5%
10%
15%
20%
25%
30%
35%
40%
WA
IO - 1
00
% b
asis
Iron
-ore
- BH
P s
hare
Meta
llurg
ica
l coa
l
Ene
rgy c
oal
Co
pp
er - T
ota
l
Co
pp
er - E
sco
nd
ida
Co
pp
er - o
the
r
Petro
leum
- To
tal
Petro
leum
- Con
ven
tional
Petro
leum
- US
On
sho
re
Macquarie Wealth Management BHP Billiton
25 January 2017 5
Two major project completions and only two remaining
The Escondida Water Supply project (desalination plant and pipeline) is expected to deliver first
water in the 3QFY17. The Bass Strait Longford Gas Conditioning Plant also delivered first gas in
the 2QFY17. BHP now has two major projects still underway, the Jansen Potash development and
the North West Shelf Greater Western Flank-B.
Fig 7 Only two major projects remain underway
Capex projects Capex (US$m) Completion date Progress
North West Shelf Greater Western Flank - B 314 CY19 27% Jansen Potash 2,600 na 64% Total 2,914
Source: BHP, Macquarie Research, January 2017
Petroleum capex guidance unchanged but a step up in exploration
BHP has reiterated its capex guidance of the petroleum division of US$1.4bn, split US$800m on
conventional and US$600m for onshore. Exploration expenditure was US$364m in the 1HFY17
and BHP has upgrade its forecast spend by US$120m to US$820m for FY17, implying a 2HFY17
spend of US$456m. The last two wells in Trinidad & Tobago were failures and drilling is now
focused on the Wildling well in the Gulf of Mexico.
Fig 8 BHP offshore petroleum exploration well results 2016/2017
Location Well Target Ownership Depth Status
Gulf of Mexico - GC609 Shenzi North - ST1 Oil 44.00% 8,315m Plugged and abandoned Gulf of Mexico - GC609 Shenzi North - ST2 Oil 44.00% 9,332m Hydrocarbons encountered, Plugged and abandoned Gulf of Mexico - GC609 Shenzi North - ST3 Oil 72.00% 9,577m Hydrocarbons encountered, Plugged and abandoned Trinidad & Tobago Angostura - Block 3A Ruby-3 Oil 25.50% 1,996m Hydrocarbons encountered, Plugged and abandoned Trinidad & Tobago - Block 5 LeClerc-1 Oil/Gas 65% 5,771m Hydrocarbons encountered, Plugged and abandoned Trinidad & Tobago - Block 5 LeClerc-ST1 Oil/Gas 100% 6,973m Hydrocarbons encountered, Plugged and abandoned Gulf of Mexico - GC564 Caicos-1 Oil 100% 3,135m Hydrocarbons encountered, Plugged and abandoned Trinidad & Tobago - Block 23a Burrokeet-1 Oil 70% 3,337m Plugged and abandoned Trinidad & Tobago - Block 23a Burrokeet-1 Oil 70% 7,348m Plugged and abandoned Gulf of Mexico - GC564 Wildling-1 Oil 100% TBC TBC
Source: BHP, Macquarie Research, January 2017
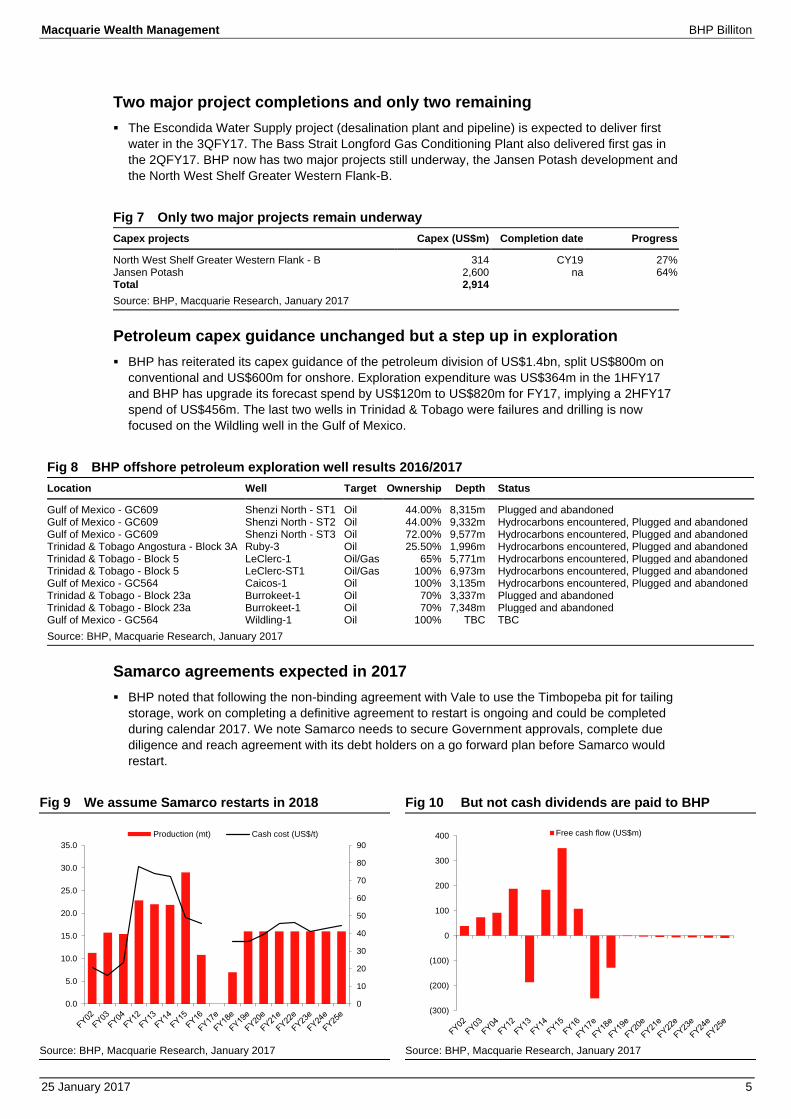
Samarco agreements expected in 2017
BHP noted that following the non-binding agreement with Vale to use the Timbopeba pit for tailing
storage, work on completing a definitive agreement to restart is ongoing and could be completed
during calendar 2017. We note Samarco needs to secure Government approvals, complete due
diligence and reach agreement with its debt holders on a go forward plan before Samarco would
restart.
Fig 9 We assume Samarco restarts in 2018 Fig 10 But not cash dividends are paid to BHP
Source: BHP, Macquarie Research, January 2017 Source: BHP, Macquarie Research, January 2017
0
10
20
30
40
50
60
70
80
90
0.0
5.0
10.0
15.0
20.0
25.0
30.0
35.0
Production (mt) Cash cost (US$/t)
(300)
(200)
(100)
0
100
200
300
400 Free cash flow (US$m)
Macquarie Wealth Management BHP Billiton
25 January 2017 6
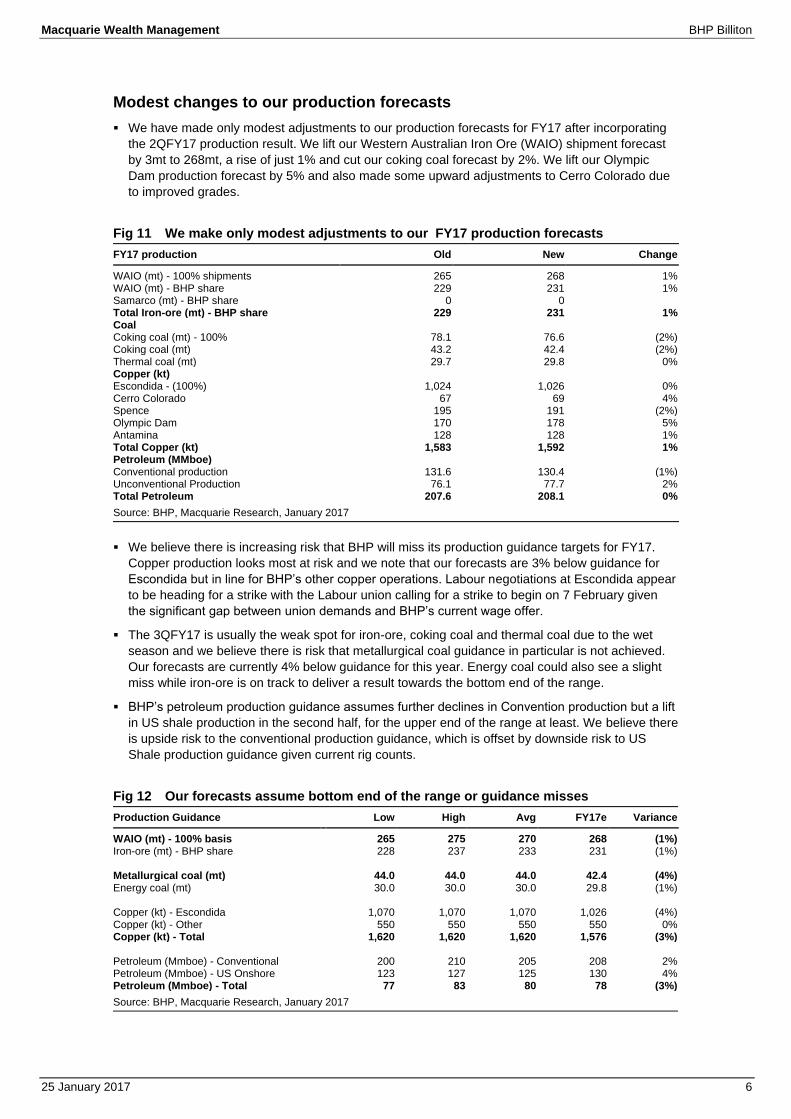
Modest changes to our production forecasts
We have made only modest adjustments to our production forecasts for FY17 after incorporating
the 2QFY17 production result. We lift our Western Australian Iron Ore (WAIO) shipment forecast
by 3mt to 268mt, a rise of just 1% and cut our coking coal forecast by 2%. We lift our Olympic
Dam production forecast by 5% and also made some upward adjustments to Cerro Colorado due
to improved grades.
Fig 11 We make only modest adjustments to our FY17 production forecasts
FY17 production Old New Change
WAIO (mt) - 100% shipments 265 268 1% WAIO (mt) - BHP share 229 231 1% Samarco (mt) - BHP share 0 0 Total Iron-ore (mt) - BHP share 229 231 1% Coal Coking coal (mt) - 100% 78.1 76.6 (2%) Coking coal (mt) 43.2 42.4 (2%) Thermal coal (mt) 29.7 29.8 0% Copper (kt) Escondida - (100%) 1,024 1,026 0% Cerro Colorado 67 69 4% Spence 195 191 (2%) Olympic Dam 170 178 5% Antamina 128 128 1% Total Copper (kt) 1,583 1,592 1% Petroleum (MMboe) Conventional production 131.6 130.4 (1%) Unconventional Production 76.1 77.7 2% Total Petroleum 207.6 208.1 0%
Source: BHP, Macquarie Research, January 2017
We believe there is increasing risk that BHP will miss its production guidance targets for FY17.
Copper production looks most at risk and we note that our forecasts are 3% below guidance for
Escondida but in line for BHP’s other copper operations. Labour negotiations at Escondida appear
to be heading for a strike with the Labour union calling for a strike to begin on 7 February given
the significant gap between union demands and BHP’s current wage offer.
The 3QFY17 is usually the weak spot for iron-ore, coking coal and thermal coal due to the wet
season and we believe there is risk that metallurgical coal guidance in particular is not achieved.
Our forecasts are currently 4% below guidance for this year. Energy coal could also see a slight
miss while iron-ore is on track to deliver a result towards the bottom end of the range.
BHP’s petroleum production guidance assumes further declines in Convention production but a lift
in US shale production in the second half, for the upper end of the range at least. We believe there
is upside risk to the conventional production guidance, which is offset by downside risk to US
Shale production guidance given current rig counts.
Fig 12 Our forecasts assume bottom end of the range or guidance misses
Production Guidance Low High Avg FY17e Variance
WAIO (mt) - 100% basis 265 275 270 268 (1%) Iron-ore (mt) - BHP share 228 237 233 231 (1%) Metallurgical coal (mt) 44.0 44.0 44.0 42.4 (4%) Energy coal (mt) 30.0 30.0 30.0 29.8 (1%) Copper (kt) - Escondida 1,070 1,070 1,070 1,026 (4%) Copper (kt) - Other 550 550 550 550 0% Copper (kt) - Total 1,620 1,620 1,620 1,576 (3%) Petroleum (Mmboe) - Conventional 200 210 205 208 2% Petroleum (Mmboe) - US Onshore 123 127 125 130 4% Petroleum (Mmboe) - Total 77 83 80 78 (3%)
Source: BHP, Macquarie Research, January 2017
Macquarie Wealth Management BHP Billiton
25 January 2017 7
Only minimal changes to earnings changes
We have made only modest changes to our earnings forecasts after incorporating the 2QFY17
production report. Our forward EPS forecasts fall less than 1% for FY17 – FY19 and rise less than
1% for FY20-FY25. We keep our price targets unchanged at A$31.00/£16.70/ZAR290.
Fig 13 Minimal changes to earnings
EPS (US¢) FY17e FY18e FY19e FY20e FY21e
Old forecast 132 98 90 100 125 New forecast 131 97 90 100 126 Change (1%) (0%) (1%) 1% 1%
Source: BHP, Macquarie Research, January 2017
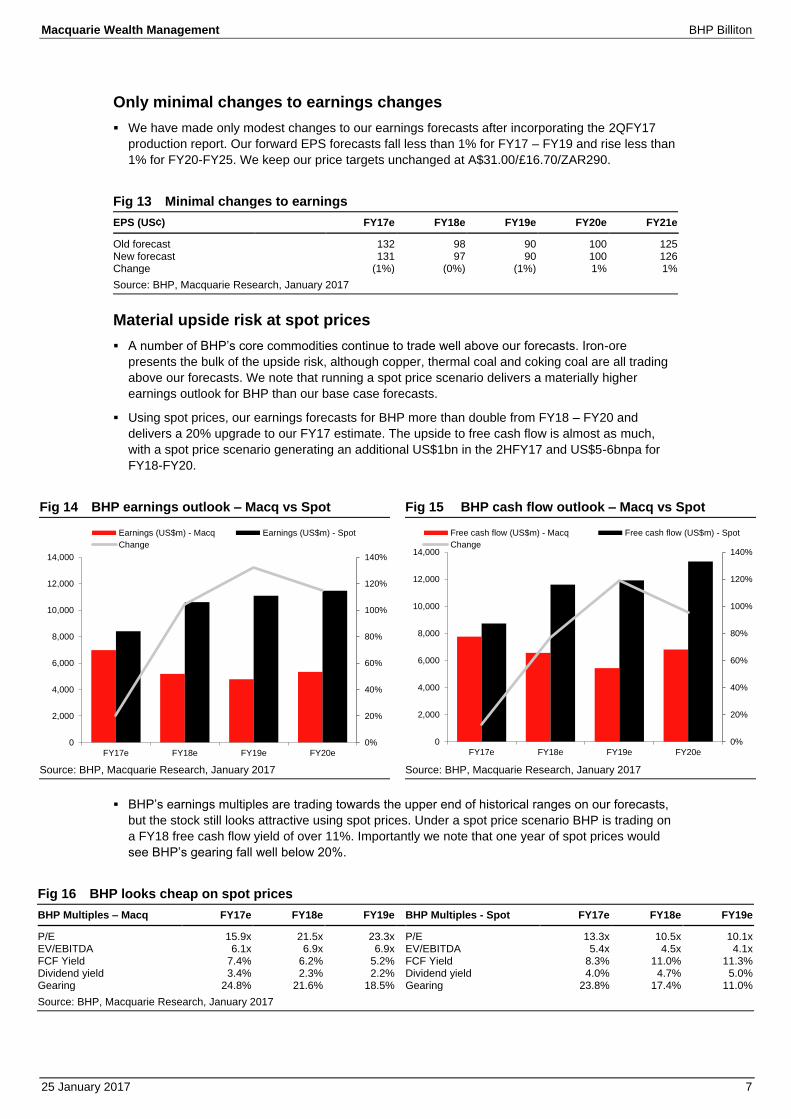
Material upside risk at spot prices
A number of BHP’s core commodities continue to trade well above our forecasts. Iron-ore
presents the bulk of the upside risk, although copper, thermal coal and coking coal are all trading
above our forecasts. We note that running a spot price scenario delivers a materially higher
earnings outlook for BHP than our base case forecasts.
Using spot prices, our earnings forecasts for BHP more than double from FY18 – FY20 and
delivers a 20% upgrade to our FY17 estimate. The upside to free cash flow is almost as much,
with a spot price scenario generating an additional US$1bn in the 2HFY17 and US$5-6bnpa for
FY18-FY20.
Fig 14 BHP earnings outlook – Macq vs Spot Fig 15 BHP cash flow outlook – Macq vs Spot
Source: BHP, Macquarie Research, January 2017 Source: BHP, Macquarie Research, January 2017
BHP’s earnings multiples are trading towards the upper end of historical ranges on our forecasts,
but the stock still looks attractive using spot prices. Under a spot price scenario BHP is trading on
a FY18 free cash flow yield of over 11%. Importantly we note that one year of spot prices would
see BHP’s gearing fall well below 20%.
Fig 16 BHP looks cheap on spot prices
BHP Multiples – Macq FY17e FY18e FY19e BHP Multiples - Spot FY17e FY18e FY19e
P/E 15.9x 21.5x 23.3x P/E 13.3x 10.5x 10.1x EV/EBITDA 6.1x 6.9x 6.9x EV/EBITDA 5.4x 4.5x 4.1x FCF Yield 7.4% 6.2% 5.2% FCF Yield 8.3% 11.0% 11.3% Dividend yield 3.4% 2.3% 2.2% Dividend yield 4.0% 4.7% 5.0% Gearing 24.8% 21.6% 18.5% Gearing 23.8% 17.4% 11.0%
Source: BHP, Macquarie Research, January 2017
0%
20%
40%
60%
80%
100%
120%
140%
0
2,000
4,000
6,000
8,000
10,000
12,000
14,000
FY17e FY18e FY19e FY20e
Earnings (US$m) - Macq Earnings (US$m) - Spot
Change
0%
20%
40%
60%
80%
100%
120%
140%
0
2,000
4,000
6,000
8,000
10,000
12,000
14,000
FY17e FY18e FY19e FY20e
Free cash flow (US$m) - Macq Free cash flow (US$m) - Spot
Change
Macquarie Wealth Management BHP Billiton
25 January 2017 8
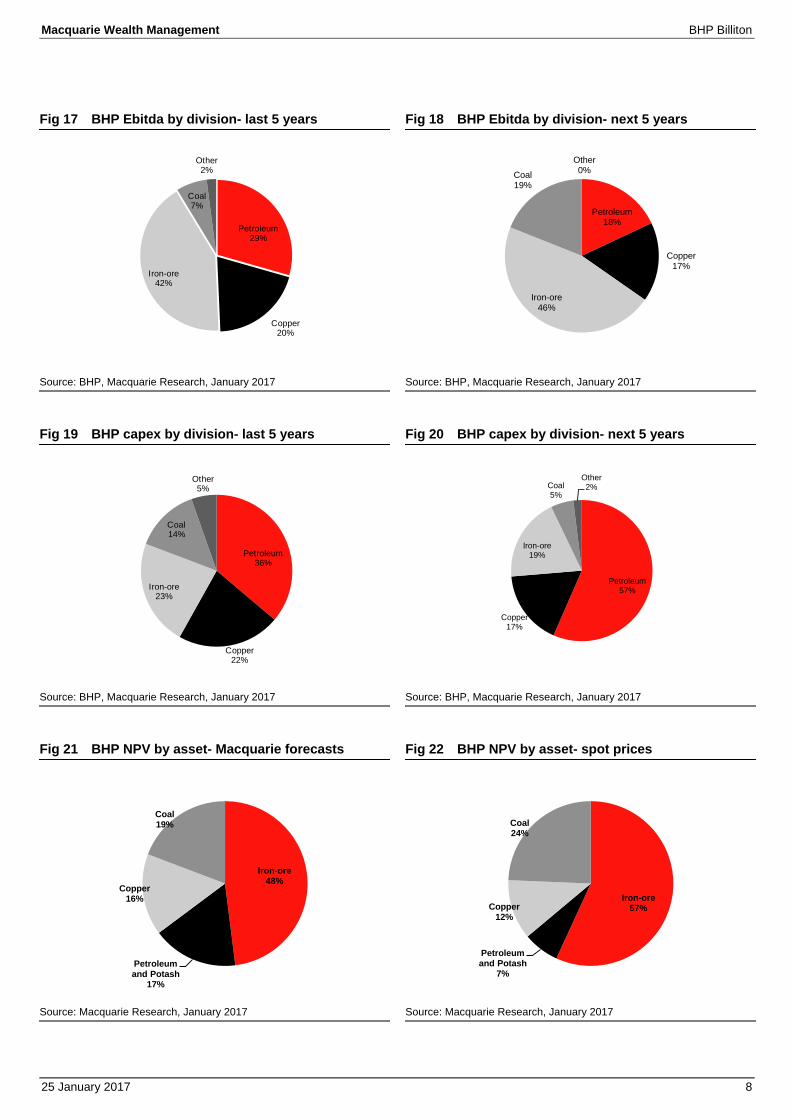
Fig 17 BHP Ebitda by division- last 5 years Fig 18 BHP Ebitda by division- next 5 years
Source: BHP, Macquarie Research, January 2017 Source: BHP, Macquarie Research, January 2017
Fig 19 BHP capex by division- last 5 years Fig 20 BHP capex by division- next 5 years
Source: BHP, Macquarie Research, January 2017 Source: BHP, Macquarie Research, January 2017
Fig 21 BHP NPV by asset- Macquarie forecasts Fig 22 BHP NPV by asset- spot prices
Source: Macquarie Research, January 2017 Source: Macquarie Research, January 2017
Petroleum29%
Copper20%
Iron-ore42%
Coal7%
Other2%
Petroleum18%
Copper17%
Iron-ore46%
Coal19%
Other0%
Petroleum36%
Copper22%
Iron-ore23%
Coal14%
Other5%
Petroleum57%
Copper17%
Iron-ore19%
Coal5%
Other2%
Iron-ore48%
Petroleum and Potash
17%
Copper16%
Coal19%
Iron-ore57%
Petroleum and Potash
7%
Copper12%
Coal24%
Macquarie Wealth Management BHP Billiton
25 January 2017 9
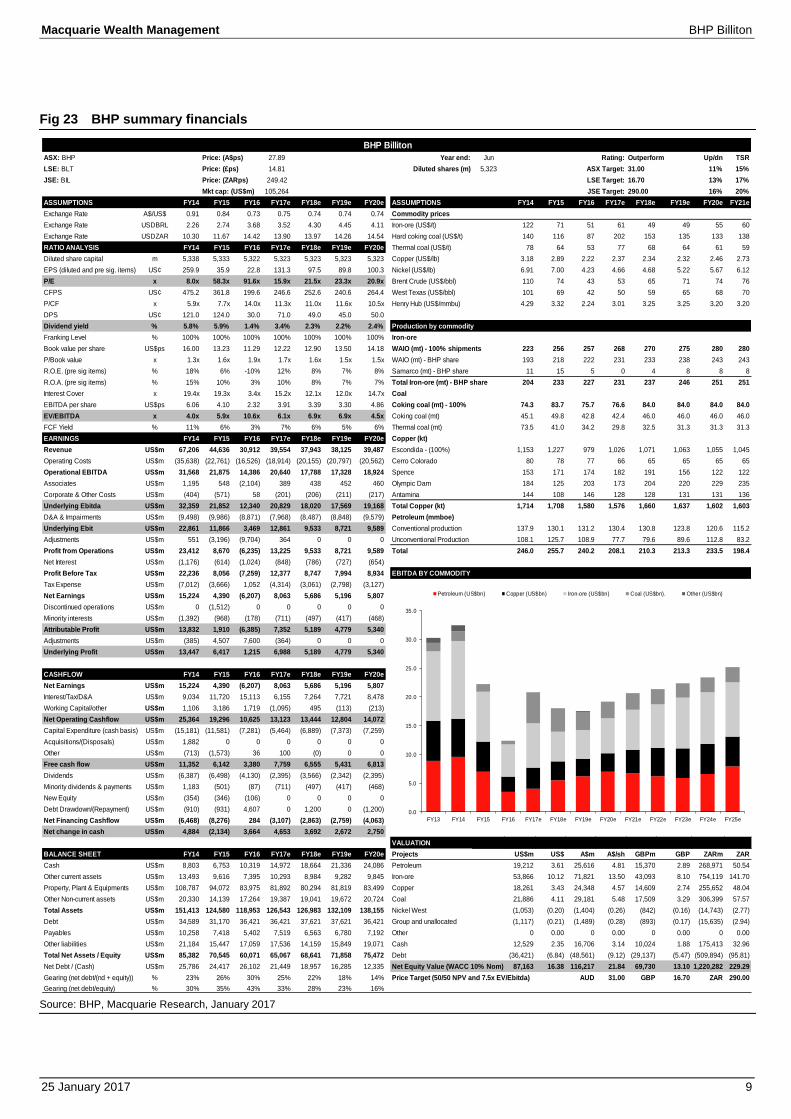
Fig 23 BHP summary financials
Source: BHP, Macquarie Research, January 2017
BHP Billiton
ASX: BHP Price: (A$ps) 27.89 Year end: Jun Rating: Outperform Up/dn TSR
LSE: BLT Price: (£ps) 14.81 Diluted shares (m) 5,323 ASX Target: 31.00 11% 15%
JSE: BIL Price: (ZARps) 249.42 LSE Target: 16.70 13% 17%
Mkt cap: (US$m) 105,264 JSE Target: 290.00 16% 20%
ASSUMPTIONS FY14 FY15 FY16 FY17e FY18e FY19e FY20e ASSUMPTIONS FY14 FY15 FY16 FY17e FY18e FY19e FY20e FY21e
Exchange Rate A$/US$ 0.91 0.84 0.73 0.75 0.74 0.74 0.74 Commodity prices
Exchange Rate USDBRL 2.26 2.74 3.68 3.52 4.30 4.45 4.11 Iron-ore (US$/t) 122 71 51 61 49 49 55 60
Exchange Rate USDZAR 10.30 11.67 14.42 13.90 13.97 14.26 14.54 Hard coking coal (US$/t) 140 116 87 202 153 135 133 138
RATIO ANALYSIS FY14 FY15 FY16 FY17e FY18e FY19e FY20e Thermal coal (US$/t) 78 64 53 77 68 64 61 59
Diluted share capital m 5,338 5,333 5,322 5,323 5,323 5,323 5,323 Copper (US$/lb) 3.18 2.89 2.22 2.37 2.34 2.32 2.46 2.73
EPS (diluted and pre sig. items) US¢ 259.9 35.9 22.8 131.3 97.5 89.8 100.3 Nickel (US$/lb) 6.91 7.00 4.23 4.66 4.68 5.22 5.67 6.12
P/E x 8.0x 58.3x 91.6x 15.9x 21.5x 23.3x 20.9x Brent Crude (US$/bbl) 110 74 43 53 65 71 74 76
CFPS US¢ 475.2 361.8 199.6 246.6 252.6 240.6 264.4 West Texas (US$/bbl) 101 69 42 50 59 65 68 70
P/CF x 5.9x 7.7x 14.0x 11.3x 11.0x 11.6x 10.5x Henry Hub (US$/mmbu) 4.29 3.32 2.24 3.01 3.25 3.25 3.20 3.20
DPS US¢ 121.0 124.0 30.0 71.0 49.0 45.0 50.0
Dividend yield % 5.8% 5.9% 1.4% 3.4% 2.3% 2.2% 2.4% Production by commodity
Franking Level % 100% 100% 100% 100% 100% 100% 100% Iron-ore
Book value per share US$ps 16.00 13.23 11.29 12.22 12.90 13.50 14.18 WAIO (mt) - 100% shipments 223 256 257 268 270 275 280 280
P/Book value x 1.3x 1.6x 1.9x 1.7x 1.6x 1.5x 1.5x WAIO (mt) - BHP share 193 218 222 231 233 238 243 243
R.O.E. (pre sig items) % 18% 6% -10% 12% 8% 7% 8% Samarco (mt) - BHP share 11 15 5 0 4 8 8 8
R.O.A. (pre sig items) % 15% 10% 3% 10% 8% 7% 7% Total Iron-ore (mt) - BHP share 204 233 227 231 237 246 251 251
Interest Cover x 19.4x 19.3x 3.4x 15.2x 12.1x 12.0x 14.7x Coal
EBITDA per share US$ps 6.06 4.10 2.32 3.91 3.39 3.30 4.86 Coking coal (mt) - 100% 74.3 83.7 75.7 76.6 84.0 84.0 84.0 84.0
EV/EBITDA x 4.0x 5.9x 10.6x 6.1x 6.9x 6.9x 4.5x Coking coal (mt) 45.1 49.8 42.8 42.4 46.0 46.0 46.0 46.0
FCF Yield % 11% 6% 3% 7% 6% 5% 6% Thermal coal (mt) 73.5 41.0 34.2 29.8 32.5 31.3 31.3 31.3
EARNINGS FY14 FY15 FY16 FY17e FY18e FY19e FY20e Copper (kt)
Revenue US$m 67,206 44,636 30,912 39,554 37,943 38,125 39,487 Escondida - (100%) 1,153 1,227 979 1,026 1,071 1,063 1,055 1,045
Operating Costs US$m (35,638) (22,761) (16,526) (18,914) (20,155) (20,797) (20,562) Cerro Colorado 80 78 77 66 65 65 65 65
Operational EBITDA US$m 31,568 21,875 14,386 20,640 17,788 17,328 18,924 Spence 153 171 174 182 191 156 122 122
Associates US$m 1,195 548 (2,104) 389 438 452 460 Olympic Dam 184 125 203 173 204 220 229 235
Corporate & Other Costs US$m (404) (571) 58 (201) (206) (211) (217) Antamina 144 108 146 128 128 131 131 136
Underlying Ebitda US$m 32,359 21,852 12,340 20,829 18,020 17,569 19,168 Total Copper (kt) 1,714 1,708 1,580 1,576 1,660 1,637 1,602 1,603
D&A & Impairments US$m (9,498) (9,986) (8,871) (7,968) (8,487) (8,848) (9,579) Petroleum (mmboe)
Underlying Ebit US$m 22,861 11,866 3,469 12,861 9,533 8,721 9,589 Conventional production 137.9 130.1 131.2 130.4 130.8 123.8 120.6 115.2
Adjustments US$m 551 (3,196) (9,704) 364 0 0 0 Unconventional Production 108.1 125.7 108.9 77.7 79.6 89.6 112.8 83.2
Profit from Operations US$m 23,412 8,670 (6,235) 13,225 9,533 8,721 9,589 Total 246.0 255.7 240.2 208.1 210.3 213.3 233.5 198.4
Net Interest US$m (1,176) (614) (1,024) (848) (786) (727) (654)
Profit Before Tax US$m 22,236 8,056 (7,259) 12,377 8,747 7,994 8,934 EBITDA BY COMMODITY
Tax Expense US$m (7,012) (3,666) 1,052 (4,314) (3,061) (2,798) (3,127)
Net Earnings US$m 15,224 4,390 (6,207) 8,063 5,686 5,196 5,807
Discontinued operations US$m 0 (1,512) 0 0 0 0 0
Minority interests US$m (1,392) (968) (178) (711) (497) (417) (468)
Attributable Profit US$m 13,832 1,910 (6,385) 7,352 5,189 4,779 5,340
Adjustments US$m (385) 4,507 7,600 (364) 0 0 0
Underlying Profit US$m 13,447 6,417 1,215 6,988 5,189 4,779 5,340
CASHFLOW FY14 FY15 FY16 FY17e FY18e FY19e FY20e
Net Earnings US$m 15,224 4,390 (6,207) 8,063 5,686 5,196 5,807
Interest/Tax/D&A US$m 9,034 11,720 15,113 6,155 7,264 7,721 8,478
Working Capital/other US$m 1,106 3,186 1,719 (1,095) 495 (113) (213)
Net Operating Cashflow US$m 25,364 19,296 10,625 13,123 13,444 12,804 14,072
Capital Expenditure (cash basis) US$m (15,181) (11,581) (7,281) (5,464) (6,889) (7,373) (7,259)
Acquisitions/(Disposals) US$m 1,882 0 0 0 0 0 0
Other US$m (713) (1,573) 36 100 (0) 0 0
Free cash flow US$m 11,352 6,142 3,380 7,759 6,555 5,431 6,813
Dividends US$m (6,387) (6,498) (4,130) (2,395) (3,566) (2,342) (2,395)
Minority dividends & payments US$m 1,183 (501) (87) (711) (497) (417) (468)
New Equity US$m (354) (346) (106) 0 0 0 0
Debt Drawdown/(Repayment) US$m (910) (931) 4,607 0 1,200 0 (1,200)
Net Financing Cashflow US$m (6,468) (8,276) 284 (3,107) (2,863) (2,759) (4,063)
Net change in cash US$m 4,884 (2,134) 3,664 4,653 3,692 2,672 2,750
VALUATION
BALANCE SHEET FY14 FY15 FY16 FY17e FY18e FY19e FY20e Projects US$m US$ A$m A$/sh GBPm GBP ZARm ZAR
Cash US$m 8,803 6,753 10,319 14,972 18,664 21,336 24,086 Petroleum 19,212 3.61 25,616 4.81 15,370 2.89 268,971 50.54
Other current assets US$m 13,493 9,616 7,395 10,293 8,984 9,282 9,845 Iron-ore 53,866 10.12 71,821 13.50 43,093 8.10 754,119 141.70
Property, Plant & Equipments US$m 108,787 94,072 83,975 81,892 80,294 81,819 83,499 Copper 18,261 3.43 24,348 4.57 14,609 2.74 255,652 48.04
Other Non-current assets US$m 20,330 14,139 17,264 19,387 19,041 19,672 20,724 Coal 21,886 4.11 29,181 5.48 17,509 3.29 306,399 57.57
Total Assets US$m 151,413 124,580 118,953 126,543 126,983 132,109 138,155 Nickel West (1,053) (0.20) (1,404) (0.26) (842) (0.16) (14,743) (2.77)
Debt US$m 34,589 31,170 36,421 36,421 37,621 37,621 36,421 Group and unallocated (1,117) (0.21) (1,489) (0.28) (893) (0.17) (15,635) (2.94)
Payables US$m 10,258 7,418 5,402 7,519 6,563 6,780 7,192 Other 0 0.00 0 0.00 0 0.00 0 0.00
Other liabilities US$m 21,184 15,447 17,059 17,536 14,159 15,849 19,071 Cash 12,529 2.35 16,706 3.14 10,024 1.88 175,413 32.96
Total Net Assets / Equity US$m 85,382 70,545 60,071 65,067 68,641 71,858 75,472 Debt (36,421) (6.84) (48,561) (9.12) (29,137) (5.47) (509,894) (95.81)
Net Debt / (Cash) US$m 25,786 24,417 26,102 21,449 18,957 16,285 12,335 Net Equity Value (WACC 10% Nom) 87,163 16.38 116,217 21.84 69,730 13.10 1,220,282 229.29
Gearing (net debt/(nd + equity)) % 23% 26% 30% 25% 22% 18% 14% Price Target (50/50 NPV and 7.5x EV/Ebitda) AUD 31.00 GBP 16.70 ZAR 290.00
Gearing (net debt/equity) % 30% 35% 43% 33% 28% 23% 16%
0.0
5.0
10.0
15.0
20.0
25.0
30.0
35.0
FY13 FY14 FY15 FY16 FY17e FY18e FY19e FY20e FY21e FY22e FY23e FY24e FY25e
Petroleum (US$bn) Copper (US$bn) Iron-ore (US$bn) Coal (US$bn). Other (US$bn)
Macquarie Wealth Management BHP Billiton
25 January 2017 10
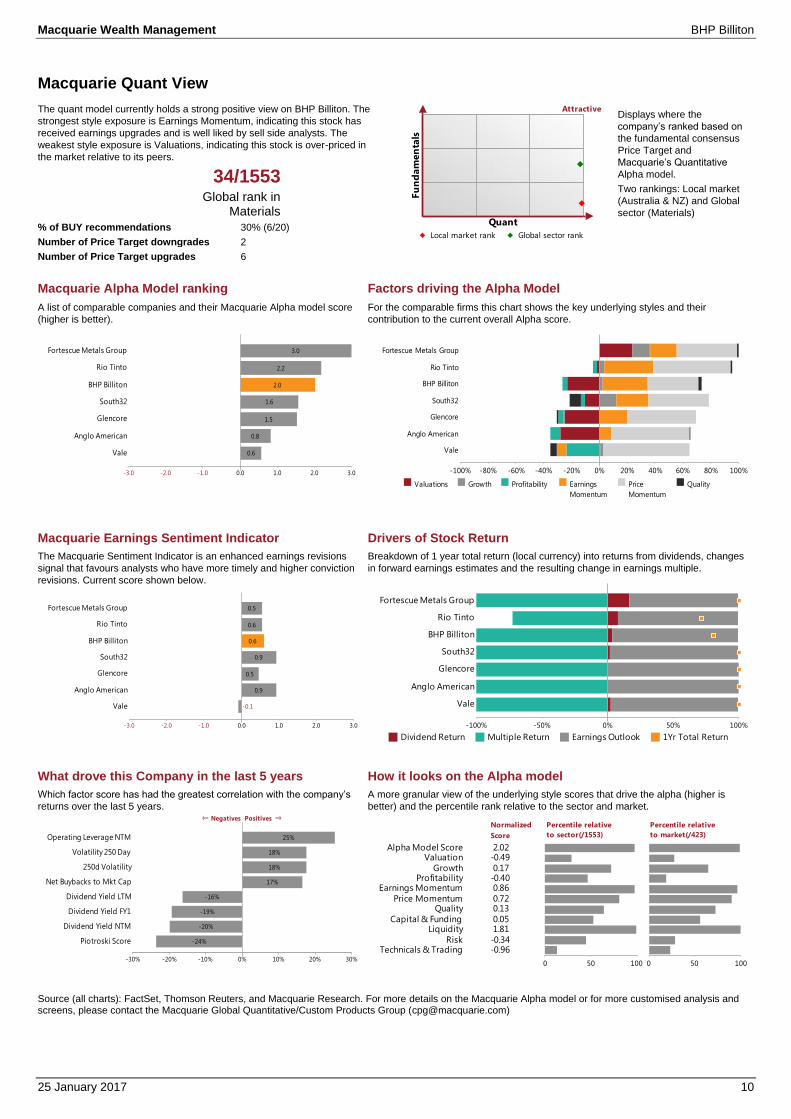
Macquarie Quant View
The quant model currently holds a strong positive view on BHP Billiton. The
strongest style exposure is Earnings Momentum, indicating this stock has
received earnings upgrades and is well liked by sell side analysts. The
weakest style exposure is Valuations, indicating this stock is over-priced in
the market relative to its peers.
Displays where the
company’s ranked based on
the fundamental consensus
Price Target and
Macquarie’s Quantitative
Alpha model.
Two rankings: Local market
(Australia & NZ) and Global
sector (Materials)
34/1553 Global rank in
Materials
% of BUY recommendations 30% (6/20)
Number of Price Target downgrades 2
Number of Price Target upgrades 6
Macquarie Alpha Model ranking Factors driving the Alpha Model
A list of comparable companies and their Macquarie Alpha model score
(higher is better).
For the comparable firms this chart shows the key underlying styles and their
contribution to the current overall Alpha score.
Macquarie Earnings Sentiment Indicator Drivers of Stock Return
The Macquarie Sentiment Indicator is an enhanced earnings revisions
signal that favours analysts who have more timely and higher conviction
revisions. Current score shown below.
Breakdown of 1 year total return (local currency) into returns from dividends, changes
in forward earnings estimates and the resulting change in earnings multiple.
What drove this Company in the last 5 years How it looks on the Alpha model
Which factor score has had the greatest correlation with the company’s
returns over the last 5 years.
A more granular view of the underlying style scores that drive the alpha (higher is
better) and the percentile rank relative to the sector and market.
Source (all charts): FactSet, Thomson Reuters, and Macquarie Research. For more details on the Macquarie Alpha model or for more customised analysis and screens, please contact the Macquarie Global Quantitative/Custom Products Group ([email protected])
Fu
nd
am
en
tals
Quant
Local market rank Global sector rank
Attractive
0.6
0.8
1.5
1.6
2.0
2.2
3.0
-3.0 -2.0 -1.0 0.0 1.0 2.0 3.0
Vale
Anglo American
Glencore
South32
BHP Billiton
Rio Tinto
Fortescue Metals Group
-100% -80% -60% -40% -20% 0% 20% 40% 60% 80% 100%
Vale
Anglo American
Glencore
South32
BHP Billiton
Rio Tinto
Fortescue Metals Group
Valuations Growth Profitability Earnings
Momentum
Price
Momentum
Quality
-0.1
0.9
0.5
0.9
0.6
0.6
0.5
-3.0 -2.0 -1.0 0.0 1.0 2.0 3.0
Vale
Anglo American
Glencore
South32
BHP Billiton
Rio Tinto
Fortescue Metals Group
-100% -50% 0% 50% 100%
Vale
Anglo American
Glencore
South32
BHP Billiton
Rio Tinto
Fortescue Metals Group
Dividend Return Multiple Return Earnings Outlook 1Yr Total Return
-24%
-20%
-19%
-16%
17%
18%
18%
25%
-30% -20% -10% 0% 10% 20% 30%
⇐ Negatives Positives ⇒
Piotroski Score
Dividend Yield NTM
Dividend Yield FY1
Dividend Yield LTM
Net Buybacks to Mkt Cap
250d Volatility
Volatility 250 Day
Operating Leverage NTM
0 1
Technicals & TradingRisk
LiquidityCapital & Funding
QualityPrice Momentum
Earnings MomentumProfitability
Growth
ValuationAlpha Model Score
-0.96-0.34
1.81 0.05
0.13 0.72
0.86-0.40 0.17
-0.49 2.02
0 1
Normalized
Score
0 50 100
Percentile relative
to sector(/1553)
0 50 100
Percentile relative
to market(/423)
Macquarie Wealth Management BHP Billiton
25 January 2017 11
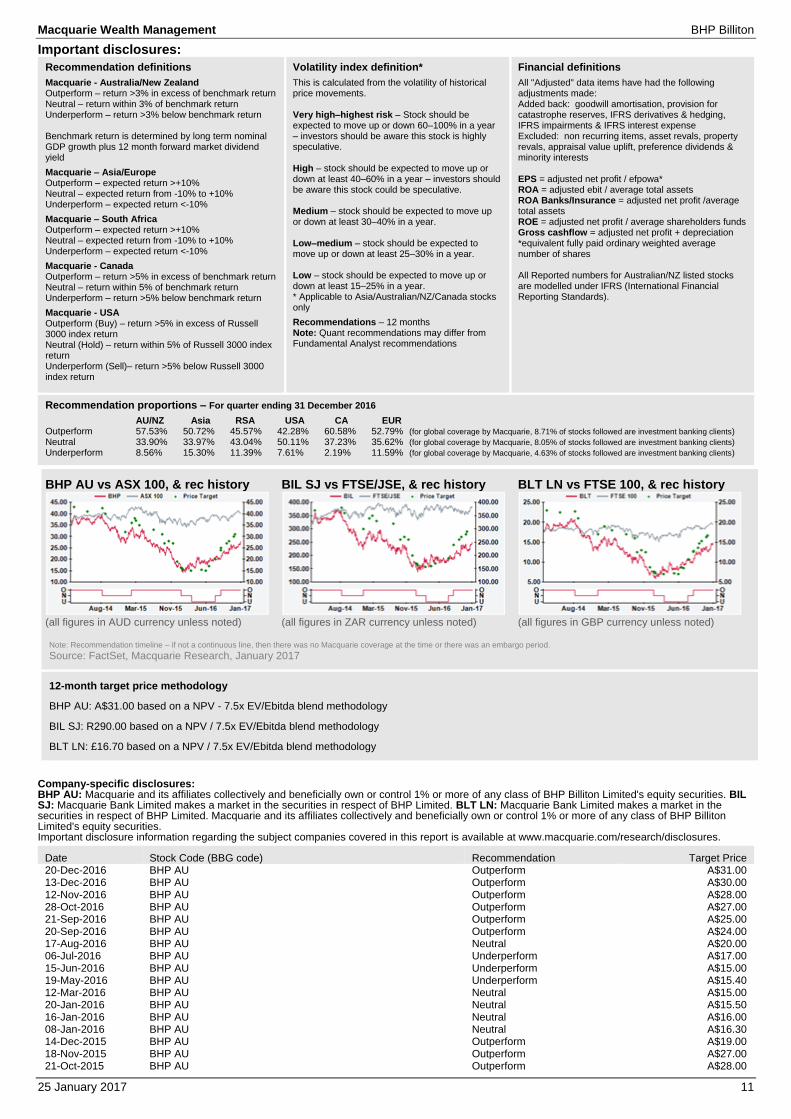
Important disclosures:
Recommendation definitions
Macquarie - Australia/New Zealand Outperform – return >3% in excess of benchmark return Neutral – return within 3% of benchmark return Underperform – return >3% below benchmark return Benchmark return is determined by long term nominal GDP growth plus 12 month forward market dividend yield
Macquarie – Asia/Europe Outperform – expected return >+10% Neutral – expected return from -10% to +10% Underperform – expected return <-10%
Macquarie – South Africa Outperform – expected return >+10% Neutral – expected return from -10% to +10% Underperform – expected return <-10%
Macquarie - Canada Outperform – return >5% in excess of benchmark return Neutral – return within 5% of benchmark return Underperform – return >5% below benchmark return
Macquarie - USA Outperform (Buy) – return >5% in excess of Russell 3000 index return Neutral (Hold) – return within 5% of Russell 3000 index return Underperform (Sell)– return >5% below Russell 3000 index return
Volatility index definition*
This is calculated from the volatility of historical price movements. Very high–highest risk – Stock should be expected to move up or down 60–100% in a year – investors should be aware this stock is highly speculative. High – stock should be expected to move up or down at least 40–60% in a year – investors should be aware this stock could be speculative. Medium – stock should be expected to move up or down at least 30–40% in a year. Low–medium – stock should be expected to move up or down at least 25–30% in a year. Low – stock should be expected to move up or down at least 15–25% in a year. * Applicable to Asia/Australian/NZ/Canada stocks only
Recommendations – 12 months Note: Quant recommendations may differ from Fundamental Analyst recommendations
Financial definitions
All "Adjusted" data items have had the following adjustments made: Added back: goodwill amortisation, provision for catastrophe reserves, IFRS derivatives & hedging, IFRS impairments & IFRS interest expense Excluded: non recurring items, asset revals, property revals, appraisal value uplift, preference dividends & minority interests EPS = adjusted net profit / efpowa* ROA = adjusted ebit / average total assets ROA Banks/Insurance = adjusted net profit /average total assets ROE = adjusted net profit / average shareholders funds Gross cashflow = adjusted net profit + depreciation *equivalent fully paid ordinary weighted average number of shares All Reported numbers for Australian/NZ listed stocks are modelled under IFRS (International Financial Reporting Standards).
Recommendation proportions – For quarter ending 31 December 2016
AU/NZ Asia RSA USA CA EUR Outperform 57.53% 50.72% 45.57% 42.28% 60.58% 52.79% (for global coverage by Macquarie, 8.71% of stocks followed are investment banking clients)
Neutral 33.90% 33.97% 43.04% 50.11% 37.23% 35.62% (for global coverage by Macquarie, 8.05% of stocks followed are investment banking clients)
Underperform 8.56% 15.30% 11.39% 7.61% 2.19% 11.59% (for global coverage by Macquarie, 4.63% of stocks followed are investment banking clients)
BHP AU vs ASX 100, & rec history
(all figures in AUD currency unless noted)
BIL SJ vs FTSE/JSE, & rec history
(all figures in ZAR currency unless noted)
BLT LN vs FTSE 100, & rec history
(all figures in GBP currency unless noted)
Note: Recommendation timeline – if not a continuous line, then there was no Macquarie coverage at the time or there was an embargo period.
Source: FactSet, Macquarie Research, January 2017
12-month target price methodology
BHP AU: A$31.00 based on a NPV - 7.5x EV/Ebitda blend methodology
BIL SJ: R290.00 based on a NPV / 7.5x EV/Ebitda blend methodology
BLT LN: £16.70 based on a NPV / 7.5x EV/Ebitda blend methodology
Company-specific disclosures: BHP AU: Macquarie and its affiliates collectively and beneficially own or control 1% or more of any class of BHP Billiton Limited's equity securities. BIL SJ: Macquarie Bank Limited makes a market in the securities in respect of BHP Limited. BLT LN: Macquarie Bank Limited makes a market in the securities in respect of BHP Limited. Macquarie and its affiliates collectively and beneficially own or control 1% or more of any class of BHP Billiton Limited's equity securities. Important disclosure information regarding the subject companies covered in this report is available at www.macquarie.com/research/disclosures.
Date Stock Code (BBG code) Recommendation Target Price 20-Dec-2016 BHP AU Outperform A$31.00 13-Dec-2016 BHP AU Outperform A$30.00 12-Nov-2016 BHP AU Outperform A$28.00 28-Oct-2016 BHP AU Outperform A$27.00 21-Sep-2016 BHP AU Outperform A$25.00 20-Sep-2016 BHP AU Outperform A$24.00 17-Aug-2016 BHP AU Neutral A$20.00 06-Jul-2016 BHP AU Underperform A$17.00 15-Jun-2016 BHP AU Underperform A$15.00 19-May-2016 BHP AU Underperform A$15.40 12-Mar-2016 BHP AU Neutral A$15.00 20-Jan-2016 BHP AU Neutral A$15.50 16-Jan-2016 BHP AU Neutral A$16.00 08-Jan-2016 BHP AU Neutral A$16.30 14-Dec-2015 BHP AU Outperform A$19.00 18-Nov-2015 BHP AU Outperform A$27.00 21-Oct-2015 BHP AU Outperform A$28.00
Macquarie Wealth Management BHP Billiton
25 January 2017 12
24-Sep-2015 BHP AU Outperform A$27.00 09-Sep-2015 BHP AU Outperform A$31.00 16-Jul-2015 BHP AU Outperform A$33.00 15-Apr-2015 BHP AU Outperform A$35.00 24-Mar-2015 BHP AU Outperform A$37.00 17-Mar-2015 BHP AU Outperform A$38.00 25-Feb-2015 BHP AU Outperform A$36.00 15-Jan-2015 BHP AU Neutral A$32.00 09-Sep-2014 BHP AU Neutral A$40.00 20-Aug-2014 BHP AU Neutral A$42.50 16-May-2014 BHP AU Outperform A$41.00 19-Feb-2014 BHP AU Outperform A$43.00
Target price risk disclosures: BHP AU: Any inability to compete successfully in their markets may harm the business. This could be a result of many factors which may include geographic mix and introduction of improved products or service offerings by competitors. The results of operations may be materially affected by global economic conditions generally, including conditions in financial markets. The company is exposed to market risks, such as changes in interest rates, foreign exchange rates and input prices. From time to time, the company will enter into transactions, including transactions in derivative instruments, to manage certain of these exposures. BIL SJ: Any inability to compete successfully in their markets may harm the business. This could be a result of many factors which may include geographic mix and introduction of improved products or service offerings by competitors. The results of operations may be materially affected by global economic conditions generally, including conditions in financial markets. The company is exposed to market risks, such as changes in interest rates, foreign exchange rates and input prices. From time to time, the company will enter into transactions, including transactions in derivative instruments, to manage certain of these exposures. BLT LN: Any inability to compete successfully in their markets may harm the business. This could be a result of many factors which may include geographic mix and introduction of improved products or service offerings by competitors. The results of operations may be materially affected by global economic conditions generally, including conditions in financial markets. The company is exposed to market risks, such as changes in interest rates, foreign exchange rates and input prices. From time to time, the company will enter into transactions, including transactions in derivative instruments, to manage certain of these exposures.
Analyst certification: We hereby certify that all of the views expressed in this report accurately reflect our personal views about the subject company or companies and its or their securities. We also certify that no part of our compensation was, is or will be, directly or indirectly, related to the specific recommendations or views expressed in this report. The Analysts responsible for preparing this report receive compensation from Macquarie that is based upon various factors including Macquarie Group Limited (MGL) total revenues, a portion of which are generated by Macquarie Group’s Investment Banking activities. General disclosure: This research has been issued by Macquarie Securities (Australia) Limited ABN 58 002 832 126, AFSL 238947, a Participant of the ASX and Chi-X Australia Pty Limited. This research is distributed in Australia by Macquarie Wealth Management, a division of Macquarie Equities Limited ABN 41 002 574 923 AFSL 237504 ("MEL"), a Participant of the ASX, and in New Zealand by Macquarie Equities New Zealand Limited (“MENZ”) an NZX Firm. Macquarie Private Wealth’s services in New Zealand are provided by MENZ. Macquarie Bank Limited (ABN 46 008 583 542, AFSL No. 237502) (“MBL”) is a company incorporated in Australia and authorised under the Banking Act 1959 (Australia) to conduct banking business in Australia. None of MBL, MGL or MENZ is registered as a bank in New Zealand by the Reserve Bank of New Zealand under the Reserve Bank of New Zealand Act 1989. Apart from Macquarie Bank Limited ABN 46 008 583 542 (MBL), any MGL subsidiary noted in this research, , is not an authorised deposit-taking institution for the purposes of the Banking Act 1959 (Australia) and that subsidiary’s obligations do not represent deposits or other liabilities of MBL. MBL does not guarantee or otherwise provide assurance in respect of the obligations of that subsidiary, unless noted otherwise. This research contains general advice and does not take account of your objectives, financial situation or needs. Before acting on this general advice, you should consider the appropriateness of the advice having regard to your situation. We recommend you obtain financial, legal and taxation advice before making any financial investment decision. This research has been prepared for the use of the clients of the Macquarie Group and must not be copied, either in whole or in part, or distributed to any other person. If you are not the intended recipient, you must not use or disclose this research in any way. If you received it in error, please tell us immediately by return e-mail and delete the document. We do not guarantee the integrity of any e-mails or attached files and are not responsible for any changes made to them by any other person. Nothing in this research shall be construed as a solicitation to buy or sell any security or product, or to engage in or refrain from engaging in any transaction. This research is based on information obtained from sources believed to be reliable, but the Macquarie Group does not make any representation or warranty that it is accurate, complete or up to date. We accept no obligation to correct or update the information or opinions in it. Opinions expressed are subject to change without notice. The Macquarie Group accepts no liability whatsoever for any direct, indirect, consequential or other loss arising from any use of this research and/or further communication in relation to this research. The Macquarie Group produces a variety of research products, recommendations contained in one type of research product may differ from recommendations contained in other types of research. The Macquarie Group has established and implemented a conflicts policy at group level, which may be revised and updated from time to time, pursuant to regulatory requirements; which sets out how we must seek to identify and manage all material conflicts of interest. The Macquarie Group, its officers and employees may have conflicting roles in the financial products referred to in this research and, as such, may effect transactions which are not consistent with the recommendations (if any) in this research. The Macquarie Group may receive fees, brokerage or commissions for acting in those capacities and the reader should assume that this is the case. The Macquarie Group‘s employees or officers may provide oral or written opinions to its clients which are contrary to the opinions expressed in this research. Important disclosure information regarding the subject companies covered in this report is available at www.macquarie.com/disclosures © Macquarie Group
This publication was disseminated on 25 January 2017 at 06:56 UTC.