Embed Size (px)
Citation preview

BULLETIN | D E C E M B E R Q UA R T E R 2011 2 3
Australia’s Tourism Industry
IntroductionThe tourism industry makes a significant contribution to the overall level of economic activity and employment in Australia. This article discusses this contribution and how it has changed over time, drawing on both publicly available data and insights from the Bank’s liaison program. In particular, the article examines trends in two broad categories of tourism expenditure: spending by Australian residents within Australia (domestic tourism expenditure) and spending by overseas visitors to Australia (tourism exports).
Measuring Australia’s Tourism IndustryIndustries are normally classified according to their production. However, tourism is unique among industries. Its output is determined by consumption spending – in this case, the spending of tourists and other visitors. Measuring tourism spending requires identifying visitors and their expenditure patterns. This is a challenging task, and so measures of the economic significance of tourism have traditionally been limited. However, since 2000 the Australian Bureau of Statistics (ABS) has published Australia’s Tourism Satellite Account (TSA) which provides considerable detail on the tourism
Karen Hooper and Marileze van Zyl*
This article examines developments in Australia’s tourism industry over the past decade. It focuses on the increased tendency for Australians to holiday overseas and the compositional changes in the inbound visitor market, which together have contributed to subdued growth in parts of the tourism industry in recent years.
* The authors are from Economic Analysis Department.
industry.1 Specifically, the annual TSA measures the direct contribution of tourism to the economy by aggregating the output of each industry that is consumed by ‘visitors’. In this way, tourism output is brought into the national accounts framework as a composite of the output of conventionally defined industries.
In order to measure the size of the tourism industry, spending by ‘visitors’ must be clearly distinguished from that of regular residents in a particular region. The definition of visitors adopted in the TSA, consistent with international standards, defines a visitor to include any person travelling to a region for a period of less than one year that is outside of their normal geographic environment. Notably, measures of tourism output are not just restricted to spending on leisure activity but also include spending on travel for business, education, visiting friends and relatives (VFR), training and other personal reasons.2 (In addition to the TSA, higher frequency data on the characteristics and travel patterns of domestic
1 Publication of the TSA represents recognition of the economic importance of tourism, the demand for greater information on the industry and developments in establishing appropriate international statistical standards. The Australian TSA is based on international standards developed by an Inter-Secretariat Working Group on Tourism Statistics, which includes the Organisation for Economic Co-operation and Development (OECD).
2 There are some exclusions. Students, including those from overseas, are counted only as visitors if their course is for less than one year; trips associated with employment and routine travel are excluded; day trips are only counted where they involve a round-trip distance of at least 50 kilometres from home; and overnight trips must involve a stay at least 40 kilometres from home. For further details, see ABS (2010).
Australia's Tourism Industry.indd 23 14/12/11 10:50 AM
RESERVE BANK OF AUSTRALIA
AUSTRALIA’S TOURISM INDUSTRY
2 4
and international visitors are available from the National Visitor Survey and International Visitor Survey, which are published quarterly by Tourism Research Australia (TRA). The ABS also publishes monthly data on overseas arrivals and departures.)
The TSA data show that tourism output was around $34 billion in 2009/10, or 2.6 per cent of Australia’s GDP (Graph 1).3 This share has steadily declined since its peak of 3.4 per cent at the time of the Sydney Olympics in 2000/01, with the decline since then largely accounted for by a fall in the contribution of domestic tourism.
3 In 2009/10, tourism contributed 2.6 per cent of total industry gross value added (a measure of output which excludes taxes). For purposes of comparison, agriculture and mining recorded output shares of 2.3 per cent and 8.4 per cent.
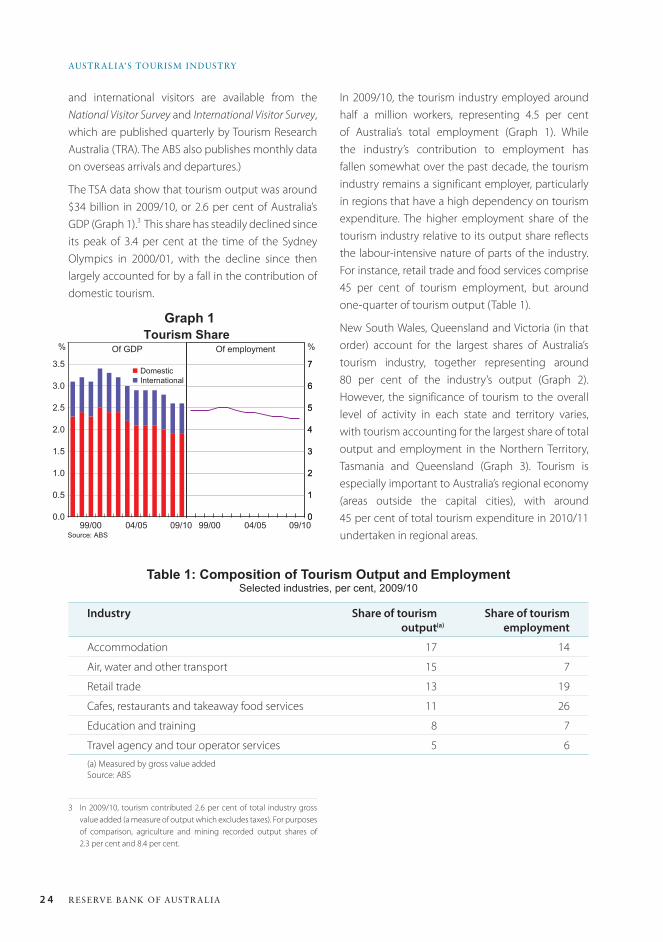
Table 1: Composition of Tourism Output and EmploymentSelected industries, per cent, 2009/10
Industry Share of tourismoutput
Share of tourism employment
Accommodation 17 14
Air, water and other transport 15 7
Retail trade 13 19
Cafes, restaurants and takeaway food services 11 26
Education and training 8 7
Travel agency and tour operator services 5 6(a) Measured by gross value addedSource: ABS
In 2009/10, the tourism industry employed around half a million workers, representing 4.5 per cent of Australia’s total employment (Graph 1). While the industry’s contribution to employment has fallen somewhat over the past decade, the tourism industry remains a significant employer, particularly in regions that have a high dependency on tourism expenditure. The higher employment share of the tourism industry relative to its output share reflects the labour-intensive nature of parts of the industry. For instance, retail trade and food services comprise 45 per cent of tourism employment, but around one-quarter of tourism output (Table 1).
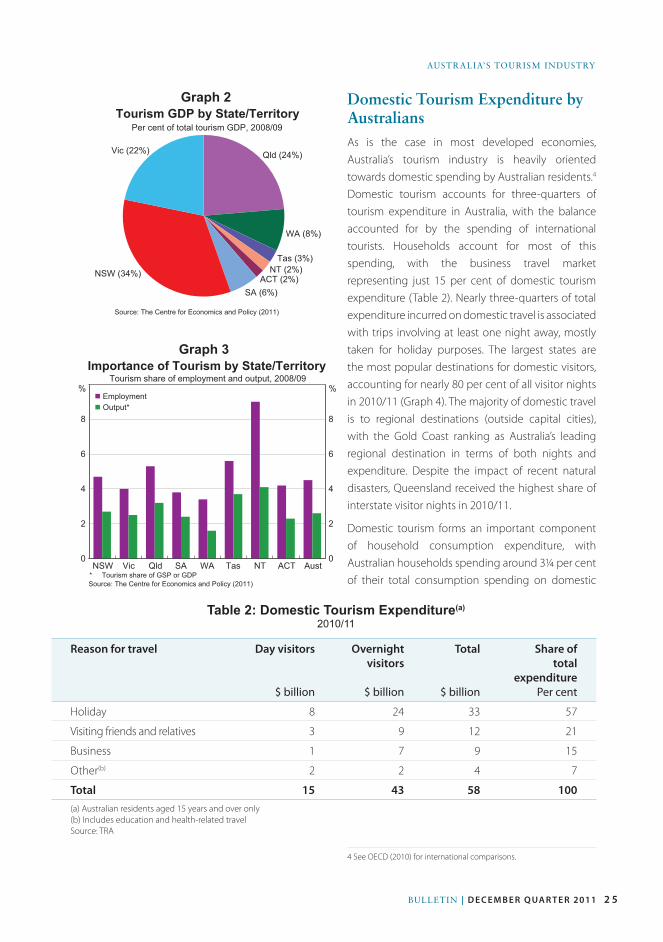
New South Wales, Queensland and Victoria (in that order) account for the largest shares of Australia’s tourism industry, together representing around 80 per cent of the industry’s output (Graph 2). However, the significance of tourism to the overall level of activity in each state and territory varies, with tourism accounting for the largest share of total output and employment in the Northern Territory, Tasmania and Queensland (Graph 3). Tourism is especially important to Australia’s regional economy (areas outside the capital cities), with around 45 per cent of total tourism expenditure in 2010/11 undertaken in regional areas.
0.0
0.5
1.0
1.5
2.0
2.5
3.0
3.5
Tourism Share
Source: ABS
%
n Domestic
%
99/00
n International
0
1
2
3
4
5
6
7
0
1
2
3
4
5
6
7
Of GDP Of employment
09/1004/05 99/00 09/1004/05
Graph 1
(a)
Australia's Tourism Industry.indd 24 14/12/11 10:50 AM
BULLETIN | D E C E M B E R Q UA R T E R 2011
AUSTRALIA’S TOURISM INDUSTRY
2 5
Graph 3
Graph 2
0
2
4
6
8
0
2
4
6
8
Importance of Tourism by State/Territory
Tourism share of employment and output, 2008/09
Source: The Centre for Economics and Policy (2011)
NSW
%n Employment
%
n Output*
Vic Qld SA WA Tas NT ACT Aust* Tourism share of GSP or GDP
Tourism GDP by State/Territory
Per cent of total tourism GDP, 2008/09
Source: The Centre for Economics and Policy (2011)
NSW (34%)
Vic (22%)Qld (24%)
WA (8%)
Tas (3%)
NT (2%)ACT (2%)
SA (6%)
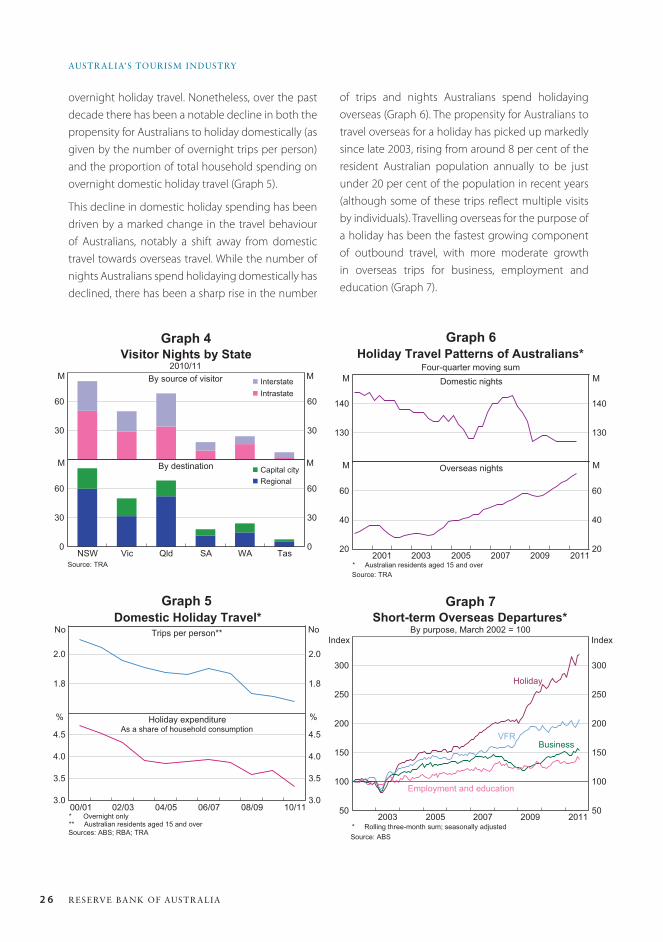
Domestic Tourism Expenditure by AustraliansAs is the case in most developed economies, Australia’s tourism industry is heavily oriented towards domestic spending by Australian residents.4 Domestic tourism accounts for three-quarters of tourism expenditure in Australia, with the balance accounted for by the spending of international tourists. Households account for most of this spending, with the business travel market representing just 15 per cent of domestic tourism expenditure (Table 2). Nearly three-quarters of total expenditure incurred on domestic travel is associated with trips involving at least one night away, mostly taken for holiday purposes. The largest states are the most popular destinations for domestic visitors, accounting for nearly 80 per cent of all visitor nights in 2010/11 (Graph 4). The majority of domestic travel is to regional destinations (outside capital cities), with the Gold Coast ranking as Australia’s leading regional destination in terms of both nights and expenditure. Despite the impact of recent natural disasters, Queensland received the highest share of interstate visitor nights in 2010/11.
Domestic tourism forms an important component of household consumption expenditure, with Australian households spending around 3¼ per cent of their total consumption spending on domestic
4 See OECD (2010) for international comparisons.
Table 2: Domestic Tourism Expenditure(a)
2010/11
Reason for travel Day visitors
$ billion
Overnight visitors
$ billion
Total
$ billion
Share oftotal
expenditurePer cent
Holiday 8 24 33 57
Visiting friends and relatives 3 9 12 21
Business 1 7 9 15
Other(b) 2 2 4 7
Total 15 43 58 100(a) Australian residents aged 15 years and over only(b) Includes education and health-related travelSource: TRA
Australia's Tourism Industry.indd 25 14/12/11 10:50 AM
RESERVE BANK OF AUSTRALIA
AUSTRALIA’S TOURISM INDUSTRY
2 6
overnight holiday travel. Nonetheless, over the past decade there has been a notable decline in both the propensity for Australians to holiday domestically (as given by the number of overnight trips per person) and the proportion of total household spending on overnight domestic holiday travel (Graph 5).
This decline in domestic holiday spending has been driven by a marked change in the travel behaviour of Australians, notably a shift away from domestic travel towards overseas travel. While the number of nights Australians spend holidaying domestically has declined, there has been a sharp rise in the number
of trips and nights Australians spend holidaying overseas (Graph 6). The propensity for Australians to travel overseas for a holiday has picked up markedly since late 2003, rising from around 8 per cent of the resident Australian population annually to be just under 20 per cent of the population in recent years (although some of these trips reflect multiple visits by individuals). Travelling overseas for the purpose of a holiday has been the fastest growing component of outbound travel, with more moderate growth in overseas trips for business, employment and education (Graph 7).
2010/11
Visitor Nights by State
Source: TRA
Tas
MBy source of visitor
n Capital city
30
60
30
60
0
30
60
0
30
60
M
MM
NSW Vic Qld SA WA
n Regional
By destination
n Interstate
n Intrastate
Graph 4
Graph 5
Graph 6
Graph 7Domestic Holiday Travel*
* Overnight only
10/11
NoTrips per person**
1.8
2.0
1.8
2.0
3.0
3.5
4.0
4.5
3.0
3.5
4.0
4.5
No
% %
Sources: ABS; RBA; TRA
08/0906/0704/0502/0300/01
Holiday expenditureAs a share of household consumption
** Australian residents aged 15 and over
Four-quarter moving sum
Holiday Travel Patterns of Australians*
Source: TRA
2011
M Domestic nights
130
140
130
140
20
40
60
20
40
60
20092007200520032001* Australian residents aged 15 and over
Overseas nights
M
M M
50
100
150
200
250
300
50
100
150
200
250
300
Short-term Overseas Departures*By purpose, March 2002 = 100
Source: ABS
2003
Index
Business
Index
2005 2009 2011
VFR
Holiday
Employment and education
* Rolling three-month sum; seasonally adjusted2007
Australia's Tourism Industry.indd 26 14/12/11 10:50 AM
BULLETIN | D E C E M B E R Q UA R T E R 2011
AUSTRALIA’S TOURISM INDUSTRY
2 7
Graph 8
Graph 9
0 4 8 12 16
Top 10 Destinations for Australian ResidentsShare of total departures
Source: ABS
NZ
%
n 10/11
China
Hong Kong
Fiji
Singapore
Malaysia
Indonesia
US
Thailand
UK
n 00/01
Seasonally adjusted, 2002 = 100
Tourism Prices
Sources: ABS; RBA
Index
85
90
95
100
105
85
90
95
100
105
80
90
100
110
120
80
90
100
110
120
Index
IndexIndex
20052003 2007 2009 2011
Domestic holiday prices
Overseas holiday prices
Overseas relative to domestic holiday prices
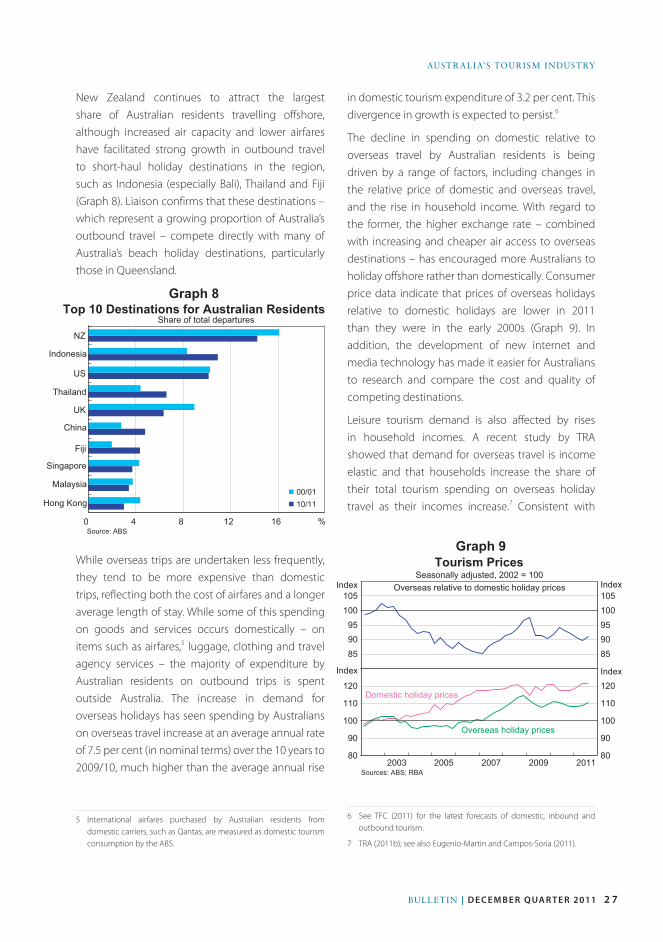
New Zealand continues to attract the largest share of Australian residents travelling offshore, although increased air capacity and lower airfares have facilitated strong growth in outbound travel to short-haul holiday destinations in the region, such as Indonesia (especially Bali), Thailand and Fiji (Graph 8). Liaison confirms that these destinations – which represent a growing proportion of Australia’s outbound travel – compete directly with many of Australia’s beach holiday destinations, particularly those in Queensland.
While overseas trips are undertaken less frequently, they tend to be more expensive than domestic trips, reflecting both the cost of airfares and a longer average length of stay. While some of this spending on goods and services occurs domestically – on items such as airfares,5 luggage, clothing and travel agency services – the majority of expenditure by Australian residents on outbound trips is spent outside Australia. The increase in demand for overseas holidays has seen spending by Australians on overseas travel increase at an average annual rate of 7.5 per cent (in nominal terms) over the 10 years to 2009/10, much higher than the average annual rise
5 International airfares purchased by Australian residents from domestic carriers, such as Qantas, are measured as domestic tourism consumption by the ABS.
in domestic tourism expenditure of 3.2 per cent. This divergence in growth is expected to persist.6
The decline in spending on domestic relative to overseas travel by Australian residents is being driven by a range of factors, including changes in the relative price of domestic and overseas travel, and the rise in household income. With regard to the former, the higher exchange rate – combined with increasing and cheaper air access to overseas destinations – has encouraged more Australians to holiday offshore rather than domestically. Consumer price data indicate that prices of overseas holidays relative to domestic holidays are lower in 2011 than they were in the early 2000s (Graph 9). In addition, the development of new internet and media technology has made it easier for Australians to research and compare the cost and quality of competing destinations.
Leisure tourism demand is also affected by rises in household incomes. A recent study by TRA showed that demand for overseas travel is income elastic and that households increase the share of their total tourism spending on overseas holiday travel as their incomes increase.7 Consistent with
6 See TFC (2011) for the latest forecasts of domestic, inbound and outbound tourism.
7 TRA (2011b); see also Eugenio-Martin and Campos-Soria (2011).
Australia's Tourism Industry.indd 27 14/12/11 10:50 AM
RESERVE BANK OF AUSTRALIA
AUSTRALIA’S TOURISM INDUSTRY
2 8
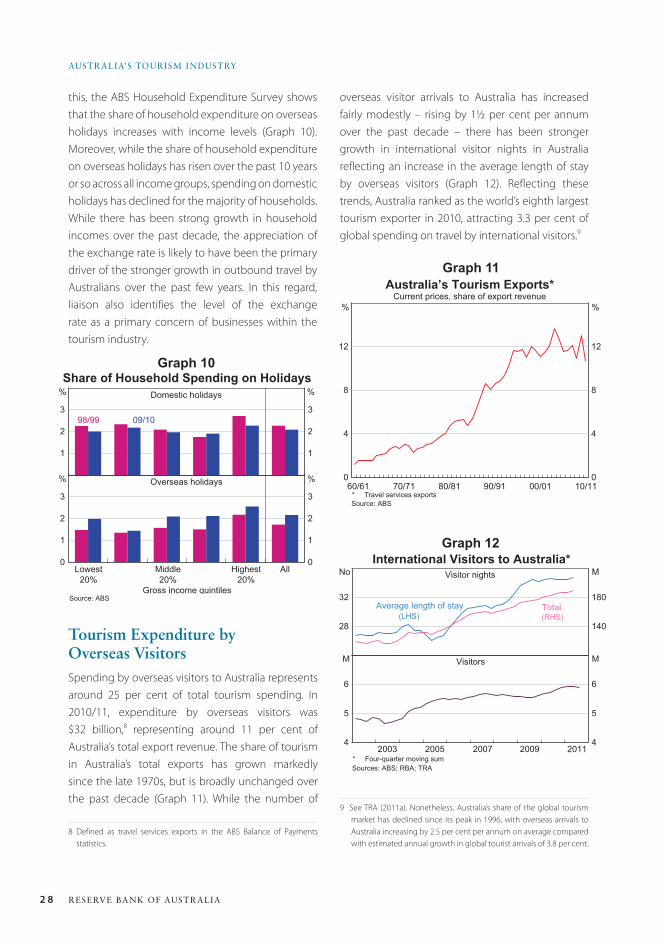
overseas visitor arrivals to Australia has increased fairly modestly – rising by 1½ per cent per annum over the past decade – there has been stronger growth in international visitor nights in Australia reflecting an increase in the average length of stay by overseas visitors (Graph 12). Reflecting these trends, Australia ranked as the world’s eighth largest tourism exporter in 2010, attracting 3.3 per cent of global spending on travel by international visitors.9
9 See TRA (2011a). Nonetheless, Australia’s share of the global tourism market has declined since its peak in 1996, with overseas arrivals to Australia increasing by 2.5 per cent per annum on average compared with estimated annual growth in global tourist arrivals of 3.8 per cent.
Graph 11
0
4
8
12
0
4
8
12
Australia’s Tourism Exports*Current prices, share of export revenue
Source: ABS
%%
10/1100/01* Travel services exports
90/9180/8170/7160/61
Graph 12International Visitors to Australia*
Sources: ABS; RBA; TRA
2011
Total
No Visitor nights
(LHS)
28
32
140
180
4
5
6
4
5
6
M
Visitors
2009200720052003
(RHS)
Average length of stay
MM
* Four-quarter moving sum
this, the ABS Household Expenditure Survey shows that the share of household expenditure on overseas holidays increases with income levels (Graph 10). Moreover, while the share of household expenditure on overseas holidays has risen over the past 10 years or so across all income groups, spending on domestic holidays has declined for the majority of households. While there has been strong growth in household incomes over the past decade, the appreciation of the exchange rate is likely to have been the primary driver of the stronger growth in outbound travel by Australians over the past few years. In this regard, liaison also identifies the level of the exchange rate as a primary concern of businesses within the tourism industry.
Tourism Expenditure by Overseas VisitorsSpending by overseas visitors to Australia represents around 25 per cent of total tourism spending. In 2010/11, expenditure by overseas visitors was $32 billion,8 representing around 11 per cent of Australia’s total export revenue. The share of tourism in Australia’s total exports has grown markedly since the late 1970s, but is broadly unchanged over the past decade (Graph 11). While the number of
8 Defined as travel services exports in the ABS Balance of Payments statistics.
Graph 10Share of Household Spending on Holidays
Source: ABS
Highest20%
Gross income quintiles
%Domestic holidays
1
2
3
1
2
3
0
1
2
3
0
1
2
3
%
Overseas holidays% %
Middle20%
Lowest20%
All
98/99 09/10
Australia's Tourism Industry.indd 28 14/12/11 10:50 AM
BULLETIN | D E C E M B E R Q UA R T E R 2011
AUSTRALIA’S TOURISM INDUSTRY
2 9
Graph 13Overseas Arrivals*
0
50
100
150
200
250
300
350
0.0
1.5
3.0
4.5
6.0
7.5
9.0
10.5
Sources: ABS; RBA
2003
%Share of total arrivals**
China
* Seasonally adjusted by RBA
March 2002 = 100
India
** Smoothed
India
Index
2007 2011
Japan
NZ
Total
China
2003 2007 2011
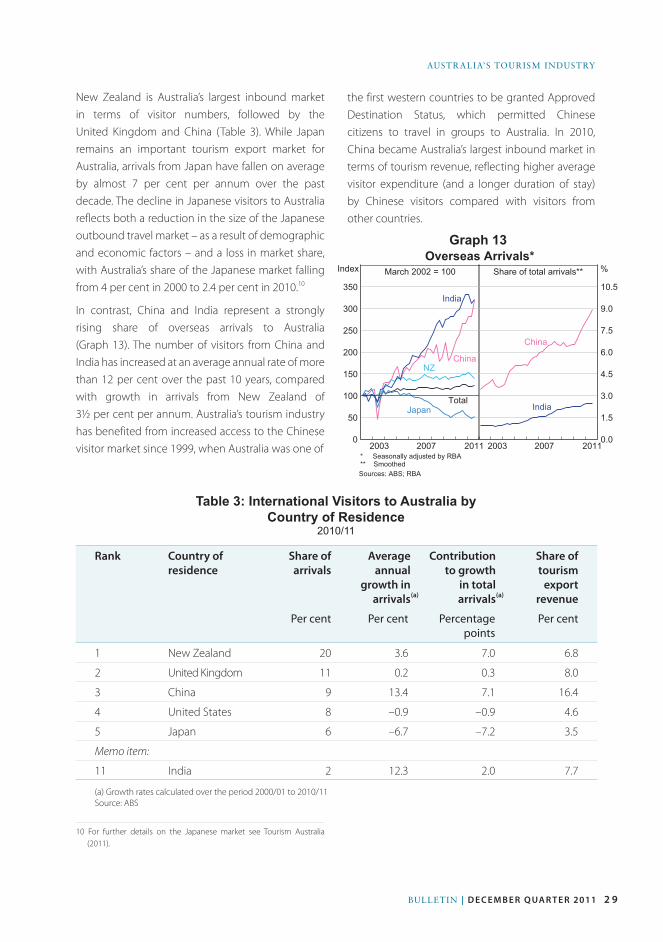
New Zealand is Australia’s largest inbound market in terms of visitor numbers, followed by the United Kingdom and China (Table 3). While Japan remains an important tourism export market for Australia, arrivals from Japan have fallen on average by almost 7 per cent per annum over the past decade. The decline in Japanese visitors to Australia reflects both a reduction in the size of the Japanese outbound travel market – as a result of demographic and economic factors – and a loss in market share, with Australia’s share of the Japanese market falling from 4 per cent in 2000 to 2.4 per cent in 2010.10
In contrast, China and India represent a strongly rising share of overseas arrivals to Australia (Graph 13). The number of visitors from China and India has increased at an average annual rate of more than 12 per cent over the past 10 years, compared with growth in arrivals from New Zealand of 3½ per cent per annum. Australia’s tourism industry has benefited from increased access to the Chinese visitor market since 1999, when Australia was one of
10 For further details on the Japanese market see Tourism Australia (2011).
Table 3: International Visitors to Australia by Country of Residence
2010/11
Rank Country of residence
Share of arrivals
Average annual
growth in arrivals
Contribution to growth
in total arrivals
Share of tourism
export revenue
Per cent Per cent Percentage points
Per cent
1 New Zealand 20 3.6 7.0 6.8
2 United Kingdom 11 0.2 0.3 8.0
3 China 9 13.4 7.1 16.4
4 United States 8 –0.9 –0.9 4.6
5 Japan 6 –6.7 –7.2 3.5
Memo item:
11 India 2 12.3 2.0 7.7
(a) Growth rates calculated over the period 2000/01 to 2010/11Source: ABS
the first western countries to be granted Approved Destination Status, which permitted Chinese citizens to travel in groups to Australia. In 2010, China became Australia’s largest inbound market in terms of tourism revenue, reflecting higher average visitor expenditure (and a longer duration of stay) by Chinese visitors compared with visitors from other countries.
(a) (a)
Australia's Tourism Industry.indd 29 14/12/11 10:50 AM

RESERVE BANK OF AUSTRALIA
AUSTRALIA’S TOURISM INDUSTRY
3 0
Unlike domestic tourists, overseas visitors generally spend the bulk of their travel expenditure in capital cities and on average they have a longer length of stay (Graph 14). Liaison suggests that this is partly related to the importance of capital cities as major international gateways to Australia. Capital cities have benefited from a rising share of overseas visitor expenditure as spending by international visitors in regional areas has declined somewhat in recent years in real terms. This trend is consistent with the strong growth in Chinese visitors – who demonstrate a strong propensity for travel to capital cities – and the decline in Japanese tourists that has had a more pronounced effect on overall tourism demand in some regional destinations. For instance, in 2010/11, Sydney and Melbourne were the most popular destinations for Chinese visitors (as measured by visitor nights), whereas Japanese visitors have demonstrated a relatively stronger preference for travel to Queensland’s beach destinations, notably the Gold Coast and Tropical North Queensland (TNQ) (Graph 15).
Looking forward, ongoing strong income growth in emerging economies, such as China and India, is expected to continue to underpin demand for Australia’s tourism exports. Growth in Chinese visitors
Graph 14
Graph 15
Graph 16
0
20
40
60
80
0
20
40
60
80
Visitor Expenditure in Australia*
Share of spending by destination, 2010/11
* Overnight travel only
Domestic visitors
%n Capital cities
n Regions
%
International visitors
Source: TRA
0 5 10 15 20 25 30 35
International Visitor PatternsShare of visitor nights by selected destinations, 2010/11
Source: TRA
Sydney
%
n China
Melbourne
Brisbane
Gold Coast
TNQ
Adelaide
Perth
n Japan n All
alone is expected to contribute around one-third of the growth in Australia’s tourism export earnings out to 2020. As a consequence, the share of spending by international visitors in total tourism expenditure in Australia is forecast by the Tourism Forecasting Committee (TFC) to continue to rise over the next decade, driven principally by strong arrivals from Asia (Graph 16). This poses a challenge for the tourism industry in leisure and regional areas, which have at least to date had limited exposure to the growing segments of the inbound tourism market compared with Australia’s capital cities.
0
20
40
60
80
0
20
40
60
80
Tourism Consumption in AustraliaShare of total tourism consumption by visitor
Source: TFC
2020
Domestic visitors
%%
201420112008200520021999 2017
Overseas visitors
TFC forecasts
Australia's Tourism Industry.indd 30 14/12/11 10:50 AM

BULLETIN | D E C E M B E R Q UA R T E R 2011
AUSTRALIA’S TOURISM INDUSTRY
3 1
Graph 17
-20
-10
0
10
20
-20
-10
0
10
20
Accommodation Indicators*Growth over year to June quarter 2011, selected Queensland regions
Gol
dC
oast
%Leisure tourism exposed
� Room nights occupied � Average room rates
% Mining exposed
Sun
shin
e C
oast
Whi
tsun
days
TNQ
Em
eral
d
Gla
dsto
ne
Bris
bane
Source: ABS* Hotels, motels and serviced apartments
Adjustments Within the Tourism IndustryIn response to these trends in spending by Australian and overseas visitors, conditions within the tourism industry vary significantly. In particular, demand for hotels in capital cities has been strong in response to growing demand from overseas visitors and from business travel by Australian residents. Overall demand in regional areas has been mixed: while conditions in Australia’s traditional domestic leisure markets have been soft as Australians have increasingly preferred to holiday abroad, demand for accommodation and other services in some regional towns and cities – especially those located close to mining activity – has been strong.
In response to this dichotomy in the relative strength of demand, tourism providers have, where possible, adjusted the price and mix of their operations. This adjustment is most apparent in the transport and accommodation sectors. For instance, strong growth in accommodation demand in Brisbane as well as in some mining-exposed regions – supported in part by the business travel market – has seen a sharp increase in room rates in the face of a tight supply of rooms (Graph 17). To date there has been little growth in hotel room supply, with liaison suggesting new supply has been constrained by a range of factors including lack of available development finance. Nonetheless, there has reportedly been an increase in hotel refurbishments over the past year or so in capital city markets, targeting the upper-end of the visitor market. In contrast to the strength of the CBD and some regional markets, accommodation providers in leisure tourism destinations in Queensland have held prices flat or reduced room rates in response to the weaker demand conditions that have prevailed. Liaison indicates that some providers in holiday destinations are investing in refurbishments and/or an expanded range of services, such as providing Chinese and Hindi-language television and menus, to attract the inbound visitor market, while others have begun to shift their rooms into the housing rental market.
A similar pattern of adjustment is evident in the domestic aviation market, where strong inter-capital transport services demand – as well as demand for air services into regional and remote areas of Australia in response to mining-related activity – is seeing a shift in capacity to service these growing markets. Data on the top 55 domestic aviation routes in Australia published by the Bureau of Infrastructure, Transport and Regional Economics (BITRE) confirm this adjustment. By classifying these routes as inter-capital, leisure based and mining exposed, a clear pattern of demand emerges. Passenger traffic on inter-capital and mining-exposed routes has increased, while the number of passengers carried on routes focused towards leisure travel has declined over the year to the June quarter 2011 (Graph 18).
Nonetheless, the ability of firms to reposition themselves and take advantage of opportunities for growth outside of the domestic leisure market depends on their flexibility and capacity to adapt. This adjustment appears to be easier for firms capable of shifting capacity, such as transport providers, but more difficult for bricks-and-mortar operators, such as accommodation providers, unless they can tailor their services to meet the requirements of the business and inbound visitor markets.
Australia's Tourism Industry.indd 31 14/12/11 10:50 AM

RESERVE BANK OF AUSTRALIA
AUSTRALIA’S TOURISM INDUSTRY
3 2
ConclusionThe increasing propensity for Australians to holiday overseas has brought about important changes in the pattern of tourism demand in Australia over the past decade. As a result of this change in travel behaviour and the rising globalisation of travel, Australia’s tourism industry is expected to become more focused on tourism exports, especially growing markets such as China. Reorienting activity in response to the shifting spending patterns of Australian residents and overseas visitors is possible for some tourism providers, in particular those in the capital cities. However, conditions in other parts of the tourism industry, such as in the traditional leisure market destinations, are likely to remain more difficult in the period ahead. R
ReferencesABS (Australian Bureau of Statistics) (2010), ‘Australian
National Accounts: Tourism Satellite Account 2009-10’, ABS
Cat No 5249.0, December.
Centre for Economics and Policy, The (2011), ‘Tourism
Satellite Accounts 2008–09: Summary Spreadsheets, The
Economic Contribution of Tourism to Australian States &
Territories’. Available at <http://www.ret.gov.au/tourism/
Documents/tra/Snapshots%20and%20Factsheets/2011/
To u r i s m - S a te l l i te - Ac c o u n t s - 2 0 0 8 - 0 9 - S u m m a r y -
Spreadsheets.pdf>.
Eugenio-Martin JL and JA Campos-Soria (2011), ‘Income and the Substitution Pattern between Domestic
and International Tourism Demand’, Applied Economics,
43(20), pp 2519–2531.
OECD (Organisation for Economic Co-operation and Development) (2010), OECD Tourism Trends and Policies
2010, OECD Publishing, Paris.
TFC (Tourism Forecasting Committee) (2011), Forecast
2011 Issue 2, Tourism Research Australia, Canberra.
Tourism Australia (2011), Japan: Market Profile 2011,
Tourism Australia, Sydney.
TRA (Tourism Research Australia) (2011a), Tourism
Industry Facts and Figures at a Glance, Tourism Research
Australia, Canberra.
TRA (2011b), What is Driving Australians’ Travel Choices?,
Tourism Research Australia, Canberra.
Graph 18
-4
-2
0
2
4
6
-4
-2
0
2
4
6
Australian Domestic Airline Passengers*Growth over year to June quarter 2011
* Covers the top 55 domestic routes only
Inter-capital
%%
Sources: BITRE; RBA
** Includes routes not classified elsewhere
Leisure Mining exposed All**
Australia's Tourism Industry.indd 32 14/12/11 10:50 AM