Embed Size (px)
Citation preview

i
Australia’s Migration Trends 2012–13
Australia’s Migration Trends 2012–13 Page i
Australia’s Migration Trends 2012–13 was prepared by:
Economic Analysis Unit Strategic Policy Evaluation and Research Branch Department of Immigration and Border Protection
The department’s website at www.immi.gov.au contains this publication and a wide variety of additional information on departmental activities.
Comments about this publication can be emailed to [email protected]
© Commonwealth of Australia 2014
All material presented in this publication is provided under a Creative Commons Attribution 3.0 Australia licence (http://creativecommons.org/licenses/by/3.0/au/deed.en).
For the avoidance of doubt, this means this licence only applies to material as set out in this document.
The details of the relevant licence conditions are available on the Creative Commons website (accessible using the links provided) as is the full legal code for the CC BY 3.0 AU licence (http://creativecommons.org/licenses/by/3.0/legalcode).
Use of the Coat of Arms
The terms under which the Coat of Arms can be used are detailed on the It's an Honour website (http://www.itsanhonour.gov.au/coat-arms/index.cfm).
Contact us
Enquiries regarding the licence and any use of this document are welcome at:
National Communications Branch Department of Immigration and Border Protection PO Box 25 BELCONNEN ACT 2616
Telephone: (02) 6264 2233 [email protected]
Australia’s Migration Trends 2012–13 Page 2 of 187
Table of Contents SUMMARY—AUSTRALIA: RECENT CHANGES IN MIGRATION 5 KEY STATISTICS 7
CHAPTER 1: MIGRATION POLICY AND PROGRAMME DEVELOPMENTS 9
1.1 CHANGES TO SKILLED MIGRATION 10 1.2 AMENDMENTS TO FAMILY VIOLENCE PROVISIONS 11 1.3 VISA SIMPLIFICATION AND DEREGULATION PROJECT 12 1.4 STUDENT VISA PROGRAMME REFORMS 12 1.5 STRENGTHENING THE INTEGRITY OF THE SUBCLASS 457 PROGRAMME 13 1.6 REFUGEES AND ASYLUM SEEKERS 14 1.7 OPERATION SOVEREIGN BORDERS 16 1.8 BUILDING MULTICULTURAL COMMUNITIES PROGRAMME 16 1.9 COMMUNITY HUBS PROGRAMME 16 1.10 EMPOWERING LOCAL COMMUNITIES PROGRAMME 16
CHAPTER 2: THE MIGRATION PROGRAMME 17
2.1 OVERVIEW 18 2.2 AUSTRALIA’S MIGRATION PROGRAMME 2012–13 20 2.3 CHARACTERISTICS OF PERMANENT MIGRANTS 22 2.4 THE SKILL STREAM 25 2.5 FAMILY STREAM 33 2.6 MIGRATION PROGRAMME PLANNING LEVELS FOR 2012–13 AND 2013–14 38 2.7 ADDITIONAL PLACES TO FAMILIES OF ILLEGAL MARITIME ARRIVALS 39
CHAPTER 3: TEMPORARY ENTRY 41
3.1 OVERVIEW 42 3.2 VISITOR VISA PROGRAMME 43 3.3 WORKING HOLIDAY MAKER PROGRAMME 47 3.4 THE STUDENT VISA PROGRAMME 50 3.5 TEMPORARY WORK (SKILLED) VISA 57 3.6 OTHER TEMPORARY RESIDENCE 61 3.7 SHORT-TERM INTRA-COMPANY TRANSFERS 65
CHAPTER 4: THE HUMANITARIAN PROGRAMME 67
4.1 OVERVIEW 68 4.2 THE HUMANITARIAN PROGRAMME 69
CHAPTER 5: VISA NON-COMPLIANCE 75
5.1 OVERVIEW 76 5.2 UNLAWFUL NON-CITIZENS IN AUSTRALIA 77 5.3 VISA CANCELLATIONS 80 5.4 COMPLIANCE-RELATED DEPARTURES 81
CHAPTER 6: NET OVERSEAS MIGRATION 83
6.1 INTRODUCTION 84 6.2 NET OVERSEAS MIGRATION AND POPULATION GROWTH 85 6.3 THE COMPONENTS OF NET OVERSEAS MIGRATION 85
Australia’s Migration Trends 2012–13 Page 3 of 187
6.4 OTHER ASPECTS OF NET OVERSEAS MIGRATION 90 6.5 NET OVERSEAS MIGRATION FORECASTS 101
CHAPTER 7: AUSTRALIA’S POPULATION 103
7.1 CHARACTERISTICS OF AUSTRALIA’S POPULATION 104 7.2 TEMPORARY ENTRANTS IN AUSTRALIA 107
CHAPTER 8: CITIZENSHIP IN AUSTRALIA 113
8.1 OVERVIEW 114 8.2 CITIZENSHIP VARIATION BY YEAR OF ARRIVAL 120 8.3 CITIZENSHIP BY GEOGRAPHIC LOCATION 123
CHAPTER 9: DIVERSITY AND SETTLEMENT 125
9.1 MULTICULTURALISM IN AUSTRALIA 126 9.2 SETTLEMENT AND INTEGRATION IN AUSTRALIA 128
CHAPTER 10: LABOUR MARKET 133
10.1 INTRODUCTION 134 10.2 OUTCOMES FOR AUSTRALIA’S MIGRANT POPULATION 134 10.3 LABOUR MARKET OUTCOMES OF THE CHILDREN OF MIGRANTS 145
CHAPTER 11: ELDERLY MIGRANTS 149
11.1 INTRODUCTION 150 11.2 CHARACTERISTICS OF ELDERLY AND AGED MIGRANTS IN AUSTRALIA 151 11.3 SOCIAL AND ECONOMIC ISSUES 155
APPENDICES, DATA SOURCES, GLOSSARY AND ACRONYMS 159
APPENDICES 160 DATA SOURCES FOR AUSTRALIA’S MIGRATION TRENDS 182 GLOSSARY 183 ACRONYMS 186
Australia’s Migration Trends 2012–13 Page 4 of 187
Summary—Australia: Recent changes in migration In 2012–13, 214 019 permanent migration visas were issued—an increase of 7.7 per cent on the 198 747 delivered in the previous year. This comprised 190 000 places under Australia’s Migration Programme, 20 019 under the Humanitarian Programme and an additional 4000 places—as recommended by the Expert Panel on Asylum Seekers—provided for under Family Stream migration.
The Migration Programme comprised 128 973 visas (67.9 per cent) issued through the Skill Stream and 60 185 visas (31.7 per cent) through the Family Stream, with the remaining 842 visas (0.4 per cent) granted under the Special Eligibility visa category.
For the second year in a row, India was the top source country for the Migration Programme, with 40 051 places (a 21.1 per cent share)—up some 38.0 per cent on the previous year. The People’s Republic of China followed with 27 334 places and the United Kingdom with 21 711 places. In addition to this regulated migration, 41 230 New Zealand citizens entered Australia as permanent settlers under the Trans-Tasman Travel Arrangement.
Visitors to Australia in 2012–13, were at their highest level ever, with more than 3.7 million visas issued—an increase of 5.4 per cent on 2011–12. The United Kingdom was the top source country, with 543 495 visas granted to offshore applicants. This was followed by the People’s Republic of China and the United States of America with 473 206 and 380 086 visa grants respectively. The most significant change between 2011–12 and 2012–13 was the substantial increase in visitors from China—up 20.1 per cent on the 393 988 visas granted in 2011–12.
From November 2012, the Business (Long Stay) (subclass 457) visa was renamed the Temporary Work (Skilled) (subclass 457) visa. Demand for these visas by Australian businesses remained strong in 2012–13, underlining their importance in meeting short-term skill needs. A total of 126 350 subclass 457 visas were issued in 2012–13, 1.0 per cent higher than the previous year. Despite this small increase, several of the top 10 countries experienced a substantial fall in grants in 2012–13. Among these were South Africa, the United States of America and the United Kingdom, with falls of 1220, 1610 and 4590 grants respectively. The fall among nationals of the United Kingdom meant that for the first time ever, it was not the top source country for subclass 457 visas. In its place was India with 27 210 visa grants for the year.
Changes to the subclass 457 programme were introduced in July 2013 to strengthen the department’s capacity to identify and prevent employer practices not in keeping with the intent of the programme. As a result, skills assessments have been strengthened, English language requirements have increased and for many occupations, sponsors are required to convincingly demonstrate that there is a genuine skilled vacancy. The compliance and enforcement framework has also been enhanced.
Two key recommendations of the Knight Review—a review of the Student visa programme—were implemented during March and April 2013. The first was the introduction of a new post-study work visa arrangement incorporated as a stream of the Temporary Graduate (subclass 485) visa. This would allow recent graduates with a higher education degree the opportunity to work for up to four years in Australia. The second was the removal of automatic or mandatory visa cancellation if a student breached their visa conditions. This was replaced by a discretionary cancellation framework that took individual circumstances into account to provide fairer outcomes for students.
Australia’s Migration Trends 2012–13 Page 5 of 187
Streamlined visa processing of student visas continued through the year. This response to the Knight Review recognises that universities generally have a good track record as low-risk, high-quality education providers. Students attending participating universities are assessed as a lower immigration risk and are therefore processed more quickly, regardless of their country of origin.
With most of the recommendations of the Knight Review now in effect, there was some growth in Student visa numbers over the last two years. In 2012–13, 259 278 visas were granted to international students. This was a 2.5 per cent increase on the previous year, but still 18.9 per cent below the record 319 632 visas granted in 2008–09. The decreases in Student visa numbers in 2009–10 and 2010–11 followed 11 consecutive years of programme growth and coincided with a number of factors. These factors included: ongoing global financial uncertainty; the rising value of the Australian dollar; changes to improve the integrity of the Student visa programme; and reforms to the Skilled Migration programme.
A new working holiday arrangement with Uruguay began in April 2013. This was the 28th reciprocal working holiday arrangement for Australia under the Working Holiday Maker Programme. This programme saw significant growth with 258 248 visas granted in 2012–13, an increase of 15.8 per cent on the 222 992 visas granted in 2011–12. This included 38 862 second Working Holiday visas granted in 2012–13, an increase of 27.4 per cent on the 30 501 grants in 2011–12.
The ongoing Seasonal Worker Program began on 1 July 2012, replacing the Pacific Seasonal Worker Pilot Scheme. The programme builds on the pilot’s economic development objectives for the Pacific and Timor-Leste, while assisting Australian employers who cannot source local labour in selected industries. The number of visa places is capped at 12 000 over four years (2012–16), with most visas issued to those working in the horticulture industry. As at June 2013, 3016 visas were issued under the Seasonal Worker Program and the Pacific Seasonal Worker Pilot Scheme in 2012–13.
In December 2012, the Government announced a pilot community sponsorship programme of 500 places under the Humanitarian Programme. This aims to provide a more supportive settlement environment for new humanitarian entrants, enabling a smoother transition from resettlement, through to education, work experience and employment.
Mid-to-late 2012–13 heralded a number of changes to simplify the visa application process, particularly for those applying for temporary visas. In November 2012, the Government reduced the number of Temporary Work visas from 17 to eight, allowing clients to more easily select an appropriate visa. From 23 March 2013, this simplification was extended to the Visitor visa programme, reducing the number of visas from 11 to four, cutting red-tape and making it easier for applicants to understand. At the same time the new Temporary Work (Short Stay Activity) (subclass 400) visa was introduced. This visa allows short-term, highly specialised non-ongoing work to be carried out in Australia.
Australia’s Migration Trends 2012–13 Page 6 of 187
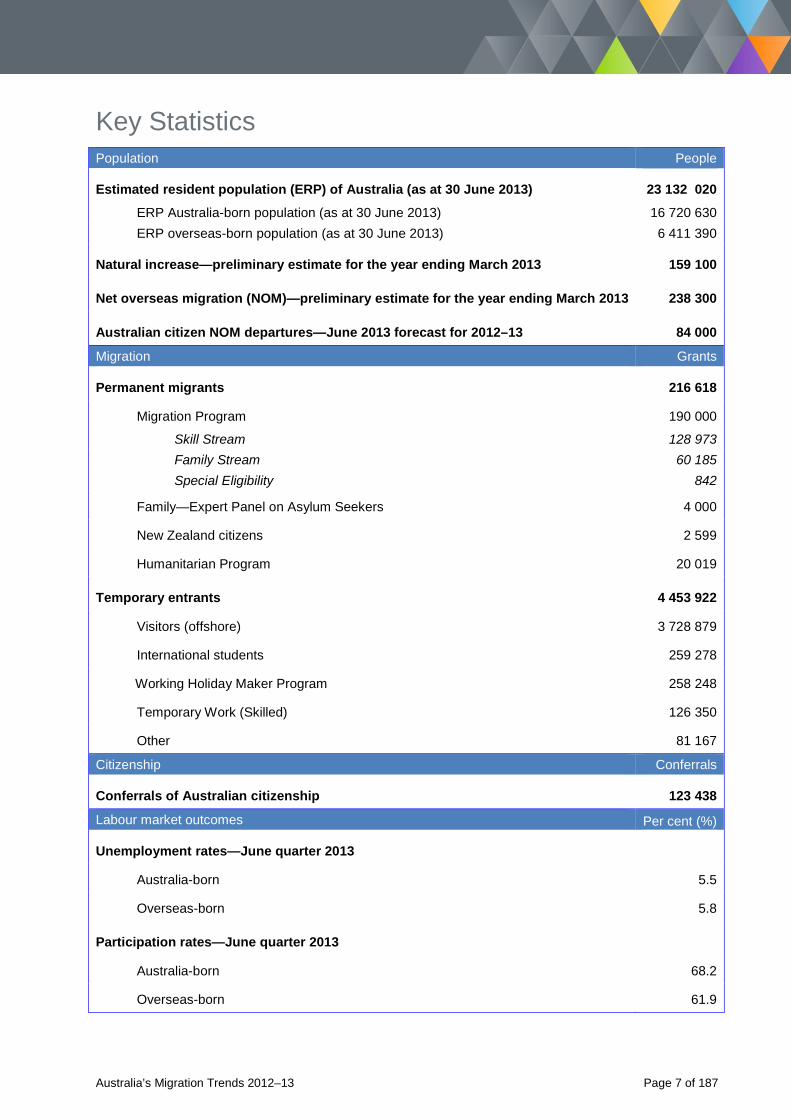
Key Statistics Population People
Estimated resident population (ERP) of Australia (as at 30 June 2013) 23 132 020
ERP Australia-born population (as at 30 June 2013) 16 720 630 ERP overseas-born population (as at 30 June 2013) 6 411 390
Natural increase—preliminary estimate for the year ending March 2013 159 100
Net overseas migration (NOM)—preliminary estimate for the year ending March 2013 238 300
Australian citizen NOM departures—June 2013 forecast for 2012–13 84 000
Migration Grants
Permanent migrants 216 618
Migration Program 190 000
Skill Stream 128 973 Family Stream 60 185 Special Eligibility 842
Family—Expert Panel on Asylum Seekers 4 000
New Zealand citizens 2 599
Humanitarian Program 20 019
Temporary entrants 4 453 922
Visitors (offshore) 3 728 879
International students 259 278
Working Holiday Maker Program 258 248
Temporary Work (Skilled) 126 350
Other 81 167
Citizenship Conferrals
Conferrals of Australian citizenship 123 438
Labour market outcomes Per cent (%)
Unemployment rates—June quarter 2013
Australia-born 5.5
Overseas-born 5.8
Participation rates—June quarter 2013
Australia-born 68.2
Overseas-born 61.9
Australia’s Migration Trends 2012–13 Page 7 of 187

This page has been left intentionally blank.
Australia’s Migration Trends 2012–13 Page 8 of 187
Chapter 1: Migration policy and programme developments
Australia’s Migration Trends 2012–13 Page 9 of 187
1.1 Changes to Skilled Migration 1.1.1 SkillSelect SkillSelect, the department’s online Skilled Migration system, was introduced in July 2012, and is designed to give the Australian Government greater control over the composition and quality of the Skilled Migration programme. All intending migrants interested in a Points Tested Skilled Migration visa or a Business Innovation and Investment visa are now required to submit an online expression of interest in SkillSelect. Intending migrants who meet the necessary requirements are then invited to apply for a Skilled Migration visa, at levels which correspond with the needs of the Australian labour market. SkillSelect also provides a means for Australian employers to find overseas skilled workers to fill skilled vacancies that cannot be filled from within the Australian labour market.
Further information on SkillSelect is available at: http://www.immi.gov.au/skills/skillselect/
1.1.2 Business Innovation and Investment programme From 1 July 2012, the Business Skills Programme was replaced by the Business Innovation and Investment Programme. The new programme reduced the number of visa subclasses from 13 to three. This niche category in Australia’s Skilled Migration programme aims to create new business as visa holders become business owners. The options available under the new programme each comprise a number of streams:
1. Business Talent (Permanent) visa: • Significant Business History Stream • Venture Capital Entrepreneur Stream
2. Business Innovation and Investment (Provisional and Permanent) visas: • Business Innovation Stream • Investor Stream • Significant Investor Stream.
The Significant Investor visa was introduced as a new stream in the programme in November 2012. It targets investors willing to invest at least $5 million into the Australian economy. To encourage investment in Australia from high net worth people seeking investment migration, there are some concessions on visa requirements such as a reduced residency period, no upper age limit or points test requirement.
Australia’s Migration Trends 2012–13 Page 10 of 187
1.1.3 Permanent Employer Sponsored visa programme The Permanent Employer Sponsored visa programme underwent substantial reforms in 2012, with new regulations for the Employer Nomination Scheme (ENS) (subclass 186) and Regional Sponsored Migration Scheme (RSMS) (subclass 187) visas starting in July 2012.
The intention of the reforms is to improve the programme’s ability to meet Australia’s economic needs; respond quickly to labour market demand; and ensure the limited programme places go to those who will make the greatest contribution to Australia. The ENS and RSMS visa programmes allow employers to sponsor skilled workers from overseas, or those already living and working in Australia as temporary visa holders, to fill genuine vacancies in their business. The employer must operate a business in Australia and be willing to nominate the prospective migrant to fill a full-time vacancy in their business for a period of at least two years.
The RSMS visa programme applies to regional, remote or low-population growth areas in Australia, whereas the ENS visa programme applies nationwide.
1.2 Amendments to Family Violence Provisions Family Violence Provisions allow people applying for permanent residence in Australia to continue with their application after the breakdown of their married or de facto relationship, if they or a member of their family unit have experienced family violence by their partner.
The provisions were originally introduced in response to concerns that some partners might remain in an abusive relationship because they believe they may be forced to leave Australia if they end their relationship.
In November 2012, the provisions were amended to streamline the evidentiary requirements for applicants when making a non-judicial claim of family violence.
Examples of acceptable forms of evidence include, but are not limited to, medical reports, hospital reports, discharge summary or statutory declaration made by a registered medical practitioner or nurse; a report, record of assault, witness statement or statutory declaration that is made by a police officer or a child welfare or protection authority.
Further information is available at: http://www.immi.gov.au/FAQs/Pages/what-if-i-dont-have-evidence-from-a-court.aspx
Australia’s Migration Trends 2012–13 Page 11 of 187
1.3 Visa Simplification and Deregulation project The Visa Simplification and Deregulation project aims to rationalise the visa framework to make it simpler and more efficient for clients and visa decision makers. Specifically, the Government has committed to reducing the number of Temporary Work visa subclasses by 50 per cent by the end of 2012 and the number of visa subclasses by up to 50 per cent by the end of 2015.
In July 2012, in conjunction with the SkillSelect reforms (Section 1.1.1), the Government reduced the number of Skilled Migration visas from 27 to 11. This included creating simpler, more standardised criteria and legislation as well as a skilled occupations list that is now standard across a number of skilled entry programmes.
In November 2012, the Government reduced the number of Temporary Work visas from 17 to eight. This smaller group of visa products allows clients to more easily select the appropriate visa as existing provisions have been consolidated to reflect the broader purpose of stay. A number of key criteria across all Temporary Work visas have been standardised and some sponsorship requirements removed.
From 23 March 2013, simplification of the Visitor visa programme was rolled out which reduced the number of visas from 11 to four, cutting red-tape and making it easier for applicants to understand. At the same time the new Temporary Work (Short Stay Activity) (subclass 400) visa was introduced allowing people to come to Australia to carry out highly specialised short-term, non-ongoing work for up to six weeks.
Discussion papers relating to this can be found at: http://www.immi.gov.au/pub-res/Pages/discussion-papers/overview.aspx
1.4 Student visa programme reforms In 2010, the Government commissioned the Strategic Review of the Student Visa Programme by the Hon Michael Knight AO (the Knight Review). The Government subsequently supported all 41 recommendations—with some modifications—in September 2011.
Of the 41 Knight Review recommendations, 39 have been implemented or addressed. Work on the remaining two recommendations, which are the primary responsibility of the Department of Education, is in progress. The following key recommendations have been implemented since November 2011:
• Introduction of the Genuine Temporary Entrant requirement from 5 November 2011 which explicitly addresses whether the individual circumstances of a Student visa applicant indicate that their intention is for a temporary stay in Australia.
• Introduction of streamlined visa processing from March 2012 for certain prospective students of participating universities where eligible students, regardless of their country of origin, are assessed as though they are lower risk and have reduced evidentiary requirements.
• Introduction of new post-study work visa arrangements from March 2013 as a new stream in the Skilled Graduate (subclass 485) visa, which was renamed the Temporary Graduate (subclass 485) visa. These post-study work arrangements are available for certain graduates of an Australian Bachelors, Masters or Doctoral degree.
• Student visa holders, from April 2013, are no longer subject to automatic or mandatory visa cancellation if they breach their conditions. A discretionary cancellation framework was introduced and will provide fairer outcomes for students by allowing the department to take into account the individual circumstances of a student when considering a breach of visa conditions.
Further information on the Knight Review is available at: http://www.immi.gov.au/Study/Pages/review-student-visa-programme.aspx
Australia’s Migration Trends 2012–13 Page 12 of 187
1.5 Strengthening the integrity of the subclass 457 programme In mid-2012, the department identified that the subclass 457 programme was growing strongly in industries and geographical regions not necessarily experiencing skills shortages.
On 1 July 2013, the Migration Regulations 1994 were amended to strengthen the capacity of the department to identify and prevent employer practices not in keeping with the intent of the subclass 457 visa programme. The amendments included:
• requiring sponsors to continue to meet the programme’s ‘training benchmarks’ for the training of Australians, for a three-year period (six years if the sponsor is accredited)
• introducing a ‘genuineness’ criterion in the assessment of subclass 457 visa nominations • introducing a further assessment around the number of subclass 457 workers a business can
sponsor • removing occupation-based exemptions to the English language requirement • strengthening 'market rate' assessment provisions • increasing the market salary assessment exemption level from $180 000 to $250 000 • clarifying that unintended employment relationships (including on-hire and sham contracting
arrangements) are not permissible under the subclass 457 programme • strengthening the obligation not to recover certain costs by requiring sponsors to be solely
responsible for certain costs • limiting the sponsorship term for start-up businesses to 12 months.
In addition to these regulatory measures, in June 2013 the Parliament passed the Temporary Sponsored Visas Act 2013 to ensure that employers make genuine efforts to seek Australians before using the subclass 457 visa programme.
One main feature of the Temporary Sponsored Visas Act 2013 is the labour market testing condition for sponsors which came into effect from 23 November 2013. Labour market testing requires affected sponsors to provide evidence to the department about their attempts to recruit Australian workers, including details and expenses of advertising. Not providing such evidence with their nomination for a 457 worker is grounds for the nomination to be refused. Sponsors are also required to fulfil this requirement when Australians have been made redundant from the nominated position.
Exemptions to the labour market testing requirement apply where:
• its application would be inconsistent with Australia’s international trade obligations under the World Trade Organization General Agreement on Trade in Services, and under Free Trade Agreements
• in the case of a major disaster, as specified by the Minister, or • the nomination is for an Australian and New Zealand Standard Classification of Occupations skill
level 1 or 2 occupation (except for the ‘protected’ occupational categories of nurses and engineers).
The Temporary Sponsored Visas Act 2013 also increased the:
• range of possible actions the department may take to sanction sponsors who fail to comply with their obligations
• authority of Fair Work Inspectors to monitor and investigate compliance with the programme and to monitor the use of other Temporary Work visas.
Further information is available at: http://www.immi.gov.au/skilled/changes-457-program.htm
Australia’s Migration Trends 2012–13 Page 13 of 187
1.6 Refugees and asylum seekers This section relates to developments in 2012–13 underway before the change in government following elections in September 2013. In June 2012, the Government announced the appointment of an expert panel to provide a report with advice and recommendations to prevent asylum seekers risking their lives on dangerous boat journeys to Australia. In August 2012, the Expert Panel on Asylum Seekers released a report including recommendations for:
• providing incentives for asylum seekers to seek protection through a managed regional system • applying a ‘no advantage’ principle to ensure no benefit is gained through circumventing regular
migration arrangements • increasing the size of the Humanitarian Programme to 20 000 places • enhancing regional engagement through advancing and developing cooperation on asylum
issues with Indonesia and Malaysia • improving regional processing capacity by re-establishing facilities in Nauru and Papua New
Guinea and by strengthening the safeguards and accountability associated with Australia’s agreement with Malaysia on the transfer and resettlement of asylum seekers
• changing family reunion arrangements for asylum seekers who arrived in Australia as Illegal Maritime Arrivals (IMAs).
The full Expert Panel report is available at: http://www.expertpanelonasylumseekers.dpmc.gov.au/
That same month, the Government announced that Australia and Nauru had signed a memorandum of understanding for a regional processing centre in Nauru.
Further information is available at: http://www.pandora.nla.gov.au/pan/141738/20130718-1402/www.minister.immi.gov.au/media/cb/2012/cb189579.htm
In September 2012, the Government announced that Australia and Papua New Guinea had entered into a new memorandum of understanding about regional processing arrangements in Papua New Guinea. The memorandum contained new elements as outlined in recent changes to the Migration Act 1958, such as assurances relating to key elements of the Refugee Convention. This represented a significant step towards establishing a regional processing centre in Papua New Guinea, as recommended by the Expert Panel on Asylum Seekers.
Further information is available at: http://www.pandora.nla.gov.au/pan/141738/20130718-1402/www.minister.immi.gov.au/media/cb/2012/cb189719.htm
The change to family reunion for IMAs, announced in September 2012, removed concessions previously available to the family of humanitarian entrants to further discourage people from risking their lives at sea. Under these arrangements families of IMAs apply through the Family Stream of the Migration Programme and are processed on the same basis as the family of other permanent residents and citizens. In recognition of these changes, an additional 4000 places were provided for under Family Stream migration.
Australia’s Migration Trends 2012–13 Page 14 of 187
In December 2012, the Government announced a pilot community sponsorship programme of 500 places under the Humanitarian Programme. This has the potential to:
• harness community goodwill and empower community groups to support Australia’s humanitarian intake
• provide a highly supportive settlement environment for new humanitarian entrants • offer an integrated approach for some entrants to move from resettlement, through work
experience, to employment.
Further information is available at: http://www.immi.gov.au/visas/humanitarian/offshore/community-proposal-pilot.htm
The Minister for Immigration announced in March 2013 that the Government had implemented another recommendation of the Expert Panel on Asylum Seekers, to provide assistance to IMAs who are transferred to a regional processing country in preparing their claims for refugee status.
Further information is available at: http://www.pandora.nla.gov.au/pan/141738/20130718-1402/www.minister.immi.gov.au/media/bo/2013/bo194169.htm
In May 2013, the Australian Government passed the Migration Amendment (Unauthorised Maritime Arrivals and Other Measures) Act 2013 (UMA Act). This Act implements recommendation 14 of the Expert Panel on Asylum Seekers which sought to reduce any incentive for people to take the longer journey to the Australian mainland and circumvent regional processing arrangements. Previously, people who entered Australia without a visa at the mainland were not liable for transfer to a regional processing country. Only those who entered Australia at an excised offshore place were liable. The UMA Act remedied this inconsistency by amending the Migration Act 1958 so all non-citizens entering Australia from 1 June 2013 by sea without a visa in effect—to be known as UMAs—are liable for transfer to a regional processing country.
Further information is available at: http://www.immi.gov.au/legislation/amendments/2013/130601/lc01062013-04.htm
On 19 July 2013, the governments of Australia and Papua New Guinea entered into a Regional Resettlement Arrangement. This arrangement builds on earlier bilateral co-operation and provides for transferring, processing and resettling IMAs in Papua New Guinea.
Pre-election commitments of the Coalition Government elected in September 2013 that related to the onshore protection programme included:
• Reintroducing Temporary Protection visas for illegally arriving asylum seekers who engage Australia’s protection obligations.
• Conducting a rapid audit of the protection determination system. • Ending illegal maritime and unauthorised air arrival’s access to the Immigration Advice and
Application Assistance Scheme. • Implementing a Fast Track decision-making process for illegal maritime and air arrivals seeking
protection that would include removing access to the Refugee Review Tribunal.
Australia’s Migration Trends 2012–13 Page 15 of 187
1.7 Operation Sovereign Borders On 25 July 2013, the Opposition Leader Tony Abbott announced a policy to stop the flow of illegal boat arrivals to Australia—the Operation Sovereign Borders (OSB) policy.
On 18 September 2013, the newly elected Coalition Government implemented OSB, a military-led border security operation supported by the direct involvement of a number of government agencies and departments brought together under a single operational command and a single ministerial responsibility. The OSB Joint Agency Task Force is led by Lieutenant General Angus Campbell as the operation’s Commander with Alan McKinnon as Deputy Commander.
The three task groups in the OSB task force are the:
• Disruption and Deterrence Task Group, led by Assistant Commissioner Steve Lancaster of the Australian Federal Police
• Detection, Interception and Transfer Task Group, led by Rear Admiral David Johnston from the Border Protection Command (using resources from the Australian Defence Force and Australian Customs and Border Protection Service)
• Offshore Detention and Returns Task Group, led by Ken Douglas from the Department of Immigration and Border Protection (DIBP).
The joint agency taskforce is headquartered in Canberra.
Further information is available at: Operation Sovereign Borders Policy
1.8 Building Multicultural Communities Programme On 31 May 2013, the Minister for Multicultural Affairs launched the Building Multicultural Communities Programme. The programme provided one-off funding to eligible not-for-profit, incorporated community organisations and local government authorities that provide services and key support to their community groups, for projects that enhance multicultural community spaces through infrastructure, equipment and capital works.
1.9 Community Hubs Programme On 4 July 2013, the Minister for Multicultural Affairs announced a new partnership with the Scanlon Foundation, the Murdoch Children’s Research Institute and the Migration Council Australia, to establish hubs in multicultural neighbourhoods at schools and other community facilities.
The programme offers practical assistance to migrant families and individuals to establish links with community services and access support in a safe and familiar environment, so they can build better lives and move towards full participation in Australian society.
1.10 Empowering Local Communities Programme The Empowering Local Communities Programme develops the community capacity-building skills of specific community groups that are under significant pressure due to their cultural, religious or racial diversity.
Australia’s Migration Trends 2012–13 Page 16 of 187
Chapter 2: The Migration Programme
Australia’s Migration Trends 2012–13 Page 17 of 187
2.1 Overview Australia’s permanent Migration Programme incorporates economic and family reunion migration and is the main pathway to permanent residence. The only other way for migrants to obtain permanent residence is to be accepted into Australia on humanitarian grounds.1
The Migration Programme is based on non-discriminatory principles relating to nationality, gender and religion. People who meet the criteria set out in the Migration Act 1958 can apply to migrate regardless of their ethnic origin, gender or religion.
The Migration Programme has two major streams:
1. Skill Stream—focuses on economic migration by facilitating the migration of people who have skills, proven entrepreneurial capability or outstanding abilities that will contribute to the Australian economy.
2. Family Stream—enables family reunion by allowing the migration of family members such as spouses, children, parents and certain other members of extended families.
In addition to the two major streams, a small number of Special Eligibility visas are issued. These visas cater for the resettlement of former Australian residents who meet specific criteria, or to resolve the status of certain groups of people who have been allowed to remain in Australia as long-term temporary residents for humanitarian reasons.
In reporting on the size of the Migration Programme, three things should be noted:
1. Both the Primary Applicant—the person who applied to migrate—and their dependants are counted in the Migration Programme. For the Family Stream most applicants intend to become a partner of an Australian resident and so relatively few dependants are involved (only 14.2 per cent of visa grants in 2012–13). For the Skill Stream many Primary Applicants are already in a family unit and include their spouse and children on their visa application (51.1 per cent of visa grants in 2012–13 were for dependants).
2. Under the 1973 Trans-Tasman Travel Arrangement, New Zealand citizens can enter and leave Australia freely and live in Australia indefinitely. This means they are not counted under the Migration Programme even if they have applied for and been granted a Skill Stream or Family Stream visa. In 2012–13, 2599 New Zealand citizens were granted a permanent visa through this process and a further 41 230 permanent settlers under the Trans-Tasman agreement. This was a decrease of 7.0 per cent on the previous year; however, New Zealand remained the largest source of new migrants to Australia in 2012–13.
3. When referring to the number of visa grants under the Migration Programme (also referred to as outcomes or places), the numbers reported take into account the cancellation of visas issued in previous years and cases where provisional or temporary visa holders did not subsequently obtain a permanent visa. Additionally, to prevent double-counting, people granted these provisional or temporary visas are not counted again on grant of their permanent visa. More information on the definition of Migration Programme outcomes is in the Glossary.
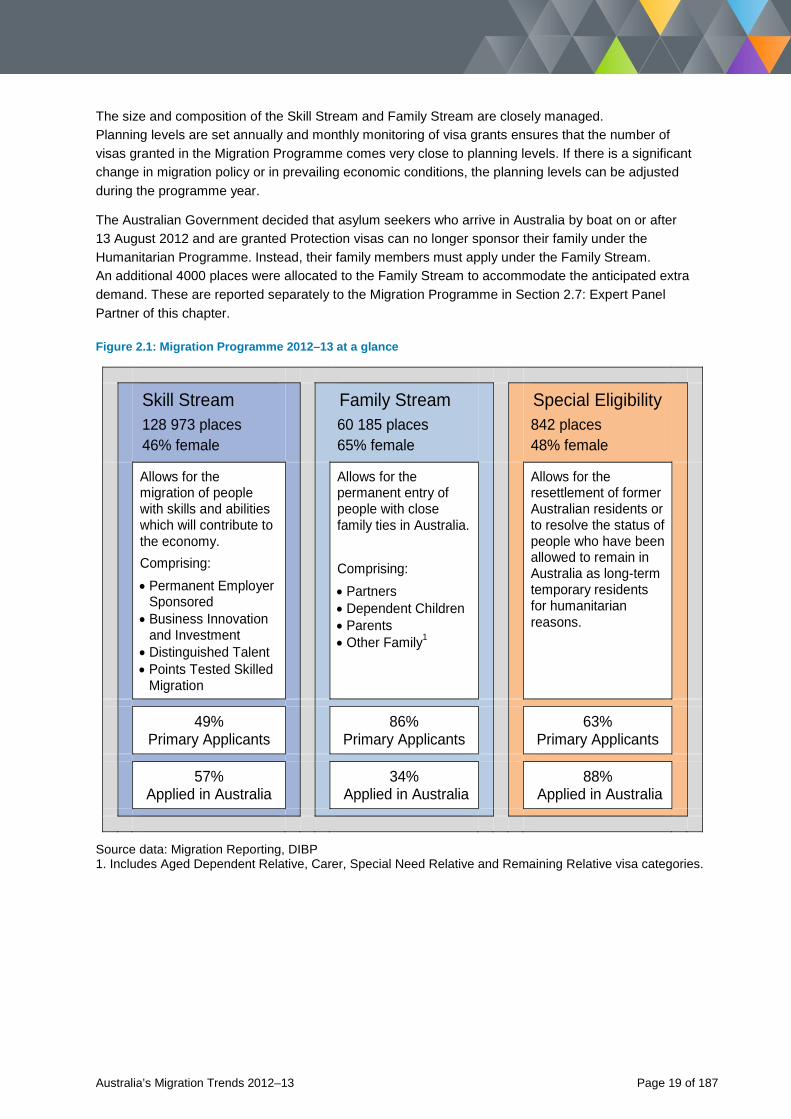
Details of the three categories of the Migration Programme are in Figure 2.1.
All applicants for permanent entry to Australia must meet health and character requirements. Primary Applicants for Skill Stream visas also need to demonstrate they have the skills and attributes needed in the Australian labour market.
1 Further information is in Chapter 4—The Humanitarian Programme.
Australia’s Migration Trends 2012–13 Page 18 of 187
The size and composition of the Skill Stream and Family Stream are closely managed. Planning levels are set annually and monthly monitoring of visa grants ensures that the number of visas granted in the Migration Programme comes very close to planning levels. If there is a significant change in migration policy or in prevailing economic conditions, the planning levels can be adjusted during the programme year.
The Australian Government decided that asylum seekers who arrive in Australia by boat on or after 13 August 2012 and are granted Protection visas can no longer sponsor their family under the Humanitarian Programme. Instead, their family members must apply under the Family Stream. An additional 4000 places were allocated to the Family Stream to accommodate the anticipated extra demand. These are reported separately to the Migration Programme in Section 2.7: Expert Panel Partner of this chapter.
Figure 2.1: Migration Programme 2012–13 at a glance
Skill Stream
128 973 places 46% female
Family Stream 60 185 places 65% female
Special Eligibility 842 places 48% female
Allows for the migration of people with skills and abilities which will contribute to the economy. Comprising: • Permanent Employer
Sponsored • Business Innovation
and Investment • Distinguished Talent • Points Tested Skilled
Migration
Allows for the permanent entry of people with close family ties in Australia. Comprising: • Partners • Dependent Children • Parents • Other Family1
Allows for the resettlement of former Australian residents or to resolve the status of people who have been allowed to remain in Australia as long-term temporary residents for humanitarian reasons.
49% Primary Applicants
86% Primary Applicants
63% Primary Applicants
57% Applied in Australia
34% Applied in Australia
88% Applied in Australia
Source data: Migration Reporting, DIBP
1. Includes Aged Dependent Relative, Carer, Special Need Relative and Remaining Relative visa categories.
Australia’s Migration Trends 2012–13 Page 19 of 187
2.2 Australia’s Migration Programme 2012–13 The Migration Programme outcome for 2012–13 was 190 000 places and comprised 128 973 places in the Skill Stream, 60 185 in the Family Stream and 842 in Special Eligibility (Table 2.1). Since 1997–98, the Skill Stream has been the main component of the Migration Programme, increasing from 51.5 per cent in 1997–98 to 67.9 per cent in 2012–13. The number of places available in the 2012–13 Migration Programme was increased by 5000 places compared to the previous programme year and was the third consecutive increase in the programme. The 2012–13 Migration Programme planning levels consisted of an increase of 3220 places under the Skill Stream, an increase of 1585 places under the Family Stream, and an increase of 195 in the Special Eligibility visa category.
Australia has experienced increases in temporary migration numbers over the past couple of decades and there has been a corresponding increase in the proportion of migrants who progress to permanent migration (onshore migration component) compared to those who apply from outside Australia (offshore migration component). In the mid-90s, around 1-in-5 Migration Programme places went to people already in Australia on a temporary basis and by 2012–13 this had increased to 1-in-2 (49.9 per cent).
Onshore migration is driven by graduating international students and by the holders of a Temporary Work (Skilled) visa (subclass 457), who successfully apply through the Skill Stream to remain in Australia permanently. Under SkillSelect, the new methodology for managing Points Tested Skilled Migration introduced on 1 July 2012, there are no longer separate visa subclass for onshore and offshore applicants. It is still too soon to know the long-term impact of this new methodology on the number of temporary visa holders who obtain a permanent resident visa. However, of the Points Tested Skilled Migration visas granted in 2012–13 through SkillSelect, 43.7 per cent were to onshore applicants. This is less than the 53.2 per cent onshore share of grants under the previous methodology for the same year. Further information on the composition of the 2012–13 Migration Programme is in Table 2.1 and Table 2.2.
Australia’s Migration Trends 2012–13 Page 20 of 187
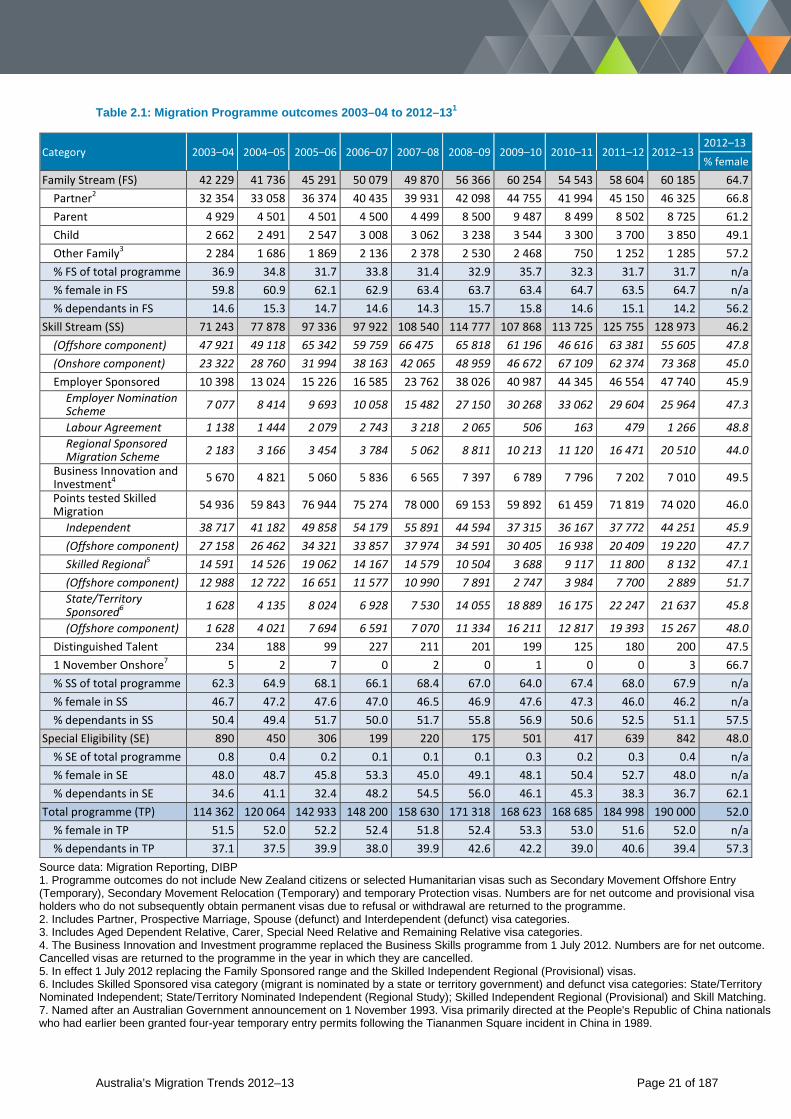
Table 2.1: Migration Programme outcomes 2003–04 to 2012–131
Category 2003–04 2004–05 2005–06 2006–07 2007–08 2008–09 2009–10 2010–11 2011–12 2012–13 2012–13 % female
Family Stream (FS) 42 229 41 736 45 291 50 079 49 870 56 366 60 254 54 543 58 604 60 185 64.7 Partner2 32 354 33 058 36 374 40 435 39 931 42 098 44 755 41 994 45 150 46 325 66.8 Parent 4 929 4 501 4 501 4 500 4 499 8 500 9 487 8 499 8 502 8 725 61.2 Child 2 662 2 491 2 547 3 008 3 062 3 238 3 544 3 300 3 700 3 850 49.1 Other Family3 2 284 1 686 1 869 2 136 2 378 2 530 2 468 750 1 252 1 285 57.2 % FS of total programme 36.9 34.8 31.7 33.8 31.4 32.9 35.7 32.3 31.7 31.7 n/a % female in FS 59.8 60.9 62.1 62.9 63.4 63.7 63.4 64.7 63.5 64.7 n/a % dependants in FS 14.6 15.3 14.7 14.6 14.3 15.7 15.8 14.6 15.1 14.2 56.2 Skill Stream (SS) 71 243 77 878 97 336 97 922 108 540 114 777 107 868 113 725 125 755 128 973 46.2 (Offshore component) 47 921 49 118 65 342 59 759 66 475 65 818 61 196 46 616 63 381 55 605 47.8 (Onshore component) 23 322 28 760 31 994 38 163 42 065 48 959 46 672 67 109 62 374 73 368 45.0 Employer Sponsored 10 398 13 024 15 226 16 585 23 762 38 026 40 987 44 345 46 554 47 740 45.9 Employer Nomination Scheme 7 077 8 414 9 693 10 058 15 482 27 150 30 268 33 062 29 604 25 964 47.3
Labour Agreement 1 138 1 444 2 079 2 743 3 218 2 065 506 163 479 1 266 48.8 Regional Sponsored Migration Scheme 2 183 3 166 3 454 3 784 5 062 8 811 10 213 11 120 16 471 20 510 44.0
Business Innovation and Investment4 5 670 4 821 5 060 5 836 6 565 7 397 6 789 7 796 7 202 7 010 49.5
Points tested Skilled Migration 54 936 59 843 76 944 75 274 78 000 69 153 59 892 61 459 71 819 74 020 46.0
Independent 38 717 41 182 49 858 54 179 55 891 44 594 37 315 36 167 37 772 44 251 45.9 (Offshore component) 27 158 26 462 34 321 33 857 37 974 34 591 30 405 16 938 20 409 19 220 47.7 Skilled Regional5 14 591 14 526 19 062 14 167 14 579 10 504 3 688 9 117 11 800 8 132 47.1 (Offshore component) 12 988 12 722 16 651 11 577 10 990 7 891 2 747 3 984 7 700 2 889 51.7 State/Territory Sponsored6 1 628 4 135 8 024 6 928 7 530 14 055 18 889 16 175 22 247 21 637 45.8
(Offshore component) 1 628 4 021 7 694 6 591 7 070 11 334 16 211 12 817 19 393 15 267 48.0 Distinguished Talent 234 188 99 227 211 201 199 125 180 200 47.5 1 November Onshore7 5 2 7 0 2 0 1 0 0 3 66.7 % SS of total programme 62.3 64.9 68.1 66.1 68.4 67.0 64.0 67.4 68.0 67.9 n/a % female in SS 46.7 47.2 47.6 47.0 46.5 46.9 47.6 47.3 46.0 46.2 n/a % dependants in SS 50.4 49.4 51.7 50.0 51.7 55.8 56.9 50.6 52.5 51.1 57.5 Special Eligibility (SE) 890 450 306 199 220 175 501 417 639 842 48.0 % SE of total programme 0.8 0.4 0.2 0.1 0.1 0.1 0.3 0.2 0.3 0.4 n/a % female in SE 48.0 48.7 45.8 53.3 45.0 49.1 48.1 50.4 52.7 48.0 n/a % dependants in SE 34.6 41.1 32.4 48.2 54.5 56.0 46.1 45.3 38.3 36.7 62.1 Total programme (TP) 114 362 120 064 142 933 148 200 158 630 171 318 168 623 168 685 184 998 190 000 52.0 % female in TP 51.5 52.0 52.2 52.4 51.8 52.4 53.3 53.0 51.6 52.0 n/a % dependants in TP 37.1 37.5 39.9 38.0 39.9 42.6 42.2 39.0 40.6 39.4 57.3 Source data: Migration Reporting, DIBP 1. Programme outcomes do not include New Zealand citizens or selected Humanitarian visas such as Secondary Movement Offshore Entry (Temporary), Secondary Movement Relocation (Temporary) and temporary Protection visas. Numbers are for net outcome and provisional visa holders who do not subsequently obtain permanent visas due to refusal or withdrawal are returned to the programme. 2. Includes Partner, Prospective Marriage, Spouse (defunct) and Interdependent (defunct) visa categories. 3. Includes Aged Dependent Relative, Carer, Special Need Relative and Remaining Relative visa categories. 4. The Business Innovation and Investment programme replaced the Business Skills programme from 1 July 2012. Numbers are for net outcome. Cancelled visas are returned to the programme in the year in which they are cancelled. 5. In effect 1 July 2012 replacing the Family Sponsored range and the Skilled Independent Regional (Provisional) visas. 6. Includes Skilled Sponsored visa category (migrant is nominated by a state or territory government) and defunct visa categories: State/Territory Nominated Independent; State/Territory Nominated Independent (Regional Study); Skilled Independent Regional (Provisional) and Skill Matching. 7. Named after an Australian Government announcement on 1 November 1993. Visa primarily directed at the People's Republic of China nationals who had earlier been granted four-year temporary entry permits following the Tiananmen Square incident in China in 1989.
Australia’s Migration Trends 2012–13 Page 21 of 187
2.3 Characteristics of permanent migrants The proportion of dependants coming through the Migration Programme has remained fairly constant over the past 10 years (Table 2.1). In 2012–13, dependants accounted for 14.2 per cent of the Family Stream, 51.1 per cent of the Skill Stream and 39.4 per cent of the overall Migration Programme. The number of dependants in the Skill Stream is of particular relevance when setting annual planning levels based on the anticipated impact the Skill Stream will have on Australia’s economy and labour market. Labour market outcomes for migrant groups, including Skill Stream Secondary Applicants, are discussed in Chapter 10.
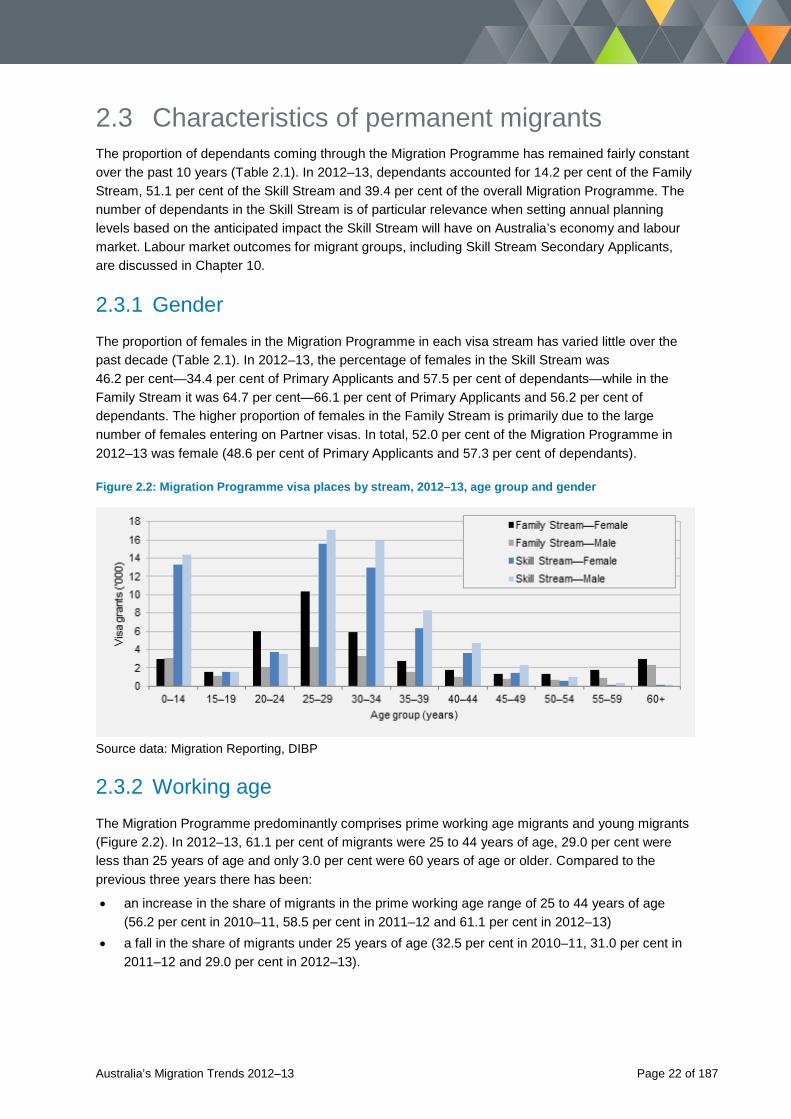
2.3.1 Gender The proportion of females in the Migration Programme in each visa stream has varied little over the past decade (Table 2.1). In 2012–13, the percentage of females in the Skill Stream was 46.2 per cent—34.4 per cent of Primary Applicants and 57.5 per cent of dependants—while in the Family Stream it was 64.7 per cent—66.1 per cent of Primary Applicants and 56.2 per cent of dependants. The higher proportion of females in the Family Stream is primarily due to the large number of females entering on Partner visas. In total, 52.0 per cent of the Migration Programme in 2012–13 was female (48.6 per cent of Primary Applicants and 57.3 per cent of dependants).
Figure 2.2: Migration Programme visa places by stream, 2012–13, age group and gender
Source data: Migration Reporting, DIBP
2.3.2 Working age The Migration Programme predominantly comprises prime working age migrants and young migrants (Figure 2.2). In 2012–13, 61.1 per cent of migrants were 25 to 44 years of age, 29.0 per cent were less than 25 years of age and only 3.0 per cent were 60 years of age or older. Compared to the previous three years there has been:
• an increase in the share of migrants in the prime working age range of 25 to 44 years of age (56.2 per cent in 2010–11, 58.5 per cent in 2011–12 and 61.1 per cent in 2012–13)
• a fall in the share of migrants under 25 years of age (32.5 per cent in 2010–11, 31.0 per cent in 2011–12 and 29.0 per cent in 2012–13).
Australia’s Migration Trends 2012–13 Page 22 of 187
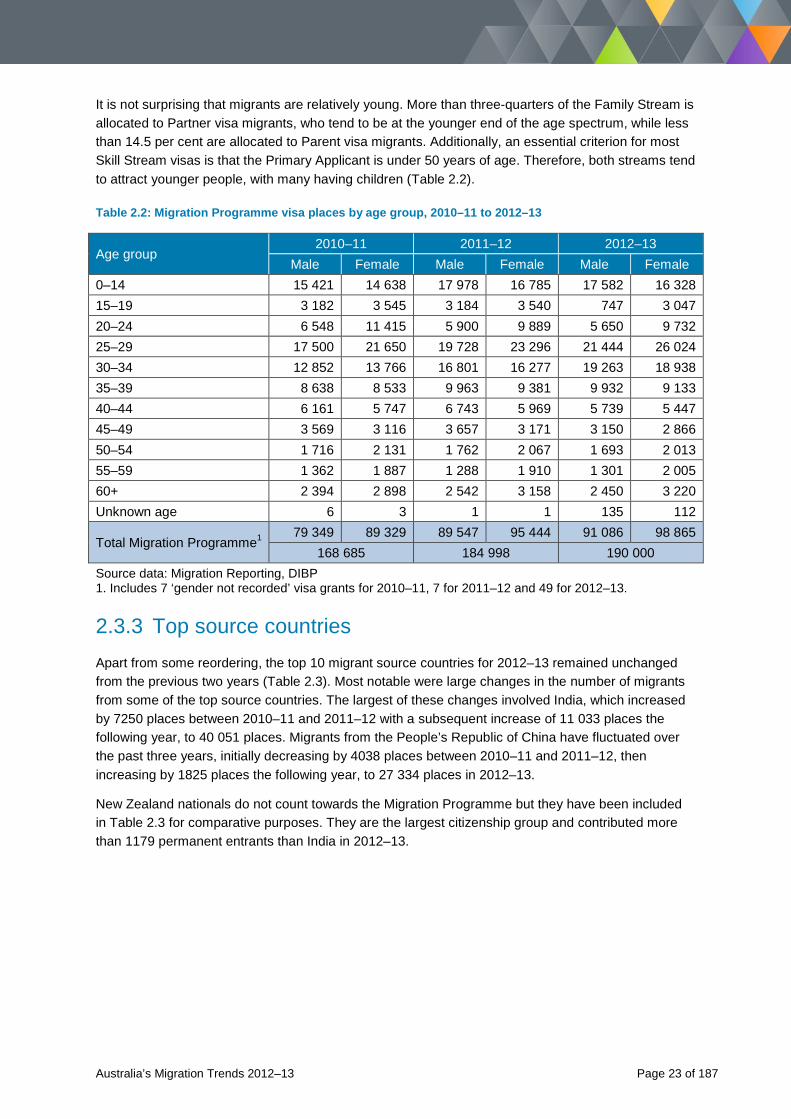
It is not surprising that migrants are relatively young. More than three-quarters of the Family Stream is allocated to Partner visa migrants, who tend to be at the younger end of the age spectrum, while less than 14.5 per cent are allocated to Parent visa migrants. Additionally, an essential criterion for most Skill Stream visas is that the Primary Applicant is under 50 years of age. Therefore, both streams tend to attract younger people, with many having children (Table 2.2).
Table 2.2: Migration Programme visa places by age group, 2010–11 to 2012–13
Age group 2010–11 2011–12 2012–13
Male Female Male Female Male Female 0–14 15 421 14 638 17 978 16 785 17 582 16 328 15–19 3 182 3 545 3 184 3 540 747 3 047 20–24 6 548 11 415 5 900 9 889 5 650 9 732 25–29 17 500 21 650 19 728 23 296 21 444 26 024 30–34 12 852 13 766 16 801 16 277 19 263 18 938 35–39 8 638 8 533 9 963 9 381 9 932 9 133 40–44 6 161 5 747 6 743 5 969 5 739 5 447 45–49 3 569 3 116 3 657 3 171 3 150 2 866 50–54 1 716 2 131 1 762 2 067 1 693 2 013 55–59 1 362 1 887 1 288 1 910 1 301 2 005 60+ 2 394 2 898 2 542 3 158 2 450 3 220 Unknown age 6 3 1 1 135 112
Total Migration Programme1 79 349 89 329 89 547 95 444 91 086 98 865
168 685 184 998 190 000 Source data: Migration Reporting, DIBP 1. Includes 7 ‘gender not recorded’ visa grants for 2010–11, 7 for 2011–12 and 49 for 2012–13.
2.3.3 Top source countries Apart from some reordering, the top 10 migrant source countries for 2012–13 remained unchanged from the previous two years (Table 2.3). Most notable were large changes in the number of migrants from some of the top source countries. The largest of these changes involved India, which increased by 7250 places between 2010–11 and 2011–12 with a subsequent increase of 11 033 places the following year, to 40 051 places. Migrants from the People’s Republic of China have fluctuated over the past three years, initially decreasing by 4038 places between 2010–11 and 2011–12, then increasing by 1825 places the following year, to 27 334 places in 2012–13.
New Zealand nationals do not count towards the Migration Programme but they have been included in Table 2.3 for comparative purposes. They are the largest citizenship group and contributed more than 1179 permanent entrants than India in 2012–13.
Australia’s Migration Trends 2012–13 Page 23 of 187
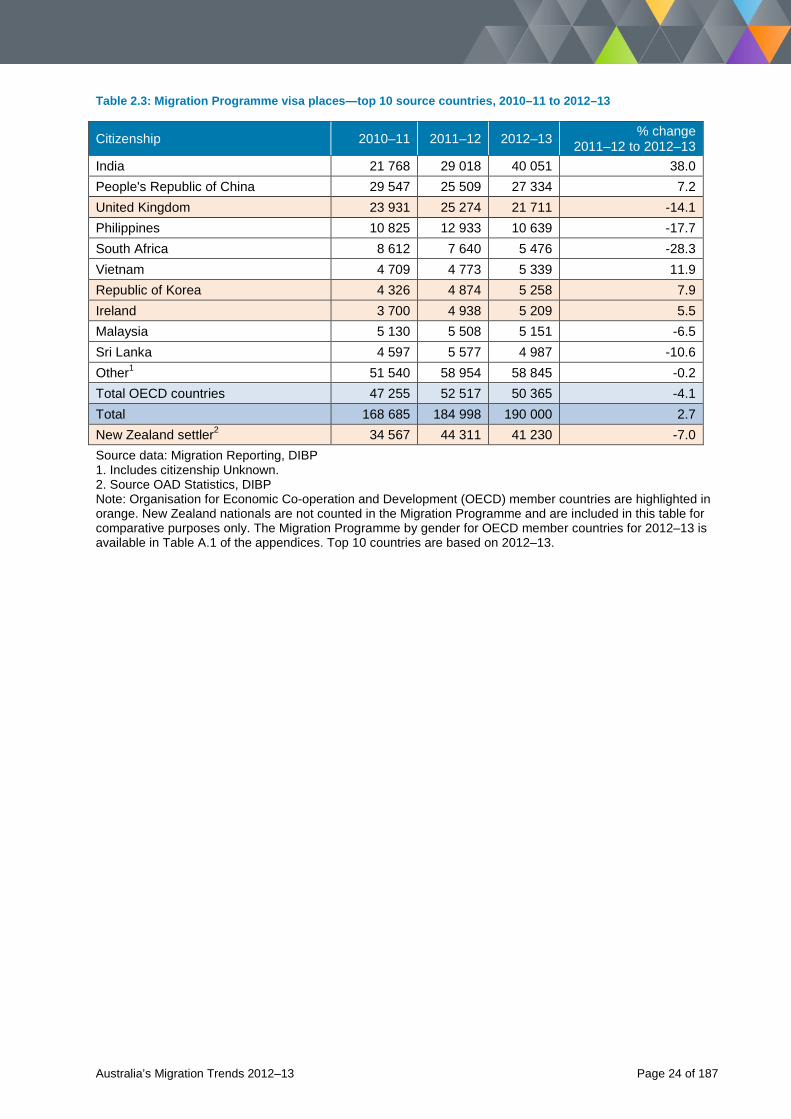
Table 2.3: Migration Programme visa places—top 10 source countries, 2010–11 to 2012–13
Citizenship 2010–11 2011–12 2012–13 % change 2011–12 to 2012–13
India 21 768 29 018 40 051 38.0 People's Republic of China 29 547 25 509 27 334 7.2 United Kingdom 23 931 25 274 21 711 -14.1 Philippines 10 825 12 933 10 639 -17.7 South Africa 8 612 7 640 5 476 -28.3 Vietnam 4 709 4 773 5 339 11.9 Republic of Korea 4 326 4 874 5 258 7.9 Ireland 3 700 4 938 5 209 5.5 Malaysia 5 130 5 508 5 151 -6.5 Sri Lanka 4 597 5 577 4 987 -10.6 Other1 51 540 58 954 58 845 -0.2 Total OECD countries 47 255 52 517 50 365 -4.1 Total 168 685 184 998 190 000 2.7 New Zealand settler2 34 567 44 311 41 230 -7.0 Source data: Migration Reporting, DIBP 1. Includes citizenship Unknown. 2. Source OAD Statistics, DIBP Note: Organisation for Economic Co-operation and Development (OECD) member countries are highlighted in orange. New Zealand nationals are not counted in the Migration Programme and are included in this table for comparative purposes only. The Migration Programme by gender for OECD member countries for 2012–13 is available in Table A.1 of the appendices. Top 10 countries are based on 2012–13.
Australia’s Migration Trends 2012–13 Page 24 of 187
2.4 The Skill Stream The Skill Stream is designed for workers who have the skills, qualifications and entrepreneurialism most needed in the Australian economy. These skilled migrants help the Australian economy directly through increased productivity and by filling labour market needs and shortages. They also provide an indirect benefit through increased demand for goods and services, creating more jobs and reducing unemployment.
The Skill Stream has grown in size every year since 1997–98, apart from a decrease of 6.0 per cent in 2009–10 following the global economic crisis. In 2012–13, the Skill Stream delivered 128 973 places. These additional 3218 places represent a 2.6 per cent increase on the previous year’s 125 755 places.
Australia’s Skill Stream comprises four components (Figure 2.3). The largest is Points Tested Skilled Migration, which replaced the General Skilled Migration category. Points Tested Skilled Migration accounted for 57.4 per cent of the Skill Stream and 39.0 per cent of the Migration Programme in 2012–13. This is followed by the Employer Sponsored visa programme and the Business Innovation and Investment visa programme, accounting for 37.0 per cent and 5.4 per cent of the Migration Programme respectively. Distinguished Talent is the smallest component and represented only 0.2 per cent of the programme in 2012–13.
In absolute terms, most of the 2.6 per cent growth in 2012–13 was in the Skilled Independent visa category (up 6479 places or 17.2 per cent) and the Regional Sponsored Migration Scheme (RSMS) (up 4039 places or 24.5 per cent) (Table 2.1).The largest decreases occurred in the Skilled Regional visa category (down 3668 places or 31.1 per cent) and the Employer Nomination Scheme (ENS) (down 3640 places or 12.3 per cent). Of note is the decrease in the offshore component of the State/Territory Sponsored category, which fell by 4126 places (down 21.3 per cent) while the onshore component increased by 3516 places (up 123.2 per cent). The reason for this was an increase in State/Territory Sponsored visa grants to applicants holding one of two temporary onshore visa subclasses—with 1877 additional grants to holders of a Temporary Graduate (subclass 485) visa and 927 to holders of a Temporary Work (Skilled) (subclass 457) visa.
Australia’s Migration Trends 2012–13 Page 25 of 187
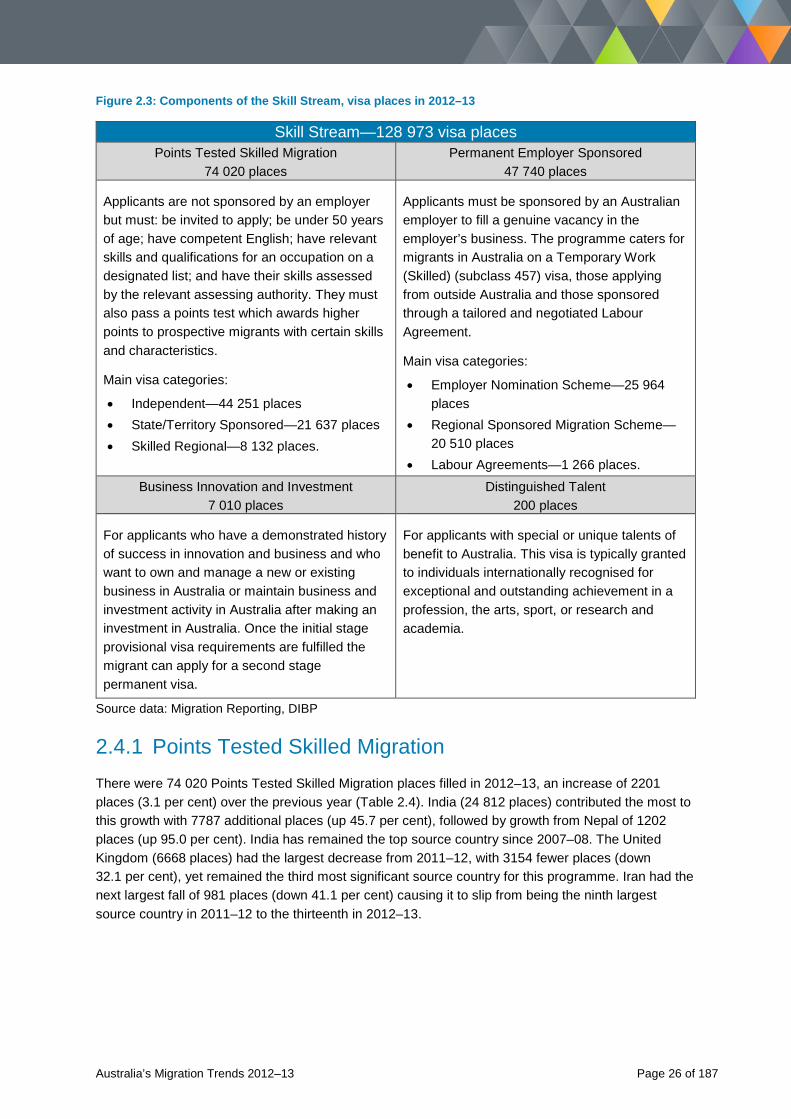
Figure 2.3: Components of the Skill Stream, visa places in 2012–13
Skill Stream—128 973 visa places Points Tested Skilled Migration
74 020 places Permanent Employer Sponsored
47 740 places
Applicants are not sponsored by an employer but must: be invited to apply; be under 50 years of age; have competent English; have relevant skills and qualifications for an occupation on a designated list; and have their skills assessed by the relevant assessing authority. They must also pass a points test which awards higher points to prospective migrants with certain skills and characteristics.
Main visa categories:
• Independent—44 251 places • State/Territory Sponsored—21 637 places • Skilled Regional—8 132 places.
Applicants must be sponsored by an Australian employer to fill a genuine vacancy in the employer’s business. The programme caters for migrants in Australia on a Temporary Work (Skilled) (subclass 457) visa, those applying from outside Australia and those sponsored through a tailored and negotiated Labour Agreement.
Main visa categories:
• Employer Nomination Scheme—25 964 places
• Regional Sponsored Migration Scheme—20 510 places
• Labour Agreements—1 266 places. Business Innovation and Investment
7 010 places Distinguished Talent
200 places
For applicants who have a demonstrated history of success in innovation and business and who want to own and manage a new or existing business in Australia or maintain business and investment activity in Australia after making an investment in Australia. Once the initial stage provisional visa requirements are fulfilled the migrant can apply for a second stage permanent visa.
For applicants with special or unique talents of benefit to Australia. This visa is typically granted to individuals internationally recognised for exceptional and outstanding achievement in a profession, the arts, sport, or research and academia.
Source data: Migration Reporting, DIBP
2.4.1 Points Tested Skilled Migration There were 74 020 Points Tested Skilled Migration places filled in 2012–13, an increase of 2201 places (3.1 per cent) over the previous year (Table 2.4). India (24 812 places) contributed the most to this growth with 7787 additional places (up 45.7 per cent), followed by growth from Nepal of 1202 places (up 95.0 per cent). India has remained the top source country since 2007–08. The United Kingdom (6668 places) had the largest decrease from 2011–12, with 3154 fewer places (down 32.1 per cent), yet remained the third most significant source country for this programme. Iran had the next largest fall of 981 places (down 41.1 per cent) causing it to slip from being the ninth largest source country in 2011–12 to the thirteenth in 2012–13.
Australia’s Migration Trends 2012–13 Page 26 of 187
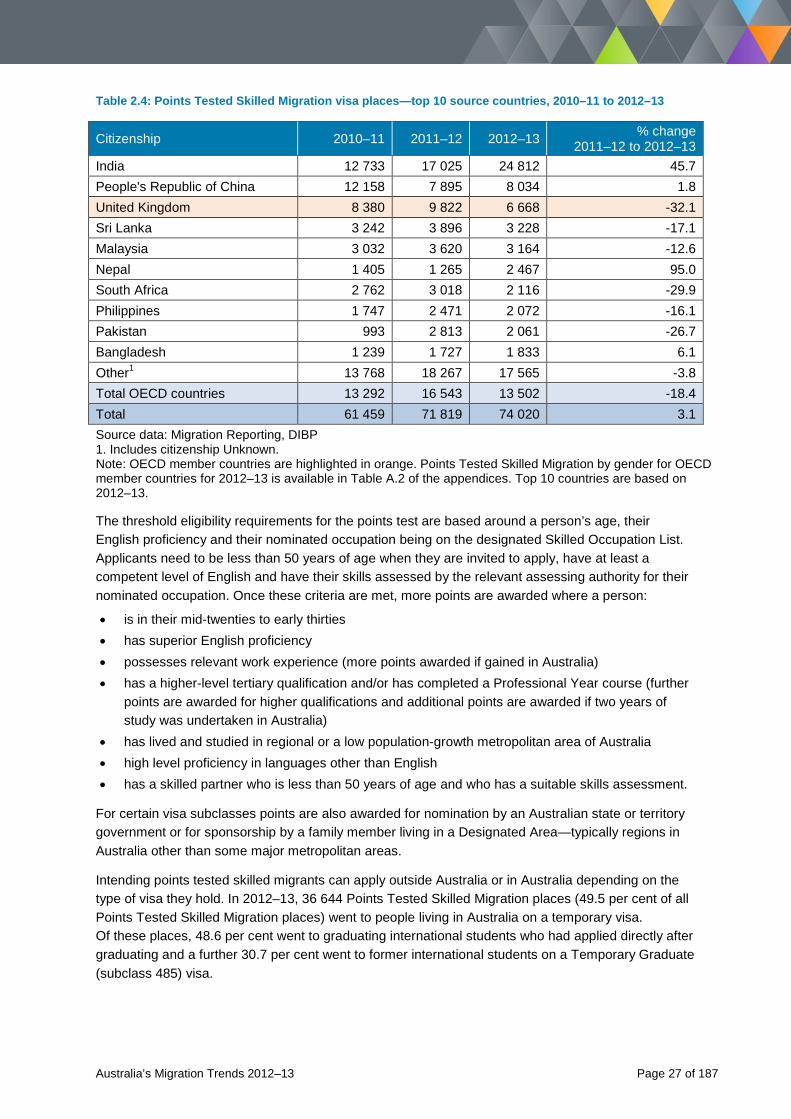
Table 2.4: Points Tested Skilled Migration visa places—top 10 source countries, 2010–11 to 2012–13
Citizenship 2010–11 2011–12 2012–13 % change 2011–12 to 2012–13
India 12 733 17 025 24 812 45.7 People's Republic of China 12 158 7 895 8 034 1.8 United Kingdom 8 380 9 822 6 668 -32.1 Sri Lanka 3 242 3 896 3 228 -17.1 Malaysia 3 032 3 620 3 164 -12.6 Nepal 1 405 1 265 2 467 95.0 South Africa 2 762 3 018 2 116 -29.9 Philippines 1 747 2 471 2 072 -16.1 Pakistan 993 2 813 2 061 -26.7 Bangladesh 1 239 1 727 1 833 6.1 Other1 13 768 18 267 17 565 -3.8 Total OECD countries 13 292 16 543 13 502 -18.4 Total 61 459 71 819 74 020 3.1 Source data: Migration Reporting, DIBP 1. Includes citizenship Unknown. Note: OECD member countries are highlighted in orange. Points Tested Skilled Migration by gender for OECD member countries for 2012–13 is available in Table A.2 of the appendices. Top 10 countries are based on 2012–13.
The threshold eligibility requirements for the points test are based around a person’s age, their English proficiency and their nominated occupation being on the designated Skilled Occupation List. Applicants need to be less than 50 years of age when they are invited to apply, have at least a competent level of English and have their skills assessed by the relevant assessing authority for their nominated occupation. Once these criteria are met, more points are awarded where a person:
• is in their mid-twenties to early thirties • has superior English proficiency • possesses relevant work experience (more points awarded if gained in Australia) • has a higher-level tertiary qualification and/or has completed a Professional Year course (further
points are awarded for higher qualifications and additional points are awarded if two years of study was undertaken in Australia)
• has lived and studied in regional or a low population-growth metropolitan area of Australia • high level proficiency in languages other than English • has a skilled partner who is less than 50 years of age and who has a suitable skills assessment.
For certain visa subclasses points are also awarded for nomination by an Australian state or territory government or for sponsorship by a family member living in a Designated Area—typically regions in Australia other than some major metropolitan areas.
Intending points tested skilled migrants can apply outside Australia or in Australia depending on the type of visa they hold. In 2012–13, 36 644 Points Tested Skilled Migration places (49.5 per cent of all Points Tested Skilled Migration places) went to people living in Australia on a temporary visa. Of these places, 48.6 per cent went to graduating international students who had applied directly after graduating and a further 30.7 per cent went to former international students on a Temporary Graduate (subclass 485) visa.
Australia’s Migration Trends 2012–13 Page 27 of 187
Overall there was a 50.7 per cent increase in onshore Points Tested Skilled Migration places compared to the 24 317 places in 2011–12. This increase was largely a flow-on effect arising from the growth in grants to migrants on the Temporary Graduate (subclass 485) visa and the Temporary Work (Skilled) (subclass 457) visa. Between 2011–12 and 2012–13, grants to subclass 485 visa holders increased from 4901 to 11 255 (up 6354) while grants to subclass 457 visa holders increased from 27 to 3642 (up 3615).
2.4.2 Permanent Employer Sponsored
Permanent Employer Sponsored migration allows businesses to employ the skilled workers they need to fill genuine job vacancies. These employees can be from outside Australia or can be temporary visa holders living in Australia. Permanent Employer Sponsored visas are not capped and receive higher processing priority, in an effort to respond quickly to the needs of Australian employers. In 2012–13, 47 740 Permanent Employer Sponsored places were filled, equivalent to 37.0 per cent of the Skill Stream and 25.1 per cent of the overall Migration Programme.
Most Permanent Employer Sponsored entrants apply from within Australia and the 2012–13 programme year was no exception with 76.2 per cent of visas granted to onshore applicants. Of these, 69.5 per cent came from the Temporary Work (Skilled) (subclass 457) visa programme. The other main temporary migration category was former international students (17.0 per cent)—comprising 10.7 per cent sponsored directly from a Student visa and 6.3 per cent sponsored from a Temporary Graduate (subclass 485) visa.
The Permanent Employer Sponsored programme comprises two permanent residence visa categories—the ENS and the RSMS—and Labour Agreements.
ENS—for Australian employers who want to sponsor overseas skilled workers to work in their business in a genuine job vacancy. The prospective migrant can be a skilled worker from overseas or on a temporary visa in Australia. They must choose an occupation listed on the Consolidated Sponsored Occupation List and comply with Australian standards and workplace legislation for wages and working conditions.
RSMS—for employers in regional or low-population growth areas of Australia, to fill vacancies in their businesses by sponsoring skilled workers for permanent residence. The programme aims to attract skilled migrants to communities in regional and low population-growth areas of Australia where their skills are most needed.
Labour Agreement—a formal arrangement between an Australian employer and the Australian Government allowing for recruitment of a specified number of skilled workers from overseas, in response to identified skills shortages. The programme is designed to ensure that overseas recruitment supports the longer-term improvement of employment and training opportunities for Australians as employers must commit to the employment, education, training and career opportunities of Australians as part of obtaining a Labour Agreement.
Australia’s Migration Trends 2012–13 Page 28 of 187
From 1 July 2012, existing Labour Agreement permanent visas were no longer available. Instead, a new Labour Agreement Stream was made accessible through the ENS and RSMS. Under this new arrangement the ENS and RSMS have three streams under which a potential migrant can apply:
• Temporary Residence Transition Stream—for Temporary Work (Skilled) (subclass 457) visa holders who have been tested in the Australian labour market by having worked for two out of the last three years in their nominated occupation and who have a permanent job offer from their employer in this occupation.
• Direct Entry Stream—for applicants from outside Australia or inside Australia who are untested in Australia’s labour market through having not held a subclass 457 visa for at least two-out-of-three years with their nominating employer.
• Agreement Stream—for applicants sponsored by an employer through a tailored and negotiated Labour Agreement.
Over the past decade, the ENS share of the Skill Stream has doubled, whereas the RSMS has increased more than five-fold. The strong rate of growth in both schemes is a consequence of an increasing focus on using immigration to supply new labour to Australian employers. The particularly strong growth in the RSMS is a result of allocating a specific number of places to this scheme when setting planning levels for the Migration Programme.
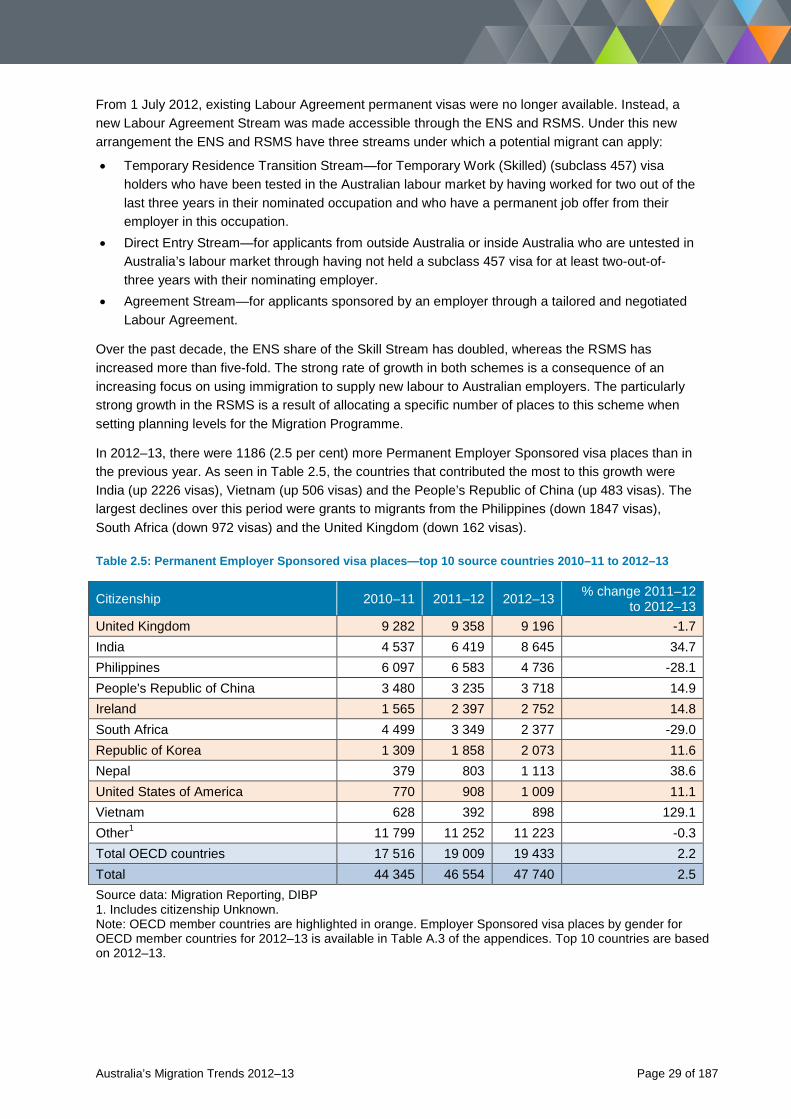
In 2012–13, there were 1186 (2.5 per cent) more Permanent Employer Sponsored visa places than in the previous year. As seen in Table 2.5, the countries that contributed the most to this growth were India (up 2226 visas), Vietnam (up 506 visas) and the People’s Republic of China (up 483 visas). The largest declines over this period were grants to migrants from the Philippines (down 1847 visas), South Africa (down 972 visas) and the United Kingdom (down 162 visas).
Table 2.5: Permanent Employer Sponsored visa places—top 10 source countries 2010–11 to 2012–13
Citizenship 2010–11 2011–12 2012–13 % change 2011–12 to 2012–13
United Kingdom 9 282 9 358 9 196 -1.7 India 4 537 6 419 8 645 34.7 Philippines 6 097 6 583 4 736 -28.1 People's Republic of China 3 480 3 235 3 718 14.9 Ireland 1 565 2 397 2 752 14.8 South Africa 4 499 3 349 2 377 -29.0 Republic of Korea 1 309 1 858 2 073 11.6 Nepal 379 803 1 113 38.6 United States of America 770 908 1 009 11.1 Vietnam 628 392 898 129.1 Other1 11 799 11 252 11 223 -0.3 Total OECD countries 17 516 19 009 19 433 2.2 Total 44 345 46 554 47 740 2.5 Source data: Migration Reporting, DIBP 1. Includes citizenship Unknown. Note: OECD member countries are highlighted in orange. Employer Sponsored visa places by gender for OECD member countries for 2012–13 is available in Table A.3 of the appendices. Top 10 countries are based on 2012–13.
Australia’s Migration Trends 2012–13 Page 29 of 187
2.4.3 Business Innovation and Investment The Business Innovation and Investment programme aims to attract skilled and experienced business owners and investors who have demonstrated experience and success in business or investment. Migrants under this programme are expected to contribute to the Australian economy by becoming actively involved as owners or part owners at a senior level in business or through investment. The programme superseded the Business Skills programme on 1 July 2012. It focuses on attracting entrepreneurial talent, innovation and investment, thereby benefiting the Australian economy. The drivers of the two programmes are not dissimilar so their programme numbers reported earlier in Table 2.1 were amalgamated, under Business Innovation and Investment outcomes.
The programme contains three categories of visas: direct permanent entry; stage 1 provisional; and stage 2 permanent visas (Table 2.7). Under the new Business Innovation and Investment programme, a person can directly apply for permanent residence under the following two streams:
• Significant Business History Stream—for people who have significant assets and a successful business career who want to own and maintain a management role in a business in Australia.
• Venture Capital Entrepreneur Stream—for people who have at least $1 million in funding from an Australian venture capital firm for: start-up; product commercialisation; or business development of a promising high-value business idea.
Under the new Business Innovation and Investment programme, there are three streams under which a person can apply for a stage 1 provisional visa, and then the stage 2 permanent visa (Table 2.7):
• Business Innovation Stream—for people who want to own and manage a new or existing business in Australia.
• Investor Stream—for people who want to make a designated investment of at least $1.5 million in an Australian state or territory and want to maintain business and investment activity in Australia after the original investment has matured.
• Significant Investor Stream—for people who are willing to invest at least $5 million into complying investments in Australia and want to maintain business and investment activity in Australia after the original investment has matured.
Most entrants come to Australia initially on a provisional visa for four years and, after satisfactory evidence of a specified level of business or investment activity, may apply for permanent residence.
There were 7010 Business Innovation and Investment visa places in 2012–13, representing 5.4 per cent of the Skill Stream. This was slightly down on the 7202 places in 2011–12. Table 2.7 shows the number of Business Innovation and Investment visas under the three categories, separating those granted under the new programme where possible.
Australia’s Migration Trends 2012–13 Page 30 of 187
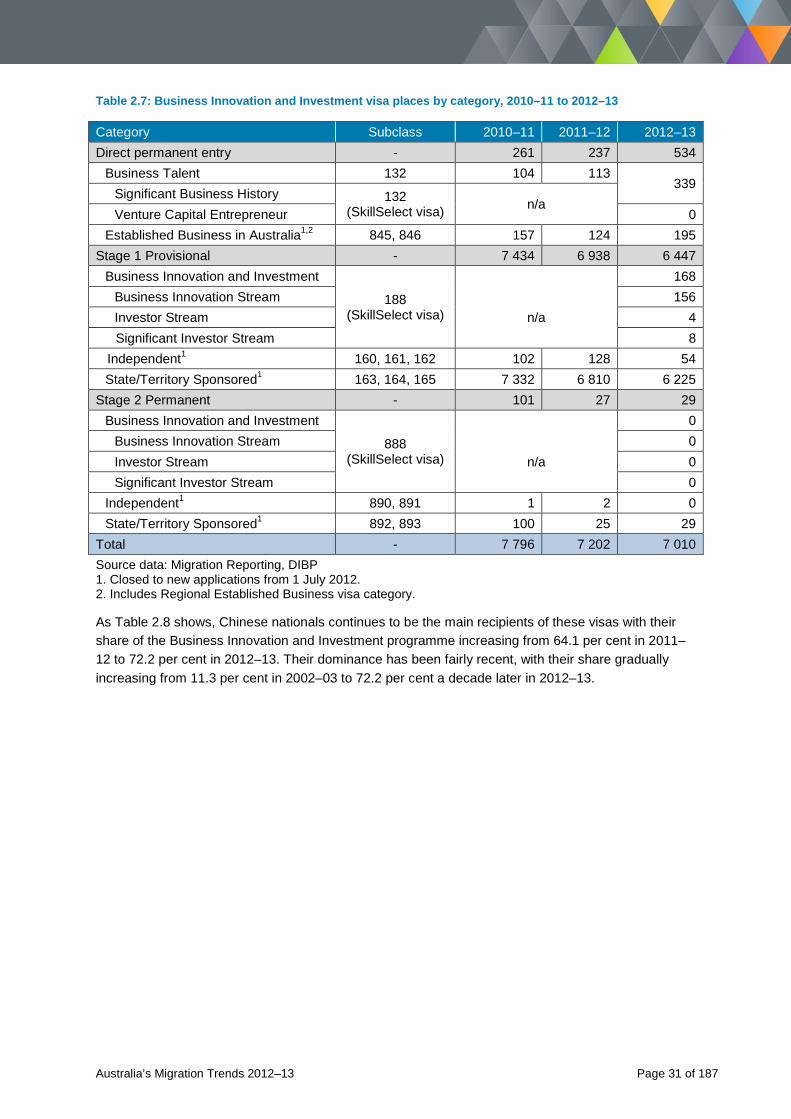
Table 2.7: Business Innovation and Investment visa places by category, 2010–11 to 2012–13
Category Subclass 2010–11 2011–12 2012–13 Direct permanent entry - 261 237 534 Business Talent 132 104 113
339 Significant Business History 132
(SkillSelect visa) n/a Venture Capital Entrepreneur 0 Established Business in Australia1,2 845, 846 157 124 195 Stage 1 Provisional - 7 434 6 938 6 447 Business Innovation and Investment
188 (SkillSelect visa)
168 Business Innovation Stream
n/a 156
Investor Stream 4 Significant Investor Stream 8 Independent1 160, 161, 162 102 128 54 State/Territory Sponsored1 163, 164, 165 7 332 6 810 6 225 Stage 2 Permanent - 101 27 29 Business Innovation and Investment
888 (SkillSelect visa)
0 Business Innovation Stream
n/a 0
Investor Stream 0 Significant Investor Stream 0 Independent1 890, 891 1 2 0 State/Territory Sponsored1 892, 893 100 25 29 Total - 7 796 7 202 7 010 Source data: Migration Reporting, DIBP 1. Closed to new applications from 1 July 2012. 2. Includes Regional Established Business visa category.
As Table 2.8 shows, Chinese nationals continues to be the main recipients of these visas with their share of the Business Innovation and Investment programme increasing from 64.1 per cent in 2011–12 to 72.2 per cent in 2012–13. Their dominance has been fairly recent, with their share gradually increasing from 11.3 per cent in 2002–03 to 72.2 per cent a decade later in 2012–13.
Australia’s Migration Trends 2012–13 Page 31 of 187
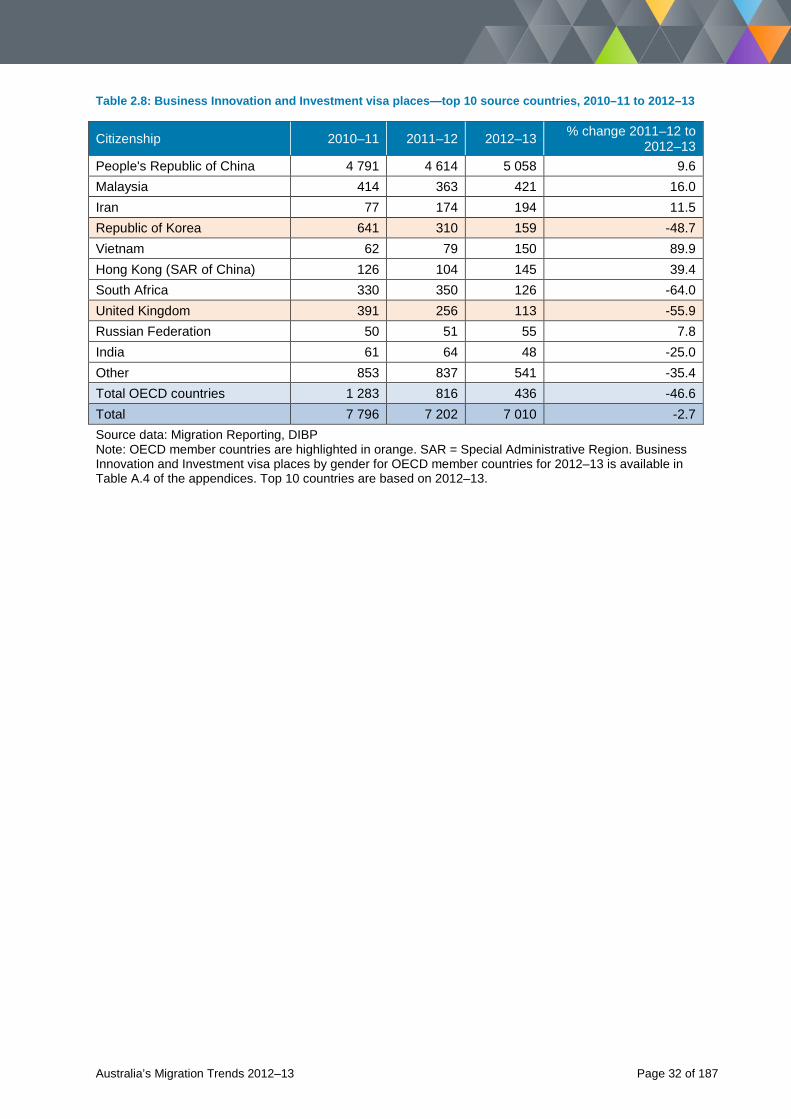
Table 2.8: Business Innovation and Investment visa places—top 10 source countries, 2010–11 to 2012–13
Citizenship 2010–11 2011–12 2012–13 % change 2011–12 to 2012–13
People's Republic of China 4 791 4 614 5 058 9.6 Malaysia 414 363 421 16.0 Iran 77 174 194 11.5 Republic of Korea 641 310 159 -48.7 Vietnam 62 79 150 89.9 Hong Kong (SAR of China) 126 104 145 39.4 South Africa 330 350 126 -64.0 United Kingdom 391 256 113 -55.9 Russian Federation 50 51 55 7.8 India 61 64 48 -25.0 Other 853 837 541 -35.4 Total OECD countries 1 283 816 436 -46.6 Total 7 796 7 202 7 010 -2.7 Source data: Migration Reporting, DIBP Note: OECD member countries are highlighted in orange. SAR = Special Administrative Region. Business Innovation and Investment visa places by gender for OECD member countries for 2012–13 is available in Table A.4 of the appendices. Top 10 countries are based on 2012–13.
Australia’s Migration Trends 2012–13 Page 32 of 187
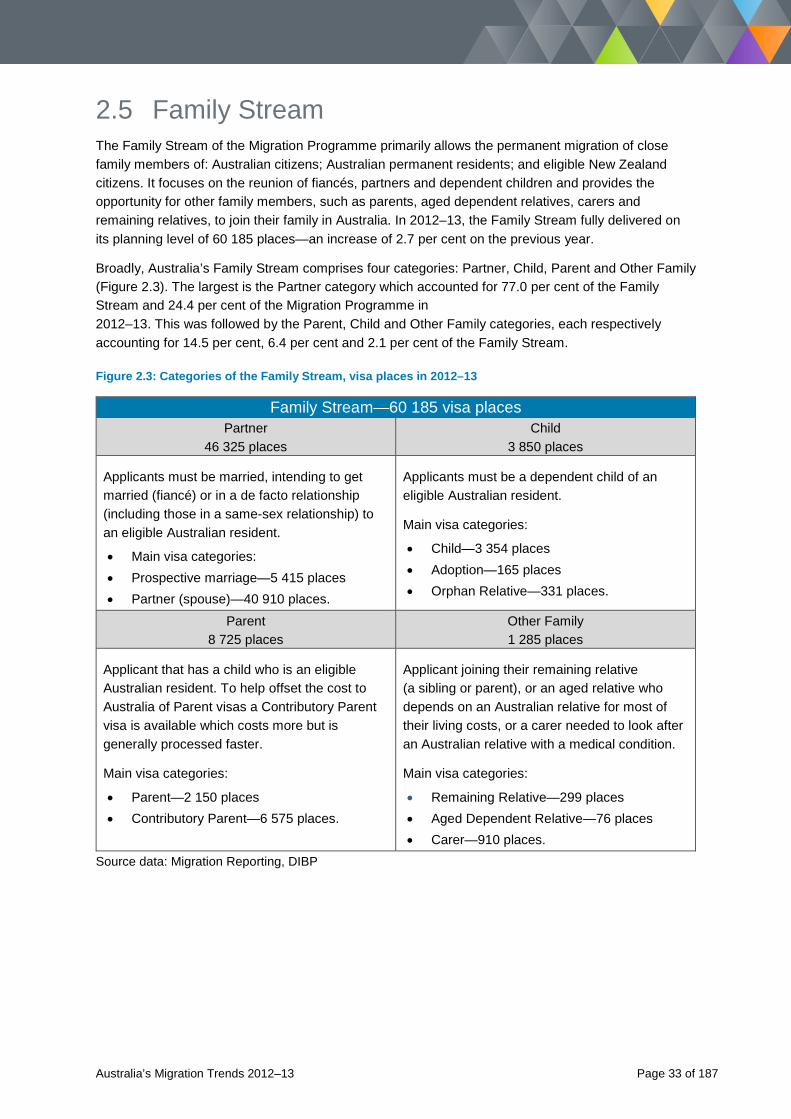
2.5 Family Stream The Family Stream of the Migration Programme primarily allows the permanent migration of close family members of: Australian citizens; Australian permanent residents; and eligible New Zealand citizens. It focuses on the reunion of fiancés, partners and dependent children and provides the opportunity for other family members, such as parents, aged dependent relatives, carers and remaining relatives, to join their family in Australia. In 2012–13, the Family Stream fully delivered on its planning level of 60 185 places—an increase of 2.7 per cent on the previous year.
Broadly, Australia’s Family Stream comprises four categories: Partner, Child, Parent and Other Family (Figure 2.3). The largest is the Partner category which accounted for 77.0 per cent of the Family Stream and 24.4 per cent of the Migration Programme in 2012–13. This was followed by the Parent, Child and Other Family categories, each respectively accounting for 14.5 per cent, 6.4 per cent and 2.1 per cent of the Family Stream.
Figure 2.3: Categories of the Family Stream, visa places in 2012–13
Family Stream—60 185 visa places Partner
46 325 places Child
3 850 places
Applicants must be married, intending to get married (fiancé) or in a de facto relationship (including those in a same-sex relationship) to an eligible Australian resident.
• Main visa categories: • Prospective marriage—5 415 places • Partner (spouse)—40 910 places.
Applicants must be a dependent child of an eligible Australian resident.
Main visa categories:
• Child—3 354 places • Adoption—165 places • Orphan Relative—331 places.
Parent 8 725 places
Other Family 1 285 places
Applicant that has a child who is an eligible Australian resident. To help offset the cost to Australia of Parent visas a Contributory Parent visa is available which costs more but is generally processed faster.
Main visa categories:
• Parent—2 150 places • Contributory Parent—6 575 places.
Applicant joining their remaining relative (a sibling or parent), or an aged relative who depends on an Australian relative for most of their living costs, or a carer needed to look after an Australian relative with a medical condition.
Main visa categories:
• Remaining Relative—299 places • Aged Dependent Relative—76 places • Carer—910 places.
Source data: Migration Reporting, DIBP
Australia’s Migration Trends 2012–13 Page 33 of 187
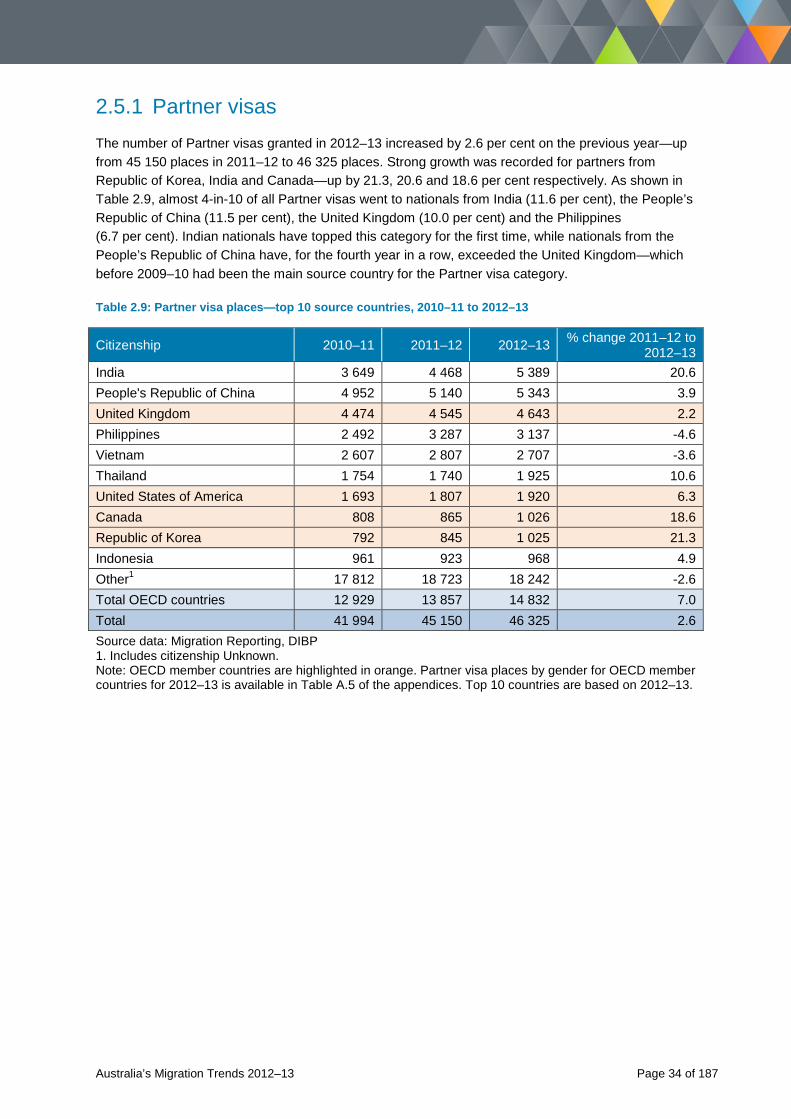
2.5.1 Partner visas The number of Partner visas granted in 2012–13 increased by 2.6 per cent on the previous year—up from 45 150 places in 2011–12 to 46 325 places. Strong growth was recorded for partners from Republic of Korea, India and Canada—up by 21.3, 20.6 and 18.6 per cent respectively. As shown in Table 2.9, almost 4-in-10 of all Partner visas went to nationals from India (11.6 per cent), the People’s Republic of China (11.5 per cent), the United Kingdom (10.0 per cent) and the Philippines (6.7 per cent). Indian nationals have topped this category for the first time, while nationals from the People’s Republic of China have, for the fourth year in a row, exceeded the United Kingdom—which before 2009–10 had been the main source country for the Partner visa category.
Table 2.9: Partner visa places—top 10 source countries, 2010–11 to 2012–13
Citizenship 2010–11 2011–12 2012–13 % change 2011–12 to 2012–13
India 3 649 4 468 5 389 20.6 People's Republic of China 4 952 5 140 5 343 3.9 United Kingdom 4 474 4 545 4 643 2.2 Philippines 2 492 3 287 3 137 -4.6 Vietnam 2 607 2 807 2 707 -3.6 Thailand 1 754 1 740 1 925 10.6 United States of America 1 693 1 807 1 920 6.3 Canada 808 865 1 026 18.6 Republic of Korea 792 845 1 025 21.3 Indonesia 961 923 968 4.9 Other1 17 812 18 723 18 242 -2.6 Total OECD countries 12 929 13 857 14 832 7.0 Total 41 994 45 150 46 325 2.6 Source data: Migration Reporting, DIBP 1. Includes citizenship Unknown. Note: OECD member countries are highlighted in orange. Partner visa places by gender for OECD member countries for 2012–13 is available in Table A.5 of the appendices. Top 10 countries are based on 2012–13.
Australia’s Migration Trends 2012–13 Page 34 of 187
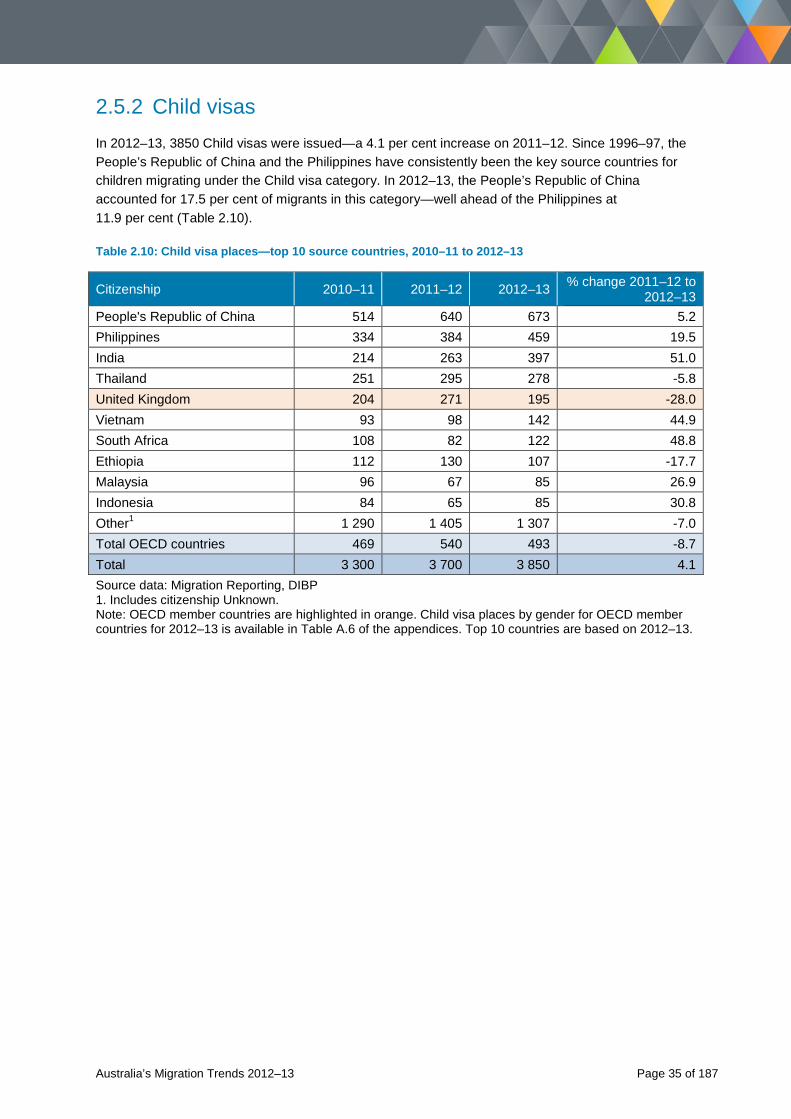
2.5.2 Child visas In 2012–13, 3850 Child visas were issued—a 4.1 per cent increase on 2011–12. Since 1996–97, the People’s Republic of China and the Philippines have consistently been the key source countries for children migrating under the Child visa category. In 2012–13, the People’s Republic of China accounted for 17.5 per cent of migrants in this category—well ahead of the Philippines at 11.9 per cent (Table 2.10).
Table 2.10: Child visa places—top 10 source countries, 2010–11 to 2012–13
Citizenship 2010–11 2011–12 2012–13 % change 2011–12 to 2012–13
People's Republic of China 514 640 673 5.2 Philippines 334 384 459 19.5 India 214 263 397 51.0 Thailand 251 295 278 -5.8 United Kingdom 204 271 195 -28.0 Vietnam 93 98 142 44.9 South Africa 108 82 122 48.8 Ethiopia 112 130 107 -17.7 Malaysia 96 67 85 26.9 Indonesia 84 65 85 30.8 Other1 1 290 1 405 1 307 -7.0 Total OECD countries 469 540 493 -8.7 Total 3 300 3 700 3 850 4.1 Source data: Migration Reporting, DIBP 1. Includes citizenship Unknown. Note: OECD member countries are highlighted in orange. Child visa places by gender for OECD member countries for 2012–13 is available in Table A.6 of the appendices. Top 10 countries are based on 2012–13.
Australia’s Migration Trends 2012–13 Page 35 of 187
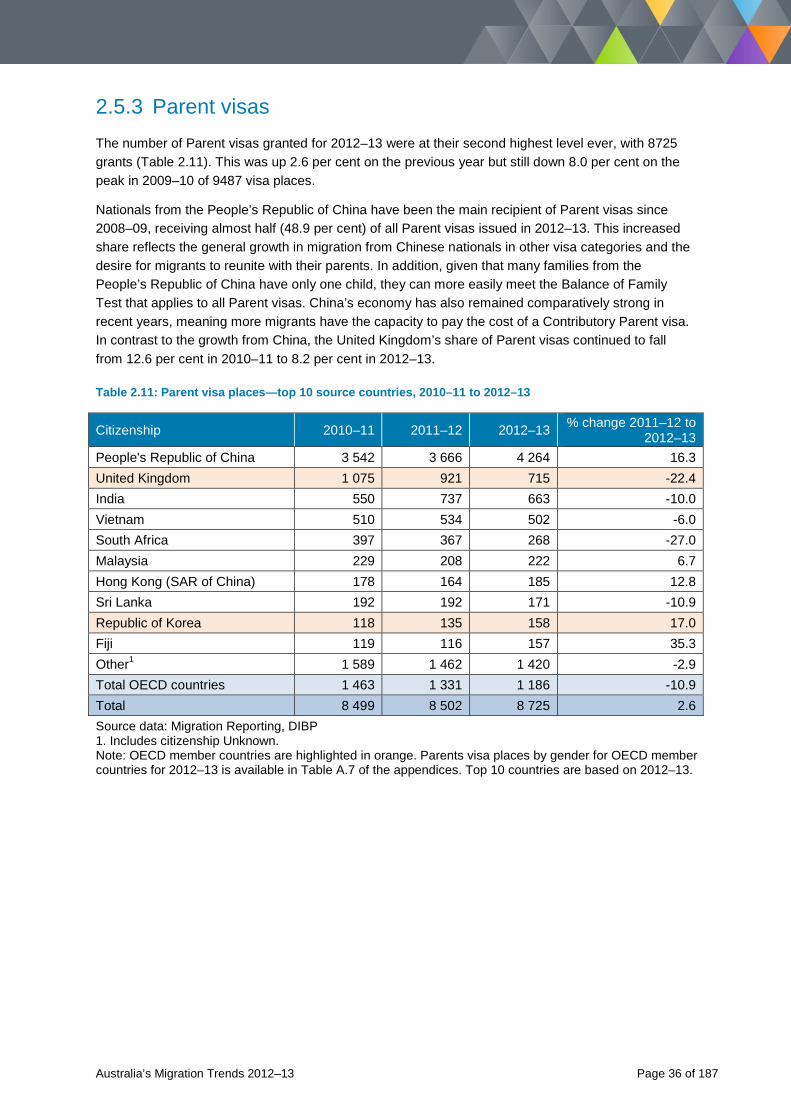
2.5.3 Parent visas The number of Parent visas granted for 2012–13 were at their second highest level ever, with 8725 grants (Table 2.11). This was up 2.6 per cent on the previous year but still down 8.0 per cent on the peak in 2009–10 of 9487 visa places.
Nationals from the People’s Republic of China have been the main recipient of Parent visas since 2008–09, receiving almost half (48.9 per cent) of all Parent visas issued in 2012–13. This increased share reflects the general growth in migration from Chinese nationals in other visa categories and the desire for migrants to reunite with their parents. In addition, given that many families from the People’s Republic of China have only one child, they can more easily meet the Balance of Family Test that applies to all Parent visas. China’s economy has also remained comparatively strong in recent years, meaning more migrants have the capacity to pay the cost of a Contributory Parent visa. In contrast to the growth from China, the United Kingdom’s share of Parent visas continued to fall from 12.6 per cent in 2010–11 to 8.2 per cent in 2012–13.
Table 2.11: Parent visa places—top 10 source countries, 2010–11 to 2012–13
Citizenship 2010–11 2011–12 2012–13 % change 2011–12 to 2012–13
People's Republic of China 3 542 3 666 4 264 16.3 United Kingdom 1 075 921 715 -22.4 India 550 737 663 -10.0 Vietnam 510 534 502 -6.0 South Africa 397 367 268 -27.0 Malaysia 229 208 222 6.7 Hong Kong (SAR of China) 178 164 185 12.8 Sri Lanka 192 192 171 -10.9 Republic of Korea 118 135 158 17.0 Fiji 119 116 157 35.3 Other1 1 589 1 462 1 420 -2.9 Total OECD countries 1 463 1 331 1 186 -10.9 Total 8 499 8 502 8 725 2.6 Source data: Migration Reporting, DIBP 1. Includes citizenship Unknown. Note: OECD member countries are highlighted in orange. Parents visa places by gender for OECD member countries for 2012–13 is available in Table A.7 of the appendices. Top 10 countries are based on 2012–13.
Australia’s Migration Trends 2012–13 Page 36 of 187
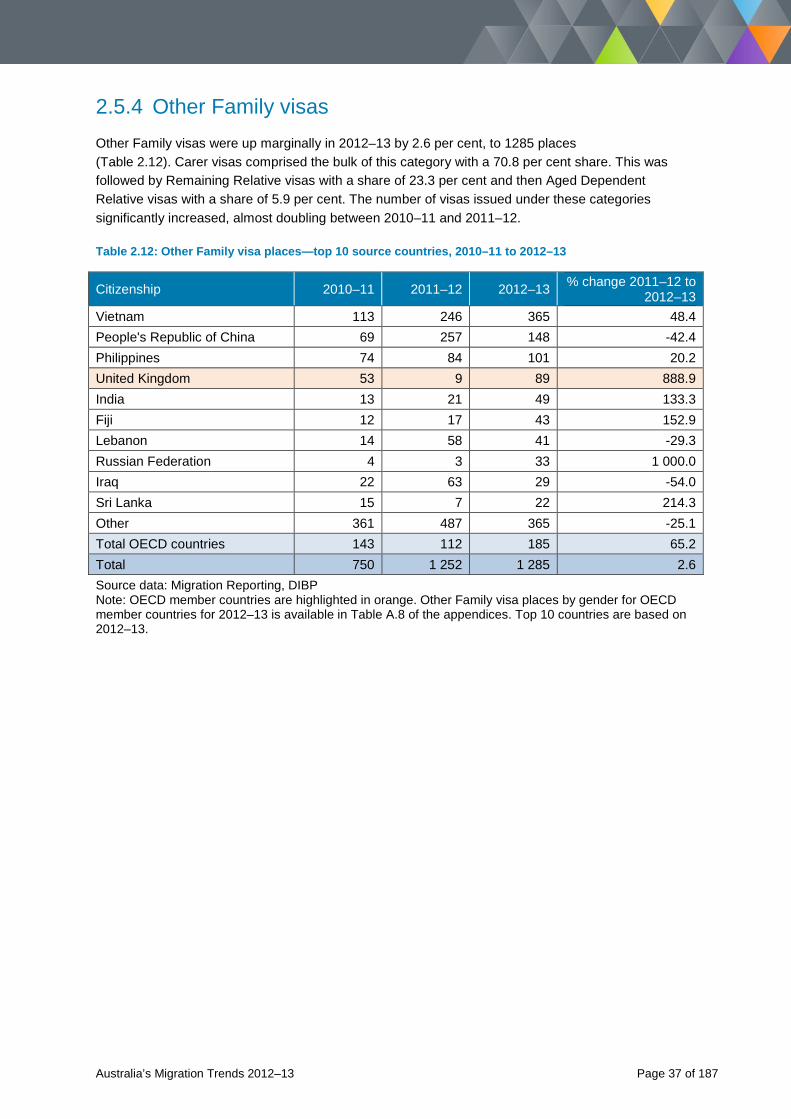
2.5.4 Other Family visas Other Family visas were up marginally in 2012–13 by 2.6 per cent, to 1285 places (Table 2.12). Carer visas comprised the bulk of this category with a 70.8 per cent share. This was followed by Remaining Relative visas with a share of 23.3 per cent and then Aged Dependent Relative visas with a share of 5.9 per cent. The number of visas issued under these categories significantly increased, almost doubling between 2010–11 and 2011–12.
Table 2.12: Other Family visa places—top 10 source countries, 2010–11 to 2012–13
Citizenship 2010–11 2011–12 2012–13 % change 2011–12 to 2012–13
Vietnam 113 246 365 48.4 People's Republic of China 69 257 148 -42.4 Philippines 74 84 101 20.2 United Kingdom 53 9 89 888.9 India 13 21 49 133.3 Fiji 12 17 43 152.9 Lebanon 14 58 41 -29.3 Russian Federation 4 3 33 1 000.0 Iraq 22 63 29 -54.0 Sri Lanka 15 7 22 214.3 Other 361 487 365 -25.1 Total OECD countries 143 112 185 65.2 Total 750 1 252 1 285 2.6 Source data: Migration Reporting, DIBP Note: OECD member countries are highlighted in orange. Other Family visa places by gender for OECD member countries for 2012–13 is available in Table A.8 of the appendices. Top 10 countries are based on 2012–13.
Australia’s Migration Trends 2012–13 Page 37 of 187
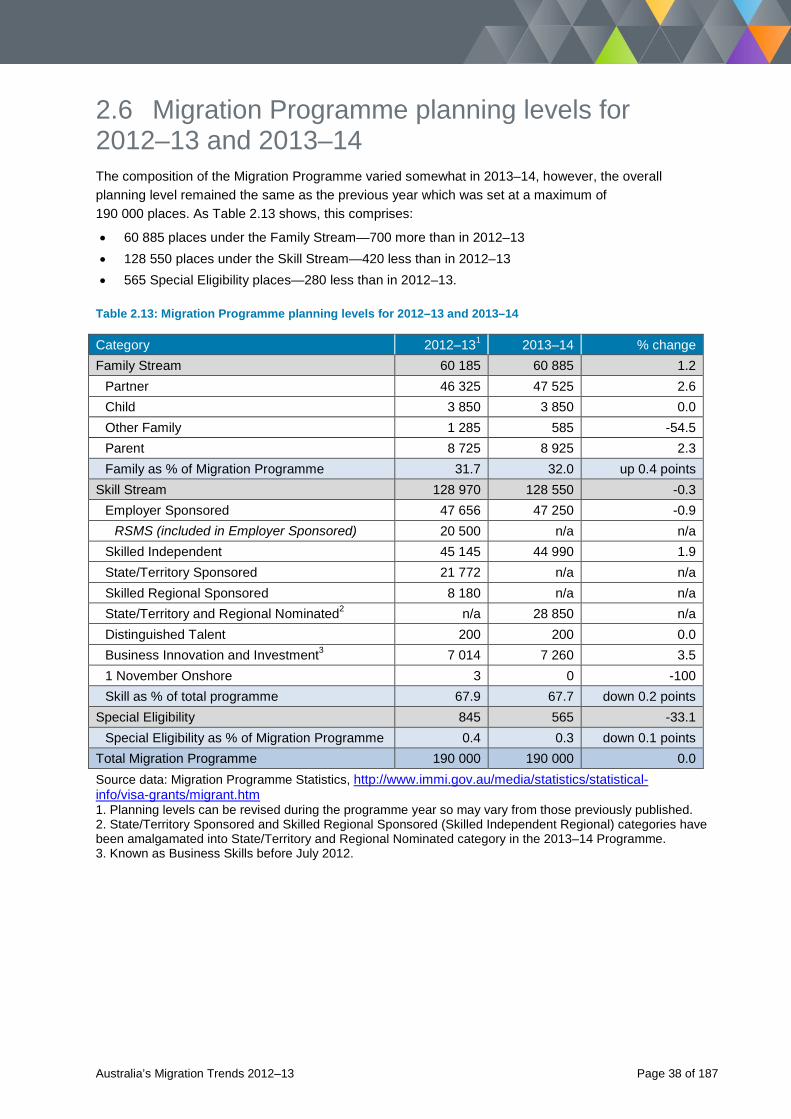
2.6 Migration Programme planning levels for 2012–13 and 2013–14 The composition of the Migration Programme varied somewhat in 2013–14, however, the overall planning level remained the same as the previous year which was set at a maximum of 190 000 places. As Table 2.13 shows, this comprises:
• 60 885 places under the Family Stream—700 more than in 2012–13 • 128 550 places under the Skill Stream—420 less than in 2012–13 • 565 Special Eligibility places—280 less than in 2012–13.
Table 2.13: Migration Programme planning levels for 2012–13 and 2013–14
Category 2012–131 2013–14 % change Family Stream 60 185 60 885 1.2 Partner 46 325 47 525 2.6 Child 3 850 3 850 0.0 Other Family 1 285 585 -54.5 Parent 8 725 8 925 2.3 Family as % of Migration Programme 31.7 32.0 up 0.4 points Skill Stream 128 970 128 550 -0.3 Employer Sponsored 47 656 47 250 -0.9 RSMS (included in Employer Sponsored) 20 500 n/a n/a Skilled Independent 45 145 44 990 1.9 State/Territory Sponsored 21 772 n/a n/a Skilled Regional Sponsored 8 180 n/a n/a State/Territory and Regional Nominated2 n/a 28 850 n/a Distinguished Talent 200 200 0.0 Business Innovation and Investment3 7 014 7 260 3.5 1 November Onshore 3 0 -100 Skill as % of total programme 67.9 67.7 down 0.2 points Special Eligibility 845 565 -33.1 Special Eligibility as % of Migration Programme 0.4 0.3 down 0.1 points Total Migration Programme 190 000 190 000 0.0 Source data: Migration Programme Statistics, http://www.immi.gov.au/media/statistics/statistical-info/visa-grants/migrant.htm 1. Planning levels can be revised during the programme year so may vary from those previously published. 2. State/Territory Sponsored and Skilled Regional Sponsored (Skilled Independent Regional) categories have been amalgamated into State/Territory and Regional Nominated category in the 2013–14 Programme. 3. Known as Business Skills before July 2012.
Australia’s Migration Trends 2012–13 Page 38 of 187
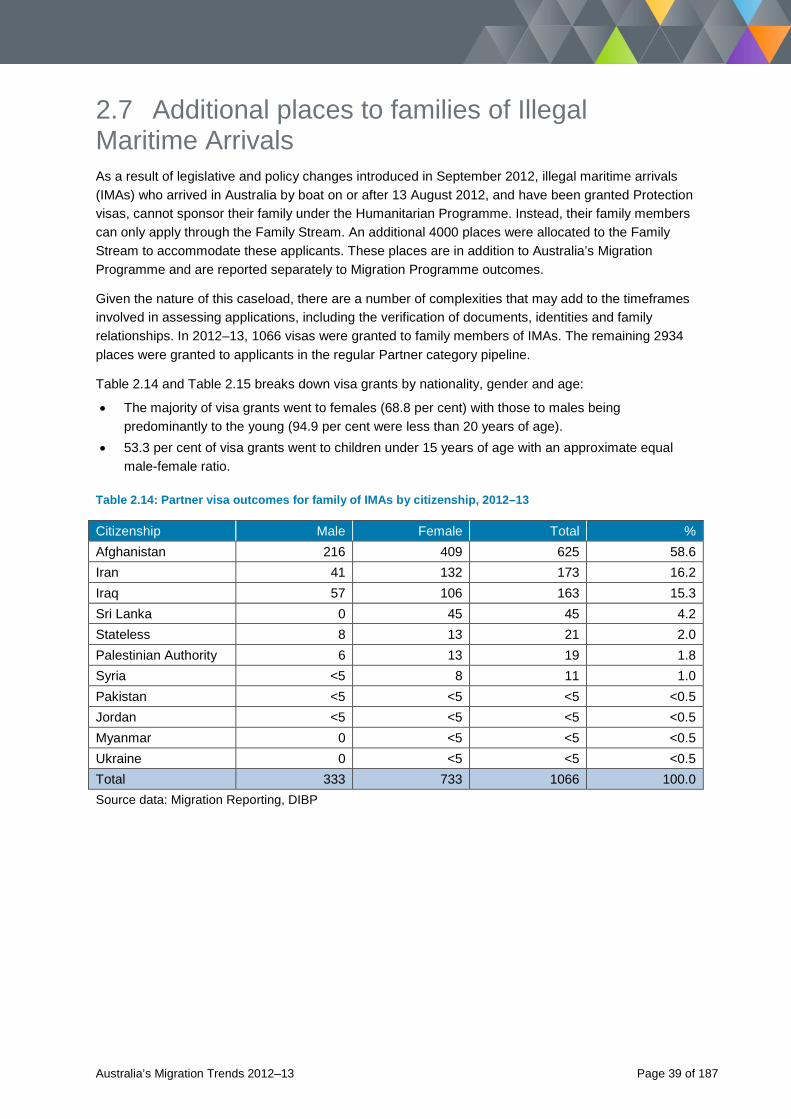
2.7 Additional places to families of Illegal Maritime Arrivals As a result of legislative and policy changes introduced in September 2012, illegal maritime arrivals (IMAs) who arrived in Australia by boat on or after 13 August 2012, and have been granted Protection visas, cannot sponsor their family under the Humanitarian Programme. Instead, their family members can only apply through the Family Stream. An additional 4000 places were allocated to the Family Stream to accommodate these applicants. These places are in addition to Australia’s Migration Programme and are reported separately to Migration Programme outcomes.
Given the nature of this caseload, there are a number of complexities that may add to the timeframes involved in assessing applications, including the verification of documents, identities and family relationships. In 2012–13, 1066 visas were granted to family members of IMAs. The remaining 2934 places were granted to applicants in the regular Partner category pipeline.
Table 2.14 and Table 2.15 breaks down visa grants by nationality, gender and age:
• The majority of visa grants went to females (68.8 per cent) with those to males being predominantly to the young (94.9 per cent were less than 20 years of age).
• 53.3 per cent of visa grants went to children under 15 years of age with an approximate equal male-female ratio.
Table 2.14: Partner visa outcomes for family of IMAs by citizenship, 2012–13
Citizenship Male Female Total % Afghanistan 216 409 625 58.6 Iran 41 132 173 16.2 Iraq 57 106 163 15.3 Sri Lanka 0 45 45 4.2 Stateless 8 13 21 2.0 Palestinian Authority 6 13 19 1.8 Syria <5 8 11 1.0 Pakistan <5 <5 <5 <0.5 Jordan <5 <5 <5 <0.5 Myanmar 0 <5 <5 <0.5 Ukraine 0 <5 <5 <0.5 Total 333 733 1066 100.0 Source data: Migration Reporting, DIBP
Australia’s Migration Trends 2012–13 Page 39 of 187
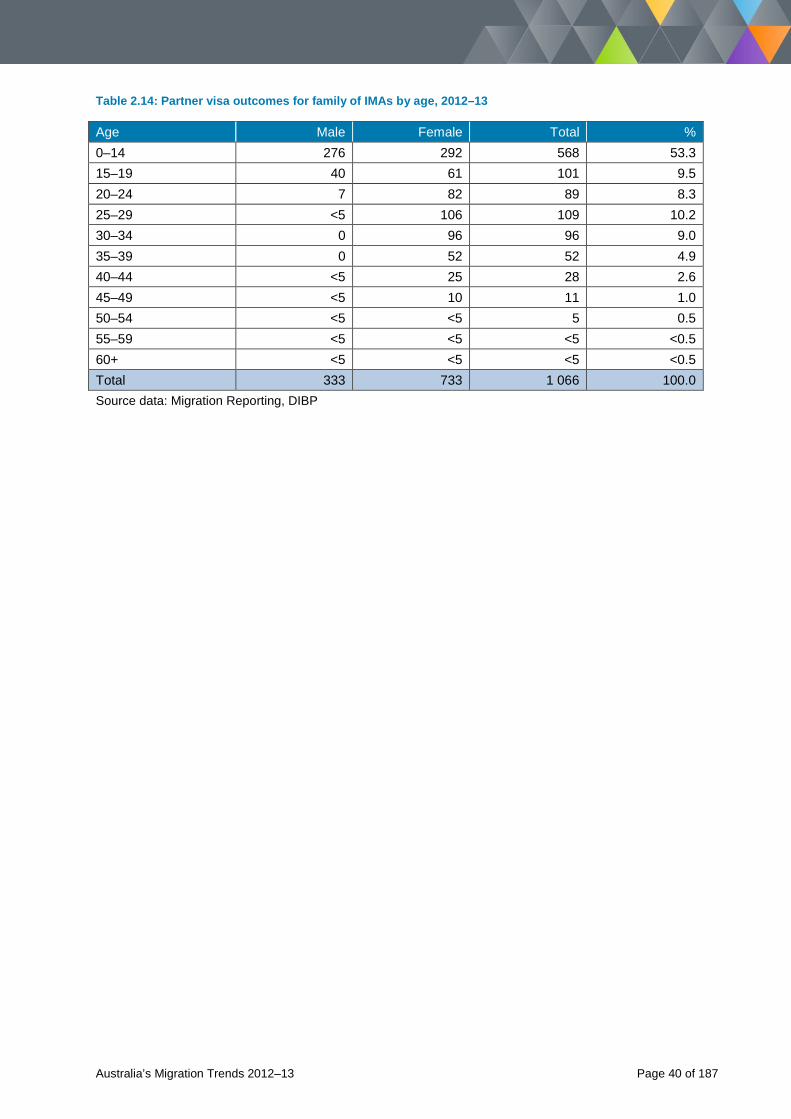
Table 2.14: Partner visa outcomes for family of IMAs by age, 2012–13
Age Male Female Total % 0–14 276 292 568 53.3 15–19 40 61 101 9.5 20–24 7 82 89 8.3 25–29 <5 106 109 10.2 30–34 0 96 96 9.0 35–39 0 52 52 4.9 40–44 <5 25 28 2.6 45–49 <5 10 11 1.0 50–54 <5 <5 5 0.5 55–59 <5 <5 <5 <0.5 60+ <5 <5 <5 <0.5 Total 333 733 1 066 100.0 Source data: Migration Reporting, DIBP
Australia’s Migration Trends 2012–13 Page 40 of 187
Chapter 3: Temporary entry
Australia’s Migration Trends 2012–13 Page 41 of 187
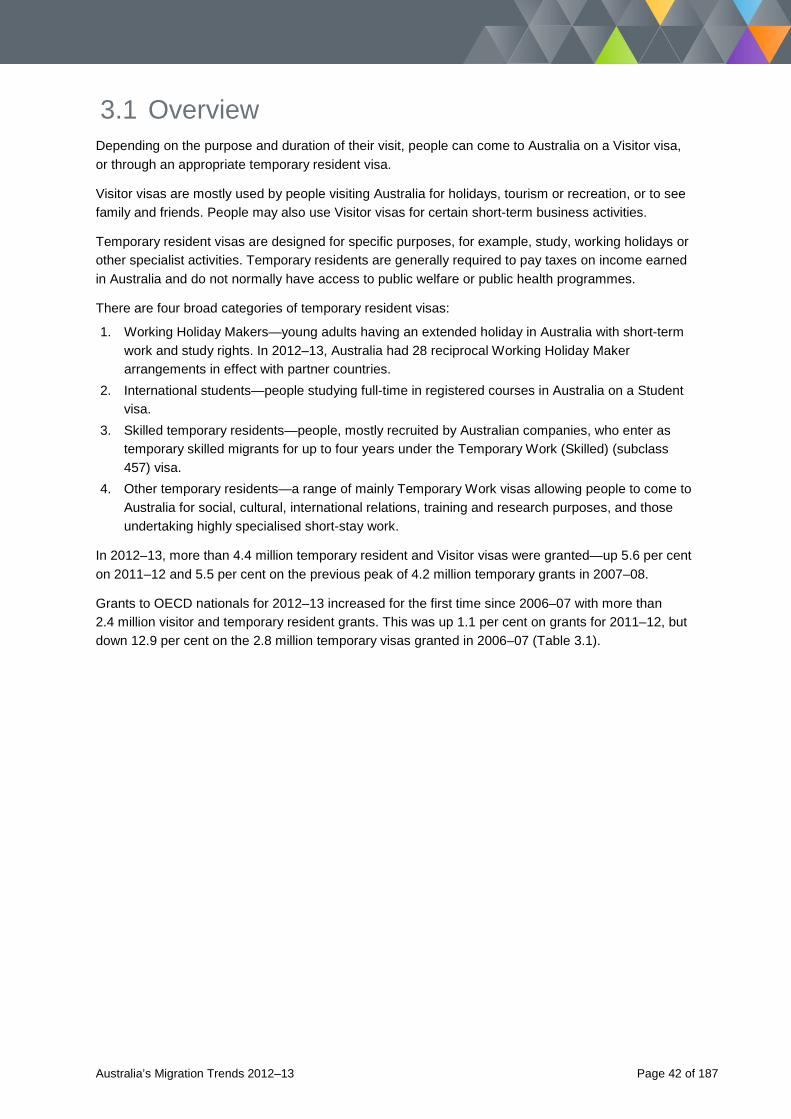
3.1 Overview Depending on the purpose and duration of their visit, people can come to Australia on a Visitor visa, or through an appropriate temporary resident visa.
Visitor visas are mostly used by people visiting Australia for holidays, tourism or recreation, or to see family and friends. People may also use Visitor visas for certain short-term business activities.
Temporary resident visas are designed for specific purposes, for example, study, working holidays or other specialist activities. Temporary residents are generally required to pay taxes on income earned in Australia and do not normally have access to public welfare or public health programmes.
There are four broad categories of temporary resident visas:
1. Working Holiday Makers—young adults having an extended holiday in Australia with short-term work and study rights. In 2012–13, Australia had 28 reciprocal Working Holiday Maker arrangements in effect with partner countries.
2. International students—people studying full-time in registered courses in Australia on a Student visa.
3. Skilled temporary residents—people, mostly recruited by Australian companies, who enter as temporary skilled migrants for up to four years under the Temporary Work (Skilled) (subclass 457) visa.
4. Other temporary residents—a range of mainly Temporary Work visas allowing people to come to Australia for social, cultural, international relations, training and research purposes, and those undertaking highly specialised short-stay work.
In 2012–13, more than 4.4 million temporary resident and Visitor visas were granted—up 5.6 per cent on 2011–12 and 5.5 per cent on the previous peak of 4.2 million temporary grants in 2007–08.
Grants to OECD nationals for 2012–13 increased for the first time since 2006–07 with more than 2.4 million visitor and temporary resident grants. This was up 1.1 per cent on grants for 2011–12, but down 12.9 per cent on the 2.8 million temporary visas granted in 2006–07 (Table 3.1).
Australia’s Migration Trends 2012–13 Page 42 of 187
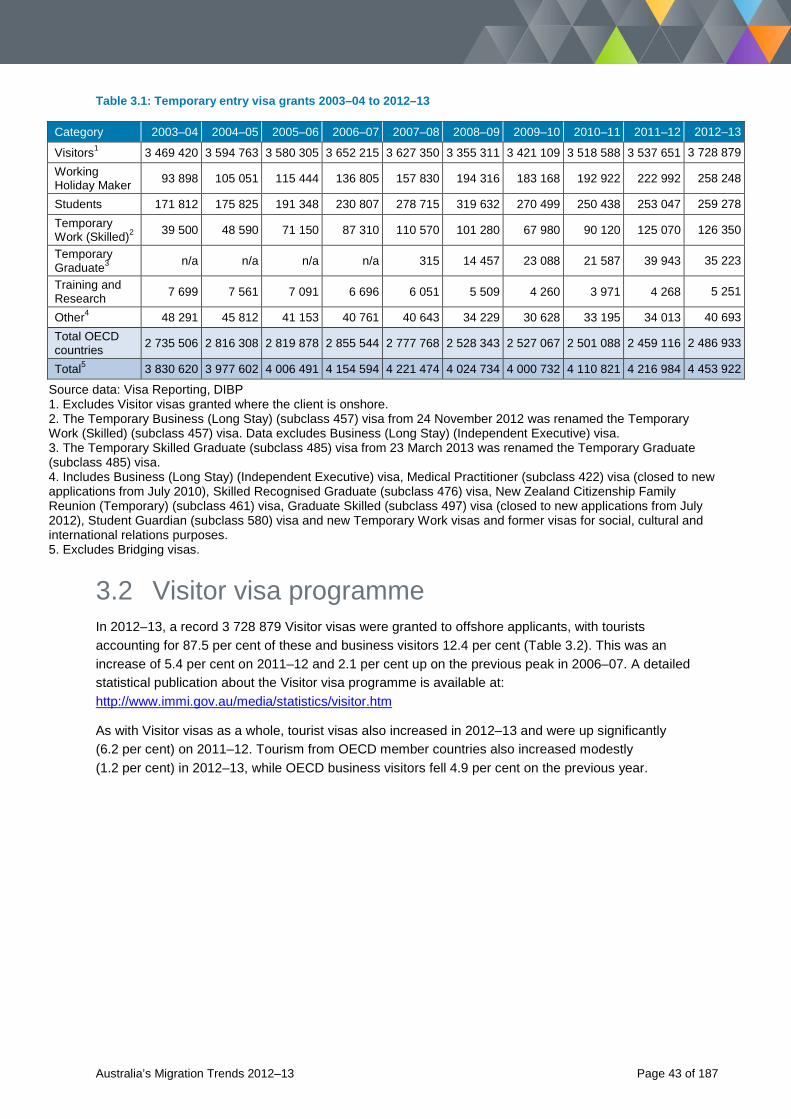
Table 3.1: Temporary entry visa grants 2003–04 to 2012–13
Category 2003–04 2004–05 2005–06 2006–07 2007–08 2008–09 2009–10 2010–11 2011–12 2012–13
Visitors1 3 469 420 3 594 763 3 580 305 3 652 215 3 627 350 3 355 311 3 421 109 3 518 588 3 537 651 3 728 879 Working Holiday Maker 93 898 105 051 115 444 136 805 157 830 194 316 183 168 192 922 222 992 258 248
Students 171 812 175 825 191 348 230 807 278 715 319 632 270 499 250 438 253 047 259 278 Temporary Work (Skilled)2 39 500 48 590 71 150 87 310 110 570 101 280 67 980 90 120 125 070 126 350
Temporary Graduate3 n/a n/a n/a n/a 315 14 457 23 088 21 587 39 943 35 223
Training and Research 7 699 7 561 7 091 6 696 6 051 5 509 4 260 3 971 4 268 5 251
Other4 48 291 45 812 41 153 40 761 40 643 34 229 30 628 33 195 34 013 40 693 Total OECD countries 2 735 506 2 816 308 2 819 878 2 855 544 2 777 768 2 528 343 2 527 067 2 501 088 2 459 116 2 486 933
Total5 3 830 620 3 977 602 4 006 491 4 154 594 4 221 474 4 024 734 4 000 732 4 110 821 4 216 984 4 453 922
Source data: Visa Reporting, DIBP 1. Excludes Visitor visas granted where the client is onshore. 2. The Temporary Business (Long Stay) (subclass 457) visa from 24 November 2012 was renamed the Temporary Work (Skilled) (subclass 457) visa. Data excludes Business (Long Stay) (Independent Executive) visa. 3. The Temporary Skilled Graduate (subclass 485) visa from 23 March 2013 was renamed the Temporary Graduate (subclass 485) visa. 4. Includes Business (Long Stay) (Independent Executive) visa, Medical Practitioner (subclass 422) visa (closed to new applications from July 2010), Skilled Recognised Graduate (subclass 476) visa, New Zealand Citizenship Family Reunion (Temporary) (subclass 461) visa, Graduate Skilled (subclass 497) visa (closed to new applications from July 2012), Student Guardian (subclass 580) visa and new Temporary Work visas and former visas for social, cultural and international relations purposes. 5. Excludes Bridging visas.
3.2 Visitor visa programme In 2012–13, a record 3 728 879 Visitor visas were granted to offshore applicants, with tourists accounting for 87.5 per cent of these and business visitors 12.4 per cent (Table 3.2). This was an increase of 5.4 per cent on 2011–12 and 2.1 per cent up on the previous peak in 2006–07. A detailed statistical publication about the Visitor visa programme is available at: http://www.immi.gov.au/media/statistics/visitor.htm
As with Visitor visas as a whole, tourist visas also increased in 2012–13 and were up significantly (6.2 per cent) on 2011–12. Tourism from OECD member countries also increased modestly (1.2 per cent) in 2012–13, while OECD business visitors fell 4.9 per cent on the previous year.
Australia’s Migration Trends 2012–13 Page 43 of 187
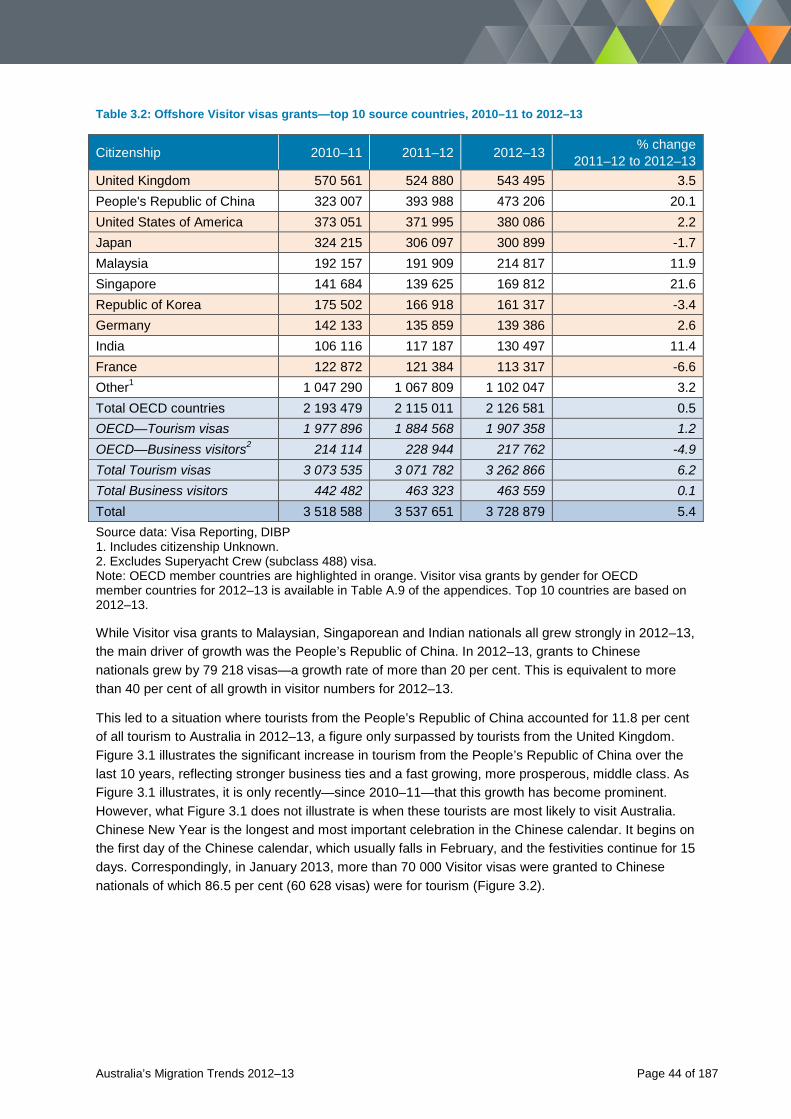
Table 3.2: Offshore Visitor visas grants—top 10 source countries, 2010–11 to 2012–13
Citizenship 2010–11 2011–12 2012–13 % change 2011–12 to 2012–13
United Kingdom 570 561 524 880 543 495 3.5 People's Republic of China 323 007 393 988 473 206 20.1 United States of America 373 051 371 995 380 086 2.2 Japan 324 215 306 097 300 899 -1.7 Malaysia 192 157 191 909 214 817 11.9 Singapore 141 684 139 625 169 812 21.6 Republic of Korea 175 502 166 918 161 317 -3.4 Germany 142 133 135 859 139 386 2.6 India 106 116 117 187 130 497 11.4 France 122 872 121 384 113 317 -6.6 Other1 1 047 290 1 067 809 1 102 047 3.2 Total OECD countries 2 193 479 2 115 011 2 126 581 0.5 OECD—Tourism visas 1 977 896 1 884 568 1 907 358 1.2 OECD—Business visitors2 214 114 228 944 217 762 -4.9 Total Tourism visas 3 073 535 3 071 782 3 262 866 6.2 Total Business visitors 442 482 463 323 463 559 0.1 Total 3 518 588 3 537 651 3 728 879 5.4 Source data: Visa Reporting, DIBP 1. Includes citizenship Unknown. 2. Excludes Superyacht Crew (subclass 488) visa. Note: OECD member countries are highlighted in orange. Visitor visa grants by gender for OECD member countries for 2012–13 is available in Table A.9 of the appendices. Top 10 countries are based on 2012–13.
While Visitor visa grants to Malaysian, Singaporean and Indian nationals all grew strongly in 2012–13, the main driver of growth was the People’s Republic of China. In 2012–13, grants to Chinese nationals grew by 79 218 visas—a growth rate of more than 20 per cent. This is equivalent to more than 40 per cent of all growth in visitor numbers for 2012–13.
This led to a situation where tourists from the People’s Republic of China accounted for 11.8 per cent of all tourism to Australia in 2012–13, a figure only surpassed by tourists from the United Kingdom. Figure 3.1 illustrates the significant increase in tourism from the People’s Republic of China over the last 10 years, reflecting stronger business ties and a fast growing, more prosperous, middle class. As Figure 3.1 illustrates, it is only recently—since 2010–11—that this growth has become prominent. However, what Figure 3.1 does not illustrate is when these tourists are most likely to visit Australia. Chinese New Year is the longest and most important celebration in the Chinese calendar. It begins on the first day of the Chinese calendar, which usually falls in February, and the festivities continue for 15 days. Correspondingly, in January 2013, more than 70 000 Visitor visas were granted to Chinese nationals of which 86.5 per cent (60 628 visas) were for tourism (Figure 3.2).
Australia’s Migration Trends 2012–13 Page 44 of 187
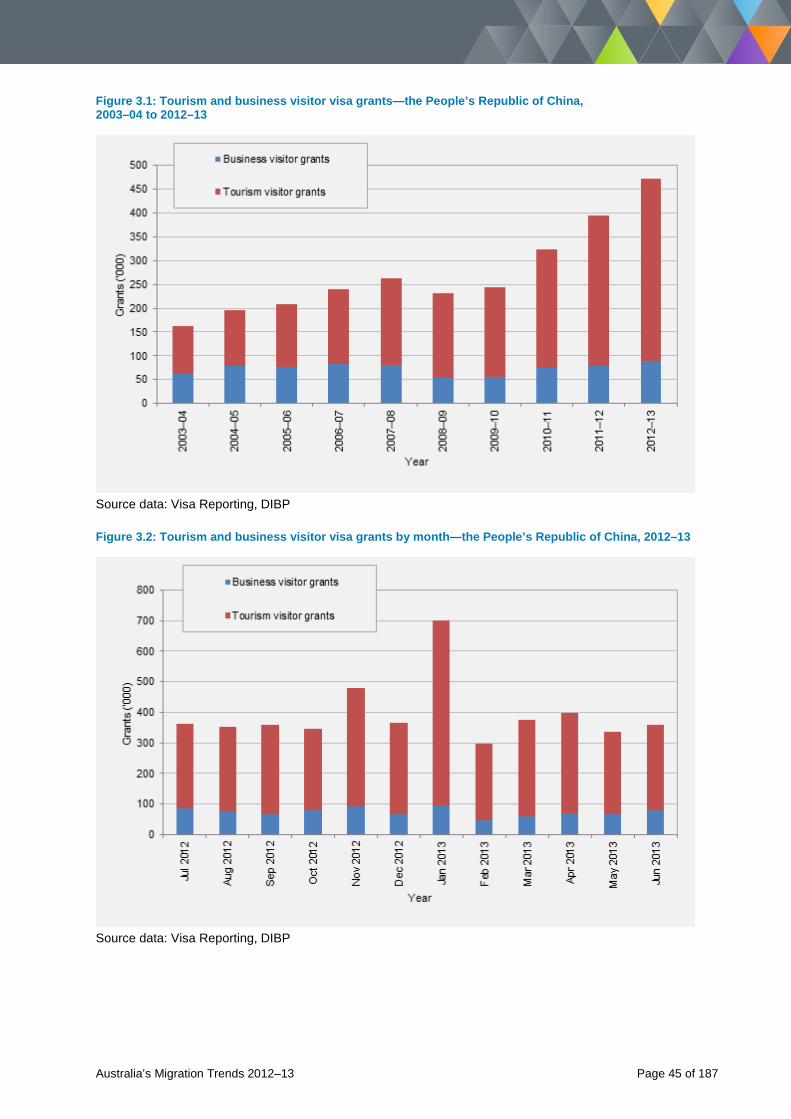
Figure 3.1: Tourism and business visitor visa grants—the People’s Republic of China, 2003–04 to 2012–13
Source data: Visa Reporting, DIBP
Figure 3.2: Tourism and business visitor visa grants by month—the People’s Republic of China, 2012–13
Source data: Visa Reporting, DIBP
Australia’s Migration Trends 2012–13 Page 45 of 187
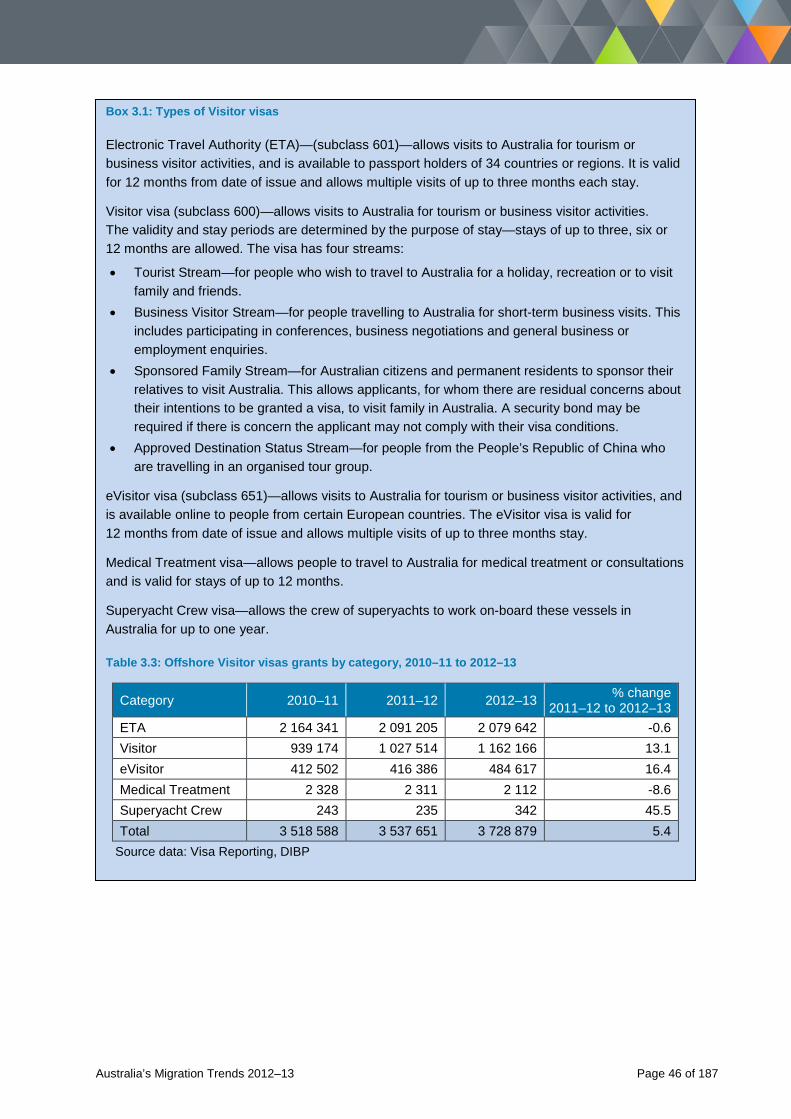
Box 3.1: Types of Visitor visas
Electronic Travel Authority (ETA)—(subclass 601)—allows visits to Australia for tourism or business visitor activities, and is available to passport holders of 34 countries or regions. It is valid for 12 months from date of issue and allows multiple visits of up to three months each stay.
Visitor visa (subclass 600)—allows visits to Australia for tourism or business visitor activities. The validity and stay periods are determined by the purpose of stay—stays of up to three, six or 12 months are allowed. The visa has four streams:
• Tourist Stream—for people who wish to travel to Australia for a holiday, recreation or to visit family and friends.
• Business Visitor Stream—for people travelling to Australia for short-term business visits. This includes participating in conferences, business negotiations and general business or employment enquiries.
• Sponsored Family Stream—for Australian citizens and permanent residents to sponsor their relatives to visit Australia. This allows applicants, for whom there are residual concerns about their intentions to be granted a visa, to visit family in Australia. A security bond may be required if there is concern the applicant may not comply with their visa conditions.
• Approved Destination Status Stream—for people from the People’s Republic of China who are travelling in an organised tour group.
eVisitor visa (subclass 651)—allows visits to Australia for tourism or business visitor activities, and is available online to people from certain European countries. The eVisitor visa is valid for 12 months from date of issue and allows multiple visits of up to three months stay.
Medical Treatment visa—allows people to travel to Australia for medical treatment or consultations and is valid for stays of up to 12 months.
Superyacht Crew visa—allows the crew of superyachts to work on-board these vessels in Australia for up to one year.
Table 3.3: Offshore Visitor visas grants by category, 2010–11 to 2012–13
Category 2010–11 2011–12 2012–13 % change 2011–12 to 2012–13
ETA 2 164 341 2 091 205 2 079 642 -0.6 Visitor 939 174 1 027 514 1 162 166 13.1 eVisitor 412 502 416 386 484 617 16.4 Medical Treatment 2 328 2 311 2 112 -8.6 Superyacht Crew 243 235 342 45.5 Total 3 518 588 3 537 651 3 728 879 5.4
Source data: Visa Reporting, DIBP
Australia’s Migration Trends 2012–13 Page 46 of 187
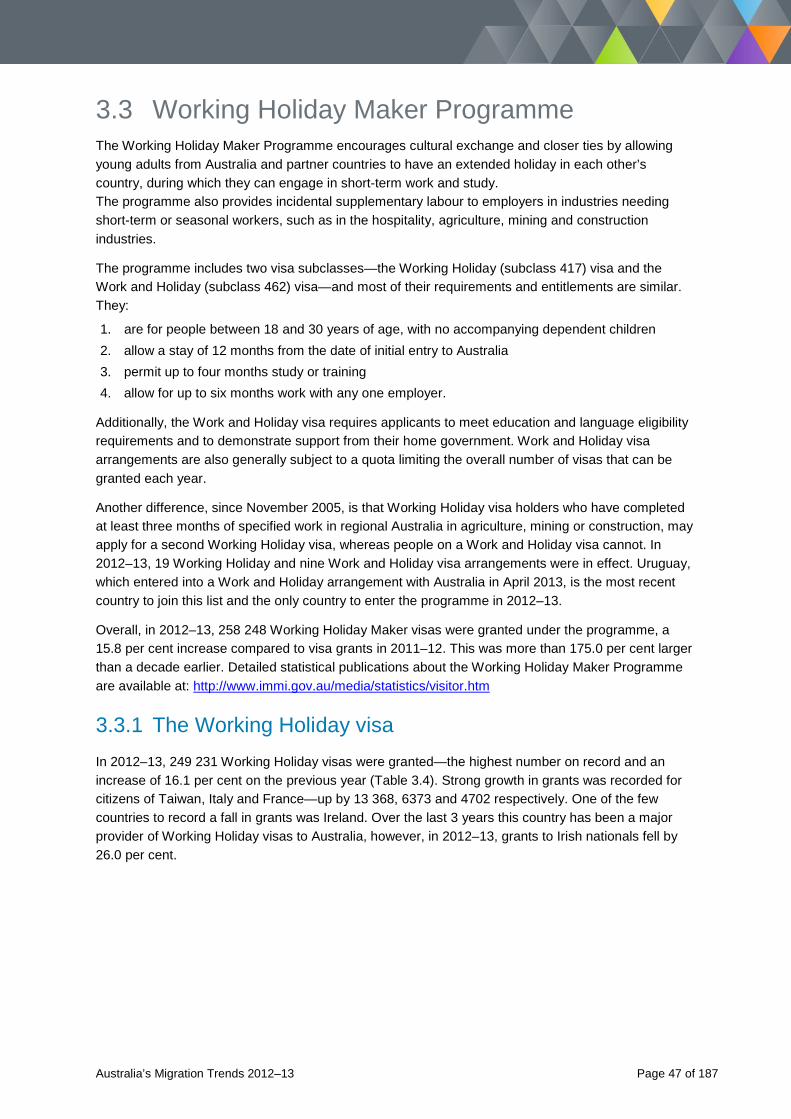
3.3 Working Holiday Maker Programme The Working Holiday Maker Programme encourages cultural exchange and closer ties by allowing young adults from Australia and partner countries to have an extended holiday in each other’s country, during which they can engage in short-term work and study. The programme also provides incidental supplementary labour to employers in industries needing short-term or seasonal workers, such as in the hospitality, agriculture, mining and construction industries.
The programme includes two visa subclasses—the Working Holiday (subclass 417) visa and the Work and Holiday (subclass 462) visa—and most of their requirements and entitlements are similar. They:
1. are for people between 18 and 30 years of age, with no accompanying dependent children 2. allow a stay of 12 months from the date of initial entry to Australia 3. permit up to four months study or training 4. allow for up to six months work with any one employer.
Additionally, the Work and Holiday visa requires applicants to meet education and language eligibility requirements and to demonstrate support from their home government. Work and Holiday visa arrangements are also generally subject to a quota limiting the overall number of visas that can be granted each year.
Another difference, since November 2005, is that Working Holiday visa holders who have completed at least three months of specified work in regional Australia in agriculture, mining or construction, may apply for a second Working Holiday visa, whereas people on a Work and Holiday visa cannot. In 2012–13, 19 Working Holiday and nine Work and Holiday visa arrangements were in effect. Uruguay, which entered into a Work and Holiday arrangement with Australia in April 2013, is the most recent country to join this list and the only country to enter the programme in 2012–13.
Overall, in 2012–13, 258 248 Working Holiday Maker visas were granted under the programme, a 15.8 per cent increase compared to visa grants in 2011–12. This was more than 175.0 per cent larger than a decade earlier. Detailed statistical publications about the Working Holiday Maker Programme are available at: http://www.immi.gov.au/media/statistics/visitor.htm
3.3.1 The Working Holiday visa In 2012–13, 249 231 Working Holiday visas were granted—the highest number on record and an increase of 16.1 per cent on the previous year (Table 3.4). Strong growth in grants was recorded for citizens of Taiwan, Italy and France—up by 13 368, 6373 and 4702 respectively. One of the few countries to record a fall in grants was Ireland. Over the last 3 years this country has been a major provider of Working Holiday visas to Australia, however, in 2012–13, grants to Irish nationals fell by 26.0 per cent.
Australia’s Migration Trends 2012–13 Page 47 of 187
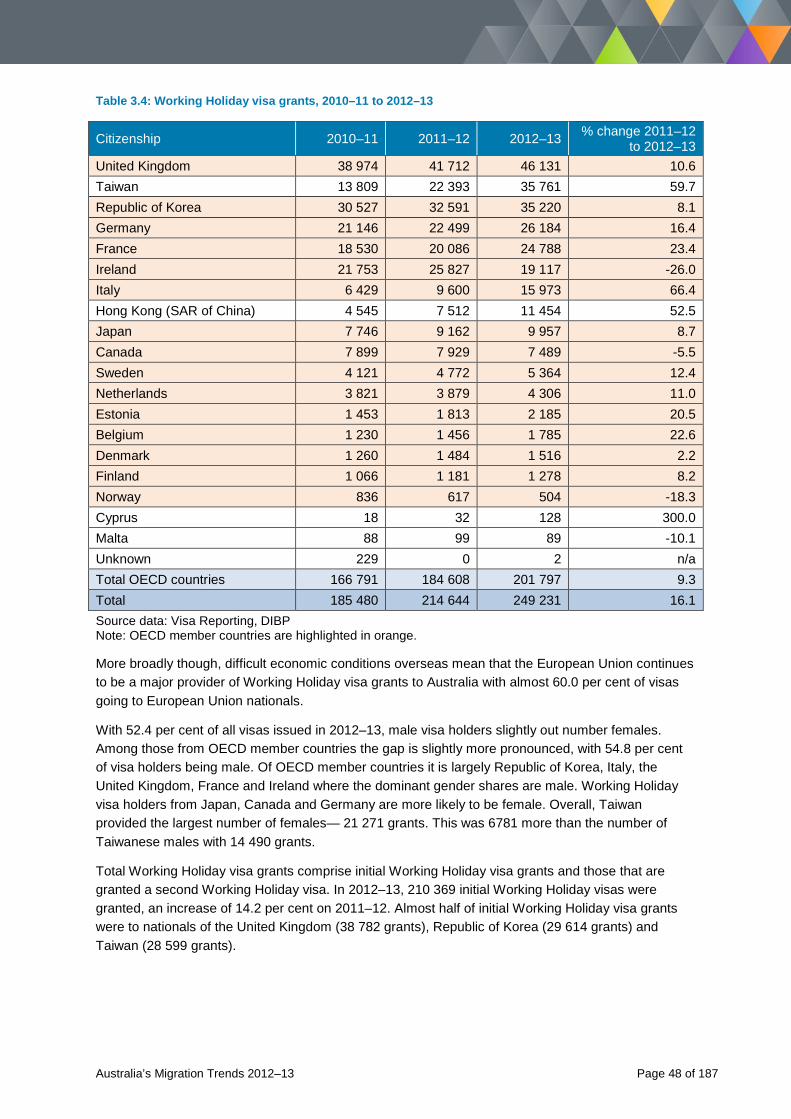
Table 3.4: Working Holiday visa grants, 2010–11 to 2012–13
Citizenship 2010–11 2011–12 2012–13 % change 2011–12 to 2012–13
United Kingdom 38 974 41 712 46 131 10.6 Taiwan 13 809 22 393 35 761 59.7 Republic of Korea 30 527 32 591 35 220 8.1 Germany 21 146 22 499 26 184 16.4 France 18 530 20 086 24 788 23.4 Ireland 21 753 25 827 19 117 -26.0 Italy 6 429 9 600 15 973 66.4 Hong Kong (SAR of China) 4 545 7 512 11 454 52.5 Japan 7 746 9 162 9 957 8.7 Canada 7 899 7 929 7 489 -5.5 Sweden 4 121 4 772 5 364 12.4 Netherlands 3 821 3 879 4 306 11.0 Estonia 1 453 1 813 2 185 20.5 Belgium 1 230 1 456 1 785 22.6 Denmark 1 260 1 484 1 516 2.2 Finland 1 066 1 181 1 278 8.2 Norway 836 617 504 -18.3 Cyprus 18 32 128 300.0 Malta 88 99 89 -10.1 Unknown 229 0 2 n/a Total OECD countries 166 791 184 608 201 797 9.3 Total 185 480 214 644 249 231 16.1 Source data: Visa Reporting, DIBP Note: OECD member countries are highlighted in orange.
More broadly though, difficult economic conditions overseas mean that the European Union continues to be a major provider of Working Holiday visa grants to Australia with almost 60.0 per cent of visas going to European Union nationals.
With 52.4 per cent of all visas issued in 2012–13, male visa holders slightly out number females. Among those from OECD member countries the gap is slightly more pronounced, with 54.8 per cent of visa holders being male. Of OECD member countries it is largely Republic of Korea, Italy, the United Kingdom, France and Ireland where the dominant gender shares are male. Working Holiday visa holders from Japan, Canada and Germany are more likely to be female. Overall, Taiwan provided the largest number of females— 21 271 grants. This was 6781 more than the number of Taiwanese males with 14 490 grants.
Total Working Holiday visa grants comprise initial Working Holiday visa grants and those that are granted a second Working Holiday visa. In 2012–13, 210 369 initial Working Holiday visas were granted, an increase of 14.2 per cent on 2011–12. Almost half of initial Working Holiday visa grants were to nationals of the United Kingdom (38 782 grants), Republic of Korea (29 614 grants) and Taiwan (28 599 grants).
Australia’s Migration Trends 2012–13 Page 48 of 187
Second Working Holiday visas grew strongly in 2012–13, up from 30 501 grants in 2011–12 to 38 862 grants, an increase of 27.4 per cent. The majority of these went to citizens from the United Kingdom (7349 grants), Ireland (7300 grants), Taiwan (7162 grants) and Republic of Korea (5606 grants).
Of all second Working Holiday visa grants in 2012–13 (where a sponsor industry was specified), 88.8 per cent went to people who qualified for this visa by working in the agriculture, forestry and fishing industry. Another 9.2 per cent went to those who worked in the construction industry and the remaining 2.0 per cent went to those who had qualified by previously working in the mining industry.
3.3.2 The Work and Holiday visa In 2012–13, 9017 Work and Holiday visas were granted. This was 8.0 per cent more than in 2011–12 (Table 3.5) and maintains a trend of continuous growth since the visa’s inception in 2003–04. As in previous years, the United States of America remained the dominant source of Work and Holiday visa holders, accounting for 76.3 per cent of those granted in 2012–13. The majority of visa holders are more likely to be female—a result that is largely due to nationals from the United States of America, where grants to females accounted for a 57.1 per cent share.
Table 3.5: Work and Holiday visa grants, 2010–11 to 2012–13
Citizenship 2010–11 2011–12 2012–13 % change 2011–12 to 2012–13 Programme cap
United States of America 6 219 6 831 6 878 0.7 No cap Chile 513 639 808 26.4 1 500 Thailand 499 346 464 34.1 500 Argentina n/a 261 417 59.8 500 Indonesia 98 99 176 77.8 1 000 Turkey 5 21 102 385.7 100 Malaysia 100 100 100 0.0 100 Bangladesh n/a 49 62 26.5 100 Uruguay n/a n/a 9 n/a 200 Iran1 8 2 0 -100.0 n/a Unknown 0 0 1 n/a n/a Total 7 442 8 348 9 017 8.0 n/a Source data: Visa Reporting, DIBP 1. Australia's Work and Holiday arrangement with Iran was discontinued on 30 June 2007. Grants shown include subsequent Work and Holiday visa extensions, which were allowed for under the specifics of the arrangement with Iran. Note: OECD member countries are highlighted in orange.
Australia’s Migration Trends 2012–13 Page 49 of 187
3.4 The Student visa programme The Student visa programme enables international students to come to Australia to study full-time. International students are important to Australia’s economic and cultural wellbeing. They make a significant contribution to the Australian economy, facilitate the development of trade and commercial links and promote goodwill and understanding of Australia.
Student visas may be granted offshore or onshore. Onshore grants are largely provided to international students already in Australia who, for example, may be changing their education provider or moving from one education sector to another. People who are in Australia on another temporary visa may also be eligible to apply for a Student visa.
Box 3.2: Types of Student visas
The range of visa categories in the Student visa programme corresponds to the courses applicants intend to undertake:
• English Language Intensive Course for Overseas Students (ELICOS) visa—for applicants intending to study stand-alone English language courses that lead to a certificate or non-formal Australian award.
• Schools visa—for applicants intending to study primary or secondary school courses and approved secondary school exchange programmes.
• Vocational Education and Training (VET) visa—for applicants intending to study certificate, VET diploma, VET advanced diploma, vocational graduate certificate or vocational graduate diploma courses.
• Higher Education visa—for applicants intending to study tertiary coursework studies (Bachelor degree, Associate Degree, Graduate Certificate, Graduate Diploma, Higher Education Diploma, Higher Education Advanced Diploma or Masters by coursework).
• Postgraduate Research visa—for applicants intending to study Masters by research or a doctoral degree.
• Non-award visa—for applicants intending to study non-award foundation studies, or other full-time courses or components of courses not leading to an Australian award.
• Australian Agency for International Development (AusAID) Defence Sector visa—for students sponsored by AusAID or Defence to undertake full-time courses of any type.
In addition, parents or relatives can apply for a visa to stay in Australia as the guardian of a student. This is known as the Student Guardian visa.
Australia’s Migration Trends 2012–13 Page 50 of 187
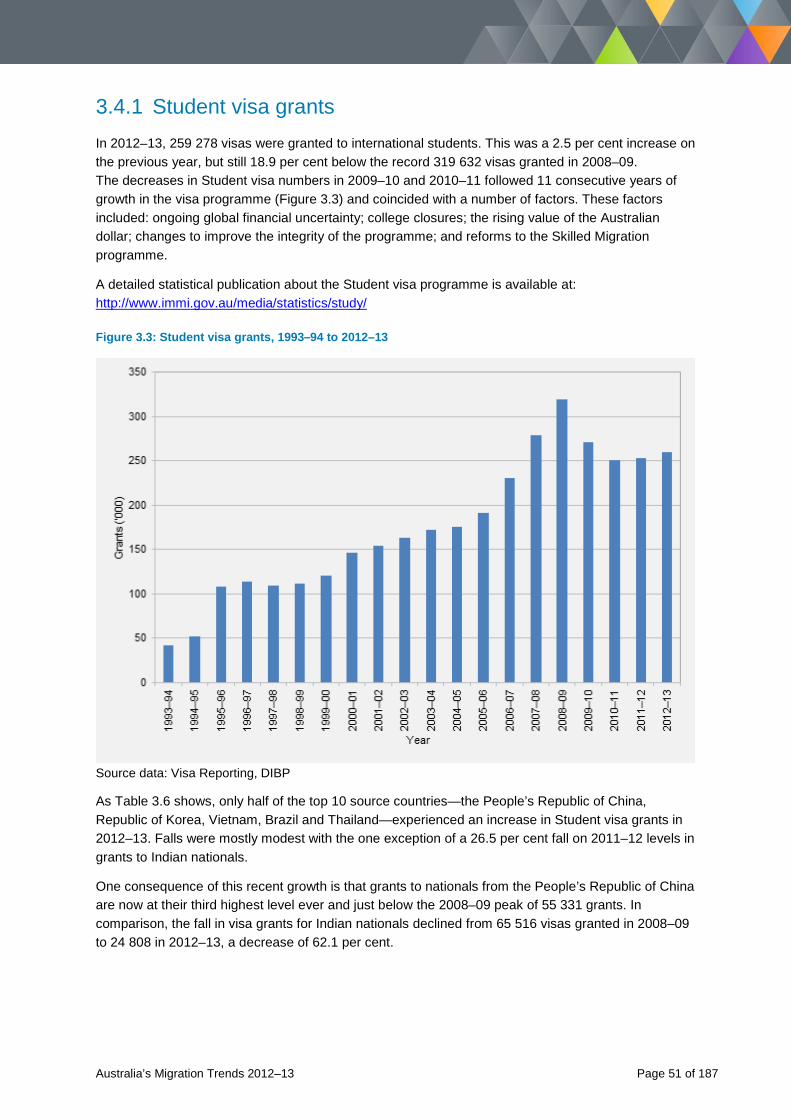
3.4.1 Student visa grants In 2012–13, 259 278 visas were granted to international students. This was a 2.5 per cent increase on the previous year, but still 18.9 per cent below the record 319 632 visas granted in 2008–09. The decreases in Student visa numbers in 2009–10 and 2010–11 followed 11 consecutive years of growth in the visa programme (Figure 3.3) and coincided with a number of factors. These factors included: ongoing global financial uncertainty; college closures; the rising value of the Australian dollar; changes to improve the integrity of the programme; and reforms to the Skilled Migration programme.
A detailed statistical publication about the Student visa programme is available at: http://www.immi.gov.au/media/statistics/study/
Figure 3.3: Student visa grants, 1993–94 to 2012–13
Source data: Visa Reporting, DIBP
As Table 3.6 shows, only half of the top 10 source countries—the People’s Republic of China, Republic of Korea, Vietnam, Brazil and Thailand—experienced an increase in Student visa grants in 2012–13. Falls were mostly modest with the one exception of a 26.5 per cent fall on 2011–12 levels in grants to Indian nationals.
One consequence of this recent growth is that grants to nationals from the People’s Republic of China are now at their third highest level ever and just below the 2008–09 peak of 55 331 grants. In comparison, the fall in visa grants for Indian nationals declined from 65 516 visas granted in 2008–09 to 24 808 in 2012–13, a decrease of 62.1 per cent.
Australia’s Migration Trends 2012–13 Page 51 of 187
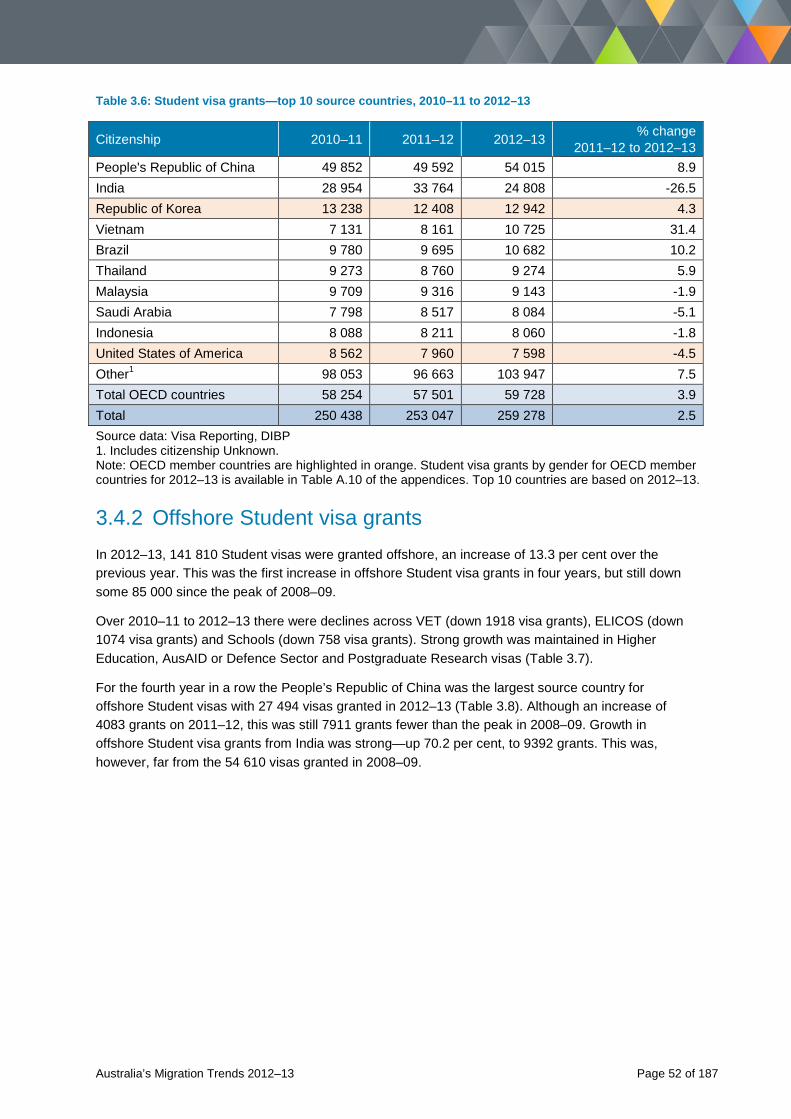
Table 3.6: Student visa grants—top 10 source countries, 2010–11 to 2012–13
Citizenship 2010–11 2011–12 2012–13 % change 2011–12 to 2012–13
People's Republic of China 49 852 49 592 54 015 8.9 India 28 954 33 764 24 808 -26.5 Republic of Korea 13 238 12 408 12 942 4.3 Vietnam 7 131 8 161 10 725 31.4 Brazil 9 780 9 695 10 682 10.2 Thailand 9 273 8 760 9 274 5.9 Malaysia 9 709 9 316 9 143 -1.9 Saudi Arabia 7 798 8 517 8 084 -5.1 Indonesia 8 088 8 211 8 060 -1.8 United States of America 8 562 7 960 7 598 -4.5 Other1 98 053 96 663 103 947 7.5 Total OECD countries 58 254 57 501 59 728 3.9 Total 250 438 253 047 259 278 2.5 Source data: Visa Reporting, DIBP 1. Includes citizenship Unknown. Note: OECD member countries are highlighted in orange. Student visa grants by gender for OECD member countries for 2012–13 is available in Table A.10 of the appendices. Top 10 countries are based on 2012–13.
3.4.2 Offshore Student visa grants In 2012–13, 141 810 Student visas were granted offshore, an increase of 13.3 per cent over the previous year. This was the first increase in offshore Student visa grants in four years, but still down some 85 000 since the peak of 2008–09.
Over 2010–11 to 2012–13 there were declines across VET (down 1918 visa grants), ELICOS (down 1074 visa grants) and Schools (down 758 visa grants). Strong growth was maintained in Higher Education, AusAID or Defence Sector and Postgraduate Research visas (Table 3.7).
For the fourth year in a row the People’s Republic of China was the largest source country for offshore Student visas with 27 494 visas granted in 2012–13 (Table 3.8). Although an increase of 4083 grants on 2011–12, this was still 7911 grants fewer than the peak in 2008–09. Growth in offshore Student visa grants from India was strong—up 70.2 per cent, to 9392 grants. This was, however, far from the 54 610 visas granted in 2008–09.
Australia’s Migration Trends 2012–13 Page 52 of 187
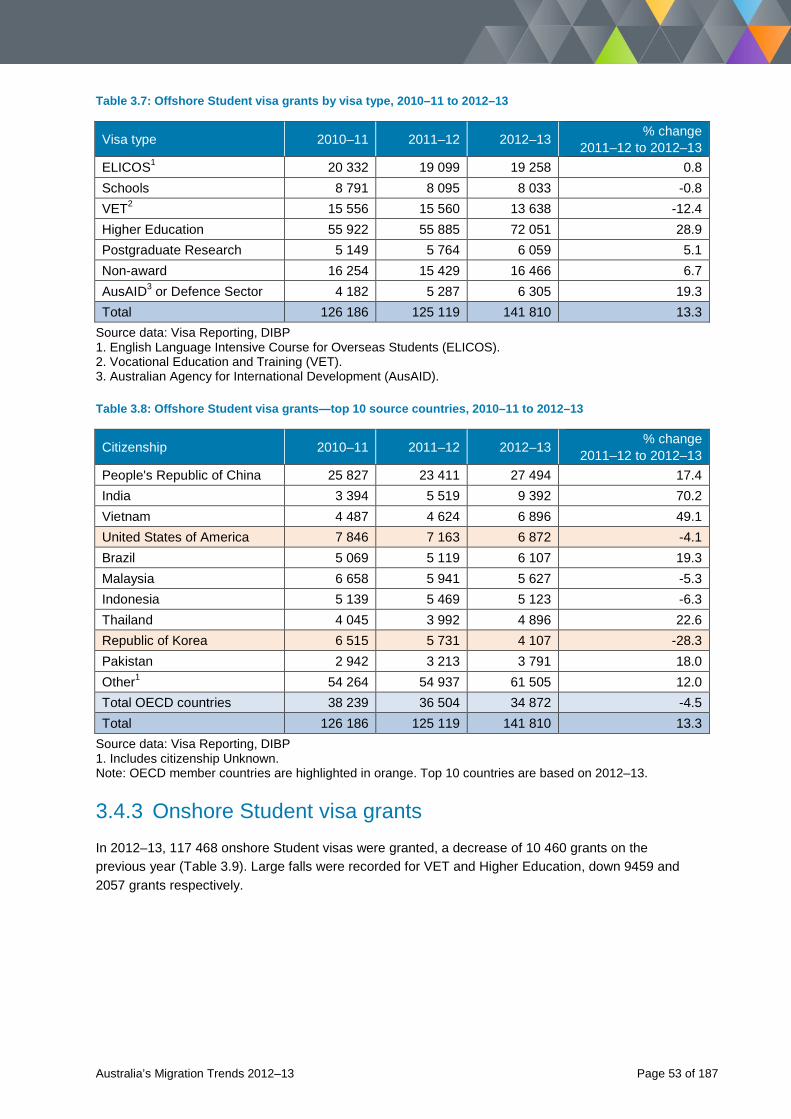
Table 3.7: Offshore Student visa grants by visa type, 2010–11 to 2012–13
Visa type 2010–11 2011–12 2012–13 % change 2011–12 to 2012–13
ELICOS1 20 332 19 099 19 258 0.8 Schools 8 791 8 095 8 033 -0.8 VET2 15 556 15 560 13 638 -12.4 Higher Education 55 922 55 885 72 051 28.9 Postgraduate Research 5 149 5 764 6 059 5.1 Non-award 16 254 15 429 16 466 6.7 AusAID3 or Defence Sector 4 182 5 287 6 305 19.3 Total 126 186 125 119 141 810 13.3
Source data: Visa Reporting, DIBP 1. English Language Intensive Course for Overseas Students (ELICOS). 2. Vocational Education and Training (VET). 3. Australian Agency for International Development (AusAID).
Table 3.8: Offshore Student visa grants—top 10 source countries, 2010–11 to 2012–13
Citizenship 2010–11 2011–12 2012–13 % change 2011–12 to 2012–13
People's Republic of China 25 827 23 411 27 494 17.4 India 3 394 5 519 9 392 70.2 Vietnam 4 487 4 624 6 896 49.1 United States of America 7 846 7 163 6 872 -4.1 Brazil 5 069 5 119 6 107 19.3 Malaysia 6 658 5 941 5 627 -5.3 Indonesia 5 139 5 469 5 123 -6.3 Thailand 4 045 3 992 4 896 22.6 Republic of Korea 6 515 5 731 4 107 -28.3 Pakistan 2 942 3 213 3 791 18.0 Other1 54 264 54 937 61 505 12.0 Total OECD countries 38 239 36 504 34 872 -4.5 Total 126 186 125 119 141 810 13.3
Source data: Visa Reporting, DIBP 1. Includes citizenship Unknown. Note: OECD member countries are highlighted in orange. Top 10 countries are based on 2012–13.
3.4.3 Onshore Student visa grants
In 2012–13, 117 468 onshore Student visas were granted, a decrease of 10 460 grants on the previous year (Table 3.9). Large falls were recorded for VET and Higher Education, down 9459 and 2057 grants respectively.
Australia’s Migration Trends 2012–13 Page 53 of 187
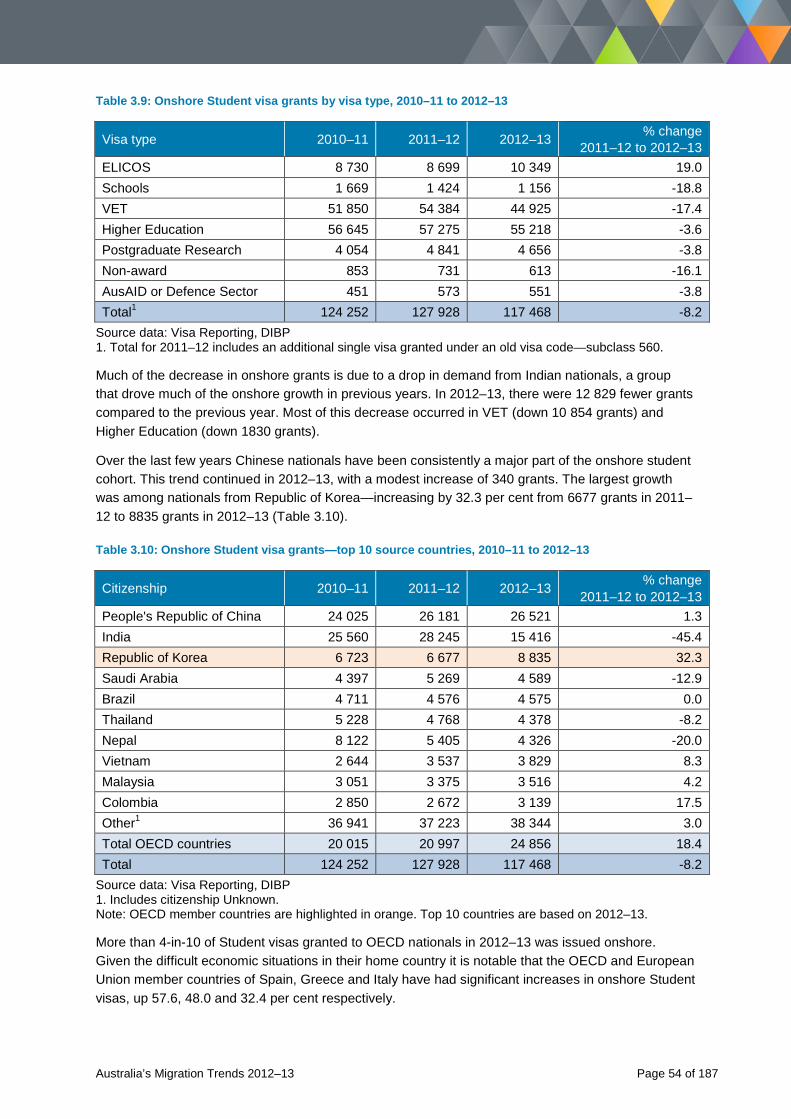
Table 3.9: Onshore Student visa grants by visa type, 2010–11 to 2012–13
Visa type 2010–11 2011–12 2012–13 % change 2011–12 to 2012–13
ELICOS 8 730 8 699 10 349 19.0 Schools 1 669 1 424 1 156 -18.8 VET 51 850 54 384 44 925 -17.4 Higher Education 56 645 57 275 55 218 -3.6 Postgraduate Research 4 054 4 841 4 656 -3.8 Non-award 853 731 613 -16.1 AusAID or Defence Sector 451 573 551 -3.8 Total1 124 252 127 928 117 468 -8.2
Source data: Visa Reporting, DIBP 1. Total for 2011–12 includes an additional single visa granted under an old visa code—subclass 560.
Much of the decrease in onshore grants is due to a drop in demand from Indian nationals, a group that drove much of the onshore growth in previous years. In 2012–13, there were 12 829 fewer grants compared to the previous year. Most of this decrease occurred in VET (down 10 854 grants) and Higher Education (down 1830 grants).
Over the last few years Chinese nationals have been consistently a major part of the onshore student cohort. This trend continued in 2012–13, with a modest increase of 340 grants. The largest growth was among nationals from Republic of Korea—increasing by 32.3 per cent from 6677 grants in 2011–12 to 8835 grants in 2012–13 (Table 3.10).
Table 3.10: Onshore Student visa grants—top 10 source countries, 2010–11 to 2012–13
Citizenship 2010–11 2011–12 2012–13 % change 2011–12 to 2012–13
People's Republic of China 24 025 26 181 26 521 1.3 India 25 560 28 245 15 416 -45.4 Republic of Korea 6 723 6 677 8 835 32.3 Saudi Arabia 4 397 5 269 4 589 -12.9 Brazil 4 711 4 576 4 575 0.0 Thailand 5 228 4 768 4 378 -8.2 Nepal 8 122 5 405 4 326 -20.0 Vietnam 2 644 3 537 3 829 8.3 Malaysia 3 051 3 375 3 516 4.2 Colombia 2 850 2 672 3 139 17.5 Other1 36 941 37 223 38 344 3.0 Total OECD countries 20 015 20 997 24 856 18.4 Total 124 252 127 928 117 468 -8.2
Source data: Visa Reporting, DIBP 1. Includes citizenship Unknown. Note: OECD member countries are highlighted in orange. Top 10 countries are based on 2012–13.
More than 4-in-10 of Student visas granted to OECD nationals in 2012–13 was issued onshore. Given the difficult economic situations in their home country it is notable that the OECD and European Union member countries of Spain, Greece and Italy have had significant increases in onshore Student visas, up 57.6, 48.0 and 32.4 per cent respectively.
Australia’s Migration Trends 2012–13 Page 54 of 187
3.4.4 Student visa holders transitioning to permanent residence
Student visas are only temporary visas and offer no guarantee of future permanent residence. However, many international students apply for permanent residence at course completion. A series of reforms over the past five years to the Skill Stream of the Migration Programme have impacted on the number of former students who obtained permanent residence and the types of visas issued. These include a redesigned points test, a more targeted Skilled Occupation List, increased recognition of higher English language skills and allocation of more Employer Sponsored places to the Migration Programme.
The main impact of the reforms has been on the granting of Skilled Independent visas. Before the reforms were introduced, the Skilled Independent visa was the most common visa granted to former international students—accounting for 74.7 per cent of all grants in 2006–07. In the early years after the reforms, these visa grants fell considerably, from 27 198 in 2006–07 to 26 151 in 2007–08 and 20 141 in 2008–09.
In its place was a small increase in the number of students sponsored for permanent residence by an Australian employer and the introduction of a new visa, the Skilled Graduate (subclass 485) visa. This visa was valid for 18 months and targeted former international students interested in permanent Skilled Migration but who had no employer sponsor. Being a temporary visa it provided these students with the opportunity to spend more time in Australia to: gain employment experience in their nominated profession; find an employer willing to sponsor them; or acquire additional skills, including improving their English language proficiency.
This visa successfully delivered on these objectives, with a growing number of people on subclass 485 visas making a transition to points based and Employer Sponsored visas between 2009–10 and 2012–13 (Table 3.11). In contrast, there was no sustained growth in applications for skilled visas from Skilled Graduate (subclass 485) visa holders. In 2010–11, 11 694 applications were received. In the following two years, 9361 and 10 877 applications were received.
The reasons for this apparent contradiction are:
• Reforms to Skilled Migration and the introduction of SkillSelect over this period led to a fall in applications for permanent visas from subclass 485 visa holders.
• Despite the reduction in demand, the queue of applicants awaiting a decision on their permanent visas application remained at high levels.
• In this sort of environment, the growth in permanent visa grants does not necessarily reflect an increase in applications. In this instance it reflected the larger number of people in the processing queue being granted visas.
In March 2013, the subclass 485 visa was amended and renamed the Temporary Graduate (subclass 485) visa. This visa no longer offers a direct application pathway for students to permanent Skilled Migration. It is now a temporary visa designed to provide students with an opportunity to obtain work experience, helping to make them more employable upon their return to their home country.
Small numbers of Skilled Independent visas continued to be issued to former students through to 2009–10, a situation that was accentuated by the lower processing priority they were given relative to Employer Sponsored and State/Territory Sponsored visas. In 2009–10, however, applications for these visas had progressed in the processing queue and as a result the number of grants rose by 124.0 per cent. Since then numbers have been maintained (Table 3.12).
Australia’s Migration Trends 2012–13 Page 55 of 187
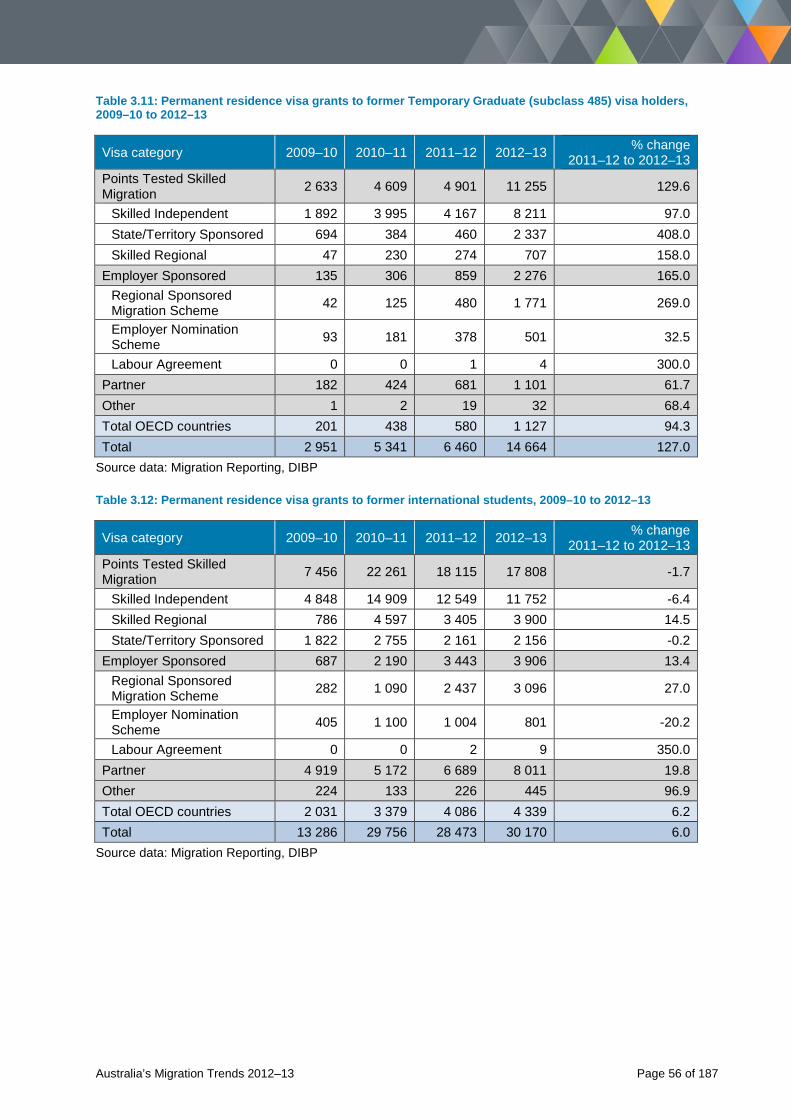
Table 3.11: Permanent residence visa grants to former Temporary Graduate (subclass 485) visa holders, 2009–10 to 2012–13
Visa category 2009–10 2010–11 2011–12 2012–13 % change 2011–12 to 2012–13
Points Tested Skilled Migration 2 633 4 609 4 901 11 255 129.6
Skilled Independent 1 892 3 995 4 167 8 211 97.0 State/Territory Sponsored 694 384 460 2 337 408.0 Skilled Regional 47 230 274 707 158.0 Employer Sponsored 135 306 859 2 276 165.0 Regional Sponsored Migration Scheme 42 125 480 1 771 269.0
Employer Nomination Scheme 93 181 378 501 32.5
Labour Agreement 0 0 1 4 300.0 Partner 182 424 681 1 101 61.7 Other 1 2 19 32 68.4 Total OECD countries 201 438 580 1 127 94.3 Total 2 951 5 341 6 460 14 664 127.0
Source data: Migration Reporting, DIBP
Table 3.12: Permanent residence visa grants to former international students, 2009–10 to 2012–13
Visa category 2009–10 2010–11 2011–12 2012–13 % change 2011–12 to 2012–13
Points Tested Skilled Migration 7 456 22 261 18 115 17 808 -1.7
Skilled Independent 4 848 14 909 12 549 11 752 -6.4 Skilled Regional 786 4 597 3 405 3 900 14.5 State/Territory Sponsored 1 822 2 755 2 161 2 156 -0.2 Employer Sponsored 687 2 190 3 443 3 906 13.4 Regional Sponsored Migration Scheme 282 1 090 2 437 3 096 27.0
Employer Nomination Scheme 405 1 100 1 004 801 -20.2
Labour Agreement 0 0 2 9 350.0 Partner 4 919 5 172 6 689 8 011 19.8 Other 224 133 226 445 96.9 Total OECD countries 2 031 3 379 4 086 4 339 6.2 Total 13 286 29 756 28 473 30 170 6.0
Source data: Migration Reporting, DIBP
Australia’s Migration Trends 2012–13 Page 56 of 187
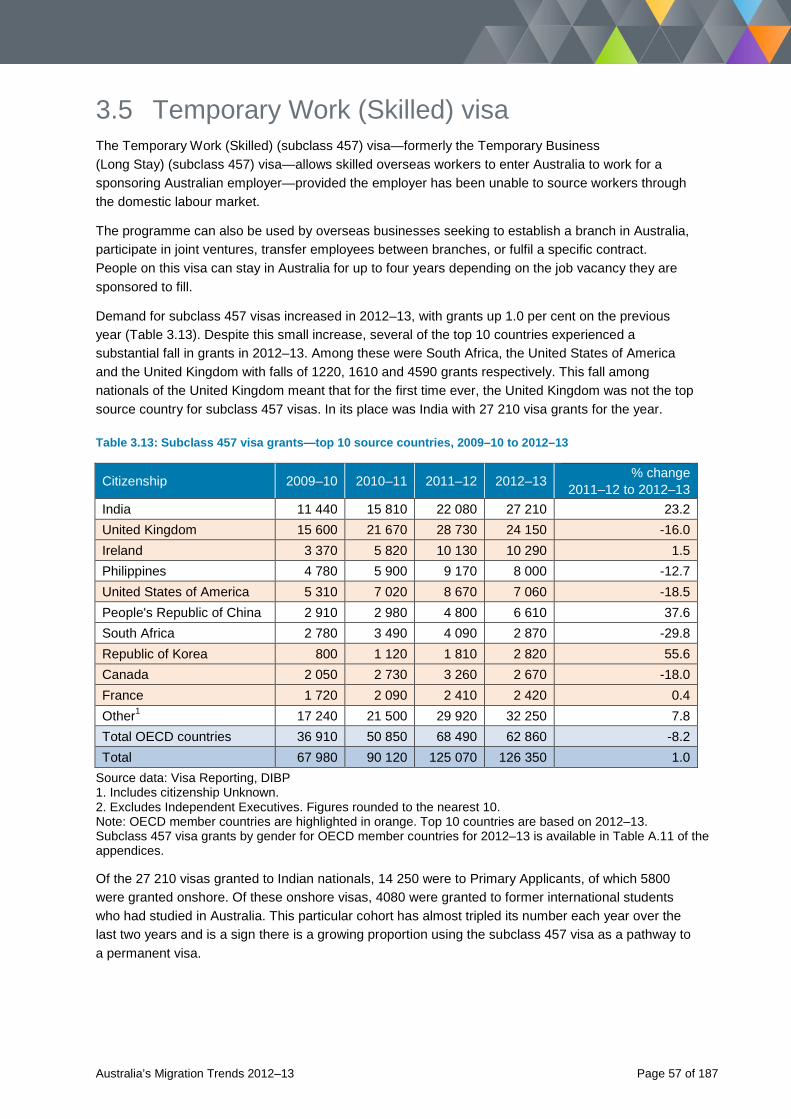
3.5 Temporary Work (Skilled) visa The Temporary Work (Skilled) (subclass 457) visa—formerly the Temporary Business (Long Stay) (subclass 457) visa—allows skilled overseas workers to enter Australia to work for a sponsoring Australian employer—provided the employer has been unable to source workers through the domestic labour market.
The programme can also be used by overseas businesses seeking to establish a branch in Australia, participate in joint ventures, transfer employees between branches, or fulfil a specific contract. People on this visa can stay in Australia for up to four years depending on the job vacancy they are sponsored to fill.
Demand for subclass 457 visas increased in 2012–13, with grants up 1.0 per cent on the previous year (Table 3.13). Despite this small increase, several of the top 10 countries experienced a substantial fall in grants in 2012–13. Among these were South Africa, the United States of America and the United Kingdom with falls of 1220, 1610 and 4590 grants respectively. This fall among nationals of the United Kingdom meant that for the first time ever, the United Kingdom was not the top source country for subclass 457 visas. In its place was India with 27 210 visa grants for the year.
Table 3.13: Subclass 457 visa grants—top 10 source countries, 2009–10 to 2012–13
Citizenship 2009–10 2010–11 2011–12 2012–13 % change 2011–12 to 2012–13
India 11 440 15 810 22 080 27 210 23.2 United Kingdom 15 600 21 670 28 730 24 150 -16.0 Ireland 3 370 5 820 10 130 10 290 1.5 Philippines 4 780 5 900 9 170 8 000 -12.7 United States of America 5 310 7 020 8 670 7 060 -18.5 People's Republic of China 2 910 2 980 4 800 6 610 37.6 South Africa 2 780 3 490 4 090 2 870 -29.8 Republic of Korea 800 1 120 1 810 2 820 55.6 Canada 2 050 2 730 3 260 2 670 -18.0 France 1 720 2 090 2 410 2 420 0.4 Other1 17 240 21 500 29 920 32 250 7.8 Total OECD countries 36 910 50 850 68 490 62 860 -8.2 Total 67 980 90 120 125 070 126 350 1.0
Source data: Visa Reporting, DIBP 1. Includes citizenship Unknown. 2. Excludes Independent Executives. Figures rounded to the nearest 10. Note: OECD member countries are highlighted in orange. Top 10 countries are based on 2012–13. Subclass 457 visa grants by gender for OECD member countries for 2012–13 is available in Table A.11 of the appendices.
Of the 27 210 visas granted to Indian nationals, 14 250 were to Primary Applicants, of which 5800 were granted onshore. Of these onshore visas, 4080 were granted to former international students who had studied in Australia. This particular cohort has almost tripled its number each year over the last two years and is a sign there is a growing proportion using the subclass 457 visa as a pathway to a permanent visa.
Australia’s Migration Trends 2012–13 Page 57 of 187
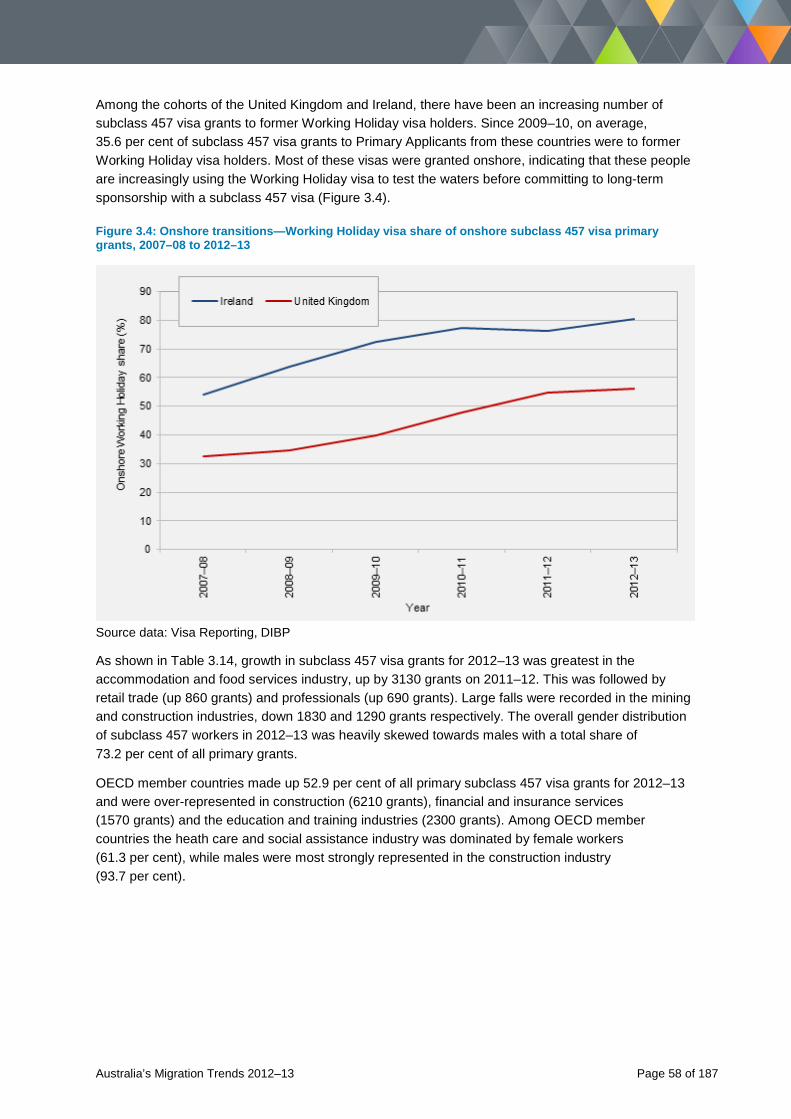
Among the cohorts of the United Kingdom and Ireland, there have been an increasing number of subclass 457 visa grants to former Working Holiday visa holders. Since 2009–10, on average, 35.6 per cent of subclass 457 visa grants to Primary Applicants from these countries were to former Working Holiday visa holders. Most of these visas were granted onshore, indicating that these people are increasingly using the Working Holiday visa to test the waters before committing to long-term sponsorship with a subclass 457 visa (Figure 3.4).
Figure 3.4: Onshore transitions—Working Holiday visa share of onshore subclass 457 visa primary grants, 2007–08 to 2012–13
Source data: Visa Reporting, DIBP
As shown in Table 3.14, growth in subclass 457 visa grants for 2012–13 was greatest in the accommodation and food services industry, up by 3130 grants on 2011–12. This was followed by retail trade (up 860 grants) and professionals (up 690 grants). Large falls were recorded in the mining and construction industries, down 1830 and 1290 grants respectively. The overall gender distribution of subclass 457 workers in 2012–13 was heavily skewed towards males with a total share of 73.2 per cent of all primary grants.
OECD member countries made up 52.9 per cent of all primary subclass 457 visa grants for 2012–13 and were over-represented in construction (6210 grants), financial and insurance services (1570 grants) and the education and training industries (2300 grants). Among OECD member countries the heath care and social assistance industry was dominated by female workers (61.3 per cent), while males were most strongly represented in the construction industry (93.7 per cent).
Australia’s Migration Trends 2012–13 Page 58 of 187
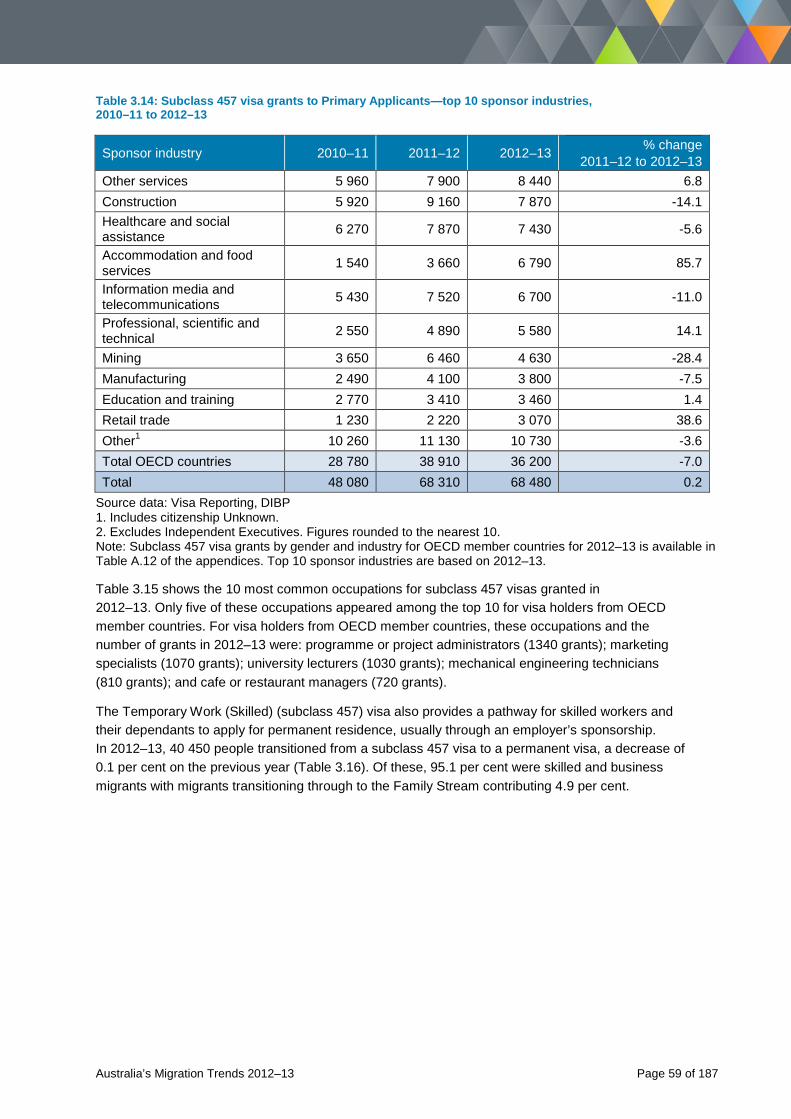
Table 3.14: Subclass 457 visa grants to Primary Applicants—top 10 sponsor industries, 2010–11 to 2012–13
Sponsor industry 2010–11 2011–12 2012–13 % change 2011–12 to 2012–13
Other services 5 960 7 900 8 440 6.8 Construction 5 920 9 160 7 870 -14.1 Healthcare and social assistance 6 270 7 870 7 430 -5.6
Accommodation and food services 1 540 3 660 6 790 85.7
Information media and telecommunications 5 430 7 520 6 700 -11.0
Professional, scientific and technical 2 550 4 890 5 580 14.1
Mining 3 650 6 460 4 630 -28.4 Manufacturing 2 490 4 100 3 800 -7.5 Education and training 2 770 3 410 3 460 1.4 Retail trade 1 230 2 220 3 070 38.6 Other1 10 260 11 130 10 730 -3.6 Total OECD countries 28 780 38 910 36 200 -7.0 Total 48 080 68 310 68 480 0.2
Source data: Visa Reporting, DIBP 1. Includes citizenship Unknown. 2. Excludes Independent Executives. Figures rounded to the nearest 10. Note: Subclass 457 visa grants by gender and industry for OECD member countries for 2012–13 is available in Table A.12 of the appendices. Top 10 sponsor industries are based on 2012–13.
Table 3.15 shows the 10 most common occupations for subclass 457 visas granted in 2012–13. Only five of these occupations appeared among the top 10 for visa holders from OECD member countries. For visa holders from OECD member countries, these occupations and the number of grants in 2012–13 were: programme or project administrators (1340 grants); marketing specialists (1070 grants); university lecturers (1030 grants); mechanical engineering technicians (810 grants); and cafe or restaurant managers (720 grants).
The Temporary Work (Skilled) (subclass 457) visa also provides a pathway for skilled workers and their dependants to apply for permanent residence, usually through an employer’s sponsorship. In 2012–13, 40 450 people transitioned from a subclass 457 visa to a permanent visa, a decrease of 0.1 per cent on the previous year (Table 3.16). Of these, 95.1 per cent were skilled and business migrants with migrants transitioning through to the Family Stream contributing 4.9 per cent.
Australia’s Migration Trends 2012–13 Page 59 of 187
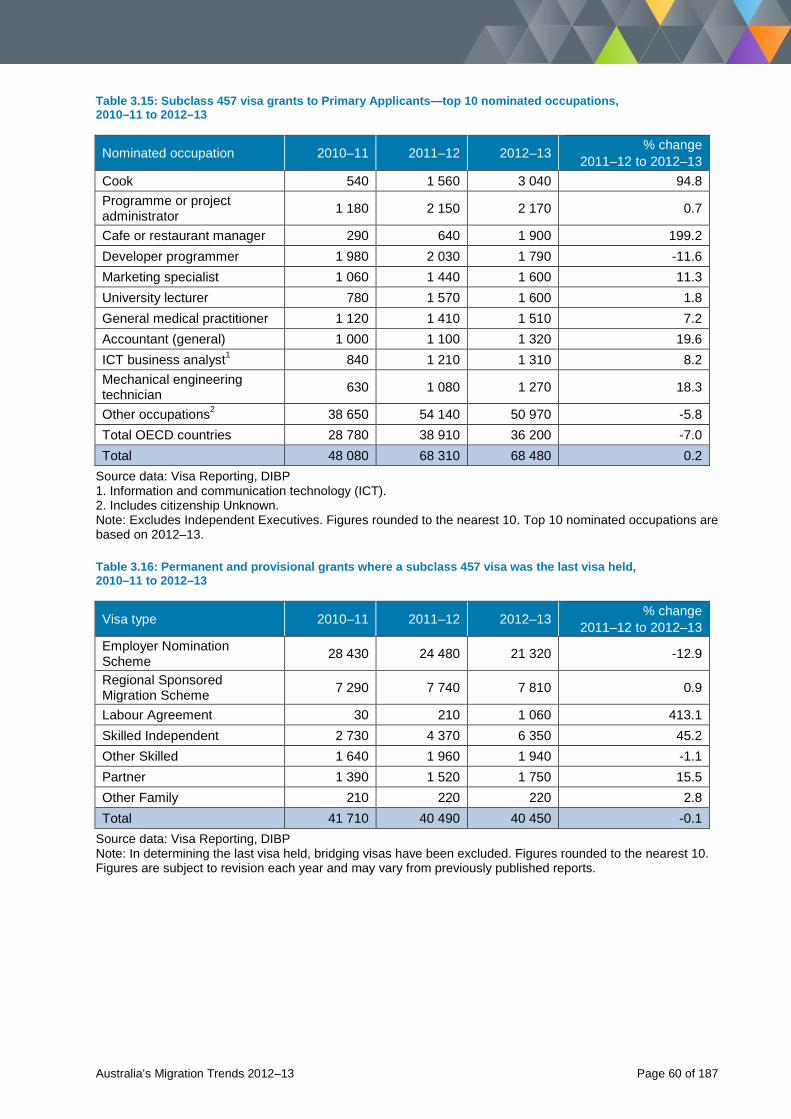
Table 3.15: Subclass 457 visa grants to Primary Applicants—top 10 nominated occupations, 2010–11 to 2012–13
Nominated occupation 2010–11 2011–12 2012–13 % change 2011–12 to 2012–13
Cook 540 1 560 3 040 94.8 Programme or project administrator 1 180 2 150 2 170 0.7
Cafe or restaurant manager 290 640 1 900 199.2 Developer programmer 1 980 2 030 1 790 -11.6 Marketing specialist 1 060 1 440 1 600 11.3 University lecturer 780 1 570 1 600 1.8 General medical practitioner 1 120 1 410 1 510 7.2 Accountant (general) 1 000 1 100 1 320 19.6 ICT business analyst1 840 1 210 1 310 8.2 Mechanical engineering technician 630 1 080 1 270 18.3
Other occupations2 38 650 54 140 50 970 -5.8 Total OECD countries 28 780 38 910 36 200 -7.0 Total 48 080 68 310 68 480 0.2
Source data: Visa Reporting, DIBP 1. Information and communication technology (ICT). 2. Includes citizenship Unknown. Note: Excludes Independent Executives. Figures rounded to the nearest 10. Top 10 nominated occupations are based on 2012–13.
Table 3.16: Permanent and provisional grants where a subclass 457 visa was the last visa held, 2010–11 to 2012–13
Visa type 2010–11 2011–12 2012–13 % change 2011–12 to 2012–13
Employer Nomination Scheme 28 430 24 480 21 320 -12.9
Regional Sponsored Migration Scheme 7 290 7 740 7 810 0.9
Labour Agreement 30 210 1 060 413.1 Skilled Independent 2 730 4 370 6 350 45.2 Other Skilled 1 640 1 960 1 940 -1.1 Partner 1 390 1 520 1 750 15.5 Other Family 210 220 220 2.8 Total 41 710 40 490 40 450 -0.1
Source data: Visa Reporting, DIBP Note: In determining the last visa held, bridging visas have been excluded. Figures rounded to the nearest 10. Figures are subject to revision each year and may vary from previously published reports.
Australia’s Migration Trends 2012–13 Page 60 of 187
3.6 Other temporary residence Other temporary residence visas allow people to undertake a wide range of activities in Australia that allow short-term non-ongoing highly specialised work, enrich social and cultural development, strengthen international relations or provide training opportunities of benefit to Australia.
As shown in Table 3.17, in 2012–13, 41 059 visas were granted—an increase of 25.1 per cent on 2011–12. The bulk of this increase is due to the new Temporary Work (Short Stay Activity) (subclass 400) visa, with 6224 grants since the end of March 2013. Strong growth was also recorded for the International Relations group of visas, up 31.4 per cent on the previous year.
Visa holders from OECD member countries were issued 56.5 per cent of these temporary visas. The largest OECD recipient was the United States of America with 8441 visas granted, followed by the United Kingdom (4505), Germany (1452), Canada (1287) and France (1110). Almost three-quarters (72.3 per cent) of OECD recipients were male.
Detailed statistics of other temporary visas granted by gender for OECD member countries for 2012–13 is available in Table A.13 of the appendices.
Australia’s Migration Trends 2012–13 Page 61 of 187
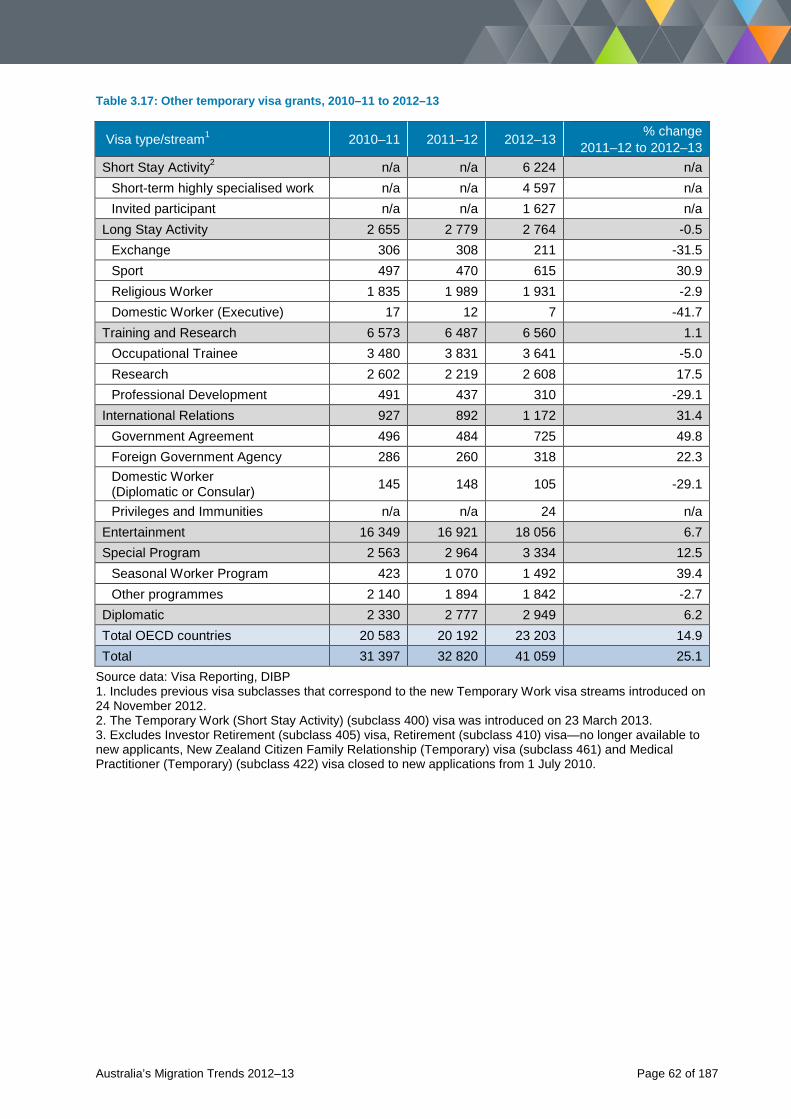
Table 3.17: Other temporary visa grants, 2010–11 to 2012–13
Visa type/stream1 2010–11 2011–12 2012–13 % change 2011–12 to 2012–13
Short Stay Activity2 n/a n/a 6 224 n/a Short-term highly specialised work n/a n/a 4 597 n/a Invited participant n/a n/a 1 627 n/a Long Stay Activity 2 655 2 779 2 764 -0.5 Exchange 306 308 211 -31.5 Sport 497 470 615 30.9 Religious Worker 1 835 1 989 1 931 -2.9 Domestic Worker (Executive) 17 12 7 -41.7 Training and Research 6 573 6 487 6 560 1.1 Occupational Trainee 3 480 3 831 3 641 -5.0 Research 2 602 2 219 2 608 17.5 Professional Development 491 437 310 -29.1 International Relations 927 892 1 172 31.4 Government Agreement 496 484 725 49.8 Foreign Government Agency 286 260 318 22.3 Domestic Worker (Diplomatic or Consular) 145 148 105 -29.1
Privileges and Immunities n/a n/a 24 n/a Entertainment 16 349 16 921 18 056 6.7 Special Program 2 563 2 964 3 334 12.5 Seasonal Worker Program 423 1 070 1 492 39.4 Other programmes 2 140 1 894 1 842 -2.7 Diplomatic 2 330 2 777 2 949 6.2 Total OECD countries 20 583 20 192 23 203 14.9 Total 31 397 32 820 41 059 25.1
Source data: Visa Reporting, DIBP 1. Includes previous visa subclasses that correspond to the new Temporary Work visa streams introduced on 24 November 2012. 2. The Temporary Work (Short Stay Activity) (subclass 400) visa was introduced on 23 March 2013. 3. Excludes Investor Retirement (subclass 405) visa, Retirement (subclass 410) visa—no longer available to new applicants, New Zealand Citizen Family Relationship (Temporary) visa (subclass 461) and Medical Practitioner (Temporary) (subclass 422) visa closed to new applications from 1 July 2010.
Australia’s Migration Trends 2012–13 Page 62 of 187
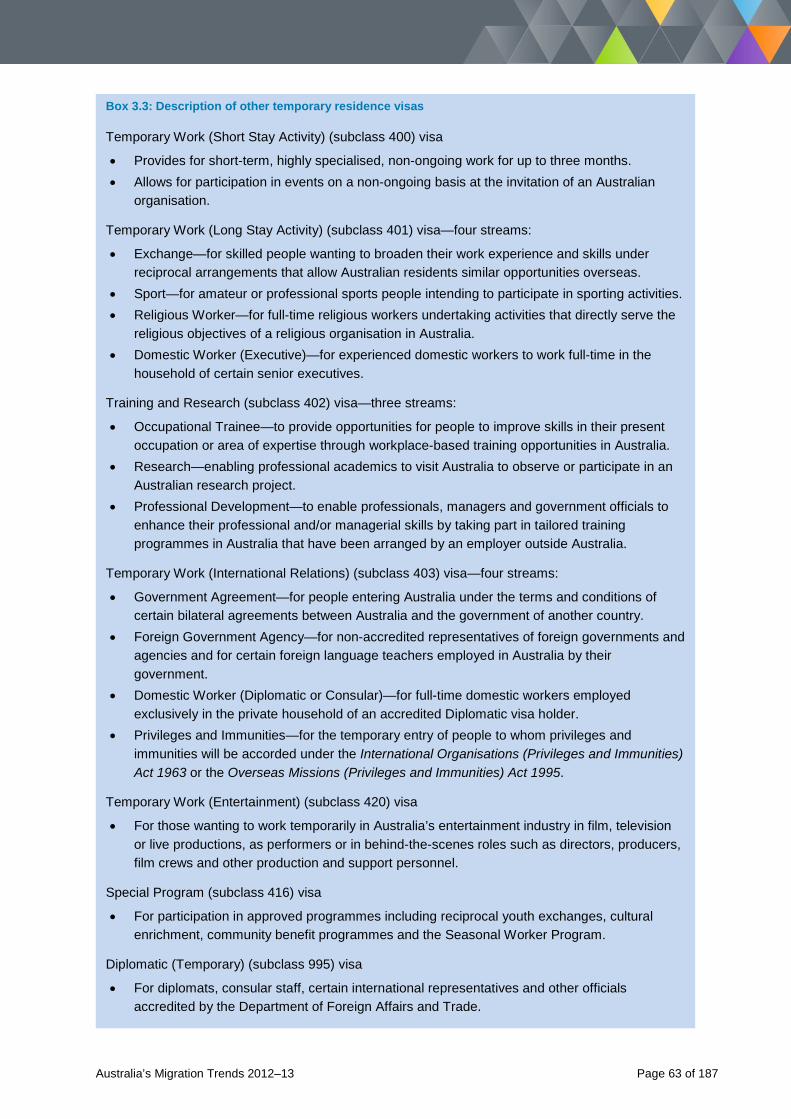
Box 3.3: Description of other temporary residence visas
Temporary Work (Short Stay Activity) (subclass 400) visa
• Provides for short-term, highly specialised, non-ongoing work for up to three months. • Allows for participation in events on a non-ongoing basis at the invitation of an Australian
organisation.
Temporary Work (Long Stay Activity) (subclass 401) visa—four streams:
• Exchange—for skilled people wanting to broaden their work experience and skills under reciprocal arrangements that allow Australian residents similar opportunities overseas.
• Sport—for amateur or professional sports people intending to participate in sporting activities. • Religious Worker—for full-time religious workers undertaking activities that directly serve the
religious objectives of a religious organisation in Australia. • Domestic Worker (Executive)—for experienced domestic workers to work full-time in the
household of certain senior executives.
Training and Research (subclass 402) visa—three streams:
• Occupational Trainee—to provide opportunities for people to improve skills in their present occupation or area of expertise through workplace-based training opportunities in Australia.
• Research—enabling professional academics to visit Australia to observe or participate in an Australian research project.
• Professional Development—to enable professionals, managers and government officials to enhance their professional and/or managerial skills by taking part in tailored training programmes in Australia that have been arranged by an employer outside Australia.
Temporary Work (International Relations) (subclass 403) visa—four streams:
• Government Agreement—for people entering Australia under the terms and conditions of certain bilateral agreements between Australia and the government of another country.
• Foreign Government Agency—for non-accredited representatives of foreign governments and agencies and for certain foreign language teachers employed in Australia by their government.
• Domestic Worker (Diplomatic or Consular)—for full-time domestic workers employed exclusively in the private household of an accredited Diplomatic visa holder.
• Privileges and Immunities—for the temporary entry of people to whom privileges and immunities will be accorded under the International Organisations (Privileges and Immunities) Act 1963 or the Overseas Missions (Privileges and Immunities) Act 1995.
Temporary Work (Entertainment) (subclass 420) visa
• For those wanting to work temporarily in Australia’s entertainment industry in film, television or live productions, as performers or in behind-the-scenes roles such as directors, producers, film crews and other production and support personnel.
Special Program (subclass 416) visa
• For participation in approved programmes including reciprocal youth exchanges, cultural enrichment, community benefit programmes and the Seasonal Worker Program.
Diplomatic (Temporary) (subclass 995) visa
• For diplomats, consular staff, certain international representatives and other officials accredited by the Department of Foreign Affairs and Trade.
Australia’s Migration Trends 2012–13 Page 63 of 187
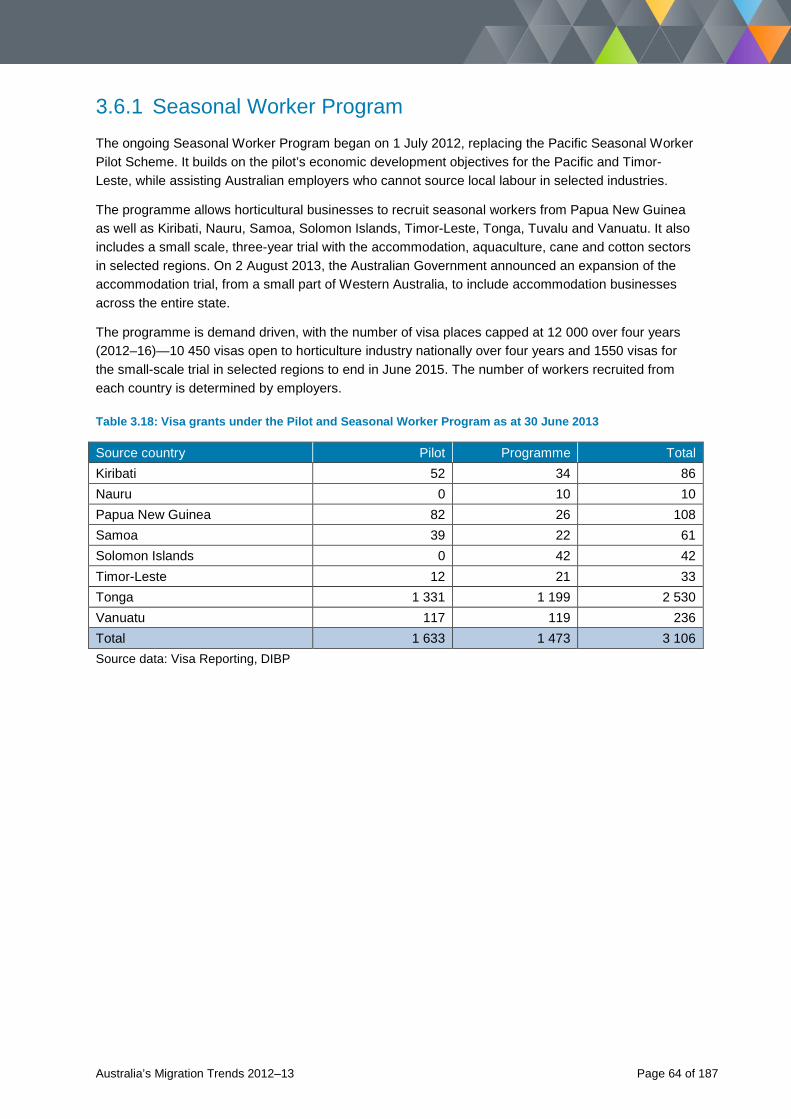
3.6.1 Seasonal Worker Program
The ongoing Seasonal Worker Program began on 1 July 2012, replacing the Pacific Seasonal Worker Pilot Scheme. It builds on the pilot’s economic development objectives for the Pacific and Timor-Leste, while assisting Australian employers who cannot source local labour in selected industries.
The programme allows horticultural businesses to recruit seasonal workers from Papua New Guinea as well as Kiribati, Nauru, Samoa, Solomon Islands, Timor-Leste, Tonga, Tuvalu and Vanuatu. It also includes a small scale, three-year trial with the accommodation, aquaculture, cane and cotton sectors in selected regions. On 2 August 2013, the Australian Government announced an expansion of the accommodation trial, from a small part of Western Australia, to include accommodation businesses across the entire state.
The programme is demand driven, with the number of visa places capped at 12 000 over four years (2012–16)—10 450 visas open to horticulture industry nationally over four years and 1550 visas for the small-scale trial in selected regions to end in June 2015. The number of workers recruited from each country is determined by employers.
Table 3.18: Visa grants under the Pilot and Seasonal Worker Program as at 30 June 2013
Source country Pilot Programme Total Kiribati 52 34 86 Nauru 0 10 10 Papua New Guinea 82 26 108 Samoa 39 22 61 Solomon Islands 0 42 42 Timor-Leste 12 21 33 Tonga 1 331 1 199 2 530 Vanuatu 117 119 236 Total 1 633 1 473 3 106 Source data: Visa Reporting, DIBP
Australia’s Migration Trends 2012–13 Page 64 of 187
3.7 Short-term intra-company transfers Intra-company transfers—also known as intra-corporate transfers or posted workers—are movements of employees in the same company who are temporarily transferred to a different country to provide services for a limited period. In contrast to ordinary labour migration, these workers (if salaried) are employees of a company in the country of origin rather than of a domestic company or—if self-employed—are based in the country of origin rather than the country in which the service is carried out.
Short-term intra-company transfers are an under-studied aspect of international trade. They can be difficult to measure in the Australian context. This is due to the limited availability of data collected for some visas that could be used to travel to Australia under an intra-corporate transfer arrangement. The analyses in this report is therefore restricted to the Temporary Work (Skilled) (subclass 457) visa where a person’s visa application indicated they were travelling on an internal company transfer arrangement. It does not include all intra-corporate transfers, as some individuals who meet this definition will come to Australia on other visas, including short-term business visitors.
3.7.1 Temporary Work (Skilled) intra-corporate flows
In 2012–13, 8930 subclass 457 visas were granted to Primary Applicants identified as an intra-company transfer—a decrease on the previous year of 11.7 per cent. This represented 13.0 per cent of all subclass 457 visas granted to Primary Applicants for 2012–13. By comparison, of the 36 200 subclass 457 visas granted to Primary Applicants from OECD member countries, 2600 (7.2 per cent) were identified as an intra-company transfer.
Of the top 10 source countries, India dominated with 5470 visas granted to Primary Applicants in 2012–13. While this was a 61.2 per cent share of all visas issued, it represented a decrease of 6.6 per cent on 2011–12 levels (Table 3.19).
Australia’s Migration Trends 2012–13 Page 65 of 187
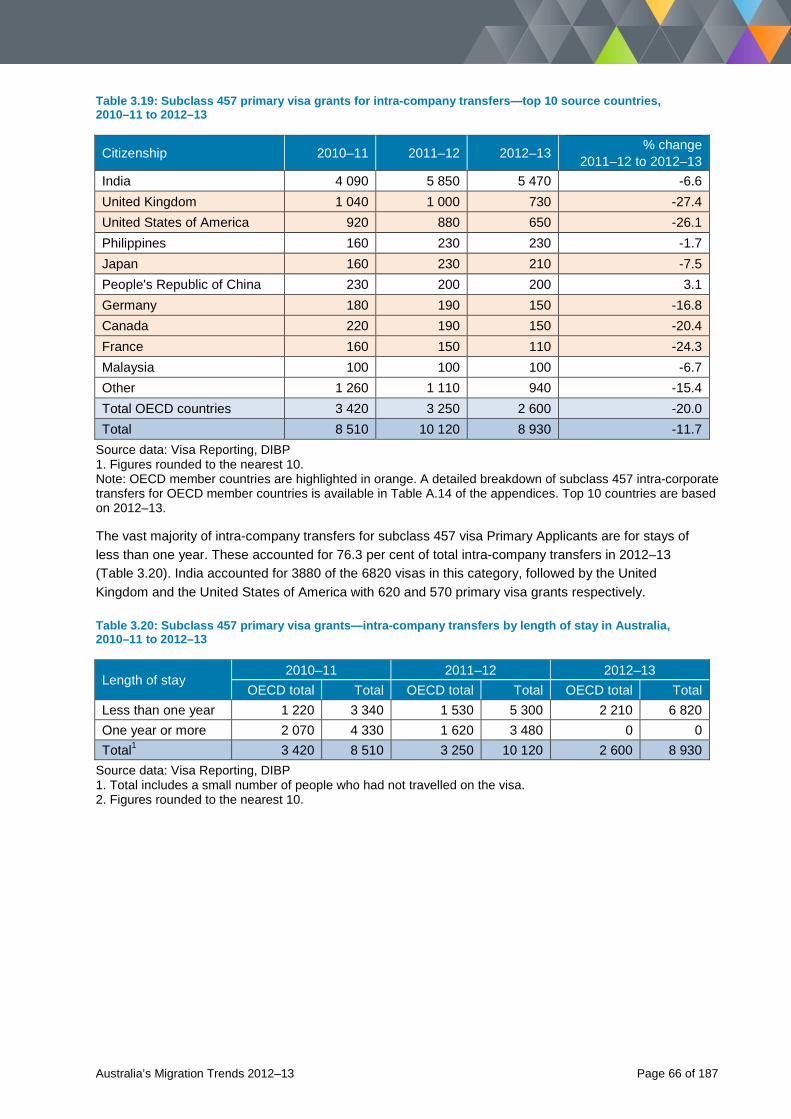
Table 3.19: Subclass 457 primary visa grants for intra-company transfers—top 10 source countries, 2010–11 to 2012–13
Citizenship 2010–11 2011–12 2012–13 % change 2011–12 to 2012–13
India 4 090 5 850 5 470 -6.6 United Kingdom 1 040 1 000 730 -27.4 United States of America 920 880 650 -26.1 Philippines 160 230 230 -1.7 Japan 160 230 210 -7.5 People's Republic of China 230 200 200 3.1 Germany 180 190 150 -16.8 Canada 220 190 150 -20.4 France 160 150 110 -24.3 Malaysia 100 100 100 -6.7 Other 1 260 1 110 940 -15.4 Total OECD countries 3 420 3 250 2 600 -20.0 Total 8 510 10 120 8 930 -11.7
Source data: Visa Reporting, DIBP 1. Figures rounded to the nearest 10. Note: OECD member countries are highlighted in orange. A detailed breakdown of subclass 457 intra-corporate transfers for OECD member countries is available in Table A.14 of the appendices. Top 10 countries are based on 2012–13.
The vast majority of intra-company transfers for subclass 457 visa Primary Applicants are for stays of less than one year. These accounted for 76.3 per cent of total intra-company transfers in 2012–13 (Table 3.20). India accounted for 3880 of the 6820 visas in this category, followed by the United Kingdom and the United States of America with 620 and 570 primary visa grants respectively.
Table 3.20: Subclass 457 primary visa grants—intra-company transfers by length of stay in Australia, 2010–11 to 2012–13
Length of stay 2010–11 2011–12 2012–13
OECD total Total OECD total Total OECD total Total Less than one year 1 220 3 340 1 530 5 300 2 210 6 820 One year or more 2 070 4 330 1 620 3 480 0 0 Total1 3 420 8 510 3 250 10 120 2 600 8 930
Source data: Visa Reporting, DIBP 1. Total includes a small number of people who had not travelled on the visa. 2. Figures rounded to the nearest 10.
Australia’s Migration Trends 2012–13 Page 66 of 187
Chapter 4: The Humanitarian Programme
Australia’s Migration Trends 2012–13 Page 67 of 187
4.1 Overview Australia’s Humanitarian Programme has an offshore resettlement component and an onshore protection component.
The offshore resettlement component is for people outside of Australia who need humanitarian assistance. It has two categories:
1. Refugee—generally for people identified by the United Nations High Commissioner for Refugees (UNHCR) as a refugee in need of resettlement. The visa subclasses in this category are: • Refugee—for applicants who have fled persecution in their home country and who are living
outside their home country. • In-Country Special Humanitarian—for applicants living in their home country who are subject
to persecution. • Emergency Rescue—for applicants living in or outside their home country and who are in
urgent need of protection because there is an immediate threat to their life and security. • Woman at Risk—for female applicants and their dependants living outside their home country
without the protection of a male relative, who are in danger of being victimised, harassed or seriously abused because of their gender.
2. Special Humanitarian Programme—for people outside their home country and subject to substantial discrimination amounting to gross violation of their human rights in their home country. These applicants must be proposed for resettlement by an Australian citizen, permanent resident or organisation that can support them through the settlement process.
The onshore protection component is for people seeking asylum in Australia who have their claims assessed in Australia.
Australia’s Migration Trends 2012–13 Page 68 of 187
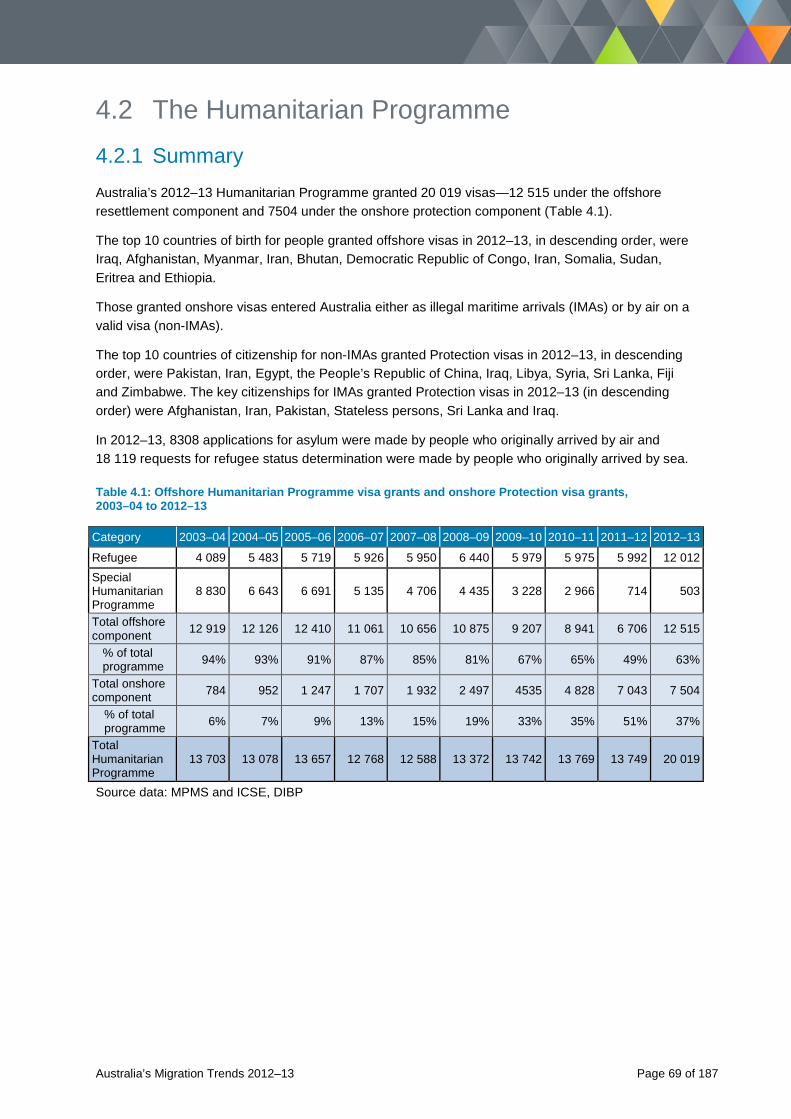
4.2 The Humanitarian Programme 4.2.1 Summary Australia’s 2012–13 Humanitarian Programme granted 20 019 visas—12 515 under the offshore resettlement component and 7504 under the onshore protection component (Table 4.1).
The top 10 countries of birth for people granted offshore visas in 2012–13, in descending order, were Iraq, Afghanistan, Myanmar, Iran, Bhutan, Democratic Republic of Congo, Iran, Somalia, Sudan, Eritrea and Ethiopia.
Those granted onshore visas entered Australia either as illegal maritime arrivals (IMAs) or by air on a valid visa (non-IMAs).
The top 10 countries of citizenship for non-IMAs granted Protection visas in 2012–13, in descending order, were Pakistan, Iran, Egypt, the People’s Republic of China, Iraq, Libya, Syria, Sri Lanka, Fiji and Zimbabwe. The key citizenships for IMAs granted Protection visas in 2012–13 (in descending order) were Afghanistan, Iran, Pakistan, Stateless persons, Sri Lanka and Iraq.
In 2012–13, 8308 applications for asylum were made by people who originally arrived by air and 18 119 requests for refugee status determination were made by people who originally arrived by sea.
Table 4.1: Offshore Humanitarian Programme visa grants and onshore Protection visa grants, 2003–04 to 2012–13
Category 2003–04 2004–05 2005–06 2006–07 2007–08 2008–09 2009–10 2010–11 2011–12 2012–13
Refugee 4 089 5 483 5 719 5 926 5 950 6 440 5 979 5 975 5 992 12 012 Special Humanitarian Programme
8 830 6 643 6 691 5 135 4 706 4 435 3 228 2 966 714 503
Total offshore component 12 919 12 126 12 410 11 061 10 656 10 875 9 207 8 941 6 706 12 515
% of total programme 94% 93% 91% 87% 85% 81% 67% 65% 49% 63%
Total onshore component 784 952 1 247 1 707 1 932 2 497 4535 4 828 7 043 7 504
% of total programme 6% 7% 9% 13% 15% 19% 33% 35% 51% 37%
Total Humanitarian Programme
13 703 13 078 13 657 12 768 12 588 13 372 13 742 13 769 13 749 20 019
Source data: MPMS and ICSE, DIBP
Australia’s Migration Trends 2012–13 Page 69 of 187
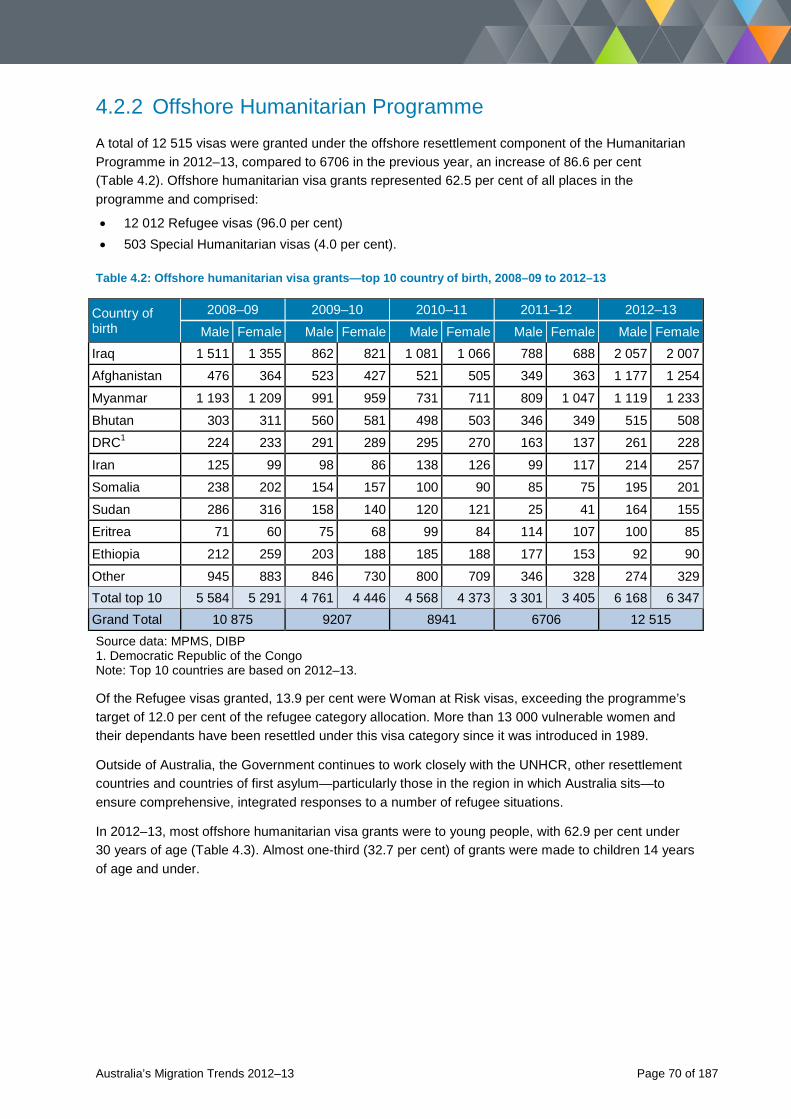
4.2.2 Offshore Humanitarian Programme A total of 12 515 visas were granted under the offshore resettlement component of the Humanitarian Programme in 2012–13, compared to 6706 in the previous year, an increase of 86.6 per cent (Table 4.2). Offshore humanitarian visa grants represented 62.5 per cent of all places in the programme and comprised:
• 12 012 Refugee visas (96.0 per cent) • 503 Special Humanitarian visas (4.0 per cent).
Table 4.2: Offshore humanitarian visa grants—top 10 country of birth, 2008–09 to 2012–13
Country of birth
2008–09 2009–10 2010–11 2011–12 2012–13
Male Female Male Female Male Female Male Female Male Female Iraq 1 511 1 355 862 821 1 081 1 066 788 688 2 057 2 007
Afghanistan 476 364 523 427 521 505 349 363 1 177 1 254
Myanmar 1 193 1 209 991 959 731 711 809 1 047 1 119 1 233
Bhutan 303 311 560 581 498 503 346 349 515 508
DRC1 224 233 291 289 295 270 163 137 261 228
Iran 125 99 98 86 138 126 99 117 214 257
Somalia 238 202 154 157 100 90 85 75 195 201
Sudan 286 316 158 140 120 121 25 41 164 155
Eritrea 71 60 75 68 99 84 114 107 100 85
Ethiopia 212 259 203 188 185 188 177 153 92 90
Other 945 883 846 730 800 709 346 328 274 329 Total top 10 5 584 5 291 4 761 4 446 4 568 4 373 3 301 3 405 6 168 6 347 Grand Total 10 875 9207 8941 6706 12 515 Source data: MPMS, DIBP 1. Democratic Republic of the Congo Note: Top 10 countries are based on 2012–13.
Of the Refugee visas granted, 13.9 per cent were Woman at Risk visas, exceeding the programme’s target of 12.0 per cent of the refugee category allocation. More than 13 000 vulnerable women and their dependants have been resettled under this visa category since it was introduced in 1989.
Outside of Australia, the Government continues to work closely with the UNHCR, other resettlement countries and countries of first asylum—particularly those in the region in which Australia sits—to ensure comprehensive, integrated responses to a number of refugee situations.
In 2012–13, most offshore humanitarian visa grants were to young people, with 62.9 per cent under 30 years of age (Table 4.3). Almost one-third (32.7 per cent) of grants were made to children 14 years of age and under.
Australia’s Migration Trends 2012–13 Page 70 of 187
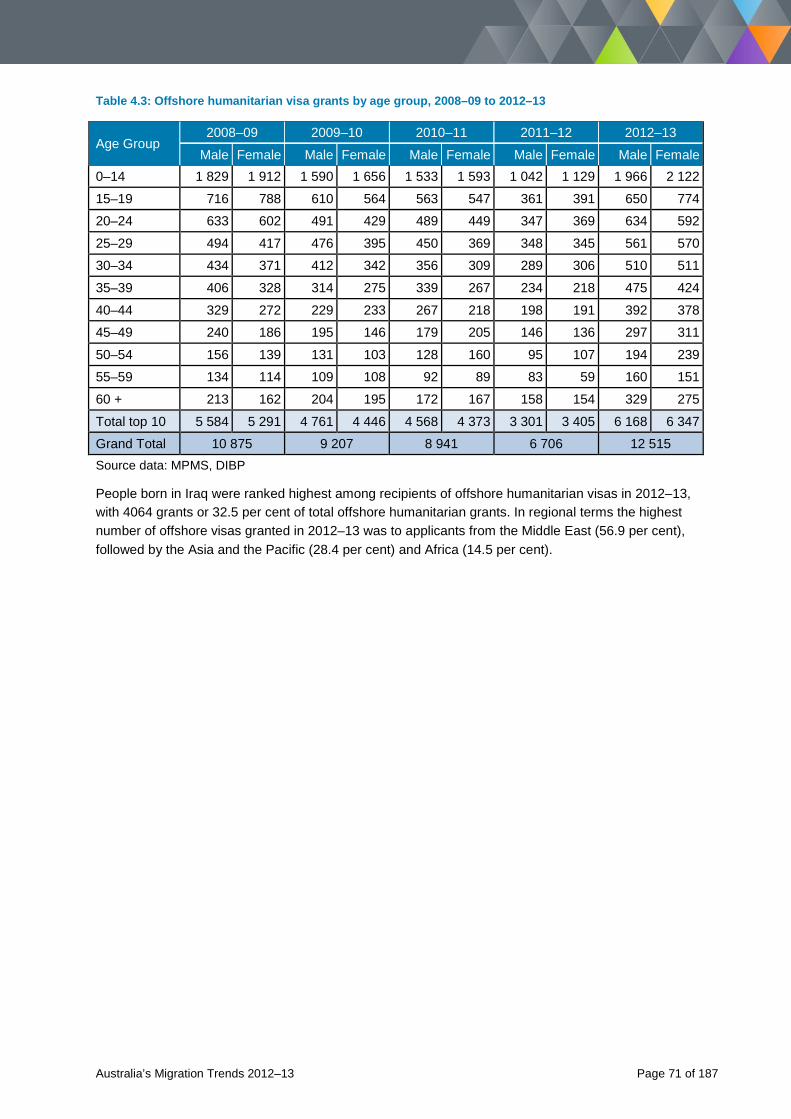
Table 4.3: Offshore humanitarian visa grants by age group, 2008–09 to 2012–13
Age Group 2008–09 2009–10 2010–11 2011–12 2012–13
Male Female Male Female Male Female Male Female Male Female 0–14 1 829 1 912 1 590 1 656 1 533 1 593 1 042 1 129 1 966 2 122
15–19 716 788 610 564 563 547 361 391 650 774
20–24 633 602 491 429 489 449 347 369 634 592
25–29 494 417 476 395 450 369 348 345 561 570
30–34 434 371 412 342 356 309 289 306 510 511
35–39 406 328 314 275 339 267 234 218 475 424
40–44 329 272 229 233 267 218 198 191 392 378
45–49 240 186 195 146 179 205 146 136 297 311
50–54 156 139 131 103 128 160 95 107 194 239
55–59 134 114 109 108 92 89 83 59 160 151
60 + 213 162 204 195 172 167 158 154 329 275
Total top 10 5 584 5 291 4 761 4 446 4 568 4 373 3 301 3 405 6 168 6 347
Grand Total 10 875 9 207 8 941 6 706 12 515 Source data: MPMS, DIBP
People born in Iraq were ranked highest among recipients of offshore humanitarian visas in 2012–13, with 4064 grants or 32.5 per cent of total offshore humanitarian grants. In regional terms the highest number of offshore visas granted in 2012–13 was to applicants from the Middle East (56.9 per cent), followed by the Asia and the Pacific (28.4 per cent) and Africa (14.5 per cent).
Australia’s Migration Trends 2012–13 Page 71 of 187
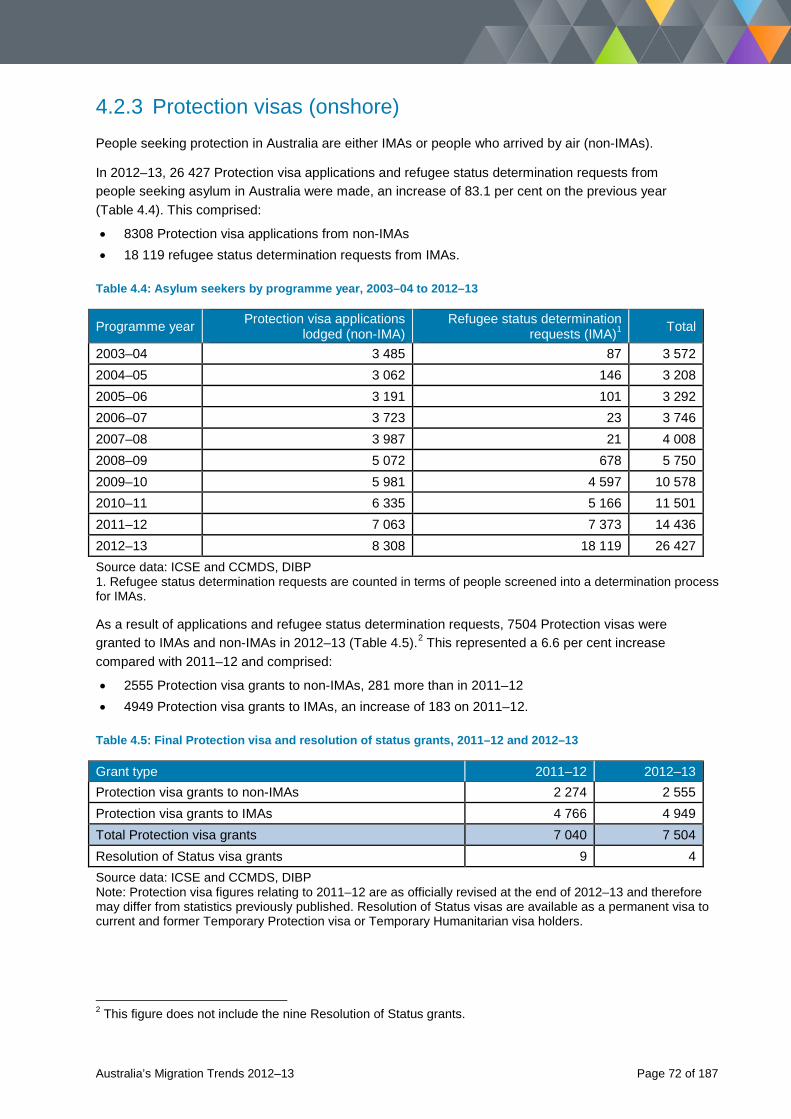
4.2.3 Protection visas (onshore) People seeking protection in Australia are either IMAs or people who arrived by air (non-IMAs).
In 2012–13, 26 427 Protection visa applications and refugee status determination requests from people seeking asylum in Australia were made, an increase of 83.1 per cent on the previous year (Table 4.4). This comprised:
• 8308 Protection visa applications from non-IMAs • 18 119 refugee status determination requests from IMAs.
Table 4.4: Asylum seekers by programme year, 2003–04 to 2012–13
Programme year Protection visa applications lodged (non-IMA)
Refugee status determination requests (IMA)1 Total
2003–04 3 485 87 3 572 2004–05 3 062 146 3 208 2005–06 3 191 101 3 292 2006–07 3 723 23 3 746 2007–08 3 987 21 4 008 2008–09 5 072 678 5 750 2009–10 5 981 4 597 10 578 2010–11 6 335 5 166 11 501 2011–12 7 063 7 373 14 436 2012–13 8 308 18 119 26 427 Source data: ICSE and CCMDS, DIBP 1. Refugee status determination requests are counted in terms of people screened into a determination process for IMAs.
As a result of applications and refugee status determination requests, 7504 Protection visas were granted to IMAs and non-IMAs in 2012–13 (Table 4.5).2 This represented a 6.6 per cent increase compared with 2011–12 and comprised:
• 2555 Protection visa grants to non-IMAs, 281 more than in 2011–12 • 4949 Protection visa grants to IMAs, an increase of 183 on 2011–12.
Table 4.5: Final Protection visa and resolution of status grants, 2011–12 and 2012–13
Grant type 2011–12 2012–13 Protection visa grants to non-IMAs 2 274 2 555 Protection visa grants to IMAs 4 766 4 949 Total Protection visa grants 7 040 7 504 Resolution of Status visa grants 9 4 Source data: ICSE and CCMDS, DIBP Note: Protection visa figures relating to 2011–12 are as officially revised at the end of 2012–13 and therefore may differ from statistics previously published. Resolution of Status visas are available as a permanent visa to current and former Temporary Protection visa or Temporary Humanitarian visa holders.
2 This figure does not include the nine Resolution of Status grants.
Australia’s Migration Trends 2012–13 Page 72 of 187
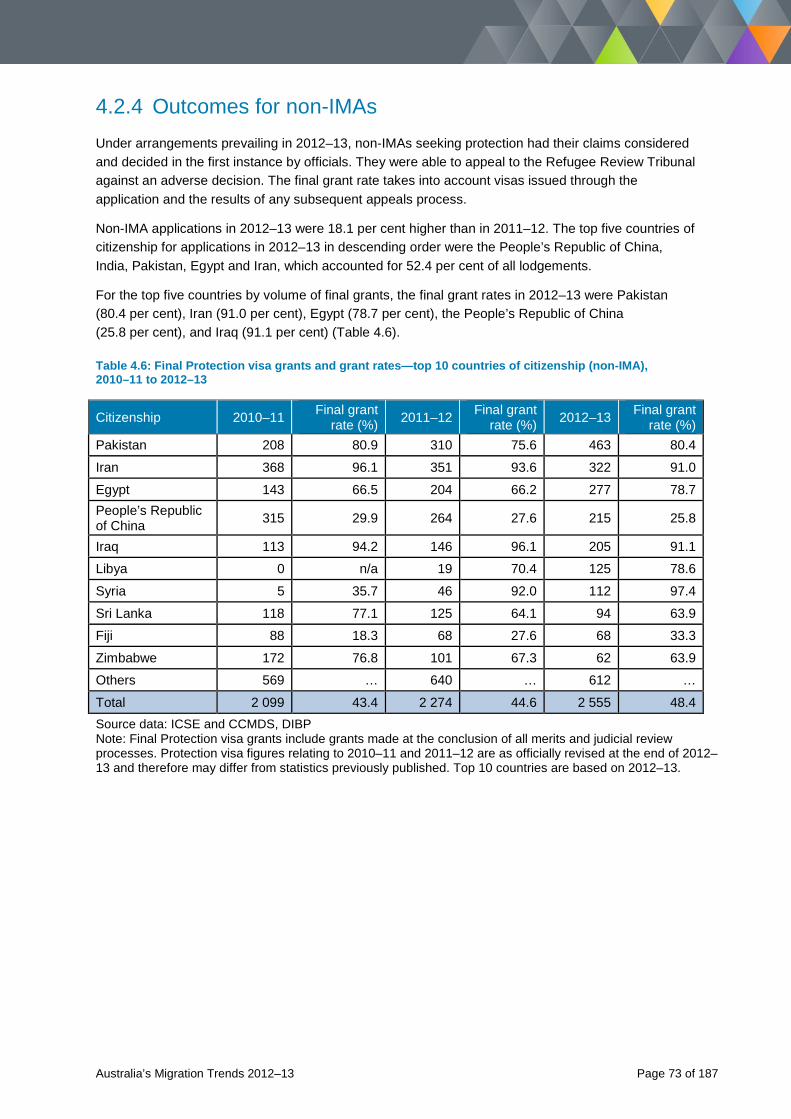
4.2.4 Outcomes for non-IMAs Under arrangements prevailing in 2012–13, non-IMAs seeking protection had their claims considered and decided in the first instance by officials. They were able to appeal to the Refugee Review Tribunal against an adverse decision. The final grant rate takes into account visas issued through the application and the results of any subsequent appeals process.
Non-IMA applications in 2012–13 were 18.1 per cent higher than in 2011–12. The top five countries of citizenship for applications in 2012–13 in descending order were the People’s Republic of China, India, Pakistan, Egypt and Iran, which accounted for 52.4 per cent of all lodgements.
For the top five countries by volume of final grants, the final grant rates in 2012–13 were Pakistan (80.4 per cent), Iran (91.0 per cent), Egypt (78.7 per cent), the People’s Republic of China (25.8 per cent), and Iraq (91.1 per cent) (Table 4.6).
Table 4.6: Final Protection visa grants and grant rates—top 10 countries of citizenship (non-IMA), 2010–11 to 2012–13
Citizenship 2010–11 Final grant rate (%) 2011–12 Final grant
rate (%) 2012–13 Final grant rate (%)
Pakistan 208 80.9 310 75.6 463 80.4
Iran 368 96.1 351 93.6 322 91.0
Egypt 143 66.5 204 66.2 277 78.7 People’s Republic of China 315 29.9 264 27.6 215 25.8
Iraq 113 94.2 146 96.1 205 91.1
Libya 0 n/a 19 70.4 125 78.6
Syria 5 35.7 46 92.0 112 97.4
Sri Lanka 118 77.1 125 64.1 94 63.9
Fiji 88 18.3 68 27.6 68 33.3
Zimbabwe 172 76.8 101 67.3 62 63.9
Others 569 … 640 … 612 …
Total 2 099 43.4 2 274 44.6 2 555 48.4 Source data: ICSE and CCMDS, DIBP Note: Final Protection visa grants include grants made at the conclusion of all merits and judicial review processes. Protection visa figures relating to 2010–11 and 2011–12 are as officially revised at the end of 2012–13 and therefore may differ from statistics previously published. Top 10 countries are based on 2012–13.
Australia’s Migration Trends 2012–13 Page 73 of 187
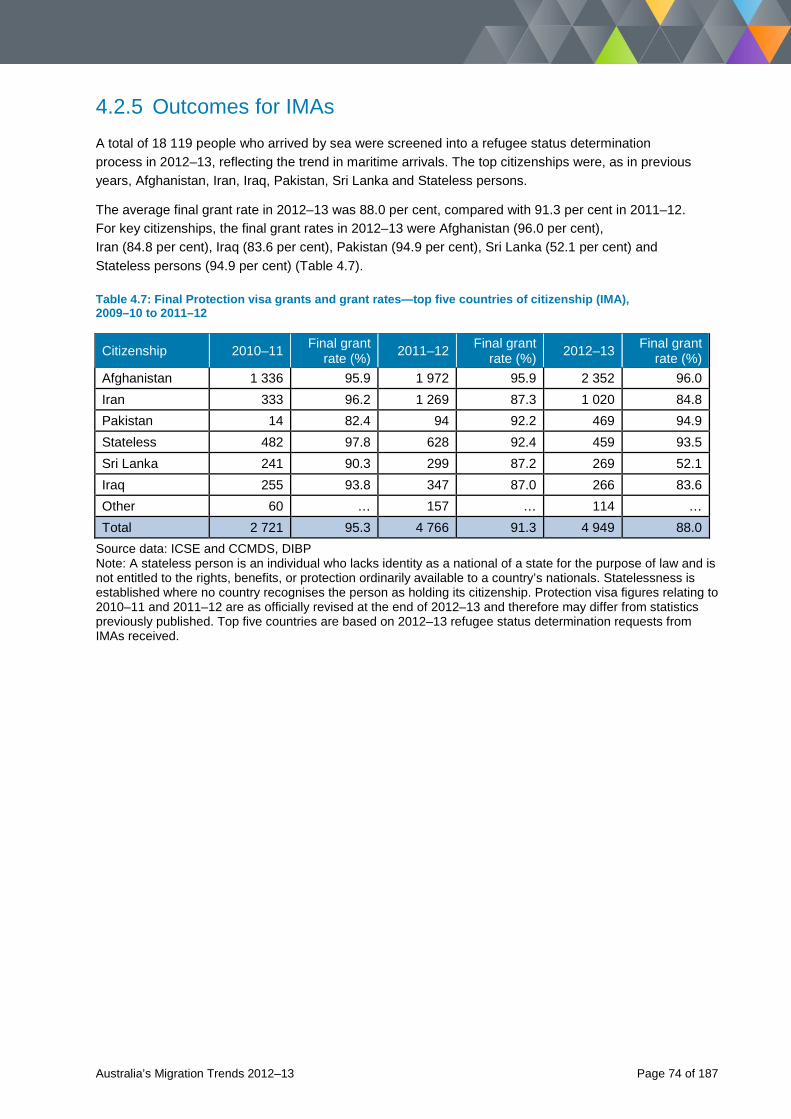
4.2.5 Outcomes for IMAs A total of 18 119 people who arrived by sea were screened into a refugee status determination process in 2012–13, reflecting the trend in maritime arrivals. The top citizenships were, as in previous years, Afghanistan, Iran, Iraq, Pakistan, Sri Lanka and Stateless persons.
The average final grant rate in 2012–13 was 88.0 per cent, compared with 91.3 per cent in 2011–12. For key citizenships, the final grant rates in 2012–13 were Afghanistan (96.0 per cent), Iran (84.8 per cent), Iraq (83.6 per cent), Pakistan (94.9 per cent), Sri Lanka (52.1 per cent) and Stateless persons (94.9 per cent) (Table 4.7).
Table 4.7: Final Protection visa grants and grant rates—top five countries of citizenship (IMA), 2009–10 to 2011–12
Citizenship 2010–11 Final grant rate (%) 2011–12 Final grant
rate (%) 2012–13 Final grant rate (%)
Afghanistan 1 336 95.9 1 972 95.9 2 352 96.0 Iran 333 96.2 1 269 87.3 1 020 84.8 Pakistan 14 82.4 94 92.2 469 94.9 Stateless 482 97.8 628 92.4 459 93.5 Sri Lanka 241 90.3 299 87.2 269 52.1 Iraq 255 93.8 347 87.0 266 83.6 Other 60 … 157 … 114 … Total 2 721 95.3 4 766 91.3 4 949 88.0
Source data: ICSE and CCMDS, DIBP Note: A stateless person is an individual who lacks identity as a national of a state for the purpose of law and is not entitled to the rights, benefits, or protection ordinarily available to a country’s nationals. Statelessness is established where no country recognises the person as holding its citizenship. Protection visa figures relating to 2010–11 and 2011–12 are as officially revised at the end of 2012–13 and therefore may differ from statistics previously published. Top five countries are based on 2012–13 refugee status determination requests from IMAs received.
Australia’s Migration Trends 2012–13 Page 74 of 187
Chapter 5: Visa non-compliance
Australia’s Migration Trends 2012–13 Page 75 of 187
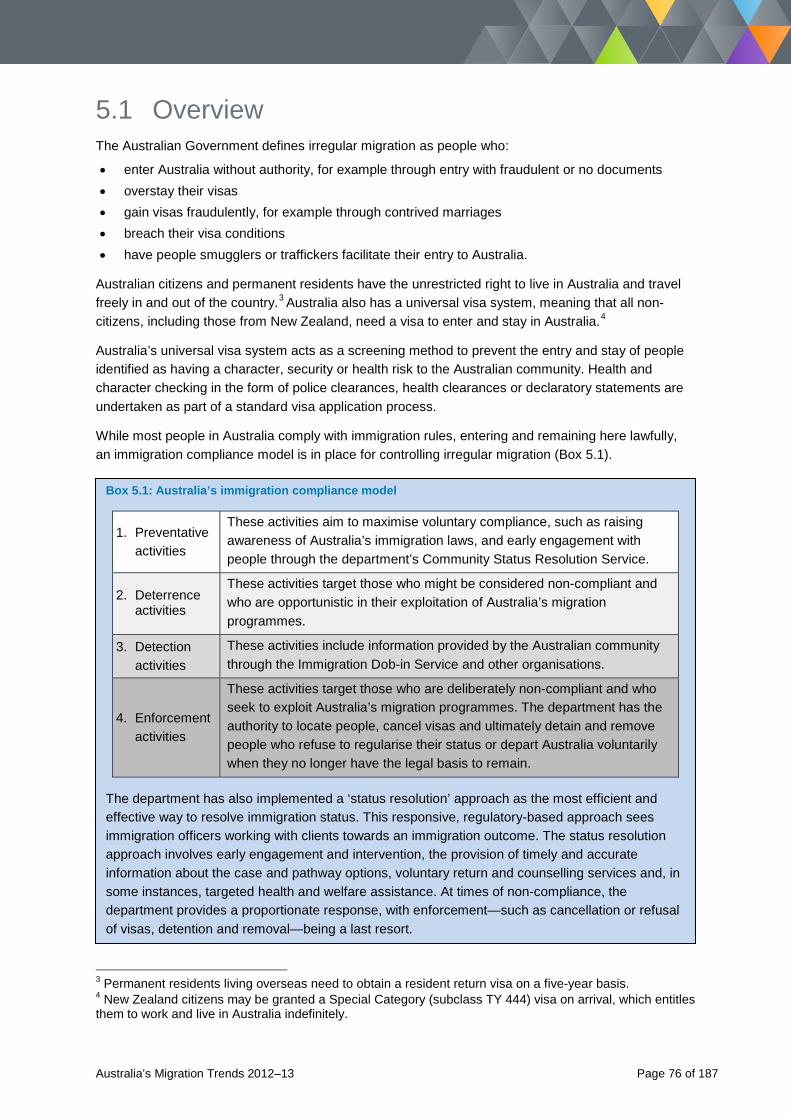
5.1 Overview The Australian Government defines irregular migration as people who:
• enter Australia without authority, for example through entry with fraudulent or no documents • overstay their visas • gain visas fraudulently, for example through contrived marriages • breach their visa conditions • have people smugglers or traffickers facilitate their entry to Australia.
Australian citizens and permanent residents have the unrestricted right to live in Australia and travel freely in and out of the country.3 Australia also has a universal visa system, meaning that all non-citizens, including those from New Zealand, need a visa to enter and stay in Australia.4
Australia’s universal visa system acts as a screening method to prevent the entry and stay of people identified as having a character, security or health risk to the Australian community. Health and character checking in the form of police clearances, health clearances or declaratory statements are undertaken as part of a standard visa application process.
While most people in Australia comply with immigration rules, entering and remaining here lawfully, an immigration compliance model is in place for controlling irregular migration (Box 5.1).
Box 5.1: Australia’s immigration compliance model
1. Preventative activities
These activities aim to maximise voluntary compliance, such as raising awareness of Australia’s immigration laws, and early engagement with people through the department’s Community Status Resolution Service.
2. Deterrence activities
These activities target those who might be considered non-compliant and who are opportunistic in their exploitation of Australia’s migration programmes.
3. Detection activities
These activities include information provided by the Australian community through the Immigration Dob-in Service and other organisations.
4. Enforcement activities
These activities target those who are deliberately non-compliant and who seek to exploit Australia’s migration programmes. The department has the authority to locate people, cancel visas and ultimately detain and remove people who refuse to regularise their status or depart Australia voluntarily when they no longer have the legal basis to remain.
The department has also implemented a ‘status resolution’ approach as the most efficient and effective way to resolve immigration status. This responsive, regulatory-based approach sees immigration officers working with clients towards an immigration outcome. The status resolution approach involves early engagement and intervention, the provision of timely and accurate information about the case and pathway options, voluntary return and counselling services and, in some instances, targeted health and welfare assistance. At times of non-compliance, the department provides a proportionate response, with enforcement—such as cancellation or refusal of visas, detention and removal—being a last resort.
3 Permanent residents living overseas need to obtain a resident return visa on a five-year basis. 4 New Zealand citizens may be granted a Special Category (subclass TY 444) visa on arrival, which entitles them to work and live in Australia indefinitely.
Australia’s Migration Trends 2012–13 Page 76 of 187
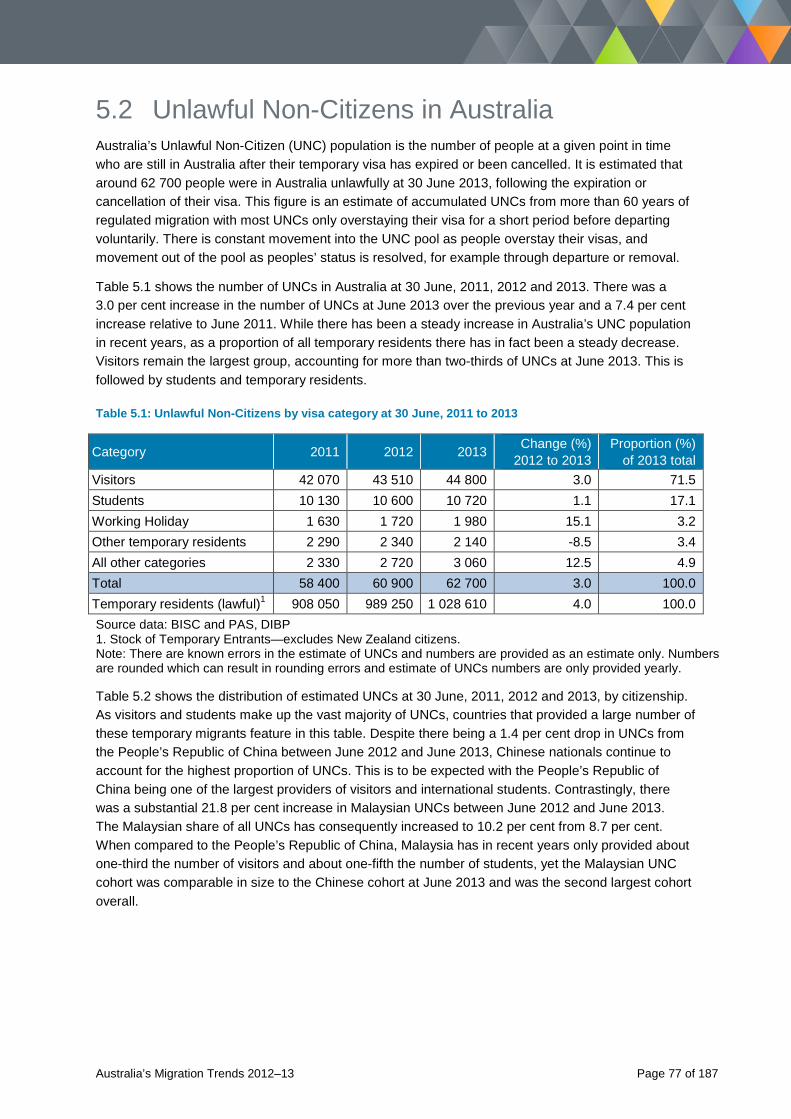
5.2 Unlawful Non-Citizens in Australia Australia’s Unlawful Non-Citizen (UNC) population is the number of people at a given point in time who are still in Australia after their temporary visa has expired or been cancelled. It is estimated that around 62 700 people were in Australia unlawfully at 30 June 2013, following the expiration or cancellation of their visa. This figure is an estimate of accumulated UNCs from more than 60 years of regulated migration with most UNCs only overstaying their visa for a short period before departing voluntarily. There is constant movement into the UNC pool as people overstay their visas, and movement out of the pool as peoples’ status is resolved, for example through departure or removal.
Table 5.1 shows the number of UNCs in Australia at 30 June, 2011, 2012 and 2013. There was a 3.0 per cent increase in the number of UNCs at June 2013 over the previous year and a 7.4 per cent increase relative to June 2011. While there has been a steady increase in Australia’s UNC population in recent years, as a proportion of all temporary residents there has in fact been a steady decrease. Visitors remain the largest group, accounting for more than two-thirds of UNCs at June 2013. This is followed by students and temporary residents.
Table 5.1: Unlawful Non-Citizens by visa category at 30 June, 2011 to 2013
Category 2011 2012 2013 Change (%) 2012 to 2013
Proportion (%) of 2013 total
Visitors 42 070 43 510 44 800 3.0 71.5 Students 10 130 10 600 10 720 1.1 17.1 Working Holiday 1 630 1 720 1 980 15.1 3.2 Other temporary residents 2 290 2 340 2 140 -8.5 3.4 All other categories 2 330 2 720 3 060 12.5 4.9 Total 58 400 60 900 62 700 3.0 100.0 Temporary residents (lawful)1 908 050 989 250 1 028 610 4.0 100.0 Source data: BISC and PAS, DIBP 1. Stock of Temporary Entrants—excludes New Zealand citizens. Note: There are known errors in the estimate of UNCs and numbers are provided as an estimate only. Numbers are rounded which can result in rounding errors and estimate of UNCs numbers are only provided yearly.
Table 5.2 shows the distribution of estimated UNCs at 30 June, 2011, 2012 and 2013, by citizenship. As visitors and students make up the vast majority of UNCs, countries that provided a large number of these temporary migrants feature in this table. Despite there being a 1.4 per cent drop in UNCs from the People’s Republic of China between June 2012 and June 2013, Chinese nationals continue to account for the highest proportion of UNCs. This is to be expected with the People’s Republic of China being one of the largest providers of visitors and international students. Contrastingly, there was a substantial 21.8 per cent increase in Malaysian UNCs between June 2012 and June 2013. The Malaysian share of all UNCs has consequently increased to 10.2 per cent from 8.7 per cent. When compared to the People’s Republic of China, Malaysia has in recent years only provided about one-third the number of visitors and about one-fifth the number of students, yet the Malaysian UNC cohort was comparable in size to the Chinese cohort at June 2013 and was the second largest cohort overall.
Australia’s Migration Trends 2012–13 Page 77 of 187
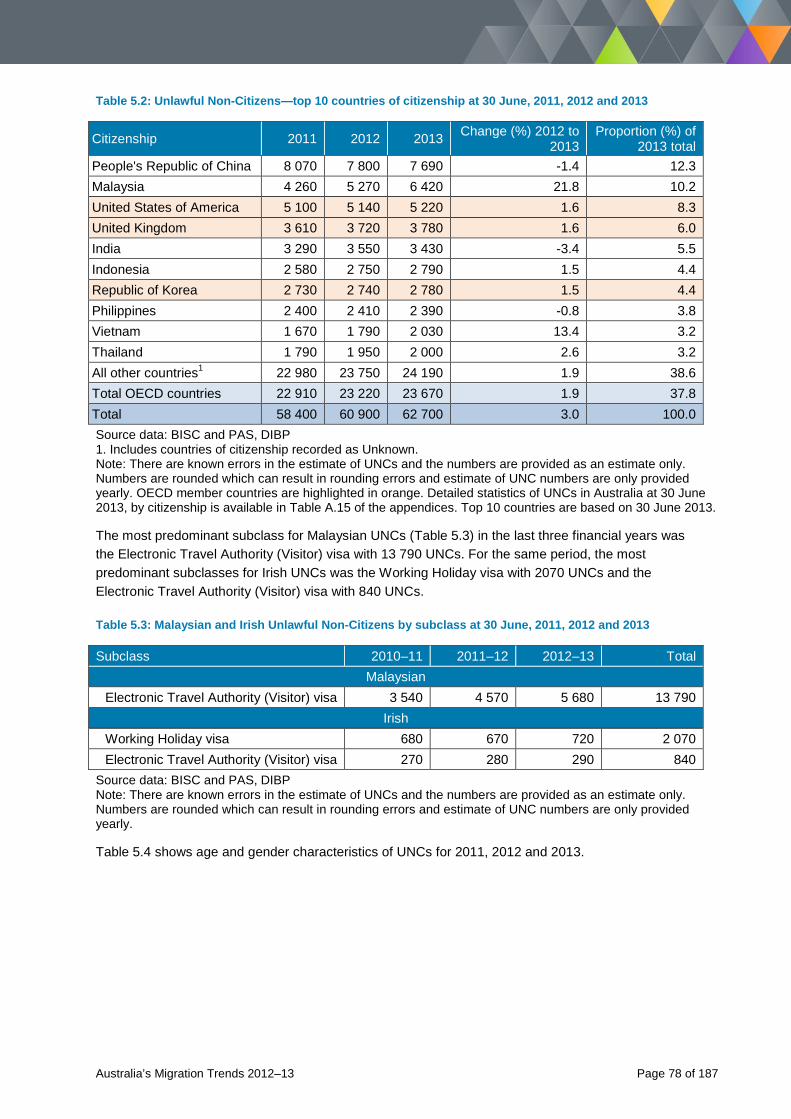
Table 5.2: Unlawful Non-Citizens—top 10 countries of citizenship at 30 June, 2011, 2012 and 2013
Citizenship 2011 2012 2013 Change (%) 2012 to 2013
Proportion (%) of 2013 total
People's Republic of China 8 070 7 800 7 690 -1.4 12.3 Malaysia 4 260 5 270 6 420 21.8 10.2 United States of America 5 100 5 140 5 220 1.6 8.3 United Kingdom 3 610 3 720 3 780 1.6 6.0 India 3 290 3 550 3 430 -3.4 5.5 Indonesia 2 580 2 750 2 790 1.5 4.4 Republic of Korea 2 730 2 740 2 780 1.5 4.4 Philippines 2 400 2 410 2 390 -0.8 3.8 Vietnam 1 670 1 790 2 030 13.4 3.2 Thailand 1 790 1 950 2 000 2.6 3.2 All other countries1 22 980 23 750 24 190 1.9 38.6 Total OECD countries 22 910 23 220 23 670 1.9 37.8 Total 58 400 60 900 62 700 3.0 100.0 Source data: BISC and PAS, DIBP 1. Includes countries of citizenship recorded as Unknown. Note: There are known errors in the estimate of UNCs and the numbers are provided as an estimate only. Numbers are rounded which can result in rounding errors and estimate of UNC numbers are only provided yearly. OECD member countries are highlighted in orange. Detailed statistics of UNCs in Australia at 30 June 2013, by citizenship is available in Table A.15 of the appendices. Top 10 countries are based on 30 June 2013.
The most predominant subclass for Malaysian UNCs (Table 5.3) in the last three financial years was the Electronic Travel Authority (Visitor) visa with 13 790 UNCs. For the same period, the most predominant subclasses for Irish UNCs was the Working Holiday visa with 2070 UNCs and the Electronic Travel Authority (Visitor) visa with 840 UNCs.
Table 5.3: Malaysian and Irish Unlawful Non-Citizens by subclass at 30 June, 2011, 2012 and 2013
Subclass 2010–11 2011–12 2012–13 Total Malaysian
Electronic Travel Authority (Visitor) visa 3 540 4 570 5 680 13 790 Irish
Working Holiday visa 680 670 720 2 070 Electronic Travel Authority (Visitor) visa 270 280 290 840 Source data: BISC and PAS, DIBP Note: There are known errors in the estimate of UNCs and the numbers are provided as an estimate only. Numbers are rounded which can result in rounding errors and estimate of UNC numbers are only provided yearly.
Table 5.4 shows age and gender characteristics of UNCs for 2011, 2012 and 2013.
Australia’s Migration Trends 2012–13 Page 78 of 187
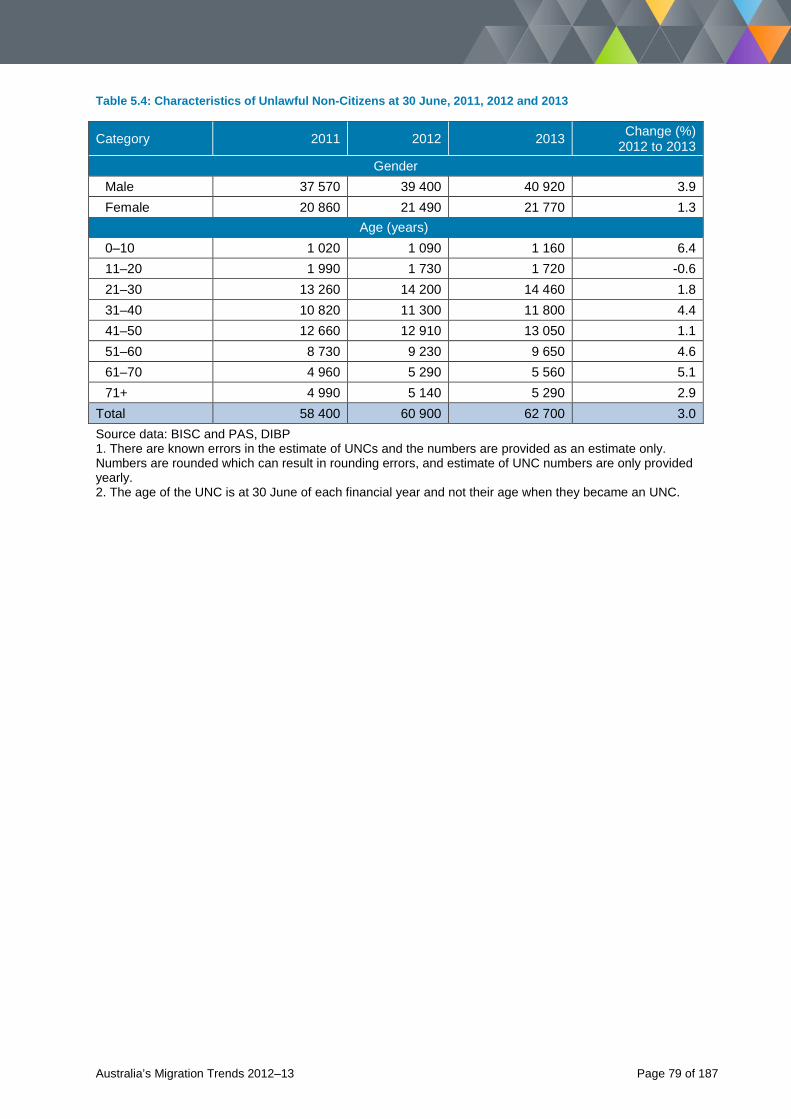
Table 5.4: Characteristics of Unlawful Non-Citizens at 30 June, 2011, 2012 and 2013
Category 2011 2012 2013 Change (%) 2012 to 2013
Gender Male 37 570 39 400 40 920 3.9 Female 20 860 21 490 21 770 1.3
Age (years) 0–10 1 020 1 090 1 160 6.4 11–20 1 990 1 730 1 720 -0.6 21–30 13 260 14 200 14 460 1.8 31–40 10 820 11 300 11 800 4.4 41–50 12 660 12 910 13 050 1.1 51–60 8 730 9 230 9 650 4.6 61–70 4 960 5 290 5 560 5.1 71+ 4 990 5 140 5 290 2.9 Total 58 400 60 900 62 700 3.0 Source data: BISC and PAS, DIBP 1. There are known errors in the estimate of UNCs and the numbers are provided as an estimate only. Numbers are rounded which can result in rounding errors, and estimate of UNC numbers are only provided yearly. 2. The age of the UNC is at 30 June of each financial year and not their age when they became an UNC.
Australia’s Migration Trends 2012–13 Page 79 of 187
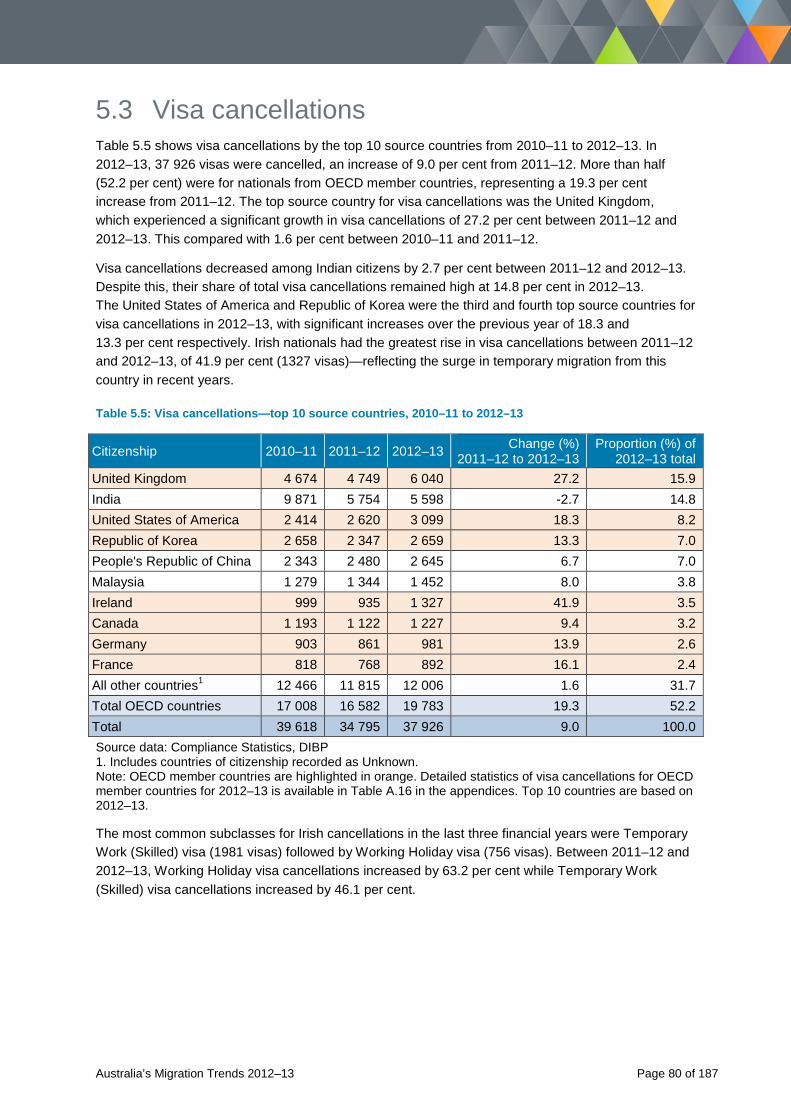
5.3 Visa cancellations Table 5.5 shows visa cancellations by the top 10 source countries from 2010–11 to 2012–13. In 2012–13, 37 926 visas were cancelled, an increase of 9.0 per cent from 2011–12. More than half (52.2 per cent) were for nationals from OECD member countries, representing a 19.3 per cent increase from 2011–12. The top source country for visa cancellations was the United Kingdom, which experienced a significant growth in visa cancellations of 27.2 per cent between 2011–12 and 2012–13. This compared with 1.6 per cent between 2010–11 and 2011–12.
Visa cancellations decreased among Indian citizens by 2.7 per cent between 2011–12 and 2012–13. Despite this, their share of total visa cancellations remained high at 14.8 per cent in 2012–13. The United States of America and Republic of Korea were the third and fourth top source countries for visa cancellations in 2012–13, with significant increases over the previous year of 18.3 and 13.3 per cent respectively. Irish nationals had the greatest rise in visa cancellations between 2011–12 and 2012–13, of 41.9 per cent (1327 visas)—reflecting the surge in temporary migration from this country in recent years.
Table 5.5: Visa cancellations—top 10 source countries, 2010–11 to 2012–13
Citizenship 2010–11 2011–12 2012–13 Change (%) 2011–12 to 2012–13
Proportion (%) of 2012–13 total
United Kingdom 4 674 4 749 6 040 27.2 15.9 India 9 871 5 754 5 598 -2.7 14.8 United States of America 2 414 2 620 3 099 18.3 8.2 Republic of Korea 2 658 2 347 2 659 13.3 7.0 People's Republic of China 2 343 2 480 2 645 6.7 7.0 Malaysia 1 279 1 344 1 452 8.0 3.8 Ireland 999 935 1 327 41.9 3.5 Canada 1 193 1 122 1 227 9.4 3.2 Germany 903 861 981 13.9 2.6 France 818 768 892 16.1 2.4 All other countries1 12 466 11 815 12 006 1.6 31.7 Total OECD countries 17 008 16 582 19 783 19.3 52.2 Total 39 618 34 795 37 926 9.0 100.0 Source data: Compliance Statistics, DIBP 1. Includes countries of citizenship recorded as Unknown. Note: OECD member countries are highlighted in orange. Detailed statistics of visa cancellations for OECD member countries for 2012–13 is available in Table A.16 in the appendices. Top 10 countries are based on 2012–13.
The most common subclasses for Irish cancellations in the last three financial years were Temporary Work (Skilled) visa (1981 visas) followed by Working Holiday visa (756 visas). Between 2011–12 and 2012–13, Working Holiday visa cancellations increased by 63.2 per cent while Temporary Work (Skilled) visa cancellations increased by 46.1 per cent.
Australia’s Migration Trends 2012–13 Page 80 of 187
Box 5.2: Cancelling visas
Under the Migration Act 1958, visas can be cancelled for non-compliance with visa conditions, including overstaying, working without authority, or for character concerns (such as committing serious criminal offences). When a person’s visa is cancelled, the person becomes an Unlawful Non-Citizen and arrangements are subsequently made for detention and removal from Australia. The department seeks to assist in resolving a person’s immigration status in the first instance through the Community Status Resolution Service and may grant short-term bridging visas to manage the individual in the community where risks can be managed appropriately. Further information on the Community Status Resolution Service is available at: http://www.immi.gov.au/managing-australias-borders/compliance/community-status-resolution
5.4 Compliance-related departures The department facilitates the departure of people who have no entitlement to remain in Australia. These people either leave voluntarily as an assisted voluntary return or monitored departure, or they are removed under section 198 of the Migration Act 1958.
These departures are formally known as ‘returns’ and ‘removals’, and apply to these categories of UNCs:
Australia’s Migration Trends 2012–13 Page 81 of 187
• people who have overstayed their visa • people who have been refused a further visa or had their visa cancelled, including those whose
visas are cancelled on the basis of their criminal conduct • crews of vessels caught fishing illegally in Australian waters • people who arrived in Australia without authorisation and have not been granted a visa to remain
in Australia.
In recent years these types of departures have increased, reflecting the expansion of strategies to engage with people in the community to assist them in resolving their immigration status and to support voluntary returns where this is feasible (Table 5.6).
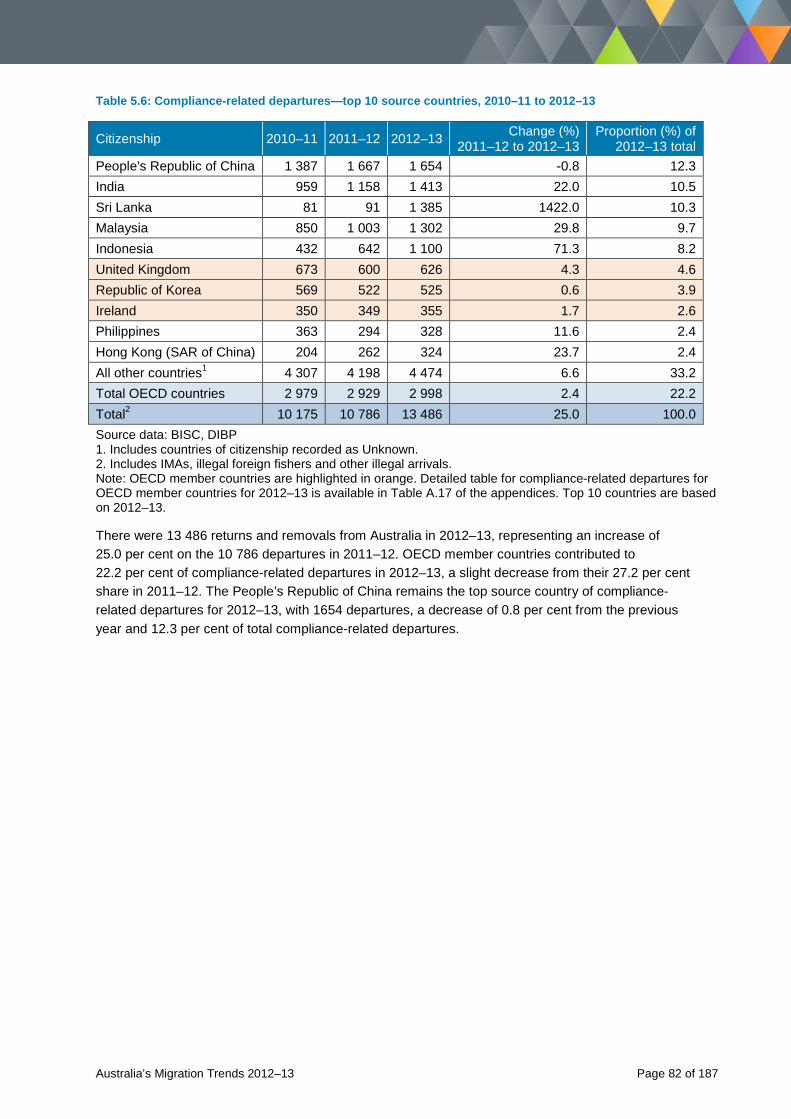
Table 5.6: Compliance-related departures—top 10 source countries, 2010–11 to 2012–13
Citizenship 2010–11 2011–12 2012–13 Change (%) 2011–12 to 2012–13
Proportion (%) of 2012–13 total
People's Republic of China 1 387 1 667 1 654 -0.8 12.3 India 959 1 158 1 413 22.0 10.5 Sri Lanka 81 91 1 385 1422.0 10.3 Malaysia 850 1 003 1 302 29.8 9.7 Indonesia 432 642 1 100 71.3 8.2 United Kingdom 673 600 626 4.3 4.6 Republic of Korea 569 522 525 0.6 3.9 Ireland 350 349 355 1.7 2.6 Philippines 363 294 328 11.6 2.4 Hong Kong (SAR of China) 204 262 324 23.7 2.4 All other countries1 4 307 4 198 4 474 6.6 33.2 Total OECD countries 2 979 2 929 2 998 2.4 22.2 Total2 10 175 10 786 13 486 25.0 100.0 Source data: BISC, DIBP 1. Includes countries of citizenship recorded as Unknown. 2. Includes IMAs, illegal foreign fishers and other illegal arrivals. Note: OECD member countries are highlighted in orange. Detailed table for compliance-related departures for OECD member countries for 2012–13 is available in Table A.17 of the appendices. Top 10 countries are based on 2012–13.
There were 13 486 returns and removals from Australia in 2012–13, representing an increase of 25.0 per cent on the 10 786 departures in 2011–12. OECD member countries contributed to 22.2 per cent of compliance-related departures in 2012–13, a slight decrease from their 27.2 per cent share in 2011–12. The People’s Republic of China remains the top source country of compliance-related departures for 2012–13, with 1654 departures, a decrease of 0.8 per cent from the previous year and 12.3 per cent of total compliance-related departures.
Australia’s Migration Trends 2012–13 Page 82 of 187
Chapter 6: Net Overseas Migration
Australia’s Migration Trends 2012–13 Page 83 of 187
6.1 Introduction So far this report has focused on the granting of temporary and permanent visas. While the number of visas issued has a strong influence on levels of migration in Australia and is something the department needs to closely manage, it is not how population change is measured. This is because people granted a permanent visa may delay their arrival in Australia or give up on the idea of migration altogether. There is also the issue of how long migrants stay in Australia. People granted a permanent visa may find Australia is not to their liking and choose to return to their home country. Similarly someone on a temporary visa may switch to another type of visa, thereby prolonging their stay. In addition there are other aspects of migration which the department does not control. This includes the free movement of New Zealand citizens, in and out of Australia, and the emigration and return-migration of Australian residents.
Net Overseas Migration (NOM) is used to account for all these movements (Box 6.1). This measures the net gain or loss of population through migration into and out of Australia.
The compilation of NOM is a joint exercise between the Australian Bureau of Statistics (ABS) and the department, with the ABS responsible for calculating the preliminary and final NOM estimates and the department responsible for NOM forecasts.
This chapter reports on NOM’s impact on population. It increases understanding of recent movements in NOM by examining its components and analysing NOM by citizenship to gain a better appreciation of how migration is changing the face of Australia’s population. The chapter concludes by forecasting NOM over the next four years.
Box 6.1: Understanding Net Overseas Migration
NOM is based on an international traveller’s duration of stay and is the difference between:
NOM arrivals—the number of incoming travellers who stay in Australia for 12 months or more over a 16-month period, who are not currently counted in the population.
NOM departures—the number of outgoing travellers (Australian residents and long-term visitors to Australia) who leave Australia for 12 months or more over a 16-month period, who are currently counted in the population.
Short-term movements (less than 12 months) are not included when calculating NOM. However, the ‘12-in-16 month rule’ applies in counting NOM arrivals. This rule means that people who are not permanent residents of Australia can be counted as NOM arrivals, even if they leave Australia briefly and provided their time in Australia adds up to at least 12 months in a 16-month window. It therefore includes permanent and temporary migrants, as well as New Zealand citizens and Australians. The same 12-in-16 month rule applies to NOM departures.
NOM data is not comparable with visa grants as there is a difference between when and how a visa is granted and its impact on NOM. For example, someone who is granted a visa in one year but who does not arrive in Australia until the following year, means they may be counted in NOM a year later. Also, someone who is granted a permanent visa may only stay in Australia for a short time, meaning they are not counted in NOM at all. It is also very common for someone to be granted a permanent visa while in Australia on a temporary visa. These cases are recorded in the temporary arrival component of NOM, but as a permanent visa in the Migration Programme.
Australia’s Migration Trends 2012–13 Page 84 of 187
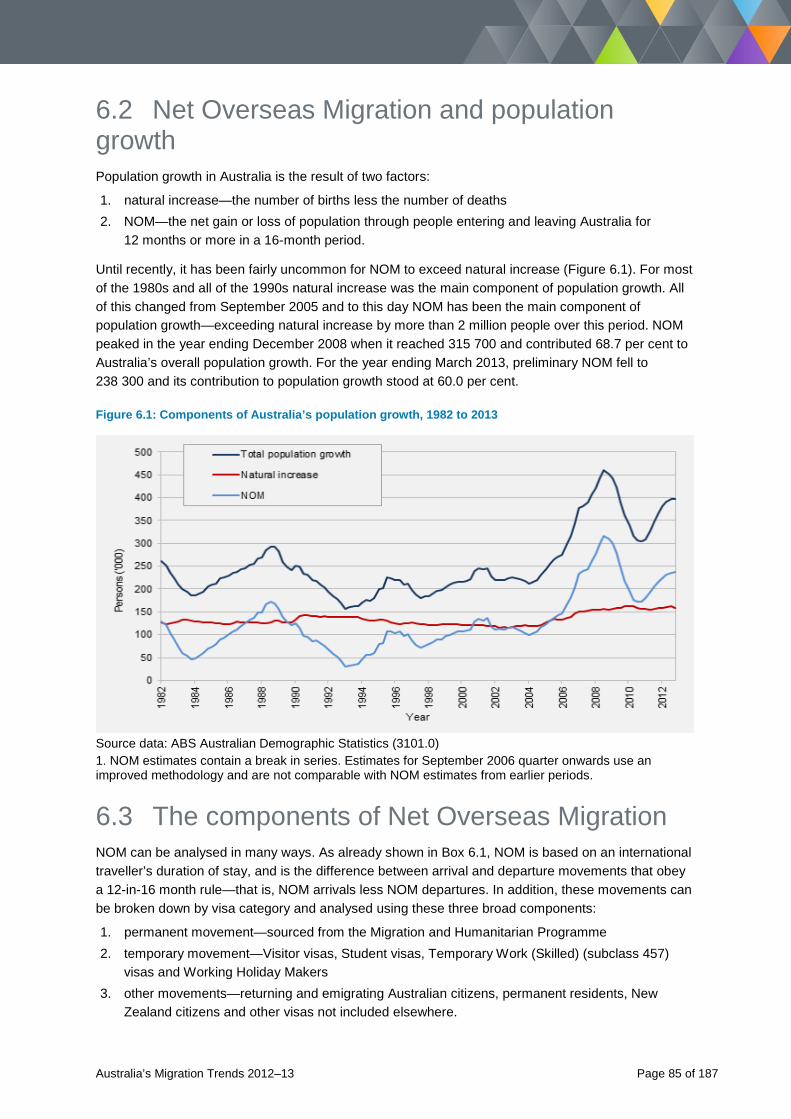
6.2 Net Overseas Migration and population growth Population growth in Australia is the result of two factors:
1. natural increase—the number of births less the number of deaths 2. NOM—the net gain or loss of population through people entering and leaving Australia for
12 months or more in a 16-month period.
Until recently, it has been fairly uncommon for NOM to exceed natural increase (Figure 6.1). For most of the 1980s and all of the 1990s natural increase was the main component of population growth. All of this changed from September 2005 and to this day NOM has been the main component of population growth—exceeding natural increase by more than 2 million people over this period. NOM peaked in the year ending December 2008 when it reached 315 700 and contributed 68.7 per cent to Australia’s overall population growth. For the year ending March 2013, preliminary NOM fell to 238 300 and its contribution to population growth stood at 60.0 per cent.
Figure 6.1: Components of Australia’s population growth, 1982 to 2013
Source data: ABS Australian Demographic Statistics (3101.0) 1. NOM estimates contain a break in series. Estimates for September 2006 quarter onwards use an improved methodology and are not comparable with NOM estimates from earlier periods.
6.3 The components of Net Overseas Migration NOM can be analysed in many ways. As already shown in Box 6.1, NOM is based on an international traveller’s duration of stay, and is the difference between arrival and departure movements that obey a 12-in-16 month rule—that is, NOM arrivals less NOM departures. In addition, these movements can be broken down by visa category and analysed using these three broad components:
1. permanent movement—sourced from the Migration and Humanitarian Programme 2. temporary movement—Visitor visas, Student visas, Temporary Work (Skilled) (subclass 457)
visas and Working Holiday Makers 3. other movements—returning and emigrating Australian citizens, permanent residents, New
Zealand citizens and other visas not included elsewhere.
Australia’s Migration Trends 2012–13 Page 85 of 187
Box 6.2: Classifying NOM arrivals and departures
Example 1
Anika arrived on a Student visa in September 2005 and stayed until December 2008. During this time she did not leave Australia or obtain any other visas. Anika’s NOM arrival was categorised as a Student, as was her NOM departure.
Example 2
John arrived on a 457 visa in March 2006. He has made small trips overseas, but has been in Australia long enough to be counted as a NOM arrival—he would be categorised as a Temporary Work (Skilled) (subclass 457) visa and would be included in the NOM arrival statistics for March 2006. In September 2009, John received his Skilled permanent residence visa. In March 2011, he accepted an intercompany transfer to Germany for two years. As John has been out of Australia for 12-in-16 months he was counted in the NOM departure statistics as a permanent resident. Note that John’s categorisation between his NOM arrival on a Temporary Work (Skilled) (subclass 457) visa and his NOM departure on a permanent Skilled visa have changed.
Example 3
Jane arrived on a tourist visa in June 2004 to have a holiday, but also looked at universities because she planned to study in Australia. She departed Australia after two weeks and returned in July 2004 on a Student visa. She studied in Australia from that time, returning home during the university holidays. In December 2006, while studying, Jane married an Australian and obtained permanent residence through a Spouse visa. In January 2011, she became an Australian citizen. In March 2011, Jane and her husband moved to the United Kingdom for three years of postgraduate studies. Jane’s NOM arrival was categorised as a visitor because her initial arrival on a tourist visa began the 12-in-16 month period. Her NOM departure was categorised as an Australian citizen.
Australia’s Migration Trends 2012–13 Page 86 of 187
6.3.1 NOM arrivals In the year ending December 2008, NOM arrivals peaked at 536 000, with the temporary component accounting for a 51.2 per cent share of these arrivals. By comparison, permanent arrivals accounted for significantly less with a share of 17.8 per cent, while other entrants—mainly Australian and New Zealand citizens—accounted for 30.9 per cent. The temporary component of NOM arrivals was dominant at that time because of the large numbers of international students taking up study options in Australia.
NOM arrivals fell away sharply over the next two years, so that for the year ending September 2010, there were 111 000 fewer arrivals—a 20.7 per cent decrease. Most of this was due to a fall in international student arrivals which coincided with: the ongoing impact of the global economic crisis in some countries; the high value of the Australian dollar; and increased competition in the global education market. Also contributing were a series of Australian Government reforms to the Skilled Migration programme and strengthened student integrity measures.
Since then, NOM arrivals have gradually increased and at June 2013 are forecast to rise to 503 800 for the year to June 2013 (Table 6.1)5. What is most significant is the growth that has occurred in Working Holiday Maker NOM arrivals in recent years, while student arrivals and most other components of NOM have changed little. Between December 2008 and June 2013, annual Working Holiday NOM arrivals are expected to increase 95.7 per cent from 32 500 to 63 500 people. This is mostly due to an increase in the number of people taking up second Working Holiday visas. These allow Working Holiday Makers to stay an extra year in Australia if they have worked in agriculture, mining or construction while on their first Working Holiday visa.
6.3.2 NOM departures Generally the largest component of NOM departures is the ‘other movements’ category, in particular the departures of Australian citizens. This is to be expected as the pool of Australian citizens from which these departures can be drawn is very large—more than 18 million people at the time of the Australian Census of Population and Housing were Australian citizens. When looked at this way, NOM departures of Australian citizens represent only a very small fraction of all Australian citizens. This fraction becomes even smaller when the arrivals of returning Australian citizens are taken into account.
Among the permanent and temporary components of NOM departures, the largest category is international students. In the year ending December 2008 there were 28 300 international student NOM departures. In the year ending September 2010, international student NOM departures had increased by 17 400 people to 45 700, with a peak forecast for the year to June 2012 at 52 500. The increase in Student visa NOM departures was a flow-on effect from the short-lived surge in NOM arrivals of international students a few years earlier.
The growth in departures of international students would have been even more pronounced if not for the increasing number of Student visas being granted onshore. This growth in the onshore component coincides with changes to Skilled Migration policy and difficult economic circumstances in some overseas countries. As a result, some international students may be extending their studies in Australia until overseas conditions improve or acquire additional Australian qualifications to increase their prospects of skilled migration.
5 Figure of 503 800 NOM arrivals is a department forecast. In December 2013, the Australian Bureau of Statistics released a preliminary estimate of 508 700 NOM arrivals and 264 300 NOM departures, for 2012-13.
Australia’s Migration Trends 2012–13 Page 87 of 187
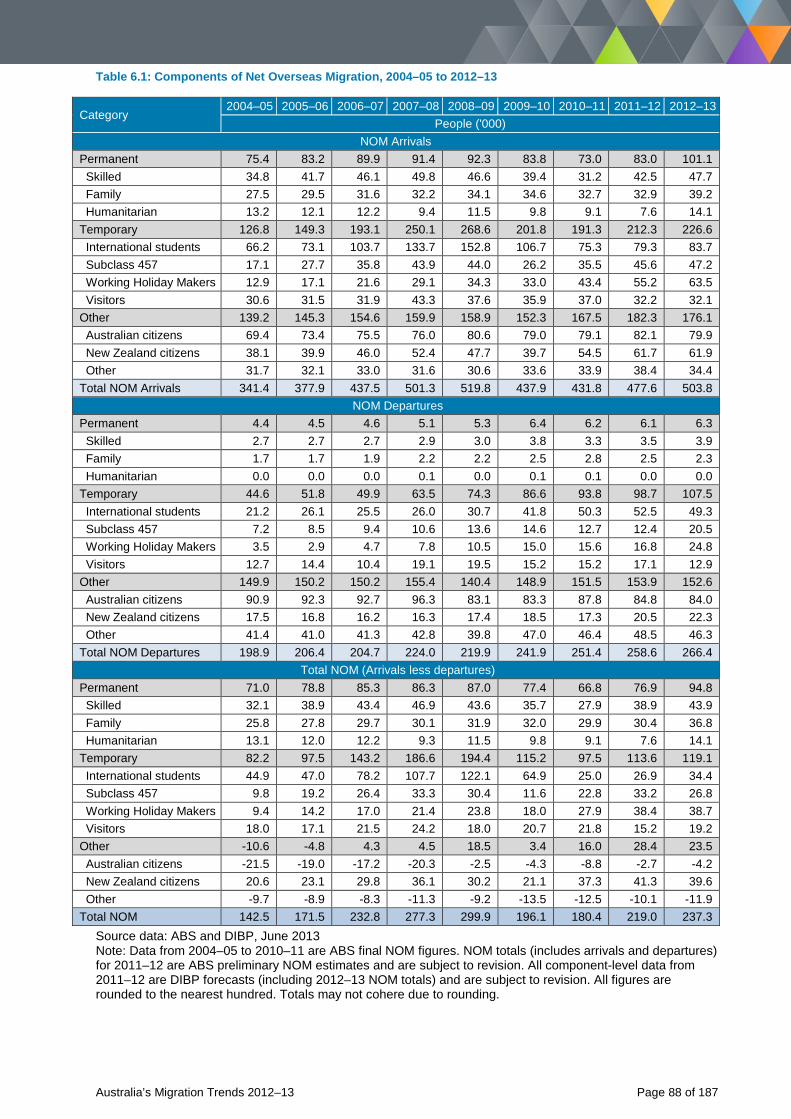
Table 6.1: Components of Net Overseas Migration, 2004–05 to 2012–13
Category 2004–05 2005–06 2006–07 2007–08 2008–09 2009–10 2010–11 2011–12 2012–13
People ('000) NOM Arrivals
Permanent 75.4 83.2 89.9 91.4 92.3 83.8 73.0 83.0 101.1 Skilled 34.8 41.7 46.1 49.8 46.6 39.4 31.2 42.5 47.7 Family 27.5 29.5 31.6 32.2 34.1 34.6 32.7 32.9 39.2 Humanitarian 13.2 12.1 12.2 9.4 11.5 9.8 9.1 7.6 14.1 Temporary 126.8 149.3 193.1 250.1 268.6 201.8 191.3 212.3 226.6 International students 66.2 73.1 103.7 133.7 152.8 106.7 75.3 79.3 83.7 Subclass 457 17.1 27.7 35.8 43.9 44.0 26.2 35.5 45.6 47.2 Working Holiday Makers 12.9 17.1 21.6 29.1 34.3 33.0 43.4 55.2 63.5 Visitors 30.6 31.5 31.9 43.3 37.6 35.9 37.0 32.2 32.1 Other 139.2 145.3 154.6 159.9 158.9 152.3 167.5 182.3 176.1 Australian citizens 69.4 73.4 75.5 76.0 80.6 79.0 79.1 82.1 79.9 New Zealand citizens 38.1 39.9 46.0 52.4 47.7 39.7 54.5 61.7 61.9 Other 31.7 32.1 33.0 31.6 30.6 33.6 33.9 38.4 34.4 Total NOM Arrivals 341.4 377.9 437.5 501.3 519.8 437.9 431.8 477.6 503.8
NOM Departures Permanent 4.4 4.5 4.6 5.1 5.3 6.4 6.2 6.1 6.3 Skilled 2.7 2.7 2.7 2.9 3.0 3.8 3.3 3.5 3.9 Family 1.7 1.7 1.9 2.2 2.2 2.5 2.8 2.5 2.3 Humanitarian 0.0 0.0 0.0 0.1 0.0 0.1 0.1 0.0 0.0 Temporary 44.6 51.8 49.9 63.5 74.3 86.6 93.8 98.7 107.5 International students 21.2 26.1 25.5 26.0 30.7 41.8 50.3 52.5 49.3 Subclass 457 7.2 8.5 9.4 10.6 13.6 14.6 12.7 12.4 20.5 Working Holiday Makers 3.5 2.9 4.7 7.8 10.5 15.0 15.6 16.8 24.8 Visitors 12.7 14.4 10.4 19.1 19.5 15.2 15.2 17.1 12.9 Other 149.9 150.2 150.2 155.4 140.4 148.9 151.5 153.9 152.6 Australian citizens 90.9 92.3 92.7 96.3 83.1 83.3 87.8 84.8 84.0 New Zealand citizens 17.5 16.8 16.2 16.3 17.4 18.5 17.3 20.5 22.3 Other 41.4 41.0 41.3 42.8 39.8 47.0 46.4 48.5 46.3 Total NOM Departures 198.9 206.4 204.7 224.0 219.9 241.9 251.4 258.6 266.4
Total NOM (Arrivals less departures) Permanent 71.0 78.8 85.3 86.3 87.0 77.4 66.8 76.9 94.8 Skilled 32.1 38.9 43.4 46.9 43.6 35.7 27.9 38.9 43.9 Family 25.8 27.8 29.7 30.1 31.9 32.0 29.9 30.4 36.8 Humanitarian 13.1 12.0 12.2 9.3 11.5 9.8 9.1 7.6 14.1 Temporary 82.2 97.5 143.2 186.6 194.4 115.2 97.5 113.6 119.1 International students 44.9 47.0 78.2 107.7 122.1 64.9 25.0 26.9 34.4 Subclass 457 9.8 19.2 26.4 33.3 30.4 11.6 22.8 33.2 26.8 Working Holiday Makers 9.4 14.2 17.0 21.4 23.8 18.0 27.9 38.4 38.7 Visitors 18.0 17.1 21.5 24.2 18.0 20.7 21.8 15.2 19.2 Other -10.6 -4.8 4.3 4.5 18.5 3.4 16.0 28.4 23.5 Australian citizens -21.5 -19.0 -17.2 -20.3 -2.5 -4.3 -8.8 -2.7 -4.2 New Zealand citizens 20.6 23.1 29.8 36.1 30.2 21.1 37.3 41.3 39.6 Other -9.7 -8.9 -8.3 -11.3 -9.2 -13.5 -12.5 -10.1 -11.9 Total NOM 142.5 171.5 232.8 277.3 299.9 196.1 180.4 219.0 237.3
Source data: ABS and DIBP, June 2013 Note: Data from 2004–05 to 2010–11 are ABS final NOM figures. NOM totals (includes arrivals and departures) for 2011–12 are ABS preliminary NOM estimates and are subject to revision. All component-level data from 2011–12 are DIBP forecasts (including 2012–13 NOM totals) and are subject to revision. All figures are rounded to the nearest hundred. Totals may not cohere due to rounding.
Australia’s Migration Trends 2012–13 Page 88 of 187
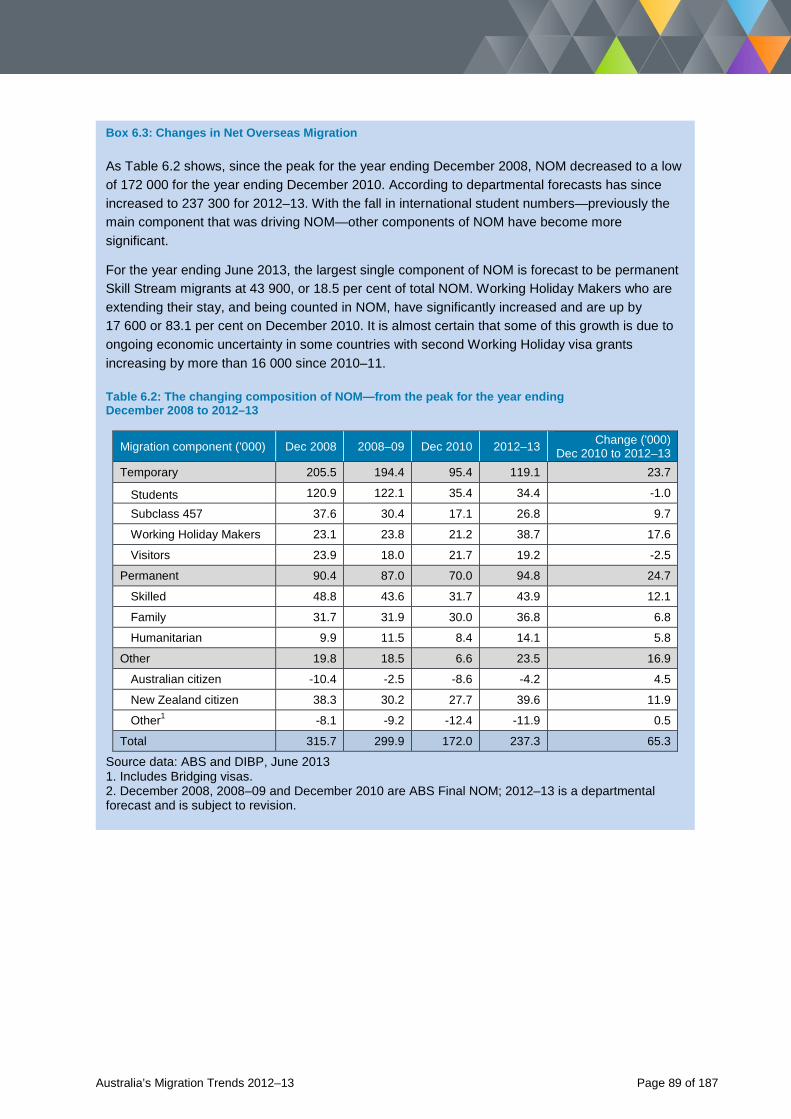
Box 6.3: Changes in Net Overseas Migration
As Table 6.2 shows, since the peak for the year ending December 2008, NOM decreased to a low of 172 000 for the year ending December 2010. According to departmental forecasts has since increased to 237 300 for 2012–13. With the fall in international student numbers—previously the main component that was driving NOM—other components of NOM have become more significant.
For the year ending June 2013, the largest single component of NOM is forecast to be permanent Skill Stream migrants at 43 900, or 18.5 per cent of total NOM. Working Holiday Makers who are extending their stay, and being counted in NOM, have significantly increased and are up by 17 600 or 83.1 per cent on December 2010. It is almost certain that some of this growth is due to ongoing economic uncertainty in some countries with second Working Holiday visa grants increasing by more than 16 000 since 2010–11.
Table 6.2: The changing composition of NOM—from the peak for the year ending December 2008 to 2012–13
Migration component ('000) Dec 2008 2008–09 Dec 2010 2012–13 Change ('000) Dec 2010 to 2012–13
Temporary 205.5 194.4 95.4 119.1 23.7
Students 120.9 122.1 35.4 34.4 -1.0
Subclass 457 37.6 30.4 17.1 26.8 9.7
Working Holiday Makers 23.1 23.8 21.2 38.7 17.6
Visitors 23.9 18.0 21.7 19.2 -2.5
Permanent 90.4 87.0 70.0 94.8 24.7
Skilled 48.8 43.6 31.7 43.9 12.1
Family 31.7 31.9 30.0 36.8 6.8
Humanitarian 9.9 11.5 8.4 14.1 5.8
Other 19.8 18.5 6.6 23.5 16.9
Australian citizen -10.4 -2.5 -8.6 -4.2 4.5
New Zealand citizen 38.3 30.2 27.7 39.6 11.9
Other1 -8.1 -9.2 -12.4 -11.9 0.5
Total 315.7 299.9 172.0 237.3 65.3
Source data: ABS and DIBP, June 2013 1. Includes Bridging visas. 2. December 2008, 2008–09 and December 2010 are ABS Final NOM; 2012–13 is a departmental forecast and is subject to revision.
Australia’s Migration Trends 2012–13 Page 89 of 187
6.4 Other aspects of Net Overseas Migration
6.4.1 Introduction So far, this chapter has examined NOM from a high-level perspective. In this sections, the chapter examines NOM in more detail. This includes:
• NOM by citizenship—reporting on the main source countries for people having an impact on Australia’s population through migration.
• Emigration—reporting on the birthplaces, destinations and other characteristics of citizens who have left Australia for 12 months or more.
• New Zealand movement—analysing the characteristics and movements of New Zealand citizens.
The data used in this analysis is from the Travellers’ Characteristics Database—owned and developed by the ABS—which contains information about all travellers along with their final NOM status. The information in the database is derived from overseas arrivals and departures data, which can be combined to determine if an individual is in or out of Australia’s estimated resident population, based on the rules in Box 6.1.
As the compilation of final NOM requires many months of overseas arrival and departures data, final NOM data is not available until 21 months after the reference quarter. At the time of writing the latest final NOM data available is for the December quarter 2011.
Australia’s Migration Trends 2012–13 Page 90 of 187
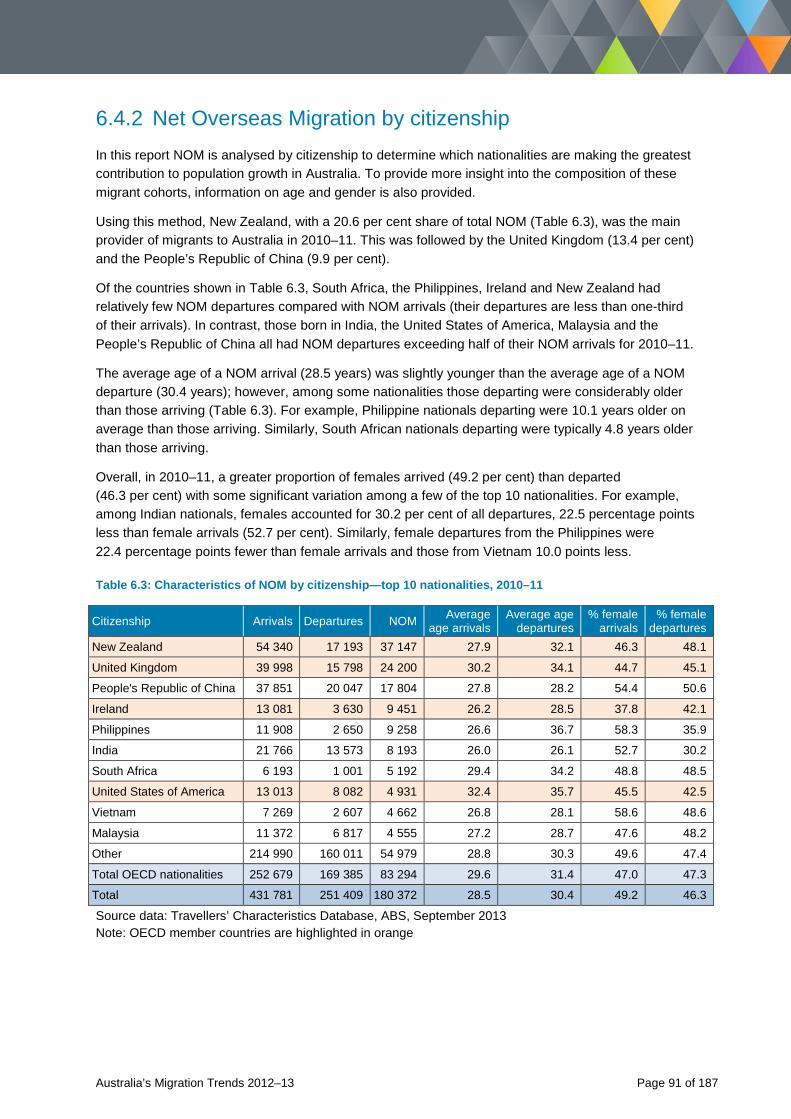
6.4.2 Net Overseas Migration by citizenship In this report NOM is analysed by citizenship to determine which nationalities are making the greatest contribution to population growth in Australia. To provide more insight into the composition of these migrant cohorts, information on age and gender is also provided.
Using this method, New Zealand, with a 20.6 per cent share of total NOM (Table 6.3), was the main provider of migrants to Australia in 2010–11. This was followed by the United Kingdom (13.4 per cent) and the People’s Republic of China (9.9 per cent).
Of the countries shown in Table 6.3, South Africa, the Philippines, Ireland and New Zealand had relatively few NOM departures compared with NOM arrivals (their departures are less than one-third of their arrivals). In contrast, those born in India, the United States of America, Malaysia and the People’s Republic of China all had NOM departures exceeding half of their NOM arrivals for 2010–11.
The average age of a NOM arrival (28.5 years) was slightly younger than the average age of a NOM departure (30.4 years); however, among some nationalities those departing were considerably older than those arriving (Table 6.3). For example, Philippine nationals departing were 10.1 years older on average than those arriving. Similarly, South African nationals departing were typically 4.8 years older than those arriving.
Overall, in 2010–11, a greater proportion of females arrived (49.2 per cent) than departed (46.3 per cent) with some significant variation among a few of the top 10 nationalities. For example, among Indian nationals, females accounted for 30.2 per cent of all departures, 22.5 percentage points less than female arrivals (52.7 per cent). Similarly, female departures from the Philippines were 22.4 percentage points fewer than female arrivals and those from Vietnam 10.0 points less.
Table 6.3: Characteristics of NOM by citizenship—top 10 nationalities, 2010–11
Citizenship Arrivals Departures NOM Average age arrivals
Average age departures
% female arrivals
% female departures
New Zealand 54 340 17 193 37 147 27.9 32.1 46.3 48.1
United Kingdom 39 998 15 798 24 200 30.2 34.1 44.7 45.1
People's Republic of China 37 851 20 047 17 804 27.8 28.2 54.4 50.6
Ireland 13 081 3 630 9 451 26.2 28.5 37.8 42.1
Philippines 11 908 2 650 9 258 26.6 36.7 58.3 35.9
India 21 766 13 573 8 193 26.0 26.1 52.7 30.2
South Africa 6 193 1 001 5 192 29.4 34.2 48.8 48.5
United States of America 13 013 8 082 4 931 32.4 35.7 45.5 42.5
Vietnam 7 269 2 607 4 662 26.8 28.1 58.6 48.6
Malaysia 11 372 6 817 4 555 27.2 28.7 47.6 48.2
Other 214 990 160 011 54 979 28.8 30.3 49.6 47.4
Total OECD nationalities 252 679 169 385 83 294 29.6 31.4 47.0 47.3
Total 431 781 251 409 180 372 28.5 30.4 49.2 46.3
Source data: Travellers’ Characteristics Database, ABS, September 2013 Note: OECD member countries are highlighted in orange
Australia’s Migration Trends 2012–13 Page 91 of 187
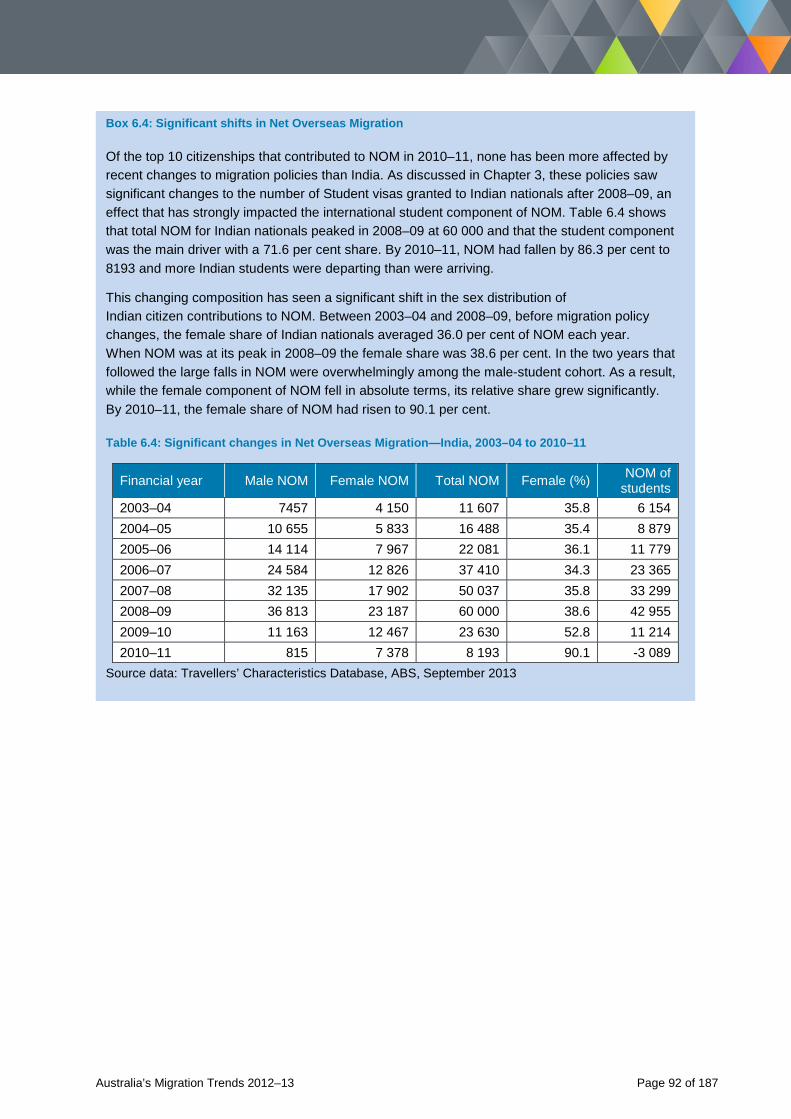
Box 6.4: Significant shifts in Net Overseas Migration
Of the top 10 citizenships that contributed to NOM in 2010–11, none has been more affected by recent changes to migration policies than India. As discussed in Chapter 3, these policies saw significant changes to the number of Student visas granted to Indian nationals after 2008–09, an effect that has strongly impacted the international student component of NOM. Table 6.4 shows that total NOM for Indian nationals peaked in 2008–09 at 60 000 and that the student component was the main driver with a 71.6 per cent share. By 2010–11, NOM had fallen by 86.3 per cent to 8193 and more Indian students were departing than were arriving.
This changing composition has seen a significant shift in the sex distribution of Indian citizen contributions to NOM. Between 2003–04 and 2008–09, before migration policy changes, the female share of Indian nationals averaged 36.0 per cent of NOM each year. When NOM was at its peak in 2008–09 the female share was 38.6 per cent. In the two years that followed the large falls in NOM were overwhelmingly among the male-student cohort. As a result, while the female component of NOM fell in absolute terms, its relative share grew significantly. By 2010–11, the female share of NOM had risen to 90.1 per cent.
Table 6.4: Significant changes in Net Overseas Migration—India, 2003–04 to 2010–11
Financial year Male NOM Female NOM Total NOM Female (%) NOM of students
2003–04 7457 4 150 11 607 35.8 6 154 2004–05 10 655 5 833 16 488 35.4 8 879 2005–06 14 114 7 967 22 081 36.1 11 779 2006–07 24 584 12 826 37 410 34.3 23 365 2007–08 32 135 17 902 50 037 35.8 33 299 2008–09 36 813 23 187 60 000 38.6 42 955 2009–10 11 163 12 467 23 630 52.8 11 214 2010–11 815 7 378 8 193 90.1 -3 089
Source data: Travellers’ Characteristics Database, ABS, September 2013
Australia’s Migration Trends 2012–13 Page 92 of 187
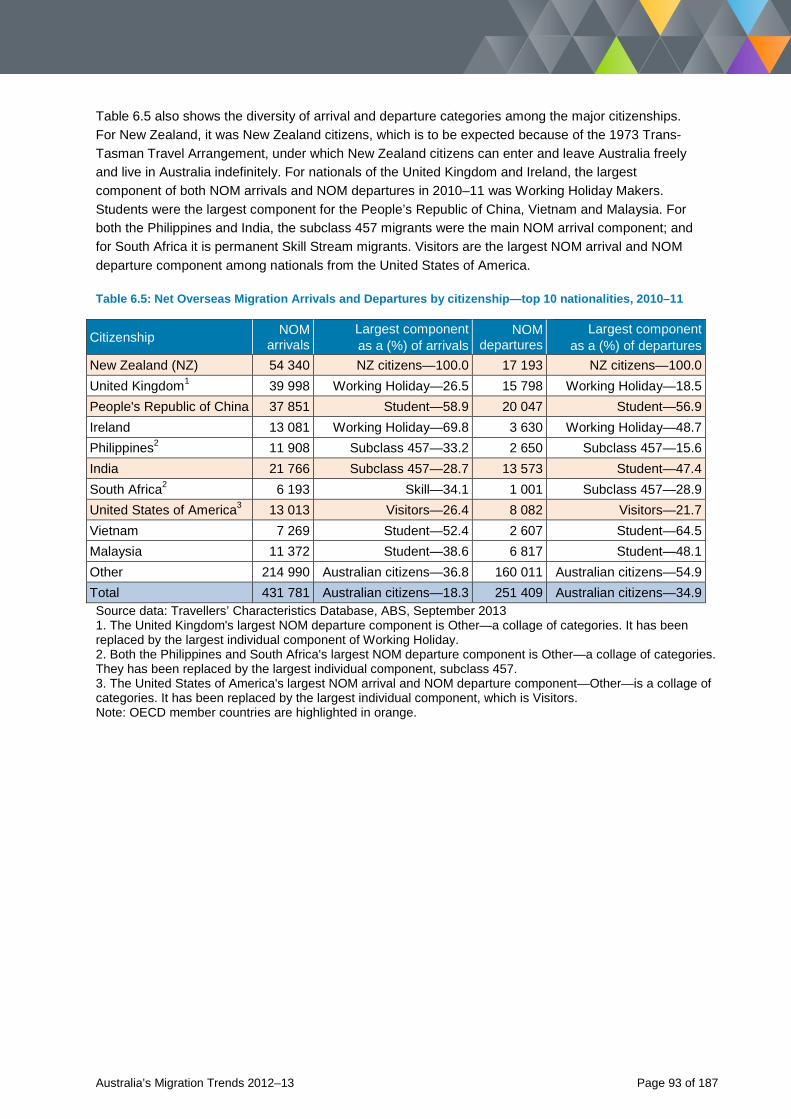
Table 6.5 also shows the diversity of arrival and departure categories among the major citizenships. For New Zealand, it was New Zealand citizens, which is to be expected because of the 1973 Trans-Tasman Travel Arrangement, under which New Zealand citizens can enter and leave Australia freely and live in Australia indefinitely. For nationals of the United Kingdom and Ireland, the largest component of both NOM arrivals and NOM departures in 2010–11 was Working Holiday Makers. Students were the largest component for the People’s Republic of China, Vietnam and Malaysia. For both the Philippines and India, the subclass 457 migrants were the main NOM arrival component; and for South Africa it is permanent Skill Stream migrants. Visitors are the largest NOM arrival and NOM departure component among nationals from the United States of America.
Table 6.5: Net Overseas Migration Arrivals and Departures by citizenship—top 10 nationalities, 2010–11
Citizenship NOM arrivals
Largest component as a (%) of arrivals
NOM departures
Largest component as a (%) of departures
New Zealand (NZ) 54 340 NZ citizens—100.0 17 193 NZ citizens—100.0 United Kingdom1 39 998 Working Holiday—26.5 15 798 Working Holiday—18.5 People's Republic of China 37 851 Student—58.9 20 047 Student—56.9 Ireland 13 081 Working Holiday—69.8 3 630 Working Holiday—48.7 Philippines2 11 908 Subclass 457—33.2 2 650 Subclass 457—15.6 India 21 766 Subclass 457—28.7 13 573 Student—47.4 South Africa2 6 193 Skill—34.1 1 001 Subclass 457—28.9 United States of America3 13 013 Visitors—26.4 8 082 Visitors—21.7 Vietnam 7 269 Student—52.4 2 607 Student—64.5 Malaysia 11 372 Student—38.6 6 817 Student—48.1 Other 214 990 Australian citizens—36.8 160 011 Australian citizens—54.9 Total 431 781 Australian citizens—18.3 251 409 Australian citizens—34.9 Source data: Travellers’ Characteristics Database, ABS, September 2013 1. The United Kingdom's largest NOM departure component is Other—a collage of categories. It has been replaced by the largest individual component of Working Holiday. 2. Both the Philippines and South Africa's largest NOM departure component is Other—a collage of categories. They has been replaced by the largest individual component, subclass 457. 3. The United States of America's largest NOM arrival and NOM departure component—Other—is a collage of categories. It has been replaced by the largest individual component, which is Visitors. Note: OECD member countries are highlighted in orange.
Australia’s Migration Trends 2012–13 Page 93 of 187
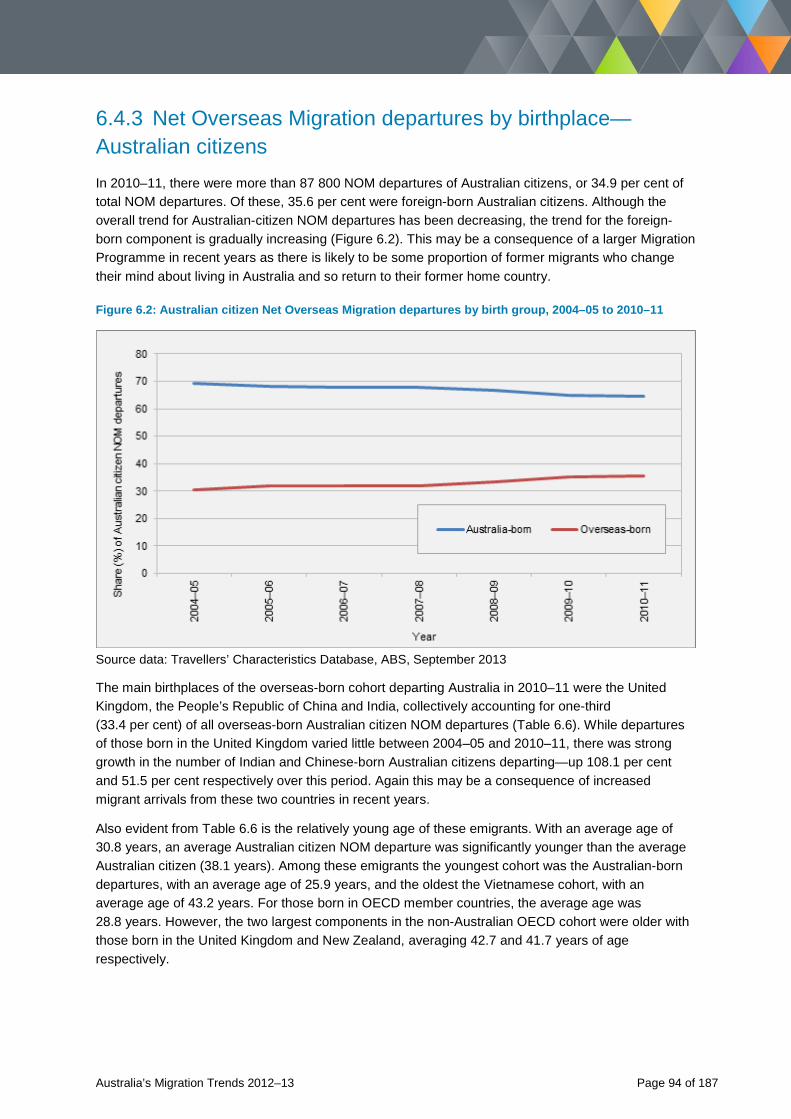
6.4.3 Net Overseas Migration departures by birthplace—Australian citizens In 2010–11, there were more than 87 800 NOM departures of Australian citizens, or 34.9 per cent of total NOM departures. Of these, 35.6 per cent were foreign-born Australian citizens. Although the overall trend for Australian-citizen NOM departures has been decreasing, the trend for the foreign-born component is gradually increasing (Figure 6.2). This may be a consequence of a larger Migration Programme in recent years as there is likely to be some proportion of former migrants who change their mind about living in Australia and so return to their former home country.
Figure 6.2: Australian citizen Net Overseas Migration departures by birth group, 2004–05 to 2010–11
Source data: Travellers’ Characteristics Database, ABS, September 2013
The main birthplaces of the overseas-born cohort departing Australia in 2010–11 were the United Kingdom, the People’s Republic of China and India, collectively accounting for one-third (33.4 per cent) of all overseas-born Australian citizen NOM departures (Table 6.6). While departures of those born in the United Kingdom varied little between 2004–05 and 2010–11, there was strong growth in the number of Indian and Chinese-born Australian citizens departing—up 108.1 per cent and 51.5 per cent respectively over this period. Again this may be a consequence of increased migrant arrivals from these two countries in recent years.
Also evident from Table 6.6 is the relatively young age of these emigrants. With an average age of 30.8 years, an average Australian citizen NOM departure was significantly younger than the average Australian citizen (38.1 years). Among these emigrants the youngest cohort was the Australian-born departures, with an average age of 25.9 years, and the oldest the Vietnamese cohort, with an average age of 43.2 years. For those born in OECD member countries, the average age was 28.8 years. However, the two largest components in the non-Australian OECD cohort were older with those born in the United Kingdom and New Zealand, averaging 42.7 and 41.7 years of age respectively.
Australia’s Migration Trends 2012–13 Page 94 of 187
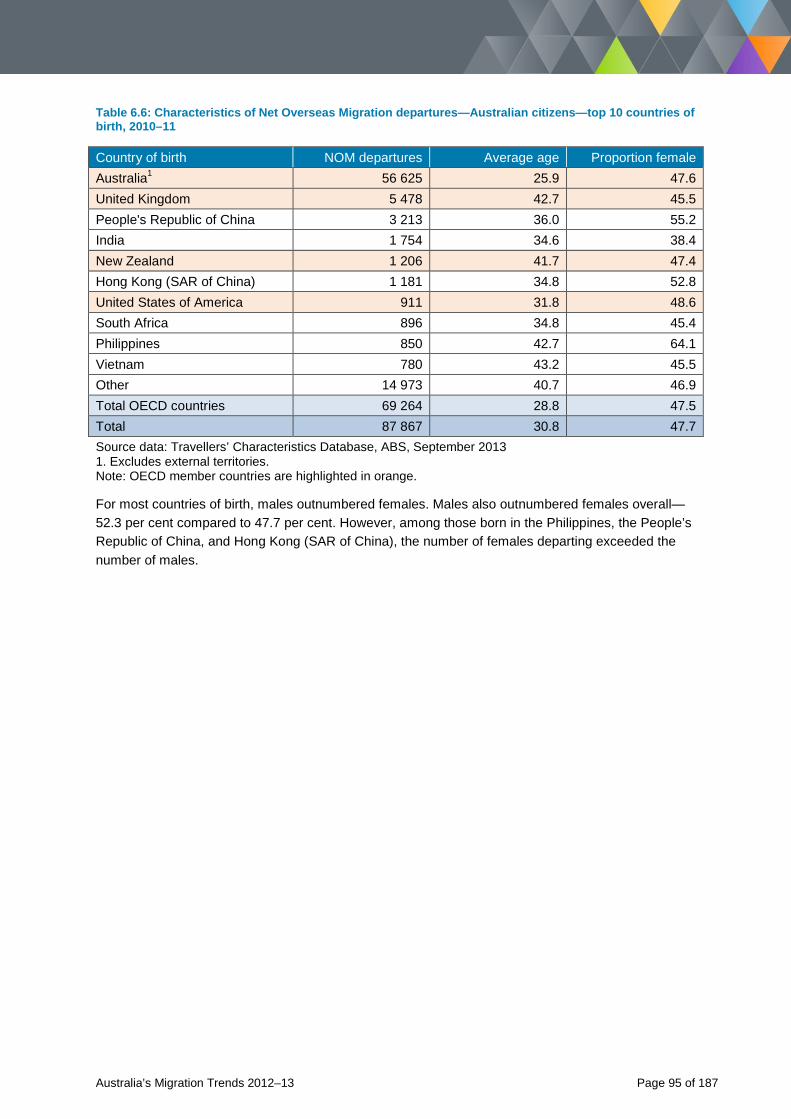
Table 6.6: Characteristics of Net Overseas Migration departures—Australian citizens—top 10 countries of birth, 2010–11
Country of birth NOM departures Average age Proportion female Australia1 56 625 25.9 47.6 United Kingdom 5 478 42.7 45.5 People's Republic of China 3 213 36.0 55.2 India 1 754 34.6 38.4 New Zealand 1 206 41.7 47.4 Hong Kong (SAR of China) 1 181 34.8 52.8 United States of America 911 31.8 48.6 South Africa 896 34.8 45.4 Philippines 850 42.7 64.1 Vietnam 780 43.2 45.5 Other 14 973 40.7 46.9 Total OECD countries 69 264 28.8 47.5 Total 87 867 30.8 47.7 Source data: Travellers’ Characteristics Database, ABS, September 2013 1. Excludes external territories. Note: OECD member countries are highlighted in orange.
For most countries of birth, males outnumbered females. Males also outnumbered females overall—52.3 per cent compared to 47.7 per cent. However, among those born in the Philippines, the People’s Republic of China, and Hong Kong (SAR of China), the number of females departing exceeded the number of males.
Australia’s Migration Trends 2012–13 Page 95 of 187
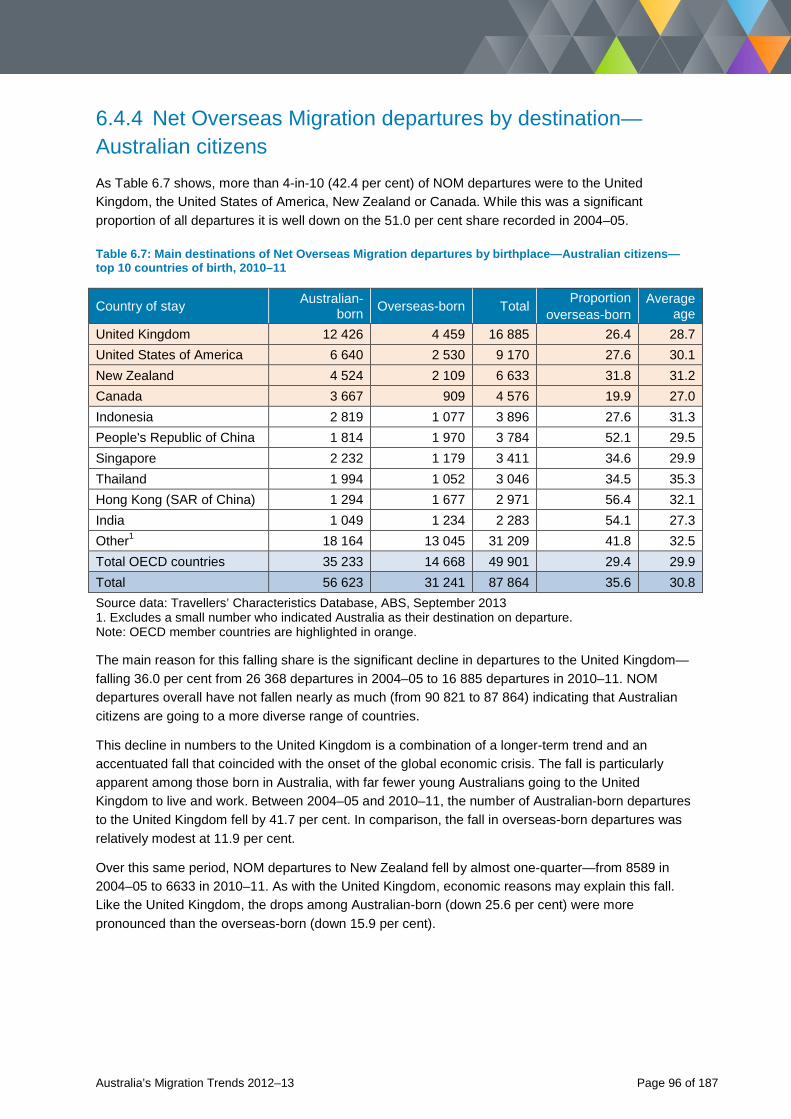
6.4.4 Net Overseas Migration departures by destination—Australian citizens As Table 6.7 shows, more than 4-in-10 (42.4 per cent) of NOM departures were to the United Kingdom, the United States of America, New Zealand or Canada. While this was a significant proportion of all departures it is well down on the 51.0 per cent share recorded in 2004–05.
Table 6.7: Main destinations of Net Overseas Migration departures by birthplace—Australian citizens—top 10 countries of birth, 2010–11
Country of stay Australian-born Overseas-born Total Proportion
overseas-born Average
age United Kingdom 12 426 4 459 16 885 26.4 28.7 United States of America 6 640 2 530 9 170 27.6 30.1 New Zealand 4 524 2 109 6 633 31.8 31.2 Canada 3 667 909 4 576 19.9 27.0 Indonesia 2 819 1 077 3 896 27.6 31.3 People's Republic of China 1 814 1 970 3 784 52.1 29.5 Singapore 2 232 1 179 3 411 34.6 29.9 Thailand 1 994 1 052 3 046 34.5 35.3 Hong Kong (SAR of China) 1 294 1 677 2 971 56.4 32.1 India 1 049 1 234 2 283 54.1 27.3 Other1 18 164 13 045 31 209 41.8 32.5 Total OECD countries 35 233 14 668 49 901 29.4 29.9 Total 56 623 31 241 87 864 35.6 30.8 Source data: Travellers’ Characteristics Database, ABS, September 2013 1. Excludes a small number who indicated Australia as their destination on departure. Note: OECD member countries are highlighted in orange.
The main reason for this falling share is the significant decline in departures to the United Kingdom—falling 36.0 per cent from 26 368 departures in 2004–05 to 16 885 departures in 2010–11. NOM departures overall have not fallen nearly as much (from 90 821 to 87 864) indicating that Australian citizens are going to a more diverse range of countries.
This decline in numbers to the United Kingdom is a combination of a longer-term trend and an accentuated fall that coincided with the onset of the global economic crisis. The fall is particularly apparent among those born in Australia, with far fewer young Australians going to the United Kingdom to live and work. Between 2004–05 and 2010–11, the number of Australian-born departures to the United Kingdom fell by 41.7 per cent. In comparison, the fall in overseas-born departures was relatively modest at 11.9 per cent.
Over this same period, NOM departures to New Zealand fell by almost one-quarter—from 8589 in 2004–05 to 6633 in 2010–11. As with the United Kingdom, economic reasons may explain this fall. Like the United Kingdom, the drops among Australian-born (down 25.6 per cent) were more pronounced than the overseas-born (down 15.9 per cent).
Australia’s Migration Trends 2012–13 Page 96 of 187
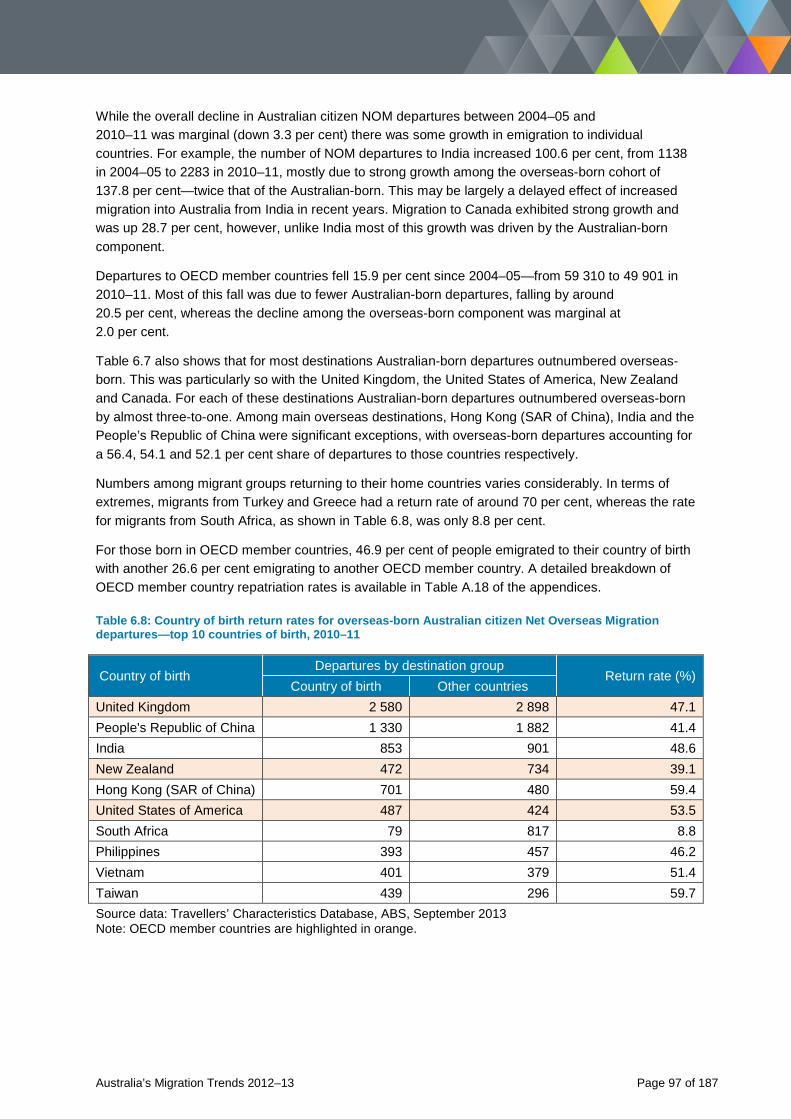
While the overall decline in Australian citizen NOM departures between 2004–05 and 2010–11 was marginal (down 3.3 per cent) there was some growth in emigration to individual countries. For example, the number of NOM departures to India increased 100.6 per cent, from 1138 in 2004–05 to 2283 in 2010–11, mostly due to strong growth among the overseas-born cohort of 137.8 per cent—twice that of the Australian-born. This may be largely a delayed effect of increased migration into Australia from India in recent years. Migration to Canada exhibited strong growth and was up 28.7 per cent, however, unlike India most of this growth was driven by the Australian-born component.
Departures to OECD member countries fell 15.9 per cent since 2004–05—from 59 310 to 49 901 in 2010–11. Most of this fall was due to fewer Australian-born departures, falling by around 20.5 per cent, whereas the decline among the overseas-born component was marginal at 2.0 per cent.
Table 6.7 also shows that for most destinations Australian-born departures outnumbered overseas-born. This was particularly so with the United Kingdom, the United States of America, New Zealand and Canada. For each of these destinations Australian-born departures outnumbered overseas-born by almost three-to-one. Among main overseas destinations, Hong Kong (SAR of China), India and the People’s Republic of China were significant exceptions, with overseas-born departures accounting for a 56.4, 54.1 and 52.1 per cent share of departures to those countries respectively.
Numbers among migrant groups returning to their home countries varies considerably. In terms of extremes, migrants from Turkey and Greece had a return rate of around 70 per cent, whereas the rate for migrants from South Africa, as shown in Table 6.8, was only 8.8 per cent.
For those born in OECD member countries, 46.9 per cent of people emigrated to their country of birth with another 26.6 per cent emigrating to another OECD member country. A detailed breakdown of OECD member country repatriation rates is available in Table A.18 of the appendices.
Table 6.8: Country of birth return rates for overseas-born Australian citizen Net Overseas Migration departures—top 10 countries of birth, 2010–11
Country of birth Departures by destination group
Return rate (%) Country of birth Other countries
United Kingdom 2 580 2 898 47.1 People's Republic of China 1 330 1 882 41.4 India 853 901 48.6 New Zealand 472 734 39.1 Hong Kong (SAR of China) 701 480 59.4 United States of America 487 424 53.5 South Africa 79 817 8.8 Philippines 393 457 46.2 Vietnam 401 379 51.4 Taiwan 439 296 59.7 Source data: Travellers’ Characteristics Database, ABS, September 2013 Note: OECD member countries are highlighted in orange.
Australia’s Migration Trends 2012–13 Page 97 of 187
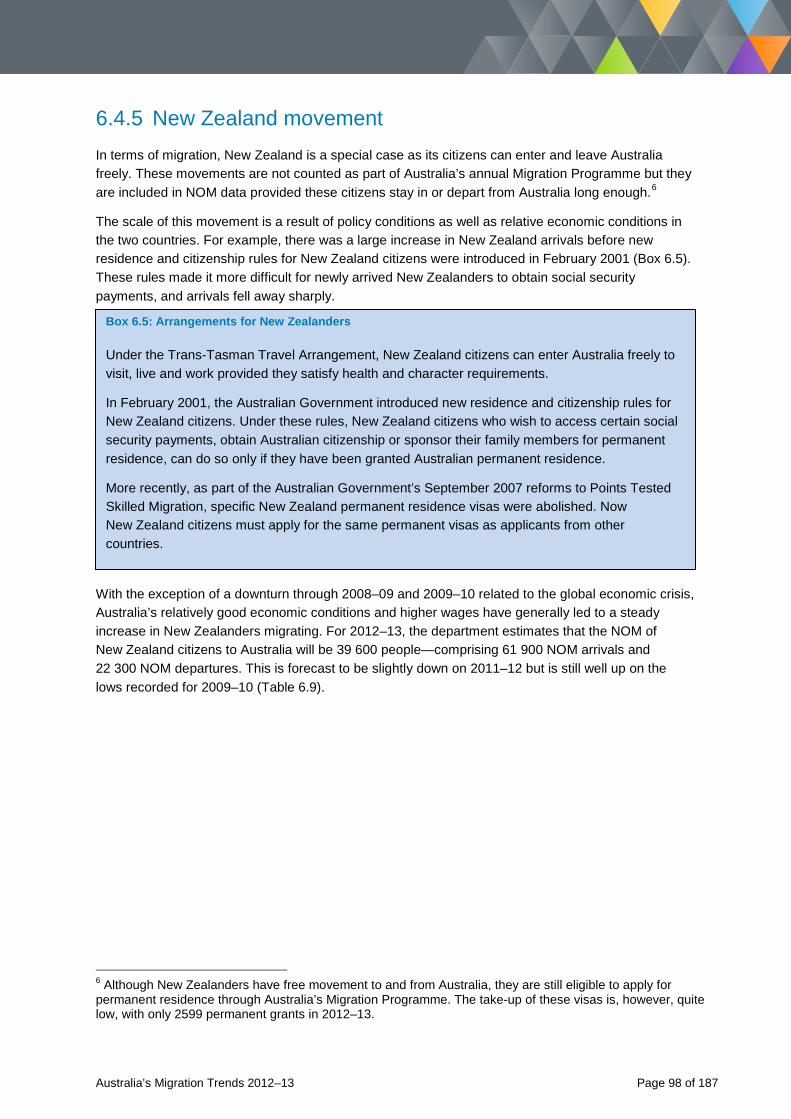
6.4.5 New Zealand movement In terms of migration, New Zealand is a special case as its citizens can enter and leave Australia freely. These movements are not counted as part of Australia’s annual Migration Programme but they are included in NOM data provided these citizens stay in or depart from Australia long enough.6
The scale of this movement is a result of policy conditions as well as relative economic conditions in the two countries. For example, there was a large increase in New Zealand arrivals before new residence and citizenship rules for New Zealand citizens were introduced in February 2001 (Box 6.5). These rules made it more difficult for newly arrived New Zealanders to obtain social security payments, and arrivals fell away sharply.
Box 6.5: Arrangements for New Zealanders
Under the Trans-Tasman Travel Arrangement, New Zealand citizens can enter Australia freely to visit, live and work provided they satisfy health and character requirements.
In February 2001, the Australian Government introduced new residence and citizenship rules for New Zealand citizens. Under these rules, New Zealand citizens who wish to access certain social security payments, obtain Australian citizenship or sponsor their family members for permanent residence, can do so only if they have been granted Australian permanent residence.
More recently, as part of the Australian Government’s September 2007 reforms to Points Tested Skilled Migration, specific New Zealand permanent residence visas were abolished. Now New Zealand citizens must apply for the same permanent visas as applicants from other countries.
With the exception of a downturn through 2008–09 and 2009–10 related to the global economic crisis, Australia’s relatively good economic conditions and higher wages have generally led to a steady increase in New Zealanders migrating. For 2012–13, the department estimates that the NOM of New Zealand citizens to Australia will be 39 600 people—comprising 61 900 NOM arrivals and 22 300 NOM departures. This is forecast to be slightly down on 2011–12 but is still well up on the lows recorded for 2009–10 (Table 6.9).
6 Although New Zealanders have free movement to and from Australia, they are still eligible to apply for permanent residence through Australia’s Migration Programme. The take-up of these visas is, however, quite low, with only 2599 permanent grants in 2012–13.
Australia’s Migration Trends 2012–13 Page 98 of 187
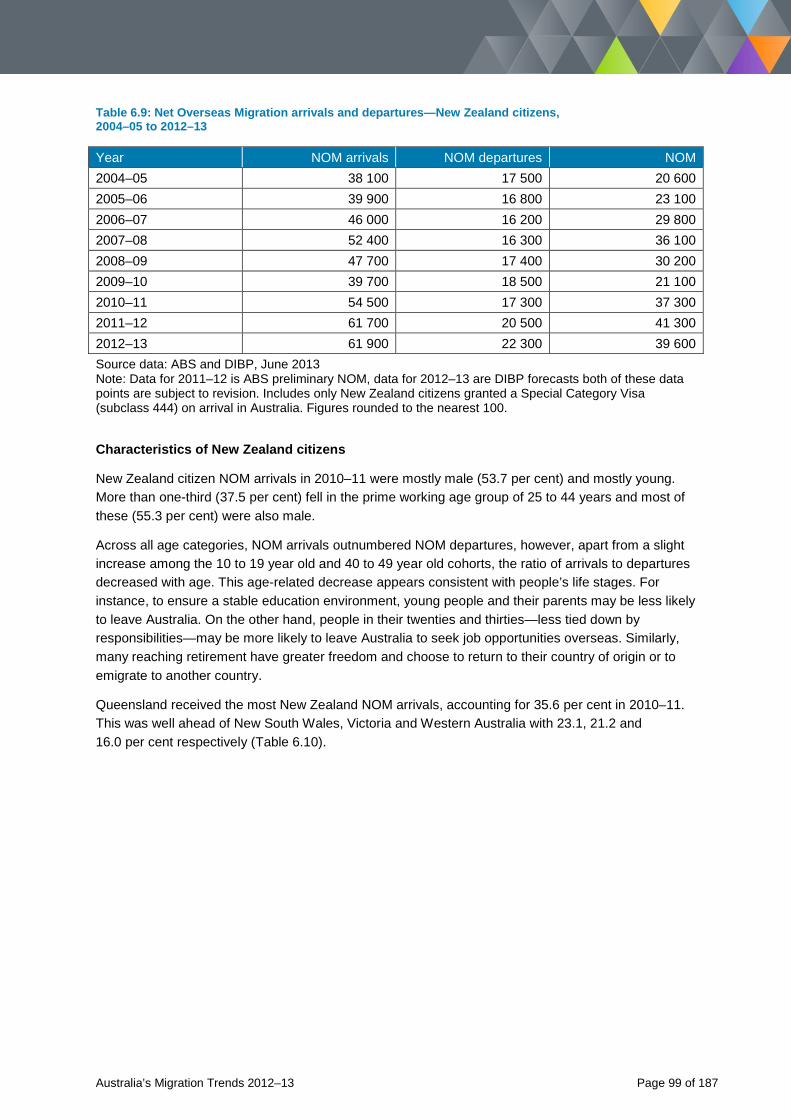
Table 6.9: Net Overseas Migration arrivals and departures—New Zealand citizens, 2004–05 to 2012–13
Year NOM arrivals NOM departures NOM 2004–05 38 100 17 500 20 600 2005–06 39 900 16 800 23 100 2006–07 46 000 16 200 29 800 2007–08 52 400 16 300 36 100 2008–09 47 700 17 400 30 200 2009–10 39 700 18 500 21 100 2010–11 54 500 17 300 37 300 2011–12 61 700 20 500 41 300 2012–13 61 900 22 300 39 600 Source data: ABS and DIBP, June 2013 Note: Data for 2011–12 is ABS preliminary NOM, data for 2012–13 are DIBP forecasts both of these data points are subject to revision. Includes only New Zealand citizens granted a Special Category Visa (subclass 444) on arrival in Australia. Figures rounded to the nearest 100.
Characteristics of New Zealand citizens
New Zealand citizen NOM arrivals in 2010–11 were mostly male (53.7 per cent) and mostly young. More than one-third (37.5 per cent) fell in the prime working age group of 25 to 44 years and most of these (55.3 per cent) were also male.
Across all age categories, NOM arrivals outnumbered NOM departures, however, apart from a slight increase among the 10 to 19 year old and 40 to 49 year old cohorts, the ratio of arrivals to departures decreased with age. This age-related decrease appears consistent with people’s life stages. For instance, to ensure a stable education environment, young people and their parents may be less likely to leave Australia. On the other hand, people in their twenties and thirties—less tied down by responsibilities—may be more likely to leave Australia to seek job opportunities overseas. Similarly, many reaching retirement have greater freedom and choose to return to their country of origin or to emigrate to another country.
Queensland received the most New Zealand NOM arrivals, accounting for 35.6 per cent in 2010–11. This was well ahead of New South Wales, Victoria and Western Australia with 23.1, 21.2 and 16.0 per cent respectively (Table 6.10).
Australia’s Migration Trends 2012–13 Page 99 of 187
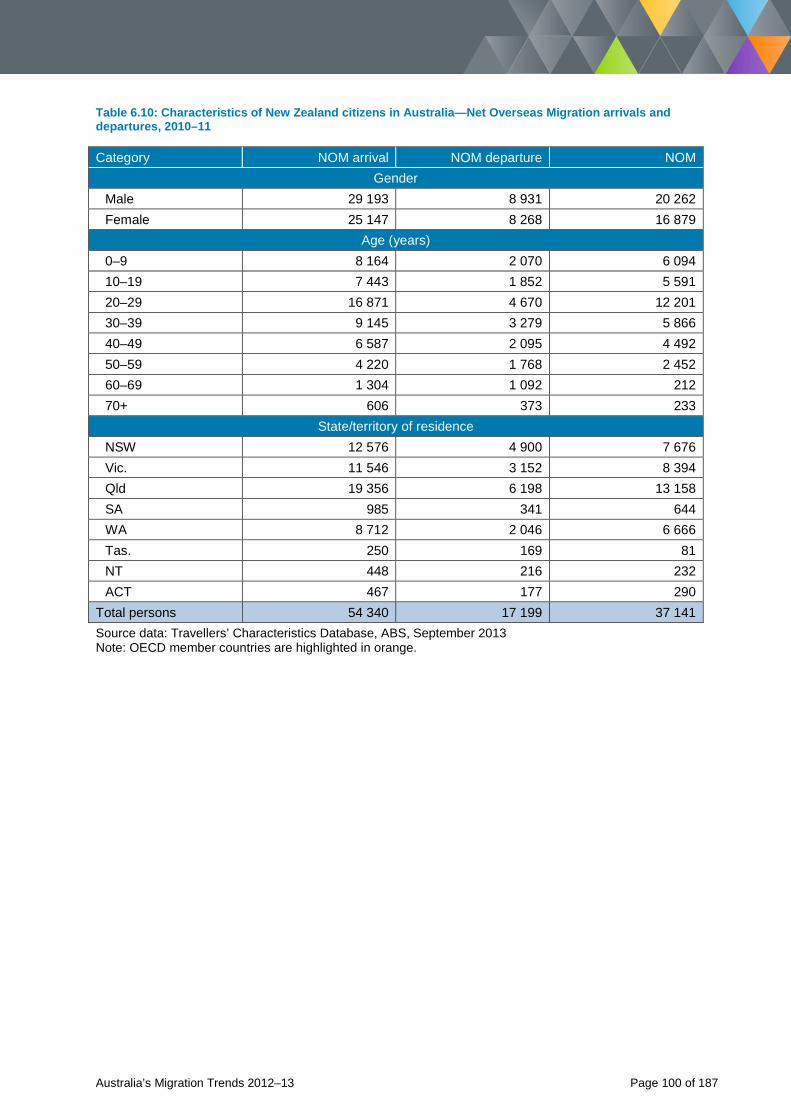
Table 6.10: Characteristics of New Zealand citizens in Australia—Net Overseas Migration arrivals and departures, 2010–11
Category NOM arrival NOM departure NOM Gender
Male 29 193 8 931 20 262 Female 25 147 8 268 16 879
Age (years) 0–9 8 164 2 070 6 094 10–19 7 443 1 852 5 591 20–29 16 871 4 670 12 201 30–39 9 145 3 279 5 866 40–49 6 587 2 095 4 492 50–59 4 220 1 768 2 452 60–69 1 304 1 092 212 70+ 606 373 233
State/territory of residence NSW 12 576 4 900 7 676 Vic. 11 546 3 152 8 394 Qld 19 356 6 198 13 158 SA 985 341 644 WA 8 712 2 046 6 666 Tas. 250 169 81 NT 448 216 232 ACT 467 177 290 Total persons 54 340 17 199 37 141 Source data: Travellers’ Characteristics Database, ABS, September 2013 Note: OECD member countries are highlighted in orange.
Australia’s Migration Trends 2012–13 Page 100 of 187
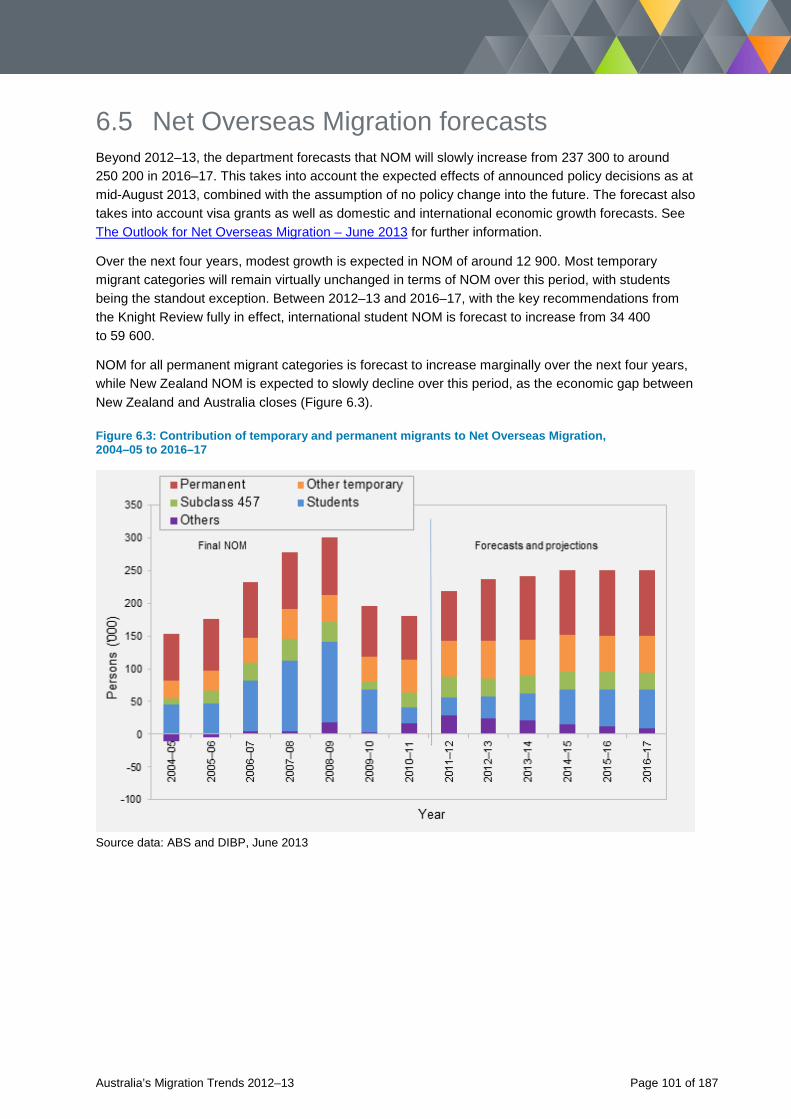
6.5 Net Overseas Migration forecasts Beyond 2012–13, the department forecasts that NOM will slowly increase from 237 300 to around 250 200 in 2016–17. This takes into account the expected effects of announced policy decisions as at mid-August 2013, combined with the assumption of no policy change into the future. The forecast also takes into account visa grants as well as domestic and international economic growth forecasts. See The Outlook for Net Overseas Migration – June 2013 for further information.
Over the next four years, modest growth is expected in NOM of around 12 900. Most temporary migrant categories will remain virtually unchanged in terms of NOM over this period, with students being the standout exception. Between 2012–13 and 2016–17, with the key recommendations from the Knight Review fully in effect, international student NOM is forecast to increase from 34 400 to 59 600.
NOM for all permanent migrant categories is forecast to increase marginally over the next four years, while New Zealand NOM is expected to slowly decline over this period, as the economic gap between New Zealand and Australia closes (Figure 6.3).
Figure 6.3: Contribution of temporary and permanent migrants to Net Overseas Migration, 2004–05 to 2016–17
Source data: ABS and DIBP, June 2013
Australia’s Migration Trends 2012–13 Page 101 of 187

This page has been left intentionally blank.
Australia’s Migration Trends 2012–13 Page 102 of 187

Chapter 7: Australia’s population
Australia’s Migration Trends 2012–13 Page 103 of 187
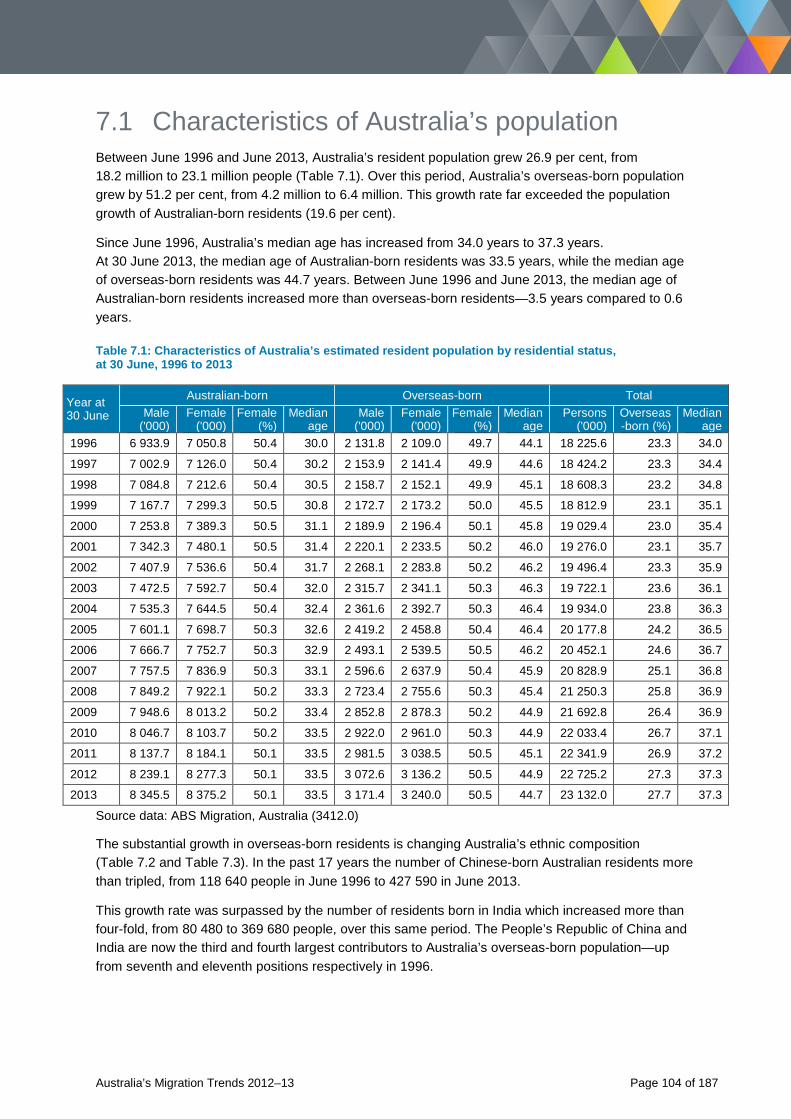
7.1 Characteristics of Australia’s population Between June 1996 and June 2013, Australia’s resident population grew 26.9 per cent, from 18.2 million to 23.1 million people (Table 7.1). Over this period, Australia’s overseas-born population grew by 51.2 per cent, from 4.2 million to 6.4 million. This growth rate far exceeded the population growth of Australian-born residents (19.6 per cent).
Since June 1996, Australia’s median age has increased from 34.0 years to 37.3 years. At 30 June 2013, the median age of Australian-born residents was 33.5 years, while the median age of overseas-born residents was 44.7 years. Between June 1996 and June 2013, the median age of Australian-born residents increased more than overseas-born residents—3.5 years compared to 0.6 years.
Table 7.1: Characteristics of Australia’s estimated resident population by residential status, at 30 June, 1996 to 2013
Year at 30 June
Australian-born Overseas-born Total Male
('000) Female ('000)
Female (%)
Median age
Male ('000)
Female ('000)
Female (%)
Median age
Persons ('000)
Overseas-born (%)
Median age
1996 6 933.9 7 050.8 50.4 30.0 2 131.8 2 109.0 49.7 44.1 18 225.6 23.3 34.0
1997 7 002.9 7 126.0 50.4 30.2 2 153.9 2 141.4 49.9 44.6 18 424.2 23.3 34.4
1998 7 084.8 7 212.6 50.4 30.5 2 158.7 2 152.1 49.9 45.1 18 608.3 23.2 34.8
1999 7 167.7 7 299.3 50.5 30.8 2 172.7 2 173.2 50.0 45.5 18 812.9 23.1 35.1
2000 7 253.8 7 389.3 50.5 31.1 2 189.9 2 196.4 50.1 45.8 19 029.4 23.0 35.4
2001 7 342.3 7 480.1 50.5 31.4 2 220.1 2 233.5 50.2 46.0 19 276.0 23.1 35.7
2002 7 407.9 7 536.6 50.4 31.7 2 268.1 2 283.8 50.2 46.2 19 496.4 23.3 35.9
2003 7 472.5 7 592.7 50.4 32.0 2 315.7 2 341.1 50.3 46.3 19 722.1 23.6 36.1
2004 7 535.3 7 644.5 50.4 32.4 2 361.6 2 392.7 50.3 46.4 19 934.0 23.8 36.3
2005 7 601.1 7 698.7 50.3 32.6 2 419.2 2 458.8 50.4 46.4 20 177.8 24.2 36.5
2006 7 666.7 7 752.7 50.3 32.9 2 493.1 2 539.5 50.5 46.2 20 452.1 24.6 36.7
2007 7 757.5 7 836.9 50.3 33.1 2 596.6 2 637.9 50.4 45.9 20 828.9 25.1 36.8
2008 7 849.2 7 922.1 50.2 33.3 2 723.4 2 755.6 50.3 45.4 21 250.3 25.8 36.9
2009 7 948.6 8 013.2 50.2 33.4 2 852.8 2 878.3 50.2 44.9 21 692.8 26.4 36.9
2010 8 046.7 8 103.7 50.2 33.5 2 922.0 2 961.0 50.3 44.9 22 033.4 26.7 37.1
2011 8 137.7 8 184.1 50.1 33.5 2 981.5 3 038.5 50.5 45.1 22 341.9 26.9 37.2
2012 8 239.1 8 277.3 50.1 33.5 3 072.6 3 136.2 50.5 44.9 22 725.2 27.3 37.3
2013 8 345.5 8 375.2 50.1 33.5 3 171.4 3 240.0 50.5 44.7 23 132.0 27.7 37.3
Source data: ABS Migration, Australia (3412.0)
The substantial growth in overseas-born residents is changing Australia’s ethnic composition (Table 7.2 and Table 7.3). In the past 17 years the number of Chinese-born Australian residents more than tripled, from 118 640 people in June 1996 to 427 590 in June 2013.
This growth rate was surpassed by the number of residents born in India which increased more than four-fold, from 80 480 to 369 680 people, over this same period. The People’s Republic of China and India are now the third and fourth largest contributors to Australia’s overseas-born population—up from seventh and eleventh positions respectively in 1996.
Australia’s Migration Trends 2012–13 Page 104 of 187
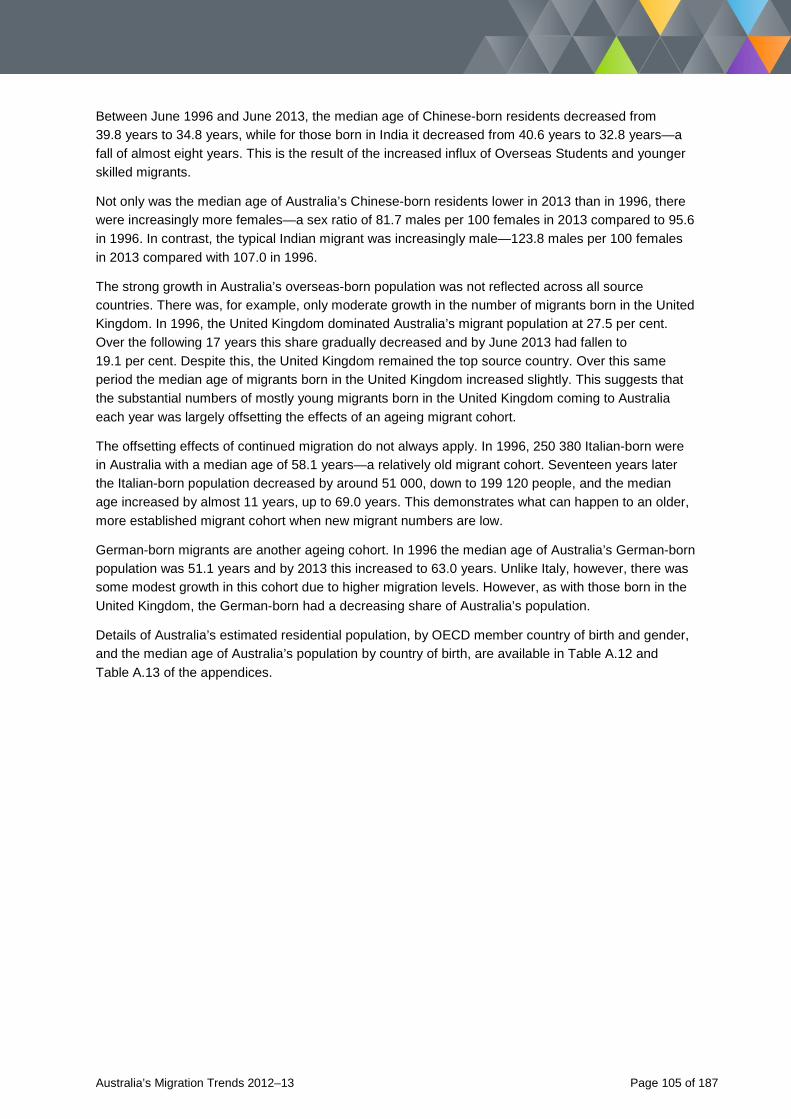
Between June 1996 and June 2013, the median age of Chinese-born residents decreased from 39.8 years to 34.8 years, while for those born in India it decreased from 40.6 years to 32.8 years—a fall of almost eight years. This is the result of the increased influx of Overseas Students and younger skilled migrants.
Not only was the median age of Australia’s Chinese-born residents lower in 2013 than in 1996, there were increasingly more females—a sex ratio of 81.7 males per 100 females in 2013 compared to 95.6 in 1996. In contrast, the typical Indian migrant was increasingly male—123.8 males per 100 females in 2013 compared with 107.0 in 1996.
The strong growth in Australia’s overseas-born population was not reflected across all source countries. There was, for example, only moderate growth in the number of migrants born in the United Kingdom. In 1996, the United Kingdom dominated Australia’s migrant population at 27.5 per cent. Over the following 17 years this share gradually decreased and by June 2013 had fallen to 19.1 per cent. Despite this, the United Kingdom remained the top source country. Over this same period the median age of migrants born in the United Kingdom increased slightly. This suggests that the substantial numbers of mostly young migrants born in the United Kingdom coming to Australia each year was largely offsetting the effects of an ageing migrant cohort.
The offsetting effects of continued migration do not always apply. In 1996, 250 380 Italian-born were in Australia with a median age of 58.1 years—a relatively old migrant cohort. Seventeen years later the Italian-born population decreased by around 51 000, down to 199 120 people, and the median age increased by almost 11 years, up to 69.0 years. This demonstrates what can happen to an older, more established migrant cohort when new migrant numbers are low.
German-born migrants are another ageing cohort. In 1996 the median age of Australia’s German-born population was 51.1 years and by 2013 this increased to 63.0 years. Unlike Italy, however, there was some modest growth in this cohort due to higher migration levels. However, as with those born in the United Kingdom, the German-born had a decreasing share of Australia’s population.
Details of Australia’s estimated residential population, by OECD member country of birth and gender, and the median age of Australia’s population by country of birth, are available in Table A.12 and Table A.13 of the appendices.
Australia’s Migration Trends 2012–13 Page 105 of 187
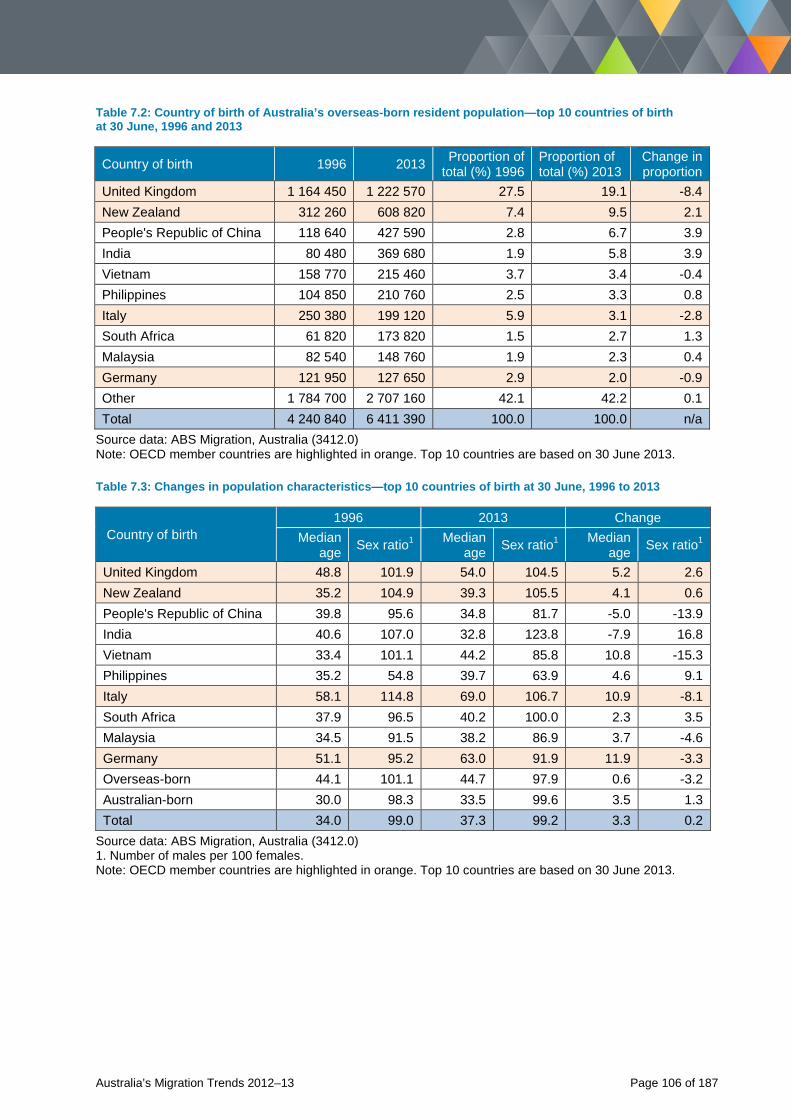
Table 7.2: Country of birth of Australia’s overseas-born resident population—top 10 countries of birth at 30 June, 1996 and 2013
Country of birth 1996 2013 Proportion of total (%) 1996
Proportion of total (%) 2013
Change in proportion
United Kingdom 1 164 450 1 222 570 27.5 19.1 -8.4 New Zealand 312 260 608 820 7.4 9.5 2.1 People's Republic of China 118 640 427 590 2.8 6.7 3.9 India 80 480 369 680 1.9 5.8 3.9 Vietnam 158 770 215 460 3.7 3.4 -0.4 Philippines 104 850 210 760 2.5 3.3 0.8 Italy 250 380 199 120 5.9 3.1 -2.8 South Africa 61 820 173 820 1.5 2.7 1.3 Malaysia 82 540 148 760 1.9 2.3 0.4 Germany 121 950 127 650 2.9 2.0 -0.9 Other 1 784 700 2 707 160 42.1 42.2 0.1 Total 4 240 840 6 411 390 100.0 100.0 n/a
Source data: ABS Migration, Australia (3412.0) Note: OECD member countries are highlighted in orange. Top 10 countries are based on 30 June 2013.
Table 7.3: Changes in population characteristics—top 10 countries of birth at 30 June, 1996 to 2013
Country of birth 1996 2013 Change
Median age Sex ratio1 Median
age Sex ratio1 Median age Sex ratio1
United Kingdom 48.8 101.9 54.0 104.5 5.2 2.6 New Zealand 35.2 104.9 39.3 105.5 4.1 0.6 People's Republic of China 39.8 95.6 34.8 81.7 -5.0 -13.9 India 40.6 107.0 32.8 123.8 -7.9 16.8 Vietnam 33.4 101.1 44.2 85.8 10.8 -15.3 Philippines 35.2 54.8 39.7 63.9 4.6 9.1 Italy 58.1 114.8 69.0 106.7 10.9 -8.1 South Africa 37.9 96.5 40.2 100.0 2.3 3.5 Malaysia 34.5 91.5 38.2 86.9 3.7 -4.6 Germany 51.1 95.2 63.0 91.9 11.9 -3.3 Overseas-born 44.1 101.1 44.7 97.9 0.6 -3.2 Australian-born 30.0 98.3 33.5 99.6 3.5 1.3 Total 34.0 99.0 37.3 99.2 3.3 0.2
Source data: ABS Migration, Australia (3412.0) 1. Number of males per 100 females. Note: OECD member countries are highlighted in orange. Top 10 countries are based on 30 June 2013.
Australia’s Migration Trends 2012–13 Page 106 of 187
7.2 Temporary entrants in Australia Temporary entrants include visitors, Overseas Students, Working Holiday Makers, business people and executives, and entrants for social, cultural, international relations and training purposes. They also include people who hold a Bridging visa and who are awaiting the outcome of an application for a permanent or other substantive visa, such as asylum seekers.
Temporary entrants are included in this chapter because they are considered to be part of Australia’s resident population if they have lived here for 12 months or more in a 16-month period (see Chapter 6: Net Overseas Migration for more detail). For this reason, this chapter also discusses in detail Students, Temporary Work (Skilled) visa holders and Working Holiday Makers—temporary entrants who can legitimately stay in Australia for more than 12 months. The chapter does not identify the number of temporary entrants counted in Australia’s resident population, but instead provides a snapshot of all temporary entrants in Australia at a point in time, regardless of their length of stay. The analyses excludes New Zealand citizens who are not necessarily temporary entrants as they may stay in Australia as long as they choose.
At 30 June 2013, more than 1 million people in Australia were on a temporary visa—an increase of 39 360 people or 4.0 per cent from the same time the previous year (Table 7.4). Most of this increase in temporary entrants was due to a greater number of Temporary Work (Skilled) residents (up by 28 940 people) and Working Holiday Maker visa holders (up by 23 910 people). A reduction in the number of grants of Student visas over the past four years, of around 20 per cent on average since its peak in 2008–09, has resulted in a further fall in the stock of Overseas Students in Australia (down by 2790 people).
Of the top five nationalities, the most significant increase between 30 June of 2012 and 2013 was recorded for the United Kingdom (up by 19 460 people), with sizable increases for the People’s Republic of China and Ireland (up by 3410 and 2620 people respectively). Over this same period the number of Indian nationals fell by 8670 people—a continuation of a fall from a peak of 143 840 people at 30 June 2010 to 118 540 people at 30 June 2013. This extended decline is largely a delayed flow-on effect of opposing changes in the number of Student visa grants to Indian nationals in 2008–09 and 2009–10, when onshore visa grants increased sharply while offshore visa grants fell even more sharply.
Australia’s Migration Trends 2012–13 Page 107 of 187
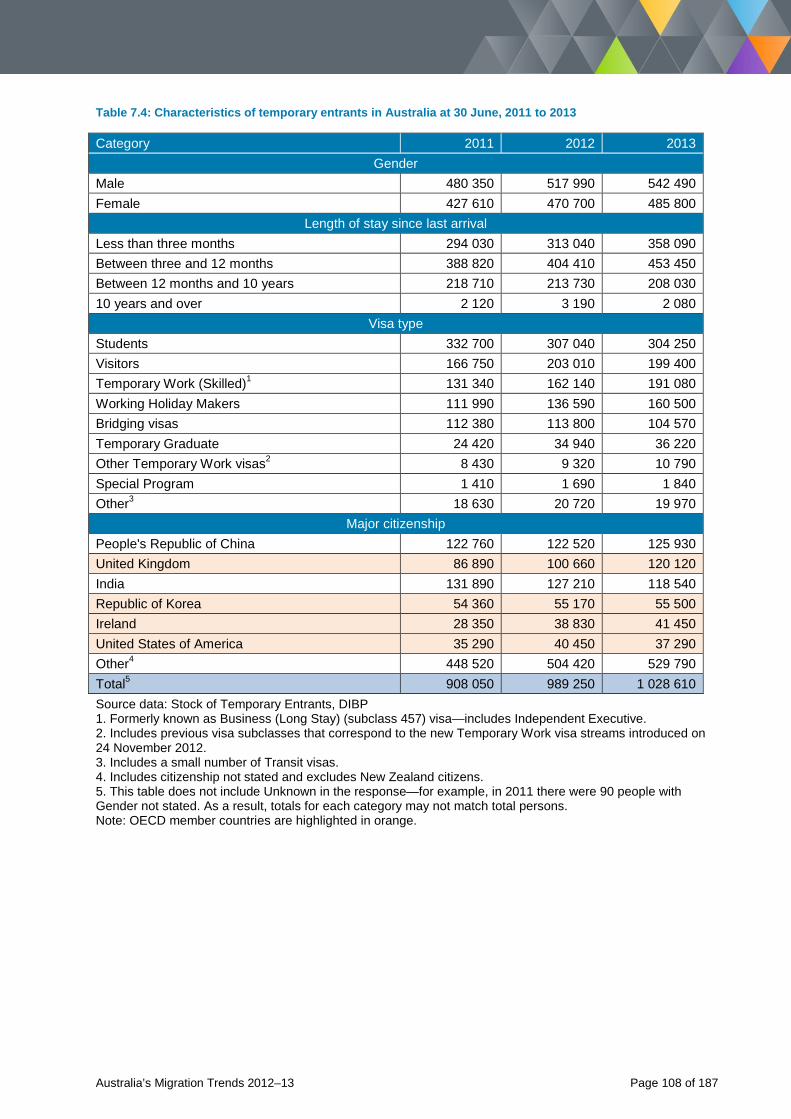
Table 7.4: Characteristics of temporary entrants in Australia at 30 June, 2011 to 2013
Category 2011 2012 2013 Gender
Male 480 350 517 990 542 490 Female 427 610 470 700 485 800
Length of stay since last arrival Less than three months 294 030 313 040 358 090 Between three and 12 months 388 820 404 410 453 450 Between 12 months and 10 years 218 710 213 730 208 030 10 years and over 2 120 3 190 2 080
Visa type Students 332 700 307 040 304 250 Visitors 166 750 203 010 199 400 Temporary Work (Skilled)1 131 340 162 140 191 080 Working Holiday Makers 111 990 136 590 160 500 Bridging visas 112 380 113 800 104 570 Temporary Graduate 24 420 34 940 36 220 Other Temporary Work visas2 8 430 9 320 10 790 Special Program 1 410 1 690 1 840 Other3 18 630 20 720 19 970
Major citizenship People's Republic of China 122 760 122 520 125 930 United Kingdom 86 890 100 660 120 120 India 131 890 127 210 118 540 Republic of Korea 54 360 55 170 55 500 Ireland 28 350 38 830 41 450 United States of America 35 290 40 450 37 290 Other4 448 520 504 420 529 790 Total5 908 050 989 250 1 028 610 Source data: Stock of Temporary Entrants, DIBP 1. Formerly known as Business (Long Stay) (subclass 457) visa—includes Independent Executive. 2. Includes previous visa subclasses that correspond to the new Temporary Work visa streams introduced on 24 November 2012. 3. Includes a small number of Transit visas. 4. Includes citizenship not stated and excludes New Zealand citizens. 5. This table does not include Unknown in the response—for example, in 2011 there were 90 people with Gender not stated. As a result, totals for each category may not match total persons. Note: OECD member countries are highlighted in orange.
Australia’s Migration Trends 2012–13 Page 108 of 187
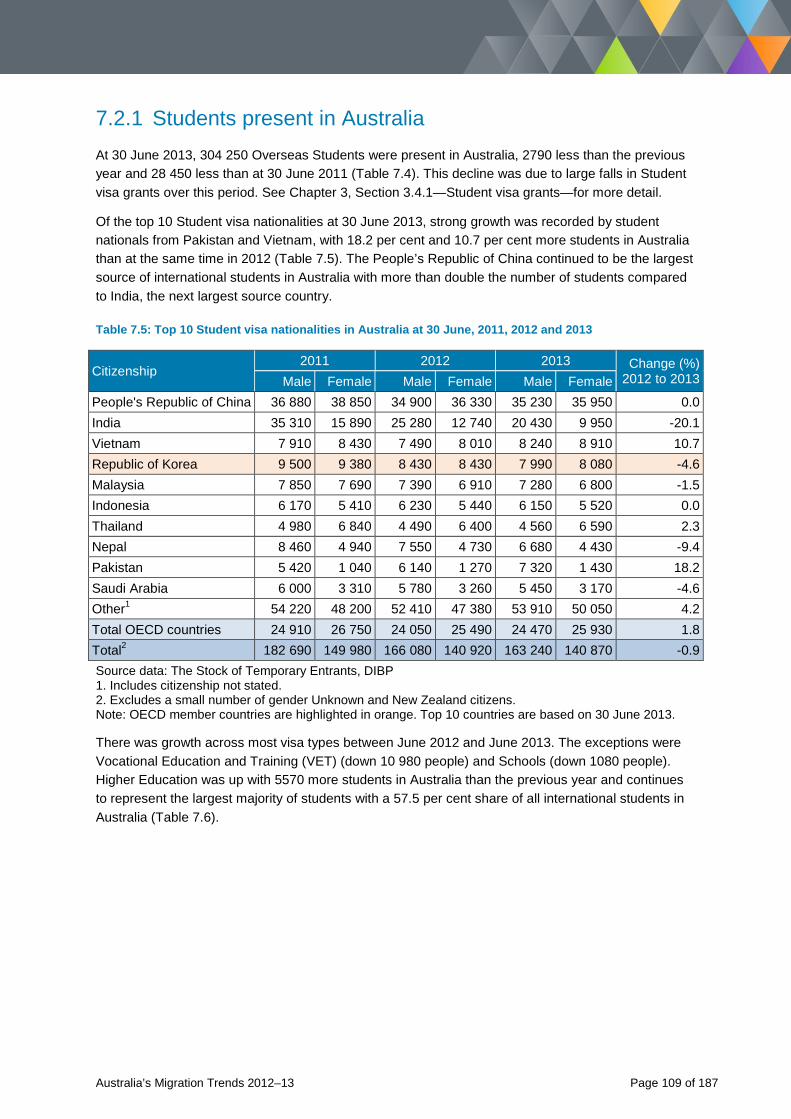
7.2.1 Students present in Australia At 30 June 2013, 304 250 Overseas Students were present in Australia, 2790 less than the previous year and 28 450 less than at 30 June 2011 (Table 7.4). This decline was due to large falls in Student visa grants over this period. See Chapter 3, Section 3.4.1—Student visa grants—for more detail.
Of the top 10 Student visa nationalities at 30 June 2013, strong growth was recorded by student nationals from Pakistan and Vietnam, with 18.2 per cent and 10.7 per cent more students in Australia than at the same time in 2012 (Table 7.5). The People’s Republic of China continued to be the largest source of international students in Australia with more than double the number of students compared to India, the next largest source country.
Table 7.5: Top 10 Student visa nationalities in Australia at 30 June, 2011, 2012 and 2013
Citizenship 2011 2012 2013 Change (%)
2012 to 2013 Male Female Male Female Male Female People's Republic of China 36 880 38 850 34 900 36 330 35 230 35 950 0.0 India 35 310 15 890 25 280 12 740 20 430 9 950 -20.1 Vietnam 7 910 8 430 7 490 8 010 8 240 8 910 10.7 Republic of Korea 9 500 9 380 8 430 8 430 7 990 8 080 -4.6 Malaysia 7 850 7 690 7 390 6 910 7 280 6 800 -1.5 Indonesia 6 170 5 410 6 230 5 440 6 150 5 520 0.0 Thailand 4 980 6 840 4 490 6 400 4 560 6 590 2.3 Nepal 8 460 4 940 7 550 4 730 6 680 4 430 -9.4 Pakistan 5 420 1 040 6 140 1 270 7 320 1 430 18.2 Saudi Arabia 6 000 3 310 5 780 3 260 5 450 3 170 -4.6 Other1 54 220 48 200 52 410 47 380 53 910 50 050 4.2 Total OECD countries 24 910 26 750 24 050 25 490 24 470 25 930 1.8 Total2 182 690 149 980 166 080 140 920 163 240 140 870 -0.9 Source data: The Stock of Temporary Entrants, DIBP 1. Includes citizenship not stated. 2. Excludes a small number of gender Unknown and New Zealand citizens. Note: OECD member countries are highlighted in orange. Top 10 countries are based on 30 June 2013.
There was growth across most visa types between June 2012 and June 2013. The exceptions were Vocational Education and Training (VET) (down 10 980 people) and Schools (down 1080 people). Higher Education was up with 5570 more students in Australia than the previous year and continues to represent the largest majority of students with a 57.5 per cent share of all international students in Australia (Table 7.6).
Australia’s Migration Trends 2012–13 Page 109 of 187
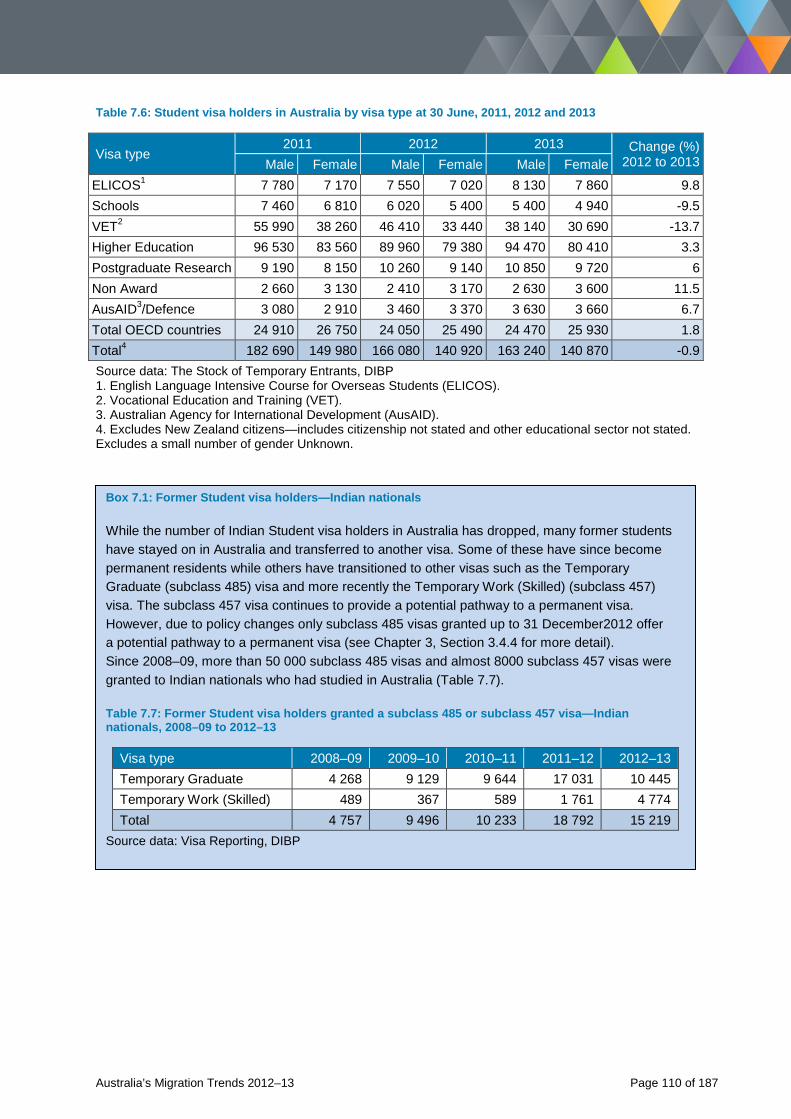
Table 7.6: Student visa holders in Australia by visa type at 30 June, 2011, 2012 and 2013
Visa type 2011 2012 2013 Change (%)
2012 to 2013 Male Female Male Female Male Female ELICOS1 7 780 7 170 7 550 7 020 8 130 7 860 9.8 Schools 7 460 6 810 6 020 5 400 5 400 4 940 -9.5 VET2 55 990 38 260 46 410 33 440 38 140 30 690 -13.7 Higher Education 96 530 83 560 89 960 79 380 94 470 80 410 3.3 Postgraduate Research 9 190 8 150 10 260 9 140 10 850 9 720 6 Non Award 2 660 3 130 2 410 3 170 2 630 3 600 11.5 AusAID3/Defence 3 080 2 910 3 460 3 370 3 630 3 660 6.7 Total OECD countries 24 910 26 750 24 050 25 490 24 470 25 930 1.8 Total4 182 690 149 980 166 080 140 920 163 240 140 870 -0.9 Source data: The Stock of Temporary Entrants, DIBP 1. English Language Intensive Course for Overseas Students (ELICOS). 2. Vocational Education and Training (VET). 3. Australian Agency for International Development (AusAID). 4. Excludes New Zealand citizens—includes citizenship not stated and other educational sector not stated. Excludes a small number of gender Unknown.
Box 7.1: Former Student visa holders—Indian nationals
While the number of Indian Student visa holders in Australia has dropped, many former students have stayed on in Australia and transferred to another visa. Some of these have since become permanent residents while others have transitioned to other visas such as the Temporary Graduate (subclass 485) visa and more recently the Temporary Work (Skilled) (subclass 457) visa. The subclass 457 visa continues to provide a potential pathway to a permanent visa. However, due to policy changes only subclass 485 visas granted up to 31 December2012 offer a potential pathway to a permanent visa (see Chapter 3, Section 3.4.4 for more detail). Since 2008–09, more than 50 000 subclass 485 visas and almost 8000 subclass 457 visas were granted to Indian nationals who had studied in Australia (Table 7.7).
Table 7.7: Former Student visa holders granted a subclass 485 or subclass 457 visa—Indian nationals, 2008–09 to 2012–13
Visa type 2008–09 2009–10 2010–11 2011–12 2012–13 Temporary Graduate 4 268 9 129 9 644 17 031 10 445 Temporary Work (Skilled) 489 367 589 1 761 4 774 Total 4 757 9 496 10 233 18 792 15 219
Source data: Visa Reporting, DIBP
Australia’s Migration Trends 2012–13 Page 110 of 187
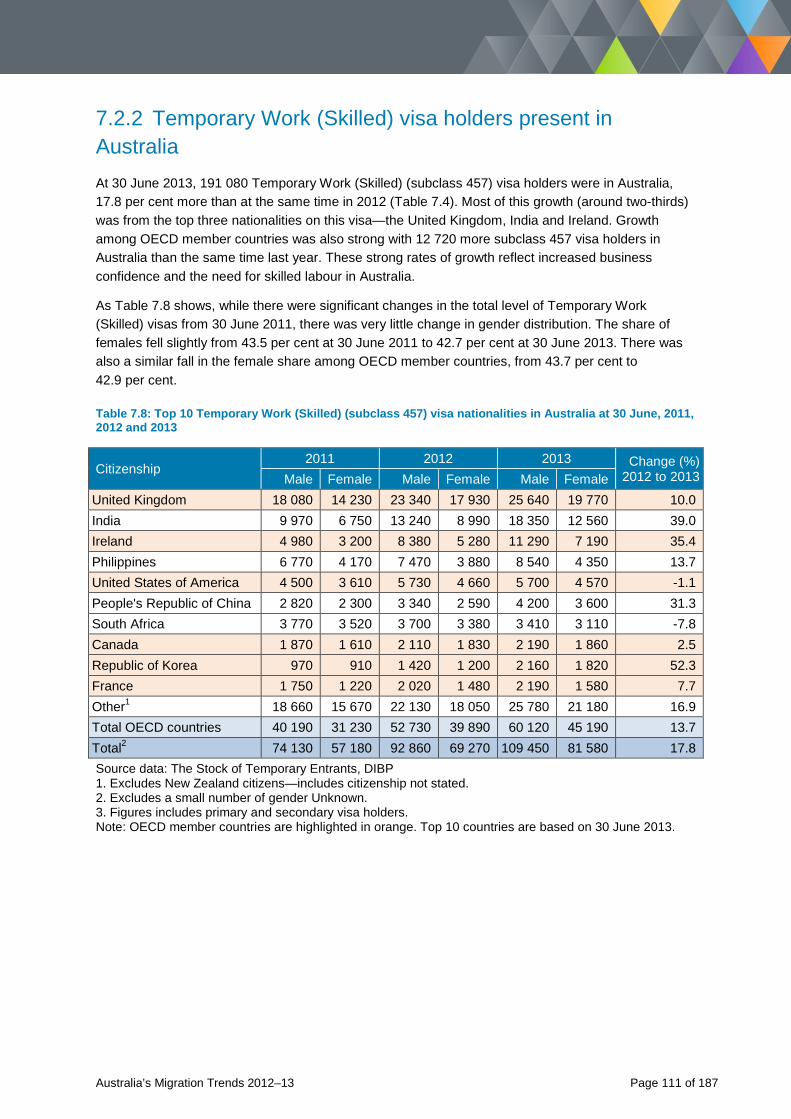
7.2.2 Temporary Work (Skilled) visa holders present in Australia At 30 June 2013, 191 080 Temporary Work (Skilled) (subclass 457) visa holders were in Australia, 17.8 per cent more than at the same time in 2012 (Table 7.4). Most of this growth (around two-thirds) was from the top three nationalities on this visa—the United Kingdom, India and Ireland. Growth among OECD member countries was also strong with 12 720 more subclass 457 visa holders in Australia than the same time last year. These strong rates of growth reflect increased business confidence and the need for skilled labour in Australia.
As Table 7.8 shows, while there were significant changes in the total level of Temporary Work (Skilled) visas from 30 June 2011, there was very little change in gender distribution. The share of females fell slightly from 43.5 per cent at 30 June 2011 to 42.7 per cent at 30 June 2013. There was also a similar fall in the female share among OECD member countries, from 43.7 per cent to 42.9 per cent.
Table 7.8: Top 10 Temporary Work (Skilled) (subclass 457) visa nationalities in Australia at 30 June, 2011, 2012 and 2013
Citizenship 2011 2012 2013 Change (%)
2012 to 2013 Male Female Male Female Male Female United Kingdom 18 080 14 230 23 340 17 930 25 640 19 770 10.0 India 9 970 6 750 13 240 8 990 18 350 12 560 39.0 Ireland 4 980 3 200 8 380 5 280 11 290 7 190 35.4 Philippines 6 770 4 170 7 470 3 880 8 540 4 350 13.7 United States of America 4 500 3 610 5 730 4 660 5 700 4 570 -1.1 People's Republic of China 2 820 2 300 3 340 2 590 4 200 3 600 31.3 South Africa 3 770 3 520 3 700 3 380 3 410 3 110 -7.8 Canada 1 870 1 610 2 110 1 830 2 190 1 860 2.5 Republic of Korea 970 910 1 420 1 200 2 160 1 820 52.3 France 1 750 1 220 2 020 1 480 2 190 1 580 7.7 Other1 18 660 15 670 22 130 18 050 25 780 21 180 16.9 Total OECD countries 40 190 31 230 52 730 39 890 60 120 45 190 13.7 Total2 74 130 57 180 92 860 69 270 109 450 81 580 17.8 Source data: The Stock of Temporary Entrants, DIBP 1. Excludes New Zealand citizens—includes citizenship not stated. 2. Excludes a small number of gender Unknown. 3. Figures includes primary and secondary visa holders. Note: OECD member countries are highlighted in orange. Top 10 countries are based on 30 June 2013.
Australia’s Migration Trends 2012–13 Page 111 of 187
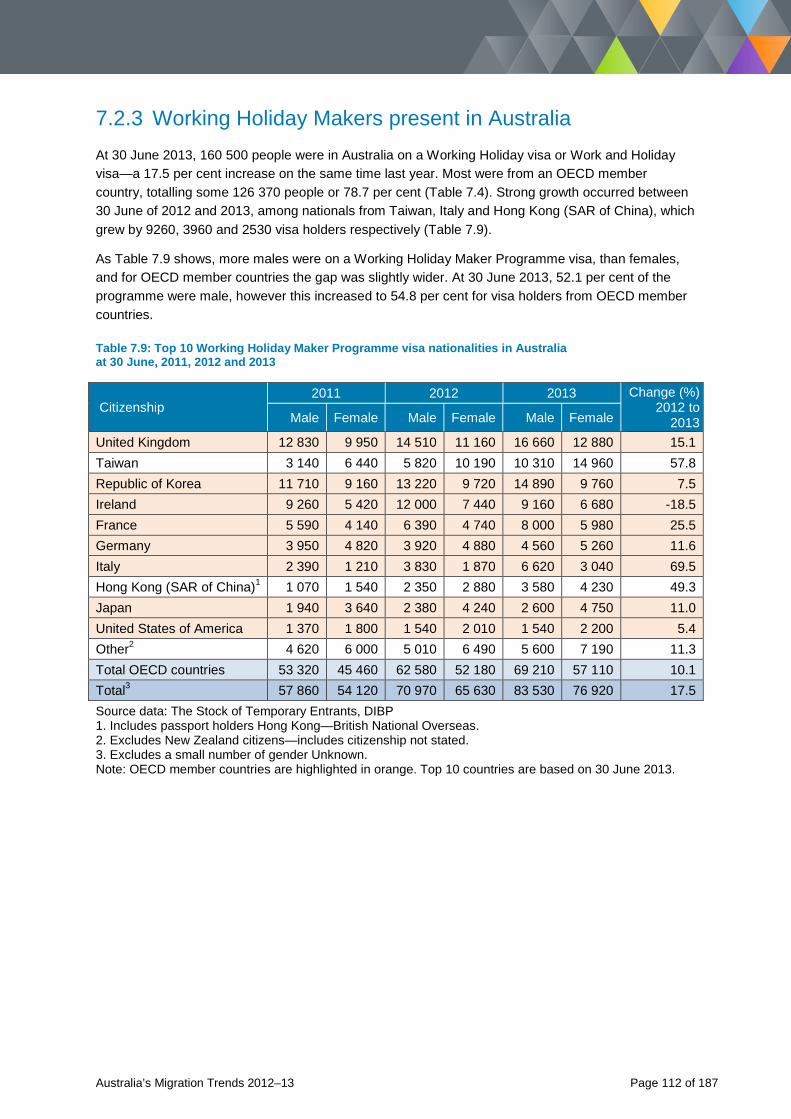
7.2.3 Working Holiday Makers present in Australia At 30 June 2013, 160 500 people were in Australia on a Working Holiday visa or Work and Holiday visa—a 17.5 per cent increase on the same time last year. Most were from an OECD member country, totalling some 126 370 people or 78.7 per cent (Table 7.4). Strong growth occurred between 30 June of 2012 and 2013, among nationals from Taiwan, Italy and Hong Kong (SAR of China), which grew by 9260, 3960 and 2530 visa holders respectively (Table 7.9).
As Table 7.9 shows, more males were on a Working Holiday Maker Programme visa, than females, and for OECD member countries the gap was slightly wider. At 30 June 2013, 52.1 per cent of the programme were male, however this increased to 54.8 per cent for visa holders from OECD member countries.
Table 7.9: Top 10 Working Holiday Maker Programme visa nationalities in Australia at 30 June, 2011, 2012 and 2013
Citizenship 2011 2012 2013 Change (%)
2012 to 2013 Male Female Male Female Male Female
United Kingdom 12 830 9 950 14 510 11 160 16 660 12 880 15.1 Taiwan 3 140 6 440 5 820 10 190 10 310 14 960 57.8 Republic of Korea 11 710 9 160 13 220 9 720 14 890 9 760 7.5 Ireland 9 260 5 420 12 000 7 440 9 160 6 680 -18.5 France 5 590 4 140 6 390 4 740 8 000 5 980 25.5 Germany 3 950 4 820 3 920 4 880 4 560 5 260 11.6 Italy 2 390 1 210 3 830 1 870 6 620 3 040 69.5 Hong Kong (SAR of China)1 1 070 1 540 2 350 2 880 3 580 4 230 49.3 Japan 1 940 3 640 2 380 4 240 2 600 4 750 11.0 United States of America 1 370 1 800 1 540 2 010 1 540 2 200 5.4 Other2 4 620 6 000 5 010 6 490 5 600 7 190 11.3 Total OECD countries 53 320 45 460 62 580 52 180 69 210 57 110 10.1 Total3 57 860 54 120 70 970 65 630 83 530 76 920 17.5 Source data: The Stock of Temporary Entrants, DIBP 1. Includes passport holders Hong Kong—British National Overseas. 2. Excludes New Zealand citizens—includes citizenship not stated. 3. Excludes a small number of gender Unknown. Note: OECD member countries are highlighted in orange. Top 10 countries are based on 30 June 2013.
Australia’s Migration Trends 2012–13 Page 112 of 187

Chapter 8: Citizenship in Australia
Australia’s Migration Trends 2012–13 Page 113 of 187
8.1 Overview Most people acquire Australian citizenship automatically, for example those born in Australia to an Australian citizen or permanent resident parent. Eligible non-citizens need to apply for Australian citizenship.
Citizenship by conferral is the most common method for migrants to acquire Australian citizenship. The other methods are citizenship by descent (those born overseas to an Australian citizen), citizenship by adoption (those adopted by an Australian citizen) and citizenship by resumption (those who previously lost or gave up their Australian citizenship).
Migrants seeking citizenship by conferral must meet a range of requirements. The General Eligibility provisions—under which most migrants apply—require applicants to:
• be an Australian permanent resident• have been resident in Australia for a prescribed period7
• be of good character• have an understanding of the rights and responsibilities of Australian citizenship and possess a
basic knowledge of English, demonstrated through the successful completion of a citizenship test• be likely to reside, or continue to reside, in Australia or maintain a close and continuing
association with Australia• understand the nature of the application they are submitting.
People who may meet the General Eligibility requirements include permanent residents such as spouses or partners of Australian citizens, skilled migrants, humanitarian entrants, Commonwealth Child Migration Scheme arrivals8 and certain New Zealand citizens deemed to be permanent residents of Australia as at 26 February 2001. Other conferral pathways exist, including for people born to former Australian citizens or born in Papua before its independence in 1975 and for people born in Australia who would otherwise be stateless.
Most migrants between the ages of 18 and 60 years who apply for Australian citizenship for conferral are required to pass the Australian citizenship test. The Australian citizenship test plays a valuable role in encouraging people to find out more about Australia, as well as understanding the responsibilities and privileges of being an Australian citizen. The citizenship test resource, Australian Citizenship: Our Common Bond book and DVD, includes all the information applicants need to pass the test. The resource booklet has been translated into 37 community languages and test resources can also be watched on YouTube.
There is also a citizenship course-based test as an alternate pathway for vulnerable clients who have difficulty passing a computer-based test.
7 To meet the residence requirement, people who apply for Australian citizenship on or after 1 July 2007 must have been lawfully resident in Australia for four years immediately before applying, including 12 months as a permanent resident immediately before applying. 8 Unaccompanied children, mostly from the United Kingdom and Malta, arrived in Australia under this scheme between 22 September 1947 and 31 December 1967.
Australia’s Migration Trends 2012–13 Page 114 of 187
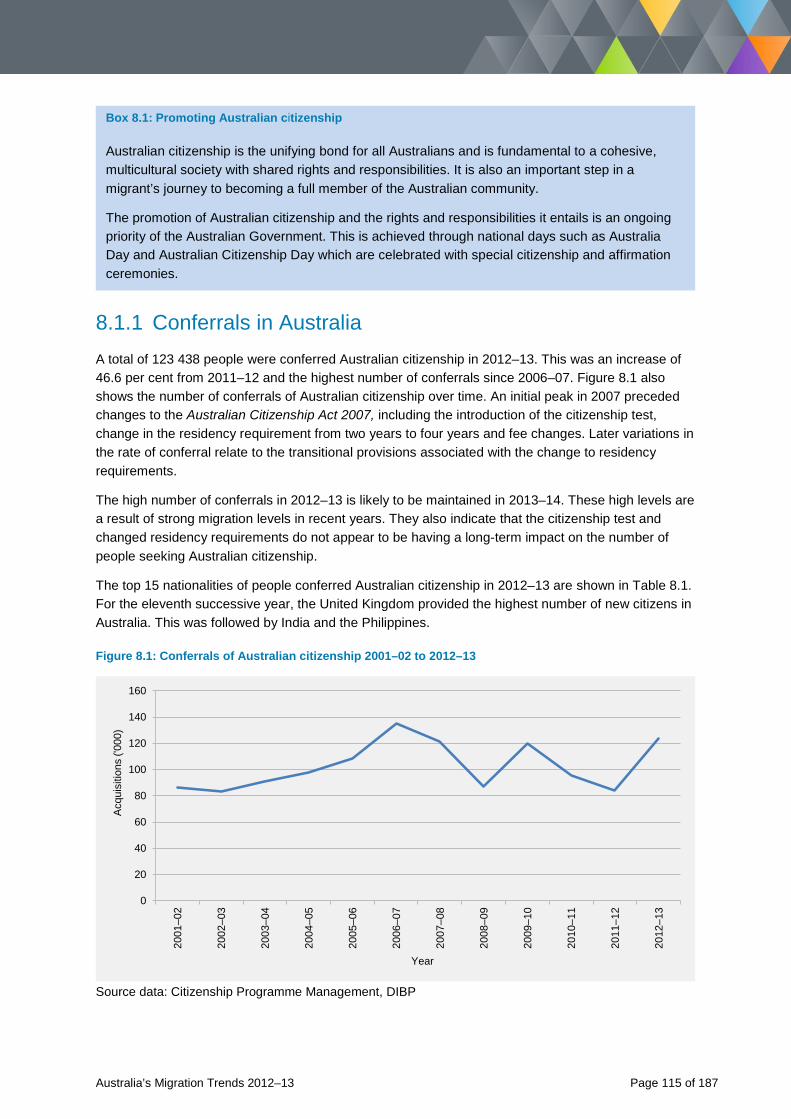
Box 8.1: Promoting Australian citizenship
Australian citizenship is the unifying bond for all Australians and is fundamental to a cohesive, multicultural society with shared rights and responsibilities. It is also an important step in a migrant’s journey to becoming a full member of the Australian community.
The promotion of Australian citizenship and the rights and responsibilities it entails is an ongoing priority of the Australian Government. This is achieved through national days such as Australia Day and Australian Citizenship Day which are celebrated with special citizenship and affirmation ceremonies.
8.1.1 Conferrals in Australia A total of 123 438 people were conferred Australian citizenship in 2012–13. This was an increase of 46.6 per cent from 2011–12 and the highest number of conferrals since 2006–07. Figure 8.1 also shows the number of conferrals of Australian citizenship over time. An initial peak in 2007 preceded changes to the Australian Citizenship Act 2007, including the introduction of the citizenship test, change in the residency requirement from two years to four years and fee changes. Later variations in the rate of conferral relate to the transitional provisions associated with the change to residency requirements.
The high number of conferrals in 2012–13 is likely to be maintained in 2013–14. These high levels are a result of strong migration levels in recent years. They also indicate that the citizenship test and changed residency requirements do not appear to be having a long-term impact on the number of people seeking Australian citizenship.
The top 15 nationalities of people conferred Australian citizenship in 2012–13 are shown in Table 8.1. For the eleventh successive year, the United Kingdom provided the highest number of new citizens in Australia. This was followed by India and the Philippines.
Figure 8.1: Conferrals of Australian citizenship 2001–02 to 2012–13
0
20
40
60
80
100
120
140
160
2001
–02
2002
–03
2003
–04
2004
–05
2005
–06
2006
–07
2007
–08
2008
–09
2009
–10
2010
–11
2011
–12
2012
–13
Acq
uisi
tions
('00
0)
Year
Source data: Citizenship Programme Management, DIBP
Australia’s Migration Trends 2012–13 Page 115 of 187
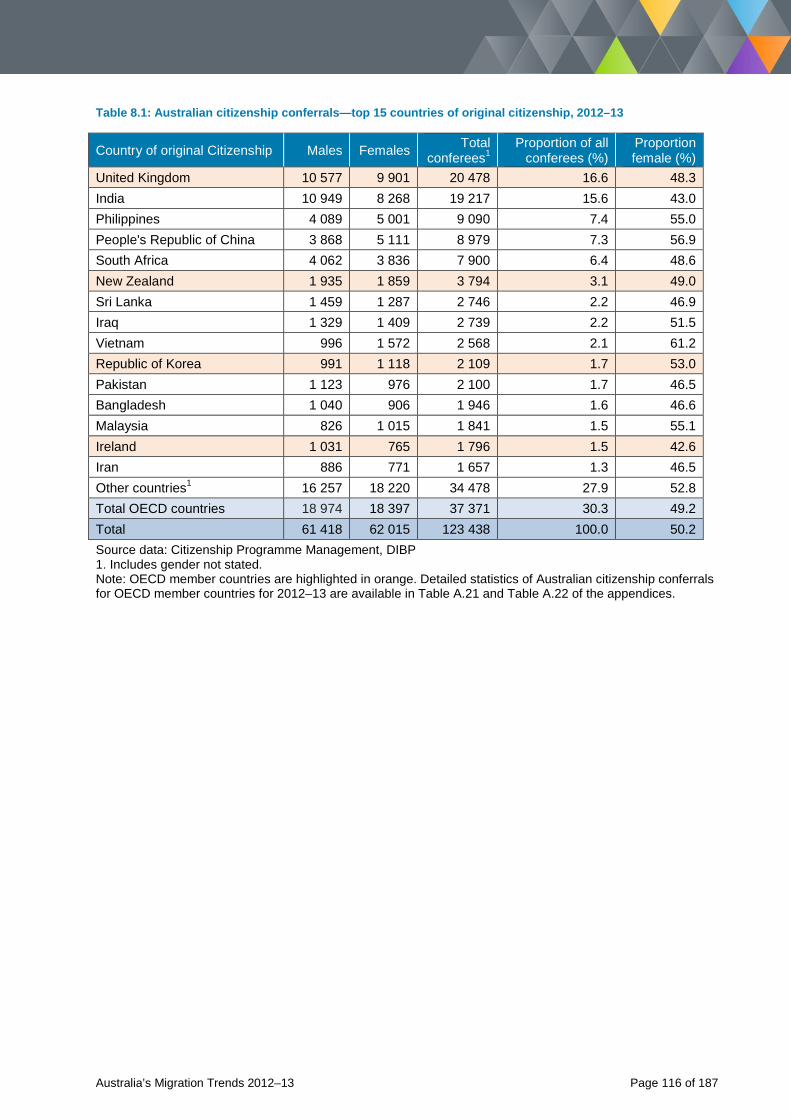
Table 8.1: Australian citizenship conferrals—top 15 countries of original citizenship, 2012–13
Country of original Citizenship Males Females Total conferees1
Proportion of all conferees (%)
Proportion female (%)
United Kingdom 10 577 9 901 20 478 16.6 48.3 India 10 949 8 268 19 217 15.6 43.0 Philippines 4 089 5 001 9 090 7.4 55.0 People's Republic of China 3 868 5 111 8 979 7.3 56.9 South Africa 4 062 3 836 7 900 6.4 48.6 New Zealand 1 935 1 859 3 794 3.1 49.0 Sri Lanka 1 459 1 287 2 746 2.2 46.9 Iraq 1 329 1 409 2 739 2.2 51.5 Vietnam 996 1 572 2 568 2.1 61.2 Republic of Korea 991 1 118 2 109 1.7 53.0 Pakistan 1 123 976 2 100 1.7 46.5 Bangladesh 1 040 906 1 946 1.6 46.6 Malaysia 826 1 015 1 841 1.5 55.1 Ireland 1 031 765 1 796 1.5 42.6 Iran 886 771 1 657 1.3 46.5 Other countries1 16 257 18 220 34 478 27.9 52.8 Total OECD countries 18 974 18 397 37 371 30.3 49.2 Total 61 418 62 015 123 438 100.0 50.2 Source data: Citizenship Programme Management, DIBP 1. Includes gender not stated. Note: OECD member countries are highlighted in orange. Detailed statistics of Australian citizenship conferrals for OECD member countries for 2012–13 are available in Table A.21 and Table A.22 of the appendices.
Australia’s Migration Trends 2012–13 Page 116 of 187
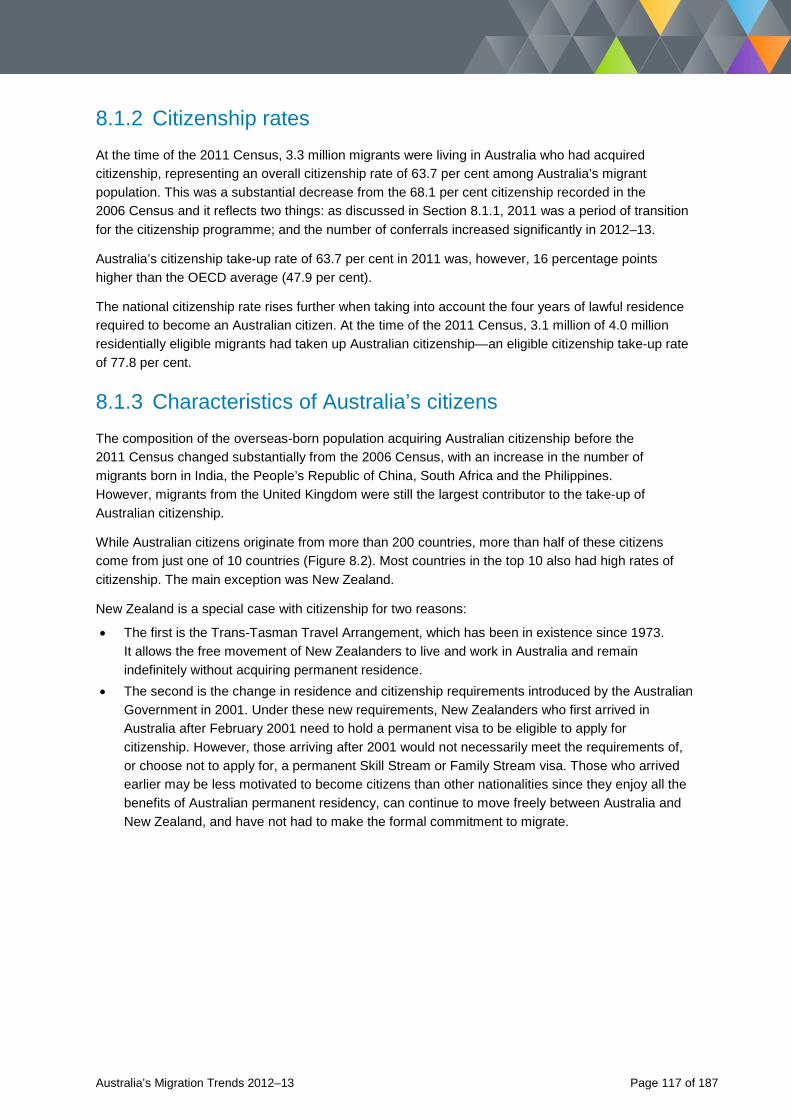
8.1.2 Citizenship rates At the time of the 2011 Census, 3.3 million migrants were living in Australia who had acquired citizenship, representing an overall citizenship rate of 63.7 per cent among Australia’s migrant population. This was a substantial decrease from the 68.1 per cent citizenship recorded in the 2006 Census and it reflects two things: as discussed in Section 8.1.1, 2011 was a period of transition for the citizenship programme; and the number of conferrals increased significantly in 2012–13.
Australia’s citizenship take-up rate of 63.7 per cent in 2011 was, however, 16 percentage points higher than the OECD average (47.9 per cent).
The national citizenship rate rises further when taking into account the four years of lawful residence required to become an Australian citizen. At the time of the 2011 Census, 3.1 million of 4.0 million residentially eligible migrants had taken up Australian citizenship—an eligible citizenship take-up rate of 77.8 per cent.
8.1.3 Characteristics of Australia’s citizens The composition of the overseas-born population acquiring Australian citizenship before the 2011 Census changed substantially from the 2006 Census, with an increase in the number of migrants born in India, the People’s Republic of China, South Africa and the Philippines. However, migrants from the United Kingdom were still the largest contributor to the take-up of Australian citizenship.
While Australian citizens originate from more than 200 countries, more than half of these citizens come from just one of 10 countries (Figure 8.2). Most countries in the top 10 also had high rates of citizenship. The main exception was New Zealand.
New Zealand is a special case with citizenship for two reasons:
• The first is the Trans-Tasman Travel Arrangement, which has been in existence since 1973. It allows the free movement of New Zealanders to live and work in Australia and remain indefinitely without acquiring permanent residence.
• The second is the change in residence and citizenship requirements introduced by the Australian Government in 2001. Under these new requirements, New Zealanders who first arrived in Australia after February 2001 need to hold a permanent visa to be eligible to apply for citizenship. However, those arriving after 2001 would not necessarily meet the requirements of, or choose not to apply for, a permanent Skill Stream or Family Stream visa. Those who arrived earlier may be less motivated to become citizens than other nationalities since they enjoy all the benefits of Australian permanent residency, can continue to move freely between Australia and New Zealand, and have not had to make the formal commitment to migrate.
Australia’s Migration Trends 2012–13 Page 117 of 187
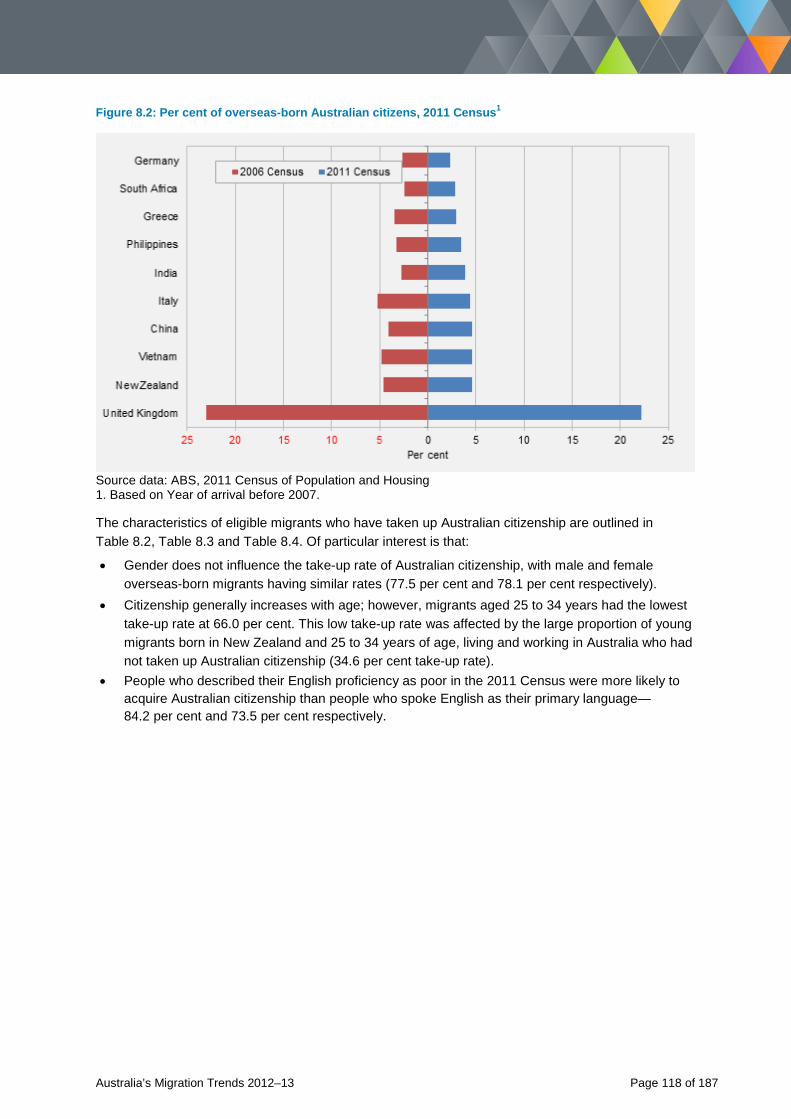
Figure 8.2: Per cent of overseas-born Australian citizens, 2011 Census1
Source data: ABS, 2011 Census of Population and Housing 1. Based on Year of arrival before 2007.
The characteristics of eligible migrants who have taken up Australian citizenship are outlined in Table 8.2, Table 8.3 and Table 8.4. Of particular interest is that:
• Gender does not influence the take-up rate of Australian citizenship, with male and female overseas-born migrants having similar rates (77.5 per cent and 78.1 per cent respectively).
• Citizenship generally increases with age; however, migrants aged 25 to 34 years had the lowest take-up rate at 66.0 per cent. This low take-up rate was affected by the large proportion of young migrants born in New Zealand and 25 to 34 years of age, living and working in Australia who had not taken up Australian citizenship (34.6 per cent take-up rate).
• People who described their English proficiency as poor in the 2011 Census were more likely to acquire Australian citizenship than people who spoke English as their primary language—84.2 per cent and 73.5 per cent respectively.
Australia’s Migration Trends 2012–13 Page 118 of 187
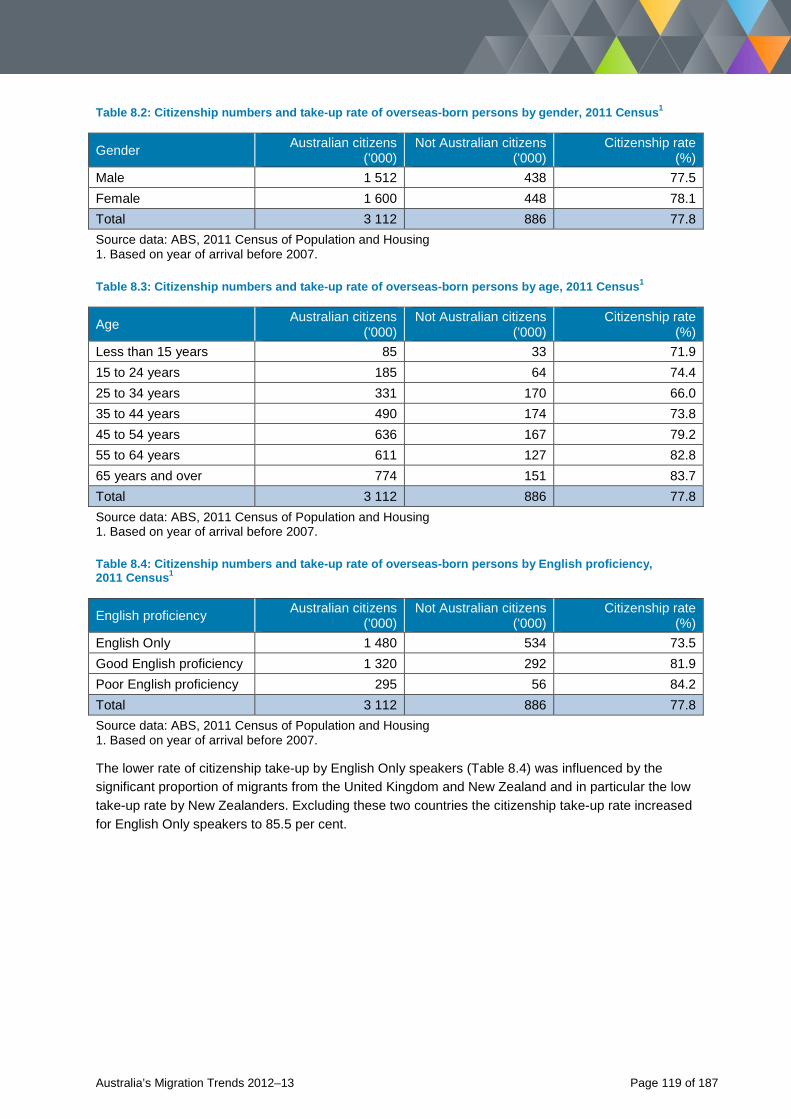
Table 8.2: Citizenship numbers and take-up rate of overseas-born persons by gender, 2011 Census1
Gender Australian citizens ('000)
Not Australian citizens ('000)
Citizenship rate (%)
Male 1 512 438 77.5 Female 1 600 448 78.1 Total 3 112 886 77.8 Source data: ABS, 2011 Census of Population and Housing 1. Based on year of arrival before 2007.
Table 8.3: Citizenship numbers and take-up rate of overseas-born persons by age, 2011 Census1
Age Australian citizens ('000)
Not Australian citizens ('000)
Citizenship rate (%)
Less than 15 years 85 33 71.9 15 to 24 years 185 64 74.4 25 to 34 years 331 170 66.0 35 to 44 years 490 174 73.8 45 to 54 years 636 167 79.2 55 to 64 years 611 127 82.8 65 years and over 774 151 83.7 Total 3 112 886 77.8 Source data: ABS, 2011 Census of Population and Housing 1. Based on year of arrival before 2007.
Table 8.4: Citizenship numbers and take-up rate of overseas-born persons by English proficiency, 2011 Census1
English proficiency Australian citizens ('000)
Not Australian citizens ('000)
Citizenship rate (%)
English Only 1 480 534 73.5 Good English proficiency 1 320 292 81.9 Poor English proficiency 295 56 84.2 Total 3 112 886 77.8 Source data: ABS, 2011 Census of Population and Housing 1. Based on year of arrival before 2007.
The lower rate of citizenship take-up by English Only speakers (Table 8.4) was influenced by the significant proportion of migrants from the United Kingdom and New Zealand and in particular the low take-up rate by New Zealanders. Excluding these two countries the citizenship take-up rate increased for English Only speakers to 85.5 per cent.
Australia’s Migration Trends 2012–13 Page 119 of 187
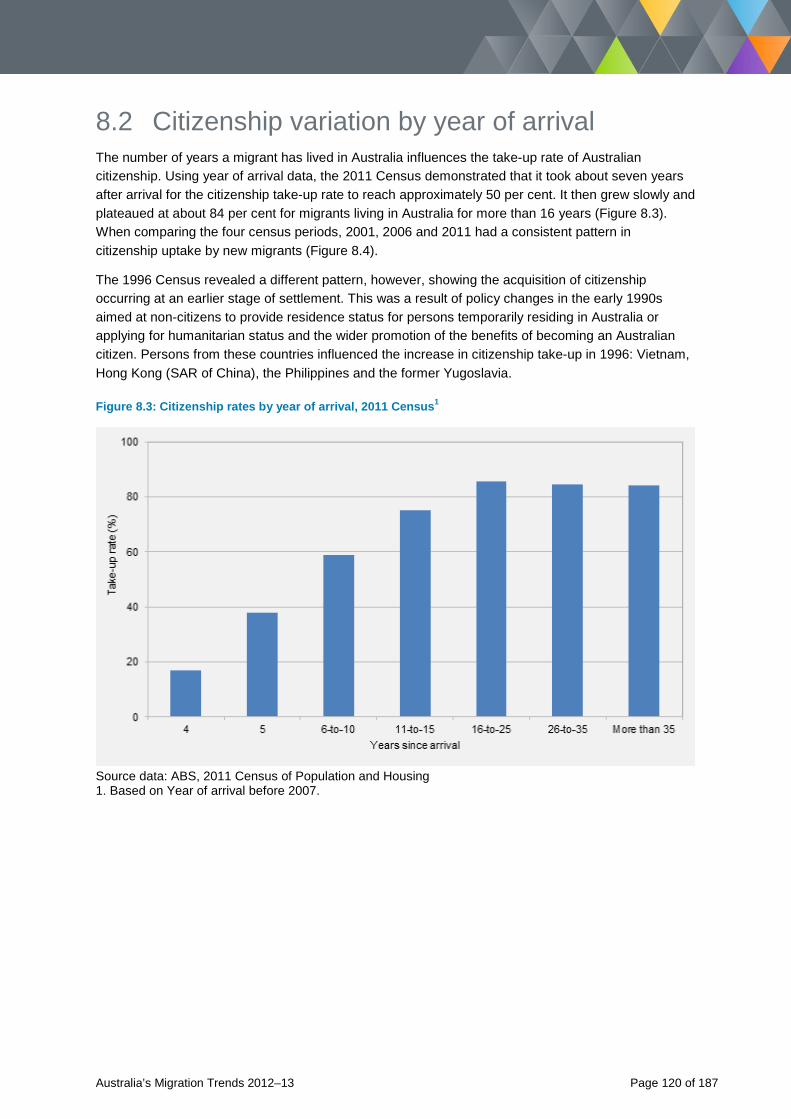
8.2 Citizenship variation by year of arrival The number of years a migrant has lived in Australia influences the take-up rate of Australian citizenship. Using year of arrival data, the 2011 Census demonstrated that it took about seven years after arrival for the citizenship take-up rate to reach approximately 50 per cent. It then grew slowly and plateaued at about 84 per cent for migrants living in Australia for more than 16 years (Figure 8.3). When comparing the four census periods, 2001, 2006 and 2011 had a consistent pattern in citizenship uptake by new migrants (Figure 8.4).
The 1996 Census revealed a different pattern, however, showing the acquisition of citizenship occurring at an earlier stage of settlement. This was a result of policy changes in the early 1990s aimed at non-citizens to provide residence status for persons temporarily residing in Australia or applying for humanitarian status and the wider promotion of the benefits of becoming an Australian citizen. Persons from these countries influenced the increase in citizenship take-up in 1996: Vietnam, Hong Kong (SAR of China), the Philippines and the former Yugoslavia.
Figure 8.3: Citizenship rates by year of arrival, 2011 Census1
Source data: ABS, 2011 Census of Population and Housing 1. Based on Year of arrival before 2007.
Australia’s Migration Trends 2012–13 Page 120 of 187
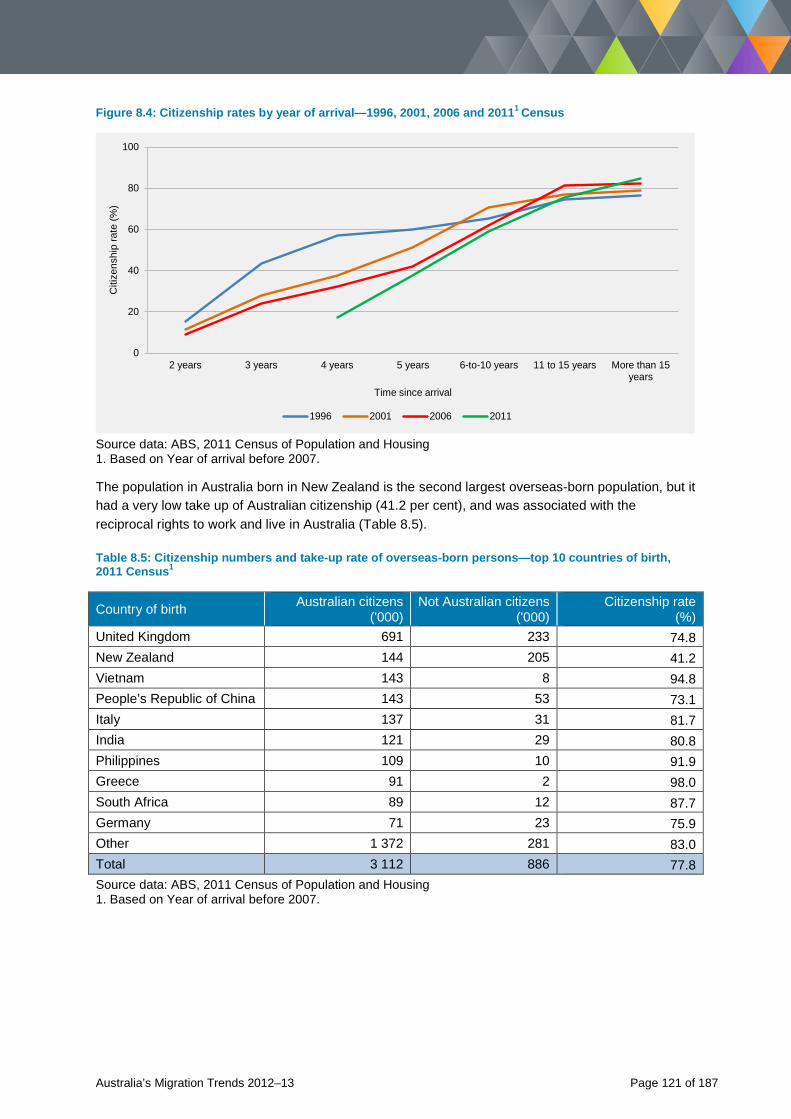
Figure 8.4: Citizenship rates by year of arrival—1996, 2001, 2006 and 20111 Census
0
20
40
60
80
100
2 years 3 years 4 years 5 years 6-to-10 years 11 to 15 years More than 15years
Citi
zens
hip
rate
(%)
Time since arrival
1996 2001 2006 2011
Source data: ABS, 2011 Census of Population and Housing 1. Based on Year of arrival before 2007.
The population in Australia born in New Zealand is the second largest overseas-born population, but it had a very low take up of Australian citizenship (41.2 per cent), and was associated with the reciprocal rights to work and live in Australia (Table 8.5).
Table 8.5: Citizenship numbers and take-up rate of overseas-born persons—top 10 countries of birth, 2011 Census1
Country of birth Australian citizens ('000)
Not Australian citizens ('000)
Citizenship rate (%)
United Kingdom 691 233 74.8 New Zealand 144 205 41.2 Vietnam 143 8 94.8 People’s Republic of China 143 53 73.1 Italy 137 31 81.7 India 121 29 80.8 Philippines 109 10 91.9 Greece 91 2 98.0 South Africa 89 12 87.7 Germany 71 23 75.9 Other 1 372 281 83.0 Total 3 112 886 77.8 Source data: ABS, 2011 Census of Population and Housing 1. Based on Year of arrival before 2007.
Australia’s Migration Trends 2012–13 Page 121 of 187
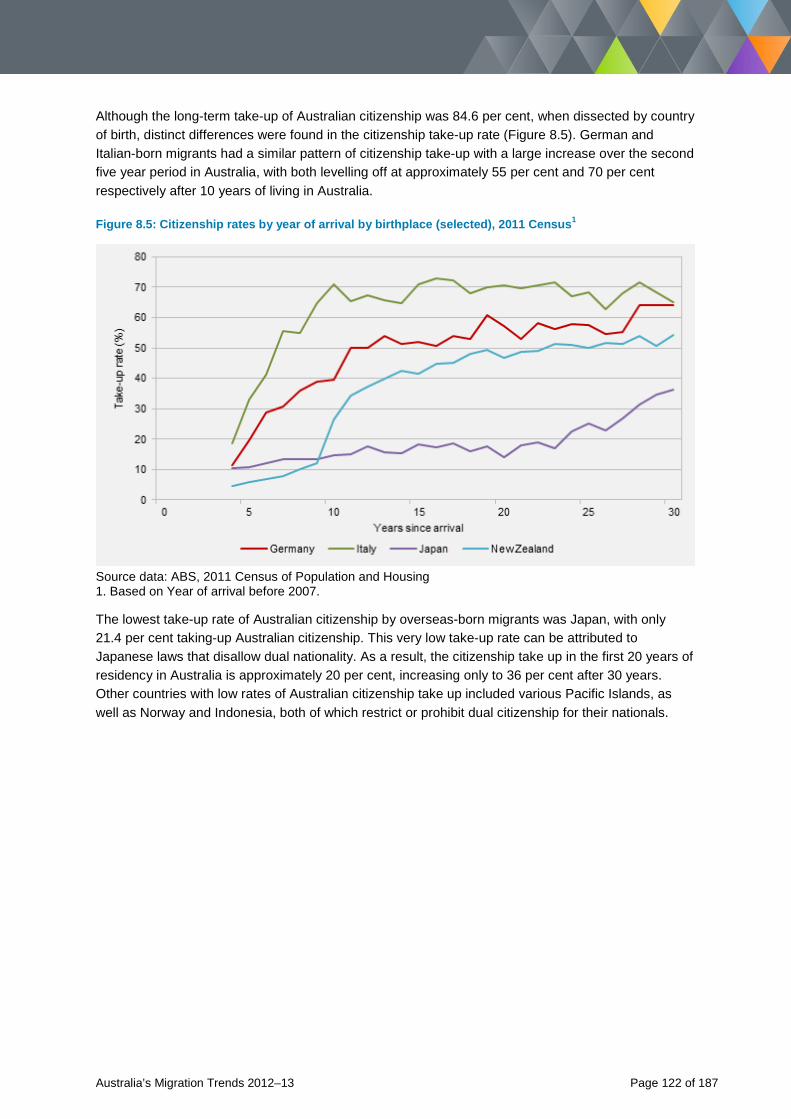
Although the long-term take-up of Australian citizenship was 84.6 per cent, when dissected by country of birth, distinct differences were found in the citizenship take-up rate (Figure 8.5). German and Italian-born migrants had a similar pattern of citizenship take-up with a large increase over the second five year period in Australia, with both levelling off at approximately 55 per cent and 70 per cent respectively after 10 years of living in Australia.
Figure 8.5: Citizenship rates by year of arrival by birthplace (selected), 2011 Census1
Source data: ABS, 2011 Census of Population and Housing 1. Based on Year of arrival before 2007.
The lowest take-up rate of Australian citizenship by overseas-born migrants was Japan, with only 21.4 per cent taking-up Australian citizenship. This very low take-up rate can be attributed to Japanese laws that disallow dual nationality. As a result, the citizenship take up in the first 20 years of residency in Australia is approximately 20 per cent, increasing only to 36 per cent after 30 years. Other countries with low rates of Australian citizenship take up included various Pacific Islands, as well as Norway and Indonesia, both of which restrict or prohibit dual citizenship for their nationals.
Australia’s Migration Trends 2012–13 Page 122 of 187
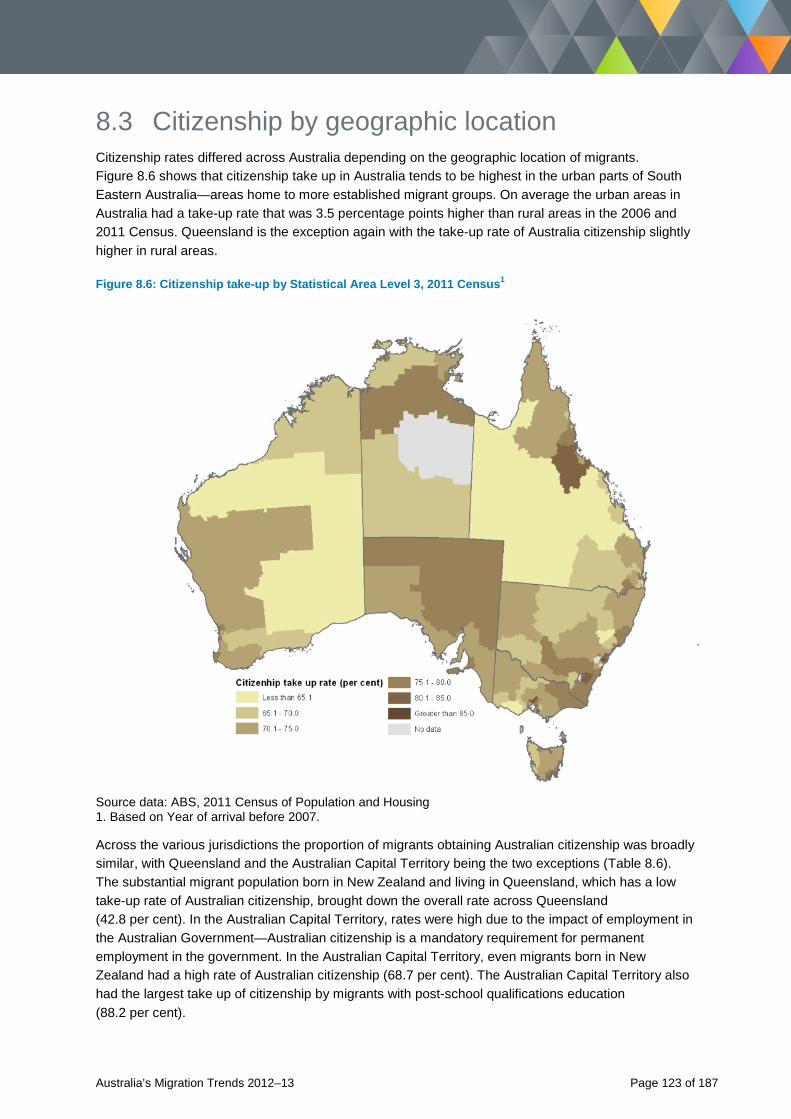
8.3 Citizenship by geographic location Citizenship rates differed across Australia depending on the geographic location of migrants. Figure 8.6 shows that citizenship take up in Australia tends to be highest in the urban parts of South Eastern Australia—areas home to more established migrant groups. On average the urban areas in Australia had a take-up rate that was 3.5 percentage points higher than rural areas in the 2006 and 2011 Census. Queensland is the exception again with the take-up rate of Australia citizenship slightly higher in rural areas.
Figure 8.6: Citizenship take-up by Statistical Area Level 3, 2011 Census1
Source data: ABS, 2011 Census of Population and Housing 1. Based on Year of arrival before 2007.
Across the various jurisdictions the proportion of migrants obtaining Australian citizenship was broadly similar, with Queensland and the Australian Capital Territory being the two exceptions (Table 8.6). The substantial migrant population born in New Zealand and living in Queensland, which has a low take-up rate of Australian citizenship, brought down the overall rate across Queensland (42.8 per cent). In the Australian Capital Territory, rates were high due to the impact of employment in the Australian Government—Australian citizenship is a mandatory requirement for permanent employment in the government. In the Australian Capital Territory, even migrants born in New Zealand had a high rate of Australian citizenship (68.7 per cent). The Australian Capital Territory also had the largest take up of citizenship by migrants with post-school qualifications education (88.2 per cent).
Australia’s Migration Trends 2012–13 Page 123 of 187
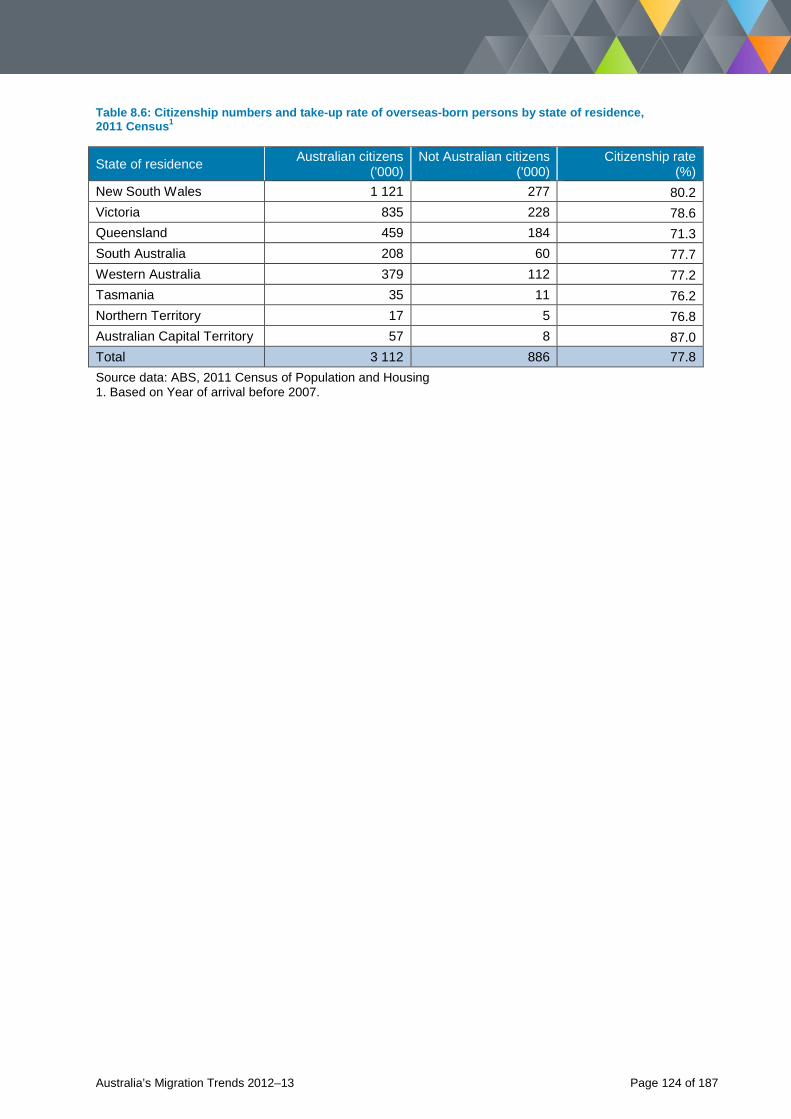
Table 8.6: Citizenship numbers and take-up rate of overseas-born persons by state of residence, 2011 Census1
State of residence Australian citizens ('000)
Not Australian citizens ('000)
Citizenship rate (%)
New South Wales 1 121 277 80.2 Victoria 835 228 78.6 Queensland 459 184 71.3 South Australia 208 60 77.7 Western Australia 379 112 77.2 Tasmania 35 11 76.2 Northern Territory 17 5 76.8 Australian Capital Territory 57 8 87.0 Total 3 112 886 77.8 Source data: ABS, 2011 Census of Population and Housing 1. Based on Year of arrival before 2007.
Australia’s Migration Trends 2012–13 Page 124 of 187
Chapter 9: Diversity and settlement
Australia’s Migration Trends 2012–13 Page 125 of 187
9.1 Multiculturalism in Australia9 The People of Australia multicultural policy celebrates and values the benefits of cultural diversity for all Australians in the broader aims of national unity, community harmony and maintenance of the country’s democratic values. The policy also confirms Australia’s opposition to all forms of racism, discrimination, intolerance and prejudice.
The key policy initiatives, described in this chapter, aim to deliver on the enduring theme that Australia’s successful multicultural society is built around shared rights and responsibilities which are fundamental to living here.
9.1.1 The National Anti-Racism Partnership and Strategy Led by the Australian Human Rights Commission, the National Anti-Racism Partnership met several times in 2011 and 2012, to develop a new national anti-racism campaign and strategy. The strategy focuses on five key areas: research and consultation; education resources; public awareness; youth engagement; and ongoing evaluation.
Following extensive national consultations, the new national anti-racism campaign and strategy was launched in August 2012. It will be implemented over three years. The national campaign—Racism. It stops with me—invites all Australians to reflect on what they can do to counter racism wherever it happens.
The campaign and strategy aim to promote a clear understanding in the Australian community of what racism is and how it can be prevented and reduced.
The strategy’s key objectives are to:
• create awareness of racism and how it affects individuals and the broader community • identify, promote and build on good practice initiatives to prevent and reduce racism • empower communities and individuals to take action to prevent and reduce racism and seek
redress when it occurs.
Further information is available at: http://itstopswithme.humanrights.gov.au/
9.1.2 Strengthened Multicultural Access and Equity Policy A key initiative of Australia’s multicultural policy was an inquiry into Australian Government services to ensure they are responsive to the needs of Australians from culturally and linguistically diverse backgrounds.
In November 2011, an independent panel of eminent community leaders was appointed to conduct this inquiry. The Access and Equity Inquiry Panel’s report, Access and equity for a multicultural Australia, was presented to the Australian Government in June 2012, outlining 20 recommendations to strengthen access and equity performance across government.
In March 2013, all 20 recommendations were supported under a strengthened Multicultural Access and Equity Policy: Respecting diversity. Improving responsiveness.
9 In late 2013 the responsibility of multicultural affairs moved to the Department of Social Services.
Australia’s Migration Trends 2012–13 Page 126 of 187
The strengthened policy is the primary vehicle for improving the responsiveness of government services to Australia’s culturally and linguistically diverse population. It sharpens the focus of access and equity on a multicultural Australia. It also extends the application of access and equity beyond service delivery to encompass all government engagement and communication with clients.
The policy also includes strengthened implementation mechanisms. Under the policy, all Australian government departments and agencies covered by the Financial Management and Accountability Act 1997 are required to develop and implement two-yearly Agency Multicultural Plans (plans) to address their multicultural access and equity obligations, with the first plans to cover 1 July 2013 to 30 June 2015.
These plans will form the basis for more structured performance reporting and accountability measures, with periodic audits by the Auditor-General and a biennial whole-of-government report to be tabled in Parliament.
9.1.3 The Australian Multicultural Council The independent, non-partisan Australian Multicultural Council (the Council) was created in August 2011. Since its establishment, the Council has provided advice to Government, including as a partner in the development and implementation of the National Anti-Racism Strategy, a member of the independent Access and Equity Inquiry Panel, and as an independent review and oversight body for the whole-of-government Agency Multicultural Plans.
In September 2012, the inaugural Australian Multicultural Council lecture was hosted to help promote the benefits of a culturally diverse Australia. The lecture—Australia and the Multicultural Experience—was delivered by distinguished Australian businessman, Mr Frank Lowy AC.
In March 2013, the Council hosted the Productivity, Diversity and Migration in an Asian Century roundtable in Melbourne to promote a dialogue between industry, trade unions, civil society and academia, and to inform the Council’s advice to Government about the economic opportunities and challenges in managing diversity and migration. The roundtable was moderated by Peter Mares of the Grattan Institute. Throughout 2013, the Council conducted a series of community consultations across Australia to begin developing an evidence base for a policy statement on social cohesion.
Further information is available at: www.amc.gov.au
9.1.4 Multicultural Arts and Festivals Grants The Multicultural Arts and Festivals Grants provide funding assistance for multicultural arts or festivals projects which provide opportunities for Australians of all backgrounds to come together, share their diverse cultural experiences and showcase their cultures to the broader community. This encourages social cohesion and mutual understanding. In 2011–12, 43 projects were funded through the grants programme involving various communities, including new and emerging ones.
Australia’s Migration Trends 2012–13 Page 127 of 187
9.2 Settlement and integration in Australia10 The Australian Government’s settlement policy supports the economic, social and humanitarian benefits of migration. The three settlement principles that support positive outcomes include:
• welcoming migrants and humanitarian entrants • providing support based on need • maximising opportunities for migrants and humanitarian entrants to participate and contribute to
Australian society.
Settlement services are designed to assist eligible migrants and humanitarian entrants in the first five years following arrival in Australia.
9.2.2 The Australian Cultural Orientation programme The Australian Cultural Orientation programme is the beginning of the settlement journey for refugee and humanitarian visa holders preparing to live in Australia. This five-day orientation course is delivered overseas to visa holders before they travel to Australia. It provides an initial introduction to aspects of Australian life and culture to enhance entrants' settlement prospects by helping create realistic expectations for life in Australia. The programme complements the Onshore Orientation Programme provided through the department’s Humanitarian Settlement Services (HSS).
In 2011–12, 293 Australian Cultural Orientation courses were delivered to more than 4500 participants, in their own languages, in Egypt, Eritrea, Ethiopia, Ghana, Guinea, Iran, Jordan, Kenya, Lebanon, Malaysia, Malawi, Nepal, Pakistan, Rwanda, the Republic of Congo, Sierra Leone, Sudan, Syria, Tanzania, Thailand, Tunisia, Turkey, Uganda, Zambia and Zimbabwe.
9.2.4 Humanitarian Settlement Services HSS provides early practical support to humanitarian clients on arrival and throughout their initial settlement period. Programme support is tailored to individual needs, including the specific needs of young people. HSS endeavours to strengthen the ability of humanitarian clients to participate in Australia’s economic and social life, and equip them with the skills and knowledge needed to independently access services beyond their initial settlement period.
Services are provided based on need, and therefore not all clients will require or receive all services. HSS providers work with clients to assess and identify their needs and develop a case management plan to deliver a tailored package of services to meet those needs.
In 2012–13, 15 827 humanitarian clients were assisted under HSS, an increase of 9.1 per cent on 2011–12 when 14 512 clients were assisted.
10 In late 2013 the responsibility of settlement moved to the Department of Social Services.
Australia’s Migration Trends 2012–13 Page 128 of 187
9.2.5 Adult Migrant English Programme The Australian Government provides eligible migrants and humanitarian entrants with free English language tuition through the Adult Migrant English Program.
The program delivers basic English language tuition to new arrivals to support their transition to life in Australia. Through the programme, new migrants and humanitarian entrants develop foundation English language skills to help them to:
• participate socially and economically in the Australian community • negotiate everyday life situations • build capability and confidence.
The Adult Migrant English Program is delivered through flexible learning options to meet individual needs. Free childcare is provided to clients with children under school age to help facilitate attendance and remove barriers to participation. The programme complements the Australian Cultural Orientation and HSS programmes and is available to eligible new arrivals from the humanitarian, family and skilled visa streams. All clients have access to up to 510 hours of English language courses in their first five years of settlement in Australia.
In 2012–13, the programme delivered English language tuition to 59 754 clients. Of the 2012–13 client group, 64 per cent were women and 73 per cent were between 15 to 44 years of age. Clients from the Family Stream comprised 54 per cent, humanitarian entrants 28 per cent, and 18 per cent were dependants of primary visa holders from the skilled stream. Some 39 per cent of clients had less than 10 years of formal education in their first language.
Clients came from 188 countries and the most common first languages spoken were Mandarin, Arabic and Vietnamese.
9.2.6 Diversity and Social Cohesion Programme The Diversity and Social Cohesion Programme provides an environment in which all Australians can develop a sense of belonging by providing opportunities to participate in and contribute to Australian society. This work is undertaken through initiatives addressing cultural, racial and religious intolerance by promoting respect, fairness and a sense of belonging for everyone. It also includes projects which develop the community capacity—building skills of specific community groups under significant pressure due to their cultural, religious or racial diversity.
9.2.7 Settlement Grants Programme The national Settlement Grants Programme aims to help eligible migrants become self-reliant and participate equitably in Australian society as soon as possible after their arrival. In addition to providing settlement services for eligible migrants, it encourages referrals and cooperation among other government services to achieve better client outcomes.
9.2.8 Complex Case Support Some humanitarian entrants have significant and particularly complex needs that affect their settlement and participation in Australian society. The Complex Case Support (CCS) Programme delivers specialised and intensive case management services to humanitarian entrants with exceptional needs.
Australia’s Migration Trends 2012–13 Page 129 of 187
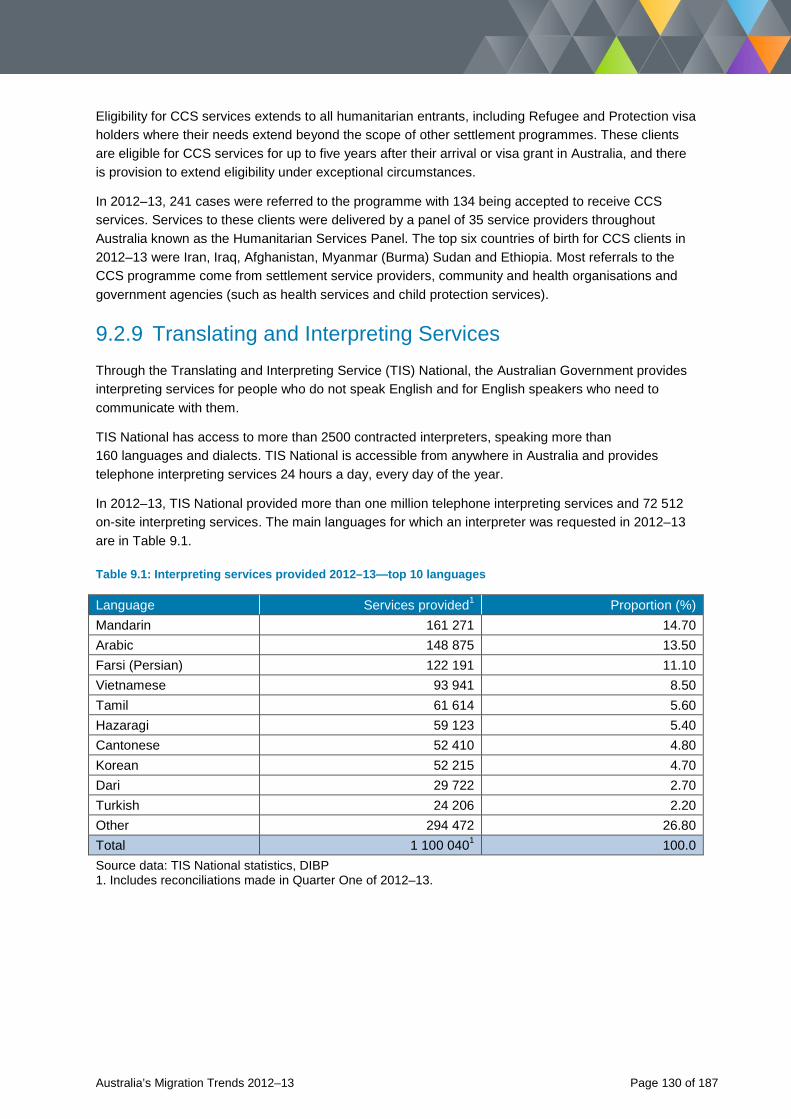
Eligibility for CCS services extends to all humanitarian entrants, including Refugee and Protection visa holders where their needs extend beyond the scope of other settlement programmes. These clients are eligible for CCS services for up to five years after their arrival or visa grant in Australia, and there is provision to extend eligibility under exceptional circumstances.
In 2012–13, 241 cases were referred to the programme with 134 being accepted to receive CCS services. Services to these clients were delivered by a panel of 35 service providers throughout Australia known as the Humanitarian Services Panel. The top six countries of birth for CCS clients in 2012–13 were Iran, Iraq, Afghanistan, Myanmar (Burma) Sudan and Ethiopia. Most referrals to the CCS programme come from settlement service providers, community and health organisations and government agencies (such as health services and child protection services).
9.2.9 Translating and Interpreting Services Through the Translating and Interpreting Service (TIS) National, the Australian Government provides interpreting services for people who do not speak English and for English speakers who need to communicate with them.
TIS National has access to more than 2500 contracted interpreters, speaking more than 160 languages and dialects. TIS National is accessible from anywhere in Australia and provides telephone interpreting services 24 hours a day, every day of the year.
In 2012–13, TIS National provided more than one million telephone interpreting services and 72 512 on-site interpreting services. The main languages for which an interpreter was requested in 2012–13 are in Table 9.1.
Table 9.1: Interpreting services provided 2012–13—top 10 languages
Language Services provided1 Proportion (%) Mandarin 161 271 14.70 Arabic 148 875 13.50 Farsi (Persian) 122 191 11.10 Vietnamese 93 941 8.50 Tamil 61 614 5.60 Hazaragi 59 123 5.40 Cantonese 52 410 4.80 Korean 52 215 4.70 Dari 29 722 2.70 Turkish 24 206 2.20 Other 294 472 26.80 Total 1 100 0401 100.0 Source data: TIS National statistics, DIBP 1. Includes reconciliations made in Quarter One of 2012–13.
Australia’s Migration Trends 2012–13 Page 130 of 187
Free interpreting services are provided through TIS National to approved individuals and organisations to help them communicate with non-English-speaking migrants and humanitarian entrants who are Australian citizens or permanent residents.
Organisations and individuals eligible for these services include:
• private medical practitioners providing services under Medicare • incorporated not-for-profit, non-government, community-based organisations providing casework
and emergency services (subject to their funding arrangements) • Members of Parliament for constituency purposes • local government authorities • trade unions • pharmacies for the purpose of dispensing Pharmaceutical Benefits Scheme medications.
During 2012–13, 180 477 free interpreting services were provided, compared to 188 172 in 2011–12.11 Of these free services, 135 211 were for telephone interpreting and 45 266 for on-site interpreting.
Free translations of personal settlement-related documents are provided to Australian citizens, permanent residents and some temporary visa holders, in the first two years of arriving to settle permanently in Australia. In 2012–13, 7177 applications for free translating services were received, for 10 027 documents. This compares to 2011–12, when 6773 applications were received for 8741 documents.12
11 The decrease in the number of telephone services provided in 2012–13, compared to 2011–12 does not reflect reduced demand. This decrease can be attributed to a disruption in services caused by a fire-related outage at TIS National in late August to early December 2012. All interpreting services were briefly affected, but emergency and priority telephone lines continued uninterrupted. 12 The department’s 2011–12 annual report erroneously reported that 8471 documents were translated under the free translating service in 2011–12.
Australia’s Migration Trends 2012–13 Page 131 of 187

This page has been left intentionally blank.
Australia’s Migration Trends 2012–13 Page 132 of 187

Chapter 10: Labour market
Australia’s Migration Trends 2012–13 Page 133 of 187
10.1 Introduction This chapter uses a range of sources to report on the labour market outcomes of four migrant groups:
• all migrants of working age • migrants who have recently come to Australia through the Skill Stream and Family Stream
components of the Migration Programme • migrants who came to Australia through the Humanitarian Programme. • children of migrants.
The measures used to report on these labour market outcomes include rates of unemployment, rates of participation, rates of full-time employment, the likelihood of skilled employment and median earnings. This Chapter also looks at the varying impacts of increased education and improved English on labour market outcomes.
10.2 Outcomes for Australia’s migrant population In aggregate, the labour outcomes of Australia’s migrant population are commensurate with those born in Australia. Australia’s migrants have an average unemployment rate of 5.9 per cent (year to June 2013), a figure only slightly higher than those born in Australia (5.7 per cent over same period). Also, while the labour force participation rate of Australian-born remains higher than that of overseas-born, the increasing share of skilled migrants coming through the Migration Programme in the past decade means the gap is narrowing (Figure 10.1).
Figure 10.2 highlights the influence of recent migrants on lifting Australia’s overall labour force participation rate. Since 2001, recent migrants have increased this overall rate by 0.6 percentage points. Without recent migrants, participation would only be 65.7 per cent. With recent migrants it is 66.3 per cent. The higher labour force participation rate of recent migrants compared to other migrants and to those born in Australia demonstrates just one aspect of the wide variation in employment outcomes among Australia’s migrant population. This variation can be put down to:
• the type of visa a migrant arrived on • how long a migrant has been in Australia • a migrant’s English proficiency • a migrant’s level of education.
Australia’s Migration Trends 2012–13 Page 134 of 187
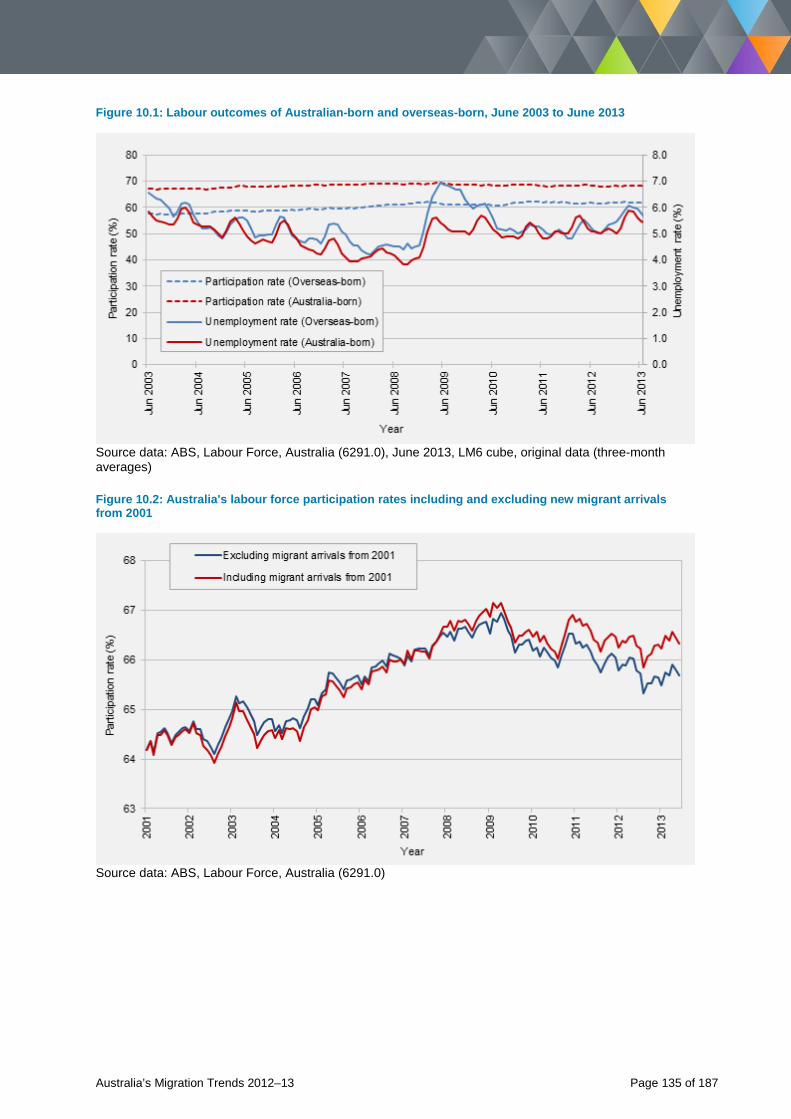
Figure 10.1: Labour outcomes of Australian-born and overseas-born, June 2003 to June 2013
Source data: ABS, Labour Force, Australia (6291.0), June 2013, LM6 cube, original data (three-month averages)
Figure 10.2: Australia's labour force participation rates including and excluding new migrant arrivals from 2001
Source data: ABS, Labour Force, Australia (6291.0)
Australia’s Migration Trends 2012–13 Page 135 of 187
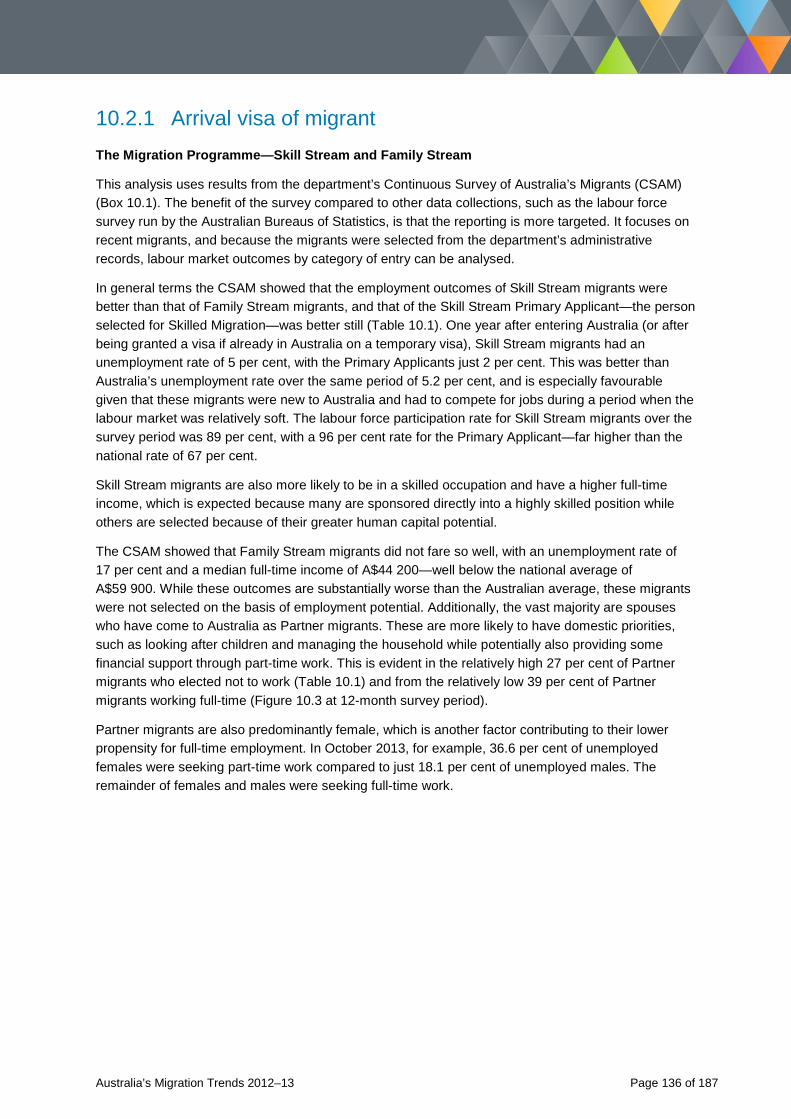
10.2.1 Arrival visa of migrant The Migration Programme—Skill Stream and Family Stream
This analysis uses results from the department’s Continuous Survey of Australia’s Migrants (CSAM) (Box 10.1). The benefit of the survey compared to other data collections, such as the labour force survey run by the Australian Bureaus of Statistics, is that the reporting is more targeted. It focuses on recent migrants, and because the migrants were selected from the department’s administrative records, labour market outcomes by category of entry can be analysed.
In general terms the CSAM showed that the employment outcomes of Skill Stream migrants were better than that of Family Stream migrants, and that of the Skill Stream Primary Applicant—the person selected for Skilled Migration—was better still (Table 10.1). One year after entering Australia (or after being granted a visa if already in Australia on a temporary visa), Skill Stream migrants had an unemployment rate of 5 per cent, with the Primary Applicants just 2 per cent. This was better than Australia’s unemployment rate over the same period of 5.2 per cent, and is especially favourable given that these migrants were new to Australia and had to compete for jobs during a period when the labour market was relatively soft. The labour force participation rate for Skill Stream migrants over the survey period was 89 per cent, with a 96 per cent rate for the Primary Applicant—far higher than the national rate of 67 per cent.
Skill Stream migrants are also more likely to be in a skilled occupation and have a higher full-time income, which is expected because many are sponsored directly into a highly skilled position while others are selected because of their greater human capital potential.
The CSAM showed that Family Stream migrants did not fare so well, with an unemployment rate of 17 per cent and a median full-time income of A$44 200—well below the national average of A$59 900. While these outcomes are substantially worse than the Australian average, these migrants were not selected on the basis of employment potential. Additionally, the vast majority are spouses who have come to Australia as Partner migrants. These are more likely to have domestic priorities, such as looking after children and managing the household while potentially also providing some financial support through part-time work. This is evident in the relatively high 27 per cent of Partner migrants who elected not to work (Table 10.1) and from the relatively low 39 per cent of Partner migrants working full-time (Figure 10.3 at 12-month survey period).
Partner migrants are also predominantly female, which is another factor contributing to their lower propensity for full-time employment. In October 2013, for example, 36.6 per cent of unemployed females were seeking part-time work compared to just 18.1 per cent of unemployed males. The remainder of females and males were seeking full-time work.
Australia’s Migration Trends 2012–13 Page 136 of 187
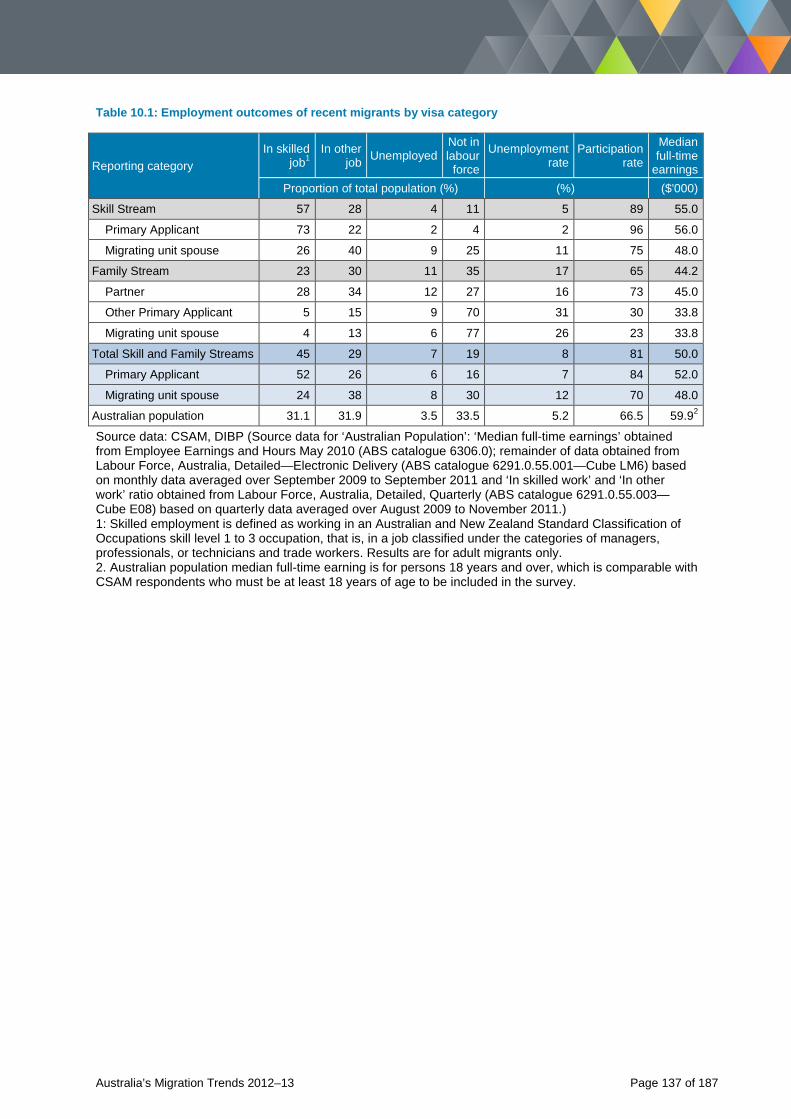
Table 10.1: Employment outcomes of recent migrants by visa category
Reporting category In skilled
job1 In other
job Unemployed Not in labour
force
Unemployment rate
Participation rate
Median full-time
earnings Proportion of total population (%) (%) ($'000)
Skill Stream 57 28 4 11 5 89 55.0
Primary Applicant 73 22 2 4 2 96 56.0
Migrating unit spouse 26 40 9 25 11 75 48.0
Family Stream 23 30 11 35 17 65 44.2
Partner 28 34 12 27 16 73 45.0
Other Primary Applicant 5 15 9 70 31 30 33.8
Migrating unit spouse 4 13 6 77 26 23 33.8
Total Skill and Family Streams 45 29 7 19 8 81 50.0
Primary Applicant 52 26 6 16 7 84 52.0
Migrating unit spouse 24 38 8 30 12 70 48.0
Australian population 31.1 31.9 3.5 33.5 5.2 66.5 59.92
Source data: CSAM, DIBP (Source data for ‘Australian Population’: ‘Median full-time earnings’ obtained from Employee Earnings and Hours May 2010 (ABS catalogue 6306.0); remainder of data obtained from Labour Force, Australia, Detailed—Electronic Delivery (ABS catalogue 6291.0.55.001—Cube LM6) based on monthly data averaged over September 2009 to September 2011 and ‘In skilled work’ and ‘In other work’ ratio obtained from Labour Force, Australia, Detailed, Quarterly (ABS catalogue 6291.0.55.003—Cube E08) based on quarterly data averaged over August 2009 to November 2011.) 1: Skilled employment is defined as working in an Australian and New Zealand Standard Classification of Occupations skill level 1 to 3 occupation, that is, in a job classified under the categories of managers, professionals, or technicians and trade workers. Results are for adult migrants only. 2. Australian population median full-time earning is for persons 18 years and over, which is comparable with CSAM respondents who must be at least 18 years of age to be included in the survey.
Australia’s Migration Trends 2012–13 Page 137 of 187
Box 10.1: The Continuous Survey of Australia’s Migrants (CSAM)
The CSAM is a departmental survey primarily designed to produce information on the labour market outcomes of recent migrants from the Family and Skill Stream.
Migrants are surveyed twice. The first survey is conducted six months after arrival (in the case of offshore migrants) or six months after visa grant (in the case of onshore migrants). The migrant then takes part in a follow-up survey six months later, to capture changes in their labour market performance and economic situation over that period.
The data presented in this section is based on the average of five cohorts of migrants who arrived in Australia (or were granted their onshore permanent visa) between January 2008 and January 2010.
Further information on the survey and its findings are available on: http://www.immi.gov.au/media/research/
Australia’s Migration Trends 2012–13 Page 138 of 187
The Humanitarian Programme
Humanitarian migrants are not surveyed in the CSAM, however all migrants are included in the Census of Population and Housing and through sophisticated data-matching algorithms their responses linked with records from DIBP’s settlement database to produce an integrated dataset of 1.3 million migrant records, representing every migrant added to the population since 2000.13 Analysis of this dataset by the ABS shows that at time of the Census (August 2011) only 39 per cent of Humanitarian Programme Primary Applicants were working and their unemployment rate was 20 per cent. Time in Australia had a very large influence, however, with large unemployment rates improving among the more established refugee cohorts. For example, refugees from Croatia, a cohort that arrived in large numbers 10 to 15 years ago and have since had more time to adjust to Australia than other refugee cohorts, had an unemployment rate of just 4 per cent.
Other improvements in outcomes over time are supported elsewhere in the analysis, which showed that Humanitarian entrants who have been in Australia 6 to 10 years had an employment-to-population ratio of 41 per cent, a figure substantially higher than the 25 per cent rate for those who have been in Australia for five years or less.
The lower rate of employment among more recent migrant groups may also be because some are making a deliberate decision to learn English or undertake further study before actively seeking employment. The report shows that this is a very worthwhile use of their time. Humanitarian migrants who speak good English and have been in Australia 6 to 10 years have an employment-to-population ratio of 47 per cent, far better than the 22 per cent rate for those who have been in Australia a similar length of time but who speak poor English. Similarly, Humanitarian entrants with a degree have an employment-to-population ratio of 55 per cent, slightly higher than the 52 per cent rate for diploma or certificate holders and well ahead of the 25 per cent rate for those who do not have a post school qualification.
13 ABS Census and DIBP settlement database linking was part of the Census Data Enhancement Project. Further information on this project is available at: http://www.abs.gov.au/ausstats/[email protected]/mf/3417.0
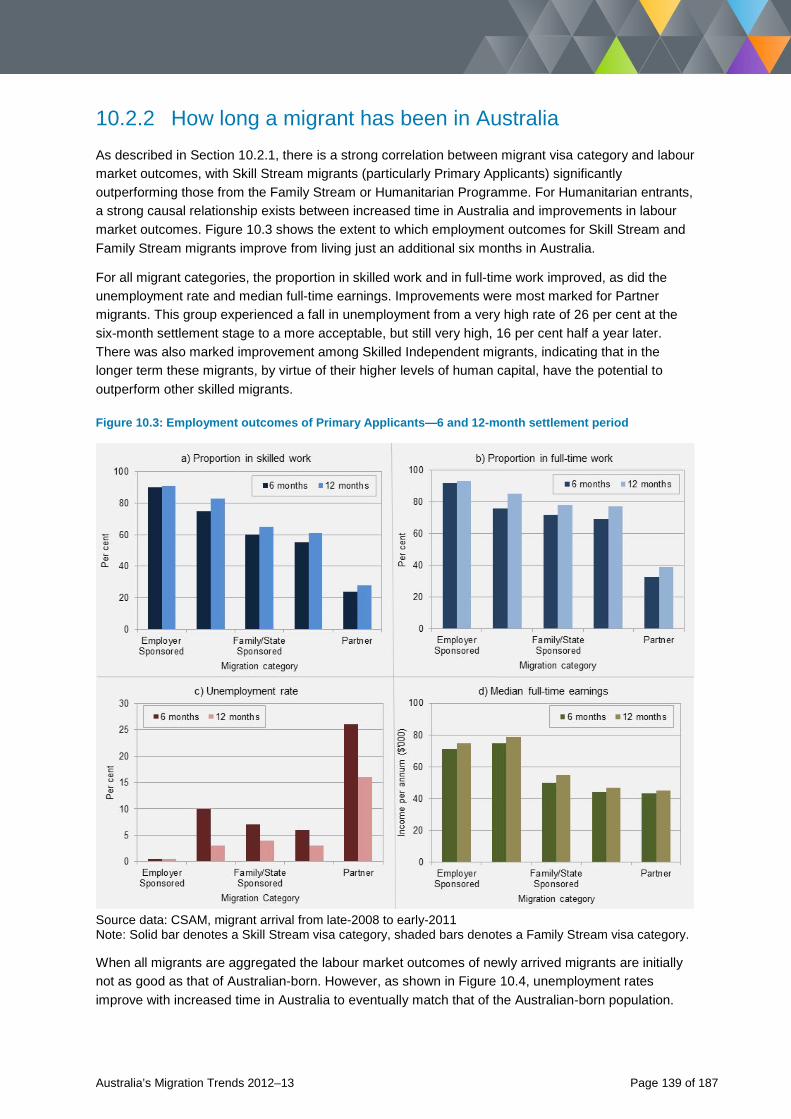
10.2.2 How long a migrant has been in Australia As described in Section 10.2.1, there is a strong correlation between migrant visa category and labour market outcomes, with Skill Stream migrants (particularly Primary Applicants) significantly outperforming those from the Family Stream or Humanitarian Programme. For Humanitarian entrants, a strong causal relationship exists between increased time in Australia and improvements in labour market outcomes. Figure 10.3 shows the extent to which employment outcomes for Skill Stream and Family Stream migrants improve from living just an additional six months in Australia.
For all migrant categories, the proportion in skilled work and in full-time work improved, as did the unemployment rate and median full-time earnings. Improvements were most marked for Partner migrants. This group experienced a fall in unemployment from a very high rate of 26 per cent at the six-month settlement stage to a more acceptable, but still very high, 16 per cent half a year later. There was also marked improvement among Skilled Independent migrants, indicating that in the longer term these migrants, by virtue of their higher levels of human capital, have the potential to outperform other skilled migrants.
Figure 10.3: Employment outcomes of Primary Applicants—6 and 12-month settlement period
Source data: CSAM, migrant arrival from late-2008 to early-2011 Note: Solid bar denotes a Skill Stream visa category, shaded bars denotes a Family Stream visa category.
When all migrants are aggregated the labour market outcomes of newly arrived migrants are initially not as good as that of Australian-born. However, as shown in Figure 10.4, unemployment rates improve with increased time in Australia to eventually match that of the Australian-born population.
Australia’s Migration Trends 2012–13 Page 139 of 187
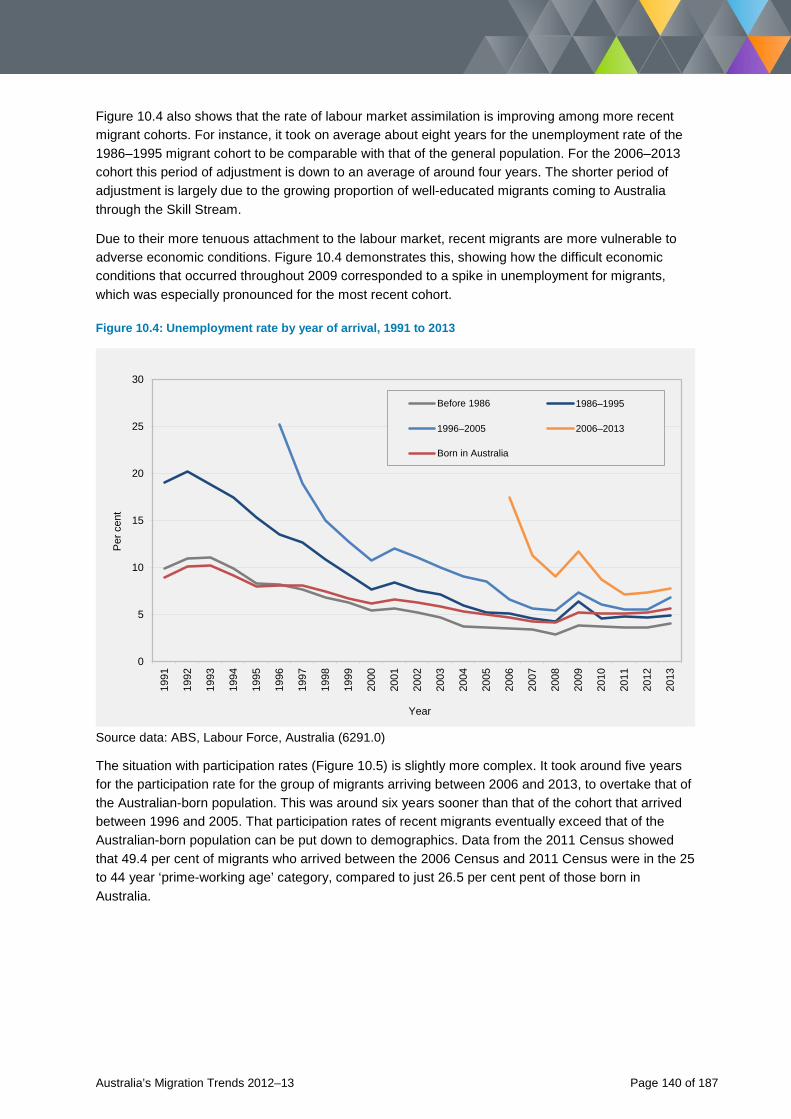
Figure 10.4 also shows that the rate of labour market assimilation is improving among more recent migrant cohorts. For instance, it took on average about eight years for the unemployment rate of the 1986–1995 migrant cohort to be comparable with that of the general population. For the 2006–2013 cohort this period of adjustment is down to an average of around four years. The shorter period of adjustment is largely due to the growing proportion of well-educated migrants coming to Australia through the Skill Stream.
Due to their more tenuous attachment to the labour market, recent migrants are more vulnerable to adverse economic conditions. Figure 10.4 demonstrates this, showing how the difficult economic conditions that occurred throughout 2009 corresponded to a spike in unemployment for migrants, which was especially pronounced for the most recent cohort.
Figure 10.4: Unemployment rate by year of arrival, 1991 to 2013
0
5
10
15
20
25
30
1991
1992
1993
1994
1995
1996
1997
1998
1999
2000
2001
2002
2003
2004
2005
2006
2007
2008
2009
2010
2011
2012
2013
Per
cen
t
Year
Before 1986 1986–1995
1996–2005 2006–2013
Born in Australia
Source data: ABS, Labour Force, Australia (6291.0)
The situation with participation rates (Figure 10.5) is slightly more complex. It took around five years for the participation rate for the group of migrants arriving between 2006 and 2013, to overtake that of the Australian-born population. This was around six years sooner than that of the cohort that arrived between 1996 and 2005. That participation rates of recent migrants eventually exceed that of the Australian-born population can be put down to demographics. Data from the 2011 Census showed that 49.4 per cent of migrants who arrived between the 2006 Census and 2011 Census were in the 25 to 44 year ‘prime-working age’ category, compared to just 26.5 per cent pent of those born in Australia.
Australia’s Migration Trends 2012–13 Page 140 of 187
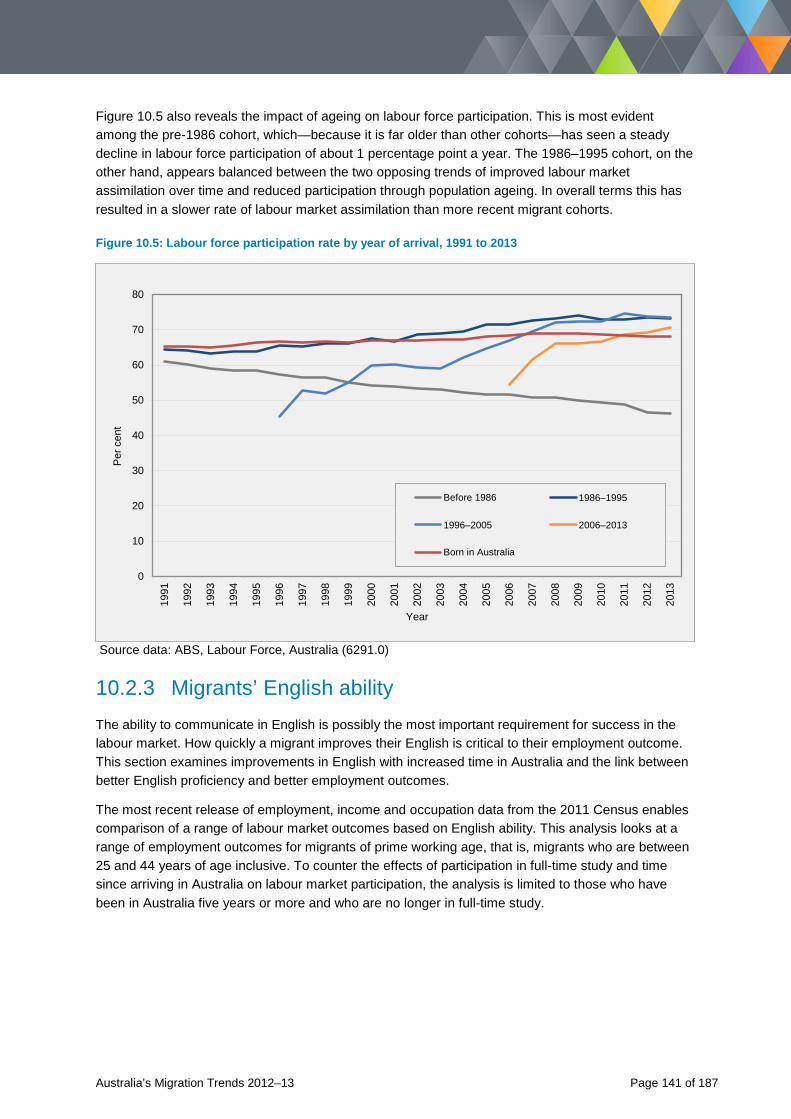
Figure 10.5 also reveals the impact of ageing on labour force participation. This is most evident among the pre-1986 cohort, which—because it is far older than other cohorts—has seen a steady decline in labour force participation of about 1 percentage point a year. The 1986–1995 cohort, on the other hand, appears balanced between the two opposing trends of improved labour market assimilation over time and reduced participation through population ageing. In overall terms this has resulted in a slower rate of labour market assimilation than more recent migrant cohorts.
Figure 10.5: Labour force participation rate by year of arrival, 1991 to 2013
0
10
20
30
40
50
60
70
80
1991
1992
1993
1994
1995
1996
1997
1998
1999
2000
2001
2002
2003
2004
2005
2006
2007
2008
2009
2010
2011
2012
2013
Per
cen
t
Year
Before 1986 1986–1995
1996–2005 2006–2013
Born in Australia
Source data: ABS, Labour Force, Australia (6291.0)
10.2.3 Migrants’ English ability The ability to communicate in English is possibly the most important requirement for success in the labour market. How quickly a migrant improves their English is critical to their employment outcome. This section examines improvements in English with increased time in Australia and the link between better English proficiency and better employment outcomes.
The most recent release of employment, income and occupation data from the 2011 Census enables comparison of a range of labour market outcomes based on English ability. This analysis looks at a range of employment outcomes for migrants of prime working age, that is, migrants who are between 25 and 44 years of age inclusive. To counter the effects of participation in full-time study and time since arriving in Australia on labour market participation, the analysis is limited to those who have been in Australia five years or more and who are no longer in full-time study.
Australia’s Migration Trends 2012–13 Page 141 of 187
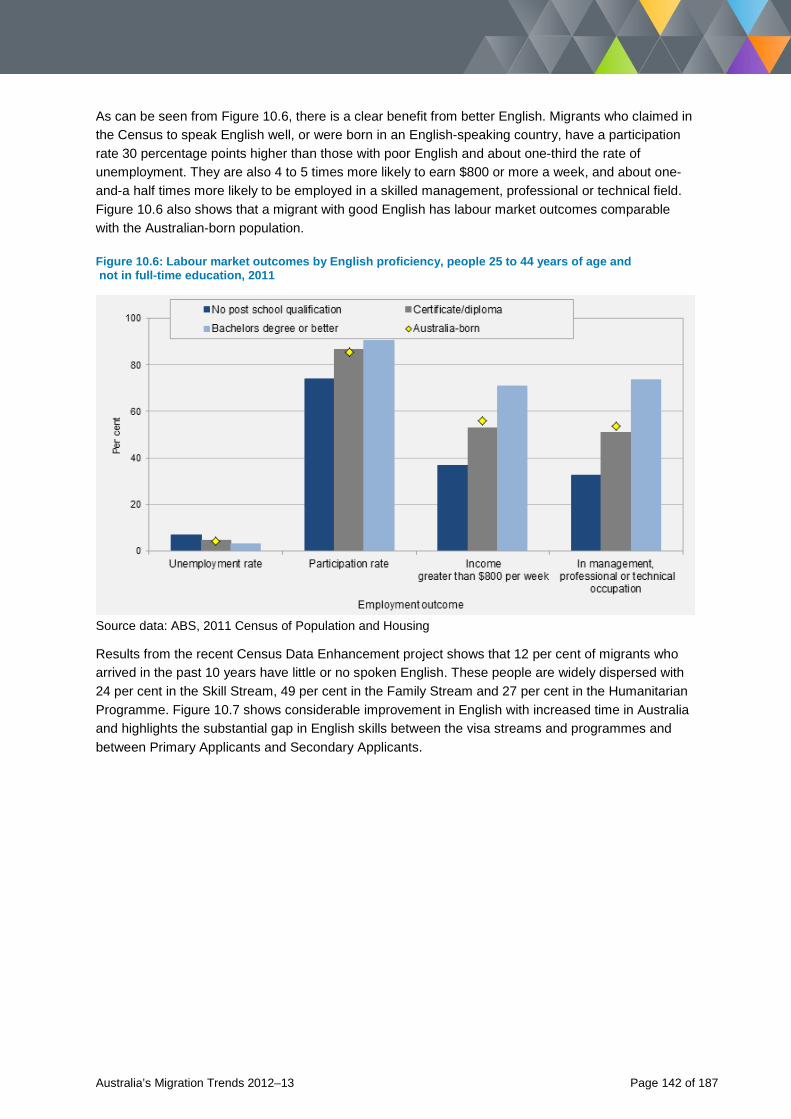
As can be seen from Figure 10.6, there is a clear benefit from better English. Migrants who claimed in the Census to speak English well, or were born in an English-speaking country, have a participation rate 30 percentage points higher than those with poor English and about one-third the rate of unemployment. They are also 4 to 5 times more likely to earn $800 or more a week, and about one-and-a half times more likely to be employed in a skilled management, professional or technical field. Figure 10.6 also shows that a migrant with good English has labour market outcomes comparable with the Australian-born population.
Figure 10.6: Labour market outcomes by English proficiency, people 25 to 44 years of age and not in full-time education, 2011
Source data: ABS, 2011 Census of Population and Housing
Results from the recent Census Data Enhancement project shows that 12 per cent of migrants who arrived in the past 10 years have little or no spoken English. These people are widely dispersed with 24 per cent in the Skill Stream, 49 per cent in the Family Stream and 27 per cent in the Humanitarian Programme. Figure 10.7 shows considerable improvement in English with increased time in Australia and highlights the substantial gap in English skills between the visa streams and programmes and between Primary Applicants and Secondary Applicants.
Australia’s Migration Trends 2012–13 Page 142 of 187
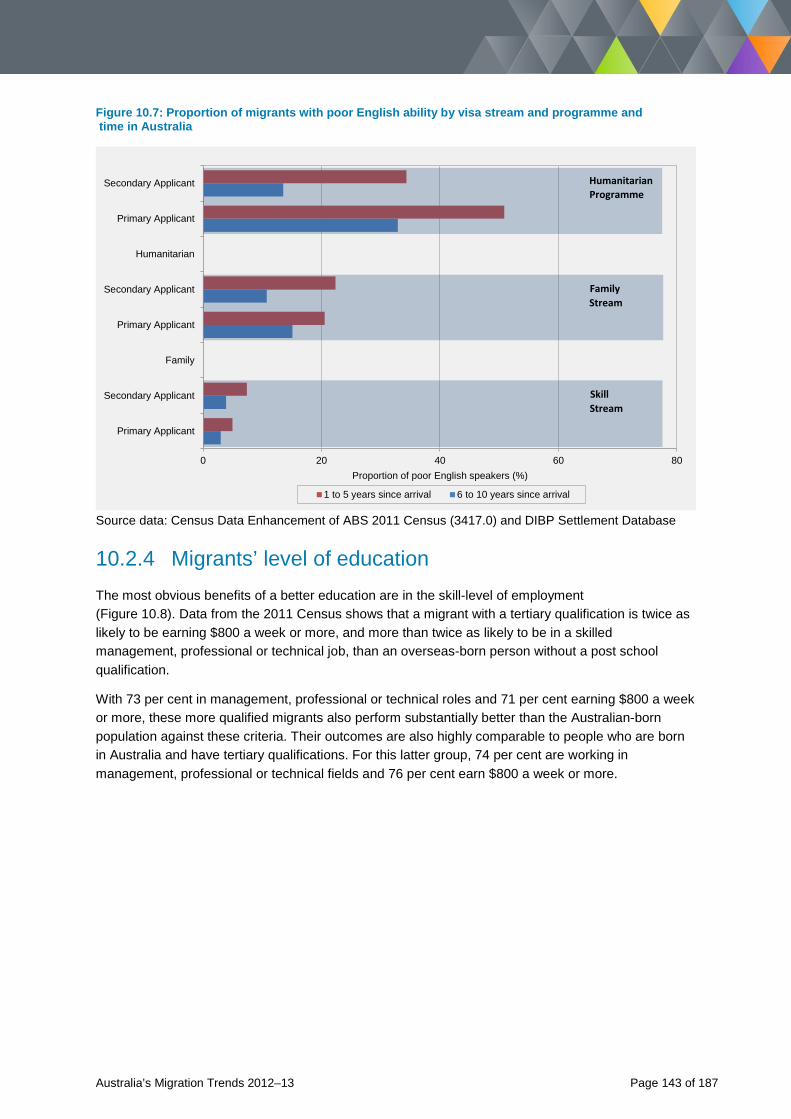
Figure 10.7: Proportion of migrants with poor English ability by visa stream and programme and time in Australia
0 20 40 60 80
Primary Applicant
Secondary Applicant
Family
Primary Applicant
Secondary Applicant
Humanitarian
Primary Applicant
Secondary Applicant
Proportion of poor English speakers (%)
1 to 5 years since arrival 6 to 10 years since arrival
HumanitarianProgramme
Family Stream
SkillStream
Source data: Census Data Enhancement of ABS 2011 Census (3417.0) and DIBP Settlement Database
10.2.4 Migrants’ level of education The most obvious benefits of a better education are in the skill-level of employment (Figure 10.8). Data from the 2011 Census shows that a migrant with a tertiary qualification is twice as likely to be earning $800 a week or more, and more than twice as likely to be in a skilled management, professional or technical job, than an overseas-born person without a post school qualification.
With 73 per cent in management, professional or technical roles and 71 per cent earning $800 a week or more, these more qualified migrants also perform substantially better than the Australian-born population against these criteria. Their outcomes are also highly comparable to people who are born in Australia and have tertiary qualifications. For this latter group, 74 per cent are working in management, professional or technical fields and 76 per cent earn $800 a week or more.
Australia’s Migration Trends 2012–13 Page 143 of 187
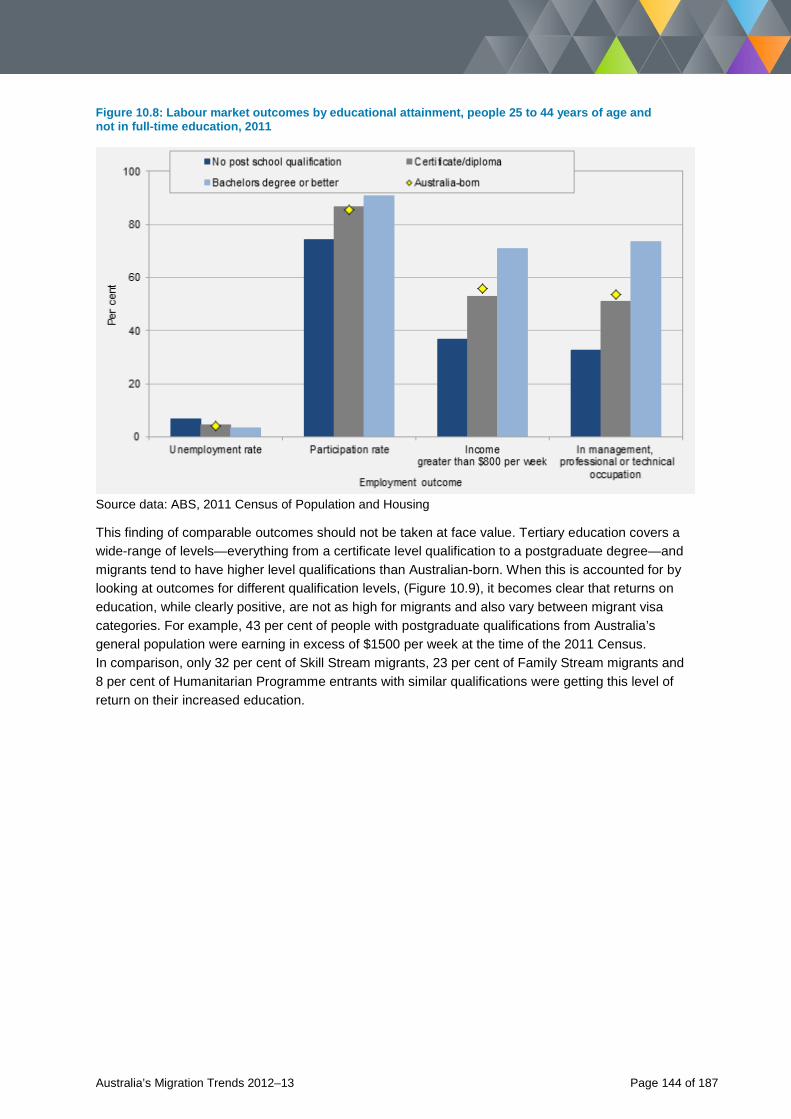
Figure 10.8: Labour market outcomes by educational attainment, people 25 to 44 years of age and not in full-time education, 2011
Source data: ABS, 2011 Census of Population and Housing
This finding of comparable outcomes should not be taken at face value. Tertiary education covers a wide-range of levels—everything from a certificate level qualification to a postgraduate degree—and migrants tend to have higher level qualifications than Australian-born. When this is accounted for by looking at outcomes for different qualification levels, (Figure 10.9), it becomes clear that returns on education, while clearly positive, are not as high for migrants and also vary between migrant visa categories. For example, 43 per cent of people with postgraduate qualifications from Australia’s general population were earning in excess of $1500 per week at the time of the 2011 Census. In comparison, only 32 per cent of Skill Stream migrants, 23 per cent of Family Stream migrants and 8 per cent of Humanitarian Programme entrants with similar qualifications were getting this level of return on their increased education.
Australia’s Migration Trends 2012–13 Page 144 of 187
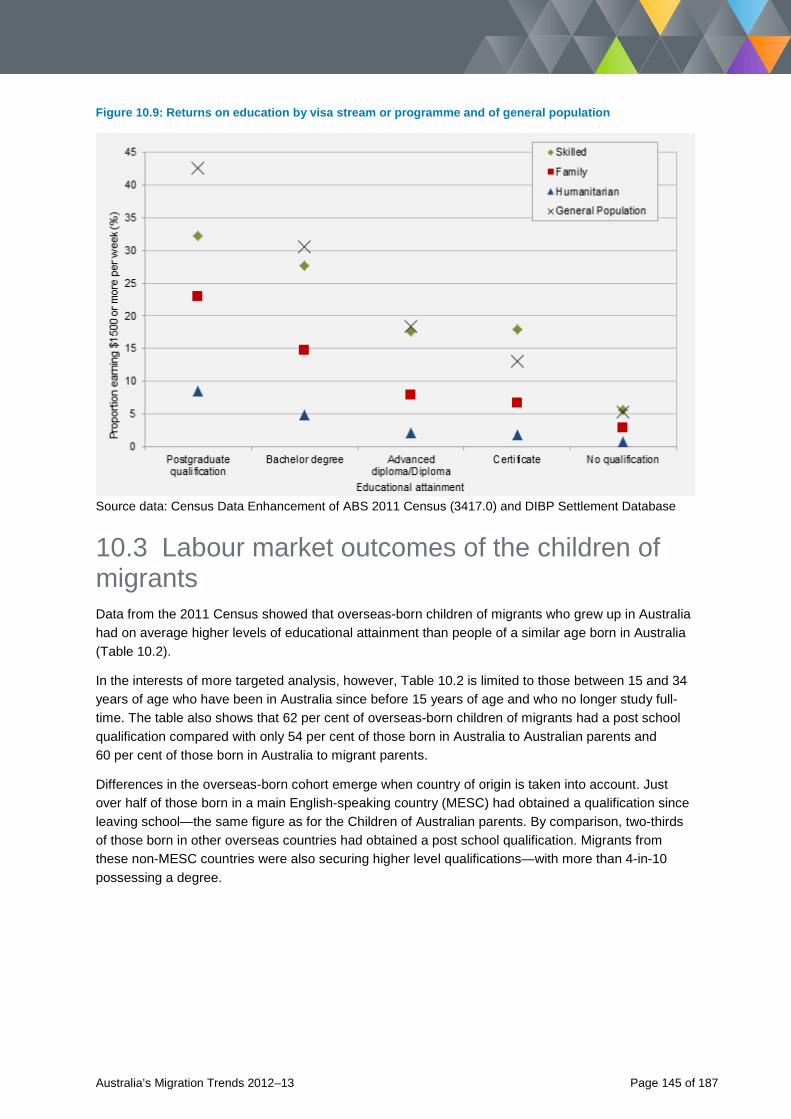
Figure 10.9: Returns on education by visa stream or programme and of general population
Source data: Census Data Enhancement of ABS 2011 Census (3417.0) and DIBP Settlement Database
10.3 Labour market outcomes of the children of migrants Data from the 2011 Census showed that overseas-born children of migrants who grew up in Australia had on average higher levels of educational attainment than people of a similar age born in Australia (Table 10.2).
In the interests of more targeted analysis, however, Table 10.2 is limited to those between 15 and 34 years of age who have been in Australia since before 15 years of age and who no longer study full-time. The table also shows that 62 per cent of overseas-born children of migrants had a post school qualification compared with only 54 per cent of those born in Australia to Australian parents and 60 per cent of those born in Australia to migrant parents.
Differences in the overseas-born cohort emerge when country of origin is taken into account. Just over half of those born in a main English-speaking country (MESC) had obtained a qualification since leaving school—the same figure as for the Children of Australian parents. By comparison, two-thirds of those born in other overseas countries had obtained a post school qualification. Migrants from these non-MESC countries were also securing higher level qualifications—with more than 4-in-10 possessing a degree.
Australia’s Migration Trends 2012–13 Page 145 of 187
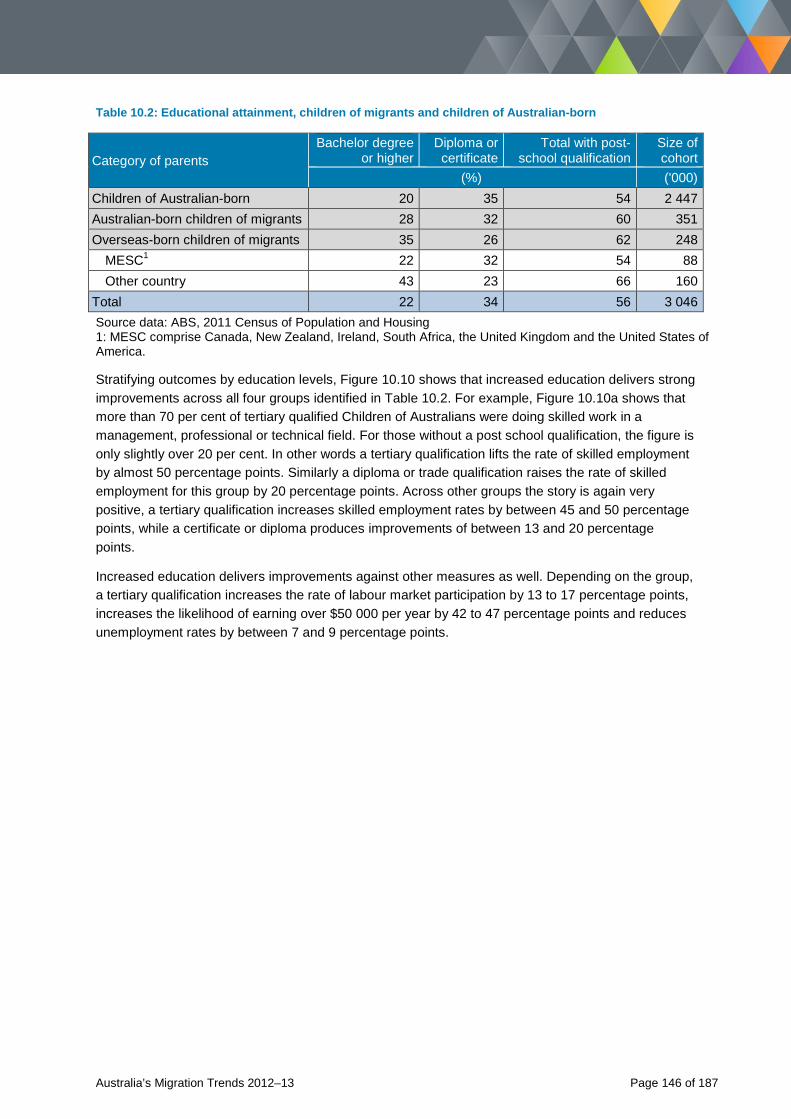
Table 10.2: Educational attainment, children of migrants and children of Australian-born
Category of parents Bachelor degree
or higher Diploma or certificate
Total with post-school qualification
Size of cohort
(%) ('000) Children of Australian-born 20 35 54 2 447 Australian-born children of migrants 28 32 60 351 Overseas-born children of migrants 35 26 62 248 MESC1 22 32 54 88 Other country 43 23 66 160 Total 22 34 56 3 046 Source data: ABS, 2011 Census of Population and Housing 1: MESC comprise Canada, New Zealand, Ireland, South Africa, the United Kingdom and the United States of America.
Stratifying outcomes by education levels, Figure 10.10 shows that increased education delivers strong improvements across all four groups identified in Table 10.2. For example, Figure 10.10a shows that more than 70 per cent of tertiary qualified Children of Australians were doing skilled work in a management, professional or technical field. For those without a post school qualification, the figure is only slightly over 20 per cent. In other words a tertiary qualification lifts the rate of skilled employment by almost 50 percentage points. Similarly a diploma or trade qualification raises the rate of skilled employment for this group by 20 percentage points. Across other groups the story is again very positive, a tertiary qualification increases skilled employment rates by between 45 and 50 percentage points, while a certificate or diploma produces improvements of between 13 and 20 percentage points.
Increased education delivers improvements against other measures as well. Depending on the group, a tertiary qualification increases the rate of labour market participation by 13 to 17 percentage points, increases the likelihood of earning over $50 000 per year by 42 to 47 percentage points and reduces unemployment rates by between 7 and 9 percentage points.
Australia’s Migration Trends 2012–13 Page 146 of 187
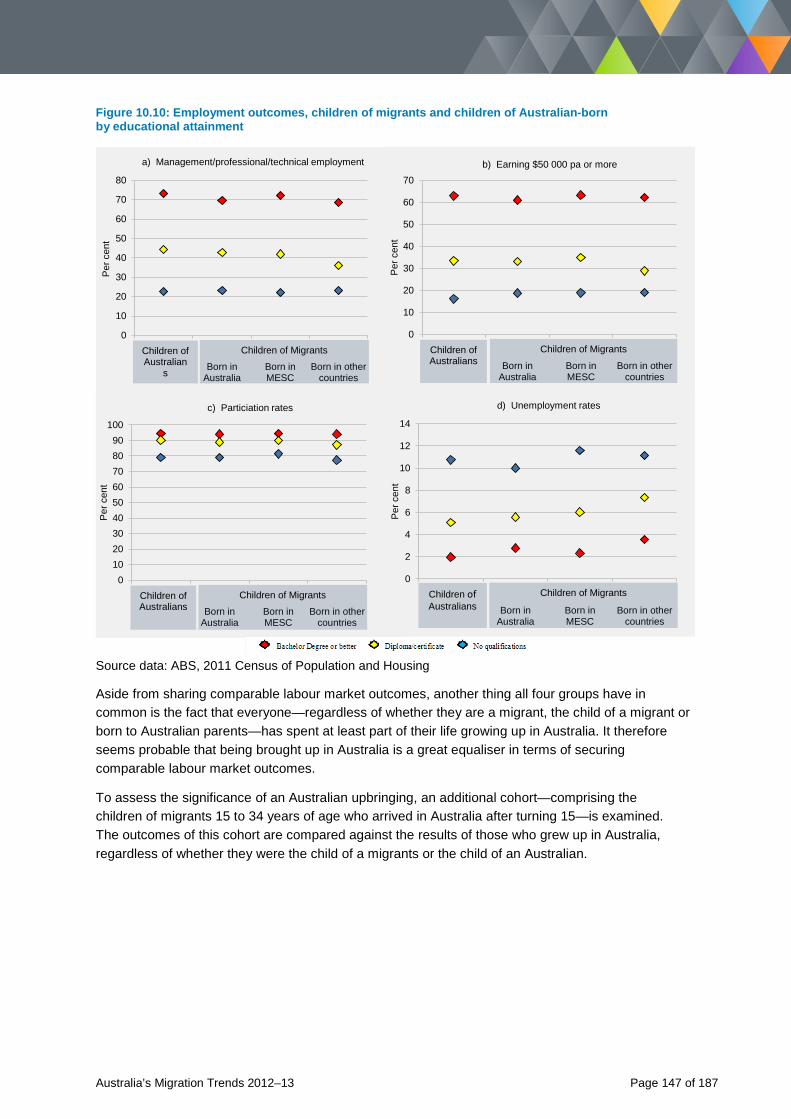
Figure 10.10: Employment outcomes, children of migrants and children of Australian-born by educational attainment
0
10
20
30
40
50
60
70
80
Born inAustralia
Born inMESC
Born in othercountries
Per
cen
t
a) Management/professional/technical employment
Children of MigrantsChildren of Australian
s
0102030405060708090
100
Born inAustralia
Born inMESC
Born in othercountries
Per
cen
t
c) Particiation rates
Children of MigrantsChildren of Australians
0
2
4
6
8
10
12
14
Born inAustralia
Born inMESC
Born in othercountries
Per
cen
td) Unemployment rates
Children of MigrantsChildren of Australians
0
10
20
30
40
50
60
70
Born inAustralia
Born inMESC
Born in othercountries
Per
cen
t
b) Earning $50 000 pa or more
Children of MigrantsChildren of Australians
Source data: ABS, 2011 Census of Population and Housing
Aside from sharing comparable labour market outcomes, another thing all four groups have in common is the fact that everyone—regardless of whether they are a migrant, the child of a migrant or born to Australian parents—has spent at least part of their life growing up in Australia. It therefore seems probable that being brought up in Australia is a great equaliser in terms of securing comparable labour market outcomes.
To assess the significance of an Australian upbringing, an additional cohort—comprising the children of migrants 15 to 34 years of age who arrived in Australia after turning 15—is examined. The outcomes of this cohort are compared against the results of those who grew up in Australia, regardless of whether they were the child of a migrants or the child of an Australian.
Australia’s Migration Trends 2012–13 Page 147 of 187
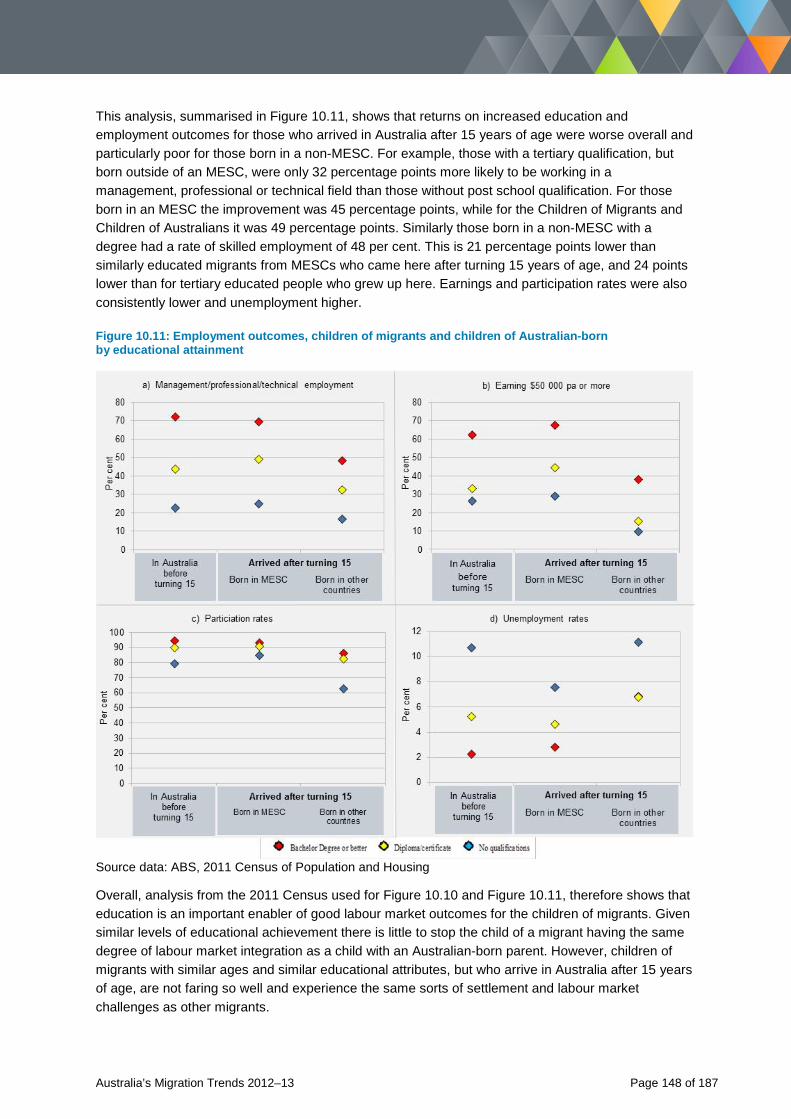
This analysis, summarised in Figure 10.11, shows that returns on increased education and employment outcomes for those who arrived in Australia after 15 years of age were worse overall and particularly poor for those born in a non-MESC. For example, those with a tertiary qualification, but born outside of an MESC, were only 32 percentage points more likely to be working in a management, professional or technical field than those without post school qualification. For those born in an MESC the improvement was 45 percentage points, while for the Children of Migrants and Children of Australians it was 49 percentage points. Similarly those born in a non-MESC with a degree had a rate of skilled employment of 48 per cent. This is 21 percentage points lower than similarly educated migrants from MESCs who came here after turning 15 years of age, and 24 points lower than for tertiary educated people who grew up here. Earnings and participation rates were also consistently lower and unemployment higher.
Figure 10.11: Employment outcomes, children of migrants and children of Australian-born by educational attainment
Source data: ABS, 2011 Census of Population and Housing
Overall, analysis from the 2011 Census used for Figure 10.10 and Figure 10.11, therefore shows that education is an important enabler of good labour market outcomes for the children of migrants. Given similar levels of educational achievement there is little to stop the child of a migrant having the same degree of labour market integration as a child with an Australian-born parent. However, children of migrants with similar ages and similar educational attributes, but who arrive in Australia after 15 years of age, are not faring so well and experience the same sorts of settlement and labour market challenges as other migrants.
Australia’s Migration Trends 2012–13 Page 148 of 187
Chapter 11: Elderly migrants
Australia’s Migration Trends 2012–13 Page 149 of 187
11.1 Introduction It is well recognised that Australia’s migrant population makes an important contribution in developing society, building the economy, improving international links and helping Australia play its part on the global stage. What is sometimes overlooked and under-analysed is the significant role that the elderly and aged migrant population, the majority of whom are long-time residents of Australia, have made to the country’s economic and social growth.
The purpose of this special focus chapter is to explore Australia’s elderly and aged migrant cohort.
This analysis begins with a discussion on the spectacular growth of the elderly and aged cohort over the past quarter of a century—growth driven more by population ageing than an influx of new arrivals—and its anticipated growth over the next 25 years. This is followed by discussion of the demographic characteristics of Australia’s elderly and aged migrant population, such as age, gender and origin, and discussion on the range of migration pathways for older migrants into Australia.
Social and economic contributions of this cohort are also explored, considering their circumstances post migration and whether Australia’s social services adequately cater for their needs. Finally this chapter explores the interconnected theme of ageing and poverty among the migrant cohort.
Box 11.1: Scope of this analysis
For the purposes of this chapter elderly migrants are defined as those between 65 and 84 years of age and the aged cohort as those 85 years of age and over. Much of the analysis looks at these two age cohorts separately, which provides additional insights into how Australia’s aged population might look in future.
Research for the special focus chapter involved analysis of data from the 1986 and 2011 Census of Population and Housing and the department’s current visa programmes. External reports and surveys were also used to analyse the elderly and aged migrant cohort.
Australia’s Migration Trends 2012–13 Page 150 of 187
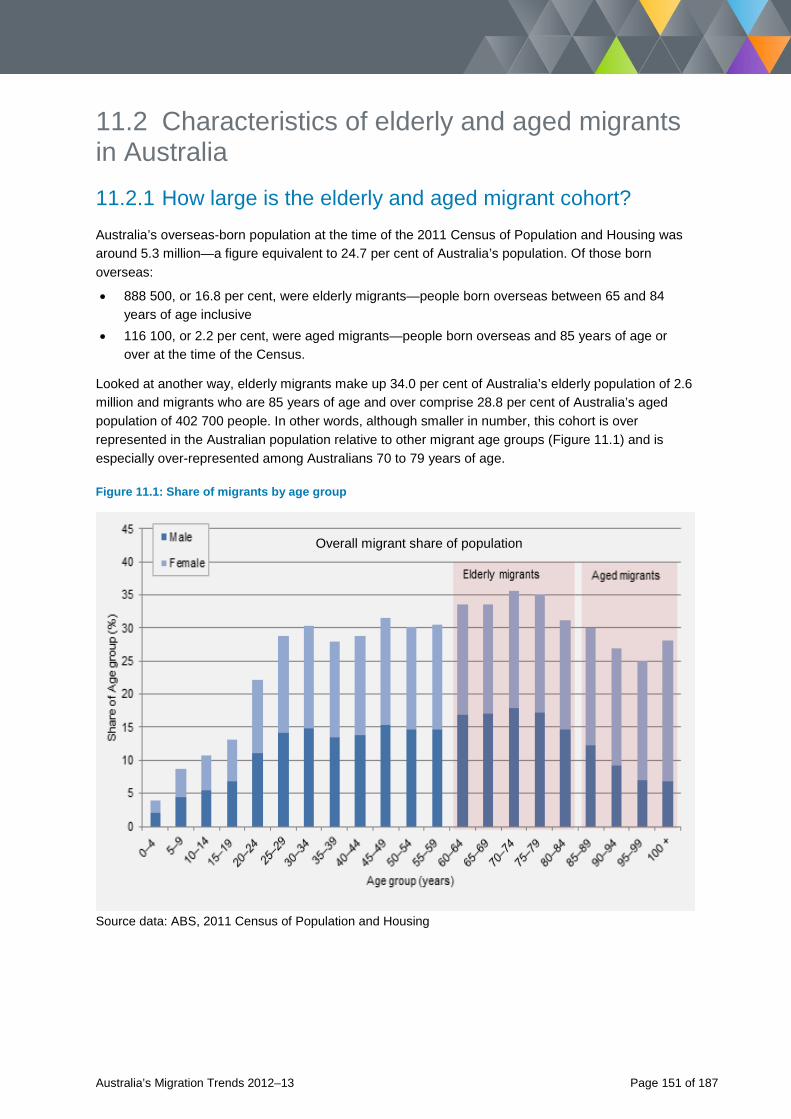
11.2 Characteristics of elderly and aged migrants in Australia 11.2.1 How large is the elderly and aged migrant cohort? Australia’s overseas-born population at the time of the 2011 Census of Population and Housing was around 5.3 million—a figure equivalent to 24.7 per cent of Australia’s population. Of those born overseas:
• 888 500, or 16.8 per cent, were elderly migrants—people born overseas between 65 and 84 years of age inclusive
• 116 100, or 2.2 per cent, were aged migrants—people born overseas and 85 years of age or over at the time of the Census.
Looked at another way, elderly migrants make up 34.0 per cent of Australia’s elderly population of 2.6 million and migrants who are 85 years of age and over comprise 28.8 per cent of Australia’s aged population of 402 700 people. In other words, although smaller in number, this cohort is over represented in the Australian population relative to other migrant age groups (Figure 11.1) and is especially over-represented among Australians 70 to 79 years of age.
Figure 11.1: Share of migrants by age group
Overall migrant share of population
Source data: ABS, 2011 Census of Population and Housing
Australia’s Migration Trends 2012–13 Page 151 of 187
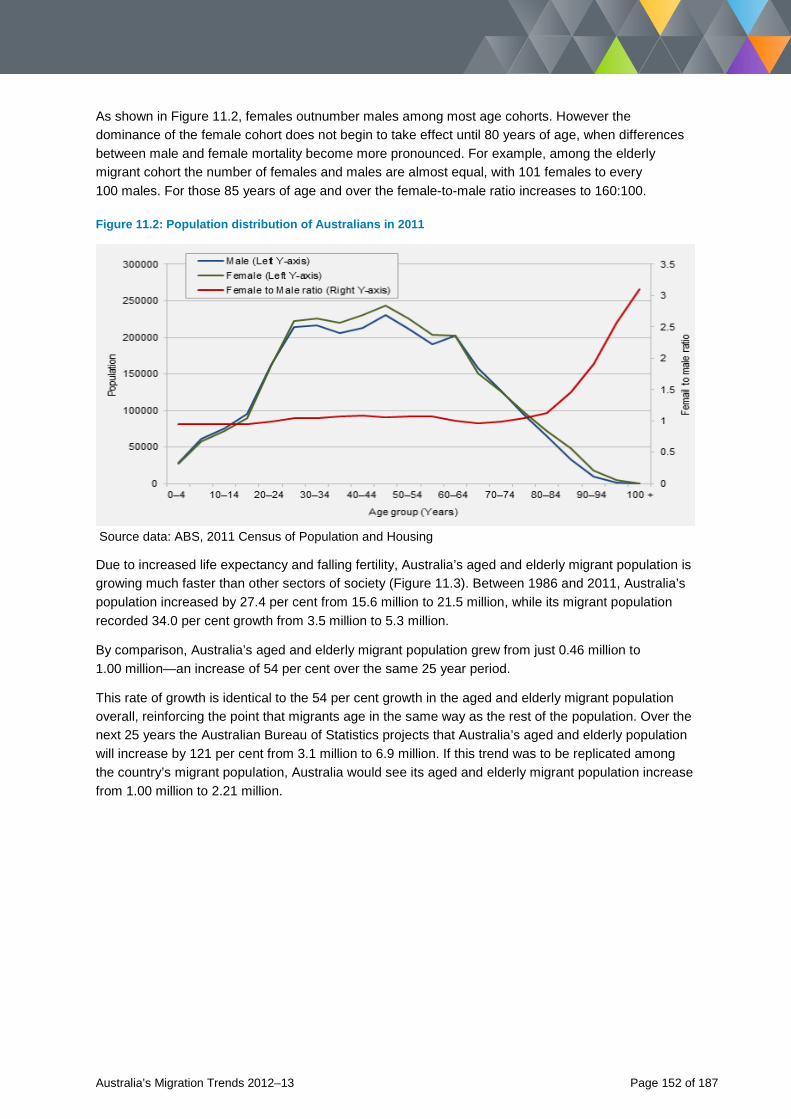
As shown in Figure 11.2, females outnumber males among most age cohorts. However the dominance of the female cohort does not begin to take effect until 80 years of age, when differences between male and female mortality become more pronounced. For example, among the elderly migrant cohort the number of females and males are almost equal, with 101 females to every 100 males. For those 85 years of age and over the female-to-male ratio increases to 160:100.
Figure 11.2: Population distribution of Australians in 2011
Source data: ABS, 2011 Census of Population and Housing
Due to increased life expectancy and falling fertility, Australia’s aged and elderly migrant population is growing much faster than other sectors of society (Figure 11.3). Between 1986 and 2011, Australia’s population increased by 27.4 per cent from 15.6 million to 21.5 million, while its migrant population recorded 34.0 per cent growth from 3.5 million to 5.3 million.
By comparison, Australia’s aged and elderly migrant population grew from just 0.46 million to 1.00 million—an increase of 54 per cent over the same 25 year period.
This rate of growth is identical to the 54 per cent growth in the aged and elderly migrant population overall, reinforcing the point that migrants age in the same way as the rest of the population. Over the next 25 years the Australian Bureau of Statistics projects that Australia’s aged and elderly population will increase by 121 per cent from 3.1 million to 6.9 million. If this trend was to be replicated among the country’s migrant population, Australia would see its aged and elderly migrant population increase from 1.00 million to 2.21 million.
Australia’s Migration Trends 2012–13 Page 152 of 187
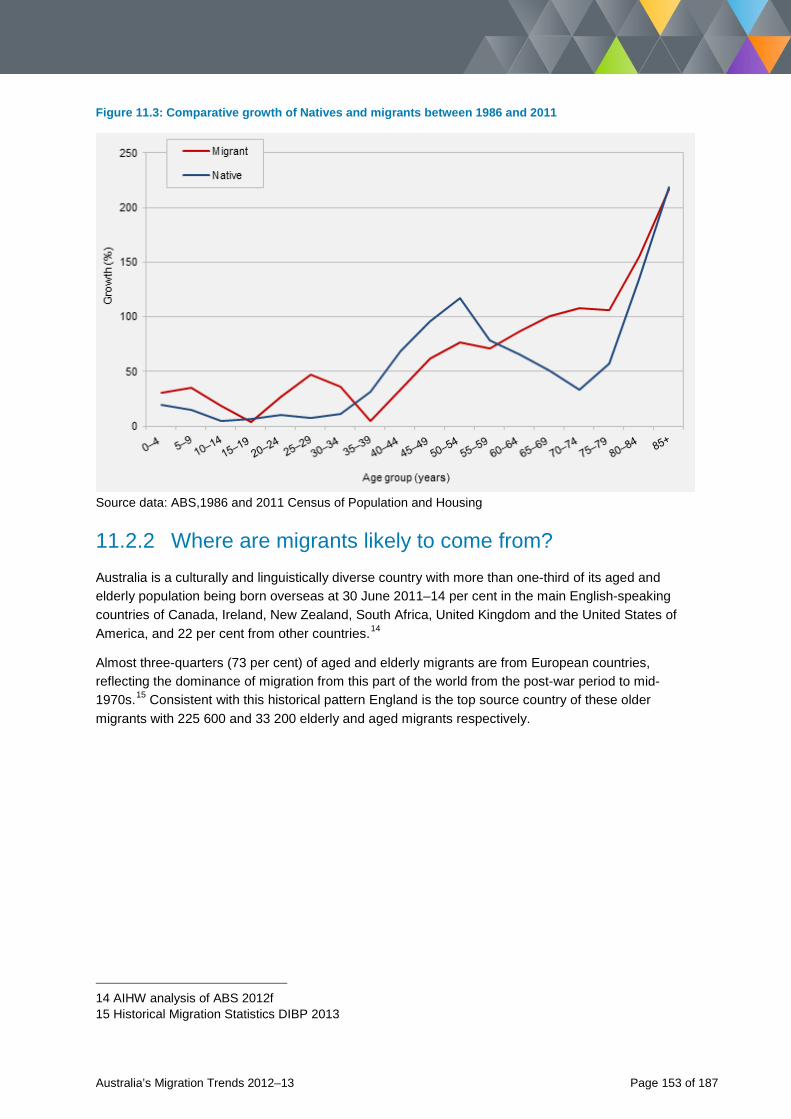
Figure 11.3: Comparative growth of Natives and migrants between 1986 and 2011
Source data: ABS,1986 and 2011 Census of Population and Housing
11.2.2 Where are migrants likely to come from? Australia is a culturally and linguistically diverse country with more than one-third of its aged and elderly population being born overseas at 30 June 2011–14 per cent in the main English-speaking countries of Canada, Ireland, New Zealand, South Africa, United Kingdom and the United States of America, and 22 per cent from other countries.14
Almost three-quarters (73 per cent) of aged and elderly migrants are from European countries, reflecting the dominance of migration from this part of the world from the post-war period to mid-1970s.15 Consistent with this historical pattern England is the top source country of these older migrants with 225 600 and 33 200 elderly and aged migrants respectively.
14 AIHW analysis of ABS 2012f 15 Historical Migration Statistics DIBP 2013
Australia’s Migration Trends 2012–13 Page 153 of 187
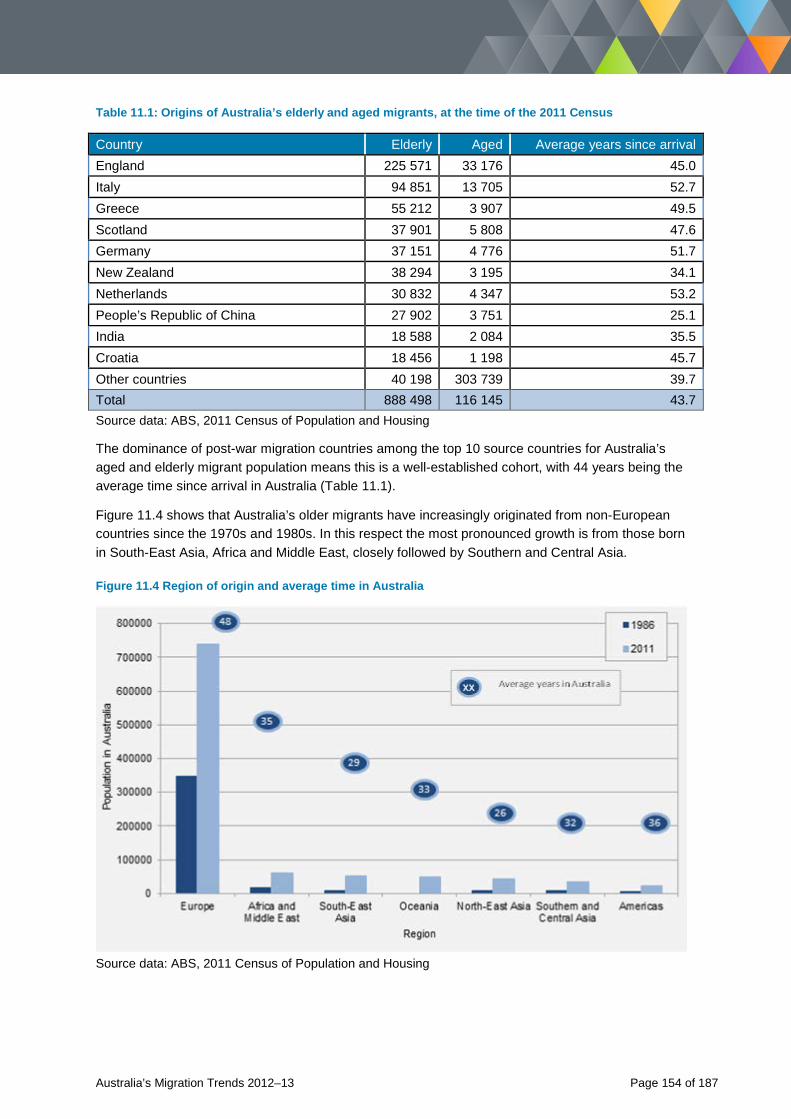
Table 11.1: Origins of Australia’s elderly and aged migrants, at the time of the 2011 Census
Country Elderly Aged Average years since arrival England 225 571 33 176 45.0 Italy 94 851 13 705 52.7 Greece 55 212 3 907 49.5 Scotland 37 901 5 808 47.6 Germany 37 151 4 776 51.7 New Zealand 38 294 3 195 34.1 Netherlands 30 832 4 347 53.2 People’s Republic of China 27 902 3 751 25.1 India 18 588 2 084 35.5 Croatia 18 456 1 198 45.7 Other countries 40 198 303 739 39.7 Total 888 498 116 145 43.7 Source data: ABS, 2011 Census of Population and Housing
The dominance of post-war migration countries among the top 10 source countries for Australia’s aged and elderly migrant population means this is a well-established cohort, with 44 years being the average time since arrival in Australia (Table 11.1).
Figure 11.4 shows that Australia’s older migrants have increasingly originated from non-European countries since the 1970s and 1980s. In this respect the most pronounced growth is from those born in South-East Asia, Africa and Middle East, closely followed by Southern and Central Asia.
Figure 11.4 Region of origin and average time in Australia
Source data: ABS, 2011 Census of Population and Housing
Australia’s Migration Trends 2012–13 Page 154 of 187
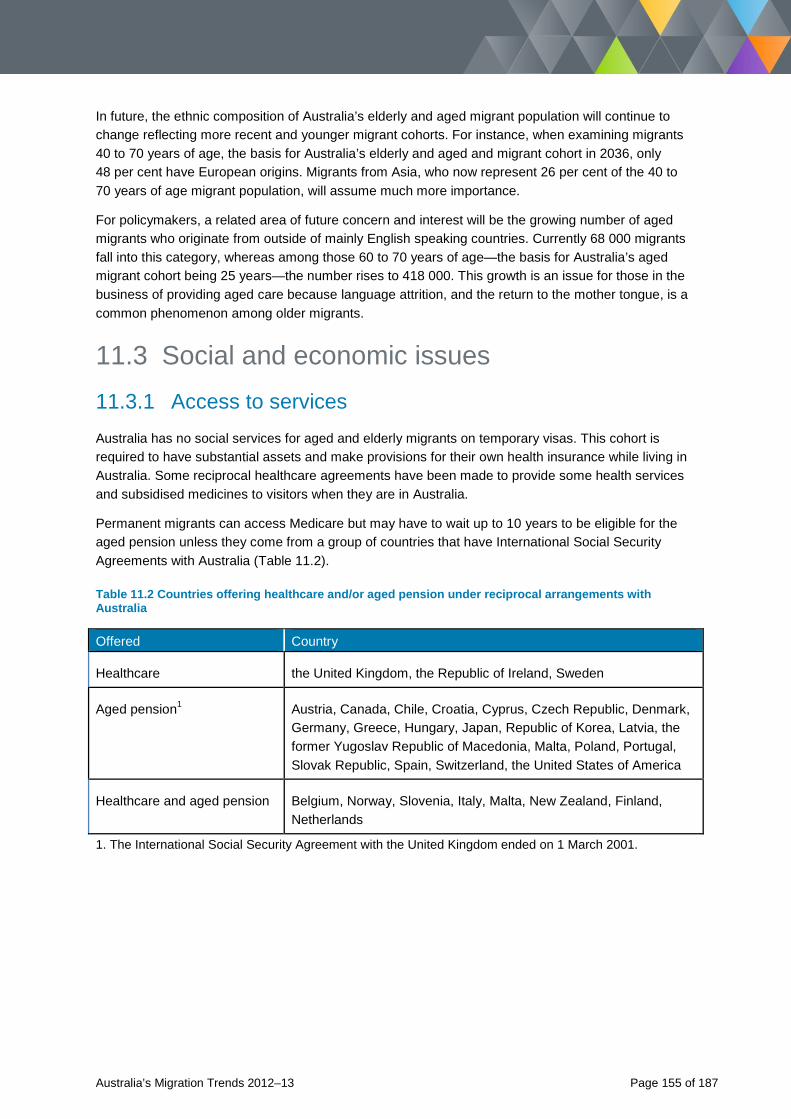
In future, the ethnic composition of Australia’s elderly and aged migrant population will continue to change reflecting more recent and younger migrant cohorts. For instance, when examining migrants 40 to 70 years of age, the basis for Australia’s elderly and aged and migrant cohort in 2036, only 48 per cent have European origins. Migrants from Asia, who now represent 26 per cent of the 40 to 70 years of age migrant population, will assume much more importance.
For policymakers, a related area of future concern and interest will be the growing number of aged migrants who originate from outside of mainly English speaking countries. Currently 68 000 migrants fall into this category, whereas among those 60 to 70 years of age—the basis for Australia’s aged migrant cohort being 25 years—the number rises to 418 000. This growth is an issue for those in the business of providing aged care because language attrition, and the return to the mother tongue, is a common phenomenon among older migrants.
11.3 Social and economic issues 11.3.1 Access to services Australia has no social services for aged and elderly migrants on temporary visas. This cohort is required to have substantial assets and make provisions for their own health insurance while living in Australia. Some reciprocal healthcare agreements have been made to provide some health services and subsidised medicines to visitors when they are in Australia.
Permanent migrants can access Medicare but may have to wait up to 10 years to be eligible for the aged pension unless they come from a group of countries that have International Social Security Agreements with Australia (Table 11.2).
Table 11.2 Countries offering healthcare and/or aged pension under reciprocal arrangements with Australia
Offered Country
Healthcare the United Kingdom, the Republic of Ireland, Sweden
Aged pension1 Austria, Canada, Chile, Croatia, Cyprus, Czech Republic, Denmark, Germany, Greece, Hungary, Japan, Republic of Korea, Latvia, the former Yugoslav Republic of Macedonia, Malta, Poland, Portugal, Slovak Republic, Spain, Switzerland, the United States of America
Healthcare and aged pension Belgium, Norway, Slovenia, Italy, Malta, New Zealand, Finland, Netherlands
1. The International Social Security Agreement with the United Kingdom ended on 1 March 2001.
Australia’s Migration Trends 2012–13 Page 155 of 187
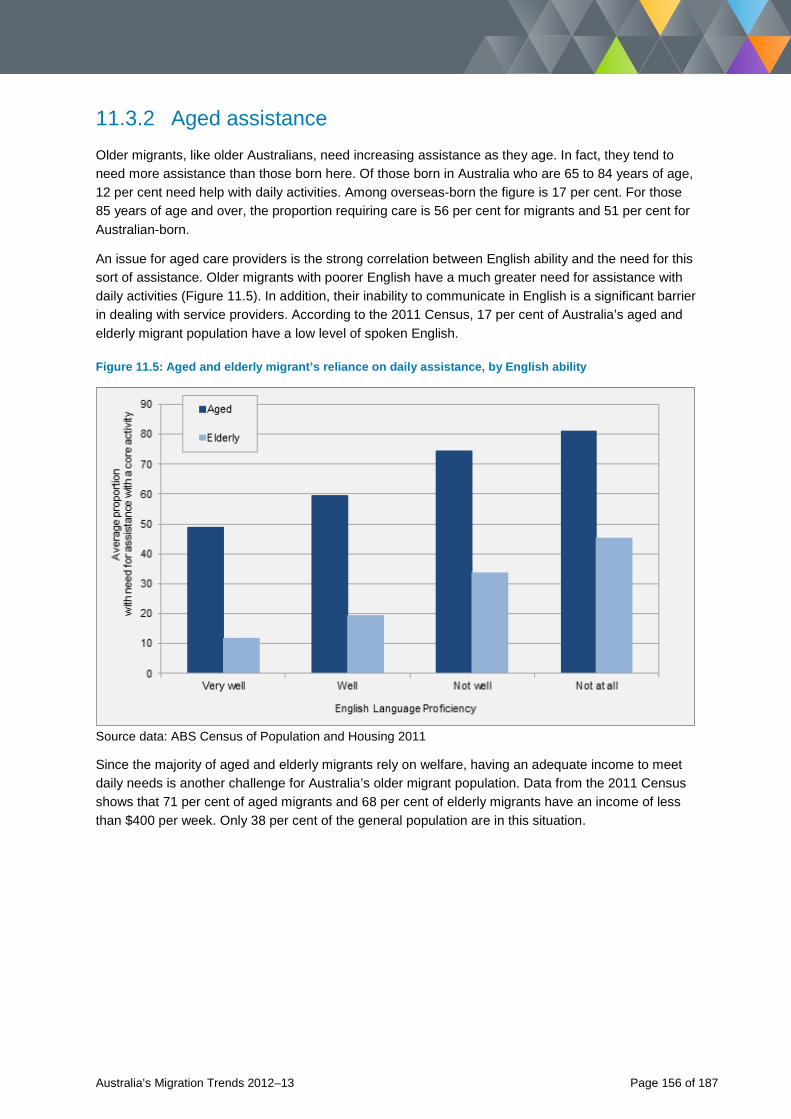
11.3.2 Aged assistance Older migrants, like older Australians, need increasing assistance as they age. In fact, they tend to need more assistance than those born here. Of those born in Australia who are 65 to 84 years of age, 12 per cent need help with daily activities. Among overseas-born the figure is 17 per cent. For those 85 years of age and over, the proportion requiring care is 56 per cent for migrants and 51 per cent for Australian-born.
An issue for aged care providers is the strong correlation between English ability and the need for this sort of assistance. Older migrants with poorer English have a much greater need for assistance with daily activities (Figure 11.5). In addition, their inability to communicate in English is a significant barrier in dealing with service providers. According to the 2011 Census, 17 per cent of Australia’s aged and elderly migrant population have a low level of spoken English.
Figure 11.5: Aged and elderly migrant’s reliance on daily assistance, by English ability
Source data: ABS Census of Population and Housing 2011
Since the majority of aged and elderly migrants rely on welfare, having an adequate income to meet daily needs is another challenge for Australia’s older migrant population. Data from the 2011 Census shows that 71 per cent of aged migrants and 68 per cent of elderly migrants have an income of less than $400 per week. Only 38 per cent of the general population are in this situation.
Australia’s Migration Trends 2012–13 Page 156 of 187
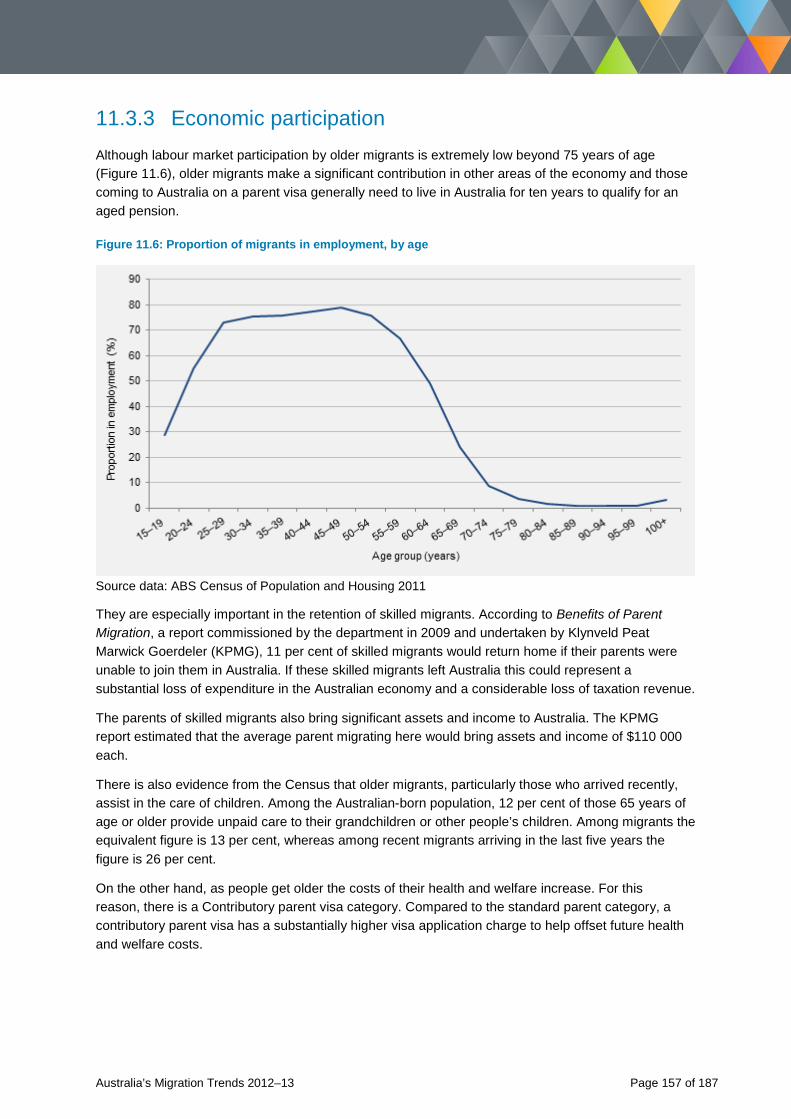
11.3.3 Economic participation Although labour market participation by older migrants is extremely low beyond 75 years of age (Figure 11.6), older migrants make a significant contribution in other areas of the economy and those coming to Australia on a parent visa generally need to live in Australia for ten years to qualify for an aged pension.
Figure 11.6: Proportion of migrants in employment, by age
Source data: ABS Census of Population and Housing 2011
They are especially important in the retention of skilled migrants. According to Benefits of Parent Migration, a report commissioned by the department in 2009 and undertaken by Klynveld Peat Marwick Goerdeler (KPMG), 11 per cent of skilled migrants would return home if their parents were unable to join them in Australia. If these skilled migrants left Australia this could represent a substantial loss of expenditure in the Australian economy and a considerable loss of taxation revenue.
The parents of skilled migrants also bring significant assets and income to Australia. The KPMG report estimated that the average parent migrating here would bring assets and income of $110 000 each.
There is also evidence from the Census that older migrants, particularly those who arrived recently, assist in the care of children. Among the Australian-born population, 12 per cent of those 65 years of age or older provide unpaid care to their grandchildren or other people’s children. Among migrants the equivalent figure is 13 per cent, whereas among recent migrants arriving in the last five years the figure is 26 per cent.
On the other hand, as people get older the costs of their health and welfare increase. For this reason, there is a Contributory parent visa category. Compared to the standard parent category, a contributory parent visa has a substantially higher visa application charge to help offset future health and welfare costs.
Australia’s Migration Trends 2012–13 Page 157 of 187

This page has been left intentionally blank.
Australia’s Migration Trends 2012–13 Page 158 of 187

Appendices, data sources, glossary
and acronyms
Australia’s Migration Trends 2012–13 Page 159 of 187
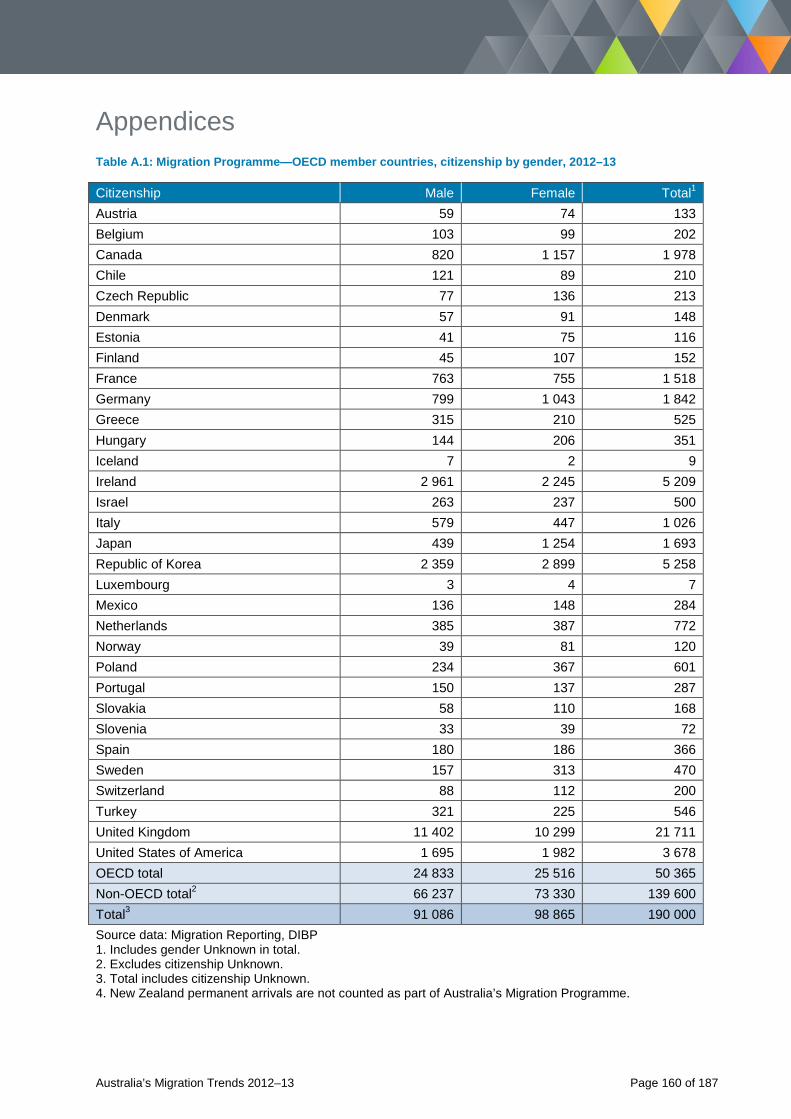
Appendices Table A.1: Migration Programme—OECD member countries, citizenship by gender, 2012–13
Citizenship Male Female Total1 Austria 59 74 133 Belgium 103 99 202 Canada 820 1 157 1 978 Chile 121 89 210 Czech Republic 77 136 213 Denmark 57 91 148 Estonia 41 75 116 Finland 45 107 152 France 763 755 1 518 Germany 799 1 043 1 842 Greece 315 210 525 Hungary 144 206 351 Iceland 7 2 9 Ireland 2 961 2 245 5 209 Israel 263 237 500 Italy 579 447 1 026 Japan 439 1 254 1 693 Republic of Korea 2 359 2 899 5 258 Luxembourg 3 4 7 Mexico 136 148 284 Netherlands 385 387 772 Norway 39 81 120 Poland 234 367 601 Portugal 150 137 287 Slovakia 58 110 168 Slovenia 33 39 72 Spain 180 186 366 Sweden 157 313 470 Switzerland 88 112 200 Turkey 321 225 546 United Kingdom 11 402 10 299 21 711 United States of America 1 695 1 982 3 678 OECD total 24 833 25 516 50 365 Non-OECD total2 66 237 73 330 139 600 Total3 91 086 98 865 190 000 Source data: Migration Reporting, DIBP 1. Includes gender Unknown in total. 2. Excludes citizenship Unknown. 3. Total includes citizenship Unknown. 4. New Zealand permanent arrivals are not counted as part of Australia’s Migration Programme.
Australia’s Migration Trends 2012–13 Page 160 of 187
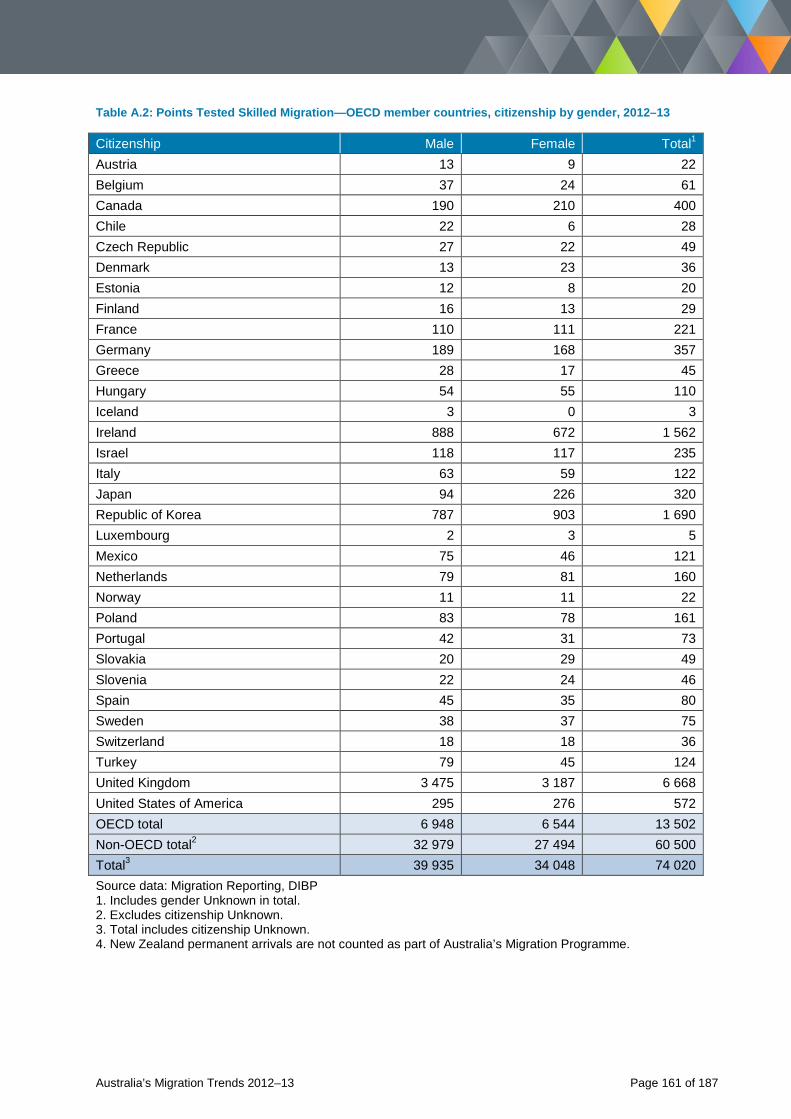
Table A.2: Points Tested Skilled Migration—OECD member countries, citizenship by gender, 2012–13
Citizenship Male Female Total1 Austria 13 9 22 Belgium 37 24 61 Canada 190 210 400 Chile 22 6 28 Czech Republic 27 22 49 Denmark 13 23 36 Estonia 12 8 20 Finland 16 13 29 France 110 111 221 Germany 189 168 357 Greece 28 17 45 Hungary 54 55 110 Iceland 3 0 3 Ireland 888 672 1 562 Israel 118 117 235 Italy 63 59 122 Japan 94 226 320 Republic of Korea 787 903 1 690 Luxembourg 2 3 5 Mexico 75 46 121 Netherlands 79 81 160 Norway 11 11 22 Poland 83 78 161 Portugal 42 31 73 Slovakia 20 29 49 Slovenia 22 24 46 Spain 45 35 80 Sweden 38 37 75 Switzerland 18 18 36 Turkey 79 45 124 United Kingdom 3 475 3 187 6 668 United States of America 295 276 572 OECD total 6 948 6 544 13 502 Non-OECD total2 32 979 27 494 60 500 Total3 39 935 34 048 74 020 Source data: Migration Reporting, DIBP 1. Includes gender Unknown in total. 2. Excludes citizenship Unknown. 3. Total includes citizenship Unknown. 4. New Zealand permanent arrivals are not counted as part of Australia’s Migration Programme.
Australia’s Migration Trends 2012–13 Page 161 of 187
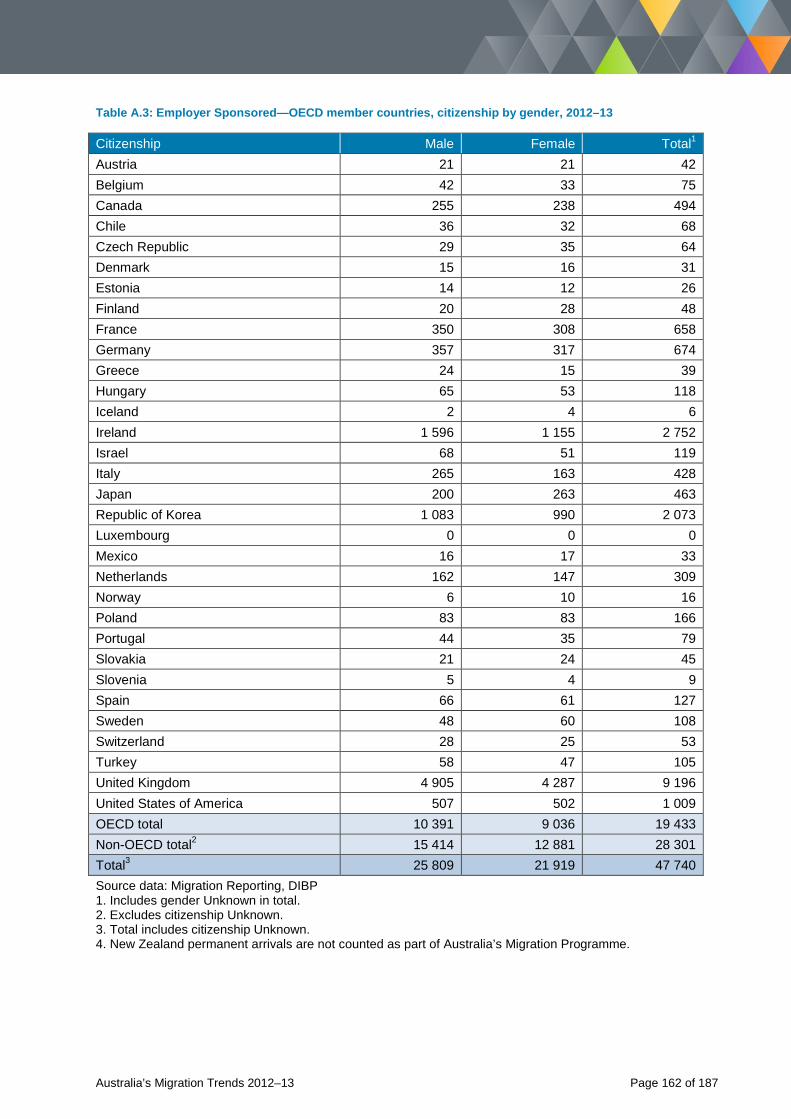
Table A.3: Employer Sponsored—OECD member countries, citizenship by gender, 2012–13
Citizenship Male Female Total1 Austria 21 21 42 Belgium 42 33 75 Canada 255 238 494 Chile 36 32 68 Czech Republic 29 35 64 Denmark 15 16 31 Estonia 14 12 26 Finland 20 28 48 France 350 308 658 Germany 357 317 674 Greece 24 15 39 Hungary 65 53 118 Iceland 2 4 6 Ireland 1 596 1 155 2 752 Israel 68 51 119 Italy 265 163 428 Japan 200 263 463 Republic of Korea 1 083 990 2 073 Luxembourg 0 0 0 Mexico 16 17 33 Netherlands 162 147 309 Norway 6 10 16 Poland 83 83 166 Portugal 44 35 79 Slovakia 21 24 45 Slovenia 5 4 9 Spain 66 61 127 Sweden 48 60 108 Switzerland 28 25 53 Turkey 58 47 105 United Kingdom 4 905 4 287 9 196 United States of America 507 502 1 009 OECD total 10 391 9 036 19 433 Non-OECD total2 15 414 12 881 28 301 Total3 25 809 21 919 47 740 Source data: Migration Reporting, DIBP 1. Includes gender Unknown in total. 2. Excludes citizenship Unknown. 3. Total includes citizenship Unknown. 4. New Zealand permanent arrivals are not counted as part of Australia’s Migration Programme.
Australia’s Migration Trends 2012–13 Page 162 of 187
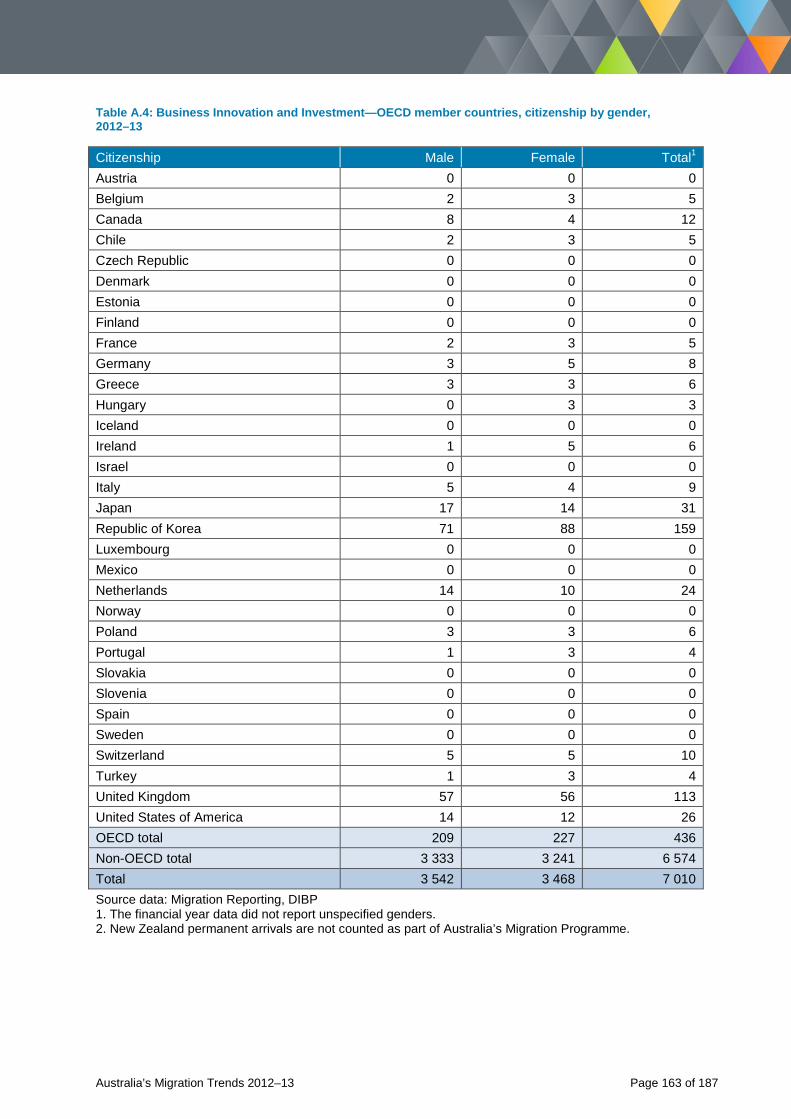
Table A.4: Business Innovation and Investment—OECD member countries, citizenship by gender, 2012–13
Citizenship Male Female Total1 Austria 0 0 0 Belgium 2 3 5 Canada 8 4 12 Chile 2 3 5 Czech Republic 0 0 0 Denmark 0 0 0 Estonia 0 0 0 Finland 0 0 0 France 2 3 5 Germany 3 5 8 Greece 3 3 6 Hungary 0 3 3 Iceland 0 0 0 Ireland 1 5 6 Israel 0 0 0 Italy 5 4 9 Japan 17 14 31 Republic of Korea 71 88 159 Luxembourg 0 0 0 Mexico 0 0 0 Netherlands 14 10 24 Norway 0 0 0 Poland 3 3 6 Portugal 1 3 4 Slovakia 0 0 0 Slovenia 0 0 0 Spain 0 0 0 Sweden 0 0 0 Switzerland 5 5 10 Turkey 1 3 4 United Kingdom 57 56 113 United States of America 14 12 26 OECD total 209 227 436 Non-OECD total 3 333 3 241 6 574 Total 3 542 3 468 7 010 Source data: Migration Reporting, DIBP 1. The financial year data did not report unspecified genders. 2. New Zealand permanent arrivals are not counted as part of Australia’s Migration Programme.
Australia’s Migration Trends 2012–13 Page 163 of 187
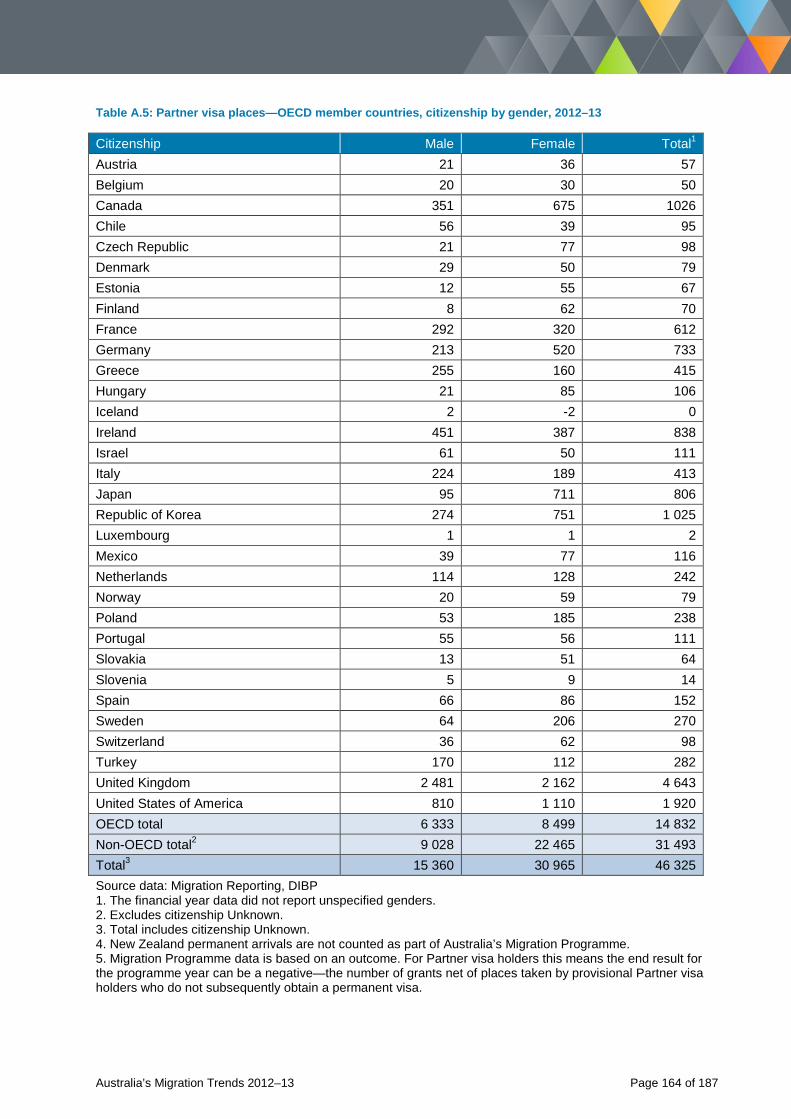
Table A.5: Partner visa places—OECD member countries, citizenship by gender, 2012–13
Citizenship Male Female Total1 Austria 21 36 57 Belgium 20 30 50 Canada 351 675 1026 Chile 56 39 95 Czech Republic 21 77 98 Denmark 29 50 79 Estonia 12 55 67 Finland 8 62 70 France 292 320 612 Germany 213 520 733 Greece 255 160 415 Hungary 21 85 106 Iceland 2 -2 0 Ireland 451 387 838 Israel 61 50 111 Italy 224 189 413 Japan 95 711 806 Republic of Korea 274 751 1 025 Luxembourg 1 1 2 Mexico 39 77 116 Netherlands 114 128 242 Norway 20 59 79 Poland 53 185 238 Portugal 55 56 111 Slovakia 13 51 64 Slovenia 5 9 14 Spain 66 86 152 Sweden 64 206 270 Switzerland 36 62 98 Turkey 170 112 282 United Kingdom 2 481 2 162 4 643 United States of America 810 1 110 1 920 OECD total 6 333 8 499 14 832 Non-OECD total2 9 028 22 465 31 493 Total3 15 360 30 965 46 325 Source data: Migration Reporting, DIBP 1. The financial year data did not report unspecified genders. 2. Excludes citizenship Unknown. 3. Total includes citizenship Unknown. 4. New Zealand permanent arrivals are not counted as part of Australia’s Migration Programme. 5. Migration Programme data is based on an outcome. For Partner visa holders this means the end result for the programme year can be a negative—the number of grants net of places taken by provisional Partner visa holders who do not subsequently obtain a permanent visa.
Australia’s Migration Trends 2012–13 Page 164 of 187
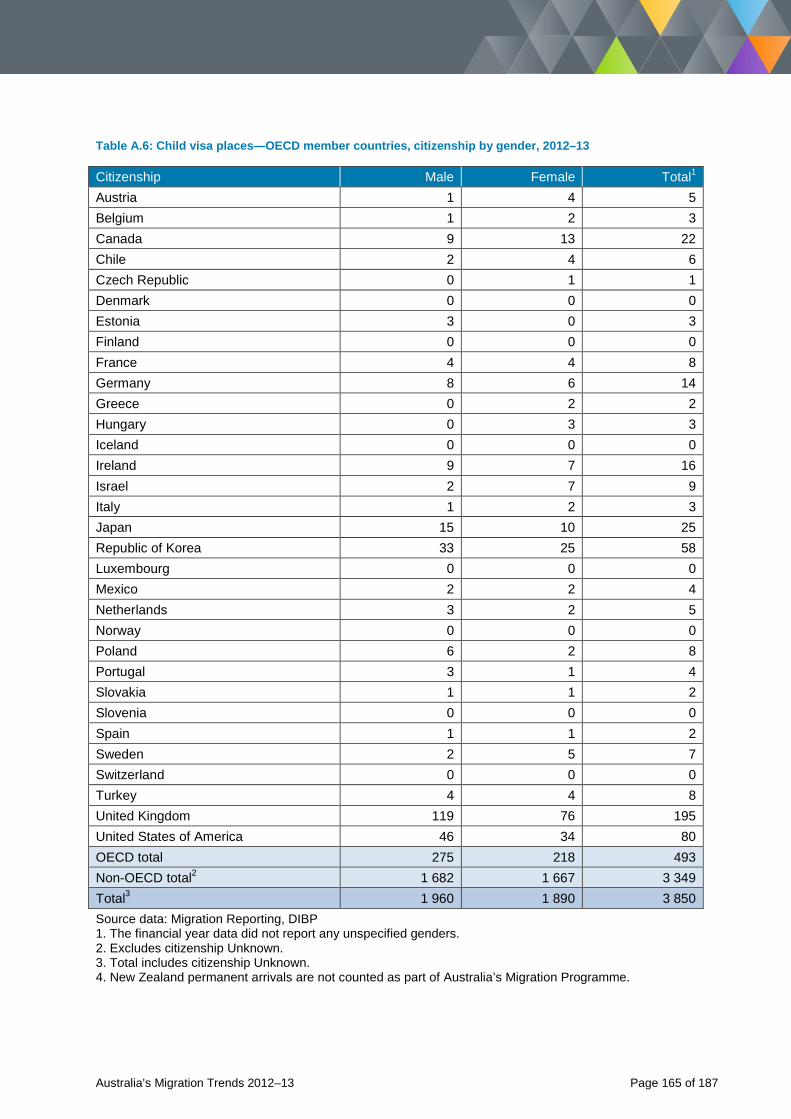
Table A.6: Child visa places—OECD member countries, citizenship by gender, 2012–13
Citizenship Male Female Total1 Austria 1 4 5 Belgium 1 2 3 Canada 9 13 22 Chile 2 4 6 Czech Republic 0 1 1 Denmark 0 0 0 Estonia 3 0 3 Finland 0 0 0 France 4 4 8 Germany 8 6 14 Greece 0 2 2 Hungary 0 3 3 Iceland 0 0 0 Ireland 9 7 16 Israel 2 7 9 Italy 1 2 3 Japan 15 10 25 Republic of Korea 33 25 58 Luxembourg 0 0 0 Mexico 2 2 4 Netherlands 3 2 5 Norway 0 0 0 Poland 6 2 8 Portugal 3 1 4 Slovakia 1 1 2 Slovenia 0 0 0 Spain 1 1 2 Sweden 2 5 7 Switzerland 0 0 0 Turkey 4 4 8 United Kingdom 119 76 195 United States of America 46 34 80 OECD total 275 218 493 Non-OECD total2 1 682 1 667 3 349 Total3 1 960 1 890 3 850 Source data: Migration Reporting, DIBP 1. The financial year data did not report any unspecified genders. 2. Excludes citizenship Unknown. 3. Total includes citizenship Unknown. 4. New Zealand permanent arrivals are not counted as part of Australia’s Migration Programme.
Australia’s Migration Trends 2012–13 Page 165 of 187
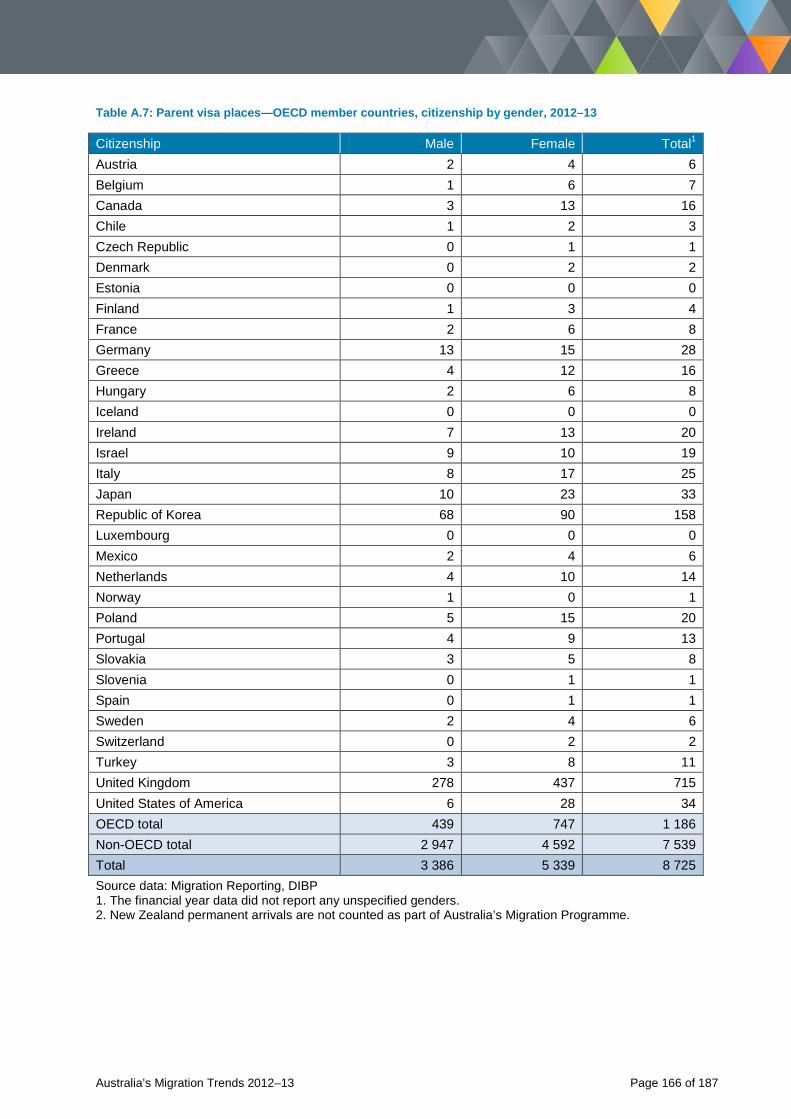
Table A.7: Parent visa places—OECD member countries, citizenship by gender, 2012–13
Citizenship Male Female Total1 Austria 2 4 6 Belgium 1 6 7 Canada 3 13 16 Chile 1 2 3 Czech Republic 0 1 1 Denmark 0 2 2 Estonia 0 0 0 Finland 1 3 4 France 2 6 8 Germany 13 15 28 Greece 4 12 16 Hungary 2 6 8 Iceland 0 0 0 Ireland 7 13 20 Israel 9 10 19 Italy 8 17 25 Japan 10 23 33 Republic of Korea 68 90 158 Luxembourg 0 0 0 Mexico 2 4 6 Netherlands 4 10 14 Norway 1 0 1 Poland 5 15 20 Portugal 4 9 13 Slovakia 3 5 8 Slovenia 0 1 1 Spain 0 1 1 Sweden 2 4 6 Switzerland 0 2 2 Turkey 3 8 11 United Kingdom 278 437 715 United States of America 6 28 34 OECD total 439 747 1 186 Non-OECD total 2 947 4 592 7 539 Total 3 386 5 339 8 725 Source data: Migration Reporting, DIBP 1. The financial year data did not report any unspecified genders. 2. New Zealand permanent arrivals are not counted as part of Australia’s Migration Programme.
Australia’s Migration Trends 2012–13 Page 166 of 187
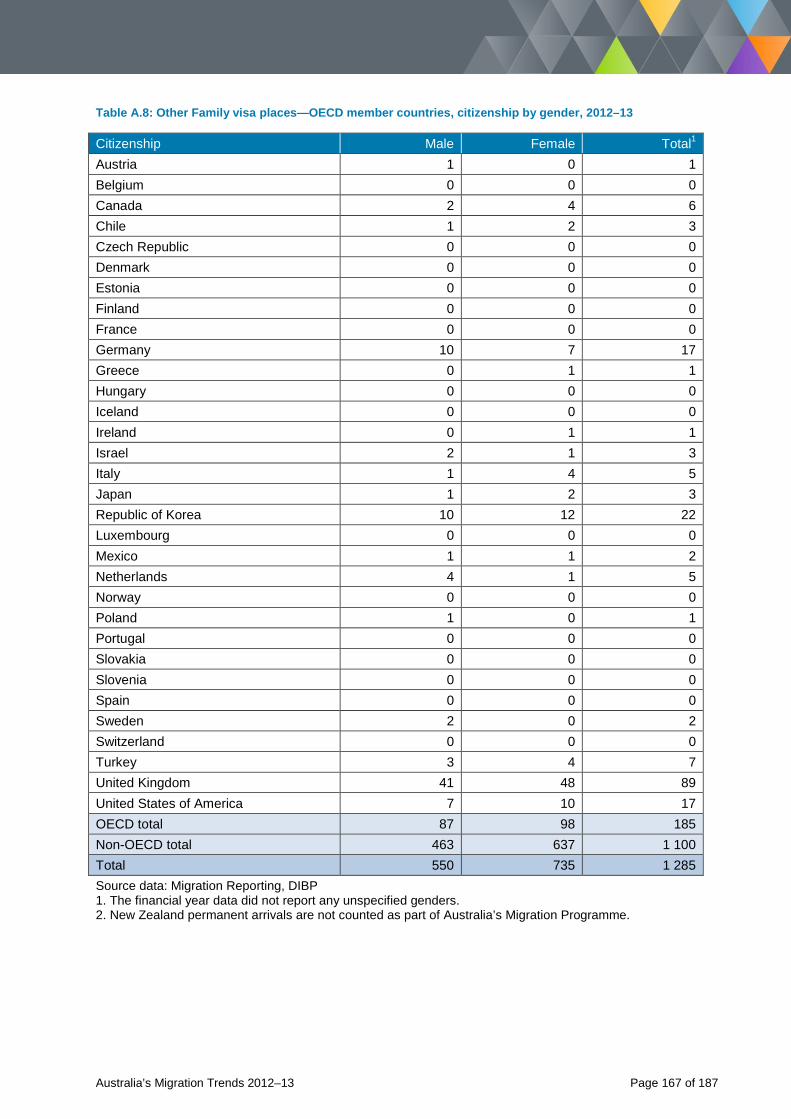
Table A.8: Other Family visa places—OECD member countries, citizenship by gender, 2012–13
Citizenship Male Female Total1 Austria 1 0 1 Belgium 0 0 0 Canada 2 4 6 Chile 1 2 3 Czech Republic 0 0 0 Denmark 0 0 0 Estonia 0 0 0 Finland 0 0 0 France 0 0 0 Germany 10 7 17 Greece 0 1 1 Hungary 0 0 0 Iceland 0 0 0 Ireland 0 1 1 Israel 2 1 3 Italy 1 4 5 Japan 1 2 3 Republic of Korea 10 12 22 Luxembourg 0 0 0 Mexico 1 1 2 Netherlands 4 1 5 Norway 0 0 0 Poland 1 0 1 Portugal 0 0 0 Slovakia 0 0 0 Slovenia 0 0 0 Spain 0 0 0 Sweden 2 0 2 Switzerland 0 0 0 Turkey 3 4 7 United Kingdom 41 48 89 United States of America 7 10 17 OECD total 87 98 185 Non-OECD total 463 637 1 100 Total 550 735 1 285 Source data: Migration Reporting, DIBP 1. The financial year data did not report any unspecified genders. 2. New Zealand permanent arrivals are not counted as part of Australia’s Migration Programme.
Australia’s Migration Trends 2012–13 Page 167 of 187
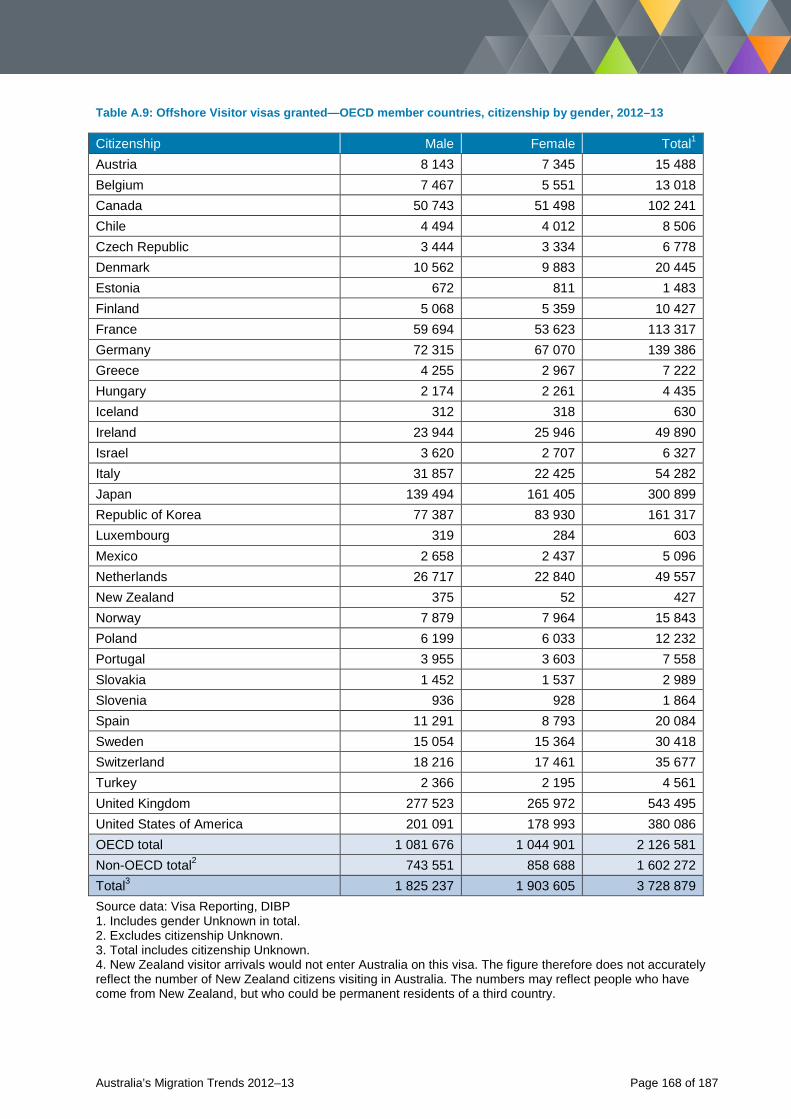
Table A.9: Offshore Visitor visas granted—OECD member countries, citizenship by gender, 2012–13
Citizenship Male Female Total1 Austria 8 143 7 345 15 488 Belgium 7 467 5 551 13 018 Canada 50 743 51 498 102 241 Chile 4 494 4 012 8 506 Czech Republic 3 444 3 334 6 778 Denmark 10 562 9 883 20 445 Estonia 672 811 1 483 Finland 5 068 5 359 10 427 France 59 694 53 623 113 317 Germany 72 315 67 070 139 386 Greece 4 255 2 967 7 222 Hungary 2 174 2 261 4 435 Iceland 312 318 630 Ireland 23 944 25 946 49 890 Israel 3 620 2 707 6 327 Italy 31 857 22 425 54 282 Japan 139 494 161 405 300 899 Republic of Korea 77 387 83 930 161 317 Luxembourg 319 284 603 Mexico 2 658 2 437 5 096 Netherlands 26 717 22 840 49 557 New Zealand 375 52 427 Norway 7 879 7 964 15 843 Poland 6 199 6 033 12 232 Portugal 3 955 3 603 7 558 Slovakia 1 452 1 537 2 989 Slovenia 936 928 1 864 Spain 11 291 8 793 20 084 Sweden 15 054 15 364 30 418 Switzerland 18 216 17 461 35 677 Turkey 2 366 2 195 4 561 United Kingdom 277 523 265 972 543 495 United States of America 201 091 178 993 380 086 OECD total 1 081 676 1 044 901 2 126 581 Non-OECD total2 743 551 858 688 1 602 272 Total3 1 825 237 1 903 605 3 728 879 Source data: Visa Reporting, DIBP 1. Includes gender Unknown in total. 2. Excludes citizenship Unknown. 3. Total includes citizenship Unknown. 4. New Zealand visitor arrivals would not enter Australia on this visa. The figure therefore does not accurately reflect the number of New Zealand citizens visiting in Australia. The numbers may reflect people who have come from New Zealand, but who could be permanent residents of a third country.
Australia’s Migration Trends 2012–13 Page 168 of 187
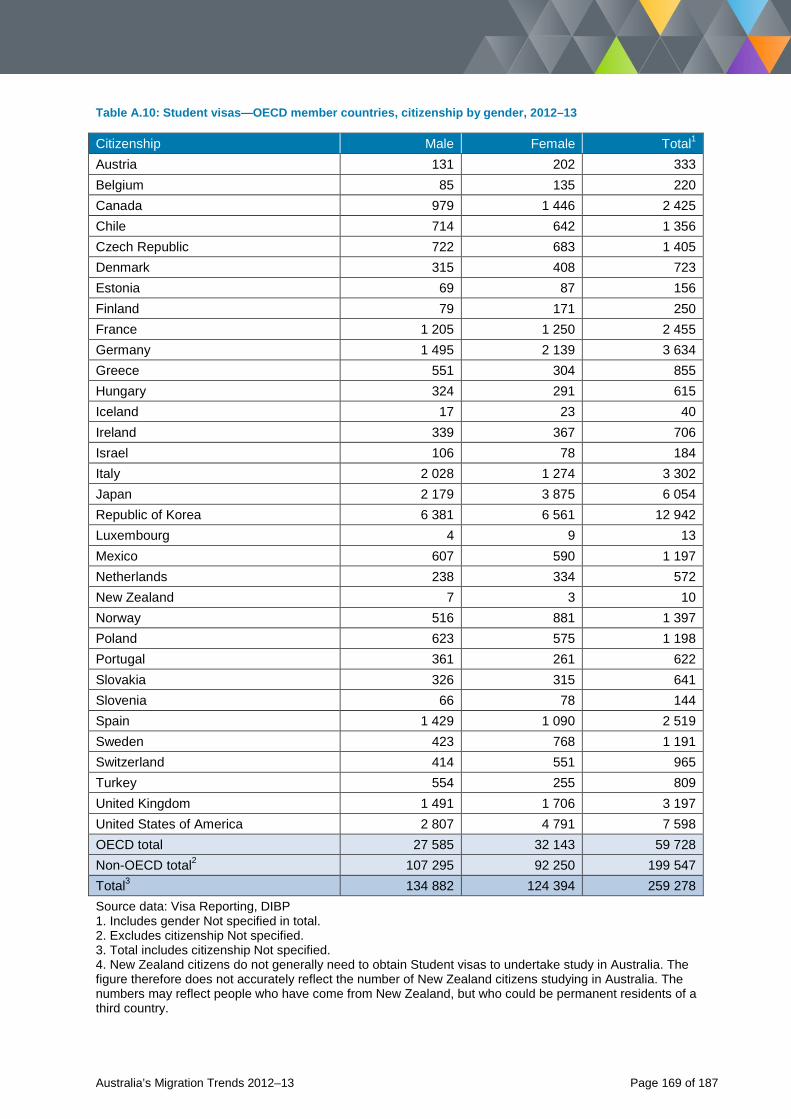
Table A.10: Student visas—OECD member countries, citizenship by gender, 2012–13
Citizenship Male Female Total1 Austria 131 202 333 Belgium 85 135 220 Canada 979 1 446 2 425 Chile 714 642 1 356 Czech Republic 722 683 1 405 Denmark 315 408 723 Estonia 69 87 156 Finland 79 171 250 France 1 205 1 250 2 455 Germany 1 495 2 139 3 634 Greece 551 304 855 Hungary 324 291 615 Iceland 17 23 40 Ireland 339 367 706 Israel 106 78 184 Italy 2 028 1 274 3 302 Japan 2 179 3 875 6 054 Republic of Korea 6 381 6 561 12 942 Luxembourg 4 9 13 Mexico 607 590 1 197 Netherlands 238 334 572 New Zealand 7 3 10 Norway 516 881 1 397 Poland 623 575 1 198 Portugal 361 261 622 Slovakia 326 315 641 Slovenia 66 78 144 Spain 1 429 1 090 2 519 Sweden 423 768 1 191 Switzerland 414 551 965 Turkey 554 255 809 United Kingdom 1 491 1 706 3 197 United States of America 2 807 4 791 7 598 OECD total 27 585 32 143 59 728 Non-OECD total2 107 295 92 250 199 547 Total3 134 882 124 394 259 278 Source data: Visa Reporting, DIBP 1. Includes gender Not specified in total. 2. Excludes citizenship Not specified. 3. Total includes citizenship Not specified. 4. New Zealand citizens do not generally need to obtain Student visas to undertake study in Australia. The figure therefore does not accurately reflect the number of New Zealand citizens studying in Australia. The numbers may reflect people who have come from New Zealand, but who could be permanent residents of a third country.
Australia’s Migration Trends 2012–13 Page 169 of 187
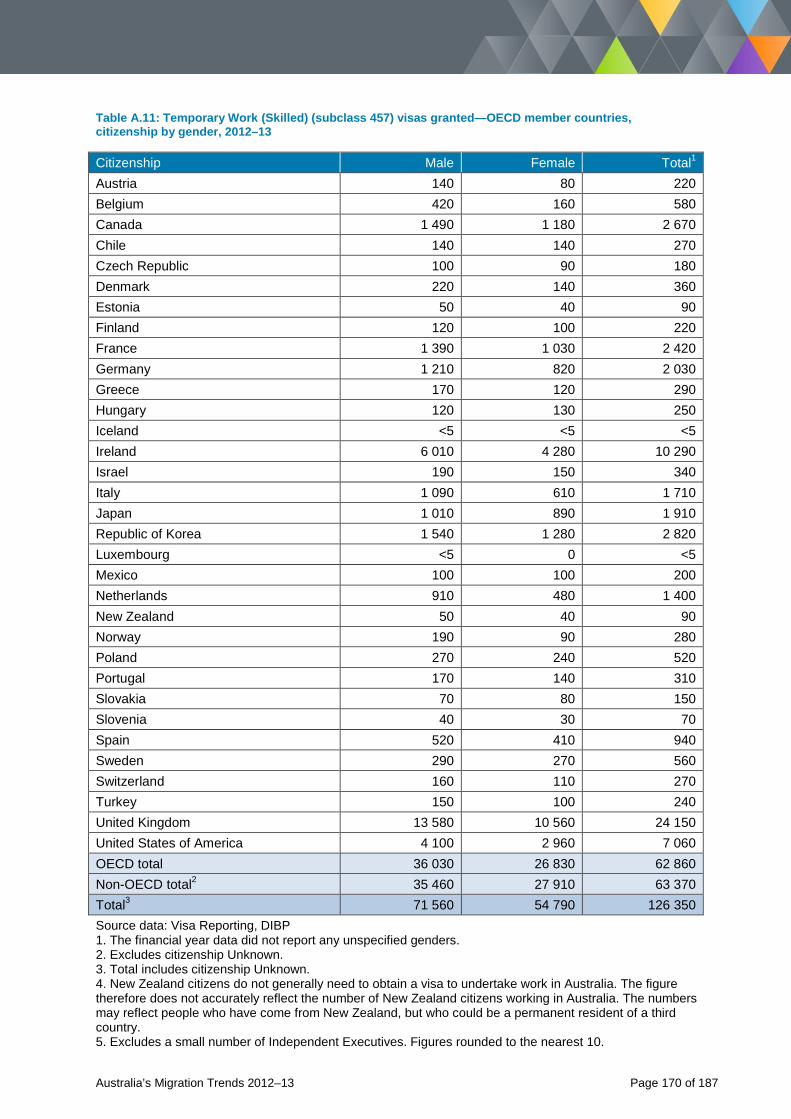
Table A.11: Temporary Work (Skilled) (subclass 457) visas granted—OECD member countries, citizenship by gender, 2012–13
Citizenship Male Female Total1 Austria 140 80 220 Belgium 420 160 580 Canada 1 490 1 180 2 670 Chile 140 140 270 Czech Republic 100 90 180 Denmark 220 140 360 Estonia 50 40 90 Finland 120 100 220 France 1 390 1 030 2 420 Germany 1 210 820 2 030 Greece 170 120 290 Hungary 120 130 250 Iceland <5 <5 <5 Ireland 6 010 4 280 10 290 Israel 190 150 340 Italy 1 090 610 1 710 Japan 1 010 890 1 910 Republic of Korea 1 540 1 280 2 820 Luxembourg <5 0 <5 Mexico 100 100 200 Netherlands 910 480 1 400 New Zealand 50 40 90 Norway 190 90 280 Poland 270 240 520 Portugal 170 140 310 Slovakia 70 80 150 Slovenia 40 30 70 Spain 520 410 940 Sweden 290 270 560 Switzerland 160 110 270 Turkey 150 100 240 United Kingdom 13 580 10 560 24 150 United States of America 4 100 2 960 7 060 OECD total 36 030 26 830 62 860 Non-OECD total2 35 460 27 910 63 370 Total3 71 560 54 790 126 350 Source data: Visa Reporting, DIBP 1. The financial year data did not report any unspecified genders. 2. Excludes citizenship Unknown. 3. Total includes citizenship Unknown. 4. New Zealand citizens do not generally need to obtain a visa to undertake work in Australia. The figure therefore does not accurately reflect the number of New Zealand citizens working in Australia. The numbers may reflect people who have come from New Zealand, but who could be a permanent resident of a third country. 5. Excludes a small number of Independent Executives. Figures rounded to the nearest 10.
Australia’s Migration Trends 2012–13 Page 170 of 187
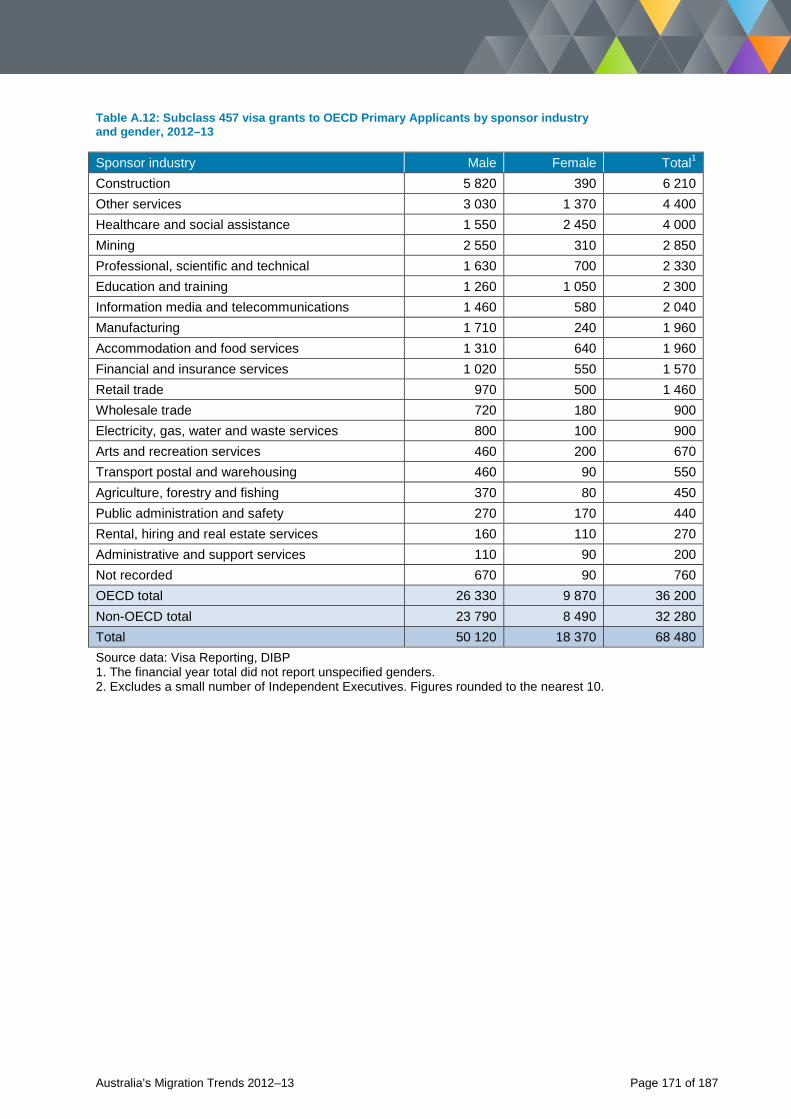
Table A.12: Subclass 457 visa grants to OECD Primary Applicants by sponsor industry and gender, 2012–13
Sponsor industry Male Female Total1 Construction 5 820 390 6 210 Other services 3 030 1 370 4 400 Healthcare and social assistance 1 550 2 450 4 000 Mining 2 550 310 2 850 Professional, scientific and technical 1 630 700 2 330 Education and training 1 260 1 050 2 300 Information media and telecommunications 1 460 580 2 040 Manufacturing 1 710 240 1 960 Accommodation and food services 1 310 640 1 960 Financial and insurance services 1 020 550 1 570 Retail trade 970 500 1 460 Wholesale trade 720 180 900 Electricity, gas, water and waste services 800 100 900 Arts and recreation services 460 200 670 Transport postal and warehousing 460 90 550 Agriculture, forestry and fishing 370 80 450 Public administration and safety 270 170 440 Rental, hiring and real estate services 160 110 270 Administrative and support services 110 90 200 Not recorded 670 90 760 OECD total 26 330 9 870 36 200 Non-OECD total 23 790 8 490 32 280 Total 50 120 18 370 68 480 Source data: Visa Reporting, DIBP 1. The financial year total did not report unspecified genders. 2. Excludes a small number of Independent Executives. Figures rounded to the nearest 10.
Australia’s Migration Trends 2012–13 Page 171 of 187
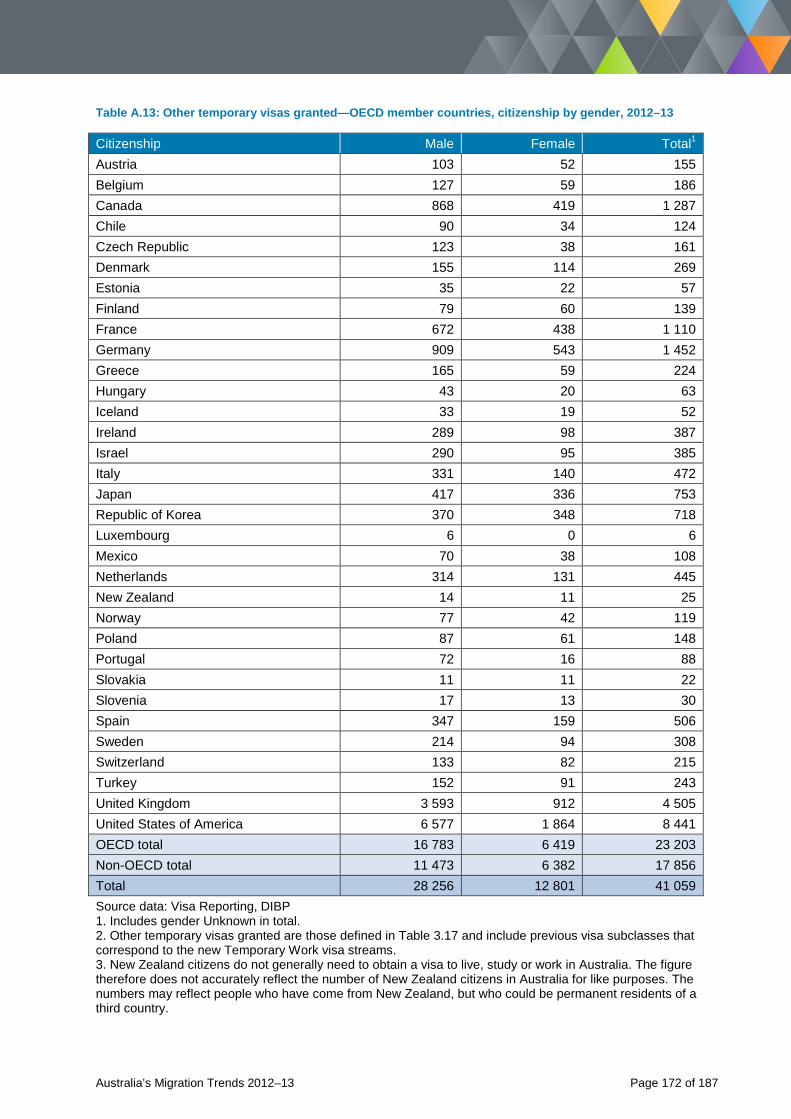
Table A.13: Other temporary visas granted—OECD member countries, citizenship by gender, 2012–13
Citizenship Male Female Total1 Austria 103 52 155 Belgium 127 59 186 Canada 868 419 1 287 Chile 90 34 124 Czech Republic 123 38 161 Denmark 155 114 269 Estonia 35 22 57 Finland 79 60 139 France 672 438 1 110 Germany 909 543 1 452 Greece 165 59 224 Hungary 43 20 63 Iceland 33 19 52 Ireland 289 98 387 Israel 290 95 385 Italy 331 140 472 Japan 417 336 753 Republic of Korea 370 348 718 Luxembourg 6 0 6 Mexico 70 38 108 Netherlands 314 131 445 New Zealand 14 11 25 Norway 77 42 119 Poland 87 61 148 Portugal 72 16 88 Slovakia 11 11 22 Slovenia 17 13 30 Spain 347 159 506 Sweden 214 94 308 Switzerland 133 82 215 Turkey 152 91 243 United Kingdom 3 593 912 4 505 United States of America 6 577 1 864 8 441 OECD total 16 783 6 419 23 203 Non-OECD total 11 473 6 382 17 856 Total 28 256 12 801 41 059 Source data: Visa Reporting, DIBP 1. Includes gender Unknown in total. 2. Other temporary visas granted are those defined in Table 3.17 and include previous visa subclasses that correspond to the new Temporary Work visa streams. 3. New Zealand citizens do not generally need to obtain a visa to live, study or work in Australia. The figure therefore does not accurately reflect the number of New Zealand citizens in Australia for like purposes. The numbers may reflect people who have come from New Zealand, but who could be permanent residents of a third country.
Australia’s Migration Trends 2012–13 Page 172 of 187
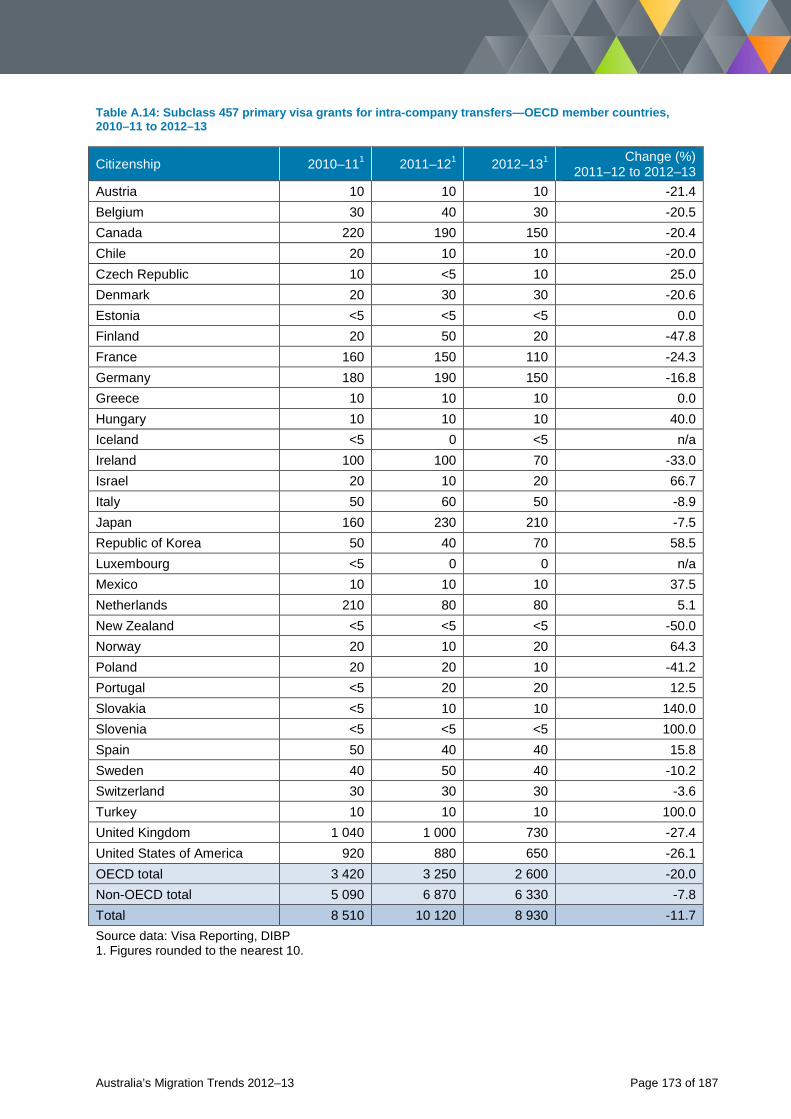
Table A.14: Subclass 457 primary visa grants for intra-company transfers—OECD member countries, 2010–11 to 2012–13
Citizenship 2010–111 2011–121 2012–131 Change (%) 2011–12 to 2012–13
Austria 10 10 10 -21.4 Belgium 30 40 30 -20.5 Canada 220 190 150 -20.4 Chile 20 10 10 -20.0 Czech Republic 10 <5 10 25.0 Denmark 20 30 30 -20.6 Estonia <5 <5 <5 0.0 Finland 20 50 20 -47.8 France 160 150 110 -24.3 Germany 180 190 150 -16.8 Greece 10 10 10 0.0 Hungary 10 10 10 40.0 Iceland <5 0 <5 n/a Ireland 100 100 70 -33.0 Israel 20 10 20 66.7 Italy 50 60 50 -8.9 Japan 160 230 210 -7.5 Republic of Korea 50 40 70 58.5 Luxembourg <5 0 0 n/a Mexico 10 10 10 37.5 Netherlands 210 80 80 5.1 New Zealand <5 <5 <5 -50.0 Norway 20 10 20 64.3 Poland 20 20 10 -41.2 Portugal <5 20 20 12.5 Slovakia <5 10 10 140.0 Slovenia <5 <5 <5 100.0 Spain 50 40 40 15.8 Sweden 40 50 40 -10.2 Switzerland 30 30 30 -3.6 Turkey 10 10 10 100.0 United Kingdom 1 040 1 000 730 -27.4 United States of America 920 880 650 -26.1 OECD total 3 420 3 250 2 600 -20.0 Non-OECD total 5 090 6 870 6 330 -7.8 Total 8 510 10 120 8 930 -11.7 Source data: Visa Reporting, DIBP 1. Figures rounded to the nearest 10.
Australia’s Migration Trends 2012–13 Page 173 of 187
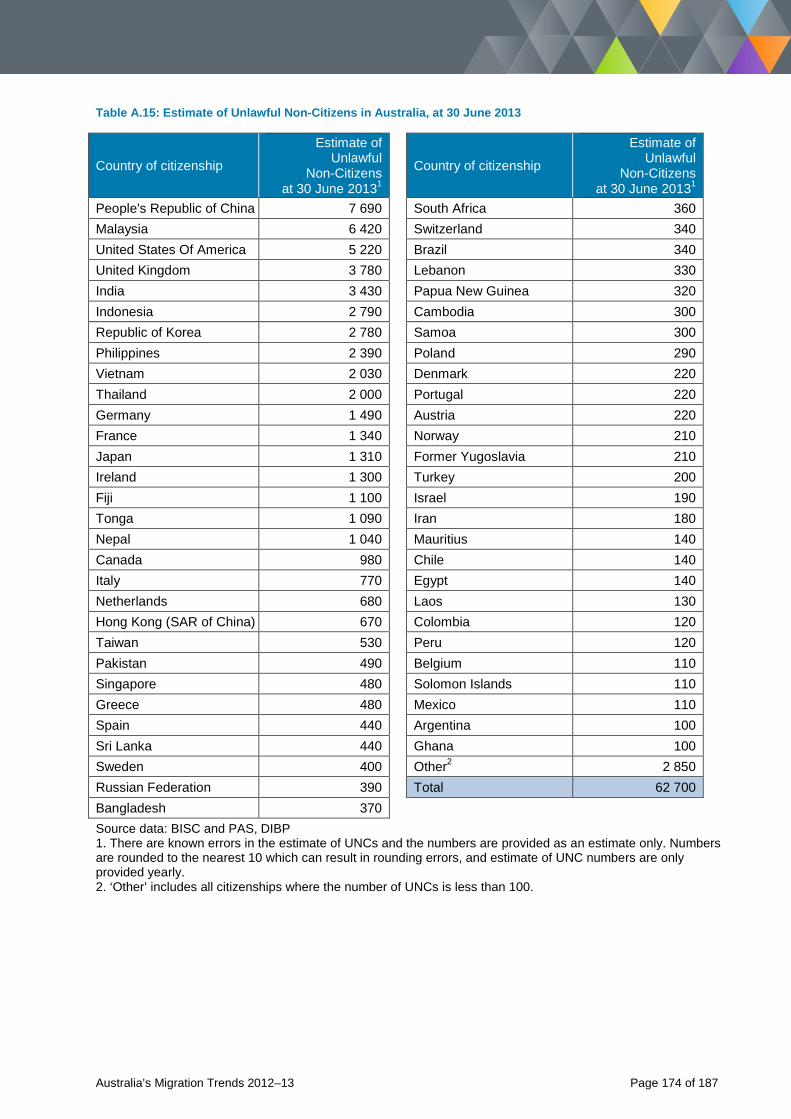
Table A.15: Estimate of Unlawful Non-Citizens in Australia, at 30 June 2013
Country of citizenship
Estimate of Unlawful
Non-Citizens at 30 June 20131
Country of citizenship
Estimate of Unlawful
Non-Citizens at 30 June 20131
People's Republic of China 7 690 South Africa 360 Malaysia 6 420 Switzerland 340 United States Of America 5 220 Brazil 340 United Kingdom 3 780 Lebanon 330 India 3 430 Papua New Guinea 320 Indonesia 2 790 Cambodia 300 Republic of Korea 2 780 Samoa 300 Philippines 2 390 Poland 290 Vietnam 2 030 Denmark 220 Thailand 2 000 Portugal 220 Germany 1 490 Austria 220 France 1 340 Norway 210 Japan 1 310 Former Yugoslavia 210 Ireland 1 300 Turkey 200 Fiji 1 100 Israel 190 Tonga 1 090 Iran 180 Nepal 1 040 Mauritius 140 Canada 980 Chile 140 Italy 770 Egypt 140 Netherlands 680 Laos 130 Hong Kong (SAR of China) 670 Colombia 120 Taiwan 530 Peru 120 Pakistan 490 Belgium 110 Singapore 480 Solomon Islands 110 Greece 480 Mexico 110 Spain 440 Argentina 100 Sri Lanka 440 Ghana 100 Sweden 400 Other2 2 850 Russian Federation 390 Total 62 700 Bangladesh 370 Source data: BISC and PAS, DIBP 1. There are known errors in the estimate of UNCs and the numbers are provided as an estimate only. Numbers are rounded to the nearest 10 which can result in rounding errors, and estimate of UNC numbers are only provided yearly. 2. ‘Other’ includes all citizenships where the number of UNCs is less than 100.
Australia’s Migration Trends 2012–13 Page 174 of 187

Table A.16: Visa cancellations—OECD member countries, citizenship by gender, 2012–13
Citizenship Male Female Total1 Austria 42 21 63 Belgium 173 51 224 Canada 658 569 1 227 Chile 62 39 101 Czech Republic 35 25 60 Denmark 118 64 182 Estonia 57 26 83 Finland 45 38 83 France 513 379 892 Germany 602 379 981 Greece 46 19 65 Hungary 21 17 38 Iceland 5 8 13 Ireland 727 600 1 327 Israel 53 35 88 Italy 256 110 366 Japan 332 320 652 Republic of Korea 1 607 1 052 2 659 Luxembourg <5 0 <5 Mexico 35 29 64 Netherlands 296 144 440 New Zealand 95 18 113 Norway 60 44 104 Poland 64 51 115 Portugal 35 23 58 Slovakia 24 16 40 Slovenia <5 6 10 Spain 81 72 153 Sweden 110 119 229 Switzerland 61 40 101 Turkey 85 25 110 United Kingdom 3 402 2 638 6 040 United States of America 1 736 1 363 3 099 OECD total 11 443 8 340 19 783 Non-OECD total2 11 158 6 785 17 947 Total3 22 717 15 205 37 926 Source data: BISC, DIBP 1. Includes gender not stated in total. 2. Excludes citizenship Unknown. 3. Total includes citizenship Unknown. 4. Citizenship breakdowns of totals less than 5 are represented with < 5. This is to protect the privacy of the individuals.
Australia’s Migration Trends 2012–13 Page 175 of 187

Table A.17: Compliance related departures—OECD member countries, citizenship by gender, 2012–13
Citizenship Male Female Total1 Austria 10 <5 13 Belgium 5 <5 9 Canada 60 59 119 Chile 19 15 34 Czech Republic 15 7 22 Denmark 9 10 19 Estonia 47 13 60 Finland 5 6 11 France 120 55 175 Germany 71 56 127 Greece 26 9 35 Hungary 16 12 28 Iceland <5 <5 5 Ireland 274 81 355 Israel 12 6 18 Italy 90 27 117 Japan 43 29 72 Republic of Korea 314 211 525 Luxembourg 0 0 0 Mexico 9 6 15 Netherlands 22 12 34 New Zealand 139 10 149 Norway <5 5 7 Poland 20 17 37 Portugal 20 6 26 Slovakia 5 <5 6 Slovenia <5 <5 7 Spain 22 23 45 Sweden 18 13 31 Switzerland 6 7 13 Turkey 41 8 49 United Kingdom 417 209 626 United States of America 125 84 209 OECD total 1 988 1 010 2 998 Non-OECD total2 7 420 2 754 10 177 Total3 9 660 3 823 13 486 Source data: BISC, DIBP 1. Includes gender not stated in total. 2. Excludes citizenship Unknown. 3. Total includes citizenship Unknown. 4. Citizenship breakdowns of totals less than 5 are represented with < 5. This is to protect the privacy of the individuals.
Australia’s Migration Trends 2012–13 Page 176 of 187
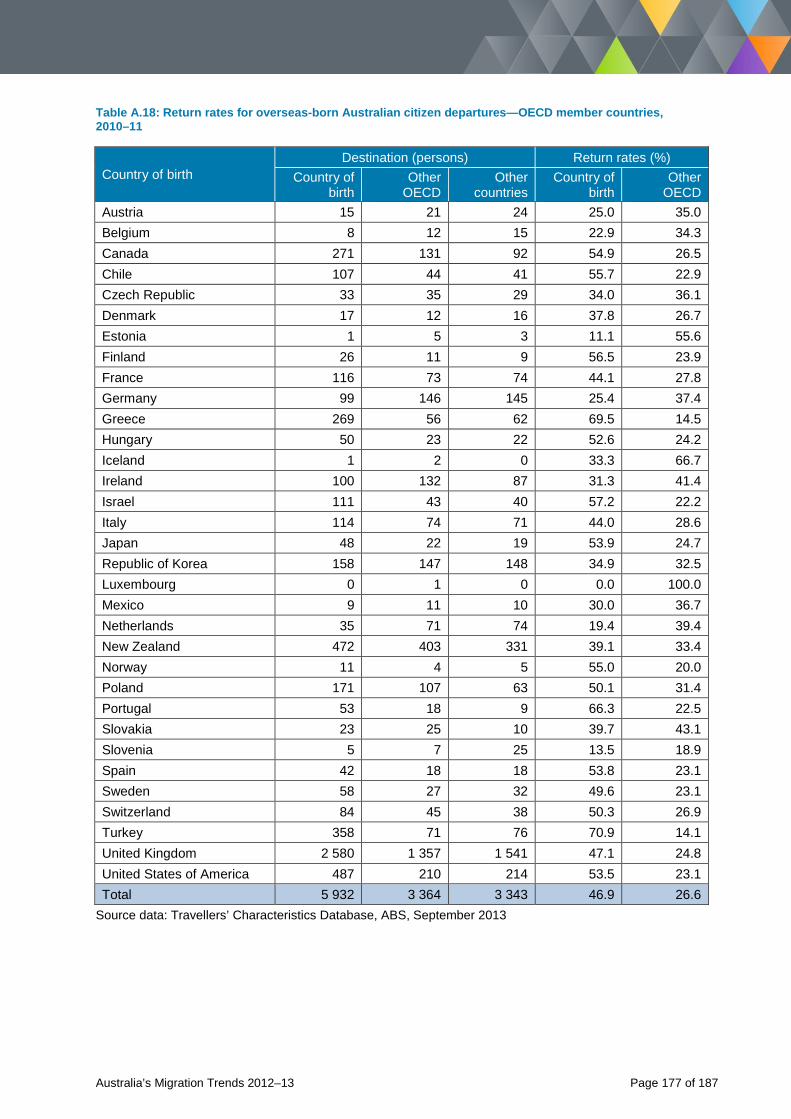
Table A.18: Return rates for overseas-born Australian citizen departures—OECD member countries, 2010–11
Country of birth Destination (persons) Return rates (%)
Country of birth
Other OECD
Other countries
Country of birth
Other OECD
Austria 15 21 24 25.0 35.0 Belgium 8 12 15 22.9 34.3 Canada 271 131 92 54.9 26.5 Chile 107 44 41 55.7 22.9 Czech Republic 33 35 29 34.0 36.1 Denmark 17 12 16 37.8 26.7 Estonia 1 5 3 11.1 55.6 Finland 26 11 9 56.5 23.9 France 116 73 74 44.1 27.8 Germany 99 146 145 25.4 37.4 Greece 269 56 62 69.5 14.5 Hungary 50 23 22 52.6 24.2 Iceland 1 2 0 33.3 66.7 Ireland 100 132 87 31.3 41.4 Israel 111 43 40 57.2 22.2 Italy 114 74 71 44.0 28.6 Japan 48 22 19 53.9 24.7 Republic of Korea 158 147 148 34.9 32.5 Luxembourg 0 1 0 0.0 100.0 Mexico 9 11 10 30.0 36.7 Netherlands 35 71 74 19.4 39.4 New Zealand 472 403 331 39.1 33.4 Norway 11 4 5 55.0 20.0 Poland 171 107 63 50.1 31.4 Portugal 53 18 9 66.3 22.5 Slovakia 23 25 10 39.7 43.1 Slovenia 5 7 25 13.5 18.9 Spain 42 18 18 53.8 23.1 Sweden 58 27 32 49.6 23.1 Switzerland 84 45 38 50.3 26.9 Turkey 358 71 76 70.9 14.1 United Kingdom 2 580 1 357 1 541 47.1 24.8 United States of America 487 210 214 53.5 23.1 Total 5 932 3 364 3 343 46.9 26.6
Source data: Travellers’ Characteristics Database, ABS, September 2013
Australia’s Migration Trends 2012–13 Page 177 of 187
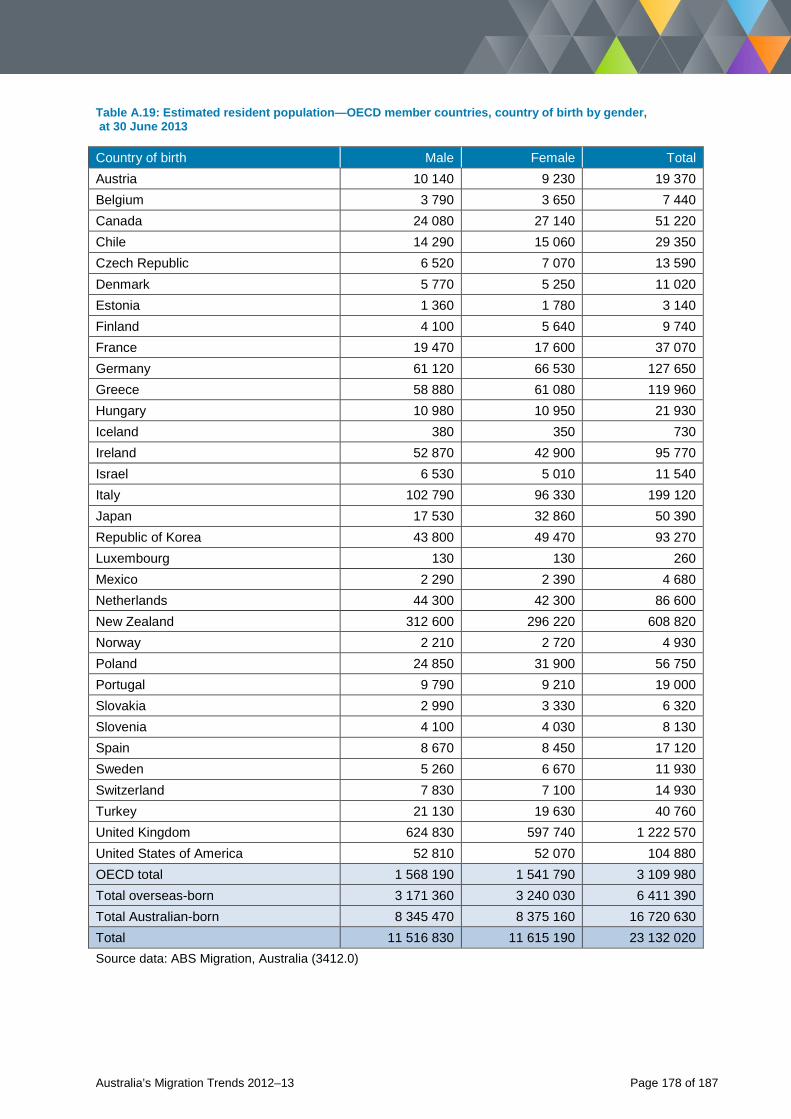
Table A.19: Estimated resident population—OECD member countries, country of birth by gender, at 30 June 2013
Country of birth Male Female Total Austria 10 140 9 230 19 370 Belgium 3 790 3 650 7 440 Canada 24 080 27 140 51 220 Chile 14 290 15 060 29 350 Czech Republic 6 520 7 070 13 590 Denmark 5 770 5 250 11 020 Estonia 1 360 1 780 3 140 Finland 4 100 5 640 9 740 France 19 470 17 600 37 070 Germany 61 120 66 530 127 650 Greece 58 880 61 080 119 960 Hungary 10 980 10 950 21 930 Iceland 380 350 730 Ireland 52 870 42 900 95 770 Israel 6 530 5 010 11 540 Italy 102 790 96 330 199 120 Japan 17 530 32 860 50 390 Republic of Korea 43 800 49 470 93 270 Luxembourg 130 130 260 Mexico 2 290 2 390 4 680 Netherlands 44 300 42 300 86 600 New Zealand 312 600 296 220 608 820 Norway 2 210 2 720 4 930 Poland 24 850 31 900 56 750 Portugal 9 790 9 210 19 000 Slovakia 2 990 3 330 6 320 Slovenia 4 100 4 030 8 130 Spain 8 670 8 450 17 120 Sweden 5 260 6 670 11 930 Switzerland 7 830 7 100 14 930 Turkey 21 130 19 630 40 760 United Kingdom 624 830 597 740 1 222 570 United States of America 52 810 52 070 104 880 OECD total 1 568 190 1 541 790 3 109 980 Total overseas-born 3 171 360 3 240 030 6 411 390 Total Australian-born 8 345 470 8 375 160 16 720 630 Total 11 516 830 11 615 190 23 132 020 Source data: ABS Migration, Australia (3412.0)
Australia’s Migration Trends 2012–13 Page 178 of 187
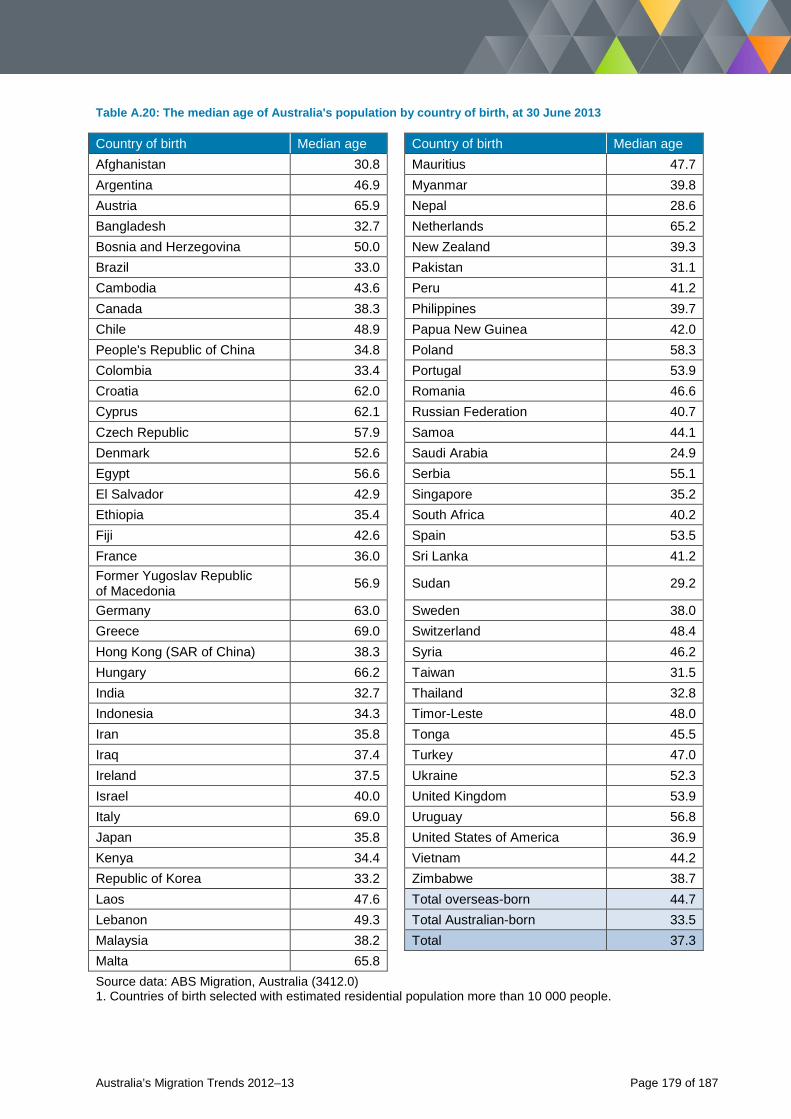
Table A.20: The median age of Australia's population by country of birth, at 30 June 2013
Country of birth Median age Country of birth Median age Afghanistan 30.8 Mauritius 47.7 Argentina 46.9 Myanmar 39.8 Austria 65.9 Nepal 28.6 Bangladesh 32.7 Netherlands 65.2 Bosnia and Herzegovina 50.0 New Zealand 39.3 Brazil 33.0 Pakistan 31.1 Cambodia 43.6 Peru 41.2 Canada 38.3 Philippines 39.7 Chile 48.9 Papua New Guinea 42.0 People's Republic of China 34.8 Poland 58.3 Colombia 33.4 Portugal 53.9 Croatia 62.0 Romania 46.6 Cyprus 62.1 Russian Federation 40.7 Czech Republic 57.9 Samoa 44.1 Denmark 52.6 Saudi Arabia 24.9 Egypt 56.6 Serbia 55.1 El Salvador 42.9 Singapore 35.2 Ethiopia 35.4 South Africa 40.2 Fiji 42.6 Spain 53.5 France 36.0 Sri Lanka 41.2 Former Yugoslav Republic of Macedonia 56.9 Sudan 29.2
Germany 63.0 Sweden 38.0 Greece 69.0 Switzerland 48.4 Hong Kong (SAR of China) 38.3 Syria 46.2 Hungary 66.2 Taiwan 31.5 India 32.7 Thailand 32.8 Indonesia 34.3 Timor-Leste 48.0 Iran 35.8 Tonga 45.5 Iraq 37.4 Turkey 47.0 Ireland 37.5 Ukraine 52.3 Israel 40.0 United Kingdom 53.9 Italy 69.0 Uruguay 56.8 Japan 35.8 United States of America 36.9 Kenya 34.4 Vietnam 44.2 Republic of Korea 33.2 Zimbabwe 38.7 Laos 47.6 Total overseas-born 44.7 Lebanon 49.3 Total Australian-born 33.5 Malaysia 38.2 Total 37.3 Malta 65.8 Source data: ABS Migration, Australia (3412.0) 1. Countries of birth selected with estimated residential population more than 10 000 people.
Australia’s Migration Trends 2012–13 Page 179 of 187
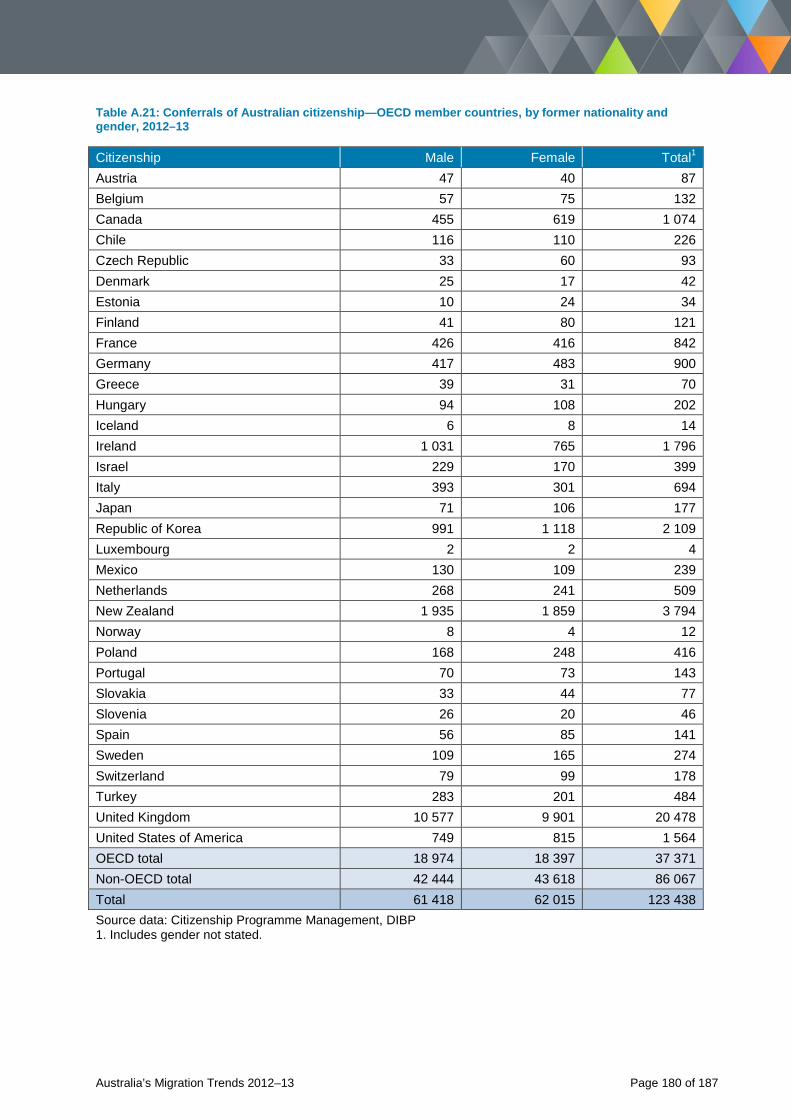
Table A.21: Conferrals of Australian citizenship—OECD member countries, by former nationality and gender, 2012–13
Citizenship Male Female Total1 Austria 47 40 87 Belgium 57 75 132 Canada 455 619 1 074 Chile 116 110 226 Czech Republic 33 60 93 Denmark 25 17 42 Estonia 10 24 34 Finland 41 80 121 France 426 416 842 Germany 417 483 900 Greece 39 31 70 Hungary 94 108 202 Iceland 6 8 14 Ireland 1 031 765 1 796 Israel 229 170 399 Italy 393 301 694 Japan 71 106 177 Republic of Korea 991 1 118 2 109 Luxembourg 2 2 4 Mexico 130 109 239 Netherlands 268 241 509 New Zealand 1 935 1 859 3 794 Norway 8 4 12 Poland 168 248 416 Portugal 70 73 143 Slovakia 33 44 77 Slovenia 26 20 46 Spain 56 85 141 Sweden 109 165 274 Switzerland 79 99 178 Turkey 283 201 484 United Kingdom 10 577 9 901 20 478 United States of America 749 815 1 564 OECD total 18 974 18 397 37 371 Non-OECD total 42 444 43 618 86 067 Total 61 418 62 015 123 438 Source data: Citizenship Programme Management, DIBP 1. Includes gender not stated.
Australia’s Migration Trends 2012–13 Page 180 of 187
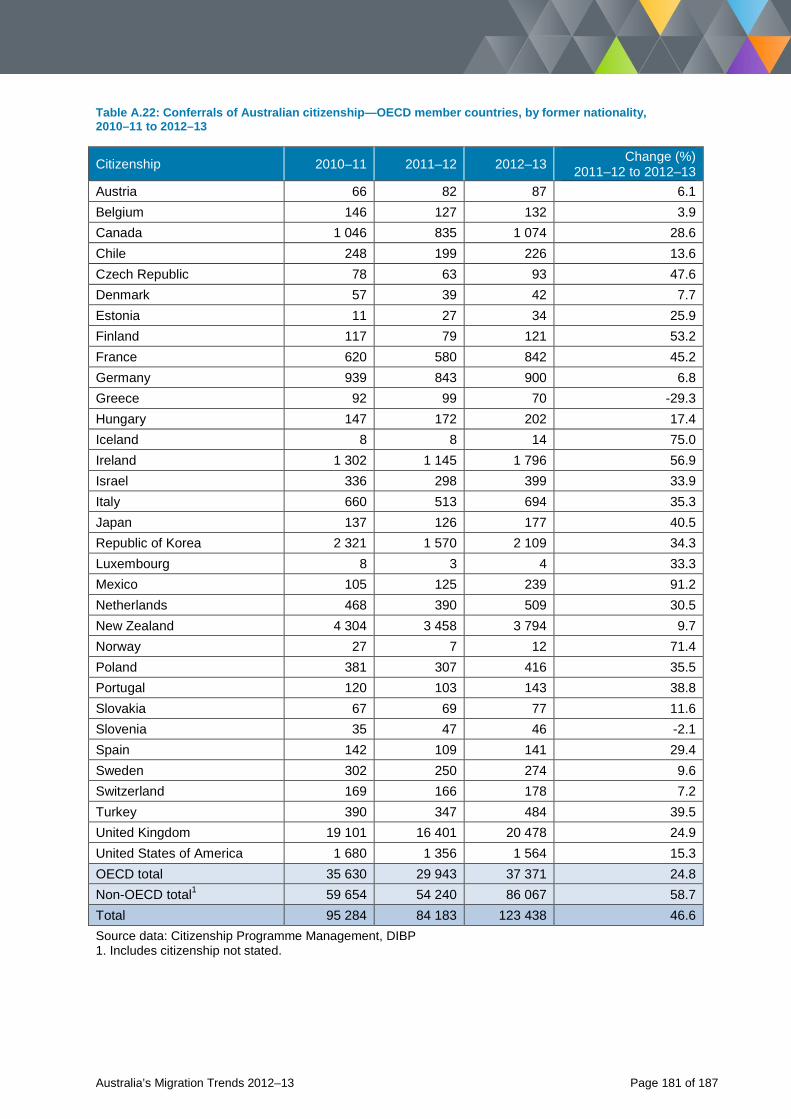
Table A.22: Conferrals of Australian citizenship—OECD member countries, by former nationality, 2010–11 to 2012–13
Citizenship 2010–11 2011–12 2012–13 Change (%) 2011–12 to 2012–13
Austria 66 82 87 6.1 Belgium 146 127 132 3.9 Canada 1 046 835 1 074 28.6 Chile 248 199 226 13.6 Czech Republic 78 63 93 47.6 Denmark 57 39 42 7.7 Estonia 11 27 34 25.9 Finland 117 79 121 53.2 France 620 580 842 45.2 Germany 939 843 900 6.8 Greece 92 99 70 -29.3 Hungary 147 172 202 17.4 Iceland 8 8 14 75.0 Ireland 1 302 1 145 1 796 56.9 Israel 336 298 399 33.9 Italy 660 513 694 35.3 Japan 137 126 177 40.5 Republic of Korea 2 321 1 570 2 109 34.3 Luxembourg 8 3 4 33.3 Mexico 105 125 239 91.2 Netherlands 468 390 509 30.5 New Zealand 4 304 3 458 3 794 9.7 Norway 27 7 12 71.4 Poland 381 307 416 35.5 Portugal 120 103 143 38.8 Slovakia 67 69 77 11.6 Slovenia 35 47 46 -2.1 Spain 142 109 141 29.4 Sweden 302 250 274 9.6 Switzerland 169 166 178 7.2 Turkey 390 347 484 39.5 United Kingdom 19 101 16 401 20 478 24.9 United States of America 1 680 1 356 1 564 15.3 OECD total 35 630 29 943 37 371 24.8 Non-OECD total1 59 654 54 240 86 067 58.7 Total 95 284 84 183 123 438 46.6 Source data: Citizenship Programme Management, DIBP 1. Includes citizenship not stated.
Australia’s Migration Trends 2012–13 Page 181 of 187
Data sources for Australia’s Migration Trends Australian Bureau of Statistics
• Census of Population and Housing, 1986, 1996, 2001, 2006 and 2011 • Australian Demographic Statistics, cat. no. 3101.0 • Employee Earnings and Hours, May 2010, cat. no. 6306.0 • Labour Force, Australia, Detailed—Electronic Delivery, cat. no. 6291.0 • Migration, Australia, 2010–11, cat. no. 3412.0 • Travellers’ Characteristics Database • Understanding Migrant Outcomes—Enhancing the Value of Census Data, Australia, 2011, cat
no. 3417.0
Department of Immigration and Border Protection
• Business Intelligence Service Centre (BISC) • Citizenship Programme Management • Compliance, Case Management, Detention and Settlement (CCMDS) • Compliance Statistics • Continuous Survey of Australia’s Migrants (CSAM) • Historical Migration Statistics • Humanitarian Settlement Services (HSS) Statistics • Integrated Client Service Environment (System) (ICSE) • Migration Programme Management System (MPMS) • Migration Reporting • Overseas Arrivals and Departures (OAD) Statistics • Programme Analysis Section (PAS) • Stock of Temporary Entrants • The Outlook for Net Overseas Migration, June 2013 • Translating and Interpreting Service (TIS) National Statistics • Visa Reporting
Australian Institute of Health and Welfare
• Diversity in Older Australians: Culturally and Linguistically Diverse older Australians (http://www.aihw.gov.au/aged-care/diversity/)
Australia’s Migration Trends 2012–13 Page 182 of 187
Glossary Census—refers to the Australian Government’s 2011 Census of Population and Housing. The Census is conducted every five years.
Citizenship by conferral—process of naturalisation whereby an applicant, after meeting all other criteria, becomes an Australian citizen at a formal citizenship ceremony.
Competent English—an International English Language Testing System band score of at least six for the four test components (speaking, reading, listening and writing).
Contributory parent category visa—a permanent visa for aged parents with children living in Australia. This visa costs more than the Aged Parent visa but is generally processed faster.
Dependant—a person is a dependant if they are included on a visa application and wholly or substantially rely on the Primary Applicant for financial, psychological or physical support. See also Primary Applicant.
Electronic Travel Authority—an electronically-stored authority for travel to Australia for short-term visits or business entry. It replaces the visa label or stamp in a passport and removes the need for application forms.
Family Stream—categories of the Migration Programme where the core eligibility criteria are based on a close family relationship with a sponsor who is an Australian citizen, Australian permanent resident or eligible New Zealand citizen. The immediate accompanying families of principal applicants in the Family Stream (for example, children of spouses) are also counted as part of the Family Stream.
Functional English—an International English Language Testing System band score of at least an average of 4.5 for the four test components (speaking, reading, listening and writing).
Humanitarian Programme—provides protection to refugees and resettlement to those for whom it may be the appropriate durable solution. In line with Australia’s international obligations, the onshore component of this programme provides protection to refugees in Australia whose claims meet the criteria of the 1951 Convention Relating to the Status of Refugees and its 1967 Protocol. The offshore component resettles refugees and others who are in great humanitarian need.
Independent Executive visa—is part of the Business (Long Stay) (subclass 457) visa category now known as the Temporary Work (Skilled) (subclass 457) visa, and caters for individuals wishing to establish a new business or buy an interest in an existing business in Australia and actively manage that business daily. Since 1 March 2003, people can no longer lodge an application for an Independent Executive visa offshore.
International student—see Overseas Student.
Illegal Maritime Arrival—A person who arrives in Australia by boat at a place outside of Australia’s regular migration zone (including Christmas Island), without a valid visa. Also referred to as an Unauthorised Maritime Arrival.
Labour force—the population 15 years of age or over who are employed or unemployed.
Australia’s Migration Trends 2012–13 Page 183 of 187
Main English-speaking countries—other than Australia, comprise Canada, Ireland, New Zealand, South Africa, the United Kingdom and the United States of America. See also non-English-speaking countries.
Migration Programme—annual planned permanent intake determined by the Australian Government in the Budget context which governs the number of visas granted for permanent entry from offshore and for permanent resident status onshore, not including New Zealand citizens intending to live permanently in Australia.
Net Overseas Migration—net gain or loss of population through people arriving in and departing from Australia:
• based on an international travellers' duration of stay being in or out of Australia for 12 months or more
• the difference between the number of: 1. incoming international travellers who stay in Australia for 12 months or more, who are not
currently counted in the population, are added to the population (NOM arrivals) 2. outgoing international travellers (Australian residents and long-term visitors to Australia) who
leave Australia for 12 months or more, who are currently counted in the population, are subtracted from the population (NOM departures).
Under the current method for estimating final NOM, this term is based on a traveller's actual duration of stay or absence during a 16-month period. Preliminary NOM estimates are modelled on patterns of traveller behaviours observed in final NOM estimates for the same period one year earlier.
Non-English-speaking countries—all countries other than those listed under main English-speaking countries.
Offshore—location outside Australia. Thus, offshore components of the Migration Programme refer to visas that cater for the migration of people who are outside of Australia. Certain offshore visas can, however, be applied for by people in Australia, but they must be outside Australia for the granting of the visa.
Onshore—location in Australia. Thus, onshore components of the Migration Programme refer to visas that cater for the migration of people who are in Australia.
Outcome—the number of visas granted net of Business Innovation and Investment provisional visas cancelled and net of places taken by provisional Partner category visa holders who do not subsequently obtain a permanent visa. It also excludes grants to people who have been previously counted towards the Migration Programme or Humanitarian Programme and New Zealand citizens.
Overseas Student (or international student)—temporary migrant in Australia who is studying at an Australian educational institution in a course approved by the Commonwealth Register of Institutions and Courses for Overseas Students.
Passenger Card—completed by all passengers arriving in or departing from Australia. Information collected includes occupation, nationality, intended length of stay, state/territory of intended residence is collected.
Planning levels—notional number of places available in the Migration Programme for the financial year, as set by the Australian Government. Levels do not always precisely match outcomes due to the way the outcomes are measured. See also Outcome.
Australia’s Migration Trends 2012–13 Page 184 of 187
Primary Applicant—the person who applied for the visa. Other people included on the visa are referred to as dependants or Secondary Applicants.
Programme year—aligns with the Australian financial year, for example 1 July 2011 to 30 June 2012.
Refugee—defined by the 1951 United Nations Convention relating to the Status of Refugees, as amended by the 1967 Protocol, as a person who: • owing to well-founded fear of being persecuted for reasons of, race, religion, nationality,
membership of a particular social group or political opinion • is outside the country of their nationality and is unable or owing to such fear, is unwilling to avail
themselves of the protection of that country; or who, not having a nationality and being outside the country of their former habitual residence, is unable or, owing to such fear, is unwilling to return to it.
Refugee Review Tribunal—an independent statutory body that reviews decisions about onshore applicants for refugee status.
Settlement—refers to the experience of adapting to life in Australia for newly arrived permanent settlers, roughly equivalent to ‘integration’.
Settler arrivals—people arriving in Australia who hold permanent migration visas, New Zealand citizens who indicate an intention to live in Australia, and those otherwise eligible to live here (for example, overseas-born children of Australian citizens). Data is based on statistics obtained from visa information and supplemented by information obtained from incoming passenger cards.
Short-term intra-corporate transfers—also known as ‘posted workers’, includes employees whose employer temporarily transfers them to another country to provide services for a limited period. In the Australian context, these include certain people arriving on one of Australia’s five short-term business visitor visas or Electronic Travel Authorities, and some holders of a Temporary Work (Skilled) (subclass 457) visa.
Skill Stream—comprises the categories of the Migration Programme where the core eligibility criteria are based on the applicant’s employability or capacity to invest and/or do business in Australia. The immediate accompanying families of Skill Stream principal applicants are also counted as part of the Skill Stream.
Stateless—refers to an individual who self identifies as stateless, who lacks identity as a national of a state for the purpose of law and who is not entitled to the rights, benefits or protection ordinarily available to a country's nationals.
Stock of temporary entrants—the number of temporary entrants in Australia at a point in time. Stock data is not used to report on visitors because the number of visitors in Australia at any one point in time is relatively small and subject to large seasonal variations.
Subclass—a unique three-digit numerical code associated with each visa. For example, the Temporary Work (Skilled) (subclass 457) visa is also known as the subclass 457 visa.
Temporary entry—refers to temporary visas granted under four main categories—visitors, students, Working Holiday Makers and temporary residents.
Visa—permission or authority granted by the Australian Government for foreign nationals to travel and stay in Australia.
Australia’s Migration Trends 2012–13 Page 185 of 187
Acronyms
ABS Australian Bureau of Statistics
AusAID Australian Agency for International Development
CCMDS Compliance, Case Management, Detention and Settlement
CCS Complex Case Support
CSAM Continuous Survey of Australia's Migrants
DIBP Department of Immigration and Border Protection
BISC Business Intelligence Service Centre
ELICOS English Language Intensive Courses for Overseas Students
ENS Employer Nomination Scheme
ETA Electronic Travel Authority
HSS Humanitarian Settlement Services
ICT Information and communication technology
ICSE Integrated Client Service Environment (System)
IMA Illegal Maritime Arrival
KPMG Klynveld Peat Marwick Goerdeler
MESC Main English-Speaking Country
MPMS Migration Programme Management System
n/a not applicable
NOM Net Overseas Migration
NZ New Zealand
OAD Overseas Arrivals and Departures
OECD Organisation for Economic Co-operation and Development
Australia’s Migration Trends 2012–13 Page 186 of 187
OSB Operation Sovereign Borders
PAS Programme Analysis Section
RSMS Regional Sponsored Migration Scheme
SAR Special Administrative Region
TIS Translating and Interpreting Service
UMA Unauthorised Maritime Arrival
UNC Unlawful Non-Citizen
UNHCR United Nations High Commissioner for Refugees
VET Vocational Education and Training
Australia’s Migration Trends 2012–13 Page 187 of 187