Embed Size (px)
Citation preview

Australia’s Complementary
Medicines
Industry Audit & Trends 2020

ABOUT COMPLEMENTARYMEDICINESComplementaryMedicines Australia (CMA)
CMA is the peak industry body for the complementarymedicines industry, representing stakeholders across the value chain, including manufacturers, raw material suppliers, distributors, consultants, retailers, allied health professionals, researchers and educators.
CMA promotes appropriate industry regulation and advancement to ensure consumers have access to complementary medicines of the highest quality.
We have been conducting annual audits of the industry for10 years and are pleased to present our most comprehensive audit to date.
Complementary Medicines
Regulated in Australia as medicines under the Therapeutic Goods Act 1989, complementary medicines include vitamins, mineraland nutritional supplements, homeopathic, aromatherapy products and herbal medicines. The term ‘complementarymedicines’also comprises traditional medicines, which includestraditional Chinese medicines, Ayurvedic, Australian Indigenous and Western herbal medicines.

CMA INDUSTRY AUDIT & TRENDS 2020 | 3
INDUSTRY AUDITSUMMARY
Number One
Australia is the largest exporter of Nutrition and Health Food to China,
with over $1 billion of exports.
Healthy Growth
The Complementary Medicines industry continues to outpace growth in the
broader economy.
Assisting in Your Health
One third of Australians using Complementary Medicines do so to manage
the symptoms of a chronic disease.
$5.6 billion Industry
Vitamin & Dietary Supplements: $3.1 billionSports Nutrition: $1.31 billion
Herbal / Traditional Products: $0.76 billionWeight loss: $0.43 billion
7 out of 10 People
Most Australians (75%) have used atleast one form of complementary
medicine in the last year.
CMA INDUSTRY AUDIT & TRENDS 2020 | 4
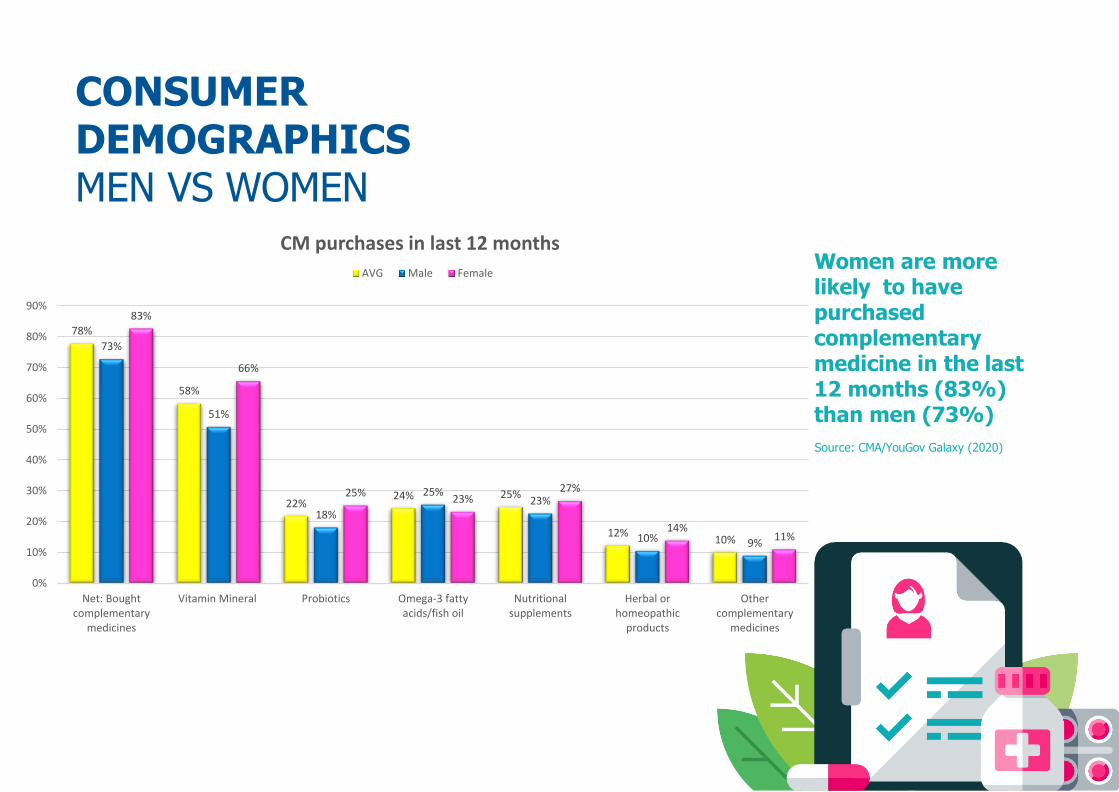
CONSUMERDEMOGRAPHICSMEN VS WOMEN
Women are morelikely to have purchased complementary medicine in the last12 months (83%)than men (73%)
Source: CMA/YouGov Galaxy (2020)
78%
58%
22%24% 25%
12%10%
73%
51%
18%
25%23%
10% 9%
83%
66%
25%23%
27%
14%11%
0%
10%
20%
30%
40%
50%
60%
70%
80%
90%
Net: Boughtcomplementary
medicines
Vitamin Mineral Probiotics Omega-3 fattyacids/fish oil
Nutritionalsupplements
Herbal orhomeopathic
products
Othercomplementary
medicines
CM purchases in last 12 months
AVG Male Female

CMA INDUSTRY AUDIT & TRENDS 2020 | 5
HEALTHYGROWTH
The Vitamins and Dietary Supplement Category has doubled in size over 10years
Forecasted to grow 22% CAGR over the next 10 years.
1,000
2,000
3,000
4,000
5,000
6,000
7,000
02008 2009 2010 2011 2012 2013 2014 2015 2016 2017 2018 2019 2020 2021 2022 2023
$ A
UD
mil
CategoryGrowth
Forecast
Weight Management and Wellbeing Sports Nutrition
Herbal and Traditional Products Vitamins and Dietary Supplements
Source: EuroMonitor (2020)
CMA INDUSTRY AUDIT & TRENDS 2020 | 6
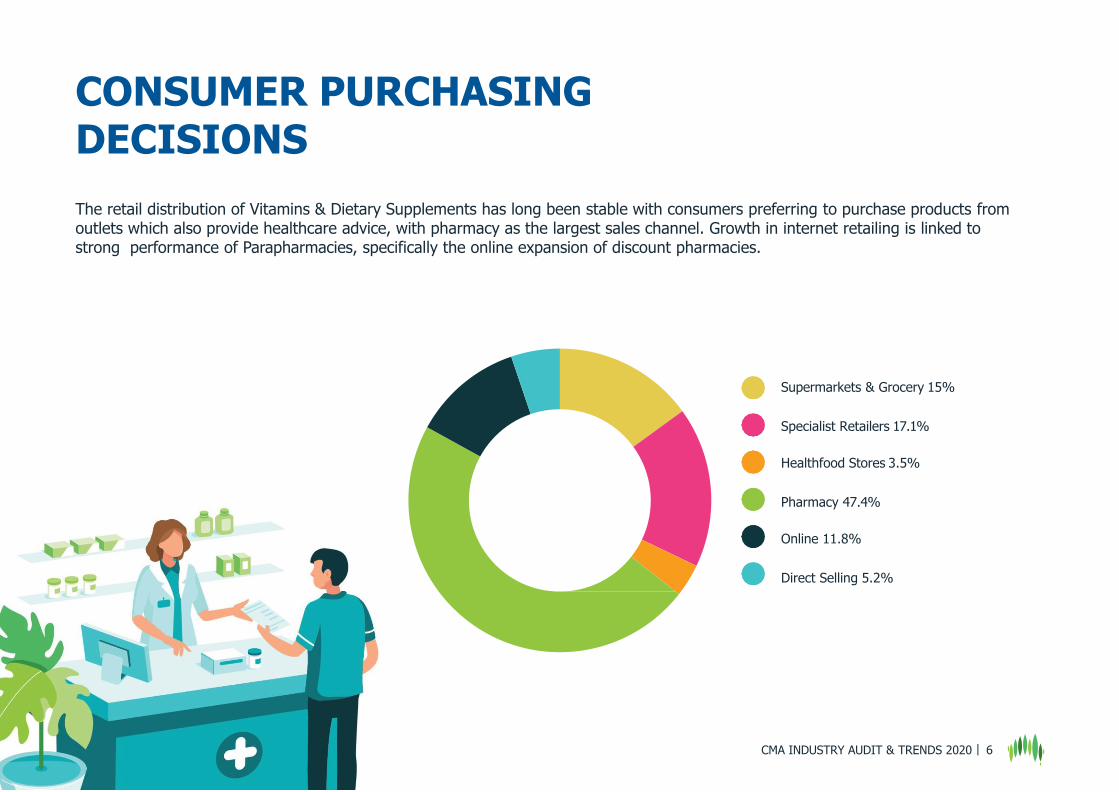
CONSUMER PURCHASINGDECISIONS
The retail distribution of Vitamins & Dietary Supplements has long been stable with consumers preferring to purchase products from outlets which also provide healthcare advice, with pharmacy as the largest sales channel. Growth in internet retailing is linked tostrong performance of Parapharmacies, specifically the online expansion of discount pharmacies.
Supermarkets & Grocery 15%
Specialist Retailers 17.1%
Healthfood Stores 3.5%
Pharmacy 47.4%
Online 11.8%
Direct Selling 5.2%

AUSTRALIA’S MANUFACTURINGSECTOR
Australian manufacturers are the globalleaders in driving industry best practice. The sector is recognised around the world for the highest quality and safetystandards.
92 TGA licensed manufacturing sites1
2,605 direct employees in the sector2
$74,127 average wage in sector2
10.8% Profit Margin
6% annual growth rate (2015-2020)2
Sources:(TGA, 2020)1
(IBISWorld, 2020)2
CMA INDUSTRY AUDIT & TRENDS 2020 | 7

CMA INDUSTRY AUDIT & TRENDS 2020 | 8
PRODUCTS BY HEALTH CATEGORY AND TRENDINGINGREDIENTSProducts by HealthCategory
Top Fastest GrowingIngredients
2018-2019 %
Growth
11.3%
Probiotics
5.6%
Calcium
4.7%
Co-Enzyme Q10
EveningPrimrose Oil
3.1%
Total $ AUD (m) 3,825
Position1 Category % Share2019
1 General Health 17.3
2 Joint and Bone 14.7
3 Heart Health 13.4
4 Digestive 10.6
5 Women’s Health 8.1
6 Energy 6.0
7 Immunity 5.5
8 All Other 24.4
Sources: EuroMonitor (2020)
CMA INDUSTRY AUDIT & TRENDS 2020 | 9
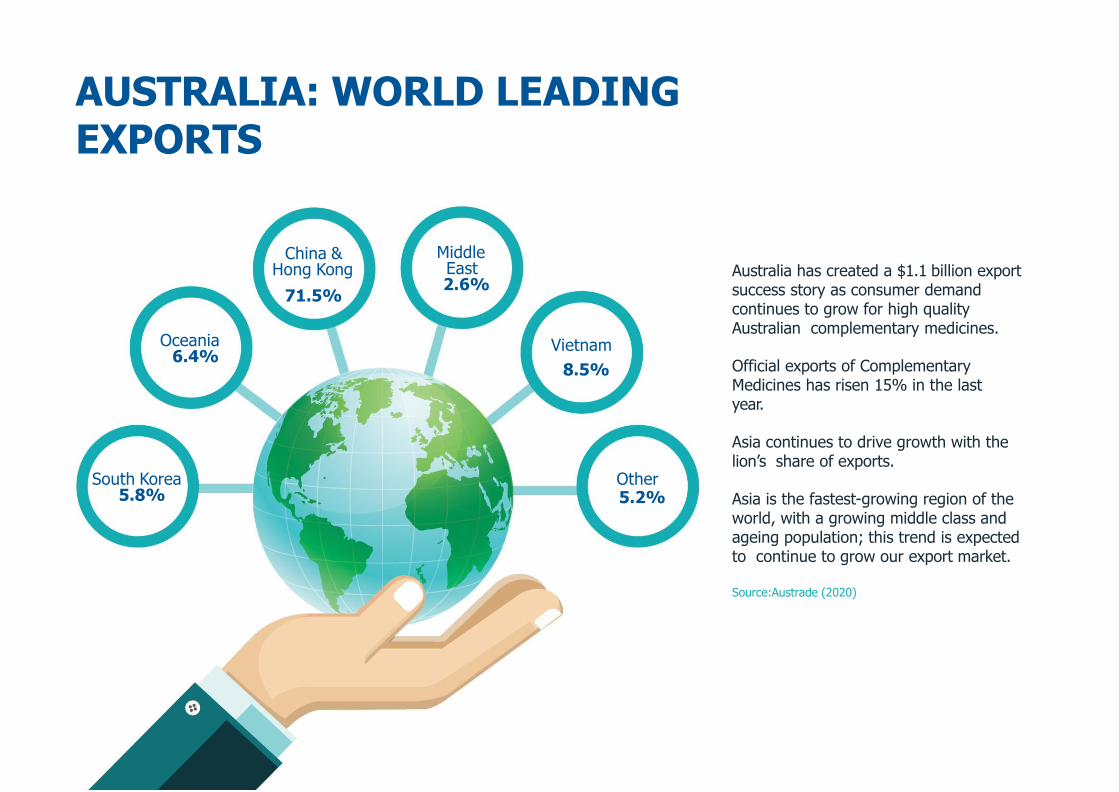
AUSTRALIA: WORLD LEADINGEXPORTS
Australia has created a $1.1 billion export success story as consumer demand continues to grow for high qualityAustralian complementary medicines.
Official exports of Complementary Medicines has risen 15% in the lastyear.
Asia continues to drive growth with thelion’s share of exports.
Asia is the fastest-growing region of the world, with a growing middle class and ageing population; this trend is expectedto continue to grow our export market.
Source:Austrade (2020)
Oceania6.4%
China &Hong Kong
71.5%
MiddleEast2.6%
South Korea5.8%
Vietnam
8.5%
Other5.2%

CMA INDUSTRY AUDIT & TRENDS 2020 | 10
AUSTRALIA: THE NUMBER ONE CHOICE FORCHINA
Australia is the largest source of Nutrition and Health Food Imports to China with an import volume ofAU $1.12 Billion (US $730 Million)
USA is second with US$680million and Germany is third withUS$240 million
China represents a significant growth opportunity for the Australian industry potentially doubling in size in 3 years
Size of Import Market 2019:$3.4b USD to reach $11b by 2024
Potential size of China MarketUS$68b
Australia year-on-year growth of imports into China of Nutrition and Health Food Imports 9%
Source: China Chamber of Commerce for Import and Export of Medicines and Health food Products (CCCMHPIE) (2020)
Sources: EuroMonitor (2020) CMA (2020)

CMA INDUSTRY AUDIT & TRENDS 2020 | 11
FIVE YEARHEALTHCHECK
Sales Growth of Australian Complementary Medicines
Value of Australian Exports
2014
$3.5 billion
2019
$5.6 billion
$175 million
2014 2019
$1.1 billion
The Australian Complementary medicines sector has seen a considerable acceleration in growth over the last five years; drivenby consumer demand domestically and internationally.
Australian complementary medicines are recognised around the world for their quality, safety and efficacy.
Growth has increased across many categories due to rising consumer spending and strong demand from consumers withincreasingly busy lifestyles, longer working hours and more stressful social lives, and a focus on preventative healthcare.
Industry has innovatived with new delivery formats, flavours, packaging and new ingredients and formulations.
Sources: Euromonitor (2020)Austrade (2020)
Vitamins & DietrySupplements
55%2014/2019 Compound Annual Growth
Herbal & Traditional Products
57%2014/2019 Compound Annual Growth
CMA INDUSTRY AUDIT & TRENDS 2020 | 12
AUDITREFERENCESAustrade, 2020. Australian Complementary Medicines Export Statistics 2016-2019, Canberra: s.n.
Australian Institute of Health and Welfare, 2019. Australian Burden of Disease Study: impact and causes of illness and death in Australia 2015. Australian Burden of Disease series, Issue 19.
China Chamber of Commerce for Import and Export of Medicines and Health Food Products, 2020. China Import Data- HealthFoods, Beijing: s.n.
Euromonitor International Australia, 2019. ComplementaryMedicines Market Data 2018-2019, Sydney: Euromonitor International Australia.
Foodsource, 2019. Foodsource 2019-2020, Gold Coast: Enthous Media.
IbisWorld, 2019. Vitamin and Supplement Manufacturing inAustralia: Market Research Report., Sydney: s.n.
Therapeutic Goods Administration, 2020. TGA ComplementaryMedicines manufacturing licence registry, Canberra: AustralianGovernment Department of Health.
YouGov Galaxy, 2020. Complementary Medicines Consumer Sentiment, Canberra: Complementary Medicines Australia.

cmaustralia.org.au+61 (02) 6260 4022
PO Box 450, Mawson, ACT 2607 Australia