Embed Size (px)
Citation preview

Australian Water Resources 2005
A baseline assessment of water resources for the National Water InitiativeLevel 2 Assessment
River and Wetland Health ThemeAssessment of River and Wetland Health: A Framework for Comparative Assessment of
the Ecological Condition of Australian Rivers and Wetlands

Australian Water Resources 2005
A baseline assessment of water resources for the National Water Initiative Level 2 Assessment
River and Wetland Health Theme
Assessment of River and Wetland Health: A Framework for Comparative Assessment of the Ecological Condition of
Australian Rivers and Wetlands
May 2007

This initiative is supported through the Australian Government's Raising National Water Standards Programme
Acknowledgements
The WRON Alliance is a group of key government, academic and industry partners who have formed a coalition to improve the usage and value of water resources information for the benefit of the nation. Members of the WRON Alliance involved with the development of Australian Water Resources 2005, which is an initiative of the National Water Commission, include: CSIRO, eWater CRC, Bureau of Rural Sciences (BRS), Australian Bureau of Statistics (ABS), National Land and Water Resources Audit (NLWRA), and Sinclair Knight Merz (SKM). The River and Wetland Health theme of this report was made possible through interaction, support and input of many organisations and individuals. In particular, thanks are due to the jurisdictional reference group consisting of representatives of the Australian states and Australian Government agencies. These provided important input and feedback, often at short notice. Colin Chartres, Matt Kendall, Judy Hagan and Craig McVeigh of the National Water Commission were closely involved with all aspects of the project and had significant input throughout. Paul Wilson from the Victorian Department of Sustainability and Environment and Martin Read from the Tasmanian Department of Primary Industries and Water played a major role in supplying data and contributing to the project. Authors: Richard H. Norris, Fiona Dyer, Peter Hairsine, Mark Kennard, Simon Linke, Linda Merrin, Arthur Read, Wayne Robinson, Chris Ryan, Scott Wilkinson, and David Williams. May 2007 Also available at: <http://www.water.gov.au>
This work is copyright. Apart from any use as permitted under the Copyright Act 1968, no part may be reproduced by any process without prior written permission from the Commonwealth. Requests and inquiries concerning reproduction and rights should be addressed to the Commonwealth Copyright Administration, Attorney General’s Department, Robert Garran Offices, National Circuit, Barton ACT 2600 or posted at <http://www.ag.gov.au/cca>. National Water Commission 95 Northbourne Ave Canberra ACT 2600 Email: [email protected] Phone: 02 6102 6000 © Commonwealth of Australia 2007 ISBN 13: 978-1-921107-40-5

Framework for the Assessment of River & Wetland Health
i
Contents
Page
Executive summary ...................................................................................... iii
1 Introduction ...........................................................................................1
1.1 Purpose.........................................................................................1 1.2 The philosophy .............................................................................3 1.3 Role of the national framework ..................................................7
2 Methods .................................................................................................9
2.1 Environmental components to be represented.........................9 2.2 Assessment and reporting framework and scale ...................10 2.3 Surface water management areas ...........................................11 2.4 Reaches and wetlands ..............................................................11 2.5 The reference condition approach ...........................................14 2.6 Indices and index features ........................................................15 2.7 Integration of the framework components..............................16 2.7.1 Reach, wetland and basin scale aggregation and integration ............... 16 2.7.2 Methods to integrate indices ..................................................................... 19 2.8 Analysis of common factors determining river condition ......21 2.9 Sensitivity analysis.....................................................................21 2.9.1 Method.......................................................................................................... 21 2.9.2 Sensitivity and underlying reasons in the NLWRA I................................. 21 2.10 Range standardisation and bands of condition...................23 2.10.1 Range standardisation................................................................................ 23 2.10.2 Bands of condition ...................................................................................... 24 2.11 Missing data............................................................................30 2.11.1 Overall Index at various scales .................................................................. 30 2.11.2 Hydrological Disturbance Index................................................................. 31 2.11.3 Nutrient and suspended sediment load index (Water Quality and Soils Index) 31 2.11.4 Habitat index (Physical Form Index).......................................................... 32 2.11.5 Catchment Disturbance Index ................................................................... 32 2.11.6 Aquatic Biota Index ..................................................................................... 32 2.11.7 Integrating the four environmental indices into an NLWRA I ARCE at the reach level .................................................................................................................... 33 2.11.8 Validation of indices .................................................................................... 33
3 References...........................................................................................34


Framework for the Assessment of River & Wetland Health
iii
Executive summary The National Framework for the Assessment of River and Wetland Health (FARWH) is being developed as part of the Australian Water Resources 2005 (AWR 2005) project being undertaken by the National Water Commission (the Commission) under the National Water Initiative (NWI).
The AWR 2005 Discovery Phase, undertaken in early 2006, examined the availability of data to undertake a national river health assessment based on the last national assessment under the Australian Catchment, River and Estuary Assessment 2002 (NLWRA 2002). It was determined that, although there were significant gaps in available data in some areas of Australia, other areas of Australia had methods and techniques that had advanced beyond those of 2002.
For this reason, the Commission is progressing the development of a national framework for river and wetland health assessment, with partner governments to enable the future application of a robust national assessment that uses existing work to the maximum extent possible.
The resulting framework, FARWH, is designed to provide the information needed to:
• establish ‘environmental and other public benefit outcomes’ (NWI paragraph 35)
• ‘address currently over allocated and/or overused systems’ (NWI paragraphs 41–45)
• support ‘integrated management of environmental water’ (NWI paragraphs 78–79).
FARWH has been developed through extensive consultation with partner state and territory governments. Other stakeholders, such as regional authorities that monitor natural resources, will also be increasingly involved to better incorporate all relevant monitoring regimes.
A framework such as FARWH is seen as essential because it allows existing work to be used for reporting the aggregate impacts of resource use on rivers and wetlands at a national scale. In this way, long-term changes in condition can be identified, including changes resulting from water management regimes.
FARWH is closely linked to other major programs such as:
• Victorian Index of Stream Condition
• Victorian Index of Wetland Condition
• Tasmanian Conservation of Freshwater Ecosystem Values Framework
• Queensland Wetlands Program
• Natural Resource Management Ministerial Council, National Natural Resource Management Monitoring and Evaluation Framework (NNRMM&EF)

Framework for the Assessment of River & Wetland Health
iv
The FARWH is based on a hierarchical model of river and wetland function, which addresses: environmental components to be represented by a national assessment, reporting scale, reference condition, discussion on selection of indices, methods for integrating and aggregating indices for assessment, sensitivity analysis, range standardisation, and managing missing data.
The FARWH proposes that six key components are appropriate for the assessment of river and wetland health, all of which are considered to represent ecological integrity. These are:
• catchment disturbance
• hydrological change and spatial extent of wetland and temporal change
• water quality
• physical form
• fringing zone
• aquatic biota.
The FARWH describes how to develop and combine indices so that nationally comparable assessments of river and wetland health can be achieved. This is designed to enable states and territories to include data that are already being collected (for example, AUSRIVAS invertebrate data) and to compare these data between regions. In some cases, such as the Victorian Index of Stream Condition, little change is needed to incorporate specific datasets into the national framework.
The framework presents the components of the environment to be represented but does not prescribe which indices should be selected to represent them. It also describes how to create the indices so that their characteristics allow direct comparisons between jurisdictions without having to take the same measurements in each place. For example, an index score of 0.5 on a scale of 0–1 for biota in one place should mean the same as a 0.5 score in another place, even if different biotic groups have been used. The index would then represent the condition of the biota considered important for that state or territory. This is achieved by agreed range standardising, reference conditions, validation, and sensitivity analysis.
The framework also recommends that indices should be:
• relative to a reference (usually pre-European conditions)
• linear and range standardised to 0–1, in increments of 0.1
• divided into condition bands.
Consideration should also be given to:
• the weighting of indices when aggregating from the finest scale of measurement, which will usually be the reach or individual wetland, to represent the surface water management area (SWMA). This weighting would normally be by stream length, or the wetted area of individual wetlands

Framework for the Assessment of River & Wetland Health
v
• methods of integration, which may follow expert rules (e.g.such as the CFEVF, Sustainable Rivers Audit). Where these are well thought out, inverse ranking should be used, as in the Victorian Index of Stream Condition. Euclidean distance is recommended where other methods have not been well developed
• sensitivity analysis to determine which indices contribute most to the evaluations
• the inevitably that there will be missing data at the finest scale of measurement. It is recommended that three of the six components should be present before an overall assessment can be reported
• at the scale of an individual surface water management area, at least five per cent of the recognised river reaches or wetlands should be represented.
The Assessment of River and Wetland Health: Potential Comparative Indices (companion document produced by the River and Wetland Health Theme, NWC 2007), describes indices that have been developed in a way that meets the requirements of the FARWH, largely during the first National Land and Water Resources Audit. Indices developed as part of the Victorian Index of Stream Condition and the Tasmanian Conservation of Freshwater Ecosystem Values Project also conform to the FARWH. Any of these may be selected by various jurisdictions. They may also be selected to fill gaps in the environmental components that may not be covered in existing state or territory programmes. Although these indices are not prescribed, some of them such as the AUSRIVAS and hydrology indices (flow stress ranking) have already been accepted for use by several jurisdictions and may be used quite widely.
The Assessment of River and Wetland Health: Potential comparative indices, (NWC 2007) therefore provides a series of methods that can be used in the assessment of river and wetland health, including a new method that has been developed for the fringing (riparian) zone.

Framework for the Assessment of River & Wetland Health
1
1 Introduction
1.1 Purpose The National Framework for the Assessment of River and Wetland Health (FARWH) is being developed as part of the Australian Water Resources 2005 project being undertaken by the National Water Commission (the Commission) under the National Water Initiative (NWI).
Australian Water Resources 2005 (AWR 2005) reports under three headline parameters: Water Availability, Water Use, and River and Wetland Health.
Philosophically, the term ‘river and wetland health’ is useful because it is readily interpreted by most people and evokes societal concern about human impacts on river and wetlands. The common goal of achieving healthy rivers and wetlands unites scientists, in particular ecologists, and others because the value of the scientific contributions is clear. A possible problem arises in the choice of relevant symptoms, or indicators, because no single indicator is likely to stand alone to reveal river and wetland health unequivocally (Boulton 1999): there is a wide variety that can be measured with varying accuracy and at a broad range of spatial scales. Thus, the FARWH is designed to provide a framework to guide assessment of river and wetland ‘health’.
The AWR 2005 Discovery Phase examined the availability of data relevant to undertaking a national river health assessment based on the last national assessment under the Australian Catchment, River and Estuary Assessment 2002. It was determined that, although there were significant gaps in available data in some areas of Australia, other areas of Australia had access to methods and techniques that had advanced beyond those of 2002.
For this reason, the Commission is progressing a national framework for river and wetland health assessment. The resulting framework, FARWH, is designed to provide the information needed to:
• establish ‘environmental and other public benefit outcomes’ (NWI paragraph 35)
• ‘address currently over allocated and/or overused systems’ (NWI paragraphs 41–45)
• support ‘integrated management of environmental water’ (NWI paragraphs 78–79).
The FARWH is being developed through extensive consultation with partner state and territory governments. Other stakeholders, such as regional authorities that monitor natural resources, will also be increasingly involved to better incorporate all relevant monitoring regimes into an assessment of national river and wetland health.
A framework such as the FARWH is seen as essential because it allows existing state and territory work to be used for reporting the aggregate impacts of resource use on rivers and wetlands at a national scale. In this

Framework for the Assessment of River & Wetland Health
2
way, long-term changes in condition can be identified, including changes resulting from water management regimes.
National natural resource management at broad scales requires information at matching broad scales. Such broad-scale information on river and wetland condition is required to assist managers to assess and develop policies, decide on investments, evaluate program and policy performance and direct resource management activities, particularly those of government. Thus, broad-scale assessment that focuses on the information needs of the Australian and state and territory governments is needed. Local government, rural industries, community groups, and various other government and non-government organisations will also benefit.
Water resource managers in Australia have recognised significant problems that are associated with an increasing demand for water, declining river and wetland health, and public pressure for changed management. For example, dryland salinity and soil and streambank erosion are problems that affect rivers and wetlands nation-wide. Both require management at broad scales. More positively, the Murray-Darling Basin Cap has limited diversions in recognition of the maintenance of environmental values as a legitimate use of water.
The formulation of policies to manage such problems generally does not require site-specific information but does need assessment at regional, state or national levels. Answers are needed to questions such as:
• ‘What is the extent and condition of our renewable natural resources?’
• ‘Where and what parts of the environment are changing?’
• ‘What is causing the observed environmental changes?’ (Olsen et al. 1999).
The problems inherent in answering these questions have been recognised in several countries, with the result that large-scale programmes have been implemented. There have been national surveys of lakes and rivers in Great Britain (Wright 1995, Raven et al. 1998), Sweden (Wiederholm and Johnson 1997), and the United States of America (Wadeable Streams Assessment. A Collaborative Survey o f the Nation’s Streams, US EPA 2006, <http://www.epa.gov/owow/streamsurvey/report.pdf >).
All Australian states and territories have developed white papers, strategic plans, or policies on water that recognise shortages and the need for management, especially in relation to the environment and achieving sustainable water use. These policy documents lay out how water reform will be achieved and the objectives of the relevant state and territory water Acts.
The June 2004 Intergovernmental Agreement on a National Water Initiative (NWI) <http://www.coag.gov.au/meetings/250604/index.htm#water_initiative> renewed these efforts by reaffirming commitment to the 1994 agreements and setting a new schedule of actions. All states and territories have now

Framework for the Assessment of River & Wetland Health
3
signed up to the NWI. The specific NWI objectives that relate to environmental water provisions are:
• Objective (iii) – statutory provision for environmental and other public benefit outcomes, and improved environmental management practices
• Objective (iv) – complete the return of all currently overallocated or overused systems to environmentally sustainable levels of extraction.
Furthermore, paragraph 79 (f) of the NWI requires ‘management and institutional arrangements to ensure the achievement of environmental and public benefit outcomes including any special requirements needed for the environmental values and water management arrangements necessary to sustain high conservation value rivers, reaches and groundwater area’.
The aim of the FARWH is to develop an approach that can be used by all Australian states and territories to provide assessments of river and wetland health that are comparable nationally. It is intended to incorporate a range of river and wetland attributes that indicate key ecological processes. The attributes measured and method of reporting also will be designed to aid in interpretation of the causes of observed environmental degradation.
1.2 The philosophy FARWH is based on the premise that ecological integrity is represented by all the major components of the environment that comprise an ecosystem.
Damage to biota is usually the final point of environmental degradation and pollution. Thus, the aquatic biota are a fundamental indicator of disturbance to rivers and wetlands and their catchments, including groundwater. Aquatic biota should therefore be included in any assessment of river and wetland health. The biota are also components of, or critical to, the goods and services provided by rivers and wetlands that are valued by society.
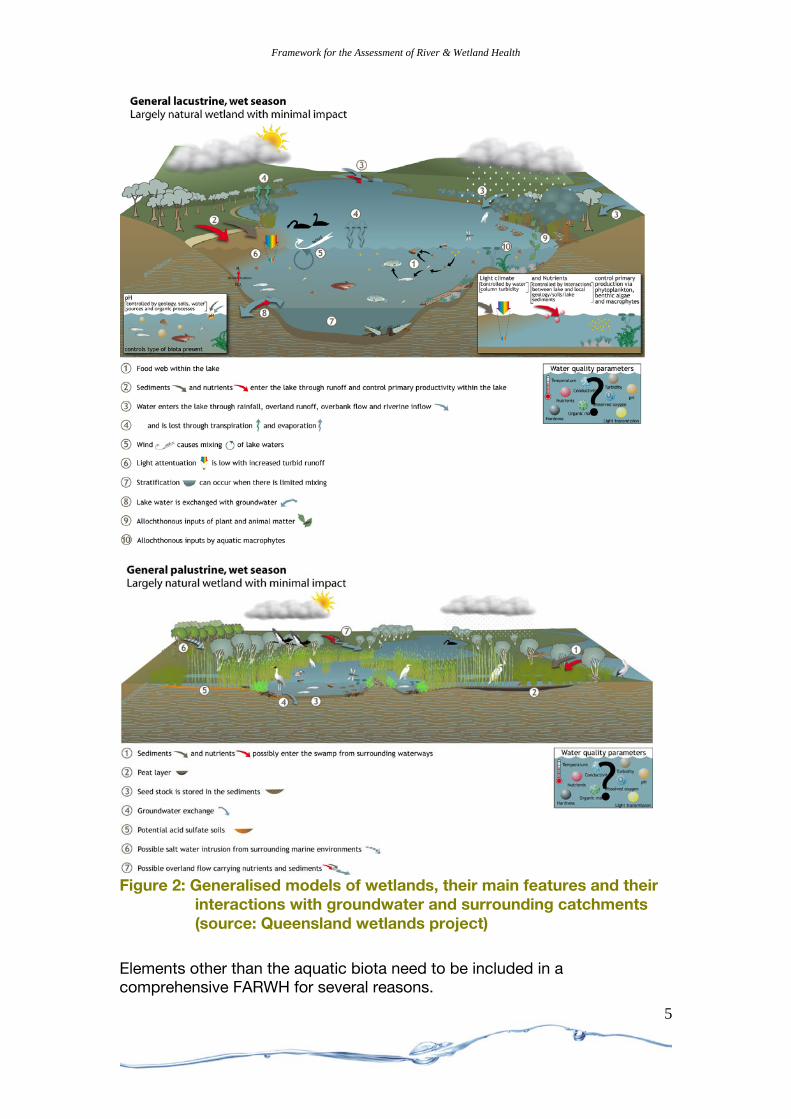
The function of the FARWH is to bring together in an assessment a number of related elements of river and wetland condition. The approach that has been adopted has been informed by our understanding of the links between catchments, river and wetland habitats, and their aquatic biota. The conceptual model and components of the FARWH are summarised in Figures 1 and 2.

Framework for the Assessment of River & Wetland Health
Figure 1: Conceptual model of scales of factors related to river and
wetland condition. This hierarchical model demonstrates catchment features such as longitudinal and lateral connectivity (dams and levees) and land use, which in turn have an effect on habitat features (riparian vegetation, snags, channel geomorphology), and these together affect the biotic components of the system (algae, aquatic vegetation, insects, fish, water birds). The model includes floodplain wetlands but groundwater will be more important for coastal plain and other wetlands and connectivity between rivers and their floodplains less so.
4
Framework for the Assessment of River & Wetland Health
Figure 2: Generalised models of wetlands, their main features and their
interactions with groundwater and surrounding catchments (source: Queensland wetlands project)
Elements other than the aquatic biota need to be included in a comprehensive FARWH for several reasons.
5

Framework for the Assessment of River & Wetland Health
6
• other features of the environment have value in their own right
• the available or selected group of biological indicators may not be sensitive to all forms of river or wetland degradation
• there may be a time lag between environmental disturbance and observable biotic response
• monitoring only the biota may tell us that the biota are damaged, but not why. A comprehensive assessment that includes measurements of the key stressors will provide information about the probable causes of degradation, and therefore guide management decisions and actions
• Unless monitoring is continuous and includes all types of biota, certain types of disturbance may go undetected, or be detected only after severe impairment has occurred, because the chosen group of biological indicators are insensitive, or there is a time lag between environmental disturbance and biotic response.
The framework proposed here is based on a hierarchical model of river and wetland function (Figs 1 and 2) in which broad-scale catchment characteristics affect local hydrology (water regimes), hydraulics, habitat features, and water and soil quality. These influence the river and wetland biota, an ultimate indicator of river and wetland health. This model is a refinement of the model underpinning the assessments made in the Snowy Water Inquiry (Young et al. 1998) and similar models that have been adopted in other major state programmes such as:
• the Victorian Index of Stream Condition <http://www.vicwaterdata.net/vicwaterdata/data_warehouse_content.aspx?option=5>
• the Victorian Index of Wetland Condition <http://www.dse.vic.gov.au/DSE/nrence.nsf/LinkView/3EA5B6AEFB53EE3DCA25708B00145F44522C816829EBF3F7CA25700C00240E63>
• the Tasmanian Conservation of Freshwater Ecosystem Values Project <http://www.dpiw.tas.gov.au/inter.nsf/WebPages/JMUY-5QF35H?open>
• the Queensland Wetlands Program <http://www.epa.qld.gov.au/publications/p01948aa.pdf/Monitoring_wetland_extent_and_condition.pdf>.
At the broad scale, catchment character influences a river or wetland through large-scale controls on hydrology, sediment delivery, and chemistry (Allan and Johnson 1997, Johnson and Gage 1997, Mitsch and Gosselink 2000). Therefore, if catchments are disturbed or in degraded ecological condition, then associated rivers and wetlands will also be unhealthy. Much of the degradation in Australia’s rivers and wetlands results from land-use practices in surrounding catchments (Boulton and Brock 1999). Assessing catchment condition may therefore provide information about the ultimate causes of any observed biological impoverishment, and highlight potential impacts that have not yet caused biological degradation within rivers but that are likely to do so.

Framework for the Assessment of River & Wetland Health
7
At the local scale, available habitat and the local physical, chemical and biological features that provide living space and resources determine the types and numbers of plants and animals that can potentially live at a site. The quantity and quality of available habitat affects the structure and composition of resident biological communities (Hynes 1968, Meffe and Sheldon 1988, Boulton and Brock 1999, Maddock 1999), and are thus critical elements of ecological condition. Habitat assessment provides information about the likely proximal causes of impoverished biological states, and may be used as a surrogate for biological condition (including biodiversity) where these latter data are unavailable. Aspects of habitat assessed in the FARWH include water quantity and quality, soils of wetlands, geomorphology, fringing zone vegetation structure, and the connectedness, longitudinal of rivers and lateral of rivers to their floodplain (including wetlands), and wetlands to their catchments and groundwater.
1.3 Role of the national framework The FARWH is designed to use data from existing programmes such as:
• the Victorian Index of Stream Condition <http://www.vicwaterdata.net/vicwaterdata/data_warehouse_content.aspx?option=5>
• the Victorian Index of Wetland Condition <http://www.dse.vic.gov.au/DSE/nrence.nsf/LinkView/3EA5B6AEFB53EE3DCA25708B00145F44522C816829EBF3F7CA25700C00240E63>
• the Tasmanian Conservation of Freshwater Ecosystem Values Project <http://www.dpiw.tas.gov.au/inter.nsf/WebPages/JMUY-5QF35H?open>
• the Lake Eyre Basin Rivers assessment (Sheldon et al. 2005) and the Queensland Wetlands Program <http://www.epa.qld.gov.au/publications/p01948aa.pdf/Monitoring_wetland_extent_and_condition.pdf>.
The FARWH is also designed to provide the basis for choosing and managing reporting measures from the Natural Resource Management Ministerial Council, National Natural Resource Management Monitoring and Evaluation Framework (NNRMM&EF) <http://www.nrm.gov.au/monitoring/>. The relationship between the two frameworks is shown in Figure 3 While the two are closely related in some ways, the NNRMM&EF is more targeted to assessing particular issues of relevance to the National Action Plan, rather than overall river and wetland health.

Framework for the Assessment of River & Wetland Health
National Water Initiative NHT / NAP
Australia’s Water Resources 2005 National Monitoring & Evaluation Framework
National River & Wetland Health Assessment Framework 4. Inland Aquatic Ecosystem Integrity
River Condition
Wetland Condition
Wetland Extent &
Distribution
Nationally Agreed Recommended
Indicators
10 Matters for Target
Catchment Disturbance
Index
Water Quality & SoilsIndex
Aquatic BiotaIndex
Physical FormIndex
HydrologicalDisturbance
Index
Nationally Agreed Recommended
Indicators
Nationally Agreed Recommended
Indicators Jurisdictional / Basin Programs(eg MDBC SRA, Vic ISC, Tas CVEF)
Fringing Vegetation
Index
Figure 3: Relationship between the Framework for the Assessment of River and Wetland Health and the Natural Resource Management Monitoring and Evaluation Framework (source Edgar et al. 2006)
A primary function of the FAWRH is to provide the approach for locally relevant, comprehensive assessments of river and wetland health that are comparable across jurisdictions. In this context, there is no need for the same measures to be made in each place, but the indices derived from the various measures must be directly comparable. For example, salinity could be an important water quality measure in one place, and nutrients could be important in another. The indices representing the various measures of water quality should be equivalent, so a score of 0.8/1.0 based on salinity is equivalent to the same score based on nutrients.
8

Framework for the Assessment of River & Wetland Health
9
2 Methods
2.1 Environmental components to be represented Catchment and habitat conditions are not the sole determinants of the richness and abundance of aquatic biota. Biological processes such as primary production, trophic relationships, competition, predation, immigration, emigration and recruitment also influence the composition and structure of running water communities. Some states and territories already have well-developed methods for assessing ecological processes that may be incorporated as biological measures.
In many places, these ecological processes can be too complex and poorly understood to be explicitly included in an assessment method, but they should be considered for inclusion anyway. Interactions among chemical and physical process create conditions at a range of scales that strongly influence biological processes (Boulton and Brock 1999). For example, the level of photosynthetic activity is heavily influenced by light, temperature and nutrient regimes—aspects of habitat that could be covered in the assessments of nutrient and suspended sediment loads and riparian condition. Similarly, hydrology, connectedness, and riparian vegetation all affect carbon fluxes, and therefore trophic structure, in rivers. Thus, while ecological processes might not be measured directly, structural variables that affect, or are affected by, those processes would be assessed.
It is proposed that the following environmental components be assessed as part of the FARWH:
Catchment Disturbance Index incorporates the effects of land use, change in vegetation cover and infrastructure (for example, roads and railway lines) on the likely runoff of sediments, nutrients and other contaminants to rivers and wetlands. The index should incorporate the effects of large-scale, non-point source impacts.
Physical Form Index uses measures of sediment inputs, riparian vegetation structure and connectedness (dams, weirs, levee banks, groundwater abstraction) to assess the state of local habitat and its likely ability to support aquatic life.
Hydrological Disturbance Index recognises the importance to aquatic ecosystem function of the water regime, both surface flow and groundwater, depending on the ecosystem.
Water Quality and Soils Index considers the effects on biota of long-term changes in water quality characteristics (rivers and wetlands) and soil quality (wetlands), such as changes in suspended sediment and total nutrient concentrations or loads, and the effects of short-term changes in salinity and toxicant levels.
Fringing Zone Index represents structural and condition features of the streamside zone, or the zone surrounding a wetland. While this index could contain features relevant to the Physical Form and Aquatic Biota indices, the

Framework for the Assessment of River & Wetland Health
10
zone is seen as such an important focus of management that it requires its own category.
Aquatic Biota Index represents the response of biota to changes in the environment. This index can be based on extensive national sampling of invertebrates sensitive to disturbance. Other components of the biota (for example, fish, water plants, algae, and riparian vegetation condition) would give a fuller picture of the response of ecosystems to change.
2.2 Assessment and reporting framework and scale Australia’s land area is just under 7.7 million square kilometres with a population of around 21 million people (about 2.5 people per square kilometre). The island continent has large regional variations in climate and, after Antarctica, is the driest continent on earth. Compared with most other continents, Australia has few lakes, and the country is heavily reliant on water from rivers for economic, agricultural, industrial and domestic activity. Indeed, 95 per cent of the population lives within 10 kilometres of a river channel (Thoms et al. 2000), which is high compared to other countries.
River and wetland health assessments should be conducted at the scale of river reaches, or individual wetlands. Reaches should be specified within the region assessed (usually surface water management area). A method for reach specification that was used in the National Land and Water Resources Audit I (NLWRA I) is described below (section 2.4). The scale of the NLWRA I reaches can be changed depending on the resolution of the digital elevation models used and it is recognised that some states (such as Victoria) already have their own methods based on on-ground or other assessment methods.
Wetlands will be specified according to a minimum area when wet. Two outstanding issues are the number of wetlands required to adequately represent a surface water management area and whether their assessment scores should be weighted by their relative size to provide . Numbers of wetlands to be sampled has been discussed in the Lake Eyre Basin Rivers Assessment <http://www.deh.gov.au/water/basins/lake-eyre/publications/assessment.html>. Both issues are being addressed in the National Indicators for Wetland Ecosystem Extent, Distribution and Condition project <http://www.nrm.gov.au/monitoring/indicators/index.html>.
Assessments at the reach scale may be reported at that scale to meet local needs but also can be aggregated to broader spatial scales to provide assessments for surface water management areas, an entire state or territory, and at the national level. It is intended that assessment for the NWI will be undertaken at the scale of a surface water management area. State-based assessment programmes that conform to FARWH (such as the Victorian Index of Stream Condition, the Tasmanian Conservation of Freshwater Ecosystem Values Framework, and eventually the Murray-Darling Basin Sustainable Rivers Audit) could also be reported at scales that meet jurisdictional needs.

Framework for the Assessment of River & Wetland Health
11
2.3 Surface water management areas The river basins used for the framework will be the surface water management areas provided by each of the states and territories to the National Water Commission. In some cases, these are groups of small river basins. In New South Wales they have been divided into regulated and unregulated sections.
2.4 Reaches and wetlands River basins are large areas with a considerable diversity of river and wetland condition, necessitating a finer basic unit for calculation of the framework indices. Wetlands will usually be discreet units of measurement and the number of individual wetlands assessed may constitute the sample size representing the surface water management area (see Sheldon et al. 2005). Wetlands may need to be weighted by their area when aggregated to provide an assessment of a surface water management area.
River links, the stretches of river between tributary junctions, are an easily defined, fine-scale unit within a river network. There may be many thousands of river links (depending on the mapping resolution used) in any assessment area, making reporting and modelling cumbersome. For example, the Tasmanian Conservation of Freshwater Ecosystem Values Framework has about 400,000 river links at a 25-metre resolution. Many of these links do not differ very much in their physical character. A large river is unlikely to change its physical character in response to being joined by a small tributary stream. Consequently, river links may be aggregated into reaches of similar character to reduce unnecessary duplication of calculations and results.
Geomorphologists have many ways of defining river reaches that often depend on intensive surveys (Rosgen 1996, Brierley et al. 1999). Intensive on-ground surveys are unlikely to be possible for reporting on all surface water management areas in a state or territory (or perhaps even one). Consequently, an automated system based on geomorphological principles was developed in NLWRA I and is available for use in this assessment, although other approaches can be used if they are available. The headwaters of catchments contain many small stream sections that could numerically overwhelm all other sections of a surface water management area, and for which little information is available for broad-scale surveys. To avoid this problem, and to ensure that the reporting scale represents most of the surface water management area in the reporting area, a reach was defined in the NLWRA I as having a minimum contributing catchment area of 50 square kilometres (this could be changed depending on state and territory needs).
The physical character of a river is likely to change from one link to another as a result of major changes in catchment area that determine the flow and other fluxes such as sediments and nutrients. Changes in slope between links influence the velocity of flow and hence the shear stress and the stream power or sediment transport capacity, leading to changes in channel and bed morphology. Flow and material loads are also influenced by catchment areas, and hence the product of catchment area and slope (a simple surrogate

Framework for the Assessment of River & Wetland Health
12
measure for stream power) is often used by geomorphologists as a primary indicator of geomorphic form (Montgomery and Buffington 1997; Dietrich et al. 1993). Entry to, or exit from, reservoirs and lakes must also be considered, and it was ensured that river links and reaches were broken at these points. The above principles were used to aggregate river links into reaches.
A branching network of river links joined by nodes was defined in the NLWRA I from the AUSLIG 9-second digital elevation model (DEM) of Australia. This data set is available for the framework, however, finer scale DEMs are available in some places and there may be benefits in using them. An alternative method of defining river networks from mapped streams was dismissed in the NLWRA I because, in places, the position of the mapped streams does not coincide exactly with valleys in the DEM. The DEM is required to generate topographic attributes of catchment area and the slope of each river link, and errors in positioning produce many spurious results. However, some states with extensive on-ground measurement programmes, such as Victoria, may have reaches defined by direct observation.
The NLWRA I used the ARCInfo flow accumulation algorithm to define the catchment area of all cells in the DEM. The river network was defined as beginning at a catchment area of 50 square kilometres. Short links, where the catchment area had reached less than 75 square kilometres by the downstream node, were removed. This data set is available for use but could also be modified using the same algorithm with finer resolution DEMs.
In the NLWRA I, links were further separated by nodes at the entry to and exit from reservoirs and lakes. The presence of lakes and reservoirs was derived from an AUSLIG waterbody database mapped from 1:2.5 million topographic maps. This database was found to unreliably distinguish natural lakes from waterbodies created or regulated by dams. A separate AUSLIG point coverage of flow control structures was obtained to define regulated waterbodies from natural lakes. Lakes were defined as those waterbodies that did not intersect an associated structure in the dam database. Reservoirs were defined as water bodies that intersected structures of 10 metres height or greater. All river links downstream of reservoirs were defined as having regulated flow.
Reaches used for the NLWRA I were formed by concatenating one or more network links and joined according to the following rules:
• all first order links (those with no tributary) were assigned as separate reaches
• for links downstream, the product of link slope and drainage area (a stream power surrogate) was compared to that of the two tributary links
• if one tributary link provided 90 per cent or more of the area of the link, then the tributary reach was continued downstream unless the area slope product differed by a factor of two or more. In that case a new reach was started
• if no tributary link dominated the area of the downstream link, then the tributary reach of closest area and slope product was continued

Framework for the Assessment of River & Wetland Health
downstream. If the product of area and slope for the link differed by more than twofold from both tributaries a new reach was started
• new reaches were initiated at the entrance and exit from lakes and reservoirs.
Each reach has an internal contributing area (called a subcatchment area in this project). The subcatchment area is the catchment area added to the reach between its upper and lower limits (Fig. 4). The subcatchment area of first order streams is the entire catchment area of the river link. Subcatchment areas for each reach were determined from the flow accumulation grid. The slope of the link was defined as the elevation difference between the upper and lower ends of the link divided by the length of the link.
The total catchment area of a river reach is the spatial extent of land that drains to the most downstream point of a reach. That means that the catchment of a reach has nested within it the catchments of all upstream reaches. The catchment area was determined by merging the subcatchment of the reach with all upstream sub-catchments (Fig. 4).
A unique seven or eight digit identifier was given to each reach, composed of the three or four-digit Australian Water Resources Council basin identifier followed by an arbitrarily assigned four-digit code.
13

Framework for the Assessment of River & Wetland Health
14
Figure 4: Relationships between reaches, subcatchments and catchments
As a check, DEM-derived river networks were compared with named streamlines recorded on the AUSLIG 1:250,000 topographic map series. A close match was found in all upland areas (areas with ridge and valley topography). If links did not coincide with a named stream they were excluded from the database. This process was necessary in the drier and flatter regions to remove DEM-generated flow accumulations that are not expressed on the ground as streams for reasons such as transmission losses, dispersion of flow, terminal lakes, or lack of flow through dune systems and depressions. The Murray-Darling Basin stream network was also manually checked and edited against the 72 1:250,000 topographic map sheets that cover the basin. The lowland rivers of the Murray-Darling Basin were not well represented by the link network because of problems of anabranching streams, distributary channels, and flow through very flat areas that were not well represented by the DEM. Accurate representation of this type of system requires further development, and reaches identified in lowland parts of the Murray-Darling Basin used in the NLWRA I should be treated with caution.
The derivation of the river reach network in the NLWRA I was time consuming, and it has not been verified. To improve reporting, knowledge of the types of rivers in the area assessed would be useful and could be considered by each state and territory. There have been attempts to classify the rivers of specific regions within Australia but there has no attempt to do this at broader scales.
2.5 The reference condition approach When conducting a financial audit it is not sufficient to know merely how much is in the till. Crucial to any audit is knowing how much is in the till in relation to how much should be there. Using a health analogy, a measurement of blood pressure by itself is insufficient to interpret the health of the patient. Information is also needed on what a healthy blood pressure would be and the patient’s measurement is compared with that reference. This referential approach has been adopted for the framework. That is, an assessment of river health relative to what the river or wetland would have been like if it had not been changed by human activities.
Assessments for each element of the framework are based on departures from reference conditions. Where ecological integrity is the criterion for health, reference conditions are usually defined as the presumed natural state of a site, determined by physically and chemically similar undisturbed sites. Typically it is impossible to find completely undisturbed sites with which to compare test sites, in which case minimally disturbed or best available sites are often used to define reference conditions (Wright et al. 1983, Simpson et al. 1996, Reynoldson et al. 1997). Reference conditions

Framework for the Assessment of River & Wetland Health
15
can also be set by professional judgement (Ladson et al. 1999), modelling of past conditions, historical records, or palaeoecological evidence (Thoms et al. 1999). Reference conditions for the FARWH have been set by a combination of minimally disturbed sites, historical data, modelling of past conditions, and professional judgement; the guiding principle is that reference conditions should be as close to natural (pre-European settlement or pre-1750) as possible.
The indices calculated in the framework all assess the condition of a river reach using a referential approach. The Aquatic Biota Index could use a modified reference approach, but the reference for some biotic indices may be straightforward. The approach is dictated by the way sites are compared statistically and the absence of unchanged reference sites in some parts of the country. For example, the reference for exotic plants and fish would be zero. Most of the other indices could use a simpler comparative approach and take as their reference point a completely unchanged condition. Both of these approaches are valid and can be used jointly to assess the overall condition of a river. Nevertheless, differences in the way reference condition is determined in relation to the different indices should be kept in mind when interpreting the condition of a reach or surface water management area.
2.6 Indices and index features Initially, reaches and individual wetlands should be assessed, and the results should then be aggregated to generate assessments of surface water management areas. Directly measured data will not be available for every river reach, with the result that a variety of approaches could be adopted, including direct site measurements, remotely sensed data and modelled data that can be combined to provide assessments for all of the reaches in an area of interest.
Ideally, several biological measures would be included in the assessment as components of the Aquatic Biota Index (for example, fish, water plants and algae). The most extensive dataset that will be available is that for aquatic invertebrates from the National River Health Program. Methods for fish have been developed by the Murray-Darling Basin Sustainable Rivers Audit and are being applied across the basin.
The extensive datasets compiled for the Wild Rivers Project—including land uses, infrastructure, levee banks, and dams—are also useful, and they are available from the NLWRA I. Data on sediment transport, nutrients and hydrology could be provided in some cases by process models that were used extensively in the NLWRA I. Water quality data are spatially sparse (see testing in Victoria and Tasmania below) when considered at the scale of reaches and surface water management areas and, apart from nutrients, are difficult to model for the extensive areas without them.

Framework for the Assessment of River & Wetland Health
16
2.7 Integration of the framework components
2.7.1 Reach, wetland and basin scale aggregation and integration In the FARWH the term ‘aggregation’ is used to denote assembling measures of the same index in different places into a measure at a larger spatial scale, for example, aggregating measures of the Aquatic Biota Index for a group of reaches, or a group of wetlands to provide a measure of the Aquatic Biota Index for a basin (for either the rivers, or the wetlands). The term ‘integration’ denotes assembling measures of different indices at a given scale to generate a combined assessment at the same scale, for example, reach-scale indices of flow regulation, nutrient and suspended sediment loads integrated for a reach. These issues have been considered in more detail for reaches representing a river within a surface water management area than they have for individual wetlands that represent a surface water management area.
At the reach or wetland level, an assessment will usually be provided for each index and individually these provide most information. These indices can be integrated to produce an assessment for each reach, or each wetland. Similarly, an assessment will usually be required for each individual index at the scale of an entire surface water management area. In turn, these may be integrated to produce an overall assessment at the surface water management area. A summary of the decisions taken to integrate indices and sub-indices, and to aggregate from reach to basin scale can be found in Table 1. Normally, the surface water management area assessments for wetlands and rivers would be separate because they represent the condition of different waterbody types, namely rivers or wetlands.
In calculating the assessment for a surface water management area, a decision is needed whether to aggregate the individual reach or individual wetland scores or to integrate the individual indices across the surface water management area. It is considered appropriate to produce the basin-scale assessment by integration rather than aggregation because of the nature of the two processes involved. Aggregation is more appropriate when crossing spatial scales, and integration is more appropriate for combining different indices. When aggregating indices up to the basin scale, different weighting approaches are likely to be chosen for different indices.

Framework for the Assessment of River & Wetland Health
17
Table 1: Summary of integration and aggregation procedures for different sub-indices and indices.
Index – reach scale
Integration approach and weighting
Aggregation approach and weighting
Index
Hydrological Disturbance Index
As per Index of Stream Condition framework Arithmetic average with double weighting to change in seasonal periodicity
Reach index aggregated to basin index by calculating length weighted average of all reach scores
Surface water management area (SWMA) Hydrological Disturbance Index
Water Quality Index (e.g. nutrient and suspended sediment loads)
Worst measure in reach taken as nutrient and suspended sediment load assessment Components unweighted
Reach index aggregated to basin index by calculating length weighted average of all reach scores
SWMA Nutrient and Suspended Sediment Load Index
Physical Form Index
Standardised Euclidean distance Components unweighted
Reach index aggregated to basin index by calculating length weighted average of all reach scores
SWMA physical index
Catchment Disturbance Index
Impacts summed Components unweighted
Indices for each reach aggregated to give a basin score
⇒ ⇒ ⇒ ⇒
Reach index aggregated to basin index by calculating area weighted average of all reach scores
SWMA Catchment Disturbance Index
Aquatic Biota Index
Reach index aggregated to basin index by calculating area weighted average of all reach scores
SWMA Fringe Index
⇓ ⇓
Fringing Zone Index
Unweighted reach average
Reach index aggregated to basin index by calculating area weighted average of all reach scores
SWMA Fringe Index
⇓
Overall Index Above six indices integrated to give FARWH for reach Standardised Euclidean distance Components unweighted or inverse weighted rankings
Above six indices integrated to make FARWH for SWMA Standardised Euclidean distance Components unweighted or inverse weighted rankings

Framework for the Assessment of River & Wetland Health
18
For example, reach length or wetland area weighting might be used for a Water Quality and Soils Index, and contributing catchment area weighting would be more appropriate for a Catchment Disturbance Index. If the reach- or wetland-scale assessment scores were to be aggregated to the scale of an entire surface water management area, weighting would be limited to one weighting approach that may not be entirely suitable for all the indices.
Where the weighting is different for some indices, then they SHOULD be weighted to the basin scale FIRST. Even more relevant, there are bound to be many reaches that do not have all indices available, hence reach- or wetland-scale integrations could be biased away from some indices and aggregation will enhance this bias. Regardless of the balance of the individual sub-indices, the basin scale (weighted) averages are unbiased. For example, an effect of aggregating all indices by reach then to surface water management area, or by index and then to surface water management area is shown in Table 2.
Table 2: Example of weighting by either reach or index for all reaches
Reach Length of reach Index1 Index2 Index3 Index4
Reach standardised Euclidean distance
1 162 6 4 6 9 0.58
2 192 1 4 7 8 0.43
3 114 2 3 5 2 0.29
4 14 3 3 1 0.23
5 88 4 9 4 0.51
6 19 3 8 4 0.45
7 22 4 7 6 0.55
8 34 8 5 7 9 0.69
9 116 3 3 8 0.42
10 95 8 0 2 0.25
BASIN weighted average standardised Euclidean distance 1 0.44
Weighted BASIN mean 2 3.89 3.82 5.39 6.10 0.47
1 Used in NLWRA1 2 Recommended by FARWH
Furthermore, aggregation of each index to the basin scale allows flexibility in the effect of scale and basin-wide reporting for the component indices. For example, there could be indices that apply at different scales to FARWH reaches: certainly hydrology acts at different scales from macroinvertebrates. Reporting at the basin level using independent aggregation makes more sense.
There might be a shortcoming to this approach where reporting is desired at individual reaches or wetlands, and they are represented by different subsets
Framework for the Assessment of River & Wetland Health
of the full set of assessment components. For example, water quality could be missing from one and hydrology from another. Where initial reporting is desired at the individual reach or wetland, methods may need to be employed that allow this. The inverse ranking system used by the Index of Stream Condition in Victoria is applied at the reach scale and then integrated measures are aggregated to broader scales.
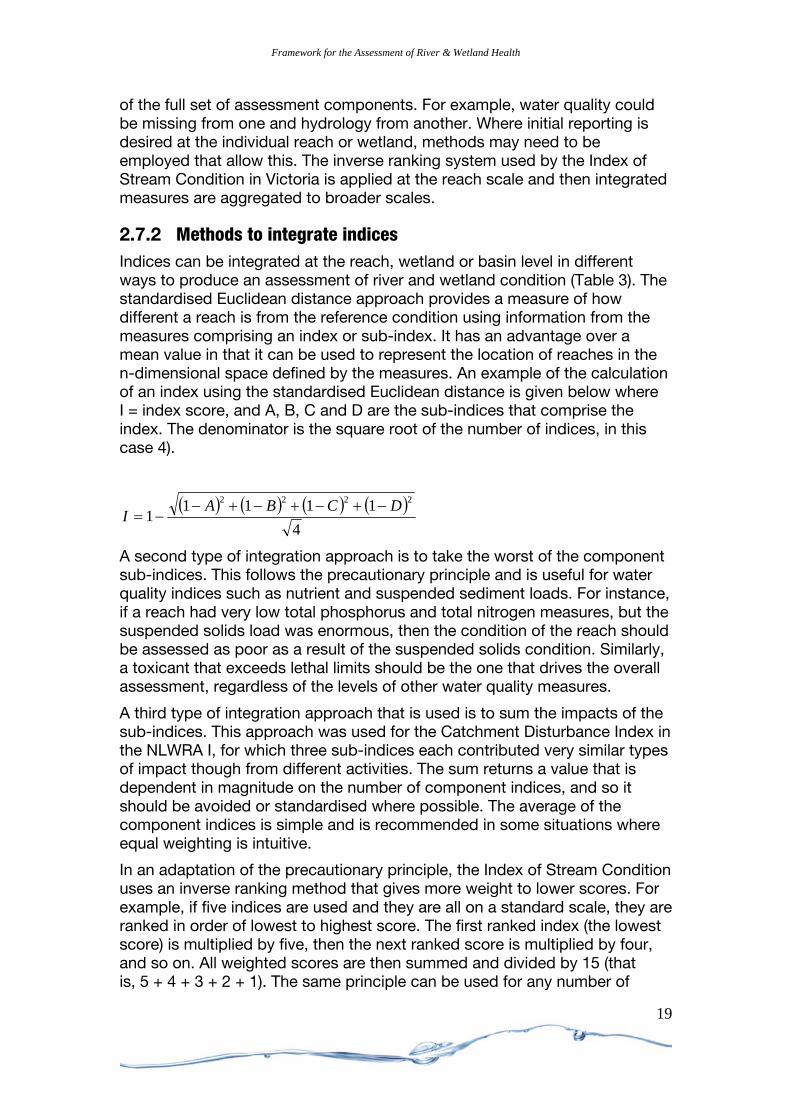
2.7.2 Methods to integrate indices Indices can be integrated at the reach, wetland or basin level in different ways to produce an assessment of river and wetland condition (Table 3). The standardised Euclidean distance approach provides a measure of how different a reach is from the reference condition using information from the measures comprising an index or sub-index. It has an advantage over a mean value in that it can be used to represent the location of reaches in the n-dimensional space defined by the measures. An example of the calculation of an index using the standardised Euclidean distance is given below where I = index score, and A, B, C and D are the sub-indices that comprise the index. The denominator is the square root of the number of indices, in this case 4).
( ) ( ) ( ) ( )4
11111
2222 DCBAI
−+−+−+−−=
A second type of integration approach is to take the worst of the component sub-indices. This follows the precautionary principle and is useful for water quality indices such as nutrient and suspended sediment loads. For instance, if a reach had very low total phosphorus and total nitrogen measures, but the suspended solids load was enormous, then the condition of the reach should be assessed as poor as a result of the suspended solids condition. Similarly, a toxicant that exceeds lethal limits should be the one that drives the overall assessment, regardless of the levels of other water quality measures.
A third type of integration approach that is used is to sum the impacts of the sub-indices. This approach was used for the Catchment Disturbance Index in the NLWRA I, for which three sub-indices each contributed very similar types of impact though from different activities. The sum returns a value that is dependent in magnitude on the number of component indices, and so it should be avoided or standardised where possible. The average of the component indices is simple and is recommended in some situations where equal weighting is intuitive.
In an adaptation of the precautionary principle, the Index of Stream Condition uses an inverse ranking method that gives more weight to lower scores. For example, if five indices are used and they are all on a standard scale, they are ranked in order of lowest to highest score. The first ranked index (the lowest score) is multiplied by five, then the next ranked score is multiplied by four, and so on. All weighted scores are then summed and divided by 15 (that is, 5 + 4 + 3 + 2 + 1). The same principle can be used for any number of
19
Framework for the Assessment of River & Wetland Health
20
indices but the denominator (the sum of the ranks) varies accordingly. This method tends to moderate the effect that one large value may have on a simple arithmetic mean or sum.
The Tasmanian Conservation of Freshwater Ecosystem Values Framework and the Murray-Darling Basin Sustainable Rivers Audit employ expert rules to integrate the subcomponents and components. These are weightings determined by expert knowledge about the environmental importance of components (see http://www.mdbc.gov.au/__data/page/64/summary_macroinvert_theme.pdf). For example, the rules developed for the Sustainable Rivers Audit macroinvertebrate index give highest importance to biodiversity—richness (SR-MIr) followed by presence of pollution sensitive taxa (SIGNAL or SR-MIs)—and least importance to the presence of expected taxa (AUSRIVAS OE or SR-MIoe). The AUSRIVAS OE was allowed to affect only the overall macroinvertebrate index where the score was low. This was because of the lack of confidence in higher scores due to the lack of suitable reference sites.
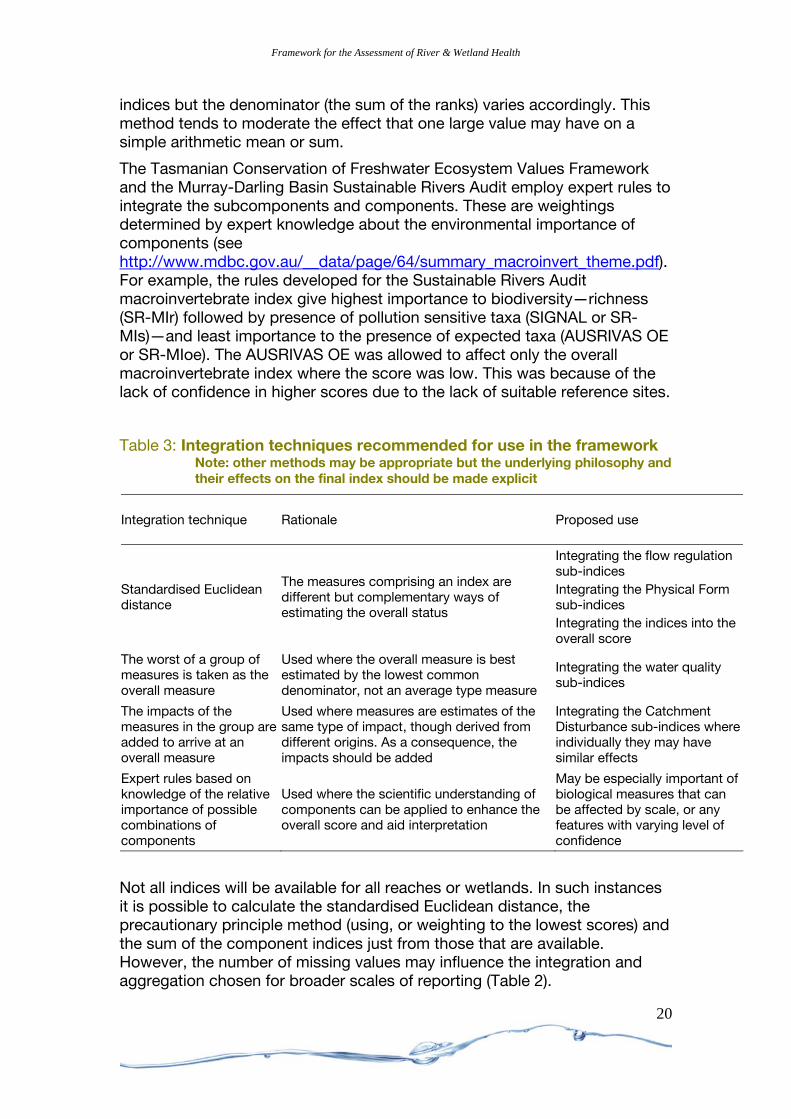
Table 3: Integration techniques recommended for use in the framework Note: other methods may be appropriate but the underlying philosophy and their effects on the final index should be made explicit
Integration technique Rationale Proposed use
Standardised Euclidean distance
The measures comprising an index are different but complementary ways of estimating the overall status
Integrating the flow regulation sub-indices Integrating the Physical Form sub-indices Integrating the indices into the overall score
The worst of a group of measures is taken as the overall measure
Used where the overall measure is best estimated by the lowest common denominator, not an average type measure
Integrating the water quality sub-indices
The impacts of the measures in the group are added to arrive at an overall measure
Used where measures are estimates of the same type of impact, though derived from different origins. As a consequence, the impacts should be added
Integrating the Catchment Disturbance sub-indices where individually they may have similar effects
Expert rules based on knowledge of the relative importance of possible combinations of components
Used where the scientific understanding of components can be applied to enhance the overall score and aid interpretation
May be especially important of biological measures that can be affected by scale, or any features with varying level of confidence
Not all indices will be available for all reaches or wetlands. In such instances it is possible to calculate the standardised Euclidean distance, the precautionary principle method (using, or weighting to the lowest scores) and the sum of the component indices just from those that are available. However, the number of missing values may influence the integration and aggregation chosen for broader scales of reporting (Table 2).

Framework for the Assessment of River & Wetland Health
21
2.8 Analysis of common factors determining river condition An overview of categories of major river management issues, and their scale of impact can be provided by statistical analysis of the suite of indices, rather than individual indices, since actual condition is usually determined by several factors. Groups of reaches or wetlands with common issues can be identified systematically using a multivariate statistical approach. The NLWRA I calculated the Euclidean distance between each pair of reaches, based on the environmental measures for each reach. Reaches were then grouped using Ward’s Clustering method (SAS Institute 2000), which is an efficient method for large data sets. The groups formed in this way may be particularly useful for avoiding the information loss that is inherent in integration, providing additional information on the spatial distribution of combinations of issues.
2.9 Sensitivity analysis
2.9.1 Method The overall assessment will change because of changes in selected indices, their sub-indices, and the methods used for integration and aggregation. Interpretation of the scores to some extent will be dependent on understanding the sensitivity of the overall assessment to changes in the sub-components. Two methods of sensitivity assessment used in the NLWRA I were found to yield similar results and the computationally simpler one was recommended. This recommended method is analogous to the ‘jackknife’, a commonly used statistical technique whereby one sub-index at a time is removed from the dataset, and the mean absolute change in overall assessment is then calculated (Norris et al. 2001).
This analysis should be performed in two ways:
• on reaches or individual wetlands with complete data sets of all selected indices and sub-indices
• on all reaches or wetlands in the reporting region where many will have one or more indices missing.
Sensitivity in this second dataset mirrors the effect on the overall assessment for a jurisdiction, because it depends not only on impact gradients and integration techniques, but also on data availability. Consequently, sub-indices with data in many reaches have more effect on the overall assessment than sub-indices with fewer data points. An example of the components of sensitivity testing from the NLWRA I follows.
2.9.2 Sensitivity and underlying reasons in the NLWRA I The main reasons for the differences in influence between the sub-indices in the NLWRA I were identified as:
• the method of aggregation of the indices representing each environmental component
• the range and distribution of the scores

Framework for the Assessment of River & Wetland Health
• the number of observations (in case of the national data).
In the ideal sensitivity analysis testing in the NLWRA I for reaches having all indices (Figure 5), five factors played an equally important role: land use, the three habitat sub-indices, and total phosphorus. The three habitat components each had a wide range of sub-index values, and ranked roughly equally because they were aggregated to the habitat index by the standardised Euclidean distance method. Although the range of total phosphorus values was not wide, the sub-index ranked highly because of the integration approach used for the nutrient and suspended sediment load index. The nutrient and suspended sediment load sub-index was determined by taking the value of the lowest component; in most reaches this was total phosphorus. The land use sub-index was ranked more highly than the infrastructure sub-index because of the smaller range of values of the latter sub-index.
The Hydrological Disturbance Index consisted of four components, none of which had a major influence on the NLWRA I Assessment of River Condition (environment) (ARCE) score because they were not as variable as other sub-indices, and each sub-index contributed only 25 per cent to the Hydrological Disturbance Index.
Cha
nge
in A
RC
0.00
0.02
0.04
0.06
0.08
0.10
Infras
tructu
reLC
C
Land
use
Mean A
nnua
l Flow
Flow D
uratio
n
Seaso
nal A
mplitud
e
Seaso
nal P
eriod
Conne
ctivit
y
Bedloa
d
Riparia
n Veg
etatio
n
Suspe
nded
Sedim
ents
Total P
hosp
horus
Total N
itroge
n
HydrologyCDI Habitat WaterQuality
Figure 5: Influence of each sub-index on the ARCE using only reaches
for which there was a complete dataset.
The sensitivity analysis using all reaches assessed in the NLWRA I, including those with missing data (Figure 6), showed that the contribution of the sub-indices to the national assessment differed slightly from the ideal situation.
22

Framework for the Assessment of River & Wetland Health
The strong influence of the three habitat components remained, but the influence of the total phosphorus sub-index was slightly greater. This results from the near complete dataset for the nutrient measures based on modelled data compared to some other indices. The effects of land use and infrastructure in the Catchment Disturbance Index are now identical in this example, because the integration rules required both to be present to calculate the Catchment Disturbance Index. With few hydrological data available, the hydrological disturbance sub-indices had relatively little influence on the ARCE at the national level.
Figure 1.6 Influence of each sub-index on the ARCE using data from all reaches
Cha
nge
in A
RC
E
0.00
0.02
0.04
0.06
Infras
tructu
reLC
C
Land
use
Mean A
nnua
l Flow
Flow D
uratio
n
Seaso
nal A
mplitud
e
Seaso
nal P
eriod
Conne
ctivit
y
Bedloa
d
Riparia
n Veg
etatio
n
Suspe
nded
Sedim
ents
Total P
hosp
horus
Total N
itroge
n
HydrologyCDI Habitat WaterQuality
2.10 Range standardisation and bands of condition
2.10.1 Range standardisation It is proposed that assessments of river and wetland health be range standardised to 0–1 with increments of 0.1 for each of the indices representing the major environmental components (biota, catchment disturbance, hydrological disturbance, physical form, fringing zone and water quality). This is necessary so that assessments from different jurisdictions are immediately comparable. Range standardisation also renders the scores dimensionless, thus accounting for different types of measurements that will inevitably be required for various indices selected both within and among jurisdictions.
23

Framework for the Assessment of River & Wetland Health
24
A score of 1 corresponds to the best attainable or pristine condition, and a score of 0 to a totally degraded condition. Each of the indices should be examined to ensure that it is theoretically possible to arrive at index values ranging from 0 to 1. Each of the index values should also be examined to ensure that the reach conditions that produce values of 0, 0.5 and 1 could be appropriately described as totally degraded, halfway between degraded and pristine, and pristine (as the scores imply). This evaluation can be based on professional judgment because the composition of each index of a number of sub-indices means that different combinations of sub-index scores could produce the same index score. It is unlikely to be possible to develop a more objective link between index scores and the described condition.
2.10.2 Bands of condition Prior extensive consultation with states and territories in the National River Health Program (NRHP) and the NLWRA I has confirmed the desire for the assessments to be divided into bands of condition as an aid to mapping and interpretation. It is proposed that the range of scores be divided into five bands to produce five categories. Values of 0–0.2 are accorded a condition of severely modified, 0.2–0.4 substantially modified, 0.4–0.6 moderately modified, 0.6–0.8 slightly modified, and 0.8–1.0 largely unmodified. The categories in the NLWRA I ARCB (Aquatic Biota Index) had different labels and used slightly different cutoff points, depending on the distribution of the values for the AUSRIVAS reference sites on which it was based. The derivation of the ARC
B
BB bands is described in more detail in the proposed possible Aquatc Biota Index section of the potential comparative indices document (NWC 2007).
The purpose of this section is to provide further interpretation of the framework categories: largely unmodified, slightly modified, moderately unmodified, substantially modified and severely unmodified.
Largely unmodified condition: 0.8–1
Rivers and wetlands that are largely unmodified considered to be in pristine, or near pristine condition should have some or all of the following:
• catchment land uses that minimally disturb the river, such as conservation, some types of forestry, low levels of grazing or cropping
• at most, limited changes to the hydrological regime
• at most, limited changes to the physical form (for example, fringing vegetation structure reasonably intact, no dams or levees and very little sediment deposition)
• loads of suspended sediment, total nitrogen and total phosphorus close to natural
• stream plants and animals should be in similar numbers and of similar types to those at unimpacted reference sites.

Framework for the Assessment of River & Wetland Health
A healthy Murray River wetland with a mosaic of wetland plants that provide diverse habitat for a range of species
(Source: Andrew Tatnall for CRC for Freshwater Ecology)
A Healthy Murray River wetland with a mosaic of plants that dries out during summer (fore ground: Moira Grass, Milfoil, Primrose; background: Giant Rush, Phragmites, Red Gum (Source: Andrew Tatnall for CRC for Freshwater Ecology)
Slightly modified condition: 0.6–0.8
Rivers and wetlands that are slightly moderately modified and considered to be in good condition should have some or all of the following:
25

Framework for the Assessment of River & Wetland Health
• a catchment dominated by land uses that have little effect on waterbodies such as state forest or protected recreation areas
• some minor changes to the hydrological regime as a result of diversion or abstraction
• some minor changes to the physical form; for example, fringing vegetation reduced to 60–80 per cent of original coverage, diversions or abstraction upstream but not in the reach, and some little or no sediment deposition
• water quality close to natural but with occasional minor short-term events possible
• plants and animals with noticeable slight loss in variety and numbers or condition. Few, if any, exotic species present.
Mostly native well vegetated riparian zone, some encroachment into the channel (Source: Institute of Applied Ecology, University of Canberra)
Good flow, natural channel, some clearing for a picnic area (Source: Institute of Applied Ecology, University of Canberra)
Wetland with slightly modified riparian vegetation but still with a variety of aquatic plants (Source: Institute of Applied Ecology, University of Canberra)
Protected catchment but with low flows modified by a road crossing (Source: Institute of Applied Ecology, University of Canberra)
Moderately modified condition: 0.4–0.6
26

Framework for the Assessment of River & Wetland Health
Rivers and wetlands that are moderately modified and considered to be in fair condition should have some or all of the following:
• a catchment dominated by land uses that disturb the river to some extent, such as dryland cropping and grazing
• some changes to the hydrological regime as a result of impoundments or abstraction
• some changes to the habitat, for example, fringing vegetation reduced to 40–60 per cent of original coverage, dams upstream but not in the reach, and some sediment deposition
• loads of suspended sediment, total nitrogen and total phosphorus above natural
• plants and animals with substantial loss of condition, variety and numbers. For AUSRIVAS, 20–50 per cent of the expected animals have been lost.
Little catchment disturbance, riparian zone intact but extensive sediment deposition (Source: Institute of Applied Ecology, University of Canberra)
Some loss of riparian vegetation, some catchment disturbance from cropping, and some sediment deposition (Source: Institute of Applied Ecology, University of Canberra)
Extensive change to riparian vegetation, reduced flow as a result
Riparian vegetation intact, minimal disturbance to the surrounding
27
Framework for the Assessment of River & Wetland Health
of abstraction (Source: Institute of Applied Ecology, University of Canberra)
catchment, mine upstream causing impaired water quality (Source: Institute of Applied Ecology, University of Canberra)
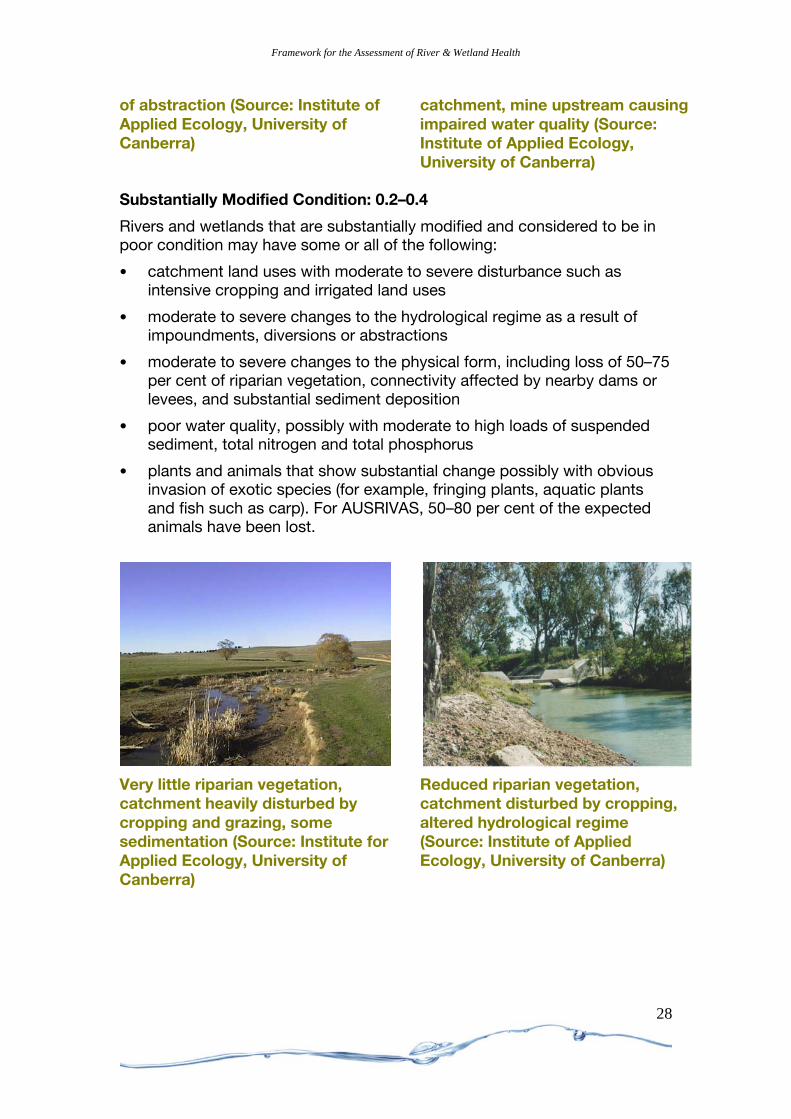
Substantially Modified Condition: 0.2–0.4
Rivers and wetlands that are substantially modified and considered to be in poor condition may have some or all of the following:
• catchment land uses with moderate to severe disturbance such as intensive cropping and irrigated land uses
• moderate to severe changes to the hydrological regime as a result of impoundments, diversions or abstractions
• moderate to severe changes to the physical form, including loss of 50–75 per cent of riparian vegetation, connectivity affected by nearby dams or levees, and substantial sediment deposition
• poor water quality, possibly with moderate to high loads of suspended sediment, total nitrogen and total phosphorus
• plants and animals that show substantial change possibly with obvious invasion of exotic species (for example, fringing plants, aquatic plants and fish such as carp). For AUSRIVAS, 50–80 per cent of the expected animals have been lost.
Very little riparian vegetation, catchment heavily disturbed by cropping and grazing, some sedimentation (Source: Institute for Applied Ecology, University of Canberra)
Reduced riparian vegetation, catchment disturbed by cropping, altered hydrological regime (Source: Institute of Applied Ecology, University of Canberra)
28

Framework for the Assessment of River & Wetland Health
Horse Park Wetland, ACT. A wetland of national significance. A bird breeding site that has been grazed for decades and is subject to urban encroachment (Source: Institute of Applied Ecology, University of Canberra)
Substantial loss of riparian vegetation, catchment disturbed by grazing, high levels of sedimentation (Source: Institute of Applied Ecology, University of Canberra)
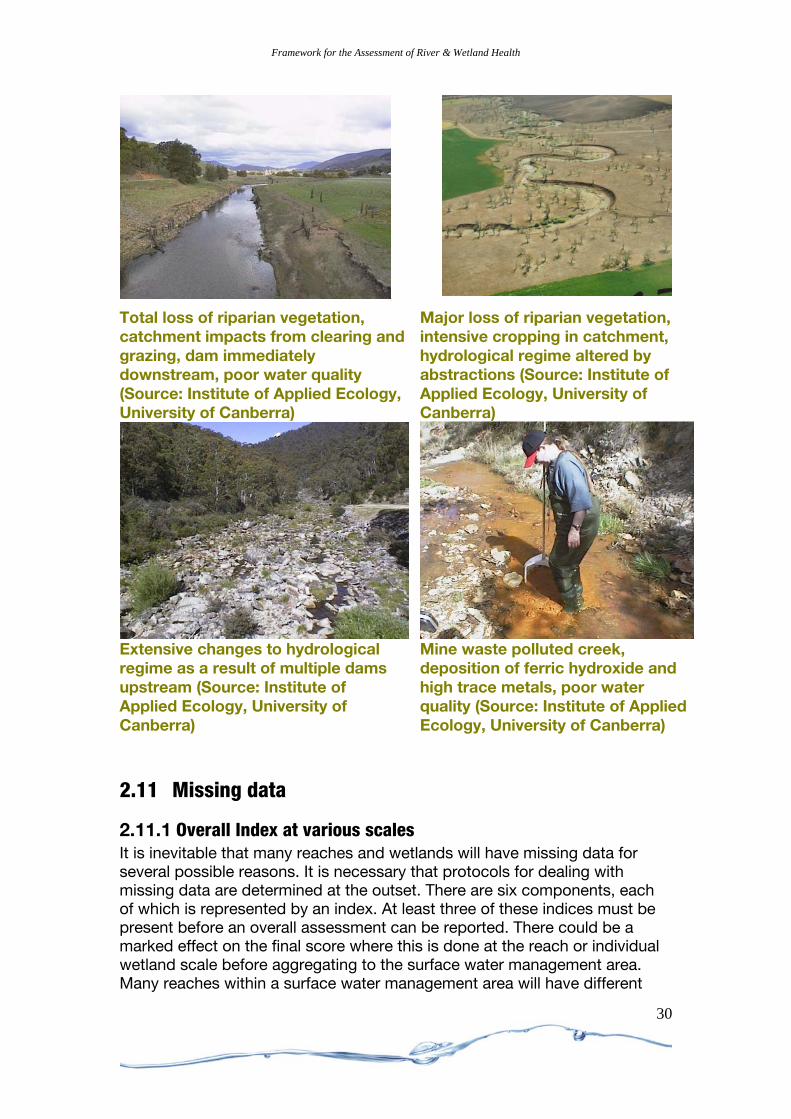
Severely Modified Condition: 0–0.2
Rivers and wetlands that have been severely modified and considered to be in very poor condition may have some or all of the following:
• catchment land uses that cause significant disturbance to rivers and wetlands such as intensive agriculture or urbanisation
• significant changes to the hydrological regime, for example, large reductions in flow, extended wetting or drying of wetlands, and changes in the seasonality of flow and inundation events
• extensive changes to the physical form, including loss of riparian vegetation, loss of connectivity, and extensive sediment deposition
• poor water quality possibly including high loads of suspended sediment, total nitrogen and total phosphorus
• major invasion of weeds and other exotic organisms, little regeneration of riparian species, and likely dominance of a few taxa. For AUSRIVAS, 80–100 percent of the expected animals have been lost (this is possible with some toxic effluents such as mine wastes).
29
Framework for the Assessment of River & Wetland Health
Total loss of riparian vegetation, catchment impacts from clearing and grazing, dam immediately downstream, poor water quality (Source: Institute of Applied Ecology, University of Canberra)
Major loss of riparian vegetation, intensive cropping in catchment, hydrological regime altered by abstractions (Source: Institute of Applied Ecology, University of Canberra)
Extensive changes to hydrological regime as a result of multiple dams upstream (Source: Institute of Applied Ecology, University of Canberra)
Mine waste polluted creek, deposition of ferric hydroxide and high trace metals, poor water quality (Source: Institute of Applied Ecology, University of Canberra)
2.11 Missing data
2.11.1 Overall Index at various scales It is inevitable that many reaches and wetlands will have missing data for several possible reasons. It is necessary that protocols for dealing with missing data are determined at the outset. There are six components, each of which is represented by an index. At least three of these indices must be present before an overall assessment can be reported. There could be a marked effect on the final score where this is done at the reach or individual wetland scale before aggregating to the surface water management area. Many reaches within a surface water management area will have different
30

Framework for the Assessment of River & Wetland Health
31
indices missing but there will still be enough to provide an overall assessment. Therefore, although this may be acceptable, it means that the overall score for a surface water management area could include errors introduced because of variability in the component indices that have been incorporated for individual reaches or wetlands.
The Victorian Index of Stream Condition also suggests handling missing data on a pro rata basis at the reach scale (http://www.vicwaterdata.net/vicwaterdata/isc2004/download/doc/2ISC%20FACTSHEET%20DR03.pdf). Where indices for individual reaches or wetlands are aggregated first, and then integrated at the scale of a surface water management area, each component should be represented by a minimum number of reaches or wetlands. This should be five per cent of the recognised reaches or wetlands (minimum wetted area) in the surface water management area. Thus, the sample size will be proportional to the number in the surface water management area.
The following examples were developed during the NLWRA I for each of the major environmental components represented. The approaches described here could form the basis for rules that can be adopted in FARWH.
2.11.2 Hydrological Disturbance Index The Hydrological Disturbance Index of the NLWRA I consists of four sub-indices, similar to the ‘flow stress ranking’ used in the Victorian Index of Stream Condition and proposed for the Tasmanian Conservation of Freshwater Ecosystem Values Framework and the Murray-Darling Basin Sustainable Rivers Audit. For reaches that had adequate hydrology data, all four measures could be calculated and then used to calculate the Hydrological Disturbance Index. However, the majority of reaches in the area assessed did not have hydrological data, and protocols had to be developed for managing those places. In some cases, such as remote areas with little or no development, the assumption could be made that there was no hydrological change, thus providing a score of 1. A similar approach may be adopted in many areas for wetlands, depending on the nature and scale of development.
2.11.3 Nutrient and suspended sediment load index (Water Quality and Soils Index)
At the reach scale, the nutrient and suspended sediment load index consists of three sub-indices: the suspended solids sub-index, total nitrogen sub-index, and total phosphorus sub-index. These sub-indices were derived from modelled data and so reaches had either a full set of nutrient and suspended sediment load results, or none if the models could not be run. The relative completeness of the data is a major advantage of modelled data over measured data. Salinity data were not used to calculate the water quality reach-scale water quality index.
The reach-scale nutrient and suspended sediment load index was aggregated to give a basin-scale (surface water management area)
Framework for the Assessment of River & Wetland Health
32
assessment if the data in the basin were from reaches whose total catchment area represented at least 50 per cent of the basin. If less than 50 per cent of the basin was represented by data, the basin was not assessed.
2.11.4 Habitat index (Physical Form Index) The habitat index of the NLWRA I (Physical Form Index in this framework) consists of three sub-indices: bedload condition, riparian vegetation, and connectivity. There were a number of reaches for which either the bedload condition or riparian sub-indices were missing. The connectedness sub-index was calculated for all reaches.
These three measures were integrated using the standardised Euclidean distance. In theory, the loss of one or more components does not introduce a bias with this integration approach, although it does result in a loss of information. That is, if all three measures were identical, the loss of one would not affect the resulting Physical Form Index. As a result, a decision was taken to require a minimum of two measures for calculation of the Physical Form Index.
The reach-scale Physical Form Index was aggregated to give a basin-scale assessment if the data in the basin were from reaches for which the total catchment area represented at least 50 per cent of the basin. If the reaches with data represented less than 50 per cent of the basin area, the basin was not assessed.
2.11.5 Catchment Disturbance Index The Catchment Disturbance Index used in the NLWRA I consists of three sub-indices: land use, land cover change, and infrastructure. Most reaches had sufficient data to determine the land use and infrastructure sub-indices. Data required to calculate the land cover change sub-index were missing for a number of reaches.
These sub-indices were integrated to generate the Catchment Disturbance Index by summing their impacts. Loss of any measure will result in a positive bias to the score; however, for most reaches the land cover change sub-index was close to one and varied little. Given this situation, it was decided that the Catchment Disturbance Index required a minimum of the land use and infrastructure sub-indices to be calculated.
The reach-scale Catchment Disturbance Index was aggregated to give a basin-scale (surface water management area) assessment if the data in the basin were from reaches whose total catchment area represented at least 50 per cent of the basin. If the reaches with data represented less than 50 per cent of the basin area, the basin was not assessed.
2.11.6 Aquatic Biota Index The AUSRIVAS data from the National River Health Program represents a large data set of many thousands of sites. Some states have continued to sample intensively using the same methods and increased the database substantially since the NLWRA I. With large datasets such as this, which are

Framework for the Assessment of River & Wetland Health
33
based on individual site measurements, there is an opportunity to model the gaps where strong relationships can be established. This approach was adopted in the NLWRA I, and rules were set for when a model was deemed of sufficient quality to accept the outputs.
Thus, the function of the ANNA models used in the NLWRA I (Linke et al. 2005) was to enable prediction of the biotic condition of a reach that had not been sampled (Norris et al. 2001). The AUSRIVAS modelling approach uses two measures for each site: a list of taxa predicted to occur if the site is in good condition (E value), and the taxa observed to occur at the site (O value). Together these two values give the O/E score.
For reaches that had not been sampled, there was a need to predict the taxa expected at the site if it were in good condition (E value), and to also predict taxa that occurred at the site under current conditions (modelled observed value MO). Together these values provide the MO/E score, a measure of condition and a surrogate for the AUSRIVAS O/E score. The ANNA modelling approach was judged more suitable for the needs of the NLWRA than the AUSRIVAS modelling approach because, while it produces similar outputs, it avoids the classification step and is computationally more efficient.
2.11.7 Integrating the four environmental indices into an NLWRA I ARCE at the reach level
The nutrient and suspended sediment load sub-index and Catchment Disturbance Index could be calculated for most reaches given the rules above. The Physical Form Index was missing for several reaches, and the Hydrological Disturbance Index was not assessed for many reaches.
These four measures were integrated into the ARCE using the standardised Euclidean distance approach. A decision was needed on whether to require the full complement of four indices to calculate the ARCE, or whether this requirement could be relaxed to base the ARCE on a subset of the four indices. As outlined above, this index is relatively unbiased by the loss of measures, but all four indices are important. This has already been argued in relation to the conceptual understanding of the processes determining river condition.
The decision taken was to require a minimum of three indices to calculate the ARCE. While not a satisfactory situation, this approach is preferable to calculating the ARCE for that small subset of the reaches for which a complete dataset was available. A comprehensive monitoring programme by states and territories would enable more rigorous data standards to be set than those described here. This should be possible in Tasmania, Victoria and the Murray-Darling Basin.
2.11.8 Validation of indices With the measures selected by jurisdictions within this framework, it is important to show that they accurately represent the true river or wetland condition. This requires independent, accurate information on the state of river or wetland condition against which the data can be compared.

Framework for the Assessment of River & Wetland Health
34
For components of the sub-indices used in the NLWRA I, and the ARCB
based on AUSRIVAS, there are various additional data that can be used for this purpose. The detailed validation of these components used in the NLWRA is dealt with in the following methods sections for the different indices. A useful approach is to compare the selected indices to datasets that have similar measures at a similar spatial scale. This is one of the objectives of the testing of this framework but that should also remain an important step for individual states and territories.
Several states and territories have conducted river condition assessments; usually they differ from the NLWRA I in the spatial scale at which the assessment is conducted, and in the measures used. The river condition assessment with which the Assessment of River Condition 2000 has the greatest similarity in terms of measures and spatial scale is the Victorian Index of Stream Condition. The Index of Stream Condition has been completed for the entire state, has measures most similar to those in the Assessment of River Condition 2000, and has detailed documentation of the methods used. Index of Stream Condition data were used to validate components of the ARC used in the NLWRA I.
3 References Allan, JD and Johnson, LB 1997, ‘Catchment-scale analysis of aquatic ecosystems’, Freshwater Biology, 37:107–111.
Boulton, AJ 1999, ‘An overview of river health assessment: philosophies, practice, problems and prognosis’, Freshwater Biology, 41:469–479.
Boulton, AJ and Brock, MA 1999, Australian Freshwater Ecology Processes and Management. Gleneagles Publishing, Glen Osmond, SA.
Brierley, G.J., Cohen, T., Fryirs, K. and Brooks, A. 1999. Post-European changes to the fluvial geomorphology of Bega catchment, Australia: implications for river ecology. Freshwater Biology 41, 839-848.
Dietrich, WE, Wilson, CJ, Montgomery, DR and McKeen, J 1993, ‘Analysis of erosion thresholds, channel networks and landscape morphology using a digital terrain model’, Journal of Geology, 101:259–278.
Edgar, B, Conrick, D and Innes, A 2006, ‘Matter for target. Inland aquatic eosystem integrity – wetlands’, Department of the Environment and Heritage, Wetlands and Waterbirds Taskforce and the Queensland Department of Natural Resources and Water.
Hynes, HBN 1968, ‘Further studies on the invertebrate fauna of a Welsh mountain stream’, Archives Hydrobiologia, 65:360–379.
Johnson, LB and Gage, SH 1997, ‘Landscape approaches to the analysis of aquatic ecosystems’, Freshwater Biology, 37:113–132.
Framework for the Assessment of River & Wetland Health
35
Ladson, AR, White, LJ, Doolan, JA, Finlayson, BL, Hart, BT, Lake, PS and Tilleard, JW 1999, ‘Development and testing of an index of stream condition for waterway management in Australia’, Freshwater Biology, 41:453–468.
Linke, S, Norris, RH, Faith, DP and Stockwell, D 2005, ‘ANNA, A new prediction method for bioassessment’, Freshwater Biology, 50:147-158.
Maddock, I 1999, ‘The importance of physical habitat assessment for evaluating river health’, Freshwater Biology, 41:373–392.
Meffe, GK and Sheldon, AL 1988, ‘The influence of habitat structure on fish assemblage composition in southeastern blackwater streams’, American Midland Naturalist, 120:225–240.
Mitsch, W.J. and Gosselink, J.G. 2000, Wetlands, Third Edition. (John Wiley and Sons, USA). ISBN 047129232X
Montogmery, DR and Buffington, JM 1997, ‘Channel-reach morphology in mountain drainage basins’, Geological Society of America Bulletin, 109:596–611.
NLWRA (National Land and Water Resources Audit). 2002. Australian Catchment, River and Estuary Assessment. Volumes 1 and 2. National land and Water Resources Audit. (Land and Water Australia, Canberra.), ISBN 0 642 37125 3
Norris, RH, Prosser, I, Young, B, Liston, P, Bauer, N, Davies, N, Dyer, F, Linke, S and Thoms, M 2001, The assessment of river condition. An audit of the ecological condition of Australian rivers. Report to the National Land and Water Resources Audit, Canberra, 288pp.
NWC 2007, Assessment of River and Wetland Health: Potential comparative indices, National Water Commission, Canberra.
Olsen, AR, Sedransk, J, Edward, D, Gotway, CA, Ligget, W, Rathbun, S, Reckhow, KH, and Young, LJ. 1999, ‘Statistical issues for monitoring ecological and natural resources in the United States’, Environmental Monitoring and Assessment, 54:1–45.
Raven, PJ, Holmes, NTH, Dawson, FH, Fox, PJA, Everard, M, Fozzard, IR and Rouen, KL 1998, River habitat quality: the physical character of rivers and streams in the U.K. and Isle of Man, River Habitat Survey Report No. 2, Environment Agency, Bristol, England, 86 pp.
Reynoldson, TB. 1997, ‘The reference condition: A comparison of multimetric and multivariate approaches to assess water-quality impairment using benthic macroinvertebrates’, Journal of the North American Benthological Society, 16:833–852.
Reynoldson, TB, Norris, RH, Resh, VH, Day, KE, and Rosenberg, DM 1997, ‘The reference condition: A comparison of multimetric and multivariate approaches to assess water-quality impairment using benthic macrionvertebrates’, Journal of the North American Benthological Society, 16:833–852.
Framework for the Assessment of River & Wetland Health
36
Rosgen, D 1996, Applied River Morphology, Wildland Hydrology, Lakewood, Colorado.
SAS Institute 2000, SAS Online Documentation, Version 8, S.A.S. Institute, Cary, North Carolina, USA.
Sheldon, F, McKenzie-Smith, F and Brunner, P. 2005. Methodology for Assessing the Health of Lake Eyre Basin Rivers, Final Report to Land and Water Australia, Canberra.
Simpson, JC, Norris, R, Barmuta, L, and Blackman, P 1996, Australian River Assessment System. National River Health Program, Predictive Model Manual, Cooperative Research Centre for Freshwater Ecology, University of Canberra, Belconnen, Canberra.
Thoms, MC, Ogden, RW and Reid, RA 1999, ‘Establishing the condition of lowland floodplain rivers: a palaeo-ecological approach’, Freshwater Biology, 41:407–424.
Thoms, MC, Foster, JM and Gawne, B 2000, ‘Floodplain sedimentation in a dryland river: the River Murray, Australia’, International Association of Hydrological Sciences 263:227–236.
US EPA (United States Environmental Protection Agency) 2006. Wadeable Streams Assessment. A Collaborative Survey of the Nation’s Streams. (United States Environmental Protection Agency Office of Water, Washington, DC 20460) EPA 841-B-06-002. http://www.epa.gov/OWOW/streamsurvey/WSA_Assessment_Dec2006.pdf
Wiederholm, T and Johnson, K 1997, ‘Monitoring and assessment of lakes and watercourses in Sweeden’, in JJ Ottens, FAM Claessen, PG Stoks, JG Timmerman and RC Ward (eds), Monitoring Tailor Made II: Information Strategies in Water Management, Elsevier, New York, pp. 317–329.
Wright, JF 1995, ‘Development and use of a system for predicting the macroinvertebrate fauna in flowing waters’, Australian Journal of Ecology, 20:181–197.
Wright, JF, Furse, MT and Armitage, PD 1993, ‘RIVPACS – a technique for evaluating the biological quality of rivers in the UK’, European Water Pollution Control, 3:15–25.
Young, W.J., Chessman, B., Erskine, W., Jakeman, A., Raadik, T., Tilleard, J., Varley, I., Wimbush, D. and Verhoeven, J. (1988) Environmental assessment method for the rivers in the area of interest of the Snowy Water Inquiry. In: Anon. (1988) Resource Materials – Appendix to the Final Report of the Snowy Water Inquiry, 44pp. (http://www.snowywaterinquiry.org.au/documents/appendix/appendix.htm).