Embed Size (px)
Citation preview

Queensland the Smart State
Australian Timber Pole Resources for Energy Networks
A Review
October 2006
Prepared by Lesley Francis1 and Jack Norton2
Innovative Forest Products, Horticulture and Forestry Science
Department of Primary Industries & Fisheries, Queensland
1 Email: [email protected] Telephone: 07 3896 9725 2 Email: [email protected] Telephone: 07 3896 9753
October 2006
Australian timber pole resources for energy networks 2
Timber pole review contents 1. List of tables ............................................................................................................................. 4
2. List of figures............................................................................................................................ 4
3. List of abbreviations ................................................................................................................. 6
4. Australian timber pole resources for energy networks - Review summary............................... 8
5. Australian timber pole resources for energy networks - Introduction......................................34
6. Australian timber pole resources.............................................................................................37
6.1. Poles in-service .................................................................................................................37
New South Wales ......................................................................................................39
Queensland ...............................................................................................................39
Victoria......................................................................................................................39
Western Australia.......................................................................................................39
Tasmania ..................................................................................................................40
Australian Capital Territory .........................................................................................40
South Australia and Northern Territory.........................................................................40
6.2. Estimated demand for traditional durability class 1 & 2 hardwood poles .................................40
6.3. Estimated supply of native forest hardwood poles ................................................................42
Nationwide timber consumption ..................................................................................42
Australian timber pole resources .................................................................................43
New South Wales ......................................................................................................44
Queensland ...............................................................................................................44
Tasmania ..................................................................................................................46
Victoria......................................................................................................................46
Western Australia.......................................................................................................46
South Australia, Australian Capital Territory and Northern Territory ...............................46
6.4. Performance of traditional native hardwood poles ................................................................46
7. Alternative timber pole resources............................................................................................48
7.1. Plantation-grown softwoods ................................................................................................51
Potential availability of plantation-grown softwood poles ...............................................51
Performance of plantation-grown softwood poles .........................................................58
7.2. Plantation-grown hardwoods ...............................................................................................63
Potential availability of plantation-grown hardwood poles ..............................................63
Performance of plantation-grown hardwood poles ........................................................71
7.3. Timber composite structures ...............................................................................................76
Mechanically connected poles ....................................................................................77
Glued-laminated (glulam) poles...................................................................................80
8. Timber pole performance.........................................................................................................83
8.1. Overview of current pole standards and specifications ..........................................................83

October 2006
Australian timber pole resources for energy networks 3
8.2. Revision of pole standards and specifications ......................................................................84
Pole strength.............................................................................................................84
8.3. Timber pole durability .........................................................................................................89
Natural durability........................................................................................................89
Timber decay.............................................................................................................92
Termite attack ............................................................................................................95
8.4. Preservative treatment of timber poles.................................................................................96
Seasoning of timber poles ..........................................................................................96
Preservative treatment of poles .................................................................................100
Treatment costs.......................................................................................................103
Termite management ...............................................................................................104
Future of current approved preservative treatments....................................................107
Remedial treatment of poles .....................................................................................107
New treatment technologies......................................................................................109
8.5. Other technologies for enhancing timber pole performance.................................................109
Asset management ..................................................................................................109
Pole inspection and maintenance..............................................................................110
Pole reinforcements .................................................................................................113
Fire retardant treatment ............................................................................................113
9. Research and development recommendations......................................................................114
Workshop Recommendations ...................................................................................114
Review Recommendations .......................................................................................116
10. Conclusions...........................................................................................................................123
11. Acknowledgements................................................................................................................125
12. References.............................................................................................................................127
13. Appendix 1 – Relative general properties of timber species commonly used or potentially
available for pole production ................................................................................132
Cover photographs courtesy of Dr Kevin Harding and Mr Terry Copley, Product Quality Group, Innovative Forest Products, Horticulture and Forestry Science, Department of Primary Industries and Fisheries (DPI & F)
This review would not have been possible without the support of the Timber Poles Availability Working Group of the Power Poles and Cross Arms Committee, Energy Networks Association of Australia, which is gratefully acknowledged.
This manuscript was prepared to the limit of available resources , and a considerable amount of anecdotal information is discussed. Further investigation and research is strongly recommended. This publication has been prepared with care. DPI & F: (a) Takes no responsibility f or any errors, omissions or inaccuracies contained in this publication; (b) Does not warrant that the information contained in this publication is current or that there is not more recent or more relevant
information available; (c) Does not accept any liability for any decisions or actions taken on the basis of this publication; and (d) Does not accept any liability for any loss or damage suffered directly or indirectly from the use of the information contained in this
publication.
© The State of Queens land, Department of Primary Industries and Fisheries 2006. Copyright protects this material. Except as permitted by the Copyright Act 1968 (Cth), reproduction by any means (photocopying, electronic, mechanical, recording or otherwise), making available online, electronic transmission or other publication of this material is prohibited without the prior written permission of The Department of Primary Industries and Fisheries, Queensland. Inquiries should be addressed to [email protected]; (telephone 61 7 3404 6999).

October 2006
Australian timber pole resources for energy networks 4
1. List of Tables
Table 1 Indicative nation-wide average purchase cost for CCA -treated timber distribution poles ..............35
Table 2 Approximate purchase cost of Stobie Poles for typical 11kV urban construction.........................35
Table 3 Estimated quantities of poles in-service throughout Australia in 2004 ........................................37
Table 4 Relative proportions of different pole types in-service 2004 .......................................................38
Table 5 Estimated nationwide annual demand for poles 2004 to 2014 ...................................................41
Table 6 Approximate native hardwood pole supply from public and private forests 2005.........................45
Table 7 NPI Australian plantation softwood availability forecast.............................................................51
Table 8 Exotic softwood available from the Fraser Coast. .....................................................................54
Table 9 Comparison of standard strength and in-grade strength............................................................60
Table 10 NPI Australian plantation hardwood availability forecast..........................................................64
Table 11 In-grade and standard pole strengths ....................................................................................73
Table 12 South African Standard pole Strength Groups as described by Banks (1955) ...........................75
Table 13 In-grade strength of plantation eucalypts grown in South Africa...............................................75
Table 14 Standards and specifications for the production and utilisation of timber utility poles .................84
Table 15 Examples of State standard Drawings and details of revised Codes of Practice .......................86
Table 16 Comparison of standard strength classifications and in-grade tests .........................................87
Table 17 The size effect for pole strength ............................................................................................88
Table 18 Durability classification system..............................................................................................90
Table 19 Initial design service life values for round poles in Climate Zone B...........................................91
Table 20 Hazard class definitions (AS 1604.1 - 2005; TUMA 1987; TMA 1977). ...................................100
Table 21 Percent sapwood for different log size and sapwood thickness combinations .........................101
Table 22 Approved preservative treatments for poles (H5) ..................................................................102
Table 23 Values used for calculations ...............................................................................................104
Table 24 Cost of chemical calculations ..............................................................................................104
Table 25 Treatments included in TAPPER program............................................................................105
Table 26 Recommendations for treated softwood poles ......................................................................110
2. List of Figures
Figure 1 Typical timber distribution poles in-service..............................................................................35
Figure 2 Typical Stobie poles in-service...............................................................................................35
Figure 3 Poles in-service 2004 ............................................................................................................37
Figure 4 Different types of poles in-service 2004 ..................................................................................38
Figure 5 Estimated annual demand for poles 2004 to 2014 ...................................................................41
Figure 6 NPI Australian Plantation softwood availability forecasts..........................................................51
Figure 7 NPI NSW Plantation softwood availability forecasts (mixed species) ........................................52
Figure 8 NPI NSW Plantation softwood availability forecasts (P. radiata) ...............................................53
Figure 9 NPI Qld plantation softwood availability forecasts (mixed species) ...........................................55
Figure 10 NPI Vic. plantation softwood availability forecasts .................................................................56
October 2006
Australian timber pole resources for energy networks 5
Figure 11 NPI SA plantation softwood availability forecasts ..................................................................57
Figure 12 NPI WA plantation softwood availability forecasts..................................................................57
Figure 13 NPI Tas. plantation softwood availability forecasts ................................................................58
Figure 14 Penetration of CCA preservative near ground-line in a P. radiata pole ....................................61
Figure 15 Damage caused by pole-top fire...........................................................................................62
Figure 16 NPI Australian plantation hardwood sawlog availability forecast .............................................64
Figure 17 NPI Qld plantation hardwood availability forecasts (mixed species) ........................................65
Figure 18 NPI NSW plantation hardwood availability forecasts (mixed species)......................................66
Figure 19 Plantation NPI NSW plantation hardwood availability forecasts (most E. globulus) ..................67
Figure 20 NPI Vic. plantation hardwood availability forecasts (most E. grandis & E. regnans)..................68
Figure 21 NPI Vic. plantation hardwood availability forecasts (most E. globulus) ....................................69
Figure 22 NPI SA and ACT plantation hardwood availability forecasts ...................................................69
Figure 23 NPI Tas. plantation hardwood availability forecasts (mixed species).......................................70
Figure 24 NPI WA plantation hardwood availability forecasts, (mixed species) .......................................71
Figure 25 NPI NT plantation hardwood availability forecasts .................................................................71
Figure 26 UniLog™ softwood pole towers ............................................................................................78
Figure 27 Newly installed rebutted poles..............................................................................................79
Figure 28 Rebutted pole in-service for 20 years ...................................................................................79
Figure 29 Typical softwood H-frame in-service in the USA ....................................................................79
Figure 30 Comwood™ poles ...............................................................................................................81
Figure 31 Schematic diagram of hardwood log cross-section ................................................................85
Figure 32 Cross-section of softwood sapwood showing empty cell lumens ............................................89
Figure 33 In-ground decay hazard zones.............................................................................................91
Figure 34 Fungal fruiting body.............................................................................................................92
Figure 35 Fungal mycelium (vegetative hyphae) ..................................................................................92
Figure 36 Stained softwood cross-section x200....................................................................................93
Figure 37 Stained softwood cross-section x400....................................................................................93
Figure 38 Example of brown rot ..........................................................................................................94
Figure 39 Example of white rot in a timber pole....................................................................................94
Figure 40 Soft rot around ground-line in decommissioned treated hardwood pole...................................95
Figure 41 Termite incidence map (Cookson & Trajstman, 2002)............................................................96
Figure 42 Termite hazard map (Leicester, Wang et al. 2003) ................................................................96
Figure 43 Schematic summary of vacuum pressure impregnation .........................................................99
Figure 44 Boron penetration in a DC 1 pole .......................................................................................108

October 2006
Australian timber pole resources for energy networks 6
3. List of Abbreviations
ACA ammoniacal copper arsenate
ACZA ammoniacal copper zinc arsenate
ACQ alkaline copper quaternary
AS Australian Standard, published by Standards Australia and distributed by
SAI Global
AS/NZS Australian/New Zealand Standard, jointly published by Standards
Australia and Standards New Zealand and distributed by SAI Global
APVMA Australian Pest and Veterinary Medicines Authority
AWPA American Wood Preservers' Association
BRS Bureau of Rural Sciences
CCA copper chrome arsenic
CN copper naphthenate
DPI & F Department of Primary Industries and Fisheries, Queensland
DPI-F Department of Primary Industries – Forestry (Queensland’s native forests
are now managed by the Department of Natural Resources, Mines,
Energy and Water (NRMW), and Queensland’s plantation resources are
managed by Forestry Plantations Queensland (FPQ))
EANSW Electricity Authority of New South Wales
EC emulsifiable concentrate
ENA Energy Networks Association of Australia (formerly ESAA)
et al. Latin abbreviation used to mean "and others"
ETSA Electricity Trust of South Australia
FWPRDC Forest and Wood Products Research & Development Corporation
Glulam glued-laminated lumber
H5 Hazard class 5 service conditions where timber is in contact with the
ground or fresh water. Preservative treatment is designed to reduce the
likelihood of attack by insects, including termites, and very severe decay.
IPA Integrated Planning Act 1999 or its successor. Queensland Government
kV kilo-Volts
kN kilo-Newtons
LSD limit-state design
MITC methylisothiocyanate
MPa megapascal; unit of measure for pressure; mega = 106
MOE modulus of elasticity, measure of stiffness
MOR modulus of rupture, measure of strength
NDE non-destructive evaluation
NPI National Plantation Inventory (Bureau of Rural Sciences)
NZ New Zealand
pers comm. Personal communication
R & D Research and development

October 2006
Australian timber pole resources for energy networks 7
PCP pentachlorophenol
PP & CC Power Poles and Cross Arms Committee
PVC polyvinylchloride
REA Rural Electrification Authority (USA)
SC suspension concentrate
SEQFA South-East Queensland Forests Agreement
SFNSW State Forests NSW; now known as Department of Primary Industries –
Forests NSW
SLS serviceability limit-state
TAPPER Termite and Power Pole Research program
TMA Timber Marketing Act 1977 or its successor. New South Wales
Government
TUMA Timber Utilisation and Marketing Act 1987 or its successor. Queensland
Government.
ULS ultimate strength limit-state
VMA Vegetation Management Act 1999 or its successor. Code applying to
native forest practice on freehold land. Queensland Government.
VPI Vacuum Pressure Impregnation
WBSF Wedding Bells State Forest
WSD working stress design

Review summary
Australian timber pole resources for energy networks October 2006 8
4. Australian timber pole resources for energy networks - Review summary
More than 5 million timber utility poles are currently in-service throughout Australia’s energy networks
(Table 1). Most were produced from select native forest-grown hardwood species having the required
structural characteristics and naturally-durable heartwood. Anecdotal evidence suggests that up to 70% of
the timber poles that are currently in-service were installed over the 20 years following the end of World
War Two, and these poles are likely to require replacement or remedial maintenance over the next
decade.
Table 1 Estimated quantities of poles in-service throughout Australia in 2004 (after Kent 2006)
State / Territory Timber Concrete Metal Other State Total
New South Wales (NSW) 2,055,651 93,398 40,229 400 2,189,678
Queensland (Qld.) 1,260,042 35,951 27,764 0 1,323,757
Victoria (Vic.) 823,934 265,282 21,949 5,370 1,116,535
South Australia (SA) 0 78 211 655,763 656,052
Tasmania (Tas.) 194,451 46 7,108 6,868 208,473
Western Australia (WA) 681,536 12,334 20,808 0 714,678
Northern Territory (NT) 0 95 38,125 0 38,220
Australian Capital Territory (ACT) 50,098 7,031 2,758 375 60,262
Total 5,065,712 414,215 158,952 668,776 6,307,655
Based on the assumption that a new preservative-treated timber pole costs five hundred dollars 1, 1.75
billion dollars would need to be invested to obtain the 3.5 million replacement timber poles that may soon
be required. Approximately 175 million dollars per annum would need to be invested if these poles were
acquired over the next decade.
In addition to new poles required for replacements in existing lines, poles are also required for new lines. If
the demand for poles used to construct new lines remains constant at half of the total demand by utilities
in 2005, an additional 27,100 high-durability poles may be required each year, representing an additional
cost of 13.5 million dollars per annum.
Whilst energy network managers in other countries are facing similar challenges to ensure optimum
management of extensive pole replacement requirements, Australian timber pole stakeholder industries
are also facing critical pole supply shortages. There were an insufficient number of native hardwood poles
available in 2005, and shortages are expected to escalate over the next decade as demand increases and
the availability of poles from traditional resources is reduced.
Although underground lines or manufactured poles constructed from alternative materials may be practical
in some locations, the cost to completely replace timber poles is likely to be prohibitive. Even when whole-
of-life costs are considered, timber poles are considerably less expensive than more intensively
manufactured alternative poles constructed of steel, concrete or fibreglass-reinforced plastic composite
1 All dollar figures referred to in this review are Australian dollars unless otherwise indicated

Review summary
Australian timber pole resources for energy networks October 2006 9
materials. Moreover, non-timber poles have different conductive and / or dynamic strength properties and
require different fittings.
The life-cycle costs of steel, concrete or fibreglass-reinforced composite poles are expected to range from
1/3 to three times more than that of timber poles. Using these ratios as a conservative guide, the cost of
investing in alternative manufactured poles to address the potential demand over the next decade would
amount to between $251 and $752 million per annum. In contrast, approximately $188 million per annum
would need to be invested if timber poles were used.
Timber poles produced from sustainably-managed forests are a renewable resource, and in addition to
economic benefits, life cycle analyses show that timber poles have considerable environmental
advantages compared with poles constructed from more intensively manufactured materials. Analyses
accounting for raw material production, treatment, installation, inspection, maintenance and disposal have
highlighted that considerably less energy is required to produce timber poles and significantly less
greenhouse gasses are produced. Carbon sequestered by trees as they grow also serves to mitigate the
build-up of atmospheric carbon dioxide, and this carbon continues to be held within the wood that is
produced, including after it has been converted into a final product.
The major disadvantages of using timber poles are current supply shortages, their less certain
performance / assumed shorter service-life, the necessity for more regular maintenance, and the need for
recycling industries to continue to be established and preservative recovery technologies to be fully
optimised. All of these issues can be addressed by strategic management, research and development
activities.
The purposes of this review were to clarify the supply and demand situation for traditional timber poles,
and to investigate alternatives in terms of their potential availability and suitability. The alternative timber
pole resources examined were:
1. Durability class 3 & 4 native hardwoods
2. Plantation softwoods
3. Plantation hardwoods
4. Timber composites

Review summary
Australian timber pole resources for energy networks October 2006 10
Traditional timber pole resources: demand, supply and performance
The species considered acceptable for use as poles vary according to the local requirements of different
utilities. Given that the sapwood of all timber species has minimal natural durability, it is commonly either
treated with a preservative or removed. Preservative-treated timber is often more durable than the
heartwood of the most naturally durable timber species. All timber poles used in Australian energy
networks are regularly inspected and maintained, though the frequency of inspection cycles and the
remedial practices and preservative treatments that are applied varies between utilities.
The national timber pole standard, AS 2209 – 1994, describes 18 durability class 1 species and 22
durability class 2 species that can be used to construct poles for overhead lines. Only these species can
be used without full-length preservative treatment, and if any untreated sapwood is not removed at
ground-line, the volume of any sapwood present is disregarded when calculating that pole’s strength. AS
2209 – 1994, also lists 23 durability class 3 species and 20 durability class 4 species (including 17
softwoods), all of which require full-length treatment of their sapwood with a preservative suitable for
Hazard Class 5 (H5) applications. As described in AS 1604.1 – 2005, preservative treatment requirements
for forest products vary according to the conditions they are likely to be exposed to in-service. Different
service conditions (biodeterioration hazards) are categorised into ‘hazard classes’ that range from H1
(least biodeterioration potential) to H6 (highest biodeterioration potential). Utility poles that support
overhead lines are classified as being exposed to H5 service conditions as they are critical structures that
are used in contact with the ground and are exposed to the weather.
The majority of timber poles that are used to support energy networks throughout mainland Australia are
selected durability class 1 and 2 species. To date, most network managers generally consider that only
these species have the necessary form and natural durability to provide an adequate level of reliability in-
service. The durability class 2 species Eucalyptus pilularis (blackbutt) and Corymbia sp. (spotted gum) are
the most common timber species currently used.
Based on various anecdotal reports, durability class 1 poles are generally expected to last for about 50 to
60 years in-service. Some durability class 1 poles made from superior-quality mature native timbers that
were available in the past were reported to last for more than 75 years in some locations. While some of
the more durable species were installed without preservative treatment in the past, most poles installed in
recent years have full-length preservative treatment of their sapwood to level suitable for H5 applications.
The treated durability class 2 species that are now most commonly available are expected to last about 40
- 50 years in-service.
Durability class 3 and 4 poles are used throughout Tasmania, and some durability class 3 poles are used
in parts of Victoria. The most common species are Eucalyptus obliqua (messmate), Eucalyptus regnans
(mountain ash) and Eucalyptus delegatensis (alpine ash), and all poles are installed after full-length
treatment of their sapwood to a level suitable for H5 applications. The lower-durability poles used in
Tasmania and in some parts of Victoria are generally expected to last for about 35 - 45 years in those
locations. Durability class 3 species such as Eucalyptus diversicolor (karri) or Corymbia calophylla (marri)

Review summary
Australian timber pole resources for energy networks October 2006 11
have occasionally been used as poles in Western Australia, but they were reported to have a propensity to
develop large splits and are therefore not common.
Softwood poles that have been treated with a preservative so that they are suitable for hazard class 5 (H5)
applications are used in Western Australia and Queensland. Pinus species poles have been used in
Western Australia in recent years due to the lack of suitable hardwood poles being available. Some Pinus
elliottii (slash pine) poles were installed in Queensland during the 1980’s and more are currently being
installed as there is an insufficient supply of the traditional hardwood resource. Appropriately treated
softwood poles are expected to be at least as durable as the high-durability native hardwood species
currently in-service.
The supply of traditional durability class 1 and 2 poles is currently insufficient to meet demands. In 2006, it
was predicted that 74,900 durability class 1 and 2 poles would be required by utilities and contractors,
while only 62,300 durability class 1 and 2 poles are likely to be available from native forests in 2006
(Figure 1). While the demand for poles is forecast to steadily increase over the next decade, the number
of poles that are currently available from native forests is considered the maximum level of supply that is
likely to be possible in the future (Table 2).
Estimated demand for durability class 1 & 2 poles (2004 - 2014)
0
20
40
60
80
100
120
2004
2005
2006
2007
2008
2009
2010
2011
2012
2013
2014
Year
Nu
mb
er o
f p
ole
s (t
ho
usa
nd
)
Utilities only Utilities & contractors
Figure 1 Estimated annual demand for poles 2004 to 2014 (after Kent 2006)
The majority of the more durable pole timber is supplied in equal proportions from private and public
forests in both New South Wales and Queensland. The supply from New South Wales public forests is
predicted to remain constant until 2039, with the relative proportion of native forest and plantation-grown
poles expected to vary in the future. The supply from Queensland public native forests is planned to begin
to be reduced in 2009, once the feasibility of alternative pole resources has been demonstrated.
Maximum supply of
traditional resource
˜ 62,300 poles per annum

Review summary
Australian timber pole resources for energy networks October 2006 12
Table 2 Approximate native hardwood pole supply from public and private forests 2005
State / Territory Supply Durability class Approximate number of polesab
New South Wales 40,400 m 3 1 & 2 40,400
2,610 m 3 c 3 & 4 2,610
Queensland 19,800 m 3 d 1 & 2 19,800
Tasmania 8,700 m 3 3 & 4 8,700
Western Australia ~2,100 m 3 1 & 2 ~2,100
Total durability class 1 & 2 62,300 a Calculations based on the assumption that an ‘average pole’ contains 1.0 m3 of timber and includes poles supplied from
public and private forests (in equal proportions)
b Additional poles may be available from private native forests by raising awareness of sustainable management options to
maximise pole production
c Number of poles currently supplied from public forests only, much larger quantity likely to be available
d Supply forecast provided by DPI-F as 99,000 lm, calculations assume 10 lm ˜ 1 m3 of pole timber
There may be potential to secure and increase the supply of poles from private native forests. Native
forest-grown hardwood poles bring higher returns than sawlogs, and further research is required to obtain
data on the productivity of private native forests in different regions and to identify management strategies
to optimise the production of poles. This knowledge would benefit producers and pole consumers by
facilitating the subsequent development of business cases that would clarify the benefits of sustainably
managing native forests for the production of poles.
Surveys carried out by the Energy Networks Association of Australia revealed that pole shortages were
beginning to be experienced in 2004 for poles with the following length (m) / strength (kN) classifications:
11/12, 12.5/8, 12.5/12 and 12.5/18 or larger. During the January 2006 meeting of the ENA Timber Pole
Availability Working Group, it was noted that emerging supply difficulties are often exacerbated by
purchasing trends. Neither private contractors nor utilities commonly take in to account the lead-times
necessary for suppliers to gather and process the required quantities of poles. A single order for a mining
company for instance, may require five-hundred 12 m / 5 kN poles. Furthermore, many network managers
do not maintain significant buffer stocks of poles to service short -term demands.
General knowledge of Australian forest products industries is vital when trying to determine the volume of
pole timber potentially available to address pole supply shortages, and the following key forests products
trade data for 1999 – 2000 serve as a useful reference:
Supply: Approximately 24 million cubic metres of roundwood were supplied from Australian forests
§ 51% was sourced from softwood plantations
§ 45% was sourced from native hardwood forests
§ Approximately half was exported
§ An additional 6 – 7 million tonnes of firewood were reported to be removed (equivalent to 65 – 75% of
the total quantity of native hardwood chips exported for pulp / paper production)

Review summary
Australian timber pole resources for energy networks October 2006 13
Demand: Approximately 21.2 million cubic metres of roundwood were required to meet the Australian
demand for forest products
§ 9.6 million cubic metres were imported
§ Demand was greatest for
• Sawn timber (about 4.8 million cubic metres required)
o 80% supplied from local native forests and plantations while 20% was imported
• Paper and paper products (about 3.7 million tonnes required)
o Higher relative proportions of paper, paper products and wood-based manufactured
panels were imported
The cost of plantation-grown poles is likely to be similar to, if not less than the cost of traditional native
forest hardwood poles. Additional savings are likely to flow from plantation forests established with a focus
on pole production. Basic estimates suggest that logs could be supplied from plantation forests at about
two-thirds the cost of logs traditionally used for pole production. There are excellent opportunities for pole
consumers to become stakeholders in plantation forests and there are various investment options
available for joint ventures involving pole consumers, forest owners and forest managers. Establishing
plantations focused on the production of poles is strongly recommended. The benefits of such enterprises
for pole consumers include security and control of supply, further reduced cost of poles, environmental
advantages like positive carbon accounting and considerable returns for a range of other forest products.
Apart from production of quality poles, plantations generate income through the sale of other solid wood
products like sawlogs, and additional low-risk income streams for products such as thinnings, sub-
optimum logs, grazing and apiary activities. Forest owners and managers additionally benefit from sharing
initial investments with supportive and committed energy networks pole consumers.
Some research and development (R & D) is required to provide detailed analyses to facilitate the initiation
of plantation partnerships and to further optimise forest resources and plantation management. In
collaboration, a relatively small investment in R & D by individual stakeholders has much potential to yield
very lucrative outcomes.
Throughout this review, the need to characterise alternative resources is discussed. Characterisation
studies are fundamental scientific investigations carried out to accurately and reliably define the key traits
and qualities of particular resources. Some resource characterisation studies may have a general focus,
while others are centred on attributes that are necessary for particular end-use applications.
Fortunately, a number of investigations have already been undertaken to identify the general properties of
many Australian timber resources. Most research has been focussed on wood fibre or sawn timber
production; nevertheless there is much valuable data to draw upon.
Selected mechanical properties have been examined, but measurements have mainly focussed on the
stiffness of sawn timber specimens or small, clear samples. Whilst stiffness and strength parameters are
related, measures of stiffness may be insufficient to predict pole strength, hence in-grade pole tests are
Review summary
Australian timber pole resources for energy networks October 2006 14
recommended. The relative mechanical properties of sawn timber products nevertheless provide a useful
guide to relative pole strength.
Recent research to characterise Australian P. radiata (radiata pine) and P. elliottii (slash pine) resources,
has revealed strong relationships between the geographical location of plantation resources and wood
density. Generally, wood density increases the closer a pine tree is grown to the equator, and wood
density generally decreases with increasing altitude. Overseas studies have shown that density is a critical
factor influencing pole strength for Pinus species. Once the relationship between in-grade pole strength
and wood density is confirmed for Australian resources, density measurements from characterisation
studies can be used to identify stands 2 of Pinus species that may be suitable for pole production. For
example, if poles produced from a particular location satisfy strength requirements, then it is likely that
similarly-sized poles sourced from appropriate plantations located further north would also be sufficiently
strong (if not stronger). Only confirmatory surveys may therefore be necessary for logs sourced from
similar resources established to the north of those that have been suitably characterised. The effect of
physical defects can also be examined during resource characterisation studies to more accurately
determine their effect on key pole characteristics.
Limit-state product information is required for modern best practice design and engineering, and poles
intended to support overhead lines must comply with specific requirements for form, strength and
durability to ensure their reliability in-service. In-grade (whole-pole) destructive pole strength research has
revealed that strength classifications in principal Australian Standards (based on tests of small, clear
timber samples) correlate poorly with the actual strength of roundwood poles. Consequently, the in-grade
strength and other key characteristics of representative samples of logs from alternative pole resources
need to be accurately measured. An important component of resource characterisation studies is refining
methods to reliably identify the trees within a stand that are suitable for pole production. These methods
include the use of non-destructive evaluation tools and documentation of key visual features or
measurements (such as stem diameter and form).
2 A plantation stand is a group of forest trees of sufficiently uniform species composition, age and condition to be
considered a homogeneous unit for management purposes

Review summary
Australian timber pole resources for energy networks October 2006 15
Alternative timber pole resources
1. Durability class 3 and 4 native forest-grown hardwood poles
Durability class 3 native hardwood poles are currently used in Tasmanian and Victorian energy
networks. In these locations they usually last for 35 to 45 years in-service and have traditionally been
inspected and / or maintained every three years. These poles undergo full-length preservative
treatment of their sapwood prior to installation, and additional ground-line preservative treatments are
used.
Lower durability native hardwood poles were considered a potentially favourable alternative by many
members of the ENA Timber Pole Availability Working Group.
1.1 Availability
It was reported that significant volumes of lower-durability hardwood logs are likely to be available
from native forests in New South Wales for pole production in the immediate future. Some poles may
also be available from Victoria and from private forests in Tasmania and New South Wales.
Any new resources for which there are no data available for their strength and durability in-service
(including proportion of treatable wood) would best be characterised to provide the design data
required to reliably use them as poles.
1.2 Strength
Several lower durability species are listed in AS 2209 as suitable to support overhead lines, and as
illustrated in AS 2878, the national standard for the classification of timber into strength groups, many
native hardwoods are known to produce strong timbers.
The strength classifications in AS 2878 are based on tests of small sections of timber. The findings of
in-grade (whole pole) destructive tests undertaken for hardwood and softwood poles have revealed
that in most cases there is poor correlation between the strength of small, clear sections of timber and
the strength of whole poles. Whilst native hardwoods are known for their strength, in-grade research is
recommended for any new pole products to provide the limit-state data that are required for modern
design procedures.
1.3 Durability
According to the national timber natural durability standard, AS 5604, the durability of the heartwood
of class 3 timber species is such that it is expected to last five to fifteen years in contact with the
ground. The natural heartwood durability of class 4 species is such that it is predicted to last up to five
years in contact with the ground. It is important to bear in mind that using current pole management
strategies including ground-line protection, the lower durability poles used in Tasmania and Victoria
are expected to last 35 to 45 years in those environments.

Review summary
Australian timber pole resources for energy networks October 2006 16
Timber poles deteriorate at different rates when used in different locations throughout the country, and
local climate has a major influence on relative biodeterioration hazards. As part of the Design for
Durability research program (undertaken by collaborating research institutions for the Forest and
Wood Products Research and Development Corporation (FWPRDC)), a decay hazard map was
developed for timber that is used in contact with the ground at different locations throughout Australia
(Figure 2). The in-ground decay hazard was found to be least severe throughout Zone A, and most
severe throughout Zone D. A termite hazard map was also developed as part of the Design for
Durability research program (Figure 3), and the predicted hazard for termite attack in houses
throughout the country was found to be least severe throughout Zone A, and most severe throughout
Zone D.
Figure 2 In-ground decay hazard zones (Leicester, Wang et al. 2003)
Based on the decay hazard map, the lower-durability pole species used in Victoria & Tasmania might
be expected to have a similar durability against decay in other regions of Zones A and B if they are
inspected and maintained in the same way as they are in southern states. If lower durability poles
were used in regions north of zone B on the termite hazard map they may be faced with an increased
likelihood of termite attack.
Figure 3 Termite hazard map (Leicester, Wang et al. 2003)
Zone A – least severe termite hazard Zone D – most severe termite hazard
Zone A – least severe decay hazard Zone D – most severe decay hazard

Review summary
Australian timber pole resources for energy networks October 2006 17
Given that lower-durability timbers are more susceptible to biodeterioration, knowledge of the
proportion of a pole’s diameter that needs to be intact for it to remain serviceable is vitally important
when assessing the feasibility of using lower durability hardwood poles. Due to the structure of natural
roundwood poles, the outer 40% of a pole’s diameter can theoretically provide up to 90% of that pole’s
strength. So, if a pole has a diameter of 200 mm, the outer 40 mm of its radius would need to remain
sound for that pole to retain 90% of its original strength (provided that the 40 mm outer annulus
remains perfectly intact in-service). In practice, more complex models are required to predict the
remaining strength of poles as they undergo mechanical deterioration (including splitting) or become
affected by decay or termites in-service.
To address these challenges, Australian researchers are producing world-class models and software
tools, such as those that continue to be refined as part of the Design for Durability research program.
Models for pole decay such as those proposed by Leicester, Wang et al. (2003) incorporate factors for
timber species, maintenance practices, differences in decay susceptibility between treated sapwood,
inner heartwood and outer heartwood, and local climate.
Importantly, recent revisions of timber pole standards and specifications with an increased focus on
reliability-based design will be valuable for managers of energy network assets.
1.4 Preservation, inspection and maintenance techniques
Current specifications require that all sapwood of durability class 3 and 4 timbers used to support
overhead lines must be treated with a timber preservative approved for H5 applications (AS 2209 –
1994, AS1604.1 – 2005, TUMA, 1987; TMA, 1977). Section five of AS 2209 - 1994 prescribes that
preservative penetration shall be to the full depth of any sapwood present, with minimum sapwood
depths of 16 mm for durability class 3 hardwoods, 20 mm for durability class 4 hardwoods and 35 mm
for durability class 4 softwoods. Given that any treated sapwood is likely to be more durable than the
heartwood of lower-durability species, knowledge of sapwood thickness for different resources is
important for engineering calculations.
If preservative-treated timber was to be relied upon to provide the majority of a pole’s strength, at least
the outer 40% of its total diameter would need to be treated to an appropriate retention with an
approved timber preservative (based on the simplistic assumption that the outer 40% of a pole’s
diameter accounts for 90% of its strength). For example, a pole with a total diameter of 300 mm would
require an outer annulus of 60 mm (occupying 120 mm of the total pole diameter) to be treated.
The preservatives and treatment technologies currently used in Australia for full-length pole treatment
cannot penetrate the heartwood of native hardwood species. Research to develop alternative
economical treatments and treatment technologies for improved preservative-penetration would
facilitate the wider use of lower-durability native hardwoods.

Review summary
Australian timber pole resources for energy networks October 2006 18
The ‘drilling and section modulus’ method was developed during the 1980s and is the current best
practice technique for pole inspection. It involves visual inspection of poles for signs of biological or
physical degrade, and then closer examination of the critical zone including drilling to detect interior
deterioration. The proportion and geometry of a pole’s sound wood is then estimated and the pole’s
remaining strength is calculated based on standard strength data. Whilst the section modulus method
is an improvement on previous techniques, it is limited in the degree of subjectivity associated with the
position of drill holes and assumptions of internal decay. It is also difficult to detect early decay, when
a significant loss of strength may have occurred without too much noticeable change in the
appearance of wood-shavings. Furthermore there is poor correlation between standard strength data
and the in-grade pole strength data, and to account for these limitations large safety factors are
necessarily applied.
Non-destructive evaluation (NDE) devices that are able to determine the extent and geometry of
timber that has deteriorated are highly desirable, and important research was recently undertaken to
compare the performance of a range of non-destructive test devices using poles that underwent
subsequent destructive tests to provide in-grade reference data. Several devices were found to offer a
significant improvement to current best practice, and others were considered to offer comparable
reliability. As non-destructive evaluation techniques continue to be refined they are increasingly being
used as a valuable tool for forest operations and timber production throughout the world.
Standard full-length preservative systems cannot penetrate the heartwood of native hardwood
species, so remedial / ground-line preservative systems are used throughout the country. Ground-line
protection is particularly important if low-durability poles are to perform reliably in higher-hazard
conditions. A range of internal and external treatments and alternative treatment technologies are
available and collaboration to continue research would be beneficial to optimise and compare the
performance of current practices and novel preservatives and treatment technologies.
1.5 Harvesting
Lower-durability native hardwood species can generally be harvested similarly to the traditional
resource. Some lower-durability species are reported to develop excessive splits during seasoning
and in-service, and the seasoning behaviour of new resources, especially those not previously used
for pole production, needs to be characterised. During resource characterisation studies, common
physical defects should be identified and their effect on the strength and durability of poles needs to
be evaluated.
There is potential to manage harvest and post-harvest practices to minimise splitting. Techniques
available include:
§ girdling trees prior to felling
§ careful felling
§ cutting grooves around the circumference of the butt or in the pith zone of the end face
§ kerf cutting

Review summary
Australian timber pole resources for energy networks October 2006 19
§ incising
§ banding (PVC and nylon bands now available)
§ restraint (e.g. nail plates, C-hooks, S-hooks or dowel pins)
§ appropriate handling to prevent impact loads
§ steaming or heating aids stress relaxation but can be a long process
§ similarly microwave energy can be used, but as with steaming, any resulting reductions in
strength need to be minimised and quantified
§ alternatively, it has been suggested that longer poles be specified so the butt can be trimmed to
remove excessive splits
Hardwood poles are most commonly air-dried in Australia, and a range of practices can be used to
optimise the process. Accelerated drying methods like Boultonizing3 and vapour drying have been
used for hardwood poles, and innovative technologies involving microwave and radio-frequency
heating are being developed for improved drying of hardwood poles.
1.6 Cost
While supply agreements and prices for poles require negotiation, the cost of lower durability native -
forest-grown hardwood poles is likely to be less than or equal to the cost of higher-durability native
forest-grown hardwood poles. A medium-sized pole currently costs approximately $500, considerably
less than non-timber alternatives. As discussed previously, timber poles also have considerable
environmental advantages.
3 Boultonizing involves the immersion of the pole in heated oil under vacuum. During the process, heat energy moves
water from the wood whilst oil (which may contain preservatives) moves into the wood
Review summary
Australian timber pole resources for energy networks October 2006 20
2. Plantation-grown softwood poles
Almost all distribution poles that are used throughout Europe, the United States, Canada and New
Zealand are plantation-grown softwoods. Plantation-grown softwood poles have been installed in
Western Australia over the past few years to address pole shortages and are beginning to be used in
Queensland. They have also been used in parts of Victoria.
2.1 Availability
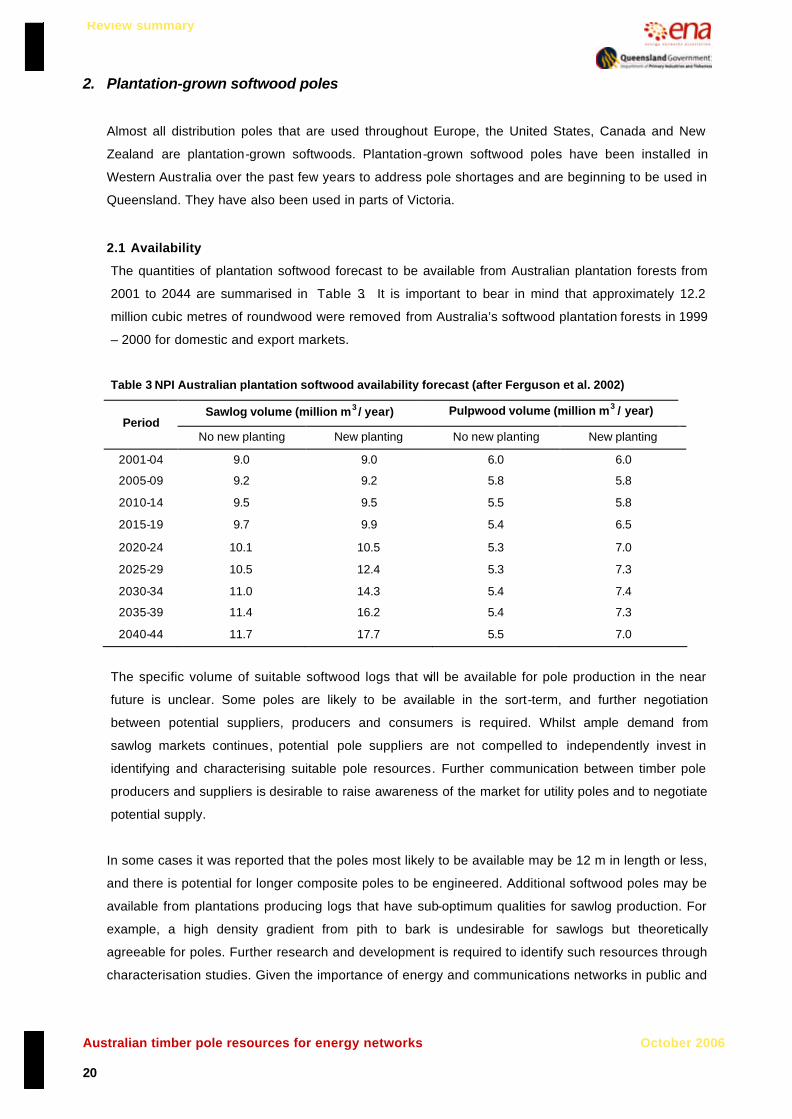
The quantities of plantation softwood forecast to be available from Australian plantation forests from
2001 to 2044 are summarised in Table 3. It is important to bear in mind that approximately 12.2
million cubic metres of roundwood were removed from Australia’s softwood plantation forests in 1999
– 2000 for domestic and export markets.
Table 3 NPI Australian plantation softwood availability forecast (after Ferguson et al. 2002)
Sawlog volume (million m3 / year) Pulpwood volume (million m3 / year) Period
No new planting New planting No new planting New planting
2001-04 9.0 9.0 6.0 6.0
2005-09 9.2 9.2 5.8 5.8
2010-14 9.5 9.5 5.5 5.8
2015-19 9.7 9.9 5.4 6.5
2020-24 10.1 10.5 5.3 7.0
2025-29 10.5 12.4 5.3 7.3
2030-34 11.0 14.3 5.4 7.4
2035-39 11.4 16.2 5.4 7.3
2040-44 11.7 17.7 5.5 7.0
The specific volume of suitable softwood logs that will be available for pole production in the near
future is unclear. Some poles are likely to be available in the sort-term, and further negotiation
between potential suppliers, producers and consumers is required. Whilst ample demand from
sawlog markets continues, potential pole suppliers are not compelled to independently invest in
identifying and characterising suitable pole resources. Further communication between timber pole
producers and suppliers is desirable to raise awareness of the market for utility poles and to negotiate
potential supply.
In some cases it was reported that the poles most likely to be available may be 12 m in length or less,
and there is potential for longer composite poles to be engineered. Additional softwood poles may be
available from plantations producing logs that have sub-optimum qualities for sawlog production. For
example, a high density gradient from pith to bark is undesirable for sawlogs but theoretically
agreeable for poles. Further research and development is required to identify such resources through
characterisation studies. Given the importance of energy and communications networks in public and
Review summary
Australian timber pole resources for energy networks October 2006 21
commercial infrastructure, any new pole resources need to be characterised in terms of their strength
and durability to provide appropriately reliable engineering and design data.
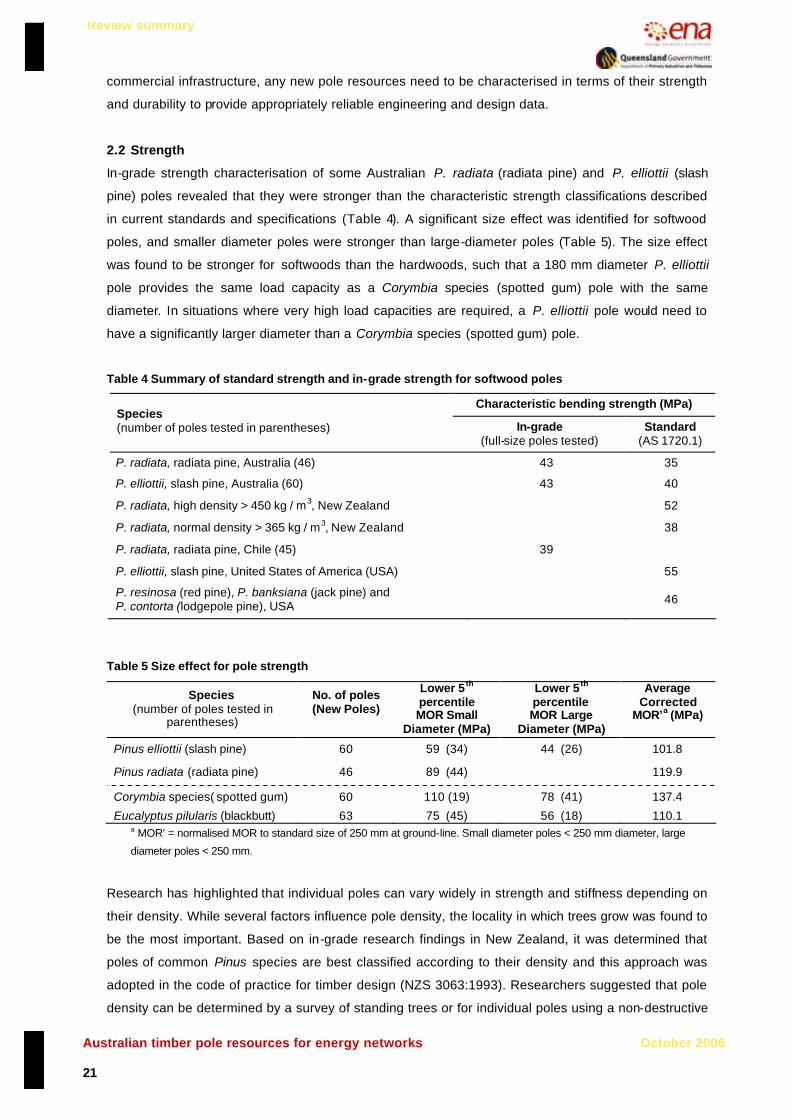
2.2 Strength
In-grade strength characterisation of some Australian P. radiata (radiata pine) and P. elliottii (slash
pine) poles revealed that they were stronger than the characteristic strength classifications described
in current standards and specifications (Table 4). A significant size effect was identified for softwood
poles, and smaller diameter poles were stronger than large-diameter poles (Table 5). The size effect
was found to be stronger for softwoods than the hardwoods, such that a 180 mm diameter P. elliottii
pole provides the same load capacity as a Corymbia species (spotted gum) pole with the same
diameter. In situations where very high load capacities are required, a P. elliottii pole would need to
have a significantly larger diameter than a Corymbia species (spotted gum) pole.
Table 4 Summary of standard strength and in-grade strength for softwood poles
Characteristic bending strength (MPa) Species (number of poles tested in parentheses) In-grade
(full-size poles tested) Standard
(AS 1720.1)
P. radiata, radiata pine, Australia (46) 43 35
P. elliottii, slash pine, Australia (60) 43 40
P. radiata, high density > 450 kg / m3, New Zealand 52
P. radiata, normal density > 365 kg / m3, New Zealand 38
P. radiata, radiata pine, Chile (45) 39
P. elliottii, slash pine, United States of America (USA) 55
P. resinosa (red pine), P. banksiana (jack pine) and P. contorta (lodgepole pine), USA 46
Table 5 Size effect for pole strength
Species (number of poles tested in
parentheses)
No. of poles (New Poles)
Lower 5 th percentile MOR Small
Diameter (MPa)
Lower 5 th percentile MOR Large
Diameter (MPa)
Average Corrected
MOR’a (MPa)
Pinus elliottii (slash pine) 60 59 (34) 44 (26) 101.8
Pinus radiata (radiata pine) 46 89 (44) 119.9
Corymbia species( spotted gum) 60 110 (19) 78 (41) 137.4
Eucalyptus pilularis (blackbutt) 63 75 (45) 56 (18) 110.1
a MOR’ = normalised MOR to standard size of 250 mm at ground-line. Small diameter poles < 250 mm diameter, large
diameter poles < 250 mm.
Research has highlighted that individual poles can vary widely in strength and stiffness depending on
their density. While several factors influence pole density, the locality in which trees grow was found to
be the most important. Based on in-grade research findings in New Zealand, it was determined that
poles of common Pinus species are best classified according to their density and this approach was
adopted in the code of practice for timber design (NZS 3063:1993). Researchers suggested that pole
density can be determined by a survey of standing trees or for individual poles using a non-destructive

Review summary
Australian timber pole resources for energy networks October 2006 22
instrument (preferably before they are steamed or air-dried). NZS 3603 (1993) classifies softwood
poles into two groups based on the density of the outer 20% of their radius, and poles can be
designed to the stresses assigned to either the normal or the high density group. Alternatively a top
load capacity can be specified, but proof testing is required in this case, to ensure poles are adequate.
2.3 Durability
Softwoods currently available from Australian plantations are durability class 4 species and according
to the national durability standard their untreated heartwood is expected to last up to five years in
contact with the ground. Pre-treatment conditioning processes like steaming are sometimes used
overseas to sterilise poles for the prevention of pre-treatment decay developing before they are
adequately seasoned. Softwood poles require treatment with a preservative suitable for H5
applications before they can be installed in contact with the ground, and they have a higher relative
proportion of treatable sapwood than hardwood poles. The outer annulus representing 40% of a pole’s
diameter theoretically provides up to 90% its strength, and the treated sapwood of softwood poles
commonly occupies more than 40% of their outer diameter. Treated P. radiata (radiata pine) and P.
elliottii (slash pine) poles examined in-service in Australia were reported to have reliably high durability
against biological deterioration. Treated softwood sapwood appears to have higher relative resistance
to soft-rot than treated hardwood sapwood, and treated pine poles are expected to last for more than
50 years in-service. Pine poles were found to be more prone to splitting than Corymbia species
(spotted gum) poles used in Queensland. It would be useful to remove a representative sample of split
poles for in-grade destructive testing to confirm that they still conform to strength requirements.
2.4 Preservation, inspection and maintenance techniques
Figure 4 Typical distribution of untreated
heartwood (yellow) and treated sapwood
(grey-green) in a P. elliottii pole
Softwood logs have a large relative amount of treatable
sapwood (Figure 4).
P. radiata (radiata pine) and P. elliottii (slash pine) are
amenable to treatment with copper chromium arsenic
(CCA). CCA is most commonly used to treat timber
intended for H5 applications in Australia and CCA
formulations are water-soluble before preservatives
become fixed in the timber.
The softwood poles used in the USA are most
commonly treated with CCA, creosote, or
pentachlorophenol (PCP), while CCA and creosote are
the most common preservatives used to treat poles
throughout Europe.
The maintenance and inspection information discussed previously also applies to softwood poles.
Holistic pole management practices are important to maximise the utilisation potential of all timber

Review summary
Australian timber pole resources for energy networks October 2006 23
poles. During the March 2006 workshop associated with this review, expert guest speaker Professor
Jeff Morrell recommended the procedures in Table 6 to make best use of preservative-treated
softwood poles.
Table 6 Recommendations to ensure optimum performance of preservative-treated poles (after Morrell 2006)
Procedure Details
Improved pole treatment
• Season all poles properly before treatment
• Pre-bore and cut all poles
• Incise or through bore/radial drill or kerf cut refractory species
• Undertake post treatment analysis and inspection to assure quality
Best management practices
• Limit preservative retention to that prescribed in standards
• Reduce surface deposits on poles
• Limit potential for bleeding of preservatives (important for creosote)
• Allow time for adequate fixation of waterborne preservatives
Cradle to grave management
• Good initial specification
• Quality control inspections
• Careful installation
• Regular inspection program maintained
• Aggressive maintenance
• Pole reinforcement when required
2.5 Harvesting
Harvesting operations need to be tailored for the proportion of a plantation that is available for pole
production, and procedures may need to be documented and optimised for the separation of poles
from sawlog operations. As is required for other solid wood products, logs intended for pole production
need to be handled and processed in a manner to prevent damage and degrade. It is suggested that
pole quality monitoring procedures be optimised and published, particularly those capitalising on non-
destructive evaluation (NDE) technologies, which can be further developed and calibrated for
particular resources during characterisation studies. During resource characterisation studies, any
splitting or physical imperfections like knots or resin defects need to be identified and their effect on
the strength and durability of poles needs to be evaluated.
Whilst best practice documents are being prepared for standard network design requirements, the
preparation of a user-friendly manual of best practice for pole manufacture, inspection and
maintenance would be beneficial to maximise the utilisation potential of timber poles. The best
practice manual would assist pole producers and suppliers to ensure maximum production of
optimum-quality poles, and would assist pole consumers to more confidently identify quality poles and
better understand timber pole assets. Such a document would supplement standards by listing
necessary reference material, summarising the requirements for poles, and providing key examples
and reference pictures that are beyond the scope of standards.

Review summary
Australian timber pole resources for energy networks October 2006 24
Poles are commonly air-dried in Australia, but accelerated drying technologies for softwood poles are
well established overseas and generally, the best quality dried poles are reported to be produced if
poles are processed before significant air-drying had occurred. A summary of the common features of
accelerated drying techniques are presented in Table 7.
Table 7 Common features of accelerated drying techniques
Advantages Disadvantages
• Assurance of continuous output
• Lower drying losses due to better control of drying and shorter
time of exposure to continual changes in atmospheric conditions
that contribute to the initial development of drying degrade
• Minimise incidence of pre-treatment decay
• Capital and / or interest for plant
and buildings
• Higher cost of drying
• Can be largely offset by
advantages
Kiln drying is used in the USA, and both high- and low- temperature kiln dying has been suggested to
have good potential for drying softwoods in Australia. Compartment kilns, pre-dryers, or progressive
(tunnel) dryers can be used. High-temperature kiln drying has been used to satisfactorily dry softwood
poles in 48 to 72 hours (from green condition to treatable moisture content). In the USA and NZ,
progressive dryers are used for low temperature seasoning of softwood poles. In Australia, P. radiata
poles were dried to treatable moisture content in 10 days using this method. Boultonization, steam
conditioning and steam and vacuum drying are used overseas as effective seasoning techniques for
softwood poles. Vapour drying has also been suggested as an option. Innovative technologies
involving the use of microwave and radio-frequency heating are being developed and refined to further
improve the accelerated drying of poles.
Cost-effective low-emission technology has been developed to use mill waste to generate the energy
required for accelerated drying. It was reported that the fuel and heat plant operating costs associated
with kiln drying can be reduced by up to 80% by using regenerative combustion combined with
gasification technology.
2.6 Cost
Softwood plantation industries focussed on the production of solid wood products are reasonably well-
established in Australia and softwood logs are often less expensive to produce than hardwood logs. It
was reported that there is not much difference in cost between softwood logs harvested for pole
production or for sawlog applications. Softwood poles cost more to treat than hardwood poles as they
have a higher relative proportion of sapwood and an increased volume of preservative solution is
required. Treated softwood poles are currently generally supplied at a price similar to or slightly more
than traditional treated hardwood poles. If softwood resources were managed specifically for the
production of poles there is potential for the cost of softwood poles to decrease.
Review summary
Australian timber pole resources for energy networks October 2006 25
3. Plantation-grown hardwood poles
Plantations of sub-tropical hardwoods have been successfully established in South Africa, some Asian
nations, throughout South America and in Australia. While most plantations were established to provide
fuel wood, charcoal or wood fibre, there are major efforts worldwide to establish and manage eucalypt
plantations for the production of high-value solid wood products.
3.1 Availability
In 2003 it was reported that the vast majority of the current Australian hardwood plantation estate
(about 82.6%) will not produce logs of suitable quality for most profitable solid wood products
industries. Eucalyptus globulus (southern blue gum), a premium pulpwood species, is by far the most
common species that has been planted. More recent plantings in Queensland and New South Wales
include species suitable for the manufacture of solid wood products including roundwood.
Pole timber may be available from plantation resources including thinnings and logs with
characteristics unfavourable for sawn timber production. Research is required to determine if these
resources comply with the standard pole criteria for physical form, strength and durability. If these
resources don’t satisfy current standards and specifications but are expected to be suitable, a
performance-based justification based on in-grade research may be required. Extension is required to
raise awareness amongst current and prospective plantation forest owners and managers of the
potential market for utility poles and further investigation is required to clarify the volume of suitable
plantation-grown timber that will be available specifically for pole production.
A significant proportion of the 17.4% of plantations managed specifically for the production of sawlog-
quality timber are owned by or established in cooperation with state agencies. Sixty-two percent of
these plantations were established after 1995 and some species that have traditionally been used for
pole production have been planted, including several naturally durable species. Plantation hardwoods
have an expected rotation length of 20 to 35 years, and by 2035, the sawlog availability from
hardwood plantations is estimated to reach only about 376,000 m3, representing less than 15% of the
2001 native forest supply of sawlogs. The volumes of Australian plantation hardwood forecast to be
available from 2001 to 2044 are presented in Table 8. Approximately 10.8 million cubic metres of
roundwood were harvested from Australia’s native hardwood forests in 1999 – 2000.
There is a considerable degree of uncertainty regarding the proportion of suitable plantation
hardwood logs that will be available for pole production in the short-term. The current production
strategy for Australia’s plantation hardwood industries is focussed on the production of wood fibre or
solid wood products to supply high-quality and appearance-grade sawn timber markets.

Review summary
Australian timber pole resources for energy networks October 2006 26
Table 8 NPI Australian plantation hardwood availability forecast (after Ferguson et al. 2002)
Sawlog volume (million m3 / year) Pulpwood volume (million m3 / year) Period
No new planting New planting No new planting New planting
2001-04 0.2 0.2 2.4 2.4
2005-09 0.3 0.3 8.3 8.8
2010-14 0.4 0.4 10.8 14.0
2015-19 1.4 0.1 10.7 15.9
2020-24 1.4 1.5 10.6 18.2
2025-29 1.3 2.0 10.6 19.1
2030-34 1.3 2.6 10.3 19.7
2035-39 1.4 3.3 10.2 20.2
2040-44 1.5 4.2 10.0 21.0
There is limited information available regarding the performance of Australian plantation-grown
hardwood poles. Some preliminary investigations and expert opinion have been reviewed, but further
resource characterisation studies specifically focussed on pole production are required.
3.2 Strength
Hardwood plantations that have been established and managed to provide industry with a
supplementary source of wood fibre are not expected to respond to late silvicultural treatment (after
about age four) in a way that would improve log quality. Knots and other defects associated with
branches are expected to be the major cause of down grade of this plantation material for both
appearance and structural applications.
Plantation resources that don’t have optimum qualities for sawn timber production may be suitable for
pole production, and research is required to characterise these resources and determine if they
comply with the standard requirements for the physical form, strength and durability of poles intended
to support overhead lines.
Most E. globulus (southern blue gum) plantations have been managed for short-rotation fibre
production (i.e. unthinned and unpruned) and it is therefore unlikely that they will yield a significant
proportion of logs that are suitable for the production of most solid wood products. Plantation
resources managed for fibre production are expected have a high frequency of knots, branch defects
and tension wood. Moreover, there have been anecdotal reports that E. globulus poles are prone to
splitting. In contrast, logs from mixed-managed stands of E. globulus or plantations managed for
sawlog production (i.e. thinned and pruned) are expected to have suitable physical characteristics for
the manufacture of solid wood products.
A larger proportion of stands planted with higher-durability hardwood species have been managed for
sawlog production. The species planted include E. pilularis (blackbutt), E. cloeziana (Gympie
messmate) and C. citriodora and C. maculata (spotted gum). These species are expected to have
very good form and physical characteristics provided stands are managed for sawlog production, and

Review summary
Australian timber pole resources for energy networks October 2006 27
they may be suitable for pole production. If these species were grown in mixed-managed stands (i.e.
thinned or wide spacing and unpruned) they may be suitable for pole production, however further
investigation is required.
The findings of strength characterisation studies of eucalypts grown overseas are useful to gauge the
feasibility of using Australian plantation-grown eucalypts as a sustainable pole resource. In-grade
strength tests of plantation-grown eucalypts were carried out in South Africa, and selected results are
presented in Table 9. It is widely accepted that timber properties can vary significantly between trees
of the same species that are grown in different environments, so it is important that research be
undertaken to characterise the strength of different Australian resources. As previously discussed, in-
grade testing is required to accurately determine pole strength.
Table 9 In-grade strength of plantation-grown Eucalypts used in South Africa
(after Banks 1955)
Mean diametera (mm) Modulus of rupturea (MPa) Species & number of poles tested
(seasoned =S, unseasoned = U Top Butt Max. Min. Mean
E. cladocalyx, sugar gum S: 17 116.8 182.8 163.4 95.4 129.7
U: 20 124.5 193.0 128.5 76.3 110.3
E. diversicolor, karri S: 20 119.4 165.1 175.5 67.5 96.3
U: 20 121.9 170.2 100.0 70.5 83.6
E. saligna, Sydney blue gum S: 26 106.7 147.3 140.9 43.0 74.5
Site A U: 26 117.8 152.4 81.2 53.6 65.9
E. saligna, Sydney blue gum S: 16 106.7 137.2 81.5 39.9 63.5
Site B U: 34 109.2 137.2 74.3 41.4 55.3
E. cloeziana, Gympie messmate S: 11 n/a 14 years old 134.4 78.3 97.5
E. globulus, southern blue gum S: 24 n/a length 6.1 - 7.3 m 124.3 53.6 87.4
E. pilularis, blackbutt S: 11 n/a 27 years old 106.5 44.6 81.2
E. maculata b, spotted gum S: 28 n/a length 6.1 m 154.4 47.9 96.3
E. microcorys, tallowwood S: 28 n/a 26 years old 143.6 79.3 108.4
E. nitens, shining gum S: 26 n/a 26 years old 72.8 16.1 49.6
E. obliqua, messmate S: 15 n/a 12 years old 127.4 79.0 99.3 a The minimum modulus of rupture values are most relevant for comparison with lower 5th percentile bending strength
values used for modern reliability-based design and engineering. Measurements were converted to metric values for this
review. b Now classified as Corymbia maculata
A relatively small number of CCA-treated large-diameter Australian E. microcorys poles have been
tested and lower fifth-percentile design strengths were calculated from in-grade research data (Table
10). A significant size effect was identified for hardwoods.

Review summary
Australian timber pole resources for energy networks October 2006 28
Table 10 In-grade and standard pole strengths - large diameter poles (after Yeates Crews et al. 2004)
Lower fifth percentile bending strength (MPa) for poles with diameter > 250 mm Speciesa
(number of poles tested in parentheses) In-grade Standard
E. microcorys, tallowwood, plantation (15) 55 80
E. pilularis blackbutt, re-growth (18) 56 80
Corymbia species b spotted gum, re-growth (41) 78 80
Eucalyptus species c grey ironbark, re-growth (17) 77b 100
a Poles had CCA -treated sapwood, b C. maculata and C. citriodora, c E. drepanophylla and E. paniculata
3.3 Durability
E. globulus is the most common hardwood species grown in Australian plantations, and it is a
durability class 3 (DC 3) species. The general durability issues previously discussed for lower-
durability native forest hardwoods also apply for lower-durability plantation species.
Species that are currently commonly used as poles are represented in the 17.4% of plantations
currently managed specifically for the production of sawlog-quality timber. These species include E.
regnans (mountain ash, DC 4), E. pilularis (Blackbutt, DC 2), E. cloeziana (Gympie messmate, DC 1)
and Corymbia citriodora / maculata (spotted gum, DC 2). Higher-durability plantation-grown
hardwoods are generally expected to have similar durability characteristics as re-growth material.
Current pole management strategies, especially ground-line protection, are important to maximise the
performance of timber poles.
In addition to strength characterisation, durability verification is an important component of reliably
characterising new pole resources, particularly for species that have not commonly been used as
poles. It is recommended that field research installations or in-service trials be established and
monitored over time to provide the data required to fully optimise reliability-based design for
plantation-grown hardwood poles. Accelerated durability tests would be useful in the short-term to
provide a qualitative verification of the relative natural durability of plantation resources. Calibrated
non-destructive evaluation techniques would be very useful for these investigations.
3.4 Preservation and maintenance techniques
For lower-durability species, the general wood preservation issues and preservative requirements
discussed previously for lower-durability native forest-grown hardwood poles apply. Similarly, the
general treatment issues for high-durability native forest resources apply for high-durability plantation
timber.
Initial research has demonstrated that the sapwood of plantation-grown hardwood species can be
satisfactorily impregnated with preservatives, and preservative treatment is currently less expensive
for hardwood poles, as they have a reduced relative proportion of treatable sapwood compared with
Review summary
Australian timber pole resources for energy networks October 2006 29
softwood pole species. While both treated and untreated timber can readily be recycled for re-use in
other applications, untreated heartwood may be re-used for higher-value applications.
The maintenance and inspection issues previously discussed are applicable to plantation-grown
hardwood poles. There is much potential to exploit new preservatives and treatment technologies as
they continue to be developed. There are additional full-length and remedial pole treatments available,
as well as alternatives for further improved ground-line protection. The serviceability, quality and
reliability of timber poles will only improve as the result of accurate resource characterisation and
reliability-based design.
3.5 Harvesting
The harvesting and post-harvest processing issues discussed previously for lower durability native
forest-grown hardwood poles generally apply for plantation-grown poles. Resource characterisation
studies will reveal if any post-harvest management practices will be required to manage end-splitting
for some species.
3.6 Cost
Continued planting of hardwoods with strength and durability properties desirable for pole production
is recommended. As previously discussed, there are numerous benefits of establishing plantations
focussed on pole production. Plantation-grown hardwood poles may be harvested at a cost as much
as 1/3 less than traditional native forest hardwood poles, and cooperative enterprises involving pole
consumers, forest owners and forest managers offer considerable benefits. Some research and
development is required, but relatively small investments by individual stakeholders have much
potential to facilitate very favourable outcomes.

Review summary
Australian timber pole resources for energy networks October 2006 30
4. Timber Composite poles
Glued or mechanically connected timber composite poles are becoming more popular in Australia. Some
technologies and designs are more developed than others and there is excellent potential for further
development. There are several very favourable composite technologies and pole design options available
for producing poles from shorter-length logs. The use of shorter-rotation plantation logs has several
benefits, and shorter-length native forest-grown poles are reported to be more readily available in some
areas. Shorter poles are also favourable for pole treaters and suppliers as more than one log may fit
within the length of preservative-treatment vessels and shorter poles are more convenient to handle.
Some of the options for timber composites include:
§ Glued-laminated (glulam) poles
• many design options including hollow structures
• sometimes used overseas
• may be constructed of hardwood and / or softwood
§ Mechanically connected poles
• Shorter-length poles joined with a metal connector like a steel sleeve
• Plane frame structures
• Composite poles consisting of a timber upper-portion and a steel and concrete in-ground
portion are used in Australia and becoming more common
§ Wood fibre and resin composite poles
• Only experimental models developed
Further innovative research and development would be useful to take maximum advantage of composite
pole technologies. Some designs only require characterisation to provide sufficient data to assist their
inclusion in design standards and specifications, while others require further optimisation or development.
Whist timber composite poles may cost more than natural roundwood poles, they are still expected to be
significantly less expensive than most non-timber alternatives. Some of the manufacturing costs
associated with producing reliably strong and durable composite poles are often offset by more
economical raw resources.

Review summary
Australian timber pole resources for energy networks October 2006 31
5. Research and development recommendations During the March 2006 workshop associated with this review project, the following issues were considered
most important to address current pole supply shortages:
§ Urgent characterisation of alternative resources to ensure their reliability in-service
§ Improved communication between stakeholder industries
§ Fully optimise asset management and communication of product requirements
Based on the information gathered during this study, the following research and development priorities
were recognised for timber pole resources in Australia. Each recommendation is discussed separately in
Section 9 of this review.
Recommendations for improved communication between stakeholder industries
§ Strategic communication and extension to facilitate more accurate forecasts of potential supply of pole
timber
§ Identify and secure future pole supply from native forests and plantation forests
§ Establish a forum to facilitate communication between stakeholder industries
Recommendations for characterisation and development of alternative resources
§ Characterise strength, durability and form of Australian plantation-grown hardwood poles
§ Characterise strength, durability and form of Australian plantation-grown softwood poles
§ Characterise strength, durability and form of lower-durability native forest-grown hardwood poles
§ Examine design options and characterise strength and durability of composite poles
§ Select and plant plantation timber varieties specifically for pole production
Recommendations to further optimise pole quality and performance
§ Examine alternative preservative treatments
§ Investigate and develop remedial pole treatments
§ Further development and characterisation of non-destructive timber evaluation technologies
§ Identify common decay fungi and characterise the rates and effects of the decay they cause in
common pole species
§ Establish linkages to take advantage of previous research
§ Update design recommendations to ensure optimum pole use and reliability
§ Develop best practice manuals for pole manufacture, maintenance and inspection

Review summary
Australian timber pole resources for energy networks October 2006 32
6. Conclusions Considerable economic benefits would flow from securing the supply of timber poles and undertaking the
research and development necessary to reliably characterise alternative timber pole resources and timber
composite poles. More than $1.89 billion is likely to be invested over the next decade to obtain the
quantity of utility poles that are expected to be required, and the continued use of timber poles presents a
potential saving of $620 million to $5.64 billion.
Timber poles have considerable environmental advantages, and sustainably-managed forests are a
renewable resource. Analyses accounting for raw material production, treatment, installation, inspection,
maintenance and disposal of poles have highlighted that considerably less energy is required to produce
timber poles and significantly less greenhouse gasses are generated during their manufacture. Carbon
sequestered by trees as they grow also serves to mitigate the build-up of atmospheric carbon dioxide, and
this carbon continues to be held within the wood that is produced after it has been converted into a final
product. When poles are removed from service, they often contain a large proportion of sound timber, and
the timber recycling companies becoming established around the country would gladly accept
decommissioned poles to recover any sound wood for re-use. Moreover, there is much potential to further
develop processes to recover preservatives from waste material that cannot be re-used.
Timber poles have favourable dynamic strength properties and they are not conductive, which is an
important factor for medium voltage lines (less than about 110 kV) as conductive poles require different
earthing and insulation systems. Given that about 80% of the poles in Australian energy networks are
timber, an additional cost would be incurred if they were to be replaced with conductive structures as
earthing systems would require modification and additional alternative electricity cable fittings would need
to be acquired and stocked. Timber poles are relatively convenient to handle and their fittings can easily
be modified in-service, which is commonly necessary at some stage during a pole’s lifetime, for example
when communication cables are installed.
Strategic and holistic management is required to address pole supply shortages, despite the intricacy of
government and commercial environments.
To address immediate shortages, the opportunities for pole production need to be conveyed to the widest
possible audience of individual forest owners and managers. Pole product requirements need to be clearly
identified, along with the benefits of pole production, and the potential for performance-based
investigations to be undertaken to identify alternative timber pole resources suitable for pole production.
Adequate time and resources need to be allocated so that appropriate silvicultural modelling techniques
can be utilised to generate reliable data based on updated pole specifications and resource
characterisation studies. This information would facilitate economic studies to obtain more reliable
predictions for the likely cost of alternative timber pole resources over time and would assist negotiations
between pole consumers, producers and suppliers to secure supply.

Review summary
Australian timber pole resources for energy networks October 2006 33
To secure supply and prevent future pole shortages, cooperative efforts to plan long-term pole supply are
required. Establishing sustainable, renewable plantation forests to be managed with an appropriate focus
on pole production is strongly recommended.
With the support of research organisations, stakeholders are encouraged to work together to complete
any research and development that is necessary to characterise and develop alternative resources.
Despite the fact that alternative timber poles to the traditional mature native resource are urgently
required, it is vital that any new alternatives be adequately characterised. Given the importance and scale
of energy distribution networks, it is essential that the performance of alternative poles in-service is
dependable and that all required data are provided for reliability-based network design procedures. It is
strongly recommended that in-grade testing techniques are used as part of resource characterisation
studies whenever possible.

October 2006
Australian timber pole resources for energy networks 34
5. Australian timber pole resources for energy networks - Introduction
Timber utility poles represent a substantial and essential component of Australia’s infrastructure, and
some of the most durable hardwoods from native forests have traditionally been used to support overhead
lines. The supply of sufficient numbers of logs of the required sizes and species has been declining over
recent years, as the result of reductions in the availability of native forest resources, combined with
increasing demands associated with pole replacement programs and network expansion. Supply
shortages are beginning to impact resource managers, pole suppliers and pole consumers, and this
review was commissioned by the Timber Pole Availability Working Group (TPAWG) of the Power Poles
and Cross Arms Committee (PP & CC) of the Energy Networks Association of Australia (ENA) to
investigate the matter. The review is intended to clarify the supply, demand and performance of traditional
native hardwood pole resources and to investigate the potential availability and performance of alternative
timber pole resources. A broad investigation of the key issues facing resource managers, suppliers and
consumers of timber poles used to support energy networks throughout the country is presented. While
every effort was made to interview representatives of all key stakeholder groups, exhaustive investigations
for each group were beyond the scope of this review.
Timber poles represent lower embodied energy than poles constructed from more intensively
manufactured materials, and until recently they have been readily available. Timber poles are
considerably less expensive than non-wood alternative poles, and indicative purchase prices for treated
timber poles of common specifications are presented in Table 1. The values provided in Table 1 are
averages of all data available and are intended to provide a general impression of the costs involved.
Even when whole-of-life costs are considered, timber poles offer the best value for money (Kent 2006). At
this stage, the cost associated with establishing underground lines is greater than for overhead lines
supported by any of the pole alternatives, and converting existing overhead lines to underground systems
is more expensive again (Kent 2006). An example non-timber alternative pole is the iconic South
Australian ‘Stobie Pole’. Stobie Poles are a metal-concrete composite manufactured by the Electricity
Trust of South Australia Utilities (ETSA), and they were developed in response to a limited availability of
suitable hardwood poles in South Australia (West, 2006., pers. comm.). Table 2 provides details of Stobie
Poles that would be typically used in distribution lines.
Pole users report that timber also has several desirable properties for electricity distribution poles that
commonly support lines conducting voltages of 11 and 22 kV. Timber poles remain largely unaffected by
saline soils, acidic soils, marine spray, animal urine and surface damage by gardening equipment.
Furthermore, timber poles are relatively convenient to handle and their fittings can easily be modified in-
service, which is commonly necessary at some stage during a pole’s lifetime, including fitting
communication cables. Timber poles are not conductive, which is an important factor for medium voltage
lines (less than about 110 kV) as conductive poles require different earthing and insulation systems and
pose an electrocution threat to wildlife (Janss and Ferrer 1999). Given that about 80% of the poles in
Australian energy networks are timber, an additional cost would be incurred if they were to be replaced
with conductive structures as earthing systems would require modification.

October 2006
Australian timber pole resources for energy networks 35
Table 1 Indicative nation-wide average purchase cost for CCA-treated timber distribution poles
aSize (m) / Strength (kN) Type of Pole (CCA-treated: H5)
9 / 5 11 / 5 12 / 8 14 / 12
Hardwoods D1 / D2 $210 $431 $470 $804
Hardwoods D3 / D4 $279 $457 $493 $844
Softwood D4 $296 $465 $595 n/a a Timber poles are commonly classified according to their length (metres) and ‘tip load’ strength in kilo-
Newtons (kN). The ultimate ‘tip load’ capacity assigned to a pole represents the maximum force in kN
applied the pole’s top (or ‘tip’), above which the pole may not maintain its’ structural integrity.
Table 2 Approximate purchase cost of Stobie Poles for typical 11 kV urban construction
Pole Strength a (kN) Application Height (m)
Weak Strong
Price b
Line 12 3.5 9 $ 842
Vertical 12 3.8 11 $ 1352
Angle 13 3.5 10.6 $1470
Terminal, Brace, Tee-Off, Transformer 12 5.8 17.3 $2933
a The design and construction of the ETSA Utilities Stobie Poles results in a weak and strong
direction b Prices are exclusive of GST and shipping
ETSA Utilities note that Stobie Poles have a range of bolt-on type cross-arms and
attachments to suit a wide range of applications. They are free-standing and don’t require
angle, terminal and tee off poles to be back-stayed or guyed. Four wire bare LV system or
LV ABC would normally be strung below the 11 kV / 22 kV HV system.
Images and information courtesy Mr Peter West, ETSA Utilites
Figure 1 Typical timber distribution poles in-service
Figure 2 Typical Stobie poles in-service
October 2006
Australian timber pole resources for energy networks 36
Considerable environmental benefits are also associated with using timber poles. Life-cycle analyses
accounting for raw material production, treatment, installation, inspection, maintenance and disposal,
highlight considerable reductions in the energy required to produce timber products compared with those
of concrete or steel. Greenhouse gas production is also significantly reduced if timber poles are used
(Kunniger and Richter 1995; Buchanan and Levine 1999; Sedjo 2002). The carbon sequestered by trees
as they grow also serves to mitigate the build-up of atmospheric carbon dioxide, and this carbon continues
to be held within the wood that is produced, long after it has been converted into a final product (Sedjo,
2002).
The major disadvantages of using timber poles are current supply shortages, their less certain
performance / assumed shorter service-life, the necessity for more regular maintenance, and the need for
recycling technologies to be fully optimised. All of these issues can be addressed by strategic
management, research and development activities.

October 2006
Australian timber pole resources for energy networks 37
6. Australian timber pole resources
6.1. Poles in-service
Based on a survey carried out by the Energy Networks Association of Australia (ENA), there were more
than six million poles supporting energy networks throughout Australia in 2004, and timber poles
accounted for about 80% of them. Most are distribution poles, and selected high-durability native
hardwoods are generally used (Kent 2006). Table 3 and Figure 3 summarise the estimated quantities of
the different types of poles in-service in each Australian State and Territory, while Table 4 and Figure 4
illustrate the relative distribution of different pole types.
Table 3 Estimated quantities of poles in-service throughout Australia in 2004 (after Kent, 2006)
State / Territory Timber Concrete Metal Other State Total
New South Wales (NSW) 2,055,651 93,398 40,229 400 2,189,678
Queensland (Qld.) 1,260,042 35,951 27,764 0 1,323,757
Victoria (Vic.) 823,934 265,282 21,949 5,370 1,116,535
South Australia (SA) 0 78 211 655,763 656,052
Tasmania (Tas.) 194,451 46 7,108 6,868 208,473
Western Australia (WA) 681,536 12,334 20,808 0 714,678
Northern Territory (NT) 0 95 38,125 0 38,220
Australian Capital Territory (ACT) 50,098 7,031 2,758 375 60,262
Total 5,065,712 414,215 158,952 668,776 6,307,655
Estimated number of utility poles in-service throughout Australia (2004)
0.0
0.5
1.0
1.5
2.0
2.5
N.S.W. Qld. Vic. S.A. Tas. W.A. N.T. A.C.T.
State
Nu
mb
er o
f po
les
(mill
ion
)
Timber Concrete Metal Other Figure 3 Poles in-service 2004 (after Kent, 2006)
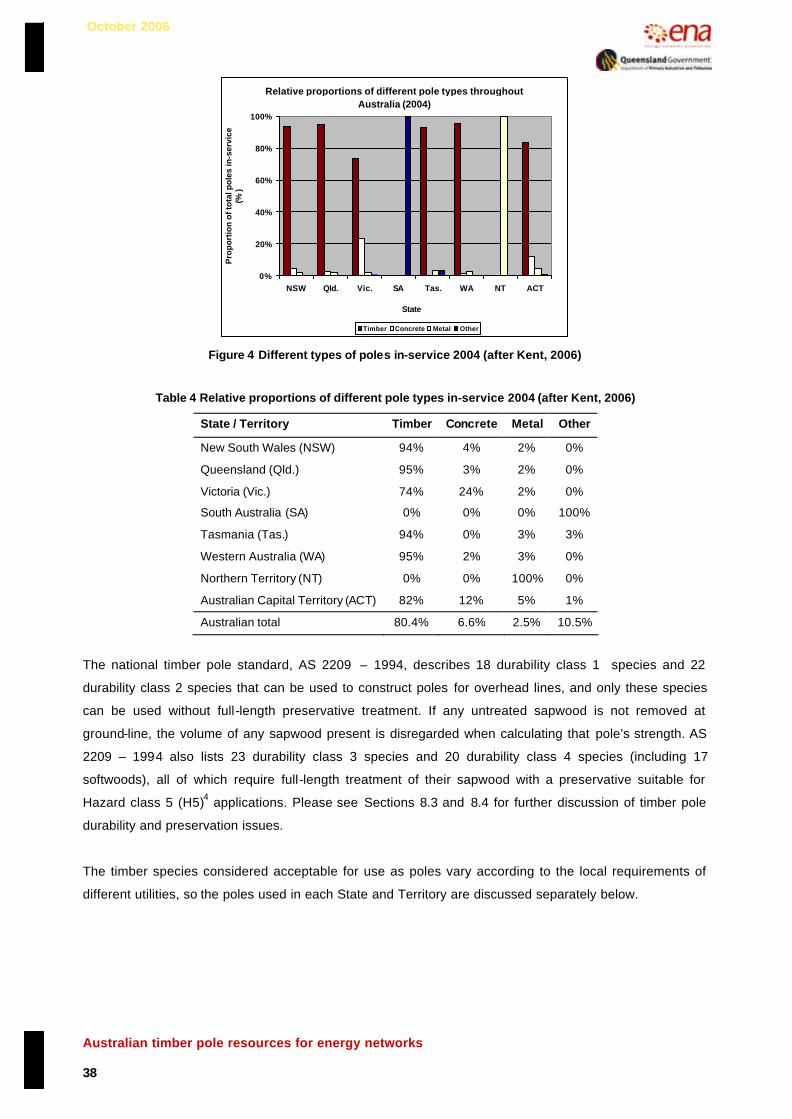
October 2006
Australian timber pole resources for energy networks 38
Relative proportions of different pole types throughout Australia (2004)
0%
20%
40%
60%
80%
100%
NSW Qld. Vic. SA Tas. WA NT ACT
State
Pro
port
ion
of to
tal p
oles
in-s
ervi
ce
(% )
Timber Concrete Metal Other
Figure 4 Different types of poles in-service 2004 (after Kent, 2006)
Table 4 Relative proportions of different pole types in-service 2004 (after Kent, 2006)
State / Territory Timber Concrete Metal Other
New South Wales (NSW) 94% 4% 2% 0%
Queensland (Qld.) 95% 3% 2% 0%
Victoria (Vic.) 74% 24% 2% 0%
South Australia (SA) 0% 0% 0% 100%
Tasmania (Tas.) 94% 0% 3% 3%
Western Australia (WA) 95% 2% 3% 0%
Northern Territory (NT) 0% 0% 100% 0%
Australian Capital Territory (ACT) 82% 12% 5% 1%
Australian total 80.4% 6.6% 2.5% 10.5%
The national timber pole standard, AS 2209 – 1994, describes 18 durability class 1 species and 22
durability class 2 species that can be used to construct poles for overhead lines, and only these species
can be used without full-length preservative treatment. If any untreated sapwood is not removed at
ground-line, the volume of any sapwood present is disregarded when calculating that pole’s strength. AS
2209 – 1994 also lists 23 durability class 3 species and 20 durability class 4 species (including 17
softwoods), all of which require full-length treatment of their sapwood with a preservative suitable for
Hazard class 5 (H5)4 applications. Please see Sections 8.3 and 8.4 for further discussion of timber pole
durability and preservation issues.
The timber species considered acceptable for use as poles vary according to the local requirements of
different utilities, so the poles used in each State and Territory are discussed separately below.

October 2006
Australian timber pole resources for energy networks 39
New South Wales
In New South Wales (NSW), timber poles represent about 94% of poles in-service. Almost all are
durability class 1 or 2 native forest hardwoods that are either preservative-treated to hazard level 5 (H5)4,
or older premium-quality durability class 1 poles that have been de-sapped (at least to ground-line). Most
newly-installed timber poles in NSW are preservative-treated durability class 2 hardwood species such as
Eucalyptus pilularis (blackbutt) or Corymbia species (spotted gum) (Thompson, 2006. pers. comm.).
Queensland
Similarly, in Queensland timber poles account for around 95% of poles in-service, and the majority are
durability class 1 or 2 hardwoods, either preservative -treated suitable for H5 applications or older
premium-quality durability class 1 poles that have been de-sapped (at least to ground-line). Most newly-
installed timber poles in Queensland are preservative-treated durability class 2 hardwood species,
predominantly Corymbia species (spotted gum). More than one hundred and thirty Pinus elliottii (slash
pine) poles treated with CCA for H5 applications have also been installed in Queensland (Warren, 2006.
pers. comm.).
Victoria
In the order of 74% of poles in Victorian networks are timber. These are durability classes 1, 2 and 3
species, with most of the lower durability class 3 poles used in western Victoria. All of the durability
classes 2 and 3 poles in-service are preservative-treated so that they are suitable for H5 applications, as
are many of the durability class 1 poles. Some older, premium-quality untreated durability class 1 poles
that were de-sapped (at least around their ground-line) also have been used in Victorian networks, along
with a relatively small number of Pinus radiata (radiata pine) poles treated with CCA to a level suitable for
H5 applications (Clancy, 2006., pers. comm.; Coulsen, 2006., pers. comm.).
Western Australia
Timber poles represent about 95% of those installed in West Australian distribution networks, and most
are durability class 1 and 2 hardwoods. Eucalyptus marginata (jarrah), a durability class 2 species, is the
most common and many jarrah poles are treated. As is the case in other states, a range of durability class
1 and 2 species have also been used, some of these are treated while others are older premium-quality
untreated poles (de-sapped at least to ground-line). Some durability class 3 poles have been used, such
as Eucalyptus diversicolor (karri) or Corymbia calophylla (marri), but these were reported to have a
propensity to develop large splits and are therefore uncommon in West Australian networks. Many H5-
CCA-treated softwood poles sourced from eastern Australia have also been installed over the last couple
4 Traditional preservatives for hazard class five (H5) applications are copper chromium arsenic (CCA) Type C: 1.20 %
m/m (%Cu + %Cr + %As) for hardwoods and 1.20 % m/m (%Cu + %Cr + %As) for softwoods, or creosote: 13.0 %
m/m for hardwoods and 24.5 % m/m for softwoods . Australian Standard AS 1604.1 (2005).

October 2006
Australian timber pole resources for energy networks 40
of years as hardwood poles have not been available (Jacobs, 2006., pers. comm.; Pettigrew, 2006., pers.
comm.).
Tasmania
Around 93% of Tasmanian distribution poles are timber. Most of these are preservative- treated durability
class 3 and 4 hardwoods, and the most common species are Eucalyptus regnans (mountain ash), E.
delegatensis (alpine ash) and E. obliqua (messmate, standard trade name; also referred to as brown top
stringybark in southern states) (Crump, 2006., pers. comm.).
Australian Capital Territory
In the Australian Capital Territory (ACT) about 83% of poles are timber. Durability class 1 and 2 species
are used, although in recent years 3-piece steel poles have more commonly been used. For the sake of
aesthetics, distribution poles were originally installed behind residences in Canberra and ACT suburbs. As
a consequence, multi-component poles are now necessary for replacements as there is inadequate space
to allow larger poles to be installed. Any timber poles that are required in the ACT are usually purchased
from NSW (Morrison, 2006., pers. comm.).
South Australia and Northern Territory
No significant amounts of timber poles are used in South Australia (SA) or the Northern Territory (NT).
South Australia has very few suitable natural forest resources. Consequently, almost all of the distribution
poles in SA are Stobie poles. Prior to the use of Stobie poles, hardwood poles were obtained from NSW
(McCarthy 1988). Metal poles are most common in the NT, primarily on account of the very high termite
hazard posed by Mastotermes darwiniensis in the region. The NT is also subject to cyclonic weather, and
underground lines are therefore becoming much more common (Pemberton, 2006., pers. comm.).
6.2. Estimated demand for traditional durability class 1 & 2 hardwood poles
The demand for utility poles is projected to increase considerably in response to network expansion and
as a result of pole inspection, maintenance and replacement programs. Surveys undertaken by the ENA
have revealed that the number of poles required for Australian networks is likely to increase by 75% from
2004 to 2014 (Table 5 and Figure 5). It was noted however, that rigorous demand statistics were not
always available and estimates are generally considered conservative (Kent 2006).
The demand predictions in Table 5 and Figure 5 represent all poles from eight to twenty metres in length,
and were calculated as the sum of quantities from major suppliers of durability class 1 and 2 poles. In
addition to poles purchased for energy networks, poles purchased by contractors accounted for about
15% of the total sales from primary pole suppliers in 2004 (Kent 2006).

October 2006
Australian timber pole resources for energy networks 41
Table 5 Estimated nationwide annual demand for poles 2004 to 2014 (after Kent, 2006)
Year Utilities only Utilities & contractors
2004 52,000 61,900
2005 54,200 68,100
2006 60,100 74,900
2007 66,100 82,400
2008 69,600 86,700
2009 73,600 91,200
2010 79,100 98,000
2011 80,900 100,300
2012 83,300 103,200
2013 84,100 105,400
2014 86,700 108,700
Estimated demand for durability class 1 & 2 poles (2004 - 2014)
0
20
40
60
80
100
120
2004
2005
2006
2007
2008
2009
2010
2011
2012
2013
2014
Year
Nu
mb
er o
f po
les
(th
ou
san
d)
Utilities only Utilities & contractors
Figure 5 Estimated annual demand for poles 2004 to 2014 (after Kent, 2006)
Anecdotal evidence suggests that up to 70% of the timber poles that are currently in-service were installed
over the 20 years following the end of World War Two. These poles are likely to require replacement or
remedial maintenance over the next decade. Based on the assumption that a new preservative-treated
timber pole costs 500 dollars, 1.75 billion dollars would need to be invested to obtain the 3.5 million
replacement timber poles that may soon be required. Approximately 175 million dollars per annum would
need to be invested if these poles were acquired over the next decade.
In addition to new poles required to replace those that have reached the end of their service-life in existing
lines, poles are also required for new lines. During the August 2006 meeting of the ENA Timber Pole
Availability Working Group, it was noted that on average, the ratio of poles for new lines compared with
replacement poles is about 1:1 (TPAWG, 2006). If the demand for poles used to construct new lines
Maximum supply of traditional resource ˜ 62,300 poles per annum

October 2006
Australian timber pole resources for energy networks 42
remains constant at half of the total demand by utilities in 2005, an additional 27,100 high-durability poles
may be required each year, representing an additional cost of 13.5 million dollars per annum.
The life-cycle costs of steel, concrete or fibreglass-reinforced composite poles are expected to range from
1/3 more to three times more than the life-cycle costs of timber poles. Using these ratios as a conservative
guide, the cost of investing in alternative manufactured poles to address the potential demand over the
next decade would amount to between $251 and $752 million per annum. If timber poles were used,
approximately $188 million per annum would need to be invested.
The ENA surveys revealed that pole shortages were beginning to be experienced in 2004 for poles with
the following length / strength classifications 5: 11 m / 12 kN, 12.5 m / 8 kN, 12.5 m / 12 kN and 12.5 m / 18
kN or larger (Kent 2006). During the January 2006 meeting of the ENA Timber Pole Availability Working
Group, it was noted that emerging supply difficulties are often exacerbated by purchasing trends. Neither
private contractors nor utilities commonly take in to account the lead-times necessary for suppliers to
gather and process the required quantities of poles. A single order for a mining company for instance, may
require five-hundred 12 m / 5 kN poles. Furthermore, many network managers do not maintain significant
buffer stocks of poles to service short -term demands (TPAWG, 2006., pers. comm.).
6.3. Estimated supply of native forest hardwood poles
Nationwide timber consumption
In their review of the environmental credentials of production, manufacture and re-use of wood fibre in
Australia, Attiwill, England et al. (2001) explained that the raw material supplied to Australian forest
products industries is sourced from Australian native forests, Australian plantations and imported timber.
They found that 24 million cubic metres of roundwood were removed from Australia’s forests in 1999 –
2000; 51% from softwood plantations, and 45% from native hardwood forests. Approximately half was
exported, and 9.6 million cubic metres were imported. An additional 6 – 7 million tonnes were reported to
be removed for firewood – a volume equivalent to 65 – 75% of the total native hardwood chips exported
(Attiwill, England et al. 2001).
Attiwill, England et al. (2001) established that the total apparent consumption6 of gross roundwood
equivalents7 in Australia was about 21.2 million cubic metres in 1999 – 2000, and consumption was
5 Timber poles are commonly classified according to their length (in metres) and ultimate ‘tip load’ strength in kilo-
Newtons. The ultimate ‘tip load’ capacity assigned to a pole represents the maximum force in kN applied a pole’s top
(or ‘tip’), above which the pole may not maintain its structural integrity. 6 Total apparent consumption of gross roundwood equivalents was calculated as the sum of timber harvested, plus
imported timber, minus exported timber 7 Imports and export data were calculated as gross roundwood equivalents of forest products, including sawn timber,
wood-based panels, pulp, paper and paperboard and woodchips. Total roundwood equivalents represent the
estimated wood volume under bark required to make a specific forest product.

October 2006
Australian timber pole resources for energy networks 43
greatest for sawn timber (about 4.8 million cubic metres) and paper and paper products (about 3.7 million
tonnes). In 2000, 80% of the sawn timber supplied to Australian markets was harvested from local native
forests and plantations while 20% was imported. Higher relative proportions of paper, paper products and
wood-based manufactured panels were imported (Attiwill, England et al. 2001).
Australian timber pole resources
On the whole, stakeholders in the production, supply, and utilisation of timber poles support the protection
of Australia’s national native forest resources. They are however, very concerned about the impact of pole
supply shortages that are emerging. As illustrated in Figure 5, about 68,100 durability class 1 and 2 poles
were required in 2005; 54,200 were needed by utilities, and an additional 13,900 by contractors (Kent
2006). Only about 62,300 durability class 1 and 2 poles were available from both public and private
resources during 2005. This was considered the maximum annual amount of the traditional resource that
will ever be available. The demand for new durability class 1 and 2 poles in 2006 was predicted to be
74,900 poles, while the supply of traditional native forest-grown hardwood poles was estimated to remain
at about 62,300 poles.
Under current native forest management policies, the estimated total sustainable log availability is
expected to fall by 36% (or 776,000 m3) from Australia’s public forests between 2001 and 2039, and by
25% (or 15,000 m3) from private forests (Nolan, Washusen et al. 2005), but the amount of higher-durability
pole timber that will be available from public native forests is generally fixed at various quantities
throughout the country until 2039. It was reported however, that significant volumes of lower-durability
hardwood logs are likely to be available from native forests in New South Wales for pole production in the
immediate future, and some poles may also be available from public forests in Victoria.
Furthermore, there may be potential to secure, and to some extent increase, the supply of poles from
private native forests. Native forest-grown hardwood poles bring higher returns than sawlogs, and further
research is required to obtain data on the productivity of private native forests, and to identify
management strategies to optimise the production of poles. Such information needs to be published and
presented to native forest owners (Taylor, 2006. pers comm.). Both native forest pole producers and pole
consumers would benefit from knowledge of the productivity of private native forests in different regions.
This would facilitate the subsequent development of a business case specifically for pole production to
determine the benefits of optimising sustainable management of native forests for pole production.
Many private native forest owners throughout the country remain uncertain about the impact that regional
forest agreements will have on future harvests. In response, many are maximising current harvests and
accepting lower returns now for fear that harvesting will be heavily restricted in the future. This highlights
the need for extension activities to clarify the requirements of regional forest agreements and to raise
awareness of the options for optimising the sustainable management of private native forests. To begin to
address these issues, extension activities, such as the AgForests program in Queensland, are vital.

October 2006
Australian timber pole resources for energy networks 44
The native hardwood supply situation specifically for pole timber is further discussed separately for each
State and Territory. For general estimations, it was assumed that a typical pole contains about 1m3 of
timber.
New South Wales
According to State Forests New South Wales (SFNSW)8, approximately 20,200 m3 of durability class 1
and 2 hardwoods are currently harvested from NSW public forests annually for pole production, along with
2,610 m3 of durability class 3 hardwoods. These quantities represent both native and plantation-grown
logs, which are supplied to pole customers according to agreements established with SFNSW that
generally apply until 2023. Over this time the relative proportions of plantation-grown and native forest-
grown poles is expected to vary with no consistent trend. The current annual volume of durability class 1
and 2 hardwood harvested is considered the maximum available, and is likely to remain so until 2039. The
current demand for the traditional pole resource is beginning to exceed the available supply, especially for
11, 12.5 and 14 m poles. In NSW, the harvesting of pole timber from public forests is managed so that
trees are left to mature to larger sizes of about 15.5 to 17 m, and the supply of 15.5 to 17 m poles is
temporarily alleviating supply problems as they include species of lower strength groups that can be cut to
11, 12.5 and 14 m lengths (Paunovic, 2006., pers. comm.).
The area of native forest available for harvesting in NSW has reduced over recent years, resulting in more
intensive harvesting operations than occurred previously. These operations have and will continue to
produce increased areas of re-growth that will produce the next crop of poles. In addition, thinning
operations have commenced in areas of young regrowth to enhance the growth of the trees that are
retained. While these operations are not producing poles now, they will help to ensure that larger poles
are available in the not so distant future from these areas (Fussell, 2006., pers. comm.).
Almost all of the pole timber harvested from NSW public forests comes from the North Coast. Some
durability class 1 and 2 hardwood poles (somewhere between 5,000 and 10,000 m3) may become
available from the South Coast region, however they are not currently being harvested. A potentially large
volume of durability class 3 timber may also become available from South Coast re-growth forests that
were clearfelled in the 1970’s and have subsequently been thinned (Paunovic, 2006., pers. comm.).
Queensland
According to the Queensland Department of Primary Industries - Forestry9 (DPI-F) and Queensland pole
producers, approximately 60% of the native hardwood pole resource was traditionally sourced from public
forests, and about 40% obtained from private forests. However, there has been a shift over the last few
years, probably in response to uncertainty associated with forest agreements. In recent years,
8 At the time of publication, the title of State Forests NSW (SFNSW) had changed to NSW Department of Primary
Industries – Forests NSW 9 The management of Queensland’s native forests was recently transferred to the Department of Natural Resources,
Mines, Energy and Water (NRMW), while management of Queensland’s plantation resources was transferred to
Forestry Plantations Queensland (FPQ)

October 2006
Australian timber pole resources for energy networks 45
approximately 40% of the native hardwood pole resource was sourced from public forests and 60% from
private forests. This trend is not expected to continue, and the relative supply ratio is currently about 50:50
and returning to previous volumes (Bragg, 2006., pers. comm; Hyne 2006., pers. comm; Williams 2006.,
pers. comm).
DPI-F report that approximately 99,000 lineal metres (lm) of pole timber (about 9,900 m3) are currently
available from Queensland’s public forests each year. The most commonly supplied pole lengths are 11
and 12.5 m, and the current volume of supply is considered close to the maximum available. Fourteen
metre poles are in limited supply, and longer poles are rare. It was reported that there may be a
reasonable volume of 8 and 9.5 m poles that are potentially underutilised (Bragg, 2006., pers. comm.).
Harvesting of pole timber suitable for the electricity distribution sector from public forests now occurs only
in south-east Queensland. While a relatively small pole resource exists in western Queensland, it is
located in areas that have been set aside for conservation (Bligh 2006). Under DPI Forestry’s policy for
the sale of pole and girder timbers, 99,000 lm of pole timber are expected to continue to be made
available annually from public forests until 2009. After 2009 it is expected that a transition to alternative
resources should begin, and the amount the State will supply at this time will depend upon the
demonstrated feasibility of alternative pole resources. Under the terms of the South-East Queensland
Forests Agreement (SEQFA), the pole supply from public native forests will completely cease after 2024
(Bragg, 2006., pers. comm.).
The Vegetation Management Act (VMA) 1999 and the Integrated Planning Act (IPA) 1997 apply to the
harvesting of timber from private land. Harvesting of timber for the commercial production of poles can still
be carried out without a development approval, provided that the clearing of remnant vegetation is
consistent with all aspects of the Code applying to native forest practice on freehold land. The Code
defines the practice required to lawfully conduct a native forest practice without a clearing permit (IPA
2005; VMA 2005).
Table 6 Approximate native hardwood pole supply from public and private forests 2005
State / Territory Supply Durability class Approximate number of polesab
New South Wales 40,400 m 3 1 & 2 40,400
2,610 m 3 c 3 & 4 2,610
Queensland 19,800 m 3 d 1 & 2 19,800
Tasmania 8,700 m 3 3 & 4 8,700
Western Australia ~2,100 m 3 1 & 2 ~2,100
Total durability class 1 & 2 62,300 a Calculations assume an ‘average pole’ contains 1.0 m3 of timber and includes poles supplied from public and private forests (in equal proportions) b There is potential to increase the supply of poles from private native forests by raising awareness of sustainable management options to maximise the production of poles c Number of poles currently supplied from public forests only, much larger quantity likely to be available d Supply forecast provided by DPI-F as 99,000 lm, calculations assume 10 lm ˜ 1 m3 of pole timber

October 2006
Australian timber pole resources for energy networks 46
Tasmania
About 80% of the poles produced in Tasmania are harvested from public forests, and 20% are obtained
from private forests (Exton, 2006., pers. comm.). According to Forestry Tasmania, approximately 5,800
durability class 3 and 4 poles per annum (about 5,800 m3) are currently sold from Tasmanian State
Forests. This volume obtained from public forests is considered the maximum available and is sold
exclusively in Tasmania. Most of the pole timber from public forests is re-growth, however native forest
management policies may impact the availability of pole timber over the next few decades. A 14% yield
reduction is envisaged after 2012, and there is potential for logging of old-growth forest to cease after
2010 when a conversion to plantation resources is expected (Glass, 2006., pers. comm.). There may
currently be additional pole timber available from private resources in Tasmania as it was reported that
many private forest managers are unaware of the potential to sell pole timber (Exton, 2006., pers. comm.).
From 2015, the Tasmanian Community Forest Agreement may affect the volume of timber available from
private forests (Glass, 2006., pers. comm.).
Victoria
No significant volumes of native forest-grown durability class one or two species suitable for pole
production are available from Victorian public or private forests. A reasonable volume of lower durability
species may potentially be available for pole production in the future (Groenhout, 2006., pers. comm.).
Western Australia
Native hardwood supply in WA has been rapidly diminishing for several years, especially since 2001,
when heavy restrictions were placed on harvesting from south west forests. Preservative-treated
plantation-grown P. radiata has been the main source of timber distribution poles over the past two years,
and over that time about 13,500 poles have been used. Only about 30% of new poles in WA are
hardwoods sourced from WA native forests (Jacobs, 2006., pers. comm.; Pettigrew, 2006., pers. comm.).
South Australia, Australian Capital Territory and Northern Territory
No significant quantities of native durability class 1 or 2 hardwood pole timber are available from SA, ACT,
or NT public or private native forests, nor are they likely to be in the future (West, 2006., pers comm.;
Morrison, 2006., pers comm.; Pemberton, 2006., pers. comm.).
6.4. Performance of traditional native hardwood poles
In general, the two main properties that determine how a timber pole of the required form will perform in-
service are its strength and its durability. Predicting these characteristics is more complex for timber than
for intensively manufactured inorganic materials, and consequently timber pole standards and
specifications continue to improve as more research data become available. Despite the relative
limitations of standards and specifications, timber has continued as the pole material of choice throughout
most of the country, and many of the challenges are now being addressed. With regard to timber pole
strength, some key Australian Standards have recently been updated and others are currently under

October 2006
Australian timber pole resources for energy networks 47
review. The revisions have been undertaken with an increased focus on limit-state principles and are
based on reliable scientific data. Please see Sections 8.1 and 8.2 for further discussion of timber pole
strength standards and specifications.
Good-quality pole inspection and maintenance practices manage the uncertainties associated with timber
durability, although greater certainty of the characteristic strength and durability of different timber pole
species will serve to optimise their reliability. It is more complex to model timber pole biodeterioration than
non-timber pole deterioration, as there are considerable differences in the biodeterioration hazards for
timber used in contact with the ground at different locations throughout the country. For example, in
Victoria, decay is more likely to cause pole deterioration south of the Great Dividing Range, while termites
pose a bigger problem north of the Divide. In Queensland, termites pose a much greater threat in north
Queensland, decay is more severe closer to the coast, while inland regions present a much lower decay
hazard. The revisions of standards also include an update of standard service-life (durability) forecasts
based on recent research. Please see Sections 8.3 and 8.4 for further discussion of timber pole durability
and preservation issues.
Based on various anecdotal reports, durability class 1 poles are generally expected to last for about 50 -
60 years in-service. Some durability class 1 poles made from superior-quality mature native timbers that
were available in the past, can last for more than 75 years in some locations. The treated durability class 2
species that are now most commonly available are expected to last about 40 - 50 years in-service. Only
durability class 1 and 2 timber species are considered suitably durable in most of the country, however,
the lower durability poles used in Tasmania and some parts of Victoria are generally expected to last for
about 35 - 45 years. In addition to improved specifications and inspection techniques, new treatment
technologies are also available to enhance the performance of timber poles. These advances are
applicable to both traditional and alternative timber pole resources.

October 2006
Australian timber pole resources for energy networks 48
7. Alternative timber pole resources
As discussed previously, lower-durability native forest-grown hardwood poles are used in Victoria and
Tasmania, and considerable volumes of lower-durability hardwood logs are likely to be available for pole
production in the immediate future.
Plantation-grown logs may also be available. The national strategy for Plantations for Australia: The 2020
Vision was launched in 1997 and contained a national plantation estate target of three million hectares to
be reached by 2020 (Plantations 2020, 2002). Parsons and Garvan (2005) noted that to reach that size,
an average increase of about 80,000 ha/year needs to be planted. There are now more private plantations
in Australia than public plantations, and 88% of the tree crop planted in 2004 is privately owned. In total,
about 86% of hardwood plantations are privately owned compared with 55% of softwood plantations
(Parsons and Gavran 2005).
Plantation-grown hardwood and softwood poles are commonly used to support energy networks overseas,
and all indications suggest that suitable plantation resources could be established in Australia. Currently
though, a considerable degree of uncertainty surrounds the proportions of suitable plantation-grown timber
that will be available in the immediate future to address shortages in the supply of native forest-grown
hardwoods. Good-quality logs are currently highly sought after in Australia for sawn timber, veneer and
plywood markets as well as for the production of poles. Most plantation stakeholders were unable to
provide accurate forecasts of the volume of plantation-grown pole timber that may be available for pole
production in the short-term, and in general, the market for large poles was poorly understood. The level
of interest in pole markets varied considerably between plantation managers. Consequently, projections
for the availability of plantation-grown pole timber in this section of the review are intended to provide a
general indication of the order of magnitude of potential supplies. In most cases, projected supply volumes
are based on sawlog specifications and it should be noted that no consideration has been made of
interactions with existing sales, contractual arrangements, or operational issues associated with diverting
poles from sawlog operations.
Much of the data presented were sourced from the Plantations of Australia - Wood Availability 2001-2044
studies undertaken for the Bureau of Rural Sciences’ National Plantation Inventory (NPI). NPI supply
projections were calculated for two different availability scenarios: the first assumes ‘no new planting’
beyond 2001, with only replanting of existing plantation areas to continue; the second assumes ‘new
planting’ is undertaken on previously cleared agricultural land from 2001 to 2019 at the annual rates
forecast in the Bureau of Rural Sciences (BRS) Medium Projections, with continued replanting only of
existing plantation areas after 2019. Both government and private forest timbers are included in the NPI
projections (Ferguson, Fox et al. 2002). For the purposes of this review, NPI regions that encompass
more than one state or territory are discussed under the heading of state or territory where more of the
resource is located.
Australian plantation resources were separated into two groups for the purposes of the NPl. The ‘sawlog’
group represents logs used to manufacture sawn timber, veneer, plywood and other solid wood products,

October 2006
Australian timber pole resources for energy networks 49
while the ‘pulpwood’ group represents logs used for the production of wood fibre, posts, poles and
reconstituted wood panels. Whilst the pulpwood group contains logs suitable for the production of small
poles, it is not clear if pulpwood logs will be of sufficient quality for the production of utility poles as
described in AS 2209 – 1994, the national standard for the requirements for timber poles intended to be
used to support overhead lines. Knots and other defects associated with branches are the major
impediment to the conversion of pulpwood logs into solid wood products. AS 2209- 1994 however,
specifies that the critical zone of any pole (i.e. the 1.6 m from 600 mm below to 1 m above nominal
ground-line) is to be free of knots, and limits apply for the number of knots allowable beyond the critical
zone. Poles intended to support overhead lines also need to satisfy AS 2009 -1994 criteria for other
characteristics including straightness, splits and barrel checks. Furthermore, the requirements for pole
strength and dimension as specified in other standards also need to be satisfied.
Additional volumes of pole timber may be available from plantation resources including thinnings and logs
with characteristics unfavourable for sawn timber production. Research is required to determine if these
resources comply with the standard pole criteria for physical form, strength and durability. If these
resources don’t satisfy current standards and specifications but are expected to be suitable, a
performance-based justification based on in-grade research may be required. Extension is required to
raise awareness amongst current and potential plantation forest owners and managers of the potential
market for utility poles and further investigation is required to clarify the volume of suitable plantation-
grown timber that will be available specifically for pole production.
The cost of plantation-grown poles is likely to be similar to, if not less than the cost of traditional native
forest hardwood poles. There are excellent opportunities for pole consumers to become stakeholders in
plantation forests and there are various investment options available for joint ventures involving pole
consumers, forest owners and forest managers. Establishing plantations focused on the production of
poles is strongly recommended. The benefits of such enterprises for pole consumers include security and
control of supply, further reduced cost of poles, environmental advantages like positive carbon accounting
and considerable returns for a range of other forest products. Apart from production of quality poles,
plantations generate income through the sale of other solid wood products like sawlogs, and additional
low-risk income streams for products such as thinnings, sub-optimum logs, grazing and apiary activities.
Forest owners and managers additionally benefit from sharing initial investments with supportive and
committed energy networks pole consumers.
Some research and development is required to provide detailed analyses to further optimise forest
resources and plantation management and to facilitate the initiation of plantation partnerships. In
collaboration, a relatively small investment in R&D by individual stakeholders has much potential to yield
very lucrative outcomes.
Throughout this review, the need for resource characterisation is discussed, particularly for alternative
resources for which there are insufficient data regarding their performance in-service as poles.
Characterisation studies are fundamental scientific investigations to accurately and reliably define the key

October 2006
Australian timber pole resources for energy networks 50
traits and qualities of particular resources. Some resource characterisation studies may have a general
focus, while others are centred on attributes that are necessary for particular end-use applications.
Limit-state product information is required for modern best practice design and engineering. Poles
intended to support overhead lines must comply with specific requirements for form, strength and
durability to ensure their reliability in-service. In-grade (whole-pole) destructive pole strength research has
revealed that strength classifications in principal Australian Standards (based on tests of small, clear
timber samples) correlate poorly with the actual strength of roundwood poles. So, the in-grade strength
and other key characteristics of representative samples of logs from alternative pole resources need to be
accurately measured. Stratified random sampling is likely to be best the best approach to select logs from
a subset of trees that satisfy the obvious general form and size requirements for pole production (e.g.
straightness). An important component of resource characterisation studies is refining methods to reliably
identify the trees within a stand that are suitable for their intended end-use application. These methods
include the use of non-destructive evaluation tools and documentation of key visual features or
measurements (such as stem diameter and form).
Fortunately, a number of investigations have already been undertaken to identify the general properties of
many Australian timber resources. Most research has been focussed on wood fibre or sawn timber
production; nevertheless there is much valuable data to draw upon.
Selected mechanical properties have been examined, but measurements have mainly focussed on the
stiffness of sawn timber specimens or small, clear samples. Whilst stiffness and strength parameters are
related, measures of stiffness may be insufficient to predict pole strength, hence in-grade pole tests are
recommended. The relative mechanical properties of sawn timber products nevertheless provide a useful
guide to relative pole strength.
Recent research to characterise Australian P. radiata (radiata pine) (Cown, McKinley et al. 2006) and P.
elliottii (slash pine) resources (Harding, 2006,. pers. comm.), has revealed strong relationships between
the geographical location of plantation resources and wood density. Generally, wood density increases the
closer a tree is grown to the equator, and wood density generally decreases with increasing altitude.
Overseas studies have shown that density is a critical factor influencing pole strength for Pinus species.
Once the relationship between in-grade pole strength and wood density is confirmed for Australian
resources, density measurements from characterisation studies can be used to identify stands Pinus
species that may be suitable for pole production. For example, if poles produced from a particular location
satisfy strength requirements, then it is likely that similarly-sized poles sourced from appropriate
plantations located further north would also be sufficiently strong (if not stronger). Only confirmatory
surveys may therefore be necessary for logs sourced from similar resources established to the north of
those that have been suitably characterised. Physical defects can also be examined during resource
characterisation studies to more accurately determine their effect on key pole characteristics.
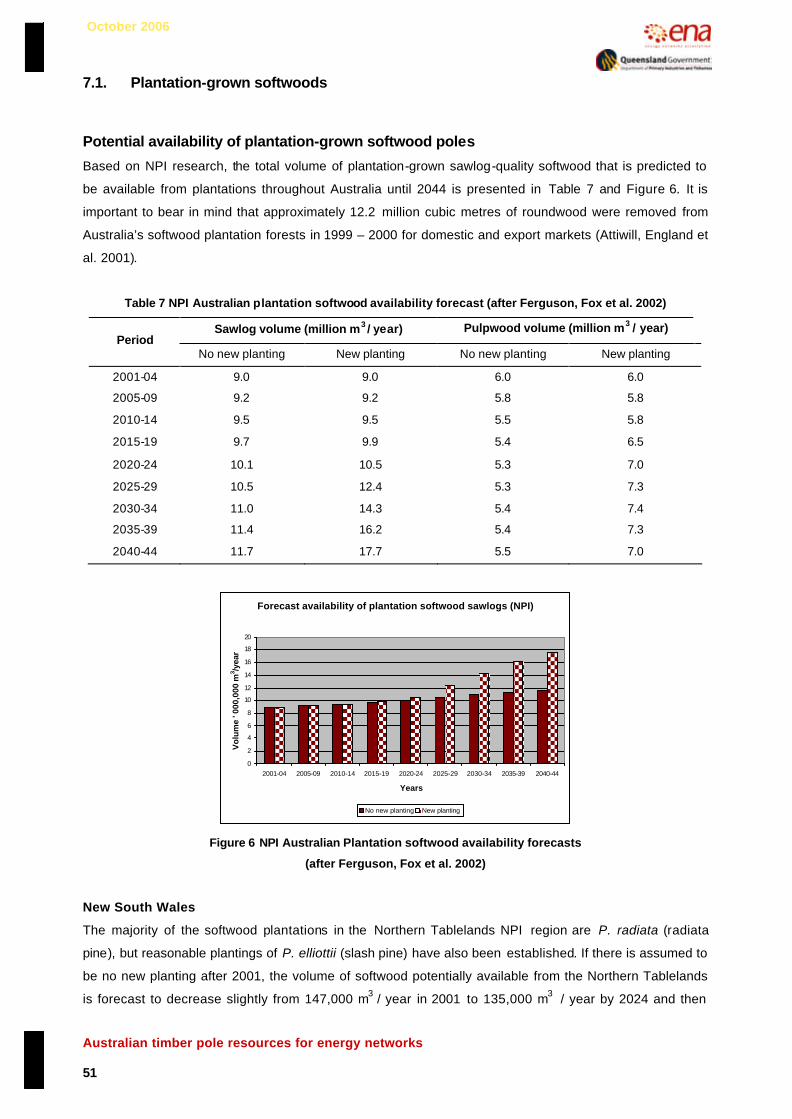
October 2006
Australian timber pole resources for energy networks 51
7.1. Plantation-grown softwoods
Potential availability of plantation-grown softwood poles
Based on NPI research, the total volume of plantation-grown sawlog-quality softwood that is predicted to
be available from plantations throughout Australia until 2044 is presented in Table 7 and Figure 6. It is
important to bear in mind that approximately 12.2 million cubic metres of roundwood were removed from
Australia’s softwood plantation forests in 1999 – 2000 for domestic and export markets (Attiwill, England et
al. 2001).
Table 7 NPI Australian plantation softwood availability forecast (after Ferguson, Fox et al. 2002)
Sawlog volume (million m3 / year) Pulpwood volume (million m3 / year) Period
No new planting New planting No new planting New planting
2001-04 9.0 9.0 6.0 6.0
2005-09 9.2 9.2 5.8 5.8
2010-14 9.5 9.5 5.5 5.8
2015-19 9.7 9.9 5.4 6.5
2020-24 10.1 10.5 5.3 7.0
2025-29 10.5 12.4 5.3 7.3
2030-34 11.0 14.3 5.4 7.4
2035-39 11.4 16.2 5.4 7.3
2040-44 11.7 17.7 5.5 7.0
Forecast availability of plantation softwood sawlogs (NPI)
0
2
4
6
8
10
12
14
16
18
20
2001-04 2005-09 2010-14 2015-19 2020-24 2025-29 2030-34 2035-39 2040-44
Years
Vo
lum
e ' 0
00,0
00 m
3 /yea
r
No new planting New planting
Figure 6 NPI Australian Plantation softwood availability forecasts
(after Ferguson, Fox et al. 2002)
New South Wales
The majority of the softwood plantations in the Northern Tablelands NPI region are P. radiata (radiata
pine), but reasonable plantings of P. elliottii (slash pine) have also been established. If there is assumed to
be no new planting after 2001, the volume of softwood potentially available from the Northern Tablelands
is forecast to decrease slightly from 147,000 m3 / year in 2001 to 135,000 m3 / year by 2024 and then
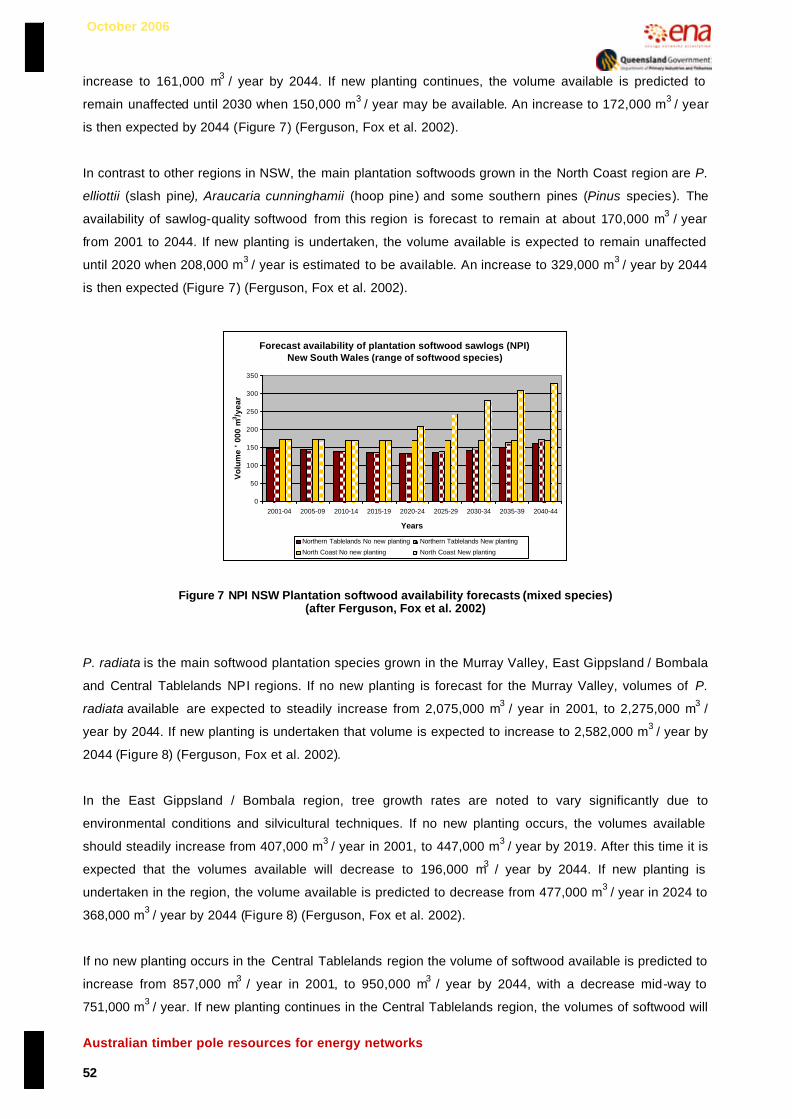
October 2006
Australian timber pole resources for energy networks 52
increase to 161,000 m3 / year by 2044. If new planting continues, the volume available is predicted to
remain unaffected until 2030 when 150,000 m3 / year may be available. An increase to 172,000 m3 / year
is then expected by 2044 (Figure 7) (Ferguson, Fox et al. 2002).
In contrast to other regions in NSW, the main plantation softwoods grown in the North Coast region are P.
elliottii (slash pine), Araucaria cunninghamii (hoop pine) and some southern pines (Pinus species). The
availability of sawlog-quality softwood from this region is forecast to remain at about 170,000 m3 / year
from 2001 to 2044. If new planting is undertaken, the volume available is expected to remain unaffected
until 2020 when 208,000 m3 / year is estimated to be available. An increase to 329,000 m3 / year by 2044
is then expected (Figure 7) (Ferguson, Fox et al. 2002).
Forecast availability of plantation softwood sawlogs (NPI)New South Wales (range of softwood species)
0
50
100
150
200
250
300
350
2001-04 2005-09 2010-14 2015-19 2020-24 2025-29 2030-34 2035-39 2040-44
Years
Vo
lum
e ' 0
00 m
3 /yea
r
Northern Tablelands No new planting Northern Tablelands New planting
North Coast No new planting North Coast New planting
Figure 7 NPI NSW Plantation softwood availability forecasts (mixed species) (after Ferguson, Fox et al. 2002)
P. radiata is the main softwood plantation species grown in the Murray Valley, East Gippsland / Bombala
and Central Tablelands NPI regions. If no new planting is forecast for the Murray Valley, volumes of P.
radiata available are expected to steadily increase from 2,075,000 m3 / year in 2001, to 2,275,000 m3 /
year by 2044. If new planting is undertaken that volume is expected to increase to 2,582,000 m3 / year by
2044 (Figure 8) (Ferguson, Fox et al. 2002).
In the East Gippsland / Bombala region, tree growth rates are noted to vary significantly due to
environmental conditions and silvicultural techniques. If no new planting occurs, the volumes available
should steadily increase from 407,000 m3 / year in 2001, to 447,000 m3 / year by 2019. After this time it is
expected that the volumes available will decrease to 196,000 m3 / year by 2044. If new planting is
undertaken in the region, the volume available is predicted to decrease from 477,000 m3 / year in 2024 to
368,000 m3 / year by 2044 (Figure 8) (Ferguson, Fox et al. 2002).
If no new planting occurs in the Central Tablelands region the volume of softwood available is predicted to
increase from 857,000 m3 / year in 2001, to 950,000 m3 / year by 2044, with a decrease mid-way to
751,000 m3 / year. If new planting continues in the Central Tablelands region, the volumes of softwood will

October 2006
Australian timber pole resources for energy networks 53
not be affected until 2025 when an increased volume of 1,057,000 m3 / year is predicted to be available,
and a further increase to 1,909,000 m3 / year by 2044 would be expected to follow (Figure 8) (Ferguson,
Fox et al. 2002).
Forecast availability of plantation softwood sawlogs (NPI)New South Wales & A.C.T. (P. radiata only)
0
500
1000
1500
2000
2500
3000
2001-04 2005-09 2010-14 2015-19 2020-24 2025-29 2030-34 2035-39 2040-44
Years
Vo
lum
e ' 0
00 m
3 /yea
r
Murray Valley No new Planting Murray Valley New planting
East Gippsland/Bombala No new planting East Gippsland/Bombala New plantingCentral tablelands No new planting Central tablelands New planting
Southern tablelands No new planting Southern tablelands New planting
Figure 8 NPI NSW Plantation softwood availability forecasts (P. radiata) (after Ferguson, Fox et al. 2002)
Australian Capital Territory
A reasonably large area of the plantation estate in the Southern Tablelands NPI region has been
established in the ACT and sawlog-quality plantation-grown softwoods available from this region are
discussed as ACT totals for the purposes of this review. The region does however also encompass areas
of NSW to the north and east of the ACT. The major softwood plantation species in the region is P.
radiata, and if there is assumed to be no new planting after 2001, the volume of softwood potentially
available is forecast to steadily increase from 205,000 m3 / year in 2001 to 278,000 m3 / year by 2044. If
new planting takes place, the volume expected to be available is predicted to increase slowly at first, and
then more rapidly in the period from 2030 to 2044 by which time a volume of 618,000 m3 / year is
predicted to be available (Figure 8) (Ferguson, Fox et al. 2002).
Queensland
The main exotic (introduced) softwood stands established in the South East Queensland (SEQ) NPI
region are planted with Pinus caribaea (Caribbean pine), P. elliottii (slash pine), P. taeda (loblolly pine), or
P. caribaea / P. elliottii hybrids. Significant plantations of the native species Araucaria cunninghamii (hoop
pine), have also been established. If there is assumed to be no new planting after 2001, the volume of
softwood potentially available from this region is predicted to increase from 898,000 m3 / year in 2001, to
1,022,000 m3 / year by 2044. If new planting continues after 2001, the volume of softwood potentially
available is predicted to remain unchanged then increase from 1,147,000 m3 / year in 2020 to 1,491,000
m3 / year by 2044 (Figure 9) (Ferguson, Fox et al. 2002).
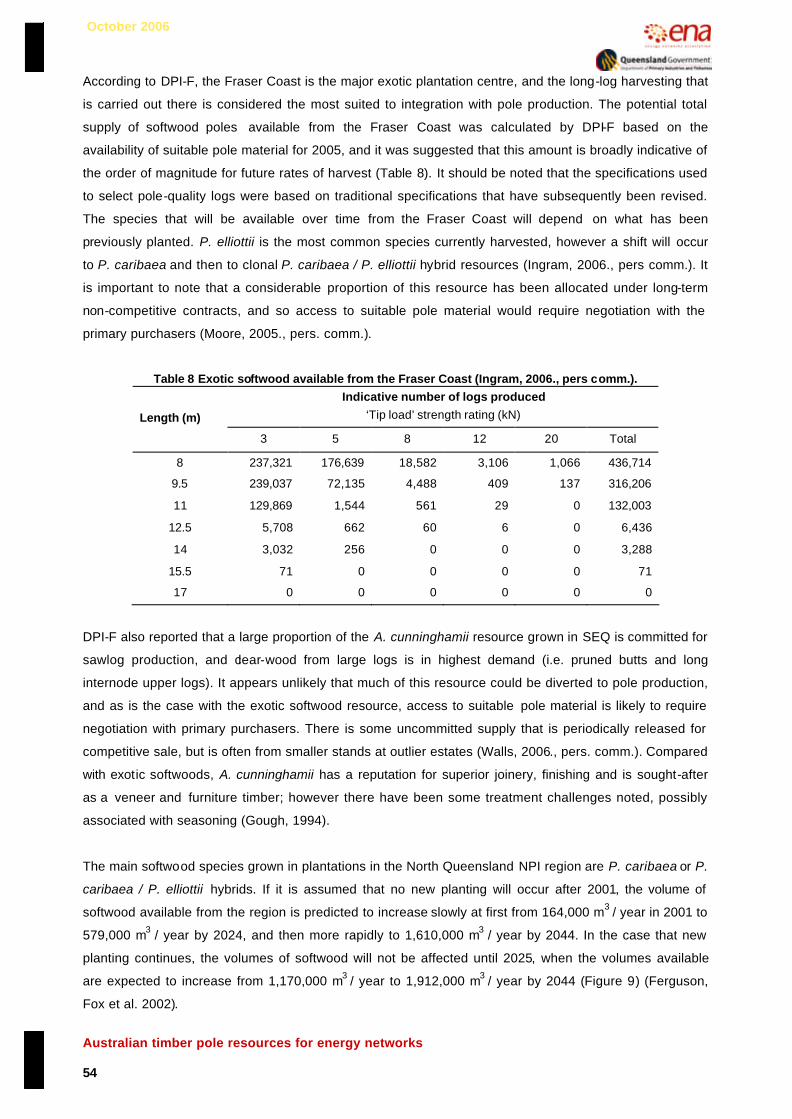
October 2006
Australian timber pole resources for energy networks 54
According to DPI-F, the Fraser Coast is the major exotic plantation centre, and the long-log harvesting that
is carried out there is considered the most suited to integration with pole production. The potential total
supply of softwood poles available from the Fraser Coast was calculated by DPI-F based on the
availability of suitable pole material for 2005, and it was suggested that this amount is broadly indicative of
the order of magnitude for future rates of harvest (Table 8). It should be noted that the specifications used
to select pole-quality logs were based on traditional specifications that have subsequently been revised.
The species that will be available over time from the Fraser Coast will depend on what has been
previously planted. P. elliottii is the most common species currently harvested, however a shift will occur
to P. caribaea and then to clonal P. caribaea / P. elliottii hybrid resources (Ingram, 2006., pers comm.). It
is important to note that a considerable proportion of this resource has been allocated under long-term
non-competitive contracts, and so access to suitable pole material would require negotiation with the
primary purchasers (Moore, 2005., pers. comm.).
Table 8 Exotic softwood available from the Fraser Coast (Ingram, 2006., pers comm.). Indicative number of logs produced
‘Tip load’ strength rating (kN) Length (m)
3 5 8 12 20 Total
8 237,321 176,639 18,582 3,106 1,066 436,714
9.5 239,037 72,135 4,488 409 137 316,206
11 129,869 1,544 561 29 0 132,003
12.5 5,708 662 60 6 0 6,436
14 3,032 256 0 0 0 3,288
15.5 71 0 0 0 0 71
17 0 0 0 0 0 0
DPI-F also reported that a large proportion of the A. cunninghamii resource grown in SEQ is committed for
sawlog production, and clear-wood from large logs is in highest demand (i.e. pruned butts and long
internode upper logs). It appears unlikely that much of this resource could be diverted to pole production,
and as is the case with the exotic softwood resource, access to suitable pole material is likely to require
negotiation with primary purchasers. There is some uncommitted supply that is periodically released for
competitive sale, but is often from smaller stands at outlier estates (Walls, 2006., pers. comm.). Compared
with exotic softwoods, A. cunninghamii has a reputation for superior joinery, finishing and is sought-after
as a veneer and furniture timber; however there have been some treatment challenges noted, possibly
associated with seasoning (Gough, 1994).
The main softwood species grown in plantations in the North Queensland NPI region are P. caribaea or P.
caribaea / P. elliottii hybrids. If it is assumed that no new planting will occur after 2001, the volume of
softwood available from the region is predicted to increase slowly at first from 164,000 m3 / year in 2001 to
579,000 m3 / year by 2024, and then more rapidly to 1,610,000 m3 / year by 2044. In the case that new
planting continues, the volumes of softwood will not be affected until 2025, when the volumes available
are expected to increase from 1,170,000 m3 / year to 1,912,000 m3 / year by 2044 (Figure 9) (Ferguson,
Fox et al. 2002).
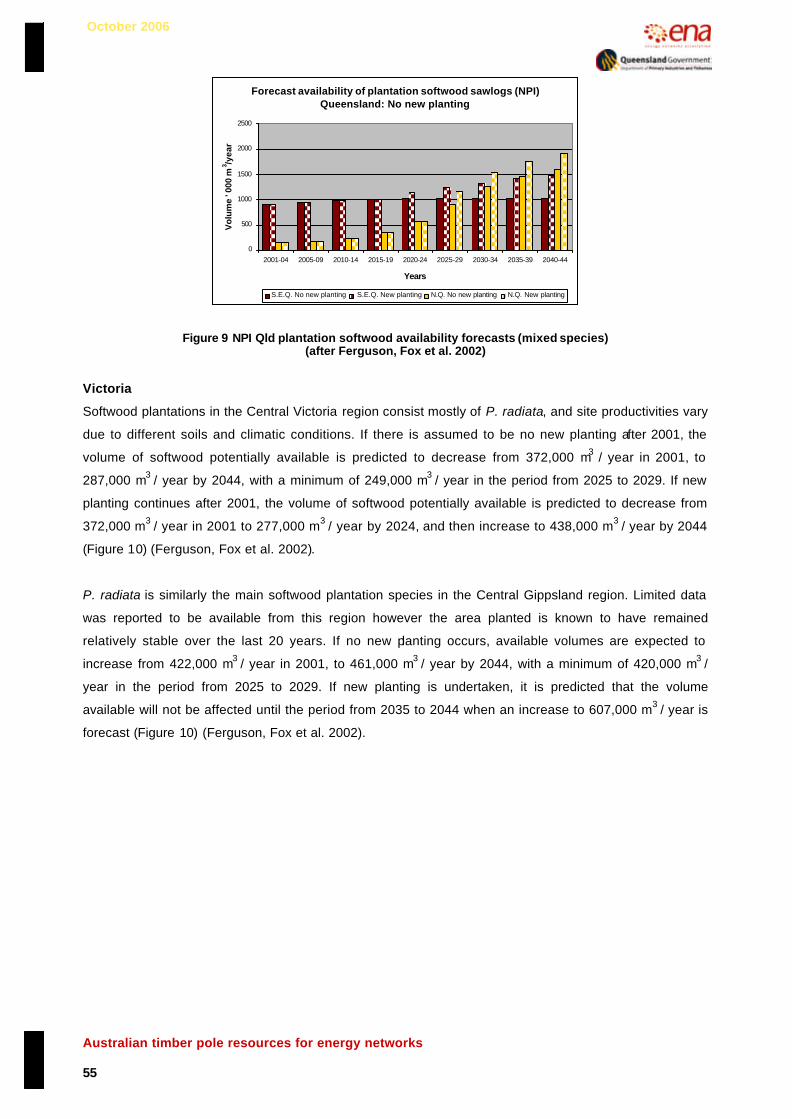
October 2006
Australian timber pole resources for energy networks 55
Forecast availability of plantation softwood sawlogs (NPI)Queensland: No new planting
0
500
1000
1500
2000
2500
2001-04 2005-09 2010-14 2015-19 2020-24 2025-29 2030-34 2035-39 2040-44
Years
Vo
lum
e ' 0
00 m
3 /yea
r
S.E.Q. No new planting S.E.Q. New planting N.Q. No new planting N.Q. New planting
Figure 9 NPI Qld plantation softwood availability forecasts (mixed species) (after Ferguson, Fox et al. 2002)
Victoria
Softwood plantations in the Central Victoria region consist mostly of P. radiata, and site productivities vary
due to different soils and climatic conditions. If there is assumed to be no new planting after 2001, the
volume of softwood potentially available is predicted to decrease from 372,000 m3 / year in 2001, to
287,000 m3 / year by 2044, with a minimum of 249,000 m3 / year in the period from 2025 to 2029. If new
planting continues after 2001, the volume of softwood potentially available is predicted to decrease from
372,000 m3 / year in 2001 to 277,000 m3 / year by 2024, and then increase to 438,000 m3 / year by 2044
(Figure 10) (Ferguson, Fox et al. 2002).
P. radiata is similarly the main softwood plantation species in the Central Gippsland region. Limited data
was reported to be available from this region however the area planted is known to have remained
relatively stable over the last 20 years. If no new planting occurs, available volumes are expected to
increase from 422,000 m3 / year in 2001, to 461,000 m3 / year by 2044, with a minimum of 420,000 m3 /
year in the period from 2025 to 2029. If new planting is undertaken, it is predicted that the volume
available will not be affected until the period from 2035 to 2044 when an increase to 607,000 m3 / year is
forecast (Figure 10) (Ferguson, Fox et al. 2002).
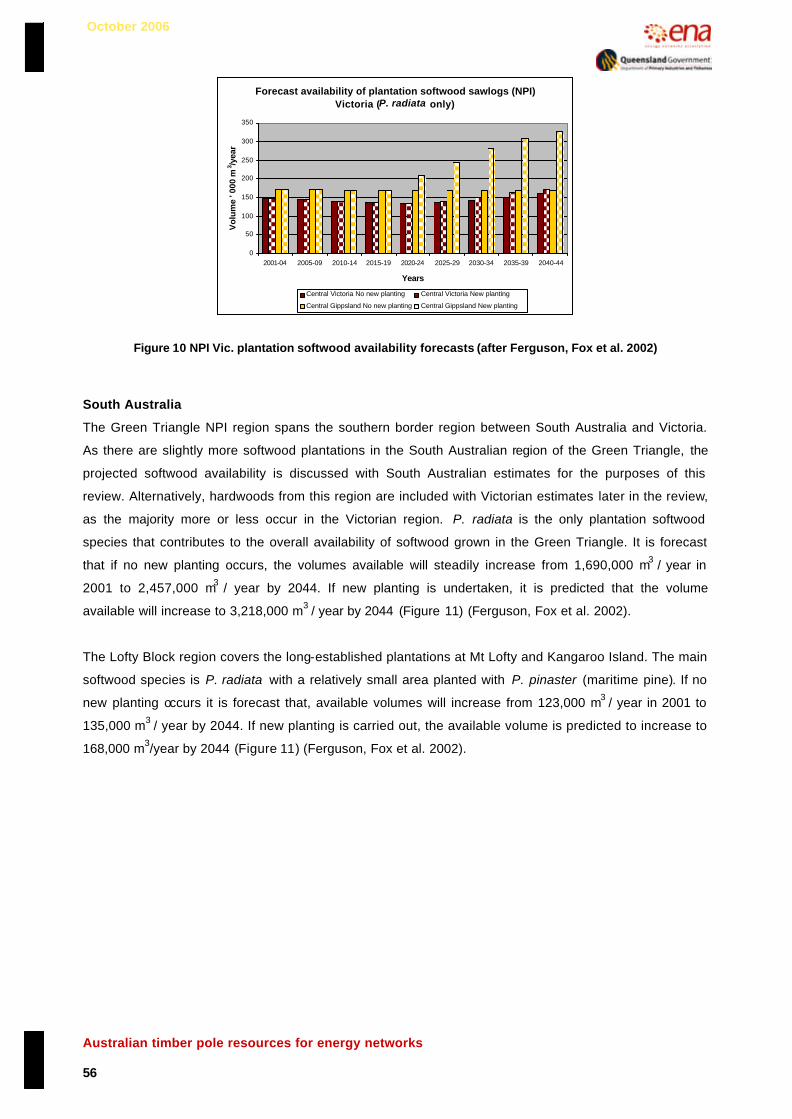
October 2006
Australian timber pole resources for energy networks 56
Forecast availability of plantation softwood sawlogs (NPI)Victoria (P. radiata only)
0
50
100
150
200
250
300
350
2001-04 2005-09 2010-14 2015-19 2020-24 2025-29 2030-34 2035-39 2040-44
Years
Vo
lum
e ' 0
00 m
3 /yea
r
Central Victoria No new planting Central Victoria New planting
Central Gippsland No new planting Central Gippsland New planting
Figure 10 NPI Vic. plantation softwood availability forecasts (after Ferguson, Fox et al. 2002)
South Australia
The Green Triangle NPI region spans the southern border region between South Australia and Victoria.
As there are slightly more softwood plantations in the South Australian region of the Green Triangle, the
projected softwood availability is discussed with South Australian estimates for the purposes of this
review. Alternatively, hardwoods from this region are included with Victorian estimates later in the review,
as the majority more or less occur in the Victorian region. P. radiata is the only plantation softwood
species that contributes to the overall availability of softwood grown in the Green Triangle. It is forecast
that if no new planting occurs, the volumes available will steadily increase from 1,690,000 m3 / year in
2001 to 2,457,000 m3 / year by 2044. If new planting is undertaken, it is predicted that the volume
available will increase to 3,218,000 m3 / year by 2044 (Figure 11) (Ferguson, Fox et al. 2002).
The Lofty Block region covers the long-established plantations at Mt Lofty and Kangaroo Island. The main
softwood species is P. radiata with a relatively small area planted with P. pinaster (maritime pine). If no
new planting occurs it is forecast that, available volumes will increase from 123,000 m3 / year in 2001 to
135,000 m3 / year by 2044. If new planting is carried out, the available volume is predicted to increase to
168,000 m3/year by 2044 (Figure 11) (Ferguson, Fox et al. 2002).
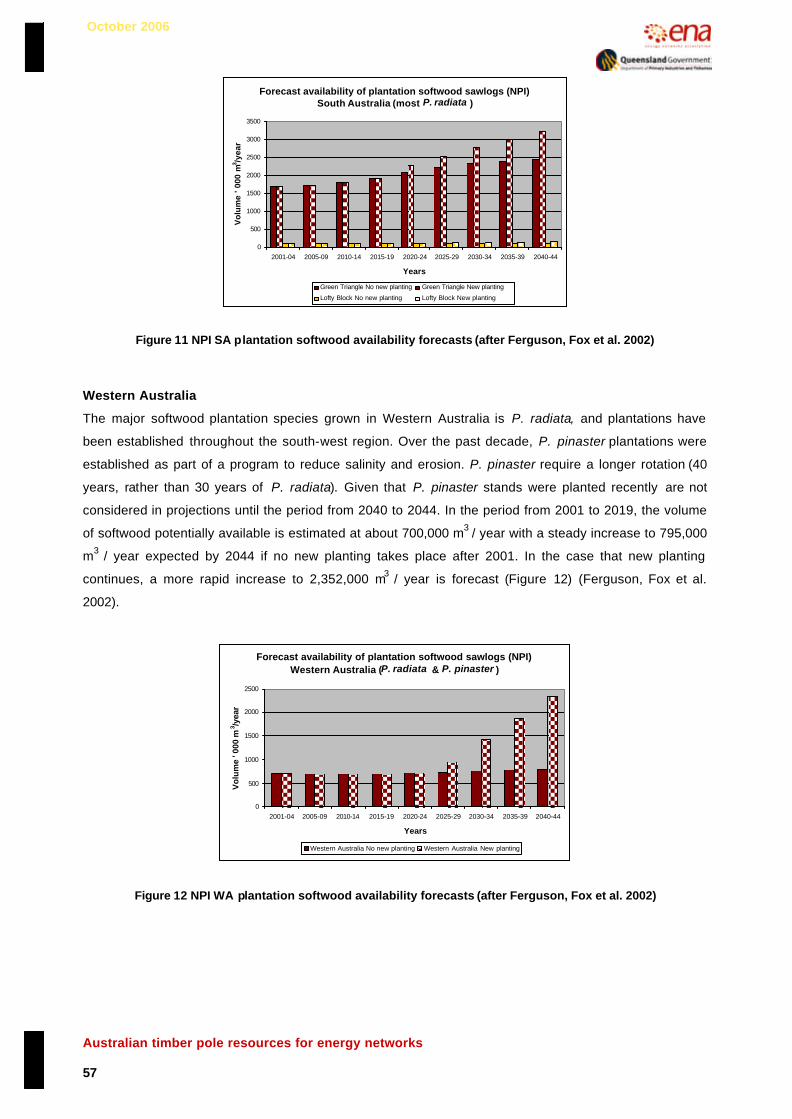
October 2006
Australian timber pole resources for energy networks 57
Forecast availability of plantation softwood sawlogs (NPI)South Australia (most P. radiata )
0
500
1000
1500
2000
2500
3000
3500
2001-04 2005-09 2010-14 2015-19 2020-24 2025-29 2030-34 2035-39 2040-44
Years
Vo
lum
e ' 0
00 m
3 /yea
r
Green Triangle No new planting Green Triangle New planting
Lofty Block No new planting Lofty Block New planting
Figure 11 NPI SA plantation softwood availability forecasts (after Ferguson, Fox et al. 2002)
Western Australia
The major softwood plantation species grown in Western Australia is P. radiata, and plantations have
been established throughout the south-west region. Over the past decade, P. pinaster plantations were
established as part of a program to reduce salinity and erosion. P. pinaster require a longer rotation (40
years, rather than 30 years of P. radiata). Given that P. pinaster stands were planted recently are not
considered in projections until the period from 2040 to 2044. In the period from 2001 to 2019, the volume
of softwood potentially available is estimated at about 700,000 m3 / year with a steady increase to 795,000
m3 / year expected by 2044 if no new planting takes place after 2001. In the case that new planting
continues, a more rapid increase to 2,352,000 m3 / year is forecast (Figure 12) (Ferguson, Fox et al.
2002).
Forecast availability of plantation softwood sawlogs (NPI)Western Australia (P. radiata & P. pinaster )
0
500
1000
1500
2000
2500
2001-04 2005-09 2010-14 2015-19 2020-24 2025-29 2030-34 2035-39 2040-44
Years
Vo
lum
e ' 0
00 m
3 /yea
r
Western Australia No new planting Western Australia New planting
Figure 12 NPI WA plantation softwood availability forecasts (after Ferguson, Fox et al. 2002)

October 2006
Australian timber pole resources for energy networks 58
Tasmania
P. radiata is the main plantation softwood species grown in Tasmania, and plantings of other species are
small. Given that planting has continued reasonably consistently over the last 20 years, a progressive
increase in its availability is anticipated. If there is assumed to be no new planting after 2001, the
availability of softwood potentially available from Tasmania is forecast to steadily increase from 768,000
m3 / year in 2001 to 924,000 m3 / year by 2044. If new planting continues, the volume available is predicted
to steadily increase to 1,570,000 m3 / year by 2044 (Figure 13) (Ferguson, Fox et al. 2002).
Forecast availability of plantation softwood sawlogs (NPI)Tasmania (most P. radiata )
0
20
40
60
80
100
120
140
160
180
200
2001-04 2005-09 2010-14 2015-19 2020-24 2025-29 2030-34 2035-39 2040-44
Years
Vol
ume
' 000
m3 /y
ear
Tasmania No new planting Tasmania New planting
Figure 13 NPI Tas. plantation softwood availability forecasts (after Ferguson, Fox et al. 2002)
Northern Territory
The Northern Territory NPI region accounts for plantations around Darwin and on Melville Island. The
dominant softwood plantation species are Pinus caribaea and P. caribaea / P. elliottii hybrids. Some
Callitris intratropica (Northern cypress) was included in the softwood totals for the NPI study, and it was
noted that predictions are reasonably tentative as no growers in the region provided estimates of
availability. No sawlog-quality softwood is predicted to be available from the NT until 2019, after which
time 23,000 m3 / year is expected to be available, with this volume predicted to decrease to 8,000 m3 / year
by 2044 (Ferguson, Fox et al. 2002).
Performance of plantation-grown softwood poles
Preservative-treated softwood poles are regularly used for distribution applications overseas. Pinus
species are most commonly used as poles and although they have low natural durability, they are
generally very amenable to preservative treatment. Treated softwood poles cost marginally more than
hardwoods (Kent 2006) as they have a higher relative amount of treatable sapwood. The large proportion
of treated sapwood in softwood poles makes them very durable.
Treated softwood poles are widely used in New Zealand (NZ) to support energy networks in rural areas.
Walford (1999) noted that in urban areas of NZ, existing overhead networks are gradually being changed
to underground systems, and new subdivisions are commonly established with underground power
October 2006
Australian timber pole resources for energy networks 59
reticulation. Many poles are still used for NZ rural networks however, with 8 to 10 m poles usually used for
240V lines, while 12 to 15 m poles are used for 11 kV lines. Poles are generally sourced from NZ
plantations, and P. radiata (radiata pine) has become the most popular species as Pinus nigra (Corsican
pine) has become less available. NZ pine poles are also sought after in Fiji, Hong Kong, the Philippines
and New Caledonia. A limited number of Pseudotsuga menziesii (Douglas fir) and Larix decidua
(European larch) poles appear in NZ networks, however the pines are preferred as they are easy to treat
with water-borne preservatives (Walford 1999).
Walford (1994) analysed data from in-grade (whole pole) bending tests and found that while distinction
needs to be made between the common NZ pole species based on their treatability, it was better to
consider the strengths of the four species collectively. Given that the strength-density relationships for
these species in NZ were not found to be significantly different, it was recommended that if any distinction
between poles is to be made it is best done on the basis of density rather than species (Walford 1994).
This approach was adopted in the code of practice for timber design (NZS 3063:1993). Individual poles
were found to vary widely in strength and stiffness depending on their density, and while several factors
influence pole density, the locality in which trees grow was found to be the most important. Walford (1994)
suggested that pole density can be determined by a survey of standing trees or for individual poles using a
non-destructive instrument like a Pilodyn™ Wood Tester (preferably before they are steamed or air-dried).
NZS 3603 (1993) classifies softwood poles into two groups based on the density of the outer 20% of their
radius, and poles can be designed to the stresses assigned to either the normal or the high density group.
Alternatively a top load capacity can be specified; however proof testing is required in this case, to ensure
poles are adequate (Walford, 1999).
Initial investigations suggest that Australian plantation-grown softwoods are potentially suitable for pole
production. Yeates, Crews et al. (2004) found that plantation-grown P. radiata and P. elliottii (slash pine)
poles were stronger than the relevant Australian Standard prescribes. In contrast, they also found that re-
growth native forest hardwoods are often weaker then the Standard prescribes. A significant size effect
was also identified for the softwood poles tested by Yeates, Crews et al. (2004), such that poles with a
larger diameter (more than 250 mm) tend to fail at lower stress than poles with smaller diameters. A
summary of some comparative strength data for poles from Australia and overseas is provided in Table 9.
Some Australian Standards relevant to timber strength have been found imprecise for natural roundwood
poles, and so considerable revisions of these documents are being undertaken (please see Sections 8.1
and 8.2 for further discussion of pole standards and specifications). Whilst further evaluations of resources
that are confi rmed to be available for pole production are recommended, there is useful initial research to
draw upon.
Recent research to characterise Australian P. radiata (radiata pine) (Cown, McKinley et al. 2006) and P.
elliottii (slash pine) resources (Harding, 2006., pers. comm.), has revealed strong relationships between
the geographical location of plantation resources and wood density. Generally, wood density increases the
closer a tree is grown to the equator, and wood density generally decreases with increasing altitude.
Overseas studies have shown that density is a critical factor influencing pole strength for Pinus species.

October 2006
Australian timber pole resources for energy networks 60
Once the relationship between in-grade pole strength and wood density is confirmed for Australian
resources, density measurements from characterisation studies can be used to identify stands Pinus
species that may be suitable for pole production. Some tests of mechanical properties have been
undertaken, but most have been focussed on measuring the stiffness (modulus of elasticity, MOE) of
sawn timber specimens or small, clear samples. Whilst stiffness and strength (modulus of rupture, MOR)
parameters are related, the mechanical properties of sawn boards are different to natural roundwood
poles and in-grade pole tests are therefore recommended.
Table 9 Comparison of standard strength and in-grade strength
Characteristic bending strength (MPa) (lower 5 th percentile MOR) Species
(number of poles tested in brackets) In-grade (full-size poles tested)
Standard (AS 1720.1)
P. radiata, radiata pine, Australia (46) 43 a 35 a
P. elliottii, slash pine, Australia (60) 43 a 40 a
P. radiata, high density > 450 kg / m3, New Zealand 52 b
P. radiata, normal density > 365 kg / m3, New Zealand 38 b
P. radiata, radiata pine, Chile (45) 39 c
P. radiata, radiata pine, Sth Africa, Site A (20) 81.1 (61.9) e
P. radiata, radiata pine, Sth Africa, Site B, (20) 63.6 (35.0) e
P. canariensis, Canary Island pine, Sth Africa, Site A,(19) 92.3 (70.5) e
P. canariensis, Canary Island pine, Sth Africa, Site B,(20) 105.4 (64.5) e
P. elliottii, slash pine, United States of America (USA) 55 d
P. resinosa (red pine), P. banksiana (jack pine) and P. contorta (lodgepole pine), USA 46 d
E. pilularis (blackbutt, re-growth) Australia (63) 55 a 80 a
Corymbia species (spotted gum, re-growth) Australia (60) 98 a 80 a a Yeates, Crews et al. (2004) b New Zealand Standard NZS 3603:1992 (1993) c Cerda and Wolfe (2003) 12 m poles (Cerda and Wolfe 2003)
d ANSI 05.1 (2002) Fifth-percentile design not currently used in the USA, considerable safety factors applied (ANSI_05.1 2002)
e Banks (1955) Different sized poles were tested. Mean strengths quoted with minimum strengths in parentheses. Minimum
strength values are most appropriate to compare with lower fifth percentile bending strengths required for modern reliability-
based design and engineering. Values converted to metric for review .
Treated P. radiata poles were included in a major pole durability research project that was established at
the Wedding Bells State Forest (WBSF) NSW in 1976. The WBSF site was selected as it was known to a
pose a high soft -rot hazard, and termites were present (Gardener 1989). Three different treatments were
tested (copper chrome arsenic salt (CCA), creosote, and pentachlorophenol (PCP)), and after 15 years
exposure at the test site all of the P. radiata poles were in good condition. On account of the sound
condition of those poles, any beneficial effect of some additional treatments that were applied to additional
treated poles could not be gauged at that time (Gardener, Simpson et al. 1994).
During the mid 1980s, 130 P. elliottii (slash pine) poles treated with copper chromium arsenic (CCA)
timber preservative were installed in Queensland networks to monitor their relative performance (Powell
2001). Powell (2001) assessed these poles along with a similar number of CCA-treated Australian

October 2006
Australian timber pole resources for energy networks 61
hardwood poles (mostly Corymbia species, spotted gum) whose exposure conditions were essentially
similar. In 2001, CCA-treated P. elliottii poles were reported to be performing better than CCA-treated
hardwoods with regard to soft-rot. Furthermore, it was noted that after 15 years service, the apparent
physical deterioration for the treated softwood poles was only marginally worse than for the treated
hardwoods.
A number of treated P. radiata poles were also installed in Victoria in the past and anecdotal evidence
suggests that they are very durable. Figure 14 shows the penetration of CCA preservative treatment in a
40 year old decommissioned P. radiata pole that had been removed from service then re-used as a fence
post (with ground-line at around the same region of the pole for each application). A chemical spot test
was used to highlight the presence of copper, which is indicated by a blue-black colour.
Figure 14 Penetration of CCA preservative near ground-line in a P. radiata pole
Ruddick, Jonsson, and Nilsson (1991), found that CCA -treatment significantly enhanced the surface-
hardness of Canadian Pinus banksiana (jack pine) and Pinus resinosa (red pine) utility poles. They also
found that the enhanced surface hardness (as determined by Pilodyn™ pin penetration) was not reduced
during a 40-year service life and that the CCA preservative was well-fixed in both species (Ruddick,
Jonsson et al. 1991).
Softwood poles are the most popular type of poles used for distribution lines in the United States of
America (USA). About 85% of these are Pinus species, about 10% are Pseudotsuga menziesii (Douglas
fir) and about 5% are Thuja plicata (Western red cedar) (Morrell, 2006., pers. comm.). Most of the pines
are P. elliottii (slash pine) but southern pines are also used (P. resinosa, red pine; P. banksiana, jack pine
and Pinus contorta, lodgepole pine). As is the case in Australia, environmental conditions differ
considerably between different regions of the USA (Scheffer 1971). American pole standards account for
this variation and there are a range of wood preservation requirements for different regions throughout the
country. The preservatives commonly used to protect softwood poles in the USA are (in order of relative
popularity) pentachlorophenol (PCP), chromated copper arsenate (CCA), creosote, copper naphthenate

October 2006
Australian timber pole resources for energy networks 62
(CN), ammoniacal copper zinc arsenate (ACZA) and ammoniacal copper quaternary (ACQ) (Morrell,
2006,. pers. comm.).
Softwoods are the most popular timber poles in energy networks throughout Europe, Canada, Sweden,
Finland & Norway are Pinus sylvestris (Scot’s pine) density 510 kg / m3. These poles are required to have
full sapwood preservative penetration, and creosote is usually used at the standard retention of 135 kg /
m3. It was reported that standard retentions are due to change soon, to accommodate changes in the type
of creosote oil currently used (Jermer, 2006., pers. comm.).
Anecdotal evidence suggests that the affects of pole-top fires may be worse for CCA-treated softwood
poles than for hardwoods. Pole-top fires are caused by the accumulation of dust and pollution on
insulators, and drizzle or heavy condensation can subsequently result in shorting that causes the pole to
ignite. The increased relative volume of treated sapwood and the reduced density of softwood poles make
them more likely to smoulder. Pole-top fires pose a significant challenge for network managers, and also
occur in hardwood poles.
Figure 15 Damage caused by pole-top fire (courtesy Mr Dennis Clancy, PowerCor Vic.)
A limited number of juvenile (diameter about 100 mm) A. cunninghamii (hoop pine) poles were previously
tested by the Department of Forestry, Division of Technical Services (former title for DPI&F Horticulture
and Forestry Science), and they were found to have a mean bending strength of 38 MPa (McNaught
1987). The lower 5th percentile bending strength was not determined for these poles. While there is very
limited information available regarding the relative performance of Australian A. cunninghamii poles, there
was one anecdotal report of preservative-treated A. cunninghammii poles being used very successfully for
energy distribution in Papua New Guinea (Pemberton, 2006., pers comm.).
Implications for utilising plantation softwood were investigated by Gough (1994) who noted that as a
general rule, P. radiata has about half the resin content of P. elliottii (slash pine), and exotic pine species
produce heavy resin deposition in response to stress or injury which may sometimes clog cutting tools.
Furthermore, the pre-treatment moisture content of A. cunninghamii logs requires monitoring to minimise
inadequate seasoning and consequent patchy preservative-penetration (Gough 1994).
October 2006
Australian timber pole resources for energy networks 63
Pre-treatment processes have been found to impact the strength of softwood poles. Walford (1994) found
that steaming poles resulted in a 15% reduction in strength, shaving poles caused a 7% strength
reduction, and machine (contour) peeling caused strength reductions that were half of that caused by
shaving softwood poles. Optimum bark removal methods need to be identified for Australian poles, as
some methods are considered inadequate by some utilities if they leave the surface of poles rough and
splintery or if aesthetics are considered inadequate.
There is much potential to optimise both plantation management and post harvest processing specifically
for pole production. Please see Section 9 for research and development recommendations.
7.2. Plantation-grown hardwoods
Potential availability of plantation-grown hardwood poles
Nolan, Washusen et al., (2005) reported that in 2003, the vast majority of the current Australian hardwood
plantation estate (about 82.6%) will not produce logs of suitable quality for utility pole production or for
most other profitable solid wood products industries. These plantations have been established and
managed to provide industry with a supplementary source of wood fibre, and are not expected to respond
to late silvicultural treatment (after about age four) in a way that would improve log quality. Knots and
other defects associated with branches are expected to be the major cause of down grade of this
plantation material for both appearance and structural applications. E. globulus (southern blue gum) is the
most common species that has been planted and very few stands are managed for sawlog production (i.e.
thinned and pruned). There are some mixed-managed plantation stands (i.e. thinned or wide spacing and
unpruned), but most plantations are managed for short -rotation fibre production (i.e. neither thinned nor
pruned).
A significant proportion of the 17.4% of plantations managed specifically for the production of sawlog-
quality timber are owned by or established in cooperation with state agencies. Most of these are young,
62% has been planted since 1995, and plantation hardwoods have an expected rotation length of 20 to
35 years. By 2035, the log availability from hardwood plantations is estimated to reach only about
376,000 m3, and at that time plantation logs are likely to make up less than 15% of the 2001 native forest
supply level (Nolan, Washusen et al. 2005).
There is a degree of uncertainty regarding the proportion of suitable logs that will be available for pole
production as the plantation hardwood industry’s production strategy is likely to focus on supplying the
high-quality and appearance hardwood market (Nolan, Washusen et al. 2005). Approximately 10.8 million
cubic metres of roundwood were harvested from Australia’s native hardwood forests in 1999 – 2000
(Attiwill, England et al. 2001).
Based on NPI research, the total volume of plantation-grown sawlog-quality hardwood that is predicted to
be available from plantations throughout Australia until 2044 is presented in Table 10 and Figure 16.
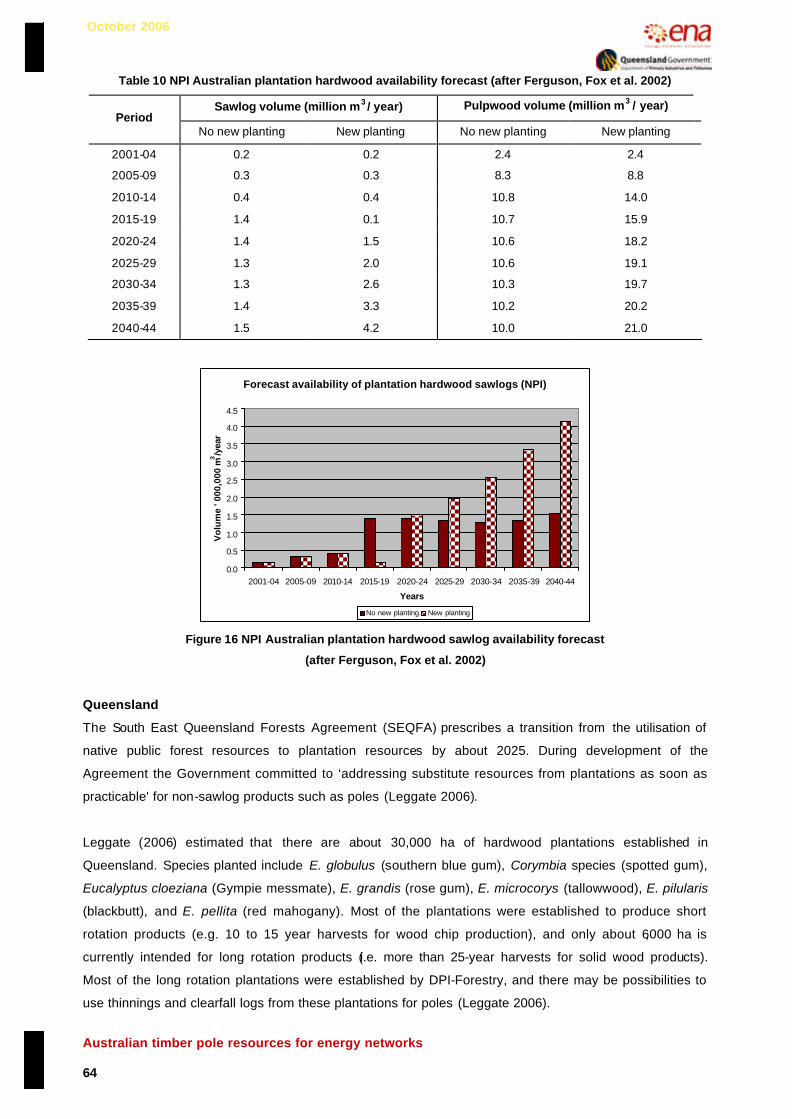
October 2006
Australian timber pole resources for energy networks 64
Table 10 NPI Australian plantation hardwood availability forecast (after Ferguson, Fox et al. 2002)
Sawlog volume (million m3 / year) Pulpwood volume (million m3 / year) Period
No new planting New planting No new planting New planting
2001-04 0.2 0.2 2.4 2.4
2005-09 0.3 0.3 8.3 8.8
2010-14 0.4 0.4 10.8 14.0
2015-19 1.4 0.1 10.7 15.9
2020-24 1.4 1.5 10.6 18.2
2025-29 1.3 2.0 10.6 19.1
2030-34 1.3 2.6 10.3 19.7
2035-39 1.4 3.3 10.2 20.2
2040-44 1.5 4.2 10.0 21.0
Forecast availability of plantation hardwood sawlogs (NPI)
0.0
0.5
1.0
1.5
2.0
2.5
3.0
3.5
4.0
4.5
2001-04 2005-09 2010-14 2015-19 2020-24 2025-29 2030-34 2035-39 2040-44
Years
Vo
lum
e ' 0
00,0
00 m
3/y
ear
No new planting New planting
Figure 16 NPI Australian plantation hardwood sawlog availability forecast
(after Ferguson, Fox et al. 2002)
Queensland
The South East Queensland Forests Agreement (SEQFA) prescribes a transition from the utilisation of
native public forest resources to plantation resources by about 2025. During development of the
Agreement the Government committed to ‘addressing substitute resources from plantations as soon as
practicable' for non-sawlog products such as poles (Leggate 2006).
Leggate (2006) estimated that there are about 30,000 ha of hardwood plantations established in
Queensland. Species planted include E. globulus (southern blue gum), Corymbia species (spotted gum),
Eucalyptus cloeziana (Gympie messmate), E. grandis (rose gum), E. microcorys (tallowwood), E. pilularis
(blackbutt), and E. pellita (red mahogany). Most of the plantations were established to produce short
rotation products (e.g. 10 to 15 year harvests for wood chip production), and only about 6,000 ha is
currently intended for long rotation products (i.e. more than 25-year harvests for solid wood products).
Most of the long rotation plantations were established by DPI-Forestry, and there may be possibilities to
use thinnings and clearfall logs from these plantations for poles (Leggate 2006).

October 2006
Australian timber pole resources for energy networks 65
Most state-managed hardwood plantations in Queensland have been established since 1999 and as such,
material suitable for the electricity distribution sector will not be available for about another 20 years. DPI-
Forestry report that the plantations of Corymbia spp (both standard spotted gum and spotted gum disease
resistant hybrid) that have been established are generally less than eight years old and consequently,
formal inventories and calculations of projected outputs have not yet been undertaken. There are some
older E. cloeziana (Gympie messmate) plantations closer to the coast, and a small amount of 250 - 300
mm diameter logs are now being harvested (Robb, 2006., pers comm.). At this stage it is not clear how
the majority of the logs produced from state-owned hardwood plantations will be distributed at maturity, as
most were established to produce sawlogs (Bragg, 2006., pers. comm.).
Based on NPI figures, if no new planting is forecast beyond 2001, the volume of plantation hardwood
available is predicted to decrease from 12,000 m3 / year in 2001 to 4,000 m3 / year by 2019. Volumes are
then expected to increase to 25,000 m3 / year by 2044. If new planting continues after 2001, the volume
available is predicted to remain unchanged until 2020 when 43,000 m3 / year are expected to be
produced. Availability is then expected to increase to 649,000 m3 / year by 2044 (Figure 17) (Ferguson,
Fox et al. 2002).
Only one or two thousand cubic metres of plantation-grown hardwood timber are predicted to be available
from the North Queensland NPI region from 2025 to 2044. If new planting continues, the volumes of
plantation hardwood timber are forecast to increase from 8,000 m3 / year in 2020 to 81,000 m3 / year by
2044 (Figure 17) (Ferguson, Fox et al. 2002).
Forecast availability of plantation hardwood sawlogs (NPI)Queensland
0
100
200
300
400
500
600
700
2001-04 2005-09 2010-14 2015-19 2020-24 2025-29 2030-34 2035-39 2040-44
Years
Vo
lum
e ' 0
00 m
3 /yea
r
S E QLD No new planting S E QLD New planting Nth Qld No new planting Nth Qld New planting
Figure 17 NPI Qld plantation hardwood availability forecasts (mixed species) (after Ferguson, Fox et al. 2002)
New South Wales
While most plantations in NSW were established for wood fibre production, there have been considerable
more recent plantings of long rotation eucalypts. These include: E. pilularis (blackbutt), E. grandis
(standard trade name rose gum, also referred to as flooded gum in NSW), Corymbia species (spotted
gum) and some E. cloeziana (Gympie messmate). State Forests New South Wales (SFNSW) reported
that they have access to about 35,000 ha of plantation that covers considerable age class, species and

October 2006
Australian timber pole resources for energy networks 66
geographical ranges. The majority of this area was planted either around 1970 or after 1994, with similar
areas covered by both groups. SFNSW is planning to clearfall much of the early short-rotation E. grandis
and E. globulus plantings in the near future, and convert them mainly to E. pilularis (Paunovic, 2006., pers.
comm.).
Based on NPI projections, the NSW North Coast and Murray Valley inventory regions are the only areas
that contain hardwood plantations of significance for solid wood production. The Plantations of Australia
Wood Availability 2001-2044 study reported that the Murray Valley region includes a range of soils and
climatic conditions, and most hardwood estates were planted with Eucalyptus globulus and E. grandis
after 1994. Given the age of the plantations, forecasts of sawlog availability for this region were
considered conservative and of limited reliability. In the period from 2001 to 2044 no significant volumes of
hardwood are expected to be available if no new planting is undertaken. If new planting is undertaken, the
volume of hardwood available is predicted to increase from 50,000 m3 / year in 2025 to 115,000 m3 / year
by 2044 (Figure 18) (Ferguson, Fox et al. 2002).
A wide variety of hardwood species have been planted throughout the North Coast region however it was
reported that scarce data was provided by private growers in the region for the Plantations of Australia
Wood Availability 2001-2044 studies. According to BRS projections, the volumes of hardwood potentially
available from this region are estimated to increase from 61,000 m3 / year in 2001 to 289,000 m3 / year by
2044. If new planting is undertaken the volume available is predicted to remain unchanged until 2030
when about 427,000 m3 / year is estimated to be available with supply likely to increase to 956,000 m3 /
year by 2044 (Figure 18) (Ferguson, Fox et al. 2002).
Forecast availability of plantation hardwood sawlogs (NPI)New South Wales (mixed species)
0
200
400
600
800
1000
1200
2001-04 2005-09 2010-14 2015-19 2020-24 2025-29 2030-34 2035-39 2040-44
Years
Vo
lum
e ' 0
00 m
3 /yea
r
Nth Coast NSW No new planting Nth Coast NSW New plantingMurray Valley No new planting Murray Valley New planting
Figure 18 NPI NSW plantation hardwood availability forecasts (mixed species) (after Ferguson, Fox et al. 2002)
NPI studies also indicated that no sawlog-quality plantation hardwood timber is likely to be available from
either the East Gippsland/Bombala region or the Central and Northern Tablelands regions if no new
planting is undertaken. On the basis of predictions by the BRS of hardwood plantations likely to be
established in these regions, it is expected that: 67,000 m3 / year may be available from the Central
Tablelands in 2035 with an increase to 112,000 m3 / year by 2044; and 19,000 m3 / year may be available

October 2006
Australian timber pole resources for energy networks 67
from the Northern Tablelands in 2035 followed by an increase to 26,000 m3 / year by 2044 Figure 19
(Ferguson, Fox et al. 2002).
Forecast availability of plantation hardwood sawlogs (NPI)New South Wales tablelands (most E. globulus)
0
20
40
60
80
100
120
2001-04 2005-09 2010-14 2015-19 2020-24 2025-29 2030-34 2035-39 2040-44
Years
Vol
ume
' 000
m3/y
ear
Nth Tablelands No new planting Nth Tablelands New planting
Central Tablelands No new planting Central Tablelands New planting
Figure 19 Plantation NPI NSW plantation hardwood availability forecasts (most E. globulus) (after Ferguson, Fox et al. 2002)
Victoria
The Plantations of Australia Wood Availability 2001-2044 study reported that two species dominate
plantations in the Central Gippsland region. Eucalyptus regnans (mountain ash) plantations were planted
between 1955 and 1985 and are well established. In contrast, E. globulus (southern blue gum) plantations
were established after 1990. There have been small plantings of other species, however E. nitens (shining
gum) is the only species that has been planted in significant amounts. It was noted that forecasts of
sawlog availability for this region were considered uncertain, as limited data was available from the
Central Gippsland region. In the period from 2001 to 2014 no significant volumes of hardwood are
expected to be available. If no new planting occurs, the volume of hardwood estimated to be available is
expected to increase from 59,000 m3 / year in 2001 to 85,000 m3 / year by 2019. The volume available is
then predicted to decrease to 40,000 m3 / year by 2044. If new planting is undertaken, the volume is
predicted to remain unaffected until 2030, when 69,000 m3 / year are predicted to be available, with an
increase to 71,000 m3 / year predicted by 2044 (Figure 20) (Ferguson, Fox et al. 2002).
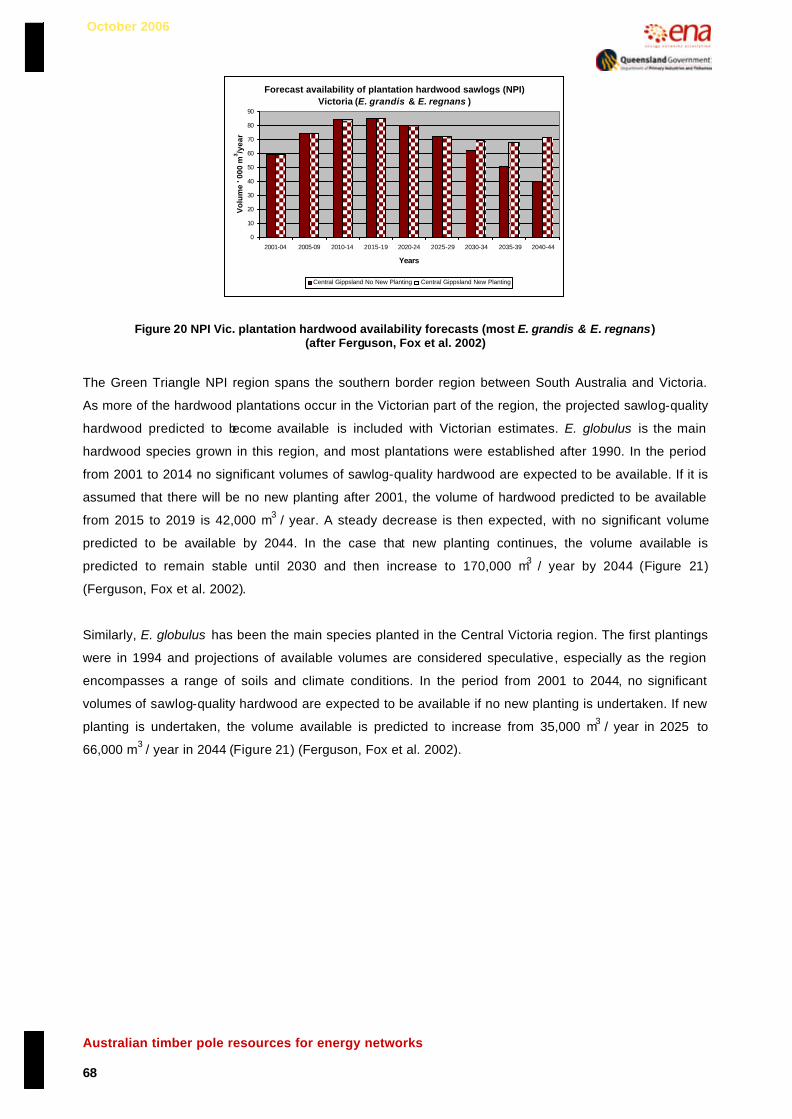
October 2006
Australian timber pole resources for energy networks 68
Forecast availability of plantation hardwood sawlogs (NPI)Victoria (E. grandis & E. regnans )
0
10
20
30
40
50
60
70
80
90
2001-04 2005-09 2010-14 2015-19 2020-24 2025-29 2030-34 2035-39 2040-44
Years
Vo
lum
e ' 0
00 m
3 /yea
r
Central Gippsland No New Planting Central Gippsland New Planting
Figure 20 NPI Vic. plantation hardwood availability forecasts (most E. grandis & E. regnans) (after Ferguson, Fox et al. 2002)
The Green Triangle NPI region spans the southern border region between South Australia and Victoria.
As more of the hardwood plantations occur in the Victorian part of the region, the projected sawlog-quality
hardwood predicted to become available is included with Victorian estimates. E. globulus is the main
hardwood species grown in this region, and most plantations were established after 1990. In the period
from 2001 to 2014 no significant volumes of sawlog-quality hardwood are expected to be available. If it is
assumed that there will be no new planting after 2001, the volume of hardwood predicted to be available
from 2015 to 2019 is 42,000 m3 / year. A steady decrease is then expected, with no significant volume
predicted to be available by 2044. In the case that new planting continues, the volume available is
predicted to remain stable until 2030 and then increase to 170,000 m3 / year by 2044 (Figure 21)
(Ferguson, Fox et al. 2002).
Similarly, E. globulus has been the main species planted in the Central Victoria region. The first plantings
were in 1994 and projections of available volumes are considered speculative, especially as the region
encompasses a range of soils and climate conditions. In the period from 2001 to 2044, no significant
volumes of sawlog-quality hardwood are expected to be available if no new planting is undertaken. If new
planting is undertaken, the volume available is predicted to increase from 35,000 m3 / year in 2025 to
66,000 m3 / year in 2044 (Figure 21) (Ferguson, Fox et al. 2002).

October 2006
Australian timber pole resources for energy networks 69
Forecast availability of plantation hardwood sawlogs (NPI)Victoria (E. globulus )
0
50
100
150
200
250
300
350
2001-04 2005-09 2010-14 2015-19 2020-24 2025-29 2030-34 2035-39 2040-44
Years
Vol
ume
' 000
m3 /y
ear
Central Victoria No new planting Central Victoria New planting
Green Triangle No new planting Green Triangle New planting
Figure 21 NPI Vic. plantation hardwood availability forecasts (most E. globulus) (after Ferguson, Fox et al. 2002)
The Murray Valley NPI encompasses the south-eastern border region between New South Wales and
Victoria, however for the purposes of this review Murray Valley totals are discussed with New South
Wales Totals.
Australian Capital Territory
If no new planting is undertaken, it is predicted that there will be no plantation hardwood timber of sawlog-
quality available from the Southern Tablelands region up to 2044. Based on BRS forecasts for hardwood
plantations likely to be established in the Southern Tablelands, it is predicted that 6,000 m3 / year may be
available in 2035 with an increase to 10,000 m3 / year by 2044 (Figure 22) (Ferguson, Fox et al. 2002).
Forecast availability of plantation hardwood sawlogs (NPI)South Australia & ACT
0
2
4
6
8
10
12
14
2001-04 2005-09 2010-14 2015-19 2020-24 2025-29 2030-34 2035-39 2040-44
Years
Vo
lum
e ' 0
00 m
3/y
ear
Lofty Block No new planting Lofty Block New planting
Southern Tablelands No new planting Southern Tablelands New planting
Figure 22 NPI SA and ACT plantation hardwood availability forecasts (after Ferguson, Fox et al. 2002)
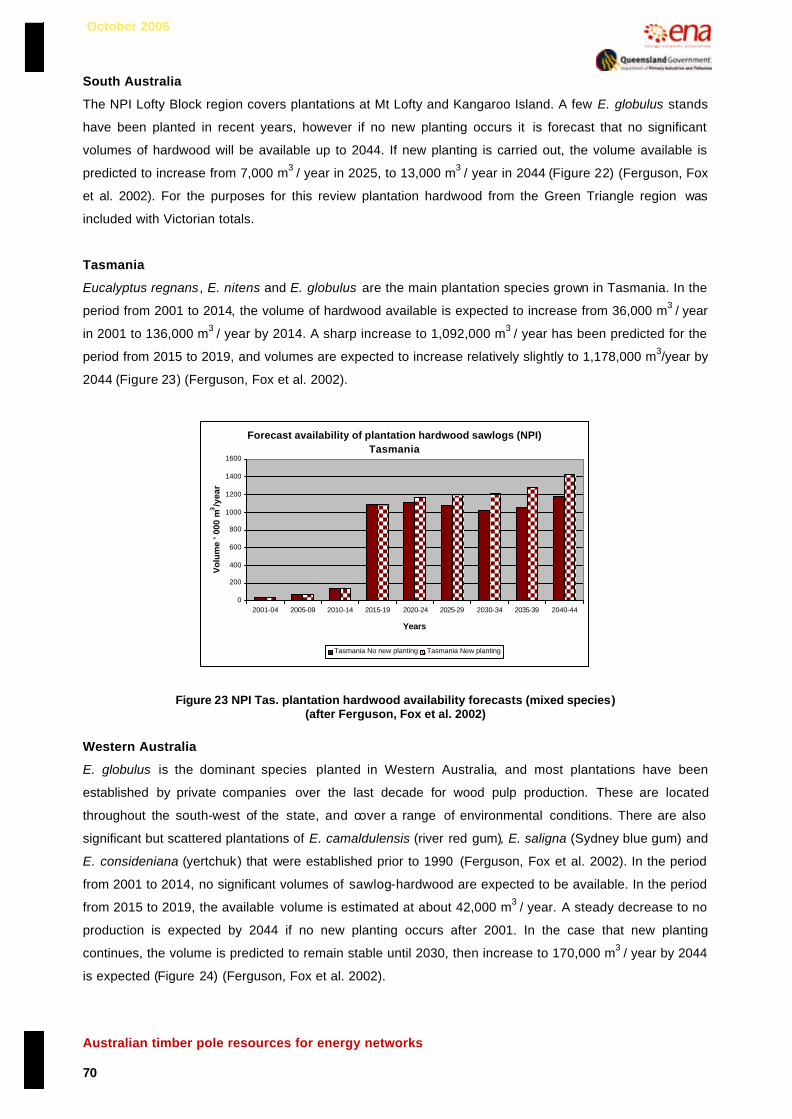
October 2006
Australian timber pole resources for energy networks 70
South Australia
The NPI Lofty Block region covers plantations at Mt Lofty and Kangaroo Island. A few E. globulus stands
have been planted in recent years, however if no new planting occurs it is forecast that no significant
volumes of hardwood will be available up to 2044. If new planting is carried out, the volume available is
predicted to increase from 7,000 m3 / year in 2025, to 13,000 m3 / year in 2044 (Figure 22) (Ferguson, Fox
et al. 2002). For the purposes for this review plantation hardwood from the Green Triangle region was
included with Victorian totals.
Tasmania
Eucalyptus regnans , E. nitens and E. globulus are the main plantation species grown in Tasmania. In the
period from 2001 to 2014, the volume of hardwood available is expected to increase from 36,000 m3 / year
in 2001 to 136,000 m3 / year by 2014. A sharp increase to 1,092,000 m3 / year has been predicted for the
period from 2015 to 2019, and volumes are expected to increase relatively slightly to 1,178,000 m3/year by
2044 (Figure 23) (Ferguson, Fox et al. 2002).
Forecast availability of plantation hardwood sawlogs (NPI)Tasmania
0
200
400
600
800
1000
1200
1400
1600
2001-04 2005-09 2010-14 2015-19 2020-24 2025-29 2030-34 2035-39 2040-44
Years
Vo
lum
e ' 0
00 m
3/y
ear
Tasmania No new planting Tasmania New planting
Figure 23 NPI Tas. plantation hardwood availability forecasts (mixed species) (after Ferguson, Fox et al. 2002)
Western Australia
E. globulus is the dominant species planted in Western Australia, and most plantations have been
established by private companies over the last decade for wood pulp production. These are located
throughout the south-west of the state, and cover a range of environmental conditions. There are also
significant but scattered plantations of E. camaldulensis (river red gum), E. saligna (Sydney blue gum) and
E. consideniana (yertchuk) that were established prior to 1990 (Ferguson, Fox et al. 2002). In the period
from 2001 to 2014, no significant volumes of sawlog-hardwood are expected to be available. In the period
from 2015 to 2019, the available volume is estimated at about 42,000 m3 / year. A steady decrease to no
production is expected by 2044 if no new planting occurs after 2001. In the case that new planting
continues, the volume is predicted to remain stable until 2030, then increase to 170,000 m3 / year by 2044
is expected (Figure 24) (Ferguson, Fox et al. 2002).

October 2006
Australian timber pole resources for energy networks 71
Forecast availability of plantation hardwood sawlogs (NPI)Western Australia
0
20
40
60
80
100
120
140
160
180
2001-04 2005-09 2010-14 2015-19 2020-24 2025-29 2030-34 2035-39 2040-44
Years
Vol
ume
' 000
m3 /y
ear
WA No new planting WA New planting
Figure 24 NPI WA plantation hardwood availability forecasts, (mixed species) (after Ferguson, Fox et al. 2002)
Northern Territory
Current hardwood plantations in the Northern Territory region are intended for the production of pulpwood
only, and most are of Acacia mangium (brown salwood). If no new planting is undertaken, it is predicted
that there will be no plantation hardwood of sawlog-quality available up to 2044. If new plantings occur, it
is predicted that 10,000 m3 / year will become available in 2020 and this volume may increase to 158,000
m3 / year by 2044 (Figure 25) (Ferguson, Fox et al. 2002).
Forecast availability of plantation hardwood sawlogs (NPI)
Northern Territory
0
20
40
60
80
100
120
140
160
180
2001-04 2005-09 2010-14 2015-19 2020-24 2025-29 2030-34 2035-39 2040-44
Years
Vo
lum
e ' 0
00 m
3 /yea
r
Northern Territory No new planting Northern Territory New planting
Figure 25 NPI NT plantation hardwood availability forecasts (after Ferguson, Fox et al. 2002)
Performance of plantation-grown hardwood poles
There is limited information available regarding the performance of Australian plantation-grown hardwood
poles, and further resource characterisation studies specifically focussed on pole production are required.
Some data from studies of native forest re-growth resources have been included in this section for
comparison, and these are further discussed in Section 8.2, Revision of standards and specifications.

October 2006
Australian timber pole resources for energy networks 72
As part of an extensive review of eucalypt plantations for the production solid wood products in Australia,
Nolan, Washusen et al., (2005) gathered the findings of hardwood resource characterisation research,
and in consultation with researchers active in the field of plantation hardwood processing and use, they
discussed the following findings:
E. globulus (southern blue gum) is a durability class 3 species. Most E. globulus plantations have been
managed for fibre production, and it is therefore unlikely that they will yield a significant proportion of logs
that are suitable for the production of most solid wood products. Plantation resources managed for fibre
production are expected have a high frequency of knots, branch defects and tension wood. Moreover,
there have been anecdotal reports that E. globulus poles are prone to splitting. In contrast, logs from
mixed-managed stands of E. globulus or plantations managed for sawlog production are expected to have
suitable physical characteristics for the manufacture of solid wood products.
A larger proportion of plantations of higher-durability hardwood species are managed for sawlog
production. The durability class 1 and 2 species planted include E. pilularis (blackbutt), E. cloeziana
(Gympie messmate) and C. citriodora and C. maculata (spotted gum). They are all expected to have very
good form and physical properties provided stands are managed for sawlog production, and all are
expected to be very suitable for pole production (Nolan, Washusen et al. 2005). If these species were
grown in mixed-managed stands (i.e. thinned or wide spacing and unpruned) they may be suitable for pole
production, however further investigation is required.
The strength of twenty-one plantation-grown Eucalyptus microcorys (tallowwood) poles was determined
through in-grade tests undertaken by Yeates, Crews et al. (2004). These poles were treated with CCA
and fifth-percentile design strengths were calculated from in-grade test data that were normalised to a
250 mm ground-line diameter equivalent (Yeates, Crews et al. 2004). Table 11 presents comparative
strength data from that study, for plantation-grown E. microcorys poles along with three common eucalypt
pole species that were obtained from native forest re-growth. At first glance, the strength measures for E.
microcorys appear much lower than would be expected, but it is very important to consider that only
large-diameter poles were tested. Before the normalisation equation was applied, the difference between
the fifth percentile characteristic bending strengths for the large diameter E. microcorys and large-
diameter E. pilularis (blackbutt) poles was only one MPa. After the generalised normalisation calculation
was applied however, there was an 11 MPa difference between the characteristic bending strengths for
those two species. This highlights the need for further testing to refine the normalisation equation for
different resources.
Yeates, Crews et al. (2004) identified a statistically significant reduction in strength (MOR) for larger-sized
Corymbia spp (spotted gum) and E. pilularis (blackbutt) poles. They observed a similar trend for
Eucalyptus species (grey ironbark) and E. microcorys (tallowwood) poles however their sample size was
not sufficient to permit statistical analysis. Please see Section 8.2, Revision of standards and
specifications for further discussion of the size effect for timber poles.

October 2006
Australian timber pole resources for energy networks 73
Table 11 In-grade and standard pole strengths (after Yeates, Crews et al. (2004))
Characteristic bending strength (MPa) (lower 5 th percentile MOR) Speciesa
(number of poles subjected to in-grade tests in brackets) In-grade
(full-size poles tested) In-grade
(full-size poles tested)
E. microcorys tallowwood, plantation (21) 44c 80
E. pilularis blackbutt, re-growth (63) 55 80
Corymbia species d spotted gum, re-growth (60) 98 80
Eucalyptus species e grey ironbark, re-growth (19) 70b 100 a Poles had CCA -treated sapwood b Yeates, Crews et al., 2004.
c Strengths not considered representative; only small number of large-diameter poles tested d Corymbia species were C. maculata and C. citriodora e Eucalyptus species were E. drepanophylla, and E. paniculata
Plantations of sub-tropical hardwoods have been successfully established in South Africa, China, India
and throughout South America. While most plantations were established to provide fuel wood or wood
fibre, there are major efforts worldwide to establish and manage eucalypt plantations for the production of
high-value solid wood products (Hopewell 2002). In general research has indicated that the high
incidence of defects common throughout current plantation eucalypt resources are likely to limit the
commercial viability of production of high-value solid wood products, especially from younger trees. Knot
defects (including loose knots, decayed knots and knotholes) are a common problem, and improved
stand management, including scheduled thinning and pruning, is expected to enhance the commercial
viability of young eucalypt plantations (Hopewell 2002). It has also been suggested that innovative post-
pruning treatments would improve grade recoveries by preventing post-pruning decay (Hopewell 2002).
Further developments of practical procedures to identify stems that meet pole product criteria are
desirable, as are post harvest processes to manage and track logs intended for pole production. The use
of non-destructive evaluation techniques, such as those that measure acoustic properties, is increasing in
forest operations and further development and calibration of these tools is recommended (Harding, 2006,
pers. comm.; Dickson, Raymond et al. 2003). (Dickson, Raymond et al. 2003)
According to Malan (1995), eucalypts were introduced to South Africa almost 100 years ago, and
approximately 72 % of South Africa’s current eucalypt plantations were planted with Eucalyptus grandis.
About 85 % of the wood produced from E. grandis plantations is consumed by pulp and mining industries
and 15 % is used for the production of sawn timber or poles. High levels of growth stress that result in
splitting are the most serious growth phenomenon in South African eucalypts, and work is underway to
change and improve the quality of the South African E. grandis resource to optimise its utilisation
potential. Research has shown that genetic factors have a significant effect on the development of
growth-stress-related defects, and there is much potential for improvement of resources through tree-
breeding programs (Malan 1995).
Malan (1995) reviewed research undertaken to identify methods to reduce growth-stress-related defects,
and found that a number of techniques have been developed to treat trees prior to felling or cross-cutting.

October 2006
Australian timber pole resources for energy networks 74
Girdling Eucalyptus camaldulensis trees then leaving them to stand was found to reduce growth-stress-
related defects by 50%, however this technique was found unsuccessful for other species. Further
research found a significant reduction in split development two months after girdling, but the study was
terminated due to stem degrade due to drying and borer damage. Interestingly, after a nine-month study,
a tree that was inadequately girdled had the most significant reduction in growth-stress-related defects,
suggested to be the result of that tree reaming at a relatively constant moisture content over the study
period without any growth of its diameter. The use of a defoliant spray to retard tree growth before
harvest was tested, and although a 20 % reduction in growth-stress-related defects was achieved, a high
level of individual variability was observed. It has been suggested that partial alleviation of growth stress
caused by killing trees then leaving them stand may be the result of reductions in moisture content. Malan
(1995) also noted that a considerable reduction in splitting was reported in dead or growth-retarded E.
grandis trees that had been subjected to severe drought, even for logs from compartments known for
severe splitting problems (Malan 1995).
Although little is known about the effect of felling practices on end-split development, Malan (1995),
explained that it is generally believed that felling should be done in the direction where the softest fall
would result, rather than in the direction or the lean. Furthermore, trees, logs or other objects on the
ground should be avoided in order to reduce felling defects such as felling shakes and minute internal
fractures that could aggravate the development of splits through partial release of growth stresses.
Cutting techniques have also been developed to minimise the bending moment when trees fall and
slanted cuts have been used to minimise the destructive effect of growth stresses.
Malan (1995) reported that studies undertaken around the world indicate that end-splitting can be
reduced considerably by cutting a circumferential groove with a chain saw on either side of the position of
cross-cutting for log making. Kerf-cutting has also been found useful to control end-split development in
South African E. grandis logs. A groove depth equal to 1/3 of the log radius was found to be best in one
study, cut at a distance of approximately 1 ½ times the log radius from the point where the cross-cut is to
be made. Other researchers found that kerfs 1/3 of a log’s diameter were most effective if cut to a
distance from the end face approximately 0.2 to 0.3 times the log diameter. Cutting grooves in the pith-
zone of the stem has been reported successful in some cases, and certain combinations of special cuts
and banding pressure have also been identified. To improve bending techniques, PVC and nylon
restraining devices have been designed which, in contrast with metal devices, can be attached to the
stem before cutting.
With regard to log transportation, Malan (2000) noted that in view of felling impacts on split development,
there can be no doubt that impacts during harvesting, loading, transportation and off-loading all influence
the condition of logs when they reach the processing plant. Drying stresses have been found to interact
with the release of growth stresses to produce radial splits, and while water and heat aids stress
relaxation, full stress relaxation by steaming or heating is a long process and therefore impractical and
expensive for eucalypts (Malan).
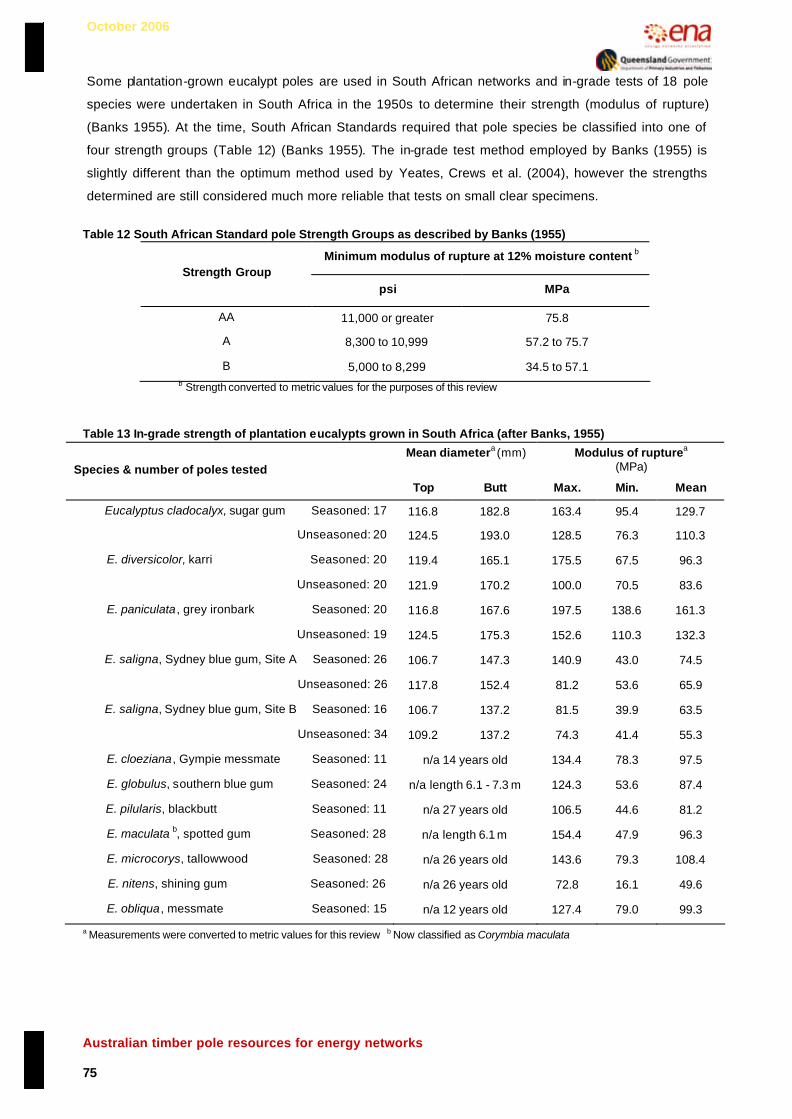
October 2006
Australian timber pole resources for energy networks 75
Some plantation-grown eucalypt poles are used in South African networks and in-grade tests of 18 pole
species were undertaken in South Africa in the 1950s to determine their strength (modulus of rupture)
(Banks 1955). At the time, South African Standards required that pole species be classified into one of
four strength groups (Table 12) (Banks 1955). The in-grade test method employed by Banks (1955) is
slightly different than the optimum method used by Yeates, Crews et al. (2004), however the strengths
determined are still considered much more reliable that tests on small clear specimens.
Table 12 South African Standard pole Strength Groups as described by Banks (1955)
Minimum modulus of rupture at 12% moisture content b Strength Group
psi MPa
AA 11,000 or greater 75.8
A 8,300 to 10,999 57.2 to 75.7
B 5,000 to 8,299 34.5 to 57.1 b Strength converted to metric values for the purposes of this review
Table 13 In-grade strength of plantation eucalypts grown in South Africa (after Banks, 1955)
Mean diametera (mm) Modulus of rupturea (MPa) Species & number of poles tested
Top Butt Max. Min. Mean
Eucalyptus cladocalyx, sugar gum Seasoned: 17 116.8 182.8 163.4 95.4 129.7
Unseasoned: 20 124.5 193.0 128.5 76.3 110.3
E. diversicolor, karri Seasoned: 20 119.4 165.1 175.5 67.5 96.3
Unseasoned: 20 121.9 170.2 100.0 70.5 83.6
E. paniculata, grey ironbark Seasoned: 20 116.8 167.6 197.5 138.6 161.3
Unseasoned: 19 124.5 175.3 152.6 110.3 132.3
E. saligna, Sydney blue gum, Site A Seasoned: 26 106.7 147.3 140.9 43.0 74.5
Unseasoned: 26 117.8 152.4 81.2 53.6 65.9
E. saligna, Sydney blue gum, Site B Seasoned: 16 106.7 137.2 81.5 39.9 63.5
Unseasoned: 34 109.2 137.2 74.3 41.4 55.3
E. cloeziana, Gympie messmate Seasoned: 11 n/a 14 years old 134.4 78.3 97.5
E. globulus, southern blue gum Seasoned: 24 n/a length 6.1 - 7.3 m 124.3 53.6 87.4
E. pilularis, blackbutt Seasoned: 11 n/a 27 years old 106.5 44.6 81.2
E. maculata b, spotted gum Seasoned: 28 n/a length 6.1 m 154.4 47.9 96.3
E. microcorys, tallowwood Seasoned: 28 n/a 26 years old 143.6 79.3 108.4
E. nitens, shining gum Seasoned: 26 n/a 26 years old 72.8 16.1 49.6
E. obliqua, messmate Seasoned: 15 n/a 12 years old 127.4 79.0 99.3
a Measurements were converted to metric values for this review b Now classified as Corymbia maculata

October 2006
Australian timber pole resources for energy networks 76
The findings of strength characterisation studies of plantation eucalypts grown overseas are useful to
gauge the feasibility of using them as a sustainable pole resource. As it is widely accepted that timber
properties can vary significantly between trees of the same species that are grown in different
environments, it is important that research be undertaken to characterise Australian resources.
Nolan, Washusen et al., (2005)10 reviewed relevant silvicultural research and summarised the following
requirements for growing sustainable plantation hardwood resources in Australia for the production of
solid wood products:
• Select species that have growth and wood quality characteristics suited to producing solid wood
products on relatively short rotation times;
• Plant selected trees on high quality sites at a relatively high initial stocking;
• Prune trees several times from an early age (about age 2 to 3) to reduce the size of the knotty core
and encourage growth of clear wood;
• Reduce the number of trees on the site11 severely (to about 150 to 250 stems per hectare) before
canopy closure;
They also noted that growing trees to a suitable diameter takes about 35 years depending on the
characteristics of the trees and the site as well as the required characteristics of the end product (Nolan,
Washusen et al. 2005). Shorter rotation lengths are likely to be suitable to produce logs intended for pole
production.
7.3. Timber composite structures
Glued or mechanically connected timber composite poles are becoming more popular in Australia and
there is much potential for further development. There are several composite technologies and pole
design options that are very favourable for producing poles from shorter-length logs. The use of shorter-
rotation plantation logs is favourable to pole producers and would allow better utilisation of the shorter-
length native forest-grown poles that are reported to be more readily available in some cases. Shorter
poles are favourable for pole manufacturers and suppliers as more than one log may fit within the length
of preservative -treatment vessels and shorter poles are more convenient to handle.
Research and development to identify and develop alternative timber pole materials has also been
undertaken overseas. Small-scale wood-fibre composite poles have been manufactured but few economic
analyses have been performed, and no evidence could be found that have been commercialised.
Compoles™ were developed in the USA, and manufactured from preservative-treated wood flakes of
mixed species origin that were bonded with synthetic adhesives. Preliminary experiments showed that
strength of the poles was greater when: a high proportion of the flakes were aligned; isocyanate (as
10 For further detailed information please see Eucalypt plantations for solid wood products in Australia – a review, ‘if
you don’t prune it, we can’t use it’, Nolan et al., (2005), which can be downloaded at no cost from the Forest and
Wood Products Research and Development Corporation (FWPRDC) website. 11 The process of reducing the number of trees per unit area is commonly referred to as ‘thinning’

October 2006
Australian timber pole resources for energy networks 77
opposed to phenol-formaldehyde) adhesives are used; and the preservative used is an organic one, such
as PCP, as opposed to inorganic salts (Adams, Krueger et al. 1981). These poles were never
commercialised (Shupe, 2006., pers. comm.).
Mechanically connected poles
Marzouk, Hosain, and Neis (1978) noted that whilst hollow spun-cast concrete poles were considered
adequate for energy distribution applications, they were not preferred in Canada as their cost was greater
than for timber poles and they were three times heavier. They investigated four composite pole designs to
utilise limited-length Pinus banksiana (jack pine) pole material. These were: splicing two pine poles with a
steel connecting device, building up a pole of sufficient height by strapping three or four logs together,
building plane frames with spliced logs, and constructing ‘composite poles’ consisting of a top portion
made of pine and a bottom portion made of concrete. The various connections were tested in-grade and
they concluded that spliced poles secured with a circular steel sleeve and the spliced-pole plane frame (A -
frame and H-frame) designs were structurally suitable substitutes for timber distribution poles.
Four different types of steel connecting devices were tested to secure the spliced poles: a bolted sleeve; a
bolted splice; a square steel tube; and a circular steel sleeve. The circular steel sleeve had the best
structural qualities and its installation was considered very simple. For the A-frame and H-frame designs,
bolted lap-joints were used for the pole splices and they were secured with two 3/4 in. (19.05 mm) high-
strength machine bolts and four 2 5/8 in. (66.67 mm) diameter shear plates. The circular steel sleeve was
considered excessive for the frame application. These frames were suggested to be utilised where space
is not an issue, such as for rural lines.
Strapping logs together was found to be inadequate, as the final product was susceptible to excessive
deflection and premature shear separation. The ‘composite poles’ in this study consisted of a 20ft (6.1 m)
P. banksiana (jack pine) pole top-portion and a reinforced concrete cylinder lower-portion, and nails and
bolts were used as shear connectors between the wood and concrete. This assembly was tested and
found to be structurally sound, however handling, transport, climbing and durability issues lead to the
conclusion that this design was probably unsuitable (Marzouk, Hosain et al. 1978).
Softwood poles joined with steel connecting devices have been commercialised in New Zealand. TTT
Products New Zealand manufacture tapered UniLog™ poles, which can be joined with metal connectors
to produce poles up to 480 mm in diameter and 15 m long. Given that there is a ready supply of long poles
in NZ, not many spliced poles are produced, however they have been used on occasions when poles are
lifted by helicopter and joined at place of installation (e.g. for environmentally sensitive locations). TTT
more commonly produce structures such as cell phone towers, and they mainly use 200 mm and 125 mm
diameter UniLogs™. Figure 26 shows two UniLog™ towers, 30 m in height. The connectors are
commonly made from 3.0 mm galvanised steel, and a preservative treatment is applied to the joint. TTT
report that based on their tests, the joint is stronger than the pole and those in-service have shown no
signs of deterioration. They also reported that the cost of two short poles and the connector is about 10%
more than for a full length pole (Reelick, 2005., pers. comm.).

October 2006
Australian timber pole resources for energy networks 78
Figure 26 UniLog™ softwood pole towers (courtesy Mr John Reelick, TTT Products)
Composite poles consisting of a timber upper-portion and a steel and concrete butt that forms the in-
ground portion are becoming more common in Australia. Pole Rebutting Australia Pty Ltd report that utility
poles were first rebutted in Australia approximately 20 years ago, and the process was subsequently
commercialised (Figure 27 and Figure 28). Pole Rebutting Australia uses two different types of stubs,
caissons and sliding sleeves. Caissons are full-length steel tubes that are part-filled with concrete. They
are usually used in the construction of new poles and during pole reinstatements when poles can be lifted
and temporarily moved horizontally. Sliding steel sleeves are generally only used for pole reinstatement in
relatively rare instances when poles cannot be moved (e.g. if they have a stay wire attached). In this case,
a relief hole is excavated and the lower portion of the composite pole consists of a pre-cast reinforced
concrete butt over which a steel sleeve is fitted. Applying a sliding sleeve requires a greater capital outlay.
Pole Rebutters Australia offer a 15 year guarantee on their stubs, and note the importance of optimum
joint design, including features such as adequate drainage, to protect timber at the butt-joint from
conditions conducive to decay (Cowey, 2006., pers. comm.).

October 2006
Australian timber pole resources for energy networks 79
Figure 27 Newly installed rebutted poles (courtesy Mr Doug Cowey, Pole Rebutters Australia)
Figure 28 Rebutted pole in-service for 20 years (courtesy Mr Doug Cowey, Pole Rebutters Australia
Rebutted poles were originally intended to prolong the useful-life of poles in-service, which have begun to
deteriorate at or below ground-line while their upper portion remains sound. Due to current shortages of
longer native hardwood poles however, rebutted poles are beginning to be used to construct new
composite poles, with the steel and concrete butt allowing poles of the required lengths to be constructed.
Pole Rebutters Australia along with pole treaters and consumers are planning research and development
activities to provide limit-state data for the strength of rebutted poles (based on in-grade tests), and to
investigate options for alternative timber upper-pole portions (Cowey, 2006., pers. comm.).
Plane-frame composite poles, mostly H-frames, are commonly used in networks in the USA, however they
were more popular in the past (Figure 29) (Morrell, 2006., pers. comm.).
Figure 29 Typical softwood H-frame in-service in the USA (Courtesy Prof. Jeff Morrell, Oregon State University)

October 2006
Australian timber pole resources for energy networks 80
Glued-laminated (glulam) poles
Common adhesives such as phenol-formaldehyde and phenol-resorcinol-formaldehyde are known to
perform very well, and have proven performance outdoors. Major impediments to the production of
durable glulam poles in the past have been associated with the interaction of the adhesives and CCA
preservative. CCA -treated laminates do not always glue well, and CCA treatment of a glulam member in
its final form is inefficient. Modern copper based preservatives with alternative formulations however show
much promise to alleviate the problem as timber treated with these products bonds well (Kennedy, 2006.,
pers. comm.).
While glulam products are gaining popularity for structural applications in Australia, only a small number of
glulam poles are currently manufactured. Laminated Timber Supplies manufacture glulam flagpoles made
of Callitris glaucophylla (white cypress) or Eucalyptus marginata (jarrah). It currently costs about $2,500 /
m3 for C. glaucophylla glulam, $1,500 / m3 for untreated P. elliottii (slash pine) glulam, and about $1,370 /
m3 for untreated P. radiata (radiata pine). The cost of preservative-treated glulam for above-ground
applications (hazard class 3) is about 30% more than the untreated product; $1,950 / m3 for LOSP-treated
P. elliottii (slash pine) glulam and about $1770 / m3 for LOSP-treated P. radiata (radiata pine). It has been
noted however, that the scale of manufacturing operations and the cost of transporting timber to the
manufacturer have a strong influence on glulam prices (Bell, 2006., pers comm.). There are many design
options for glulam poles, including hollow structures, such as those used in Europe, and a range of timber
species could potentially be used.
Martinsons Group AB in Sweden currently produces Comwood™ glulam poles. These poles are used for
applications such as streetlights, cell-phone masts and for energy networks (Figure 30). Comwood™
poles can be produced to a maximum height of 27 m with a maximum diameter of 1200 mm, and the pole
wall thickness ranges from 32 to 140 mm. The cost of a 24 m Comwood™ pole is about 2100 Euro
(approximately $3400 AUD), and these poles can be treated with CCA or creosote, and conform to
Swedish Strength Class k 30 (Lindgren, 2006., pers. comm.). According to the Swedish Building Code, the
characteristic bending strength values (lower fifth-percentile) for strength class k 30 is 30 MPa and the
characteristic modulus of elasticity parallel to the grain is 12 000 MPa (Brundin, 2006., pers. comm.).
Some glulam poles are also used in the USA, but they are not common and generally used where there is
a restricted right of way. They can be used in a variety of locations and are advantageous because they
can be cambered and do not need to be guyed (Morrell, 2006., pers. comm.).
The performance of glulam poles has also been investigated. Bergman (1998) reported on a field trial in
which a total of 36 glued laminated poles were installed in-ground in 1979 at three different locations in
Sweden. The poles were constructed using 8 x 45 mm laminates of Pinus sylvestris (Scot’s pine) that
were treated with CCA. It was noted though that the laminates had been dried too quickly and
considerable checking developed. Ten replicate poles underwent the following additional treatments:
creosote after incising; creosote without incising; CCA after incising; or surface-treated with cuprinol stain.
A phenol-resorcinol adhesive with 20% hardener was used and allowed to cure for 12 hours at 40°C and

October 2006
Australian timber pole resources for energy networks 81
under 0.8 MPa pressure. The test poles were inserted into the ground to a depth of 0.5 m. One of the
exposure sites was inside a greenhouse where the poles were sprinkled with water once a week, and a
temperature of 15 to 20° C was maintained in winter and 20 to 40° C in summer. The other two field sites
were considerably colder, and not surprisingly the poles performed best at these sites with 13 out of 16
poles free from sapwood decay after 18 years exposure, and only slight decay in the other three poles.
Slight decay was also observed in the heartwood of the outer laminates of 11 poles at these locations.
The greenhouse site presented very high decay hazard conditions and all glulam poles except those that
had an additional creosote treatment had considerable decay. Overall they found that the heartwood in the
outer laminates was the most susceptible to decay and suggested that it should be avoided in outer
laminates if possible. No difference between incised poles could be determined in 1998, and the CCA with
creosote treated samples were reported as continuing to perform very well (Jermer 2006 pers comm.).
Figure 30 Comwood™ poles (Courtesy Mr Daniel Wiklund, Martinsons Group AB)
While there has been limited research published regarding glulam poles, research in Canada has revealed
that glulam railway sleepers perform well in-service. Holsi, Doyle et al. (1999) reported on 32 glulam
railway sleepers that had been installed into working railway lines in Canada in 1947. They consisted of a
top 7/8” (22 mm) thick Betula alleghaniensis (yellow birch) lamination with a Pinus banksiana (jack pine)
body of either five full width laminations 9” (229 mm) or seven layers of 7/8” thick edge-glued and end-
jointed material. A phenol-resorcinol adhesive was used to bond the laminations, and most underwent
dielectric heating for 30 minutes to accelerate adhesive setting. The sleepers were then incised on their
top and bottom faces then pressure-treated using 50% creosote dissolved in pole treating oil to a retention
of 130 kg / m3. The sleepers were installed into two separate railway lines, and eight five-layer sleepers
and eight seven-layer sleepers at each site. The glulam sleepers were spaced at random along several
hundred metres of track amongst standard sleepers and did not receive any preferential handling. A 50
year service-life was projected for the glulam sleepers, which was approximately double that of the solid
wood controls installed at the same time, and they were assessed periodically for checking, splitting,
decay, delamination and plate-cutting. Holsi, Doyle et al. (1999) suggested that sleepers constructed with

October 2006
Australian timber pole resources for energy networks 82
two hardwood faces and a softwood body have an expected service-life of more than 60 years in a main-
line track provided that they are turned over after approximately 30 years in-service. Furthermore the
glulam sleepers were considered superior due to their resistance to checking, splitting and spike-holding
capacity in contrast to the controls (Holsi, Doyle et al. 1999).

October 2006
Australian timber pole resources for energy networks 83
8. Timber pole performance
8.1. Overview of current pole standards and specifications
Most energy providers in Australia classify timber poles according to their length and strength. Pole
lengths are measured in 1.5-metre increments ranging from about 8 m to 24.5 m. The ‘tip load’ system is
most commonly used to calculate pole strength classifications. The ultimate ‘tip load’ assigned to a pole
represents the maximum force in kilo-Newtons (kN), applied at a pole’s top (or ‘tip’), above which the pole
may not maintain its structural integrity. There are some differences in standard tip loads between States,
and many energy providers’ specifications use tip loads that are calculated based on working stress
principles and timber properties assigned using the strength group / stress grade system in Australian
Standard AS 1720.1 (1997). A number of other Standards also apply to the production and utilisation of
timber poles (Table 14). There are also State and Industry Standards (examples Table 15), and energy
providers each have their own internal Standards based on the National and State / Industry Standards,
with additional specific requirements for poles used in the locations of their networks.
The main design Standards relevant to timber poles are:
• AS/NZS 4676:2000, Structural design requirements for utility services poles;
• ESAA C(b)1 – 2003, Guidelines for design and maintenance of overhead distribution and
transmission lines;
• State and Industry Standards (soon to be EANSW / ESAA TP-1).
The main supply standards and specifications relevant to timber poles are:
• AS 2209 – 1994, Timber – Poles for overhead lines;
• AS 2878 – 2000, Timber – Classification into strength groups;
• State and Industry Standards (soon to be EANSW / ESAA TP-2).
Appendix B of the Australian Standard AS 2209 – 1994, Timber – Poles for overhead lines, provides
normative reference information describing timber species that can be used to support overhead lines.
Eighteen durability class 112 species and 22 durability class 2 species are described, and according to
Section two of the Standard, only these species can be used without full-length preservative treatment,
unless otherwise agreed between the purchaser and supplier. If a pole’s sapwood remains untreated
however, it must be assumed that any untreated sapwood does not contribute to the strength of a pole.
Section five of the Standard prescribes that if any of the durability class 1 and 2 species described in
Appendix B are intended for use after full-length preservative treatment then preservative penetration shall
be to the full depth of any sapwood present, with an additional requirement that the depth of the sapwood
must be no less than 12 mm. In the case that a pole is confirmed to be a durability class 1 species by a
recognised authority, the minimum sapwood depth requirement does not apply.
Twenty-three durability class 3 species and twenty durability class 4 species (including seventeen
softwood species) are also described in Appendix B of AS 2209 – 1994. Sections three and four of the
Standard prescribe that these species may be supplied for use as poles after full-length preservative
12 Please see Sections 8.3 and 8.4 for further information regarding pole durability and preservation
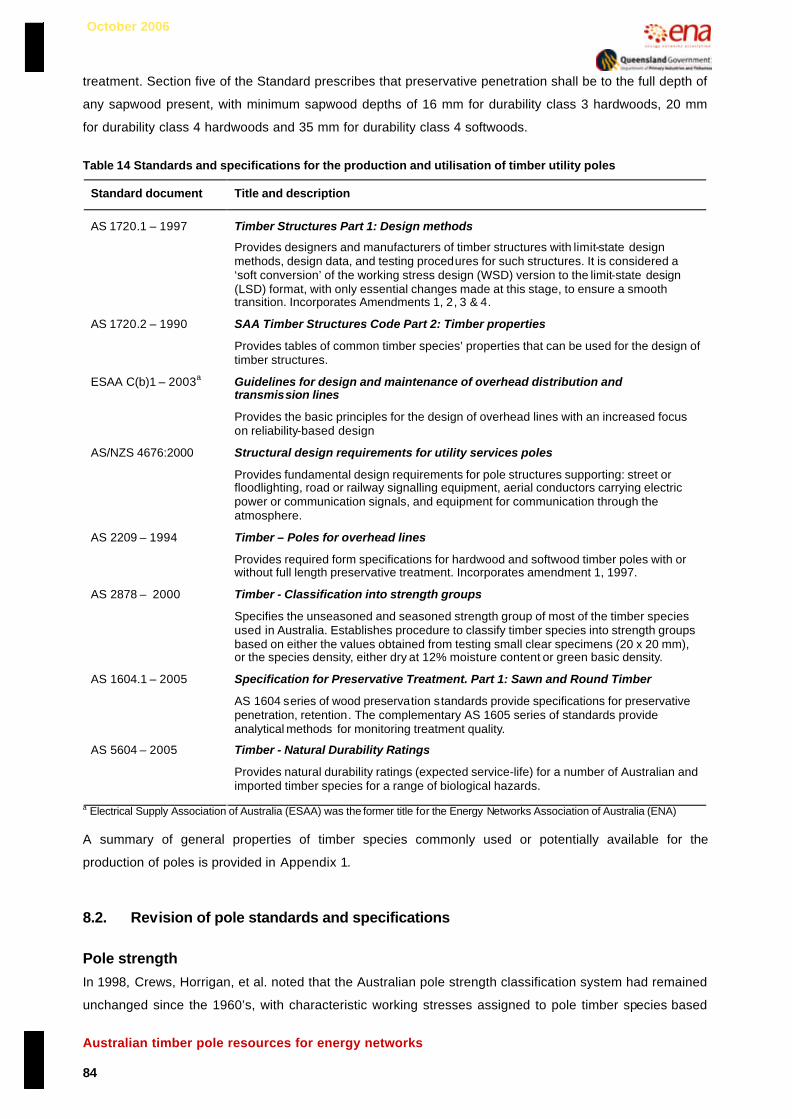
October 2006
Australian timber pole resources for energy networks 84
treatment. Section five of the Standard prescribes that preservative penetration shall be to the full depth of
any sapwood present, with minimum sapwood depths of 16 mm for durability class 3 hardwoods, 20 mm
for durability class 4 hardwoods and 35 mm for durability class 4 softwoods.
Table 14 Standards and specifications for the production and utilisation of timber utility poles
Standard document Title and description
Timber Structures Part 1: Design methods
AS 1720.1 – 1997 (AS_1720.1 1997) Provides designers and manufacturers of timber structures with limit-state design
methods, design data, and testing procedures for such structures. It is considered a ‘soft conversion’ of the working stress design (WSD) version to the limit-state design (LSD) format, with only essential changes made at this stage, to ensure a smooth transition. Incorporates Amendments 1, 2, 3 & 4.
SAA Timber Structures Code Part 2: Timber properties AS 1720.2 – 1990 (AS_1720.2 1990)
Provides tables of common timber species’ properties that can be used for the design of timber structures.
Guidelines for design and maintenance of overhead distribution and transmission lines
ESAA C(b)1 – 2003a (ESAA_C(b)1 2003)
Provides the basic principles for the design of overhead lines with an increased focus on reliability-based design
Structural design requirements for utility services poles AS/NZS 4676:2000 (AS/NZS_4676 2000)
Provides fundamental design requirements for pole structures supporting: street or floodlighting, road or railway signalling equipment, aerial conductors carrying electric power or communication signals, and equipment for communication through the atmosphere.
Timber – Poles for overhead lines AS 2209 – 1994 (AS_2209 1994)
Provides required form specifications for hardwood and softwood timber poles with or without full length preservative treatment. Incorporates amendment 1, 1997.
Timber - Classification into strength groups AS 2878 – 2000 (AS_2878 2000)
Specifies the unseasoned and seasoned strength group of most of the timber species used in Australia. Establishes procedure to classify timber species into strength groups based on either the values obtained from testing small clear specimens (20 x 20 mm), or the species density, either dry at 12% moisture content or green basic density.
Specification for Preservative Treatment. Part 1: Sawn and Round Timber AS 1604.1 – 2005 (AS_1604.1 2005)
AS 1604 series of wood preservation standards provide specifications for preservative penetration, retention. The complementary AS 1605 series of standards provide analytical methods for monitoring treatment quality.
Timber - Natural Durability Ratings AS 5604 – 2005 (AS_5604 2005)
Provides natural durability ratings (expected service-life) for a number of Australian and imported timber species for a range of biological hazards.
a Electrical Supply Association of Australia (ESAA) was the former title for the Energy Networks Association of Australia (ENA) A summary of general properties of timber species commonly used or potentially available for the
production of poles is provided in Appendix 1.
8.2. Revision of pole standards and specifications
Pole strength
In 1998, Crews, Horrigan, et al. noted that the Australian pole strength classification system had remained
unchanged since the 1960’s, with characteristic working stresses assigned to pole timber species based

October 2006
Australian timber pole resources for energy networks 85
on data from tests of small pieces of clear wood. Given the accumulating evidence of very poor correlation
between the strength of natural-round poles of a particular timber species and the strength of small timber
specimens of that species, a more probabilistic approach to timber pole design using limit-state design
procedures was suggested (Crews, Horrigan et al. 1998). Since then, considerable revisions of key timber
pole Standards have been completed and some are still underway. This situation is not unique to
Australia, and similar revisions are underway overseas.
Recent versions of both AS/NZS 4676 (2000) and ESAA C(b)1 (2003) have an increased focus on ‘limit-
state’ concepts. According to ESAA C(b)1 (2003), limit-states are the limiting conditions beyond which a
pole ceases to fulfil its intended function, and are calculated using a load and resistance format that
separates the effects of component strengths and their variability from the effects of external loadings and
their uncertainty. The limit-states determined for a particular structure are used in the application of
reliability-based design procedures which are aimed at achieving an acceptable risk of the structure failing
for a particular loading condition. The important limit-states for overhead lines are the ultimate strength
limit-state (ULS) and the serviceability limit-state (SLS). The ULS represents the state in which a structure
or component’s design capacity exceeds the design load (i.e. the maximum load that a pole can carry and
still function as intended), while the SLS represents the state in which the performance of the structure or
component under commonly occurring loads or conditions will be satisfactory. Serviceability limit-states
include vibration, clearance and support deflections, and exceeding the serviceability design load may
cause damage to some components (ESAA_C(b)1 2003).
Further development and revision of pole standards and specifications was initiated by the Electricity
Authority of NSW (EANSW) and the ENA in 2001. The editorial committee of industry experts have
completed two draft documents, namely EANSW TP-1 and EANSW TP-2 (Table 15). At the ENA - DPI&F
Australian Wood Pole Resources Workshop, Professor Keith Crews noted that these documents are more
accurate and convenient to use, and intended to:
§ Replace EANSW drawing EAS 1.1.1;
§ Provide a focus on reliability for design of timber poles consistent with AS/NZS 4676 (2000) and
ESAA C(b)1 (2003), but based on AS1720.1 (1997) and incorporating relevant updates (e.g. AS /
NZS 1170 (2002));
§ Clearly define separate limit-states (e.g. SLS & ULS);
§ Include a simplified format to calculate both wind loads and pole bending capacities;
§ Provide a performance based system for the design, specification and supply of poles that can
readily incorporate in-grade strength data and accommodate properties of changing resources
(e.g. native forest re-growth and plantation-grown poles) (Crews 2006).
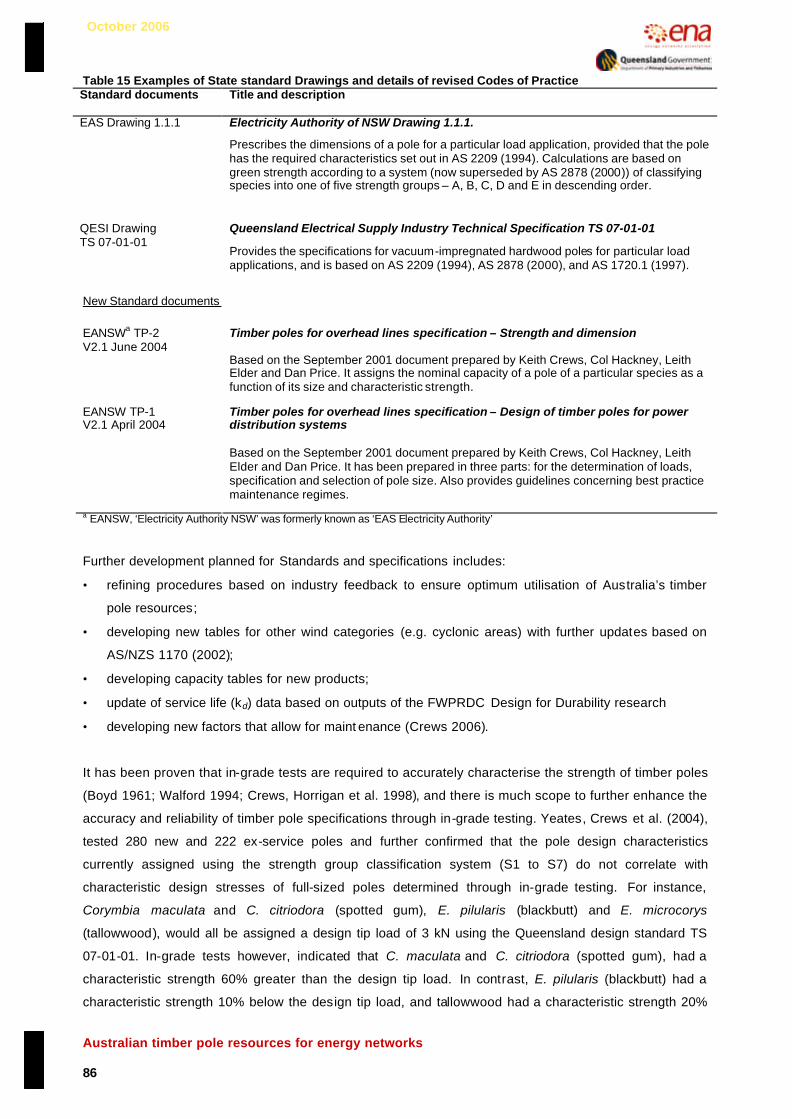
October 2006
Australian timber pole resources for energy networks 86
Table 15 Examples of State standard Drawings and details of revised Codes of Practice Standard documents Title and description
Electricity Authority of NSW Drawing 1.1.1. EAS Drawing 1.1.1
Prescribes the dimensions of a pole for a particular load application, provided that the pole has the required characteristics set out in AS 2209 (1994). Calculations are based on green strength according to a system (now superseded by AS 2878 (2000)) of classifying species into one of five strength groups – A, B, C, D and E in descending order.
Queensland Electrical Supply Industry Technical Specification TS 07-01-01 QESI Drawing TS 07-01-01 (TS_07-01-01 1995) Provides the specifications for vacuum-impregnated hardwood poles for particular load
applications, and is based on AS 2209 (1994), AS 2878 (2000), and AS 1720.1 (1997).
New Standard documents
Timber poles for overhead lines specification – Strength and dimension EANSWa TP-2 V2.1 June 2004 (EANSW_TP-1 2004) Based on the September 2001 document prepared by Keith Crews, Col Hackney, Leith
Elder and Dan Price. It assigns the nominal capacity of a pole of a particular species as a function of its size and characteristic strength.
Timber poles for overhead lines specification – Design of timber poles for power distribution systems
EANSW TP-1 V2.1 April 2004 (EANSW_TP-2 2004)
Based on the September 2001 document prepared by Keith Crews, Col Hackney, Leith Elder and Dan Price. It has been prepared in three parts: for the determination of loads, specification and selection of pole size. Also provides guidelines concerning best practice maintenance regimes.
a EANSW, ‘Electricity Authority NSW’ was formerly known as ‘EAS Electricity Authority’
Further development planned for Standards and specifications includes:
• refining procedures based on industry feedback to ensure optimum utilisation of Australia’s timber
pole resources;
• developing new tables for other wind categories (e.g. cyclonic areas) with further updates based on
AS/NZS 1170 (2002);
• developing capacity tables for new products;
• update of service life (kd) data based on outputs of the FWPRDC Design for Durability research
• developing new factors that allow for maint enance (Crews 2006).
It has been proven that in-grade tests are required to accurately characterise the strength of timber poles
(Boyd 1961; Walford 1994; Crews, Horrigan et al. 1998), and there is much scope to further enhance the
accuracy and reliability of timber pole specifications through in-grade testing. Yeates, Crews et al. (2004),
tested 280 new and 222 ex-service poles and further confirmed that the pole design characteristics
currently assigned using the strength group classification system (S1 to S7) do not correlate with
characteristic design stresses of full-sized poles determined through in-grade testing. For instance,
Corymbia maculata and C. citriodora (spotted gum), E. pilularis (blackbutt) and E. microcorys
(tallowwood), would all be assigned a design tip load of 3 kN using the Queensland design standard TS
07-01-01. In-grade tests however, indicated that C. maculata and C. citriodora (spotted gum), had a
characteristic strength 60% greater than the design tip load. In contrast, E. pilularis (blackbutt) had a
characteristic strength 10% below the design tip load, and tallowwood had a characteristic strength 20%
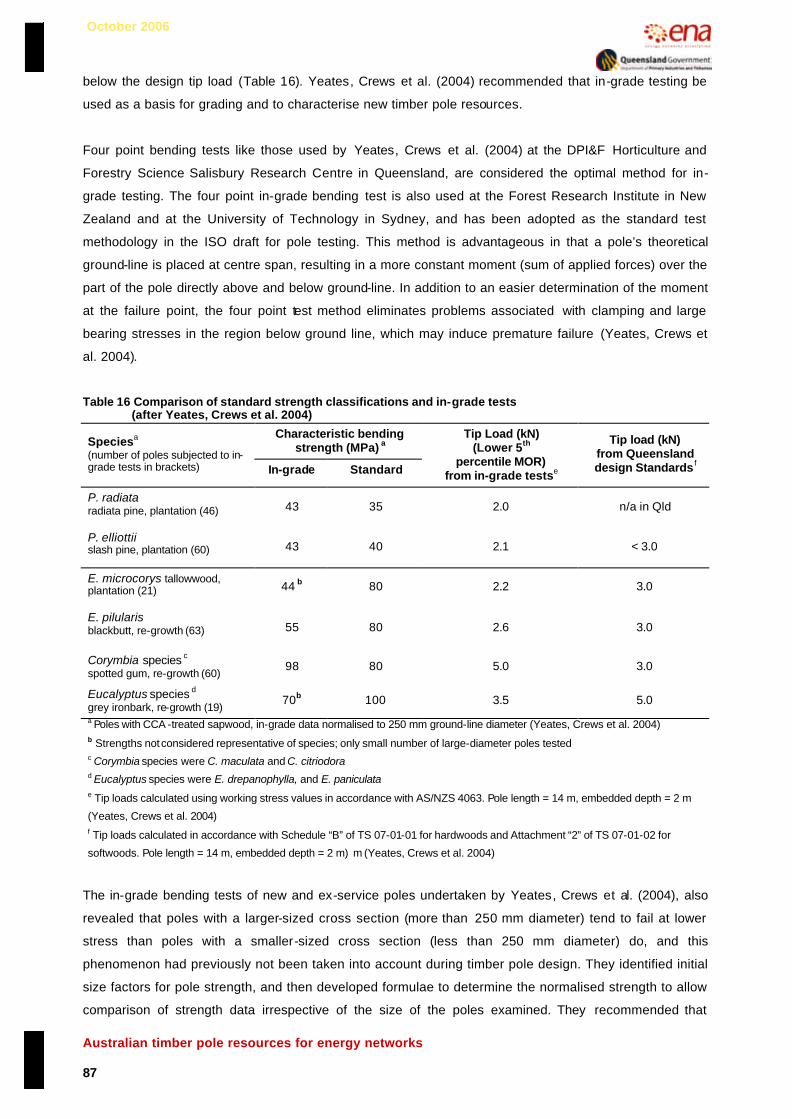
October 2006
Australian timber pole resources for energy networks 87
below the design tip load (Table 16). Yeates, Crews et al. (2004) recommended that in-grade testing be
used as a basis for grading and to characterise new timber pole resources.
Four point bending tests like those used by Yeates, Crews et al. (2004) at the DPI&F Horticulture and
Forestry Science Salisbury Research Centre in Queensland, are considered the optimal method for in-
grade testing. The four point in-grade bending test is also used at the Forest Research Institute in New
Zealand and at the University of Technology in Sydney, and has been adopted as the standard test
methodology in the ISO draft for pole testing. This method is advantageous in that a pole’s theoretical
ground-line is placed at centre span, resulting in a more constant moment (sum of applied forces) over the
part of the pole directly above and below ground-line. In addition to an easier determination of the moment
at the failure point, the four point test method eliminates problems associated with clamping and large
bearing stresses in the region below ground line, which may induce premature failure (Yeates, Crews et
al. 2004).
Table 16 Comparison of standard strength classifications and in-grade tests (after Yeates, Crews et al. 2004)
Characteristic bending strength (MPa) a Speciesa
(number of poles subjected to in-grade tests in brackets) In-grade Standard
Tip Load (kN) (Lower 5th
percentile MOR) from in-grade testse
Tip load (kN) from Queensland design Standards f
P. radiata radiata pine, plantation (46) 43 35 2.0 n/a in Qld
P. elliottii slash pine, plantation (60) 43 40 2.1 < 3.0
E. microcorys tallowwood, plantation (21) 44 b 80 2.2 3.0
E. pilularis blackbutt, re-growth (63) 55 80 2.6 3.0
Corymbia species c spotted gum, re-growth (60) 98 80 5.0 3.0
Eucalyptus species d grey ironbark, re-growth (19) 70b 100 3.5 5.0
a Poles with CCA -treated sapwood, in-grade data normalised to 250 mm ground-line diameter (Yeates, Crews et al. 2004) b Strengths not considered representative of species; only small number of large-diameter poles tested c Corymbia species were C. maculata and C. citriodora d Eucalyptus species were E. drepanophylla, and E. paniculata e Tip loads calculated using working stress values in accordance with AS/NZS 4063. Pole length = 14 m, embedded depth = 2 m
(Yeates, Crews et al. 2004) f Tip loads calculated in accordance with Schedule “B” of TS 07-01-01 for hardwoods and Attachment “2” of TS 07-01-02 for
softwoods. Pole length = 14 m, embedded depth = 2 m) m (Yeates, Crews et al. 2004)
The in-grade bending tests of new and ex-service poles undertaken by Yeates, Crews et al. (2004), also
revealed that poles with a larger-sized cross section (more than 250 mm diameter) tend to fail at lower
stress than poles with a smaller-sized cross section (less than 250 mm diameter) do, and this
phenomenon had previously not been taken into account during timber pole design. They identified initial
size factors for pole strength, and then developed formulae to determine the normalised strength to allow
comparison of strength data irrespective of the size of the poles examined. They recommended that

October 2006
Australian timber pole resources for energy networks 88
different sets of characteristic properties depending on size classes be considered, in order to make better
use of smaller poles (Table 17).
Table 17 The size effect for pole strength (after Yeates, Crews et al. 2004)
Species
No. of poles (New Poles)
Lower 5th percentile MOR Small Diameter b
(MPa)
Lower 5th percentile MOR Large Diameter b
(MPa)
Significance of Size Effect
Average Corrected
MOR’a (MPa)
P. elliottii (slash pine) 60 59 (34) 44 (26) P<0.01 101.8
P. radiata (radiata pine) 46 89 (44) (2) 119.9
Pooled pine 106 74 (78) 45 (28) P<0.01
Corymbia species (spotted gum) 60 110 (19) 78 (41) P<0.01 137.4
E. pilularis (blackbutt) 63 75 (45) 56 (18) P<0.01 110.1
Eucalyptus species (grey ironbark) 19 (2) 77 (17) 125.8
E. microcorys (tallowwood) 21 (6) 55 (15) 97.3
Pooled hardwoods 161 76 (72) 60 (89) P<0.01
a MOR’ represents normalised MOR to standard pole diameter of 250 mm at ground-line b Number in parentheses indicates number of poles tested
These findings have potential to positively impact the pole supply situation as for some species, in-grade
test results exceed the design specifications defined by current pole purchasing standards. Moreover, a
potential impediment to the use of young plantation grown wood is the ability to harvest logs of sufficient
diameter and length. For example, a P. elliottii (slash pine) pole that will provide equivalent mechanical
performance to a 250 mm diameter Corymbia species (spotted gum) pole will need to be 17% larger (293
mm) in diameter according to Queensland standard specifications. Contrary to this, Yeates, Crews et al.
(2004), found that because there is a stronger size effect for P. elliottii (slash pine) than for Corymbia
species (spotted gum), a 180 mm diameter softwood pole provides the same load capacity as a Corymbia
species (spotted gum) pole with the same diameter, and from a certain required load capacity downwards,
P. elliottii (slash pine) poles perform better than Corymbia species (spotted gum) poles. However, in
situations where very high load capacities are required, a P. elliottii (slash pine) pole would need to have a
significantly larger diameter than a Corymbia species pole (Yeates, Crews et al. 2004).
While it has been suggested that revisions and modifications to infrastructural design might slightly
alleviate pole supply difficulties, there were many anecdotal reports suggesting that the associated costs
would most often be prohibitive, and most stakeholders are reluctant to change existing systems. There
appears minimal scope to modify general specifications with regard to pole length, strength and form.
While poles of standard straightness or of a sightly relaxed rural-grade straightness are acceptable for
rural lines, select straightness is preferred for other applications; partly to do with aesthetics and partly the

October 2006
Australian timber pole resources for energy networks 89
strength implications of tension-wood in hardwoods and compression-wood in softwoods. The use of
shorter poles or shorter spans also appears impractical due to interactions with other infrastructure like
roads, and costs over time associated with the maintenance of additional poles.
8.3. Timber pole durability
Natural durability
The principal features of wood structure, as described by Hadlington and Johnston, (1988), provide the
foundation for understanding timber pole durability and preservation requirements. There are three main
parts of a typical tree-trunk or large branch. The central core is often darker and consists of heartwood.
Surrounding this is the pale-coloured sapwood, which in turn is surrounded by bark. The bark contains
three layers; beneath the outer protective layer, there are phloem cells that transport sugars, and
cambium cells whose division causes growth in the girth of the trunk. The cambium produces cells that
become sapwood, which functions to transport water and mineral salts. As new sapwood is formed toward
the outside of the trunk, the sapwood toward the centre of the trunk ceases to function and becomes
heartwood, which is impregnated with oils, gums and resins (collectively referred to as extractives) that
usually give it a darker colour (Hadlington and Johnston 1988).
A timber species natural durability is defined as its inherent resistance to decay and insect attack
(AS_5604 2005), and the characteristic resins and extractives contained in each timber species
heartwood can impart a level of protection against biological degradation. The natural durability of the
heartwood of each of the main commercial timber species used in Australia is classified into one of four
durability classes. In the case of in-ground ratings, classifications are based on expert opinion and the
performance of numerous timber specimens exposed at five sites around Australia. For above-ground
applications durability ratings have been provided based on preliminary results from 35 × 35 mm test
specimens exposed above-ground at 11 sites around Australia (Table 18) (AS_5604 2005). For the
purposes of this review, the in-ground classifications apply unless otherwise indicated.
Figure 32 Cross-section of softwood sapwood showing empty cell lumens (white), (x 200)
Bark Sapwood
Heartwood
Figure 31 Schematic diagram of hardwood log cross-section

October 2006
Australian timber pole resources for energy networks 90
Table 18 Durability classification system (Australian Standard AS 5604 - 2005)
Durability Class Probable in-ground life- expectancya, Dig (years)
Probable above-ground life- expectancya, Dag (years)
1 Greater than 25 Greater than 40
2 15 to 25 15 to 40
3 5 to 15 7 to 15
4 0 to 5 0 to 7 a Notes: 1. As further evidence becomes available these ratings may be amended
2. The heartwood durability of an individual piece of timber may vary from the classification nominated for that species 3. Above-ground conditions equate to outside above-ground subject to periodic, moderate wetting when ventilation and drainage are adequate.
Additionally, timber species natural durability against termite attack is classified into one of two
categories(AS_5604 2005). Each species is classified as either resistant or non-resistant to termite attack,
and if susceptible the rate of deterioration depends on the size, age and vigour of the attacking termite
population.
Due to the variety of biological hazard situations that timber may be exposed to throughout the country,
and to a lesser extent the natural variations of wood properties between individual trees of the same
species, the expected service-life predictions presented in AS 5604 (2005) are not optimally sensitive.
There is much potential to improve the durability Standard, by accounting for influential variables such as
climate, which is especially significant as it effects the activity of biodeteriogens and the physical
weathering of timber in-service.
Recognising the need for more reliable and sensitive durability models for timber structural elements that
are exposed to the weather, the Design for Durability Research Program was established by the Forest &
Wood Products Research & Development Corporation (FWPRDC) and collaborating research
organisations. Researchers developed deterioration models with a solid limit-state focus based on timber
durability research data, and in 2002, a Draft Timber Durability Compendium was developed, along with
software to generate durability forecasts. The Compendium and associated software contains models to
generate service-life estimates for timber used in a variety of applications, including in-ground and above-
ground situations, and contains termite control recommendations and information regarding the corrosion
of embedded and exposed metal fasteners (Leicester, Foliente et al. 2002).
As part of the Design for Durability research program, Leicester et al., (2003) developed models to predict
the strength of timber poles and rectangular sawn sections subjected to in-ground attack by decay fungi.
The models are based on decay data from an extensive in-ground timber stake trial and analysis of a
limited number of full-sized pole and rectangular sawn sections, and take into account timber species,
preservative treatment, maintenance practice and local climate. Climate has a major influence on timber
decay, and a decay hazard map was developed for the models based on a climate index and initial
general calibration based on expert opinion (Figure 33). Four decay hazard zones were selected, ranging
from zone A, which is expected to present the least severe decay hazard, to zone D, which is expected to
present the most severe decay hazard. The decay rates generated during model calculations incorporate

October 2006
Australian timber pole resources for energy networks 91
factors for timber species, climate index (based on temperature and rainfall) and decay initiation lag-times
for treated timber, sapwood, inner heartwood and outer heartwood (Leicester, Wang et al. 2003).
Figure 33 In-ground decay hazard zones (Leicester, Wang et al. 2003)
Table 19 Initial design service lifea values for round poles in Climate Zone B (Leicester, Wang et al. 2003)
Design service life (years) Timber type In-ground
decay classb Treatmentc Pole diameter 200 mm
Pole diameter 300 mm
Pole diameter 400 mm
H4 80 >100 >100 Treated softwood 4
H5 >100 >100 >100
H4 40 60 80 1
H5 60 80 100
H4 40 50 60 2
H5 50 70 80
H4 35 40 50 3
H5 40 50 60
H4 25 30 35
Treated hardwood
4 H5 30 35 40
1 - 40 60 70 Untreated hardwoodd 2 - 25 35 45
a Service-life defined as the time that it takes for the pole to lose 30% of its initial strength. If maintenance action is undertaken a further delay to the progress of decay would be expected. b As per AS 5604 – 2005 c As per AS 1604.1 – 2005 for CCA and creosote d Desapped poles

October 2006
Australian timber pole resources for energy networks 92
Leicester, Wang et al. (2003) noted that two further developments of the model were required to optimise
its usefulness for routine engineering applications. Firstly, quantification of the uncertainty associated with
strength estimates was considered necessary for engineering design standards, and secondly, the
development of models for strength deterioration not caused by decay was recommended, including
models related to deterioration due to mechanical degradation are required for the design of timber used
in arid regions of Australia. A termite hazard map for buildings was also developed as part of Design for
Durability research and it would be beneficial to undertake further calibration of the model specifically for
timber utility poles.
Models are currently being enhanced, and initial in-grade strength characterisation research is beginning
to address these issues, as are current revisions of timber pole design standards with a stronger focus on
limit-state design principles. Given the extensive research already completed during the Design for
Durability program, major benefits would flow from additional investment to further calibrate models based
on deterioration data collected for poles in-service. Further in-grade timber pole strength research is also
recommended to generate the limit-state data required to provide acceptable levels of reliability for
modern design procedures.
Timber decay
Mallet & Grgurinovic, (1996) explain that fungi are the primary recyclers of organic matter in forest
ecosystems, and these organisms are best able to decompose wood and use it as an energy source. In
the context of wood decay, both reproductive and vegetative fungal structures may be observed. Fruiting
bodies like brackets contain copious microscopic spores, which are eventually released into air currents or
spread by rain droplets. When these spores fall on timber that contains sufficient moisture, they germinate
and produce fine threads (or hyphae) which can penetrate the timber. Vegetative filamentous hyphae may
be recognised growing though a piece of decaying timber (Figure 34 and Figure 35). (Mallet and
Grgurinovic 1996).
Figure 34 Fungal fruiting body (Courtesy Prof. Jeff Morrell, Oregon State University)
Figure 35 Fungal mycelium (vegetative hyphae)
Ultimately, timber decay occurs as a result of complex interactions between organisms that utilise timber
as a source of food, the physical quality of the timber and environmental conditions. Schwarze, Engels, et

October 2006
Australian timber pole resources for energy networks 93
al. (2004) summarised the fundamental features of wood structure, which provide background knowledge
necessary to understand the principles of wood preservation. While there are differences between
softwoods, hardwoods, and between species, wood cell walls basically consist of cellulose, which is
intimately associated with lignin and other binders in a complex structure.
The secondary wall forms the largest part of wood cell walls, and is composed mostly of cellulose and
hemicellulose. The main biomechanical function of the secondary wall is to impart tensile strength to wood
cells. Lignin is an amorphous substance that is concentrated in the compound middle lamella, where it
basically serves to connect neighbouring cell elements, and provides compression strength and stiffness
to the cell wall (Schwarze, Engels et al. 2004). Lignin is also considered to play an important role in
retarding cellulose decomposition, which is thought to be mainly a physical process where the lignin
between the cellulose fibrils decreases the available surface area and prevents ready access to the
cellulose by invading organisms and their enzymes (Haug 1993). Softwoods contain about 27 to 37 %
lignin compared to 16 to 29 % in hardwoods (Haug 1993).
Cell lumen (empty space)
compound middle lamella
cell wall
parenchyma ray
hyphae of decay fungus
Figure 36 Stained softwood cross-section x200
Figure 37 Stained softwood cross-section x400
Timber decay is most commonly caused by the activity of fungi, which produce enzymes to break down
the constituents of wood cell walls into more readily assimilable substances that are required for their
growth and metabolism (Rayner and Boddy 1988). Almost all decay fungi are unable to attack timber with
a moisture content of less than about 20% (Rayner and Boddy 1988). Based on the chemical and
structural changes they cause to their timber substrate, decay fungi are usually classified into three
groups: brown rots, white rots and soft rots.
Brown rot fungi break down cellulose and hemicellulose, while lignin remains preserved in a slightly
modified form (Rayner and Boddy 1988). The modified lignin that remains gives affected wood a
characteristic dark colour and a brittle consistency (Schwarze, Engels et al. 2004).

October 2006
Australian timber pole resources for energy networks 94
Figure 38 Example of brown rot (Courtesy Prof. Jeff Morrell, Oregon State University)
Schwarze et al., (2004) explain that the term ‘white rot’ has traditionally been used to describe forms of
wood decay in which the wood assumes a bleached appearance and where lignin as well as cellulose and
hemicellulose are broken down. Greater variations in wood decay are caused by white-rot fungi,
depending on the species of fungus involved and the physical constituents and conditions of the wood that
is under attack. Despite this diversity, two forms of white rot are generally recognised: selective
delignification, where lignin is preferentially degraded; and simultaneous rot, where lignin, cellulose and
hemicellulose are broken down at approximately the same rates (Schwarze, Engels et al. 2004).
Figure 39 Example of white rot in a timber pole
In contrast to brown rot, but similarly to simultaneous rot, the destruction of the cell wall takes place in the
immediate vicinity of fungal hyphae during fungal decomposition caused by soft rot. Soft rot at ground-line
is a significant problem for treated hardwood poles because soft -rot fungi grow within cell walls and can
therefore avoid contact with timber preservative treatments that are in cell lumens (Price and Hackney
1996). Soft rot fungi attack the secondary cell walls of timber causing the shape of the wood to remain the
same but making the timber weaker and more brittle (Greaves 1979). The most common form of attack is
shallow surface softening which when dry appears as fine cuboidal checks. The second form of attack
leaves the wood material appearing sound but microscopic examination of the attack shows a greater
depth of fungal activity (Greaves 1979). Many soft rot fungi are tolerant to copper chrome arsenic wood
preservatives, and can be a problem in poorly treated timber. The CCA -treated sapwood of hardwoods is
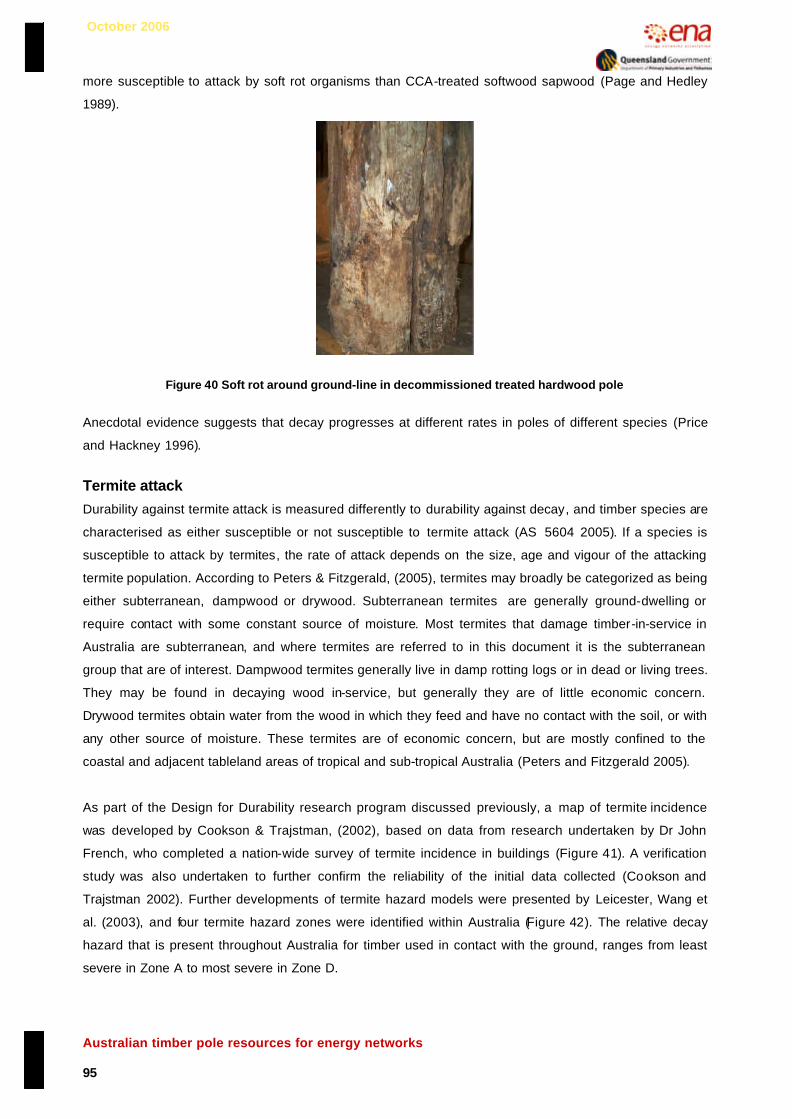
October 2006
Australian timber pole resources for energy networks 95
more susceptible to attack by soft rot organisms than CCA-treated softwood sapwood (Page and Hedley
1989).
Figure 40 Soft rot around ground-line in decommissioned treated hardwood pole
Anecdotal evidence suggests that decay progresses at different rates in poles of different species (Price
and Hackney 1996).
Termite attack
Durability against termite attack is measured differently to durability against decay, and timber species are
characterised as either susceptible or not susceptible to termite attack (AS_5604 2005). If a species is
susceptible to attack by termites, the rate of attack depends on the size, age and vigour of the attacking
termite population. According to Peters & Fitzgerald, (2005), termites may broadly be categorized as being
either subterranean, dampwood or drywood. Subterranean termites are generally ground-dwelling or
require contact with some constant source of moisture. Most termites that damage timber-in-service in
Australia are subterranean, and where termites are referred to in this document it is the subterranean
group that are of interest. Dampwood termites generally live in damp rotting logs or in dead or living trees.
They may be found in decaying wood in-service, but generally they are of little economic concern.
Drywood termites obtain water from the wood in which they feed and have no contact with the soil, or with
any other source of moisture. These termites are of economic concern, but are mostly confined to the
coastal and adjacent tableland areas of tropical and sub-tropical Australia (Peters and Fitzgerald 2005).
As part of the Design for Durability research program discussed previously, a map of termite incidence
was developed by Cookson & Trajstman, (2002), based on data from research undertaken by Dr John
French, who completed a nation-wide survey of termite incidence in buildings (Figure 41). A verification
study was also undertaken to further confirm the reliability of the initial data collected (Cookson and
Trajstman 2002). Further developments of termite hazard models were presented by Leicester, Wang et
al. (2003), and four termite hazard zones were identified within Australia (Figure 42). The relative decay
hazard that is present throughout Australia for timber used in contact with the ground, ranges from least
severe in Zone A to most severe in Zone D.
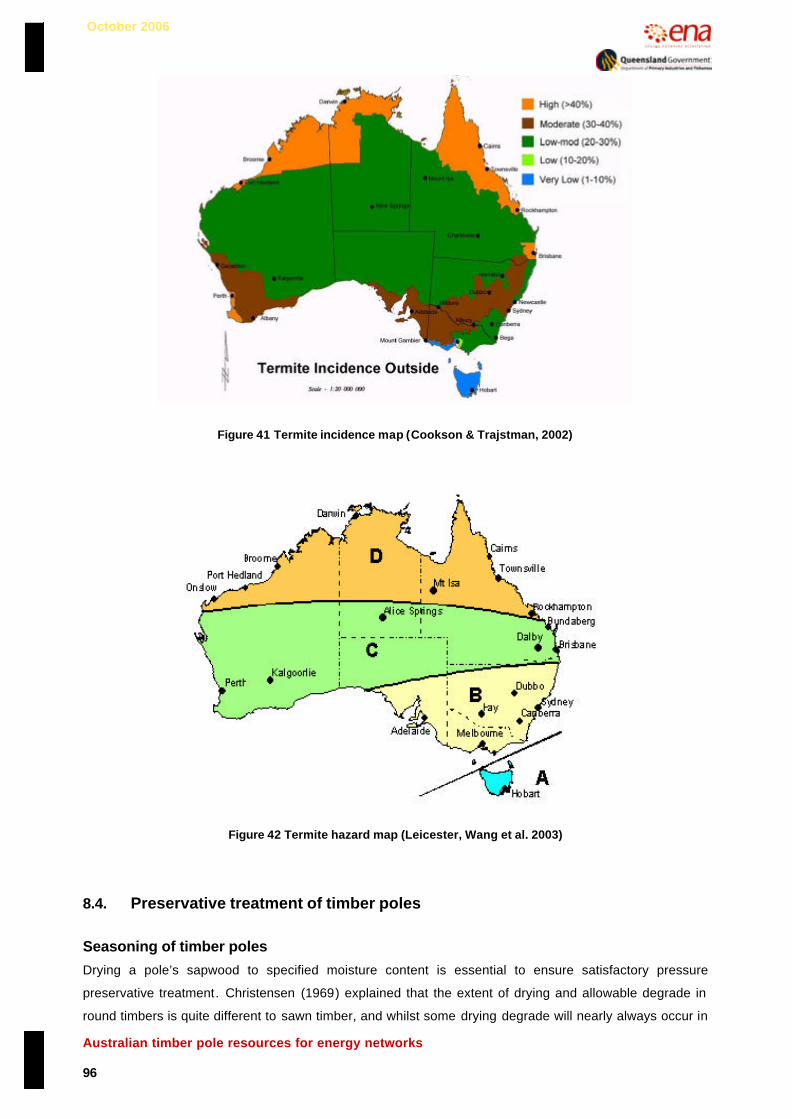
October 2006
Australian timber pole resources for energy networks 96
Figure 41 Termite incidence map (Cookson & Trajstman, 2002)
Figure 42 Termite hazard map (Leicester, Wang et al. 2003)
8.4. Preservative treatment of timber poles
Seasoning of timber poles
Drying a pole’s sapwood to specified moisture content is essential to ensure satisfactory pressure
preservative treatment. Christensen (1969) explained that the extent of drying and allowable degrade in
round timbers is quite different to sawn timber, and whilst some drying degrade will nearly always occur in

October 2006
Australian timber pole resources for energy networks 97
timber dried in the round, the nature and extent of degrade is largely determined by the drying conditions
encountered. Prompt removal of bark is recommended to accelerate drying. Air drying is the most
common method used to dry round timbers in Australia, and the relatively narrow sapwood band of native
hardwood poles is dried to a moisture content of about 25% prior to treatment. The outer five centimetres
or more of the sapwood of softwood poles is dried to about 25% before they are treated (Christensen
1969).
Christensen (1969) suggested the following practices to optimise air-drying:
• Bottom layer at least 30 cm above ground supported by bearers
• Area around stacks free of weeds and vegetation
• Optimum site drainage and stable stack foundations
• Open-piled stacking (also called fillet, open crib or strip stacking) favourable; adjacent rows of logs are
stacked parallel to each other, with each row supported by an appropriate number of bearers placed
at right angles to the length of the poles being dried
• Poles of same length in the one stack to prevent end-splitting in poles with overhanging ends
• Appropriate stack cover (e.g. corrugated plastic or steel fixed to a frame).
The rate of diffusion of water out to the surface of a log was found to be the limiting factor for drying
time in many cases, so, drying times are not expected to widely vary for a particular drying yard
throughout the year provided that air circulation is adequate and positive steps are taken to protect
logs from wetting. Appropriate stack cover also prevents damage to upper-layer poles during hot, dry
weather
• Stacks not too high to prevent the crushing of sapwood of lower-layer poles at contact points, which
later impedes preservative penetration
• Separating bearers (preferably sawn timber) aligned above the stumps or bedlogs supporting the
stack or bearers to prevent bending of poles
• Use sufficient bearers to prevent surface-crushing
• Keep stacks level (horizontal)
• Poles stacked with all log butts and tops in adjacent rows opposite or stacked with alternate butts and
tops across rows
Drying degrade
In addition to the techniques suggested by Malan (1995) to prevent drying degrade which were discussed
previously, it has been suggested that losses due to end-splitting can be minimised by specifying an over-
length allowance sufficient to ensure that a pole of usable length can be cut after drying. Alternatively,
species prone to excessive barrel splits can be incised to reduce checking and / or modify its pattern. For
some species end-splitting can be alleviated by banding or restraint (using nail plates, C-hooks, S-hooks
or dowel pins) (Christensen 1969). Taylor (1994) noted that whilst poles can be successfully air-dried, they
must be stacked so that air can move freely around them to minimise degrade caused by stain and decay
fungi.

October 2006
Australian timber pole resources for energy networks 98
Pre-treatment conditioning
Sahle-Demessie, Levien et al. (1992) examined temperature-time-location relationships during steam
conditioning and pressure treatment of timber poles using ammoniacal copper arsenate (ACA) and
developed a new mathematical model that incorporated both the thermal properties of poles and the
parameters of the treatment process. Prediction equations and charts were presented that show the
minimum required steaming time to satisfy the 1982 Rural Electrification Authority (REA) purchase
specification of a center temperature above 150 °F (65.5 °C) for 2 hours. The six hour steaming time
commonly used for ACA treatment was found to be insufficient to bring poles with diameters larger than
about 400 mm to the required sterilization conditions. The temperature of the preservative was not found
to be a major factor in determining the maximum temperature achieved at the centre of a pole, but it was
found to influence the length of time the pole is above 65.5 °C (Sahle-Demessie, Levien et al. 1992).
Accelerated drying methods
Generally, the best dried quality poles were reported to be obtained after accelerated drying when they
were processed before significant air-drying had occurred.
Innovative technologies that use of microwave and radio-frequency heating are being developed and
refined to further improve the accelerated drying of poles (Fang, Ruddick et al. 2001; Daian, Taube et al.).
Taylor (1994) explained that in preparation for preservative treatment, poles are often kiln-dried in the
USA, and in 1994 there were approximately 90 kilns used in the southern United States to dry poles.
Conventional kiln drying causes the small-diameter ends of poles to dry proportionally more than the
large-diameter ends, and as a consequence more preservative solution is absorbed by the over-dried
small end. It is desirable for maximum preservative penetration and retention to protect the in-ground
portion of poles, and techniques for differentially drying poles to prevent over-treatment of the above-
ground portion have been developed. Modifying stacking procedures, heat concentration and air flow can
be used to differentially dry poles, and poles can also be dried in tubes that heat the area ground-line
region of poles more than the above-ground region (Taylor 1994; Chui, Taylor et al. 2001).
Christensen (1969) explained that both high and low temperature kiln dying has good potential for drying
softwoods in Australia, and compartment kilns, pre-dryers, or progressive (tunnel) dryers can be used.
High-temperature kiln drying was found to be satisfactory method for drying Australian P. radiata poles,
and poles were dried from green to suitable for preservative treatment in 48 to 72 hours. As the rate of
diffusion was found to be the limiting factor for kiln-drying, poles can be relatively closely packed making
good use of kiln holding capacities. High-temperature kiln drying was not recommended for eucalypts due
to the development of severe drying degrade. Low temperature kiln drying can be undertaken using a pre-
dryer or single-pass progressive dryer, and in NZ, it has been shown to dry P. radiata poles to treatable
moisture content in 10 days. Pre-drying was not recommended for eucalypts whose sapwood took more
than three months to dry under laboratory conditions to keep degrade within acceptable limits. Progressive
driers are used to season softwood poles in USA and NZ (Christensen 1969).

October 2006
Australian timber pole resources for energy networks 99
Vapour drying is an alternative seasoning method where moisture is rapidly evaporated from timber by
heating with a hydrocarbon vapour that is recycled through a condenser. Christensen (1969) reported that
pine poles in the USA have been vapour dried from green to treatable condition in 10 to 12 hours, after
which, a preservative treatment is delivered in the same cylinder. If logs are free of air seasoning degrade
before treatment, large seasoning checks and splits are unlikely to develop during drying or in-service.
The main disadvantage of this process was reported to be that a more complex plant and more highly-
trained personnel are required (Christensen 1969).
Steam and vacuum drying can also be used to dry poles. The process involves heating poles with steam
at pressures of up to 20 psi (0.14 MPa), followed by evaporation of moisture under vacuum, when the heat
stored from steaming facilitates drying. Single or progressive cycles can be used. This method is used in
the USA for softwoods but is not recommended for eucalypts due to high levels of expected degrade.
Christensen (1969) reported that logs dried using this method retain adequate loadings of preservative
even when moisture content is still relatively high, but both stream temperature and time have to be
carefully controlled to avoid serious permanent loss of wood strength (Christensen 1969).
Boultonizing is also an option for combined seasoning and preservative treatment and involves boiling
moisture from wood immersed in heated creosote or oil under vacuum. Christensen (1969) reported that
Boultonizing can be used to process eucalypts in 8 to 24 hours with adequate drying of green logs such
that sapwood up to 5 cm thick can be treated with creosote, although creosote penetration was found to
vary between species. He furthermore noted that Boultonizing may permit the utilisation of round timber
from some economically important eucalypt species (like karri), which are extremely difficult to air-dry in
Australia without developing checking and splitting to the point of rejection (Christensen 1969).
In summary, accelerated drying techniques have the following common features:
• Advantages
o Assurance of continuous output
o Lower drying losses due to better control of drying and shorter time of exposure to continual
changes in atmospheric conditions that contribute to the initial development of drying degrade
o Minimise any pre-treatment decay
• Disadvantages
o Capital and / or interest for plant and buildings
o Higher cost of drying
o Somewhat offset by advantages
Cost-effective low-emission technology has been developed to use mill waste to generate the energy
required for kiln drying. It was reported that the fuel and heat plant operating costs associated costs for
kiln drying can be reduced by up to 80% by using regenerative combustion combined with gasification
technology (Anon 1996).

October 2006
Australian timber pole resources for energy networks 100
Preservative treatment of poles
Scientific life-cycle analyses indicate that timber is amongst the most environmentally favourable of all
structural products, and preservative-treated timber poles are no exception, despite the negative image
that is sometimes perpetuated in the absence of competitive extension and timber marketing activities
(Kunniger and Richter 1995; Chapman 2002; Sedjo 2002).
There are three approaches that can be used to protect timber from attack by insects, fungi and bacteria:
the first involves the addition of chemicals to timber to prevent attack; the second involves ‘modification’ of
the timber itself, to change the chemical structure of wood components making them resistant to
degradation by microbial enzymes; and the final approach relies on ‘structural design’ principles, including
selecting timber of the appropriate durability to carry out specific functions, construction detailing and the
use of physical barriers (Eaton and Hale 1993).
Sound reliability-based design principles are always desirable, however in most higher-hazard situations
or for assets that are difficult and / or expensive to access or replace, treatment is required to ensure
reliable timber performance. In Australia, there are three sets of specifications for preservative treated
timber; the Australian Standard AS 1604 series, Queensland’s Timber Utilisation and Marketing Act 1987
or its successor (TUMA) and New South Wales’ Timber Marketing Act 1977 or its successor (TMA). There
are only minor differences in the three sets of specifications, which address State specific needs. Six
biological hazard classes are specified (Table 3) and the preservative penetration and retention to protect
timber for use in each hazard class are defined (TMA 1977; TUMA 1987; AS_1604.1 2005). In the timber
and building industries, weathering refers to mechanical damage caused by the sun, wind and rain
whereby the surface of the timber is physically eroded rather than biologically attacked. As the extent of
weathering is entirely dependent on the exposure conditions in the immediate environment, protection
against weathering is not included in the definition of hazard classes.
Table 20 Hazard class definitions (AS 1604.1 - 2005; TUMA 1987; TMA 1977).
Hazard class Conditions of use Biological hazard
1 Inside a structure, fully protected from wetting Insect borers only
2 Inside a structure, fully protected from wetting Insect borers and termites
3 Outside a structure, exposed to intermittent wetting - above the ground
Insect borers, termites and slight decay
4 Outside a structure, exposed to continuous wetting - in contact with the ground.
Insect borers, termites and moderate decay
5 Outside a structure, exposed to continuous wetting - in contact with the ground – critical applications
Insect borers, termites and severe decay
6 In contact with sea water Marine organisms
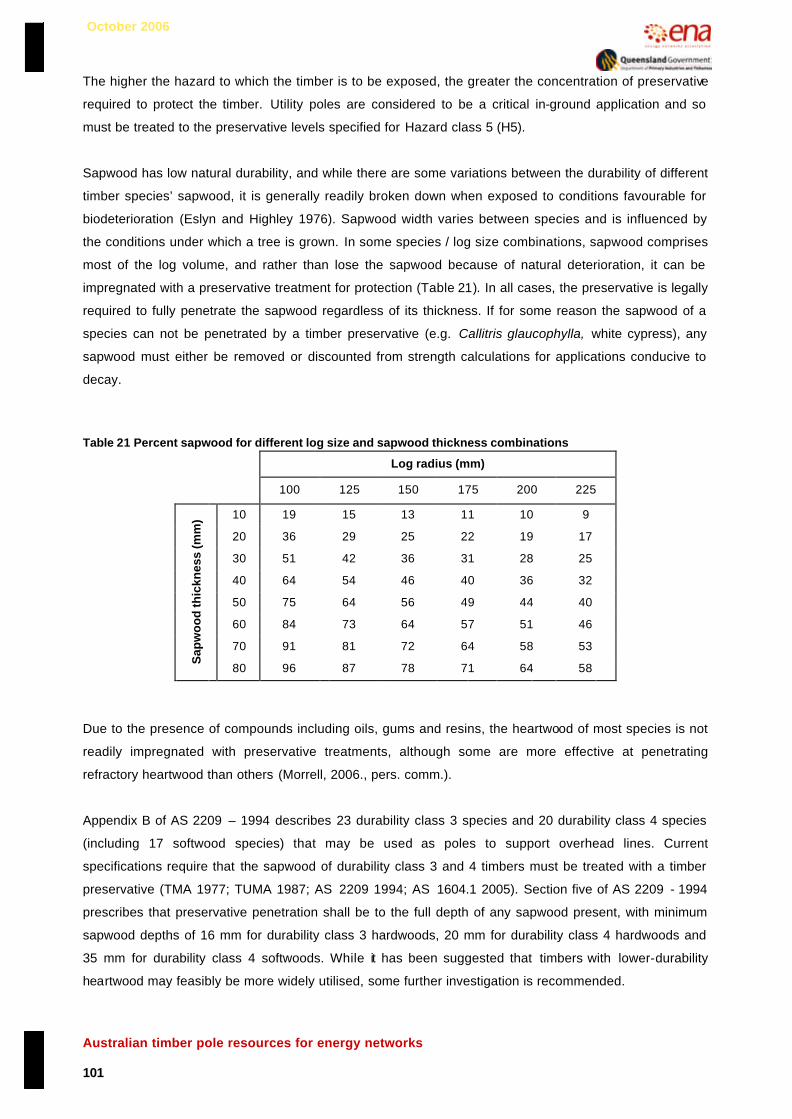
October 2006
Australian timber pole resources for energy networks 101
The higher the hazard to which the timber is to be exposed, the greater the concentration of preservative
required to protect the timber. Utility poles are considered to be a critical in-ground application and so
must be treated to the preservative levels specified for Hazard class 5 (H5).
Sapwood has low natural durability, and while there are some variations between the durability of different
timber species’ sapwood, it is generally readily broken down when exposed to conditions favourable for
biodeterioration (Eslyn and Highley 1976). Sapwood width varies between species and is influenced by
the conditions under which a tree is grown. In some species / log size combinations, sapwood comprises
most of the log volume, and rather than lose the sapwood because of natural deterioration, it can be
impregnated with a preservative treatment for protection (Table 21). In all cases, the preservative is legally
required to fully penetrate the sapwood regardless of its thickness. If for some reason the sapwood of a
species can not be penetrated by a timber preservative (e.g. Callitris glaucophylla, white cypress), any
sapwood must either be removed or discounted from strength calculations for applications conducive to
decay.
Table 21 Percent sapwood for different log size and sapwood thickness combinations
Log radius (mm)
100 125 150 175 200 225
10 19 15 13 11 10 9
20 36 29 25 22 19 17
30 51 42 36 31 28 25
40 64 54 46 40 36 32
50 75 64 56 49 44 40
60 84 73 64 57 51 46
70 91 81 72 64 58 53
Sap
wo
od
thic
knes
s (m
m)
80 96 87 78 71 64 58
Due to the presence of compounds including oils, gums and resins, the heartwood of most species is not
readily impregnated with preservative treatments, although some are more effective at penetrating
refractory heartwood than others (Morrell, 2006., pers. comm.).
Appendix B of AS 2209 – 1994 describes 23 durability class 3 species and 20 durability class 4 species
(including 17 softwood species) that may be used as poles to support overhead lines. Current
specifications require that the sapwood of durability class 3 and 4 timbers must be treated with a timber
preservative (TMA 1977; TUMA 1987; AS_2209 1994; AS_1604.1 2005). Section five of AS 2209 - 1994
prescribes that preservative penetration shall be to the full depth of any sapwood present, with minimum
sapwood depths of 16 mm for durability class 3 hardwoods, 20 mm for durability class 4 hardwoods and
35 mm for durability class 4 softwoods. While it has been suggested that timbers with lower-durability
heartwood may feasibly be more widely utilised, some further investigation is recommended.

October 2006
Australian timber pole resources for energy networks 102
Treatment trials on small diameter, plantation-grown eucalypt (vineyard) posts have shown that the
sapwood can be completely penetrated by standard vacuum pressure techniques (McCarthy, Cookson et
al. 2005). It is anticipated that the sapwood of appropriately pre-treated poles will be fully penetrated by
timber preservatives, however further work is needed to confirm this. The currently approved H5
treatments are shown in Table 22. The required levels of treatment for each of these preservatives were
determined based upon field research and monitoring the performance of treated material in-service.
Table 22 Approved preservative treatments for poles (H5)
Treatment Species Preservative level
Softwood 1.00% CCA (% copper + % chromium + % arsenic) Hardwood 1.20%
Softwood 1.41% ACQ 2100 (% copper + % dimethylammonium chloride) Hardwood 1.69%
Softwood 24.50% Creosote (% creosote)
Hardwood 13.00%
Initial research into wood modification possibilities has occurred relatively recently, but chemical
treatments are by far the most common timber preservation method. Timber preservative treatments must
repel or be toxic to target organisms, and ideally they should be safe to handle, non-corrosive, and cost
effective, and safe for disposal. In addition it is desirable that they evenly penetrate the timber without any
adverse effects to timber properties, provide long term protection, and are able to be chemically detected.
There are many timber preservative systems used throughout the world with one or more of these
characteristics. The most commonly used timber preservative system in Australia involves mixtures of
copper chrome arsenic compounds (CCA). The most common CCA formulation currently used is
generically called Type C and is formulated as: CuO: 18.5% w/w, CrO3: 47.5% w/w, and As2O5 - 34% w/w
(AWPA 2005). In all CCA formulations, copper is the main fungicide, arsenic is primarily an insecticide
with some fungicidal properties, and chromium, which is present as hexavalent chromium in the
preservative solution, reacts to 'fix' the CCA components to the timber. Thus, CCA timber preservatives
dissolve in water and react with the wood so that they are resistant to leaching (Arsenault 1975). The
presence of chromium in treated timber also improves its physical weathering characteristics (Ross, Willits
et al. 1999).
Pressure to restrict the use of CCA led to the development in the late 1980s, of alkaline copper quaternary
(ACQ) (Pernak, Zabielska-Matejuk et al. 1998) and copper azole timber treatments (Creffield, Drysdale et
al. 1996). ACQ and copper azole treatments were developed as alternatives that contain neither arsenic
nor chromium. Whilst CCA timber preservatives have been in use in Australia for over 40 years, ACQ was
more recently approved in 1994 for use to protect softwoods and hardwoods in H5 applications. Copper
azole was approved for the protection of softwoods and hardwoods against a H4 hazard class conditions
in 2003 and is not currently approved for use in protecting timber for H5 applications. DPI & F have been
advised that field data on the performance of copper azole are now available, however approval by the
Australian Pest and Veterinary Medicines Authority (APVMA) must be obtained before application can be
made for approval under the various timber treatment specifications.
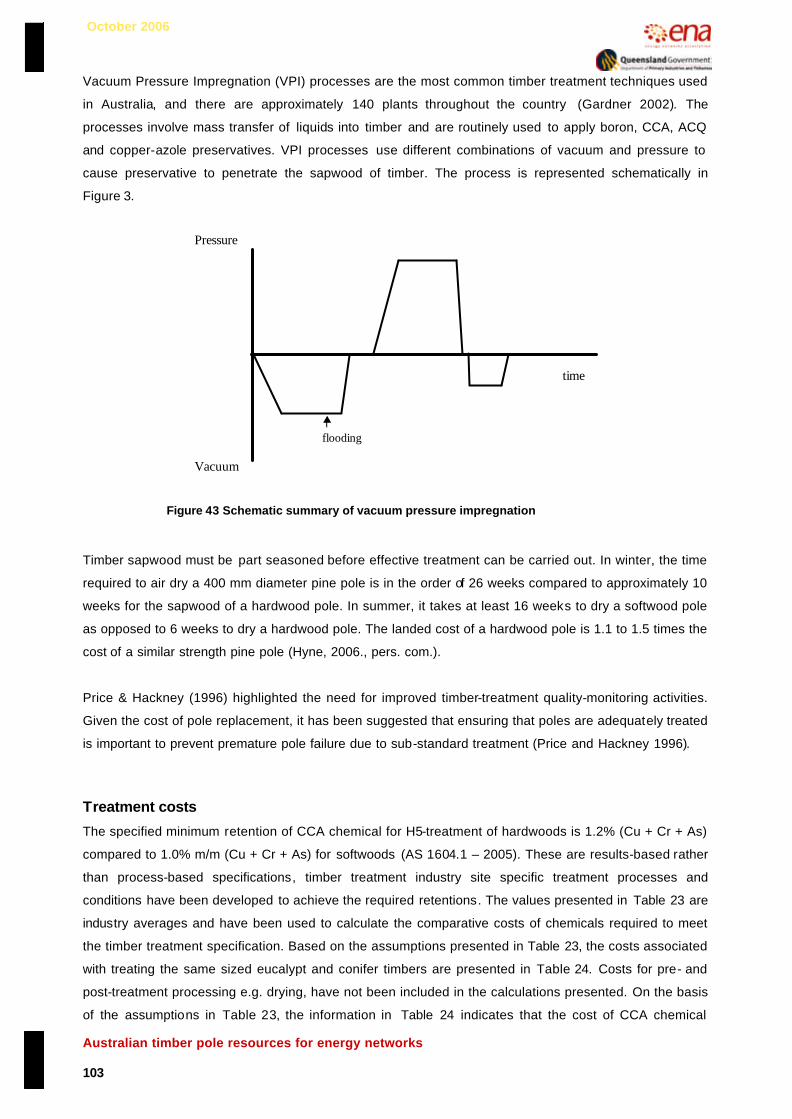
October 2006
Australian timber pole resources for energy networks 103
Vacuum Pressure Impregnation (VPI) processes are the most common timber treatment techniques used
in Australia, and there are approximately 140 plants throughout the country (Gardner 2002). The
processes involve mass transfer of liquids into timber and are routinely used to apply boron, CCA, ACQ
and copper-azole preservatives. VPI processes use different combinations of vacuum and pressure to
cause preservative to penetrate the sapwood of timber. The process is represented schematically in
Figure 3.
Timber sapwood must be part seasoned before effective treatment can be carried out. In winter, the time
required to air dry a 400 mm diameter pine pole is in the order of 26 weeks compared to approximately 10
weeks for the sapwood of a hardwood pole. In summer, it takes at least 16 weeks to dry a softwood pole
as opposed to 6 weeks to dry a hardwood pole. The landed cost of a hardwood pole is 1.1 to 1.5 times the
cost of a similar strength pine pole (Hyne, 2006., pers. com.).
Price & Hackney (1996) highlighted the need for improved timber-treatment quality-monitoring activities.
Given the cost of pole replacement, it has been suggested that ensuring that poles are adequately treated
is important to prevent premature pole failure due to sub-standard treatment (Price and Hackney 1996).
Treatment costs
The specified minimum retention of CCA chemical for H5-treatment of hardwoods is 1.2% (Cu + Cr + As)
compared to 1.0% m/m (Cu + Cr + As) for softwoods (AS 1604.1 – 2005). These are results-based rather
than process-based specifications, timber treatment industry site specific treatment processes and
conditions have been developed to achieve the required retentions. The values presented in Table 23 are
industry averages and have been used to calculate the comparative costs of chemicals required to meet
the timber treatment specification. Based on the assumptions presented in Table 23, the costs associated
with treating the same sized eucalypt and conifer timbers are presented in Table 24. Costs for pre- and
post-treatment processing e.g. drying, have not been included in the calculations presented. On the basis
of the assumptions in Table 23, the information in Table 24 indicates that the cost of CCA chemical
time
Vacuum
Pressure
flooding
Figure 43 Schematic summary of vacuum pressure impregnation

October 2006
Australian timber pole resources for energy networks 104
applied to pine poles is 1.7 times the cost of chemical required for a similar sized eucalypt pole. However,
it is important to keep in mind that all costs associated with pre- and post-treatment have not been
considered in the calculations.
Table 23 Values used for calculations Item Hardwood Softwood
Pole diameter (mm) 400 400
Pole length (m) 12 12
Sapwood thickness (mm) 30 150
Solution strength (kg / L) 0.075 0.021
Cost of CCA ($ / kg) 5.25 5.25
Absorption (L / m3) 300 550
Table 24 Cost of chemical calculations
Item Hardwood Softwood
Sapwood Volume (m 3) 0.42 1.41
Absorption (L) 126 775
kg CCA 9.45 16.29
Cost of chemical $49.61 $85.50
Termite management
With regard to protecting poles against termite attack, Horwood (2004) explained that the power supply
industry has traditionally used arsenic trioxide dust and organochlorine termiticides to protect wood poles
from termite attack. Organochlorine termiticides include aldrin, dieldrin, chlordane and heptachlor (Peters
and Fitzgerald 2005). Horwood (2004) noted that the situation for termite treatments has changed
dramatically in the past decade, however, as a result of regulatory changes that have prohibited the use of
organochlorines since 1995. Furthermore, occupational, environmental and disposal considerations have
increased concerns about the continued use of arsenic trioxide. The chemical industry has developed
alternative chemicals to replace arsenic trioxide and the organochlorines, and some of these have been
approved for use on wood poles, although no evidence of efficacy that is specific to wood poles has been
published. Some of these chemicals are being used for termite control by some power supply authorities.
Concerns have been expressed about the efficacy and reliability of available chemicals and the lack of
knowledge about the efficacy and reliability of other termite treatment options that are, or could be,
available to the power supply industry prompted the Termite and Power Pole Research program
(TAPPER) to be initiated (Horwood 2004).
Horwood (2004) explained that the research objectives of the TAPPER program were to:
(1) Identify the most efficacious treatments for controlling termites in wood power poles;
(2) Reduce the costs borne by power supply companies associated with controlling termites;
(3) And to identify alternatives to arsenic trioxide dust.

October 2006
Australian timber pole resources for energy networks 105
Horwood (2004) noted that to achieve the study objectives, two trials were established. The first was a
service trial to test the efficacy of treatments for controlling termite infestations in poles in service, while
the second was a field trial to test the efficacy of soil barriers for protecting new poles from termite attack.
The study started in December 2000 and is scheduled for completion in 2007.
Results obtained in the first 12 months of the service trial were reported by Horwood (2004), and as the
field trial had only recently been established there were no meaningful results to report at that time. For
the service trial, 10 different treatments were applied to over 450 poles in a diverse range of environments
in NSW, and poles were inspected 1, 6 and 12 months after treatment to determine the relative
effectiveness of the treatments. The treatments included in the trial were a selection of registered
termiticides and experimental products chosen by the trial organising committee (Table 25). Treatments
were selected on the basis of potential efficacy and also compatibility with pole ground-line maintenance
procedures (Horwood 2004).
Table 25 Treatments included in TAPPER program (after Horwood, 2004)
Treatment type Active constituenta Brand name Use rate
Bifenthrin 100 g/L EC
Biflex ® 5 mL concentrate/L of water/10 L of soil
Chlofenapyr 240 g/L SC Phantom b,c 5.2 mL concentrate /L of water/10 L of soil
Chlorpyrifos 450 g/L EC Dursban Micro-Lo® 22 mL concentrate /L of water/10 L of soil
Fipronil 100 g/L SC Termidor®b,c 3 mL concentrated /L of water/10 L of soil
Imidacloprid 200 g/L SC Premise® 2.5 mL concentrate /L of water/10 L of soil
Chemical soil barrier
Permethrin 500 g/L ECe Perigen 500® 40 mL concentrate /L of water or diesel/10 L of soil
Arsenic trioxide 375 g/kg
Garrards Termite Powder®
Approximately 1-2 g dust/pole
Metarhizium anisopliae 3 x 10¹⁰ spores/g
Nilb,c Approximately Toxic Dust 10 g dust /pole Toxic dust
Triflumuron 800 g/kg Intrigue®c Approximately 5-10 g dust /pole
Timber fumigant Dazomet 990 g/kg
Basamid®f According to pole diameter; on average approx. 250 g powder/pole
a EC=emulsifiable concentrate; SC = suspension concentrate b Not registered when trial started c Used in North Power subtrial d Use rate based on advice by Aventis Crop Science; product registered at twice this rate i.e. 6 mL/L e Used in permethrin subtrial only f Registered as a soil fumigant but not registered for controlling termites in timber

October 2006
Australian timber pole resources for energy networks 106
Horwood (2004) noted that the results from each inspection were adjusted for changes in infestation rates
amongst controls and expressed as percentage reductions in infestation. All treatments were effective to
some extent, and a number were comparable to arsenic trioxide. Although effective alternatives to
conventional treatments were identified, single applications did not provide acceptable levels of control.
The use of combinations of treatments may achieve levels of efficacy acceptable to the power supply
industry (Horwood 2004).
Differences in efficacy were detected, revealing a ranking of treatment reliabilities. A number of treatments
had levels of effectiveness at least comparable to that of arsenic trioxide. Of all products tested, Horwood
(2004) found that the timber fumigant dazomet achieved the highest mean percentage reductions in
termite infestation. Dazomet is one of a group of fumigants that decompose into methylisothiocyanate
(MITC) as the active ingredient. Although this group of fumigants is used extensively in the USA for
protecting poles against decay, they are not used for controlling termites. While dazomet is registered in
Australia (as a soil sterilant), it is not approved as a timber treatment. Horwood (2004) suggested that
once regulatory approval has been gained, the power supply industry should seriously consider adopting
dazomet as a termite treatment. Moreover the potential for dazomet as a dual-action treatment, for decay
and termites, should also be investigated. It was noted that when dazomet treatment failed, the treated
pole generally had a large longitudinal crack running through the treated zone. Termites were able to build
runways in these cracks and traverse the treated section apparently unaffected. It is possible that cracks
in poles allow MITC fumes to dissipate and not reach effective concentrations. Procedures for managing
cracked poles will be needed if dazomet comes into use as a remedial treatment for termite infested poles
(Horwood 2004).
Horwood (2004) noted that TAPPER results demonstrated that the alternative dust treatments of
Metarhizium and triflumuron were not as effective as arsenic trioxide. The effectiveness of Metarhizium
declined as the trial progressed, which presumably was a function of the mortality of infective spores. A
negative aspect of Metarhizium was its susceptibility to high temperatures, and the care required
protecting it from extremes of temperature. On the other hand, as a natural product it may prove
acceptable where chemicals such as arsenic trioxide do not. Metarhizium is not registered as a termiticide
in Australia, nor is it manufactured commercially for this purpose. Consequently, the likelihood of its
eventual development as a marketable commodity is not known. It is hoped that the results from the
TAPPER program may provide some impetus for commercial development (Horwood 2004).
The TAPPER program also revealed that the performance of triflumuron was consistent, but mean
percentage reductions in infestation never exceeded 50% in the Service Trial or the NorthPower Subtrial.
Triflumuron lacks the activity of arsenic trioxide and results suggest that more than one application is
needed to achieve acceptable performance (Horwood 2004).
Horwood (2004) explained that Fipronil, the most effective soil treatment, was only released onto the
Australia market approximately 12 months ago. At the start of the TAPPER trial, the manufacturer
recommended that fipronil should be used at an active ingredient concentration of 0.06% (3 mL

October 2006
Australian timber pole resources for energy networks 107
concentrate /L of water). Contrary to this advice the product was eventually registered at 6 mL per L. Used
at the higher rate, fipronil could be expected to be even more effective than indicated in the trial (Horwood
2004).
TAPPER research also showed that permethrin effectiveness was significantly impaired by the use of
diesel as a diluent. This may be a reflection of the repellent effect that diesel may have on termites, which
forced them to move away from the treated soil rather than coming into contact with toxic chemical
residue. As a result, termites continued probing the barrier until a way through or under it was discovered
(Horwood 2004).
Future of current approved preservative treatments
The Australian Pest and Veterinary Medicines Authority (APVMA) restricted the use of CCA timber
preservatives as from 11 March 2006. It is important to note that the use of CCA to protect certain
products is restricted rather than prevented all together. Products that may not be treated with CCA
include domestic decking, children’s playground equipment and picnic tables. The APVMA used the
‘precautionary principle’ in developing their decision/recommendations as no properly conducted scientific
research could be found to prove that contact with CCA treated timber was a health hazard. The APVMA
do not require that existing CCA treated structures be removed from service. The APVMA report required
a number of other findings to be implemented including operator training, environmentally sound design
and operation of timber treatment plants as well as branding of treated timber. The future of CCA as a
timber preservative is unclear as its continued use is dependent on non-technical influences.
Creosote can be applied as an oil based treatment or as Pigment Emulsified Creosote which is an
oil/water emulsion. Whilst creosote treatments are approved by the various treatment specifications for
treatment to H5 level, industrial union resistance has effectively eliminated its use as a preservative
treatment for poles in Australia. Creosote is still used extensively in the USA for the treatment of power
poles.
Alkaline copper quaternary (ACQ) is approved for H5-level treatment of softwoods and hardwoods in the
Australian Standard. The cost of treatment with ACQ is currently about 2 to 3 times the cost of treating
with CCA. The product pre and post-treatment conditioning is the same and the increased cost is in the
treatment operation only.
Remedial treatment of poles
Considerable initial research has been undertaken overseas into remedial treatments intended to extend
the useful service life of transmission poles in service (Braid and Line 1984). Internal and external decay
as well as termites are the major issues. A zone approximately 500 mm above and below ground line of a
standing pole has been identified as the most hazardous in terms of biodeterioration. Biocides may be
applied in various ways to this critical zone using methods intended to prevent further deterioration.

October 2006
Australian timber pole resources for energy networks 108
Biocides applied to the surface of a pole are usually covered with a protective wrap designed to keep the
biocide in place and prevent dilution or dissolution into the surrounding soil.
Early remedial treatments involved the use of a paste or gel applied to the surface of the pole or pumped
into a central void through an access hole intended to be used for topping up the biocide during future
inspections. Surface application was done with a spatula, brush or watering can and tended to be difficult
to use and messy. More recently, a commonly used system in Australia involved the use of diffusing
boron. Pellets are held in place in a blister wrap and the wrap was fixed to the pole surface during the
backfilling process.
Internal treatments were carried out by drilling abaxially into the pole finishing up at the ground line. Rods
were then dropped in to holes and a plastic cap was screwed in place. The principle behind these diffusion
treatments is that when the timber is wet enough for decay to occur, there is enough moisture present to
allow the pellets or rods to dissolve into the surrounding wet timber.
Figure 44 Boron penetration in a DC 1 pole
The photograph in Figure 44 reveals the extent of boron penetration in an untreated durability class one
pole. Sections have been cut through the pole both above and below ground line and an indicator that
turns red in the presence of boron has been applied. The photograph also shows the holes into which the
boron rods have been inserted. The photograph shows that the boron has diffused into the heartwood
providing protection to the centre of the pole.
Fumigant rods are commonly used to treat softwood poles in the United States. In this case, the rods turn
to gas in the presence of moisture releasing a toxicant that then moves through the internal regions of the
pole sterilizing any decay that might be present. The performance of this system in Australian eucalypt
poles needs to be investigated (Morrell, 2006., pers comm.).
There is great potential for remedial treatments such as bait technologies to be used to prolong the useful-
life of poles. Recent research has highlighted the potential for bait technologies to be exploited for the
remedial treatment of poles. Peters and Fitzgerald (DPI&F) are developing remedial termite treatments for
poles that involve bait technologies using chemicals that are not toxic to mammals but eliminate termite
nests.

October 2006
Australian timber pole resources for energy networks 109
New treatment technologies
A number of techniques have been developed to improve the performance of low durability timbers for use
as power poles. Commercially available techniques include through boring (Rhatigan and Morrell 2003)
and various methods of incising (Mohler 1969). Boring techniques essentially involve drilling holes into a
pole in a regular staggered pattern, while incising involves cutting slit-like incisions into a pole up to 2 cm
deep, 2 cm long, and parallel to or at a small angle to the grain in a regular staggered pattern. Both
techniques are designed to help timber preservative fluid flow into otherwise impermeable wood. The
impact of these techniques on the mechanical properties of through bored or incised poles have been
determined for some softwoods, and optimum boring and incising patterns have been identified that cause
a minimal reduction in strength while also reducing the variation in strength amongst pole populations. The
effectiveness of these permeability enhancing techniques on Australian hardwoods is unknown.
A novel technique currently being explored to impregnate timber with timber preservative involves the use
of supercritical fluids to transport timber preservative compounds into the timber. The biocides are
dissolved in liquefied carbon dioxide. The solution behaves like a gas in its movement into the timber and
upon release of the applied pressure; the compressed (liquid) carbon dioxide reverts to a gas leaving the
biocide in the timber. The system is not yet commercial and has not been evaluated for hardwood pole
sized material (Kang and Morrell 2003). The technique is unlikely to be economically viable for poles at
this stage.
Microwave energy has been applied to plantation grown small diameter eucalypt timbers in an attempt to
improve their permeability prior to treatment with timber preservatives (McCarthy, Cookson et al. 2005).
Whilst effective on small diameter material, the commercial viability and practicality for treatment of pole-
sized material is unknown. Further work is being carried out by the Cooperative Research Centre for
Wood Innovations Australia.
8.5. Other technologies for enhancing timber pole performance
Asset management
Holistic pole management practices are important to maximise the utilisation potential of timber poles.
During the ENA - DPI&F Wood Pole Resources Workshop in March 2006, expert guest speaker Professor
Jeff Morrell, recommended the procedures in Table 26 to make best use of preservative-treated softwood
poles. Softwood poles are the main type of timber pole available in the USA, but most of the
recommended procedures are also applicable to timber poles in general.

October 2006
Australian timber pole resources for energy networks 110
Table 26 Recommendations for treated softwood poles (after Morrell, 2006) Procedure Details
Improved pole treatment
• Season all poles properly before treatment
• Pre-bore and cut all poles
• Incise or through bore/radial drill or kerf cut refractory species
• Undertake post treatment analysis and inspection to assure quality
Best management
practices
• Limit preservative retention to that prescribed in Standards
• Reduce surface deposits on poles
• Limit potential for bleeding of preservatives (important for creosote)
• Allow time for adequate fixation of waterborne preservatives
Cradle to grave
management
• Good initial specification
• Quality control inspections
• Careful installation
• Regular inspection program maintained
• Aggressive maintenance
• Pole reinforcement when required
Based on timber recycling research, a ‘cradle to cradle’ approach has been suggested, where timber
removed from service and re-used for another application (Hopewell, 2006., pers. com.). This is reportedly
the case for some utilities in Australia, and disposal of treated poles is not considered a problem as
decommissioned poles are sought after to be used as fence posts, landscaping and other applications.
Disposal challenges may arise in the near future with an increase in the annual number of poles that are
envisaged to be decommissioned. When poles are removed from service, they often contain a large
proportion of sound timber, and timber recycling companies are being established around the country,
which would gladly accept decommissioned poles to be sawn to recover any sound wood for re-use.
Moreover, there is much potential to further develop processes to recover preservatives from waste
material that cannot be re-used prior to disposal.
Pole inspection and maintenance
Crews and Yeates (2000) noted that an ideal method of pole assessment would be able to indicate a
pole’s remaining strength, serviceability classification and remaining life with a level of reliability
commensurate with that of the rest of the network. Prior to the mid 1980s however, if inspection was done
at all, the procedure was usually minimal excavation followed by superficial examination and sounding
with an axe or hammer. Suspect poles were only sometimes drilled to examine their internal condition.
Based on anecdotal reports and industry experience Crews and Yeates (2000) showed that these
inspection methods did not keep the failure rate below acceptable levels and that waste also occurred
through excessive premature pole condemnation.
October 2006
Australian timber pole resources for energy networks 111
Crews and Yeates (2000) further explained that over the last decade or more, network managers have
developed improved asset management systems, which involve routine inspection of most poles being
undertaken in order to prevent the premature failure. They noted that the modern “section modulus”
inspection method is based on the assumption that remaining strength is proportional to the modulus of
cross-section of the sound wood in the critical plane. The section modulus method involves drilling
inspection holes into the pole in the ground-line region, estimating the depth of any decay voids and
examining the condition of wood shavings extracted during drilling. Any loss of cross-section is then
calculated, and the section-modulus (Z) is calculated by subtracting the area of decayed wood from the
theoretical sound wood area based on the pole diameter. The bending capacity of the pole is then
calculated as the product of the section modulus and the timber species’ standard strength (usually 80 to
100 MPa for traditional hardwood poles). The strength of the pole is assumed to be adequate not only at
the time of the test, but until its next inspection, if it is 100% or more than the required design load. While
this method is more reliable than the previous approach, it can still fail to identify the minority low-strength
“rogue” poles which often constitute the greatest risk of structural failure (Crews and Yeates 2000).
In concluding their analysis of current inspection practices, Crews and Yeates (2000) revealed that there
has been anecdotal evidence for some time, that while drilling for the section modulus method has
minimal effects on strength, especially if done in the neutral axis, inadequately-treated inspection-holes
may promote deterioration. Another limitation of the section modulus method is that a reasonable degree
of subjectivity is involved, associated with the position of drill holes and assumptions on the internal extent
of decay. Furthermore, it is also difficult to detect early decay, when a significant loss of strength may
have occurred without too much noticeable change in the appearance of wood-shavings.
Crews and Yeates (2000) provided the following analysis of in-grade and post failure bending capacity
research that had been undertaken:
• The traditional section modulus method will, over time, accurately predict the ultimate ground-line
bending capacity about 65-70% of the time, and significantly, it will overestimate the capacity of the
lower 5% of pole wherein “rogues” are likely to occur.
• Using the traditionally-derived section modulus method with strength group characteristic bending
properties (which are species-dependent) will improve the reliability of the residual strength prediction
significantly, with no over estimation at the lower tail and non-conservative predictions of the ultimate
ground-line bending capacity about 50 – 60% of the time.
• Any technology that accurately maps the critical ground-line section will yield further improvements,
with over estimation reduced to about 40% of the time and generally restricted to higher strength poles
in the population.
• Comparisons of the section modulus predicted using the common drilling method with the actual
values determined from analysis of pole segments indicates that below the ground-line face, the
common methods over estimated the section modulus by more than 10% in about 36% of cases and
overestimated it by more than 40% in about 11% of cases. The latter poles represent the “rogues”, as
the method does not account for the loss of pole strength in-service. The mechanisms for fibre
strength degradation are not fully understood.

October 2006
Australian timber pole resources for energy networks 112
Despite these findings, pole failures are not as likely as one might assume on account of the bending
capacities of poles being much stronger than is assumed in pole specifications. Furthermore, the safety
factors that have traditionally been used are considered very conservative and not commensurate with
reliability-based design procedures.
In the case of a pole decaying from the inside outwards, a loss of cross section will result in a reduction in
a pole’s strength. The form of the loss is important however, and a simplistic analysis of this issue reveals
that of the area of a transverse section of a pole, 90% of bending strength can be attributed to the outer
40% of total diameter13. The same applies to stiffness, as the moment of inertia (used to calculate
stiffness) and the section modulus (used to calculate bending strength), are both proportional to the pole
radius if a pipe is assumed as a model for calculations. A different engineering calculation is involved if the
cross sectional loss is from around the outside of the pole. Further research is required to quantify the
rates at which an internal reservoir of decaying wood accelerates the deterioration of the otherwise
durable surrounding heartwood.
Several authors have provided evidence of the need for the limit-state procedures currently being
incorporated into timber pole design standards and specifications. Like the updates of characteristic
standard strengths for new poles of particular species based on in-grade research, maintenance
procedures also need updating for improved reliability.
Based on in-grade tests of ex-service poles, Yeates, Crews et al. (2004), found that while there appeared
to be minimal loss of stiffness (MOE) with time in service, there was an observed loss of strength (MOR)
with time in service. They compared new pole design characteristics with ex-service data for the same
species and found that:
• There appeared to be little reduction in MOE with time, presumably as a result of two opposing effects
– the loss of section due to deterioration of the wood, and the increase in stiffness due to progressive
seasoning.
• There appeared to be a reduction in MOR with time in service. The data showed a significant
reduction in the first fifteen years of service, then a steady reduction with time beyond that point. This
trend was quite obvious with the spotted gum data but not so apparent in the data from other species.
The loss of strength with time observed was another phenomenon that had not previously been
considered in design and maintenance Standards (Yeates, Crews et al. 2004).
13 Anecdotal evidence s uggests that the outer 40% of a pole’s diameter can account for up to 90% of its strength.
Assuming that a pole is completely homogeneous, its stiffness is a function of the moment of inertia, I, and its strength
is a function of the section modulus, Z. For example, if a pole has a radius of 1 unit of measurement:
§ I of the inner 60% = p .r^4/4 = 0.102 (r = 0.6) I of the full section = 0.78 (r=1)
Therefore outer 40% provides about 87% of that pole’s stiffness
§ Z of the inner 60% = I/r = 0.17 (r = 0.6) Z of full section = 0.78 (r=1)
Therefore outer 40% provides about 78% of that pole’s strength
In practice, however, the outer heartwood is commonly denser than the inner heartwood, so it is likely that the outer
40% will probably provide more strength than the geometric calculation suggests. Further investigation is required.

October 2006
Australian timber pole resources for energy networks 113
When attempting to predict the strength of poles in-service, decay and other types of deterioration change
both the physical properties and the pole’s effective cross-section. It is quite challenging to estimate the
extent and geometry of these changes and hence difficult to determine a pole’s residual strength. Non-
destructive testing devices that are able to determine the extent and geometry of timber that has
deteriorated are highly desirable. Crews (2002), tested non-destructive evaluation (NDE) devices by
comparing their classifications of poles with subsequent in-grade destructive test data. The performance
of a range of instruments for measuring pole strength and / or loss of wood in the critical plane were
evaluated, and the PortaCAT 1, TRU-TECH and Foley devices present a significant improvement to
current best practice (CBP, the drilling and section modulus method). The LOGIN, Resistograph 1,
Resistograph 2 and Inspector instruments were considered to offer comparable reliability to the CBP,
while the PortaCAT2, Sibert, Sounding, DK Tector, Shigometer, Curtin, PURL and AutoSCAN
technologies were found to have some deficiencies compared with CBP. The Integrity 2, PortaCAT 3,
Tracero 1, Integrity 1 and Attar instruments were generally not considered satisfactory at the time the
research was undertaken (Crews 2002). Wang, Ross et al. (2000) reported that longitudinal stress-wave
methods can be used to evaluate the potential quality of the wood in used preservative-treated piles
removed from service. Although creosote and surface defects in used piles have effects on stress-wave
propagation, good correlation was found between stress-wave-based modulus of elasticity measurements
and corresponding flexural properties of boards and small clear wood specimens obtained from the piles
(Wang, Ross et al. 2000).
There are several other NDE technologies that have been proven to be effective in determining the
strength characteristics of timber by analysing living trees, however, the applicability of these instruments
for measuring pole deterioration is yet to be proven. There is great potential for NDE instruments to be
used during harvest operations to select suitable logs to be diverted to pole production, and further
investigation is highly recommended.
Pole reinforcements
Pole reliability toward the end of its useful life can be enhanced by using pole reinforcements, and they
are commonly used in the USA in conjunction with remedial treatments (Morrell, 2006., pers com.). Pole
reinforcements like the steel ‘pole nails’ that have also become common in Australia, can prolong the life
of a pole by about 15 years provided that adequate remedial treatment is applied to arrest and prevent
any further pole deterioration (TPAWG, 2006., pers. comm.).
Fire retardant treatment
Some fire retardant treatments are being investigated for use to minimise the occurrence of pole-top fires
in Australia, and given the level of interest expressed by utilities, further research would be desirable.
There are some spray-on fire-retardant treatments available in the USA, where softwood poles are very
common. These treatments are applied near ground-line to protect poles from brush fires, however there
are no common treatments for pole-top fires as they are minimised through regular maintenance and
cleaning of conductors (Morrell, 2006., pers. comm.).

October 2006
Australian timber pole resources for energy networks 114
9. Research and development recommendations
Australian energy providers are facing major challenges for management of their distribution
infrastructure. Whilst the demand for traditional high-durability native forest hardwood poles is increasing,
their availability is decreasing. Given that there are more than five million timber poles currently in-service
throughout the country, identifying optimum alternatives is a major public infrastructure issue. Timber
poles have many desirable properties, and while the native forest hardwood resources are becoming less
available, there are alternative timber pole resources that have potential to replace the traditional
resource. It is vital that stakeholders work together to plan for the future.
Workshop Recommendations
As part of this review project, a workshop was held in Brisbane in March 2006 for representatives of
stakeholder groups including pole producers, suppliers and consumers. Information gathered during
preparation of this review document was presented at the workshop, and attendees were given a forum to
identify the issues considered most important for optimum management of pole supply shortages. In
summary, the major issues were:
A. Urgent characterisation of alternative resources to ensure their reliability in-service
B. Improved communication between stakeholder industries
C. Fully optimise asset management and communication of product requirements
The following specific recommendations / activities were considered most important by 45 workshop
attendees representing pole producers, suppliers and consumers. Recommendations are listed in order of
priority as determined by the number of votes by workshop attendees, which are listed in brackets along
with the major issue listed above that they relate to.
• Alternate product development [45, A]
Research and development to demonstrate or develop alternative poles to ensure that they are fit for
purpose needs to be presented to stakeholders for consideration.
• Records [39, B, C]
Robust, industry-wide demand forecasts need to be generated for all energy networks and data needs
to be readily available to potential pole producers and suppliers.
• Education (dialogue) Government & Industry [35, B]
Provide pertinent information to decision-makers within energy networks and government agencies
responsible for resource utilisation policies. In particular, resource owners and managers need
information on options for managing their forests for pole production.
October 2006
Australian timber pole resources for energy networks 115
• Extending pole service-life [34, C]
Increase the service-life of poles currently supporting energy networks and improve the reliability
associated with pole maintenance, inspection and remedial procedures.
• Consolidated industry voice [31, B]
Pole stakeholder industries are fragmented and optimum management of pole supply problems would
be facilitated by representatives of all stakeholder industries working together. A united industry voice
would be valuable during consultation with government authorities for assistance to undertake the
research and development urgently required.
• Performance data [29, C]
Performance data are required for alternative resources including plantation hardwoods, plantation-
grown softwoods, timber composites and the lower durability hardwood species that are reported to be
immediately available.
Communication of performance-based design requirements to forest owners would facilitate more
secure and longer-term supply opportunities of timber pole resources.
• Vertical integration along supply chain [27, B]
Communication between stakeholders could be improved, especially with harvesting operators,
resource owners and resource managers.
• Communication within stakeholder groups could be improved [23, B]
Internal communication of supply issues is complicated by the uncertainty involved with supply of the
traditional resource and the supply and performance of alternative pole resources.
• Data management / collection [21, C]
Most individual stakeholders continue to improve data management recognising the necessity of
reliable information to ensure optimum longer-term management of poles in-service and pole supply.
• Harmonised standards and specifications [20, A, B, C]
A number of somewhat complex standards apply to the production and utilisation of timber poles.
More accurate and reliable reference information is required by engineers and designers.
Considerable important revisions of standards continue to improve pole standards and specifications.
The national standard AS 2209 Timber – Poles for Overhead Lines includes specifications for 83 pole
species, but the specific requirements of different pole consumers vary throughout the country. AS
2209 is currently under revision and dialogue with pole producers and suppliers was considered
important to clarify product requirements. Workshop participants highlighted the importance of
maintaining and enhancing the flexibility of standards and specifications. Performance-based product
requirements were considered essential for identifying suitable alternatives.

October 2006
Australian timber pole resources for energy networks 116
• Best practice manuals [10, C]
Whilst standards are being revised and best practice documents are being prepared for network
design requirements, pole producers and suppliers highlighted the need for clarification of
performance-based product requirements.
• Workshops [10, B]
A forum to facilitate necessary dialogue between pole stakeholder groups was considered important
by some participants, especially producers and suppliers.
Review Recommendations
Based on the information gathered during this study, the following research and development priorities
were recognised for timber pole resources in Australia.
Recommendations for improved communication between stakeholder industries
Recommendation 1: Strategic communication and extension to facilitate more accurate forecasts
of potential supply of pole timber
There are many benefits associated with the use of timber poles, more definite quantities of alternative
timber pole resources need to be identified to help manage current supply shortages.
The opportunities for pole production need to be conveyed to the widest possible audience of individual
forest owners and managers. Pole product requirements need to be clearly explained, along with the
benefits of pole production, and the potential for performance-based investigations to be undertaken to
identify alternative timber pole resources suitable for pole production. Adequate time and resources need
to be allocated so that appropriate silvicultural modelling techniques can be utilised to generate reliable
data based on updated pole specifications and resource characterisation studies. This information would
facilitate economic studies to obtain more reliable predictions for the likely cost of alternative timber pole
resources over time and would assist negotiations between pole consumers, producers and suppliers to
secure supply. With the support of research organisations, stakeholders are encouraged to work together
to complete any research and development necessary characterise and develop alternative resources.
Recommendation 2: Identify and secure future pole supply from native forests and plantation
forests
There may be potential to secure and increase the supply of poles from private native forests, and
research is required to identify potential additional resources and optimise pole production. Firstly,
accurate and up-to-date inventories of potential pole supply from private native forests in different regions
need to be determined. This information would benefit timber producers and pole consumers by facilitating
the subsequent development of business cases that would clarify the benefits of sustainably managing
private native forests for the production of poles. Secondly, for the benefit all stakeholders in the supply

October 2006
Australian timber pole resources for energy networks 117
chain, it is also recommended that advisory information be prepared detailing best management practices
for pole production.
Cooperative efforts to plan long-term pole supply are required to prevent future supply shortages., and
establishing sustainable, renewable plantation forests to be managed with an appropriate focus on pole
production is strongly recommended.
Recommendation 3: Establish a forum to facilitate communication between stakeholder industries
Throughout the country, energy network managers, forest managers and pole producers are faced with a
common problem. A cooperative approach is therefore recommended to facilitate the research and
development required to ensure optimum use of alternative poles and to maintain communication between
stakeholder industries.
In the USA, the naturally durable species that were traditionally used as utility poles have long been
unavailable, and less durable species are now most commonly used. These species require the
application of supplemental preservatives to provide long-term service. A Utility Pole Co-operative
Research Program was established in 1980 in the USA, and this organisation may serve as a model for
Australia. The US Utility Pole Co-operative (Co-op) was originally established to develop new fumigants
for the remedial treatment of poles, to assess the effects of air seasoning, and pole properties. The Co-
op’s focus now includes a wide variety of issues to improve pole performance and make utilities more
competitive. Both tangible and intangible benefits are offered to Co-op members. First, members have
access to information on solutions to a variety of wood issues. In addition, they have input on what
problems are addressed and, in many cases, the information developed originates from poles in their
systems. The intangibles of Co-op membership include the opportunity to exchange information with other
timber pole users and identify similar problems. In the USA, this component of the Co-op has become
increasingly important as deregulation has pitted utilities against one another and limited the potential for
exchange. The US Pole Co-op also assists utilities with review of specifications and, to a limited extent,
can assist with analysing pole failures.
Every two or three years, a work plan is circulated to current and potential Co-op members who comment
on the scope and value of the proposed work. The comments are then used to formulate a single proposal
which addresses a number of objectives common to the members. Researchers then perform the
proposed work, usually in conjunction with member utilities and suppliers. Many of the field test sites are
located in member utility systems in order to produce data that are more meaningful to member utilities.
The current work of the US Co-op is divided into a series of overall objectives that include:
• Identifying and evaluating methods for controlling internal decay in poles;
• Identifying methods for field treatment of surface damage to treated wood;
• Developing improved specifications for timber poles;
• Evaluating the effectiveness of external ground-line treatments; and

October 2006
Australian timber pole resources for energy networks 118
• Developing information on the performance of new preservatives for timber poles
Recent outcomes of the USA Utility Pole Co-op include:
• Development of fumigants to control internal pole deterioration;
• Assessments of non-destructive pole inspection devices;
• Assessments of the performance of external preservative systems to control surface decay;
• Assessment of fire retardant properties of various preservative treatments for timber poles; and
• Co-sponsoring pole conferences to allow utilities to learn about various pole materials.
The Co-op is a consortium of utilities, chemical companies, wood treaters, and inspection agencies that
work under a single unified work plan. All members provide some level of financial support and sign a
universal agreement outlining member rights and privileges.
If such an organisation were to be established in Australia, assistance from Government research funding
providers could be sought in recognition of the willingness of stakeholders to cooperatively support
research to identify optimum future pole resources.
Recommendations for characterisation and development of alternative resources
Recommendation 4: Characterise strength, durability and form of Australian plantation-grown
hardwood poles
Very limited testing has been undertaken to characterise Australian plantation-grown hardwood pole
resources, and further investigation is required to measure key pole properties with sufficient accuracy
and reliability for modern best practice design and engineering.
Strength tests of entire poles are important, as is in-grade durability research. Field research installations
or service-trials need to be established and the performance of alternative poles should be monitored over
time. Accelerated durability tests would be useful to examine the relative natural durability of plantation-
grown hardwoods in the short-term.
In addition to sawlog-quality logs, plantation thinnings and logs with properties not ideal for sawn timber
production may be quite suitable for the production of poles and further investigation is recommended.
Continued development of practical tools to identify trees that satisfy pole specifications and processes to
manage and track logs post harvest are desirable. The use of NDE techniques is increasing in forest
operations, and further development and calibration of these tools for use during harvesting operations is
recommended.
There is potential to take advantage of novel preservatives and treatment technologies to further enhance
the durability of hardwood poles, especially for the region of poles that is in contact with the ground.
Improved preservative penetration is crucial if lower-durability species are to be more widely used.
October 2006
Australian timber pole resources for energy networks 119
Recommendation 5: Characterise strength, durability and form of Australian plantation-grown
softwood poles
Some further characterisation of plantation-grown softwood pole resources is necessary, and it is
recommended NDE techniques be included in characterisation studies. NDE measurements can be
calibrated and refined using the results of traditional laboratory-based destructive tests so that NDE tools
can reliably be used to select of pole-quality trees or logs in the field.
There are opportunities to obtain further evidence of the performance of the 130 CCA-treated P. elliottii
poles that were installed into networks in Queensland as it has been five years since the performance of
these poles was reported. Similarly CCA -treated Pinus poles installed in Western Australia could
potentially be assessed. Selected poles could be removed from service for in-grade tests to further
validate their strength over time.
In consultation with pole users, optimum bark removal methods need to be documented.
There are several promising traditional and novel seasoning technologies that can be trialled for
accelerated drying of Australian plantation-grown softwood poles. The relative effects that different
seasoning techniques have on the strength of poles could also be examined as part of seasoning trials.
Recommendation 6: Characterise strength, durability and form of lower-durability native forest-
grown hardwood poles
Lower-durability species were reported to be available for pole production, and utilisation of this resource
for the short -term has been suggested to alleviate current supply difficulties until suitable plantation
resources are established and become available.
Further characterisation of durability class 3 and 4 native forest pole resources is necessary, especially
those for which there are insufficient data available regarding their performance in-service as utility poles.
When specific potential resources are accessible, research and development activities can take place to
characterise typical poles in terms of their strength, durability and physical characteristics (such as their
relative proportion of sapwood), to identify and maximise their utilisation potential. Ideally, NDE techniques
should be included in these studies.
Optimum post-harvest practices to control the stresses that lead to the development of spits during
seasoning and in-service may need to be determined for some species.
Even though the heartwood of many durability class 3 and 4 native forest-grown eucalypts is quite strong,
their susceptibility to biodeterioration has prevented their wider use. Using current treatment technologies,
only the sapwood of most eucalypts can be adequately treated with the preservatives that are currently
approved in Australia for H5 applications. Pole pre-treatment processes such as through-boring, incising
and microwave heating may improve preservative penetration through refractory heartwood, and further
investigation is recommended. Alternative preservatives can also be examined.
Recommendation 7: Examine design options and characterise strength and durability of
composite poles
Glued or mechanically connected timber composite poles are becoming more popular in Australia. Some
technologies and designs are more developed than others and there is excellent potential for further
innovation.

October 2006
Australian timber pole resources for energy networks 120
There are several very favourable composite technologies and pole design options available for producing
poles from shorter-length logs. The use of shorter-rotation plantation logs has several benefits, and
shorter-length native forest-grown poles are reported to be more readily available in some areas. Shorter
poles are also favourable for pole treaters and suppliers as more than one log may fit within the length of
preservative-treatment vessels and shorter poles are more convenient to handle.
When novel composite poles are developed, in-grade tests are desirable. While in some cases there are
data available regarding the properties of the components of composite poles, testing them in their final
form confirms the reliability of assumptions regarding the structural characteristics of the combination of
pole components.
Recommendation 8: Select and plant plantation timber varieties specifically for pole production
It is recommended softwood or hardwood hybrids are selected and planted specifically for pole products
and managed under customised silvicultural regimes to optimise stem quality according to pole criteria.
The silviculture needed would consider site quality impacts on stem properties and how stands can be
managed to optimise critical pole properties. Decision support systems to refine tree breeding and
silvicultural management are being developed for structural pine framing products and extension of these
systems to pole products could be a readily achieved with some additional investment in research and
development (Harding, 2006., pers. comm.).
Nolan, Washusen et al., (2005) noted that the major issues that need to be addressed for the solid wood
products industry as it moves to a plantation hardwood resource are log availability and improved
production organisation techniques. They noted that the primary areas that require research include:
• The general parameters of growing and processing suitable logs are known but there is considerable
uncertainty in the sensitivities of the boundaries of practice;
• Determining the growing cost and value of logs grown specifically for high value solid wood products;
• Improved understanding of market structures, the impact of particular wood characteristics on product
value and related economic aspects;
• Improved log availability modelling from the plantation and native forest estate;
• Increasing value from the current plantation resource by optimising processing to minimise degrade,
especially during drying;
• Exploring the mechanisms and control of growth stress and tension wood effects;
• Refining understanding of the interactions of site, species and silviculture;
• Improvement of log output and quality through tree breeding.
Importantly, Nolan, Washusen et al., (2005) suggested that work in these areas should be deliberate
comparative studies, operating across species to a standard methodology that integrates growing and
processing results, and provides improved assessment data for plantation inventory and economic
modelling.

October 2006
Australian timber pole resources for energy networks 121
Recommendations to optimise pole quality and performance
Recommendation 9: Examine alternative preservative treatments
In conjunction with pre-treatment technologies, new preservative treatments and formulations can be
examined for potential to improve treatment of lower-durability native re-growth hardwood poles and
plantation-grown hardwood poles.
Recommendation 10: Investigate and develop remedial pole treatments
Further research is required to determine the efficacy of remedial pole treatments that are used overseas,
and to investigate the performance of novel treatments. These include fumigants as well as internal and
external solid pole treatments. Recently-developed bait technologies could also be investigated for the
safe and simple remedial treatment of termite-infested poles.
Recommendation 11: Further development and characterisation of non-destructive timber
evaluation technologies
With the aid of in-grade testing, further development, calibration and validation of NDE instruments would
be beneficial, for both pole selection and for inspection of the condition of poles in-service. Non-
destructive pole assessment technologies have the potential to increase the accuracy of inspection
procedures, further improve timber pole performance reliability, and minimise the incidence of premature
retirement of poles from service.
Recommendation 12: Identify common decay fungi and characterise the rates and effects of the
decay they cause in common pole species
Calculations of the strength remaining in poles that contain decay would be much more reliable if they
were based on knowledge of the relative progression of particular decay fungi, and knowledge of the
different effects that these fungi have upon the structural integrity of common pole species.
Recommendation 13: Establish linkages to take advantage of previous research
USA and Europe have much experience with alternative pole materials, especially softwoods, and there
has been a reasonable amount of research undertaken overseas into growing Australian eucalypts as an
exotic species. In South America and South Africa for instance, industries have successfully been
established to profitably process this resource. Considerable variation exists between trees of the same
species grown in different regions of the same country, and differences may be expected to be even
greater when comparing the Australian resource with that grown overseas. Furthermore, it is necessary
that poles produced from these materials perform in Australian environments. Although the
characterisation of the Australian plantation-grown pole resource from different regions throughout the
country is required to accurately forecast pole performance, it would nevertheless be useful to establish
links with researchers from the aforementioned countries.

October 2006
Australian timber pole resources for energy networks 122
Recommendation 14: Update design recommendations to ensure optimum pole use and reliability
Given the extensive research already completed during the Design for Durability program (FWPRDC and
collaborators), major benefits would flow from additional investment to further calibrate models using
deterioration data collected for poles in-service and research to characterise alternative resources. The
development of models for strength deterioration that is not caused by decay, like mechanical degradation
would be valuable, as would further calibration of the Design for Durability termite hazard map specifically
for timber utility poles.
Furthermore, information generated during the Design for Durability research program can be used to
ensure that the most durable poles are used in environments that present a high biodeterioration hazard.
It would be useful to use detailed maintenance and inspection records and research data to continue to
refine standards and specifications.
Recommendation 15: Develop best practice manuals for pole manufacture, maintenance and
inspection
It is essential that up-to-date information be readily available to all stakeholders to ensure optimum value
and reliability of poles in-service, and to maximise the utilisation potential of Australia’s timber pole
resources. Whilst best practice documents are being prepared for standard network design requirements,
the preparation of a user-friendly manual of best practice for pole manufacture, inspection and
maintenance would be beneficial to maximise the utilisation potential of timber poles. The best practice
manual would assist pole producers and suppliers to ensure maximum production of optimum-quality
poles, and would assist pole consumers to more confidently identify quality poles and better understand
timber pole assets. Such a document would supplement standards by listing necessary reference
material, summarising the requirements for poles, and providing key examples and pictures that are
beyond the scope of standards.

October 2006
Australian timber pole resources for energy networks 123
10. Conclusions
Considerable economic benefits would flow from securing the supply of timber poles and undertaking the
research and development necessary to reliably characterise alternative timber pole resources. More than
$1.89 billion is likely to be invested over the next decade to obtain the quantity of utility poles that are
expected to be required, and the continued use of timber poles presents a potential saving of $620 million
to $5.64 billion.
Timber poles have considerable environmental advantages, and sustainably-managed forests are a
renewable resource. Analyses accounting for raw material production, treatment, installation, inspection,
maintenance and disposal of poles have highlighted that considerably less energy is required to produce
timber poles and significantly less greenhouse gasses are generated during their manufacture. Carbon
sequestered by trees as they grow also serves to mitigate the build-up of atmospheric carbon dioxide, and
this carbon continues to be held within the wood that is produced, long after it has been converted into a
final product. When poles are removed from service, they often contain a large proportion of sound timber,
and the timber recycling companies becoming established around the country would gladly accept
decommissioned poles to recover any sound wood for re-use. Moreover, there is much potential to further
develop processes to recover preservatives from waste material that cannot be re-used prior to disposal.
Timber poles have favourable dynamic strength properties and they are not conductive, which is an
important factor for medium voltage lines (less than about 110 kV) as conductive poles require different
earthing and insulation systems. Given that about 80% of the poles in Australian energy networks are
timber, an additional cost would be incurred if they were to be replaced with conductive structures as
earthing systems would require modification and additional alternative electricity cable fittings would need
to be acquired and stocked. Timber poles are relatively convenient to handle and their fittings can easily
be modified in-service, which is commonly necessary at some stage during a pole’s lifetime, for example
when communication cables are installed.
Strategic and holistic management is required to address pole supply shortages, despite the intricacy of
government and commercial environments.
To address immediate shortages, the opportunities for pole production need to be conveyed to the widest
possible audience of individual forest owners and managers. Pole product requirements need to be clearly
identified, along with the benefits of pole production, and the potential for performance-based
investigations to be undertaken to identify alternative timber pole resources suitable for pole production.
Adequate time and resources need to be allocated so that appropriate silvicultural modelling techniques
can be utilised to generate reliable data based on updated pole specifications and resource
characterisation studies. This information would facilitate economic studies to obtain more reliable
predictions for the likely cost of alternative timber pole resources over time and would assist negotiations
between pole consumers, producers and suppliers to secure supply.

October 2006
Australian timber pole resources for energy networks 124
To secure supply and prevent future pole shortages, cooperative efforts to plan long-term pole supply are
required. Establishing sustainable, renewable plantation forests to be managed with an appropriate focus
on pole production is strongly recommended.
With the support of research organisations, stakeholders are encouraged to work together to complete
any research and development that is necessary characterise and develop alternative resources. Despite
the fact that alternative timber poles to the traditional mature native resource are urgently required, it is
vital that any new alternatives be adequately characterised. Given the importance and scale of energy
distribution networks, it is essential the performance of alternative poles in-service is dependable and that
all required data are provided for reliability-based network design procedures. It is strongly recommended
that in-grade testing techniques are used as part of resource characterisation studies whenever possible.

October 2006
Australian timber pole resources for energy networks 125
11. Acknowledgements
The assistance of the following individuals who kindly provided valuable information for this revi ew is
gratefully acknowledged:
Mr Henry Kent, Secretary, Timber Pole Availability Working Group (TPAWG) of the Power Poles & Cross
Arms Committee (PP & CC), Energy Networks Association of Australia (ENA)
Mr Terry Lampard, Chairman, TPAWG, PP & CC, ENA
Members of the ENA Timber Pole Availability Working Group PP & CC, ENA
Professor Jeff Morrell, Department of Wood Science and Engineering, Oregon State University, USA
Professor Keith Crews, Centre for Built Infrastructure Research, University of Technology Sydney
Mr Chris Bragg, Mr Chick Robb, Mr Sam Ingram, Mr Peter Moore, Mr Jeff Walls, DPI-Forestry14 (Qld.)
Ms Suzie Aron, Department of Natural Resources, Mines and Water (Qld.)
Mr Peter Paunovic, Mr Ron Fussell and Mr Bob Orman, State Forests New South Wales
Mr Pat Groenhout, VicForests
Mr Alan Glass, Forestry Tasmania
Mr Dennis Clancy and Mr Rob Coulsen, Powercor (Vic.)
Mr Ian Thompson, Country Energy (NSW)
Mr Kevin Warren, Ergon (Qld)
Mr Rodney Morrison, ActewAGL (ACT)
Mr Chris Pemberton, Power and Water Corporation (NT)
Mr Paul Jacobs and Mr Mark Pettigrew, Western Power (WA)
Mr Robert Crump, Aurora Energy (Tas.)
Mr Peter West, ETSA Utilities (SA)
Mr Andrew Exton, Koppers Wood Products Pty. Ltd. (Tas.)
Dr Kevin Harding, DPI & F Horticulture and Forestry Science
Dr Michael Kennedy, DPI & F Horticulture and Forestry Science
Mr Gary Hopewell, DPI & F Horticulture and Forestry Science
Mr David Taylor, DPI & F Horticulture and Forestry Science
Mr William Leggate, formerly Department of State Development Trade and Innovation (Qld.)
Associate Professor Todd Shupe, Louisiana State University
Dr Jöran Jermer, Dr Finn Englund & Mr Jan Brundin, SP Swedish National Testing and Research Institute
Dr Bryan Walford, SCION New Zealand
Dr Mick Hedley, ENSIS New Zealand
Mr James Hyne, Hyne Timber, Hyne and Son Pty. Ltd. (Qld)
Mr Les Williams, Dale and Meyers Operations Pty. Ltd. (Qld)
Mr Mark Tildsley, Koppers Wood Products Pty. Ltd. (NSW)
Mr John Reelick, TTT Products New Zealand
14 Following the restructure of DPI-F, Chris Bragg is with Natural Resources, Mines & Water, while Chick Robb, Sam
Ingram and Jeff Walls are with Forestry Plantations Queensland

October 2006
Australian timber pole resources for energy networks 126
Mr Bruce Bell, Laminated Timber Supplies Pty. Ltd. (Vic)
Mr Doug Cowey, Pole Rebutting Australia Pty. Ltd. (Vic)
Mr Greger Lindgren and Mr Daniel Wiklund, Martinsons Group AB, Sweden
Additional thanks to the following DPI&F staff:
Ms Megan Prance, for reviewing this manuscript and assistance with the review project
Mr Gary Hopewell, for reviewing this manuscript
Mr Dale Parker, for assistance organising the Wood Pole Resources Workshop
Mr Stefan Gerber, formerly DPI&F, who submitted the proposal for this review

October 2006
Australian timber pole resources for energy networks 127
12. References
Adams, R. F., G. P. Krueger, et al. (1981). "CompoleTM - the composite wood material utility pole." Proceedings of the American Wood Preservers Association 77: 81 - 88.
Anon (1996). Cleaner burning. NZ Forest Industries magazine: 18. ANSI_05.1 (2002). Specifications and Dimensions for Wood Poles, American National Standards Institute. Arsenault, R. D. (1975). CCA-treated wood foundations: A study of performance, effectiveness, durability,
and environmental considerations. Proceedings of the American Wood Preservers' Association. AS/NZS _4676 (2000). Structural design requirements for utility service poles, Standards Australia /
Standards New Zealand: 1-88. AS_1604.1 (2005). Specification for preservative treatment. Part 1: Sawn and round timber, Standards
Australia International. AS_1720.1 (1997). Timber structures. Part 1: Design methods, Standards Australia International: 1-181. AS_1720.2 (1990). Timber Structures. Part 2: Timber properties (also known as SAA Timber Structures
Code), Standards Australia International: 1-10. AS_2209 (1994). Timber-Poles for overhead lines, Standards Australia International: 1-29. AS_2878 (2000). Timber-Classification into strength groups, Standards Australia International: 1-31. AS_5604 (2005). Timber - Natural durability ratings, Standards Australia International: 26. Attiwill, P., J. England, et al. (2001). The environmental credentials of production, manufacture and re-use
of wood fibre in Australia. A report prepared for the Department of Agriculture, Fisheries and Forestry Australia. Melbourne, University of Melbourne, School of Botany: 163.
AWPA (2005). American Wood Preservers' Association Standards. Seattle, WA, American Wood
Preservers' Association. Banks, C. H. (1955). "Testing wooden telephone and transmission poles for strength at the Forest
Products Institute." Journal of the South African Forestry Association 28: 24 - 39. Bligh, A. (2006). Bligh outlines industry changes. Press release. Brisbane, Queensland. Boyd, J. D. (1961). The strength of Australian pole timbers. CSIRO Division of Forest Products
Technological Paper 15, Division of Forest Products, CSIRO: 1-40. Braid, G. H. and M. A. Line (1984). "Preliminary Evaluation of Remedial Treatments for Soft-Rot Decay of
Eucalypt Pole Stubs." Holzforschung 38. Buchanan, A. H. and S. B. Levine (1999). "Wood-based building materials and atmospheric carbon
emissions." Environmental Science and Policy 2(6): 427-437. Cerda, G. and R. W. Wolfe (2003). "Bending strength of Chilean radiata pine poles." Forest Products
Journal 53(4): 61-65. Chapman, J. B. (2002). Timber, a truly sustainable resource, can be used to replace steel and concrete
structures in multi-storey building, School of Architecture, University of Auckland, New Zealand: 13.
Christensen, F. J. (1969). "The drying of round timbers for treatment." The Australian Timber Journal: 71-
79.
October 2006
Australian timber pole resources for energy networks 128
Chui, Y. H., A. Taylor, et al. (2001). "Effects of high-temperature drying on bending strength of red pine poles." Forest Products Journal 51(7/8): 47-50.
Cookson, L. and A. C. Trajstman (2002). Termite survey hazard mapping. CSIRO FFP Technical report
137. Clayton South, Victoria, FWPRDC / CSIRO. Cown, D., R. McKinley, et al. (2006). Benchmarking the wood properties of radiata pine plantations -
Summary Report, PN 06.3014. Forest and wood products research and development corporation: 1-6.
Creffield, J. W., J. A. Drysdale, et al. (1996). In-ground evaluation of a copper azole wood preservative
(Tanalith E) at a tropical Australian test site. International Research Group on Wood Protection 1996, Guadeloupe, France.
Crews, K. (2002). NDE prediction of degradation in timber utility poles. 7th World Conference on Timber
Engineering. Crews, K., A. Horrigan, et al. (1998). Assessment of characteristic properties for utility poles in Australia.
5th World Conference on Timber Engineering. Crews, K. and A. Yeates (2000). Strength assessment of utility poles in Australia. 7th World Conference
on Timber Engineering. Crews, K. I. (2006). Design and Specification of Timber Utility Poles, University of Technology Sydney,
Presentation for the March 2006 Australian Wood Pole Resources Workshop. Queensland Department of Primary Industries and Fisheries, Energy Networks of Australia.
CTIQ, 2006. Hopewell, G (ed). Construction timbers in Queensland: Properties and specifications for
satisfactory performance of construction timbers in Queensland, Class 1 and 10 buildings (Books 1 and 2). Department of Primary Industries and Fisheries, Queensland
Daian, G., A. Taube, et al. (2006). "Modelling the dielectric properties of wood." Wood Science and
Technology 40(3): 237-246. Dickson, R. L., C. A. Raymond, et al. (2003). "Segregation of Eucalyptus dunnii logs using acoustics."
Forest Ecology and Management 179(1/3): 243-251. EANSW_TP-1 (2004). Timber poles for overhead lines specification - EANSW TP- 1 design of timber
poles for power distribution systems. Ed. K. Crews. . University of Technology Sydney (AccessUTS Pty Ltd).
EANSW_TP-2 (2004). Timber poles for overhead lines specification - EANSW TP-2 strength and
dimensions. Ed. K. Crews., University of Technology Sydney (AccessUTS Pty Ltd): 24. Eaton, R. A. and M. D. C. Hale (1993). Wood decay, pests and protection, Chapman Hall. ESAA_C(b)1 (2003). Guidelines for design and maintenance of overhead distribution and transmission
lines. Sydney, Australia, Electricity Supply Association of Australia: 1-164. Eslyn, W. E. and T. L. Highley (1976). "Decay resistance and susceptibility of sapwood of fifteen tree
species." Phytopathology 66: 1010-1017. Fang, F., J. N. R. Ruddick, et al. (2001). "Application of radio-frequency heating to utility poles. Part 1.
Radio-frequency/vacuum drying of roundwood." Forest Products Journal 51(7/8): 56-60. Ferguson, I. S., J. Fox, et al. (2002). Plantations of Australia - Wood Availability 2001-2044. Canberra,
National Forest Inventory, Bureau of Rural Sciences. Gardener, W. D. (1989). Wedding Bells State Forest pole test. A review of the original installation, Forest
Products Utilisation, Wood Technology and Forest Research, Forestry Commission of New South Wales: 1-38.

October 2006
Australian timber pole resources for energy networks 129
Gardener, W. D., J. A. Simpson, et al. (1994). Wedding bells state forest pole test site. Report of the 1991 inspection, Research Division. State Forests New South Wales: 66.
Gardner, D. G. (2002). The Production of Treated Wood in Australia. Internal Report., State Forests of
New South Wales. Gough, D. (1994). Comparative wood utilisation hoop pine versus slash / radiata pine poles, Division of
Technical Services, Queensland Department of Forestry. Greaves, H. (1979). "The natural durability of various Australian wood pole species to soft-rotting
microfungi." International Journal of Wood Protection 1(1). Hadlington, P. and J. Johnston (1988). Australian trees - their care and repair, NSW University Press. Haug, R. T. (1993). The Practical Handbook of Compost Engineering. Boca Raton, Lewis Publishers. Holsi, J. P., E. E. Doyle, et al. (1999). The performance of glu laminated railway ties after 40 years of
service in the main line track. 20th Annual Conference of the International Research Group on Wood Preservation.
Hopewell, G. P. (2002). Sawn recovery and utilisation potential of fast-grown Argentinean eucalypts.
Denis M Cullity Research Fellowship Report, FWPRDC PG 01.3104. Forest and Wood Products Research and Development Corporation, Australia: 55.
Horwood, M. (2004). Assessing the effectiveness of a range of termite treatment options for protecting
wood poles against termite attack, Forest and Wood Products Research and Development Corporation. Report number PN01.1300: 1-19.
IPA (2005). Integrated Planning Act 1999. Queensland Government. Janss, G. F. E. and M. Ferrer (1999). "Mitigation of raptor electrocution on steel power poles." Wildlife
Society Bulletin 27(2): 263-273. Kang, S.-M. and J. J. Morrell (2003). Supercritical fluid impregnation of Douglas-fir heartwood with
cyproconazole using temperature induced deposition. IRG/WP 03-40259 34th Annual Conference of the International Research Group on Wood Preservation.
Kent, H. (2006). Options for the continued supply of power poles. Summary of research for the Power
Poles and Cross Arms Committee, Energy Networks Association of Australia. Presentation for the March 2006 Australian Wood Pole Resources Workshop. Queensland Department of Primary Industries and Fisheries, Energy Networks of Australia, Brisbane.
Kunniger, T. and K. Richter (1995). Life cycle analysis of utility poles. A Swiss case study. Third
International Wood Preservation Symposium: the challenge - safety and environment, International Research Group on Wood Preservation.
Leggate, B. (2006). Queensland Department of State Development Innovation and Trade submission to
the January 31 2006 meeting of the Timber Pole Availability Working Group, Electrical Networks Association of Australia.
Leicester, R. H., G. C. Foliente, et al. (2002). Timber durability compendium (Internal Draft). Melbourne,
CSIRO. Leicester, R. H., C.-H. Wang, et al. (2003). An risk model for termite attack in Australia. IRG/WP 03-
10468, 34th Annual Conference of the International Research Group on Wood Preservation. Leicester, R. H., C.-H. Wang, et al. (2003). An engineering model for the decay of timber in ground
contact. 34th Annual Conference of the International Research Group on Wood Preservation. Malan, F. S. (1995). Eucalyptus improvement for lumber production. Seminario Internacional de Utilizacao
da Medeira de Eucalipto Para Serraria, São Paulo.
October 2006
Australian timber pole resources for energy networks 130
Mallet, K. and C. Grgurinovic, Eds. (1996). Fungi of Australia. Volume 1B, Introduction - Fungi in the environment, Australian Biological Resources Study. Canberra, ABRS / CSIRO Australia.
Marzouk, H. M., M. U. Hosain, et al. (1978). "Built-up utility poles using prairie timber." Forest Products
Journal 28(11): 49-54. McCarthy, G. (1988). Technology in Australia 1788 - 1988. A condensed history of Australian
technological innovation and adaptation during the first two hundred years. Online Edition, Fellows of the Australian Academy of Technological Sciences and Engineering, Australian Academy of Technological Sciences and Engineering.
McCarthy, K. J., L. J. Cookson, et al. (2005). The suitability of plantation thinnings as vineyard posts.
FWPRDC PN02.3900. Melbourne, Victoria, Forest and Wood Products and Development Corporation.
McNaught, A. (1987). Mechanical properties of juvenile hoop pine poles, Queensland Department of
Forestry, Division of Technical Services. Mohler, K. (1969). "The effect of boring and incising on the bending strength of transmission poles to be
treated with aqueous preservatives." Holz-Abl 95(149). Morrell, J.J. (2006). Timber utility poles in the United States of America; Utilisation, preservation and
performance. Presentation for the March 2006 Australian Wood Pole Resources Workshop. Queensland Department of Primary Industries and Fisheries, Energy Networks of Australia.
Nolan, G., R. Washusen, et al. (2005). Eucalypt plantations for solid wood products in Australia - A review,
FWPRDC PN 04.3002, Forest and Wood Products Research and Development Corporation, Australia: 1-130.
Page, D. and M. Hedley (1989). Durability of preservative treated transmission poles. What's new in
Forest Research. 180. Parsons, M. and M. Gavran (2005). National Forest Inventory 2005. National plantation inventory 2005
update, Australian Bureau of Rural Sciences. Pernak, J., J. Zabielska-Matejuk, et al. (1998). "New quaternary ammonium chlorides—wood
preservatives." Holzforschung 52(3): 249–254. Peters, B. C. P. and C. J. Fitzgerald (2005). Developments in termite management in Queensland,
Innovative Forest Products Unit, Queensland Department of Primary Industries and Fisheries, Internal report: 1 - 21.
Powell, M. A. (2001). Inspection and assessment of slash pine utility poles after approximately 15 years
in-service exposure in several areas of Queensland, Queensland Forestry Research Institute, Queensland Department of Primary Industries: 1 - 8.
Price, D. and C. Hackney (1996). Towards better management of wood pole assets in New South Wales.
Annual Conference of the Electricity Supply Engineers Association of New South Wales. Rayner, A. D. M. and L. Boddy (1988). Fungal decomposition of wood - its biology and ecology. Bath,
Great Britain, Wiley Interscience. Rhatigan, R. G. and J. J. Morrell (2003). "Use of through-boring to improve CCA or ACZA treatment of
refractory Douglas-fir and grand fir." Forest Products Journal 53(6). Ross, R. J., S. W. Willits, et al. (1999). "A stress wave based approach to NDE of logs for assessing
potential veneer quality. Part 1. Small-diameter ponderosa pine." Forest Products Journal 49(11/12): 60-62.
Ruddick, J. N. R., E. B. Jonsson, et al. (1991). "Utility pole performance: effect of service life on surface
hardness and preservative retention of CCA-treated pine poles." Forest Products Journal 41(6): 21-27.

October 2006
Australian timber pole resources for energy networks 131
Sahle-Demessie, E., K. L. Levien, et al. (1992). "Modelling internal temperature changes of timber poles during ACA treatment." Wood Science and Technology 26(3): 227 - 240.
Scheffer, T. C. (1971). "A climate index for estimating potential for decay in wood structures above
ground." Forest Products Journal 21(10): 25-31. Schwarze, F. W. M. R., J. Engels, et al. (2004). Fungal strategies of wood decay in trees. Berlin, Springer-
Verlag. Sedjo, R. A. (2002). "Wood materials used as a means to reduce greenhouse gases (GHGs): an
examination of wooden utility poles." Mitigation and Adaptation Strategies for Global Change 7(2): 191-200.
Taylor, F. W. (1994). Differential drying of poles. International Wood Drying Conference, Rotorua. TMA (1977). Timber Marketing Act 1977. New South Wales Government. TS_07-01-01 (1995). Technical specification for vacuum-pressure impregnated hardwood poles.
Queensland Electricity Supply Industry. TUMA (1987). Timber Utilisation and Marketing Act. Queensland Government. VMA (2005). Vegetation Management Act 1999. Queensland Government. Code applying to a native
forest practice on freehold land. Walford, G. B. (1994). Strength of New Zealand grown softwood poles. Pacific Timber Engineering
Conference. Walford, G. B. (1999). Design procedures for wooden transmission line poles. Pacific Timber Engineering
Conference. Wang, X., R. J. Ross, et al. (2000). Non-destructive methods of evaluating quality of wood in preservative-
treated piles, Research Note FPL-RN-0274. Forest Products Laboratory, Forest Service, United States Department of Agriculture.
Yeates, A., K. Crews, et al. (2004). Determination of characteristic stresses and residual life expectancies
of preservative treated hardwood and softwood poles, Forest and Wood Products Research and Development Corporation, Australia. FWPRDC PN 97.404: 1-55.
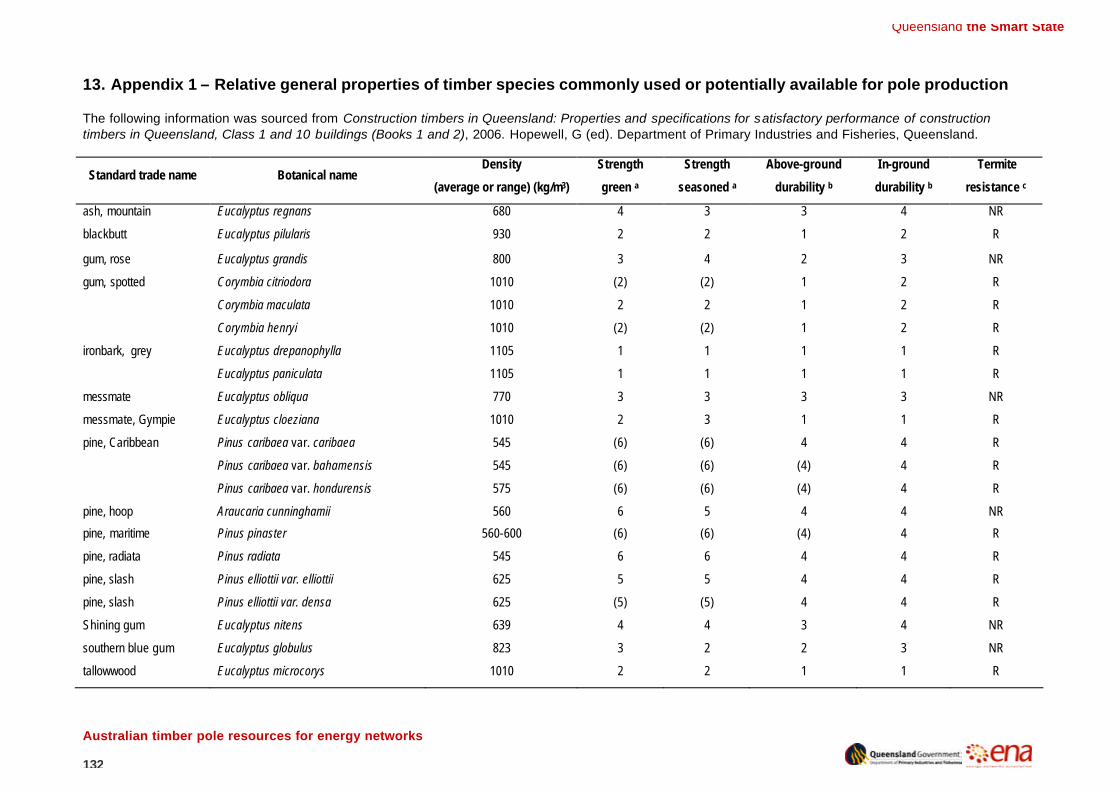
Queensland the Smart State
Australian timber pole resources for energy networks
132
13. Appendix 1 – Relative general properties of timber species commonly used or potentially available for pole production
The following information was sourced from Construction timbers in Queensland: Properties and specifications for satisfactory performance of construction timbers in Queensland, Class 1 and 10 buildings (Books 1 and 2), 2006. Hopewell, G (ed). Department of Primary Industries and Fisheries, Queensland.
Standard trade name Botanical name Density
(average or range) (kg/m3)
Strength
green a
Strength
seasoned a
Above-ground
durability b
In-ground
durability b
Termite
resistance c
ash, mountain Eucalyptus regnans 680 4 3 3 4 NR
blackbutt Eucalyptus pilularis 930 2 2 1 2 R
gum, rose Eucalyptus grandis 800 3 4 2 3 NR
gum, spotted Corymbia citriodora 1010 (2) (2) 1 2 R
Corymbia maculata 1010 2 2 1 2 R
Corymbia henryi 1010 (2) (2) 1 2 R
ironbark, grey Eucalyptus drepanophylla 1105 1 1 1 1 R
Eucalyptus paniculata 1105 1 1 1 1 R
messmate Eucalyptus obliqua 770 3 3 3 3 NR
messmate, Gympie Eucalyptus cloeziana 1010 2 3 1 1 R
pine, Caribbean Pinus caribaea var. caribaea 545 (6) (6) 4 4 R
Pinus caribaea var. bahamensis 545 (6) (6) (4) 4 R
Pinus caribaea var. hondurensis 575 (6) (6) (4) 4 R
pine, hoop Araucaria cunninghamii 560 6 5 4 4 NR
pine, maritime Pinus pinaster 560-600 (6) (6) (4) 4 R
pine, radiata Pinus radiata 545 6 6 4 4 R
pine, slash Pinus elliottii var. elliottii 625 5 5 4 4 R
pine, slash Pinus elliottii var. densa 625 (5) (5) 4 4 R
Shining gum Eucalyptus nitens 639 4 4 3 4 NR
southern blue gum Eucalyptus globulus 823 3 2 2 3 NR
tallowwood Eucalyptus microcorys 1010 2 2 1 1 R

Queensland the Smart State
Australian timber pole resources for energy networks
133
The following information was summarised from CTIQ, 2006.
a Strength groups
These strength groups have been classified according to the principles set out in AS/NZS 2878:2000: Timber
- Classification into strength groups (Standards Australia, 2000). Separate strength classifications have been
given to seasoned and unseasoned timber due to differences in the mechanical properties of small, clear
(defect-free) timber of a given species in each condition. Classifications without brackets have been derived
from mechanical test data using small, clear specimens. Classifications shown in brackets, e.g. (2), are
provisional assessments based on density and / or limited mechanical test data. Provisional classifications
can be used with confidence as they are assessed conservatively. There are seven strength groups for
unseasoned timber, ranging downwards from S1 (strongest) to S7 (weakest), and eight strength groups for
seasoned timber, ranging downward from SD1 to SD8.
b Durability ratings
The rating system used in AS 5604 - 2005 (Standards Australia, 2005) is based on the average life (range in
years) of test specimens of sound, untreated heartwood (35 x 35 mm for above-ground tests and 50 x 50
mm for in-ground trials). Where no data exists to confirm an above-ground rating, a provisional above-
ground rating denoted by brackets is provided based on the timber’s in-ground rating, e.g. (2).
Durability class Above-ground life expectancy In-ground life expectancy
1 > 40 years > 25 years
2 15 to 40 years 15 to 25 years
3 7 to 15 years 5 to 15 years
4 0 to 7 years 0 to 5 years
Note: Round timbers with a complete annulus of preservative treated sapwood (H4 or H5) will have
life expectancies significantly greater than those given above.
c Termite resistance
Subterranean termite resistance of heartwood is classified as either R for those species highly resistant to
termites or NR where the timber is known to have little or no resistance to termite attack. Where reliable data
is lacking, a timber species is classified as non-resistant until authoritative, contrary evidence becomes
available.