Embed Size (px)
Citation preview

AUSTRALIAN PROPERTY OPPORTUNITIES FUND IIQUARTERLY UPDATE 31 DECEMBER 2016
AUSTRALIAN PROPERTY OPPORTUNITIES FUND II | QUARTERLY UPDATE DECEMBER 2016 1
The Australian Property Opportunities Fund II (APOF II or the Fund) is pleased to provide this update for the December quarter 2016 (4Q 2016).
KEY HIGHLIGHTS - Announced a distribution of $0.0206 per Unit. - Portfolio occupancy remained steady at 99%. - The Fund’s weighted average lease expiry (WALE) decreased to 5.9 years.
PORTFOLIO UPDATEASSET MANAGEMENTAt Marketfair Campbelltown Shopping Centre, acquired in August 2016, a small development was completed during the quarter. This has provided an expanded medical centre, two new food tenancies on long-term leases to Harry’s Café de Wheels and Zambrero, and updated signage to the centre. The development has significantly improved the outdoor dining offering and overall presentation of the centre. Marketfair Dental Care also completed their fit out and commenced trading with occupancy at 100%. The focus now is further enhancing the centre’s performance and renewal of upcoming lease expiries.
Marketfair Campbelltown - Harry’s Café de Wheels and Zambrero, and updated centre signage
AUSTRALIAN PROPERTY OPPORTUNITIES FUND II | QUARTERLY UPDATE DECEMBER 2016 2
The Newtown Central occupancy rate remained at 99% during the quarter. The single vacancy is a small kiosk site located at the rear of the mall area. Bourke Street Bakery, an iconic local bakery chain, began trading in the centre last quarter. This tenant has been a strong addition and further improved the centre’s profile. Some minor works were completed during the quarter, including a minor plumbing upgrade and repairs to the roof. Northpoint Shopping Centre continued to trade well with the centre experiencing strong sales over the Christmas period. Occupancy increased to 99% following a lease agreement with a new sushi operator, who has updated the store fit-out and will open for trade during January 2017. This new tenant is expected to further strengthen the food offering at the centre. Improvements to the outdoor dining area have been a focus over the last two quarters with new blinds installed to weatherproof the food lane and increase the number of days during the year that customers can use the outdoor area. Other improvements have included replacing the fixed seating with new outdoor furniture. At Birkdale Fair Shopping Centre, a new lease was agreed with a pizza and pasta operator and a new tenant commenced trading in the discount variety store. The new tenants were secured prior to the former tenants reaching their lease expiry and hence the occupancy rate remained unchanged at 98%. The refurbishment project, announced last quarter, moved into the design phase. The project includes upgrading the façade and improving the signage and external walkways. The focus remains on progressing the refurbishment plans and leasing the remaining vacancies. At Hilton Plaza, which was also acquired in August 2016, occupancy remained steady at 99%. One vacancy remains in the centre, which the leasing team are actively addressing. During the quarter, the focus has been on rebranding (given the Vicinity signage needed to be removed) and commencing plans to improve the overall aesthetics of the centre. Immediate areas identified for improvement include an entrance to the centre from within the underground car park and mall lighting. The new centre signage will be installed in January 2017 and was designed to appeal to local residents and provide maximum visibility to Sir Donald Bradman Drive, a high traffic area that runs from Adelaide CBD to the Western beach suburbs.
CAPITAL MANAGEMENTDuring the period, the Fund announced a distribution of $0.0206 per Unit, in line with the September distribution, representing a 5.2% yield.
REAL ESTATE MARKET UPDATE RETAILWhile Australian retail turnover continues to grow, the rate of growth has slowed over the last two years. Growth reached a peak in October 2014 at 5.7% p.a. and by October 2016 had slowed to 3.7% p.a. The slowdown is largely attributable to food price deflation. The slowdown in the food category was partially offset by accelerating growth in clothing, footwear, personal accessories and department stores. Clothing recorded 5.7% year on year growth in October 2016. Overall, retail competition remains strong, particularly within specific sectors. This has resulted in several chains entering into voluntary administration during 2016. Retail chains which closed during the year included Dick Smith, Payless Shoes, Pumpkin Patch, Masters and Howards Storage World. This underlines the importance of tenant selection and having a portfolio with a high proportion of non-discretionary income. Across the portfolio, there were no vacancies as a result of the above closures. This is a reflection of the detailed analysis and hard work the team has undertaken to build a defensive portfolio.Sydney and Melbourne markets continued to record low single digit rental growth, predominantly driven by the CBD precincts and bulky good categories. Rents remained broadly stable in South East Queensland, Perth, Adelaide and Canberra. The quarter saw the continued trend of yield compression for retail assets.
OFFICEOffice sector lead indicators were mixed in 2016, however, business confidence remained positive. Firmer confidence was reflected in job advertisements, with the growth in advertisements accelerating to 6.1% over the 12 months to November 2016. The turnaround in job advertisements is a positive sign for employment growth after the momentum in the Australian labour market subsided during the second half of 2016. Higher commodity prices benefited the Brisbane and Perth office markets. Brisbane CBD has shown some signs of recovery to date. Leasing enquiry and activity was robust in the Melbourne CBD. Positive leasing activity and evidence of increasing demand for space, continued to exert upward pressure on effective rents. Confirmation is expected of a prime gross effective rent increase by 4.0% over Q4, equating to an increase of 10.5% over 2016.
AUSTRALIAN PROPERTY OPPORTUNITIES FUND II | QUARTERLY UPDATE DECEMBER 2016 3
The volume of leasing activity, completions and stock withdrawals has made calculating Sydney’s physical market indicators more challenging in Q4. A reduction of Sydney CBD leasing incentives is expected along with a prime gross effective rent increase of 6.0% in Q4 and 17.6% over 2016. Yield compression was less pronounced in Q4 with the most significant compression occurring in the Melbourne CBD. The tighter end of the Melbourne CBD prime equivalent yield range is now only slightly softer than the Sydney CBD.
INDUSTRIAL nvestment demand remained buoyant, although there was an apparent lack of stock for sale on-market in 2016. While transaction dollar volumes are expected to have remained near record highs, these were most likely supported by a few, large, off-market transactions during the year. Prime rents were generally flat during the quarter. This overall trend was impacted to a small degree by pockets of growth in South Sydney and North Sydney and weakness in Perth. Over the year, strong growth was recorded in South Sydney (8.1%), North Sydney (3.6%) and South East Melbourne (4.0%). Other markets were broadly flat, to mildly negative, over the year.
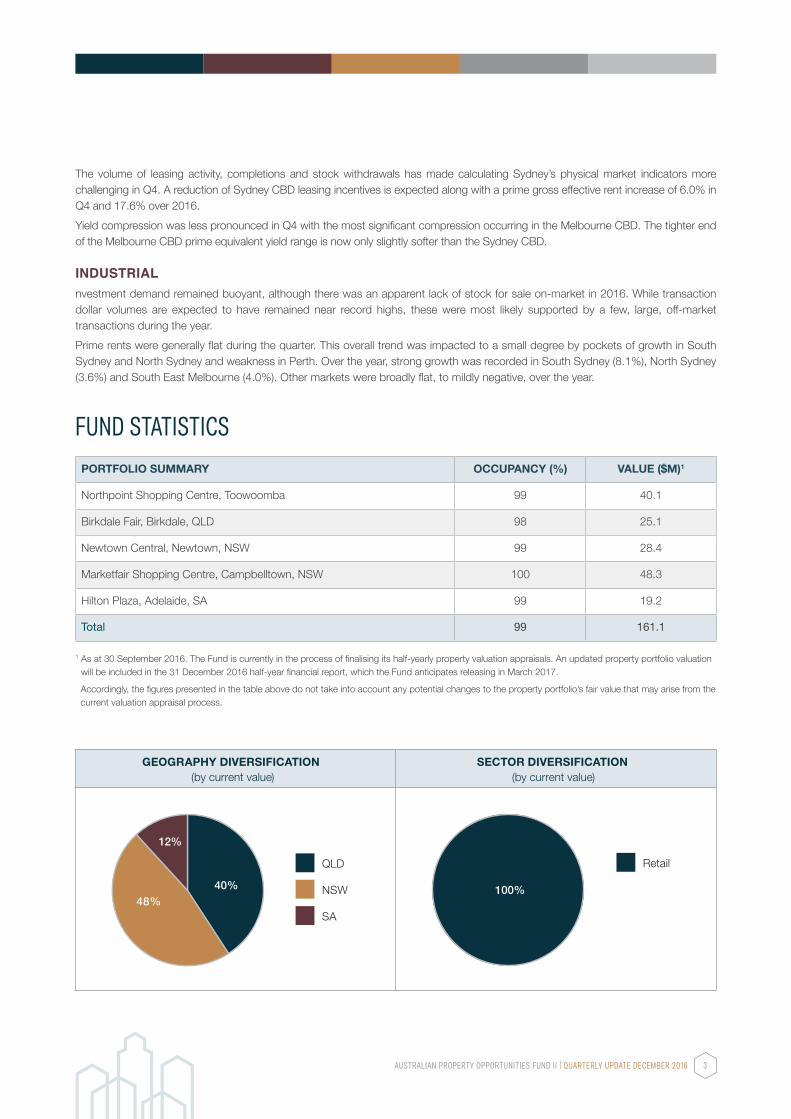
FUND STATISTICSPORTFOLIO SUMMARY OCCUPANCY (%) VALUE ($M)1
Northpoint Shopping Centre, Toowoomba 99 40.1
Birkdale Fair, Birkdale, QLD 98 25.1
Newtown Central, Newtown, NSW 99 28.4
Marketfair Shopping Centre, Campbelltown, NSW 100 48.3
Hilton Plaza, Adelaide, SA 99 19.2
Total 99 161.1
GEOGRAPHY DIVERSIFICATION(by current value)
SECTOR DIVERSIFICATION(by current value)
48%
12%
40%
QLD
NSW
SA
Retail
100%
1 As at 30 September 2016. The Fund is currently in the process of finalising its half-yearly property valuation appraisals. An updated property portfolio valuation will be included in the 31 December 2016 half-year financial report, which the Fund anticipates releasing in March 2017.
Accordingly, the figures presented in the table above do not take into account any potential changes to the property portfolio’s fair value that may arise from the current valuation appraisal process.

AUSTRALIAN PROPERTY OPPORTUNITIES FUND II | QUARTERLY UPDATE DECEMBER 2016 4
For more information, visit the Fund’s website at apof.com.au or email enquiries to [email protected].
This document relies on actual property data from JLL Research (unless otherwise stated), current as at Q4 2016. This commentary has been produced solely as a general guide and does not constitute advice. JLL, its officers, employees shall not be liable for any loss, liability, damage or expense arising directly or indirectly from any use or disclosure of or reliance on such information.
DISCLAIMERThis Quarterly Update (Update) has been prepared by Fort Street Real Estate Capital as Investment Manager of Australian Property Opportunities Fund II (Fund). An investment in the Fund is subject to various risks, many of which are beyond the control of the Investment Manager and the Fund. The past performance of the Fund is not a guarantee of the future performance of the Fund.
This Update contains statements, opinions, projections, forecasts and other material (forward looking statements), based on various assumptions. Those assumptions may or may not prove to be correct. None of the Investment Manager and the Fund, their officers, employees, agents, analysts nor any other person named in this Update makes any representation as to the accuracy or likelihood of fulfilment of the forward looking statements or any of the assumptions upon which they are based.
This Update may contain general advice. Any general advice provided has been prepared without taking into account your objectives, financial situation or needs. Before acting on the advice, you should consider the appropriateness of the advice with regard to your objectives, financial situation and needs, and consider obtaining advice from a financial advisor. You should obtain a copy of the relevant PDS or offer document before making any decisions to purchase the product.
Source: Fort Street Real Estate Capital, JLL
WEIGHTED AVERAGE LEASE EXPIRY (BY GROSS INCOME)
0%
5%
10%
15%
20%
25%
30%
35%
40%
Vacant 2017 2018 2019 2020 2021 2022 2023+
TOP TENANTS (BY GROSS INCOME)
Woolworths 21%
Wesfarmers 9%
Fitness First Australia 5%
Trade Secrets 5%
Foodworks 4%