Embed Size (px)
Citation preview

Australian Pipeline Trust
Results for announcement to the market
For the half year ended 31 December 2017
Appendix 4D
Statutory and Normalised Results
Change
Amount
$’000
Revenue up 0.8% to 1,188,649
EBITDA down 0.6% to 755,256
EBIT down 2.4% to 466,136
Profit after tax down 11.3% to 123,966
Operating cash flow down 10.8% to 462,527
Operating cash flow per security down 5.0¢ to 41.5¢
Earnings per security down 1.4¢ to 11.1¢
EBIT = Earnings before interest and tax
EBITDA = EBIT before depreciation and amortisation
Reporting Period
The above results are for the half year ended 31 December 2017. Reference is made to movements from the previous
corresponding period being the half year ended 31 December 2016.
APA Group
Distributions proposed Amount per
security
Franked
amount per
security
Interim distribution proposed
profit distribution 11.33¢ 5.83¢
capital distribution 9.67¢ -
21.00¢ 5.83¢
The record date for determining entitlements to the unrecognised interim distribution in respect of the current financial
year is 29 December 2017.
Distribution information is presented on an accounting classification basis. The APA Group Annual Tax Statement and
Annual Tax Return Guide (released in September) provide the classification of distribution components for the purposes
of preparation of securityholder income tax returns.
The Directors have reviewed APA Group’s financial position and funding requirements and have decided to retain the
suspension of the Distribution Reinvestment Plan until further notice.

Australian Pipeline Trust
Results for announcement to the market
For the half year ended 31 December 2017
Appendix 4D
Net asset backing per security
31 December
2017
$
31 December
2016
$
Net tangible asset backing per security -0.29 -0.46
Net asset backing per security 3.54 3.53
Additional information and commentary on results for the year
For additional disclosures refer to the APA Group interim report for the half year ended 31 December 2017
accompanying this Appendix 4D.

Australian Pipeline Trust
Results for announcement to the market
For the half year ended 31 December 2017
Appendix 4D
Compliance Statement
Information on Audit or Review
(a) The half year report is based on accounts to which one of the following applies.
The accounts have been audited. The accounts have been subject
to review.
The accounts are in the process of being
audited or subject to review.
The accounts have not yet been
audited or reviewed.
(b) Description of likely dispute or qualification if the accounts have not yet been audited or subject to review or
are in the process of being audited or subjected to review.
- N/A -
(c) Description of dispute or qualification if the accounts have been audited or subjected to review.
- N/A -
(d) The entity has a formally constituted audit committee.
Sign here:
Chairman
21 February 2018

Australian Pipeline Trust
Interim Financial Report. For the half year ended
31 December 2017
ARSN 091 678 778

Australian Pipeline Trust (ARSN 091 678 778) and its Controlled Entities
Interim Financial Report for the half year ended 31 December 2017
AUSTRALIAN PIPELINE TRUST DIRECTORS’ REPORT 1
1 Directors 1
2 Principal Activities 1
3 State of Affairs 1
4 Subsequent Events 1
5 Financial Overview 2
6 Business Segment Performances and Operational Review 5
7 Capital and Investment Expenditure 12
8 Financing Activities 15
9 Regulatory Matters 18
10 Corporate Governance 20
11 Auditor’s independence declaration 21
12 Rounding of Amounts 21
13 Authorisation 21
AUSTRALIAN PIPELINE TRUST
CONDENSED CONSOLIDATED FINANCIAL STATEMENTS 22
APT INVESTMENT TRUST DIRECTORS’ REPORT 45
1 Directors 45
2 Principal Activities 45
3 State of Affairs 45
4 Subsequent Events 45
5 Review of Results and Operations 46
6 Distributions 46
7 Auditor’s Independence Declaration 46
12 Rounding of Amounts 46
13 Authorisation 46
APT INVESTMENT TRUST
CONSOLIDATED FINANCIAL STATEMENTS 47

1
Australian Pipeline Trust (ARSN 091 678 778) and its Controlled Entities
Interim Financial Report for the half year ended 31 December 2017
AUSTRALIAN PIPELINE TRUST DIRECTORS’ REPORT
The Directors of Australian Pipeline Limited (Responsible Entity) submit their interim financial
report of Australian Pipeline Trust (APT) and its controlled entities (together APA or
Consolidated Entity) for the half year ended 31 December 2017. This report refers to the
consolidated results of APT and APT Investment Trust (APTIT).
1 Directors
The names of the Directors of the Responsible Entity during the half year and since the half
year ended 31 December 2017 are:
Michael Fraser Chairman
Len Bleasel AM Retired as Chairman and Director on 27 October 2017
Michael (Mick) McCormack Chief Executive Officer and Managing Director
Steven (Steve) Crane
John Fletcher Retired 21 February 2018
Debra (Debbie) Goodin
Russell Higgins AO
Patricia McKenzie
The Company Secretary of the Responsible Entity during the half year and since the half
year ended 31 December 2017 is as follows:
Nevenka Codevelle
2 Principal Activities
The principal activities of APA during the period were the ownership and operation of
energy infrastructure assets and businesses, including:
energy infrastructure, comprising gas transmission, gas storage and processing, and
gas-fired and renewable energy power generation assets located across Australia;
asset management services for the majority of APA’s energy investments and for third
parties; and
investments in unlisted energy infrastructure entities.
3 State of Affairs
No significant change in the state of affairs of APA occurred during the half year.
4 Subsequent Events
The following events have occurred subsequent to the period end:
On 21 February 2018, the Directors declared an interim distribution of 21.0 cents per
security ($234.0 million) for APA Group, an increase of 2.4%, or 0.5 cents per security
over the previous corresponding period (1H FY2017: 20.5 cents). This is comprised of

2
Australian Pipeline Trust (ARSN 091 678 778) and its Controlled Entities
Interim Financial Report for the half year ended 31 December 2017
a distribution of 15.59 cents per security from APT and a distribution of 5.41 cents per
security from APTIT. The APT distribution represents a 5.83 cents per security franked
profit distribution, a 2.47 cents per security unfranked profit distribution and 7.29
cents per security capital distribution. The APTIT distribution represents a 3.03 cent
per security profit distribution and a 2.38 cents capital distribution. Franking credits
of 2.50 cents per security will be allocated to the APT franked profit distribution. The
distribution is anticipated to be paid on 14 March 2018.
On 21 February 2018, APT Pipelines Limited gave notice of its intention to redeem all
of the $515 million APA Group Subordinated Notes (AQHHA) on 31 March 2018, in
accordance with the terms of those Notes.
On 21 February 2018, APA Group announced a fully underwritten pro-rata
accelerated institutional tradeable retail renounceable entitlement offer
(Entitlement Offer) to raise approximately $500 million. It is proposed that the
proceeds raised will be used to assist in the funding of APA’s growth projects and
capital expenditure program, the funding of the redemption of APA Group
Subordinated Notes, and for other general corporate purposes.
Other than what is noted above and as disclosed elsewhere in this report, there has not
arisen in the interval between the end of the half year ended 31 December 2017 and the
date of this report any matter or circumstance that has significantly affected, or may
significantly affect, the Group’s operations, the results of those operations, or Group’s state
of affairs, in future financial years.
5 Financial Overview
Earnings before interest and tax (EBIT) and EBIT before depreciation and amortisation
(EBITDA) excluding significant items are financial measures not prescribed by Australian
Accounting Standards (AIFRS) and represent the profit under AIFRS adjusted for specific
significant items. The Directors consider these measures to reflect the core earnings of the
Consolidated Entity, and these are therefore described in this report as ‘normalised’
measures.
Results for the half year period are in line with APA’s expectations and its full year 2018
guidance and outlook as signalled at the FY2017 results. A relatively steady result for FY2018
is nevertheless supported by the significant $1.2 plus billion of committed growth capex
projects spread across FY2018 and FY2019 that were announced during the FY2017 year.
We expect to achieve current FY2018 EBITDA within the given guidance range at the
FY2017 results of $1,475 million to $1,510 million, and indeed, we remain comfortable that
EBITDA can meet current market consensus expectations for EBITDA as compiled by
Bloomberg1. As previously noted, additional revenues from the growth investment projects
currently under construction will commence in FY2019 (around ~$70 million per FY2017
disclosure), with a further significant increase coming through into FY2020 revenues (~$200
million per FY2017 disclosure).
1 Source: Bloomberg Finance L.P.(16 February 2018) (APA AU EQUITY EEO <GO>)

3
Australian Pipeline Trust (ARSN 091 678 778) and its Controlled Entities
Interim Financial Report for the half year ended 31 December 2017
For the six months to 31 December 2017, APA reported an increase on the corresponding
period of $0.4 million in total revenue (excluding pass-through revenue) to $954.7 million,
(1H FY2017: $954.3 million).
EBITDA of $755.3 million, decreased 0.6% or $4.4 million on the previous corresponding
period EBITDA of $759.7 million.
Net profit after tax decreased 11.3% to $124.0 million (1H FY2017: $139.8 million). Net interest
and other finance costs increased for the period by 3.1%, whilst depreciation and
amortisation expense increased, due to an increased asset base. Income tax expense
decreased over the period.
Operating cash flow was $462.5 million for the six month period, a decrease of 10.8% or
$55.7 million over the previous corresponding period (1H FY2017: $518.2 million), due
primarily to an increase in cash tax paid to $36.3 million during the period (1H FY2017: 0)
which has enabled APA to attach franking credits of 2.5 cents per security (1H FY2017: 0.0
cents per security) to the interim distribution. A further $14.9 million of cash tax is expected
to be paid by 30 June 2018.
Operating cash flow per security reduced 10.8%, or 5.0 cents, to 41.5 cents per security (1H
FY2017: 46.5 cents per security).
On 21 February 2018, the Directors announced an interim distribution of 21.0 cents per
security, an increase of 2.4%, or 0.5 cents, over the previous corresponding period (1H
FY2017: 20.5 cents). APA maintains a sustainable distribution policy to ensure its ability to
fully fund its distributions out of operating cash flows whilst also retaining appropriate levels
of cash in the business to support ongoing growth projects such as those currently in
progress. The current $1.2 billion (and growing) capex program – APA’s largest to date – is
testament to APA’s growth strategy in relation to sustainable distributions.
The following table provides a summary of key financial data for the period. There were no
significant items recorded during either the current or previous periods.

4
Australian Pipeline Trust (ARSN 091 678 778) and its Controlled Entities
Interim Financial Report for the half year ended 31 December 2017
1H FY2018 1H FY2017 Change
($000) ($000) $000 %
Total revenue 1,188,649 1,179,085 9,564 0.8%
Pass-through revenue(1) 233,935 224,780 9,155 4.1%
Total revenue excluding
pass-through 954,714 954,305 409 -
EBITDA 755,256 759,682 (4,426) (0.6%)
Depreciation and amortisation
expense (289,120) (281,983) (7,137) (2.5%)
EBIT 466,136 477,699 (11,563) (2.4%)
Finance costs and interest income (262,653) (254,739) (7,914) (3.1%)
Profit before income tax 203,483 222,960 (19,477) (8.7%)
Income tax expense (79,517) (83,130) 3,613 4.3%
Profit after income tax 123,966 139,830 (15,864) (11.3%)
Operating cash flow (2) 462,527 518,247 (55,720) (10.8%)
Operating cash flow per security
(cents) 41.5 46.5 (5.0) (10.8%)
Earnings per security (cents) 11.1 12.5 (1.4) (11.2%)
Distribution per security (cents) 21.0 20.5 0.5 2.4%
Weighted average number of
securities (000) 1,114,307 1,114,307 - -
Notes: Numbers in the table may not add up due to rounding.
(1) Pass-through revenue is revenue on which no margin is earned. Pass-through revenue arises in the asset management
operations in respect of costs incurred in, and passed on to Australian Gas Networks Limited (AGN, formerly Envestra
Limited) and GDI in respect of the operation of the AGN and GDI assets respectively.
(2) Operating cash flow = net cash from operations after interest and tax payments.
5
Australian Pipeline Trust (ARSN 091 678 778) and its Controlled Entities
Directors’ Report for the half year ended 31 December 2017
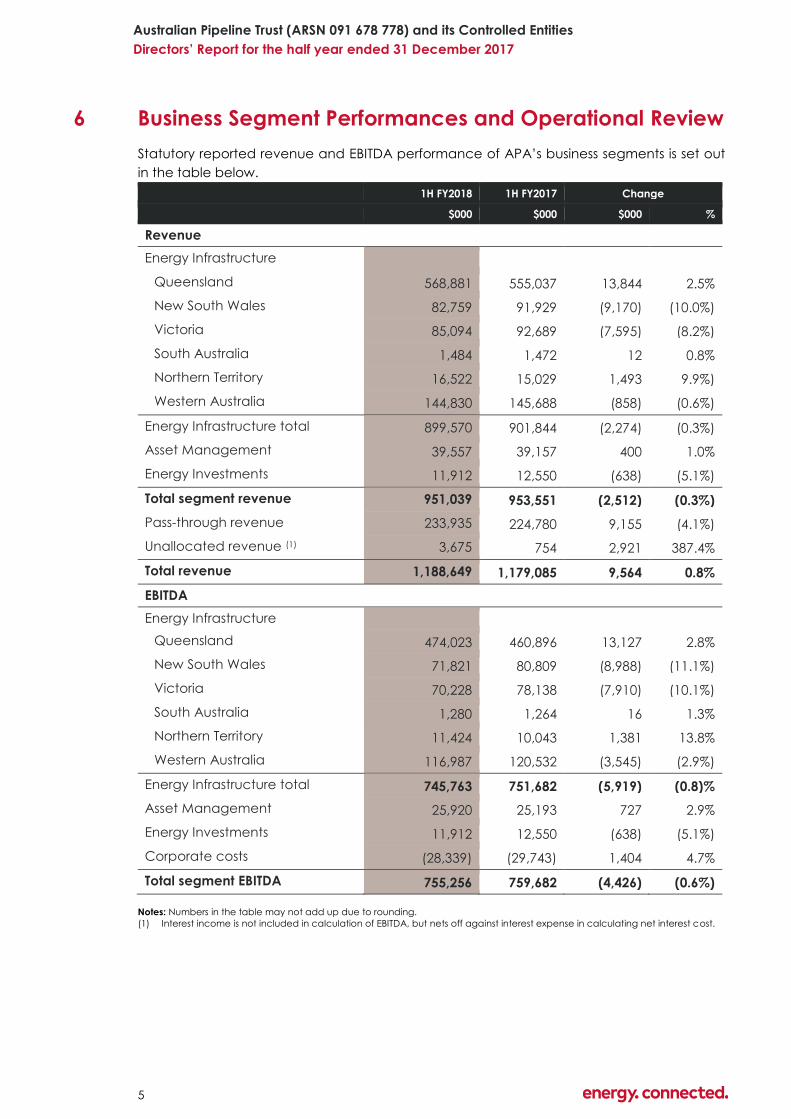
6 Business Segment Performances and Operational Review
Statutory reported revenue and EBITDA performance of APA’s business segments is set out
in the table below.
1H FY2018 1H FY2017 Change
$000 $000 $000 %
Revenue
Energy Infrastructure
Queensland 568,881 555,037 13,844 2.5%
New South Wales 82,759 91,929 (9,170) (10.0%)
Victoria 85,094 92,689 (7,595) (8.2%)
South Australia 1,484 1,472 12 0.8%
Northern Territory 16,522 15,029 1,493 9.9%)
Western Australia 144,830 145,688 (858) (0.6%)
Energy Infrastructure total 899,570 901,844 (2,274) (0.3%)
Asset Management 39,557 39,157 400 1.0%
Energy Investments 11,912 12,550 (638) (5.1%)
Total segment revenue 951,039 953,551 (2,512) (0.3%)
Pass-through revenue 233,935 224,780 9,155 (4.1%)
Unallocated revenue (1) 3,675 754 2,921 387.4%
Total revenue 1,188,649 1,179,085 9,564 0.8%
EBITDA
Energy Infrastructure
Queensland 474,023 460,896 13,127 2.8%
New South Wales 71,821 80,809 (8,988) (11.1%)
Victoria 70,228 78,138 (7,910) (10.1%)
South Australia 1,280 1,264 16 1.3%
Northern Territory 11,424 10,043 1,381 13.8%
Western Australia 116,987 120,532 (3,545) (2.9%)
Energy Infrastructure total 745,763 751,682 (5,919) (0.8)%
Asset Management 25,920 25,193 727 2.9%
Energy Investments 11,912 12,550 (638) (5.1%)
Corporate costs (28,339) (29,743) 1,404 4.7%
Total segment EBITDA 755,256 759,682 (4,426) (0.6%)
Notes: Numbers in the table may not add up due to rounding.
(1) Interest income is not included in calculation of EBITDA, but nets off against interest expense in calculating net interest cost.

6
Australian Pipeline Trust (ARSN 091 678 778) and its Controlled Entities
Directors’ Report for the half year ended 31 December 2017
APA’s financial performance during the period reflects sound ongoing operations and a
substantial commitment to continued investment in our assets and growth projects that will
significantly contribute to future earnings growth.
Total segment EBITDA, which represents earnings from APA’s continuing businesses,
decreased less than one per cent (0.6%), or $4.4 million, to $755.3 million, over the 1H
FY2017 result of $759.7 million, however remains on track to meet full year expectations.
APA derives its revenue through a mix of regulated revenue, long-term negotiated
contracts, asset management fees and investment earnings. Earnings are underpinned by
solid cash flows generated from high quality, geographically diversified assets and a
portfolio of highly creditworthy customers.
APA’s growth strategy is based on a continuing set of principles and criteria that APA has
always adhered to:
• maintain an appropriate risk and return structure;
• ensure an appropriate funding and capital structure;
• enter into contracts with highly creditworthy counterparties; and
• leverage in-house operational expertise.
6.1 Energy Infrastructure
APA’s Energy Infrastructure business includes the interconnected 7,500 kilometre East Coast
Grid, Central and Western Australian pipeline assets, as well as gas compression, processing
and storage assets, renewable and gas-fired electricity generation assets and a small
number of other wholly owned energy infrastructure assets. During the period, in addition
to our continuing operations from existing contracts, we have assisted integrated electricity
generator/retailers by providing short term flexible services that support their peak
electricity generation requirements, as well as providing flexible services to new retailers.
This segment contributed approximately 95% of Group revenue (excluding pass-through)
and Group EBITDA (before corporate costs) during the period. Revenue (excluding pass-
through revenue) was $899.6 million, a slight decrease of 0.3% on the previous
corresponding period (1H FY2017: $901.8 million). EBITDA was also slightly down on the
previous corresponding period to $745.8 million or 0.8% (1H FY2017: $751.7 million).
FY2018 was flagged at the FY2017 results outlook as lower year-on-year earnings growth,
while FY2018 to FY2019 will see an unprecedented level of capital expenditure investment
by APA that will significantly contribute to future earnings growth.
The result for the half year reflects the ongoing success of APA’s East Coast Grid with
revenues and EBITDA across Queensland and New South Wales – excluding the
economically regulated portion of the Grid – rising marginally (EBITDA +0.8%) as APA
provided customers with more multi-asset, multi-state services as opposed to the state
based point-to-point services of yesteryear.
Results for both Victoria and Western Australia reflected new access arrangements in both
states when comparing to revenue earned in the previous corresponding period.

7
Australian Pipeline Trust (ARSN 091 678 778) and its Controlled Entities
Directors’ Report for the half year ended 31 December 2017
Energy Infrastructure Revenue by State Energy Infrastructure EBITDA by State
Energy Infrastructure EBITDA by Asset
During the period, a number of new regulatory initiatives for historically unregulated
pipelines (pipelines not subject to full or light regulation) were announced by the Gas
Market Reform Group (GMRG) which was established by the Council of Australian
Governments Energy Council in August 2016. Refer to Section 9 Regulatory Matters of this
report for further information. One of the initiatives introduced during the period included
access to an arbitration process if parties cannot agree terms of access through
commercial negotiation.
To date, since the commercial arbitration regime was introduced on the East Coast and
Central Region non-scheme pipelines on 1 August 2017, APA has executed 15 gas
transportation agreements (GTA’s) with customers utilising the multiple benefits of APA’s
interconnected infrastructure, by reaching negotiated agreements without the need for
any commercial arbitration. This represents a continuation of what APA has always done,
that is, building strong relationships with customers, understanding their business needs, and
then discussing and agreeing terms to supply gas transportation services to those
customers.
Focusing on customers
Recently, APA refreshed the suite of gas pipeline services available on its East Coast and
Central Region assets to provide customers with more options and additional flexibility to
make it simpler for customers to best manage their gas portfolios. The refreshed services
and approach provide additional clarity and ease of access for customers to APA’s
infrastructure which will help promote gas market liquidity. Through our vision of connecting
Australia to its energy future, we have been working very closely with our customers for a
sustainable, reliable and cost-effective energy future.
50%
55%
60%
65%
70%
75%
80%
85%
90%
95%
0
100
200
300
400
500
600
700
800
900
1,000
1H FY15 1H FY16 1H FY17 1H FY18
A$ m WA
NT
SA
Victoria
NSW
Queensland
EBITDAmargin
0
100
200
300
400
500
600
700
800
1H FY15 1H FY16 1H FY17 1H FY18
A$ m
WA
NT
SA
Victoria
NSW
Queensland
0 100 200 300 400 500 600 700 800
1H FY15
1H FY16
1H FY17
1H FY18
A$ m
Wallumbilla Gladstone Pipeline South West Queensland Pipeline Roma Brisbane Pipeline
Carpentaria Gas Pipeline Diamantina Power Station Other Qld assets
Moomba Sydney Pipeline Victorian Transmission System SESA Pipeline
Amadeus Gas Pipeline Goldfields Gas Pipeline Eastern Goldfields Pipeline
Emu Downs Wind Farm Pilbara Pipeline System Mondarra Gas Storage
Other WA

8
Australian Pipeline Trust (ARSN 091 678 778) and its Controlled Entities
Directors’ Report for the half year ended 31 December 2017
During the six-month period, 80.7% of Energy Infrastructure revenue (excluding pass-
through) was from capacity reservation charges from long term contracts, and 8.5% from
throughput charges and other revenues. Given the dynamic east coast gas market, APA
also received additional revenues from the provision of flexible short term services,
accounting for around 0.9% of total Energy Infrastructure revenues received. With our new
service refresh, we expect this revenue segment to increasingly become part of
contracted revenue going forward. The portion of APA’s revenue that is regulated was
approximately 9.9% of 1H FY2018 Energy Infrastructure revenue.
Focusing on our customers – innovation and refresh of APA’s services suite
At APA, meeting our customers’ needs through innovation is at the heart of what we do.
Our services refresh continues the innovative approach APA has always applied to its business which has seen
it grow from a simple point-to-point gas transporter, to a leading energy infrastructure enterprise. Over the last
few years just some of the innovative services we have introduced include standard Gas Transportation
Agreements, multi-asset or ‘grid’ services, bi-directional pipeline capabilities, park and loan facilities, in-pipe
trade services, and a capacity trading website.
Our focus is on supporting our customers in meeting their business objectives more efficiently, simply, quickly,
reliably and flexibly within the context of a dynamic energy market.
We do this by developing strong relationships with our customers to understand their business, and then
applying APA’s strategic, commercial, engineering and operational smarts to develop services to meet their
customer needs. APA’s new service offerings together with this increased transparency should support
smoother and faster investment decisions which will hopefully encourage producers to bring more gas into
the tight East Coast gas market.
APA’s service refresh

9
Australian Pipeline Trust (ARSN 091 678 778) and its Controlled Entities
Directors’ Report for the half year ended 31 December 2017
Capacity
charge revenue: 80.7%
Regulated
revenue: 9.9%
Throughput charge & other
revenue: 8.5%
Flexible short term
services: 0.9%
1H FY2018 Energy Infrastructure by Revenue Type APA* Pipelines by Regulation Type
APA manages its counterparty risk in a variety of ways. One aspect is to consider
customers’ credit ratings. During the period, approximately 94% of all revenues was
received from counterparties with investment grade credit ratings. Diversification of our
customer base is another risk moderator – during 1H FY2018, 49.6% of revenue was from
energy sector customers (1H FY2017: 55.1%); 24.6% of revenue was from customers in the
utilities sector (1H FY2017: 27.5%); 21.6% from resources sector customers (1H FY2017: 12%);
and 4.2% from industrial and other customers (1H FY2017: 5.4%).
1H FY18 Energy Infrastructure Revenues
By Counterparty Credit Rating
1H FY18 Energy Infrastructure Revenues
By Customer Industry Segment
6.2 Asset Management
APA provides asset management and operational services under long term contracts to
the majority of its energy investments and to a number of third parties who own assets
where APA has significant operating expertise. APA’s main customers are Australian Gas
Networks Limited (AGN), Energy Infrastructure Investments Pty Limited (EII) and GDI (EII) Pty
Limited (GDI).
Revenue (excluding pass-through revenue) from asset management services increased by
$0.4 million or 1.0% to $39.6 million (1H FY2017: $39.2 million) and EBITDA (excluding
corporate costs) increased by $0.7 million or 2.9% to $25.9 million (1H FY2017: $25.2 million).
A- rated
or better
44.6%
BBB and
BBB+
28.1%
Investment
Grade
21.5%
Sub-investment grade
3.6%Not rated
2.2%
Energy
49.6%
Utility
24.6%
Resources
21.6%
Industrial &Others
4.2%
* Owned and/or operated by APA

10
Australian Pipeline Trust (ARSN 091 678 778) and its Controlled Entities
Directors’ Report for the half year ended 31 December 2017
Asset Management Revenue Asset Management EBITDA
APA continues to drive solid connection growth on behalf of both AGN and GDI through
continued investment in new housing estates and medium-high density housing
developments as natural gas continues to be a fuel of choice for cooking, hot water and
heating in residential markets.
During the period, APA completed mains connection to the Greater Flagstone Urban
Development Area which is located 40 kilometres from the Brisbane CBD, as well
continuing works to connect customers at the Yarrabilba urban development site also in
Queensland on behalf of our customer GDI Allgas; in Victoria the Koo Wee Rup and
Wandong-Heathcote Junction development areas were completed ahead of time and
on budget on behalf of AGN; and in South Australia multiple step-out gas connection
developments to McLaren Vale and Two Wells were also completed for AGN.
Customer contributions for the period were approximately $3 million. For the full year, it is
expected that customer contributions will remain in-line with the long term average of
around $10 million per annum, although APA continues to expect annual swings in
customer contributions, as these are driven by customers’ individual and specific work
programmes and requirements.
0
20
40
60
1H FY15 1H FY16 1H FY17 1H FY18
A$ m
One-off
Customer
Contributions
Underlying Asset
Management
Revenue
0
10
20
30
40
50
1H FY15 1H FY16 1H FY17 1H FY18
A$ m
One-off
Customer
Contributions
Underlying
Asset
Management
EBITDA

11
Australian Pipeline Trust (ARSN 091 678 778) and its Controlled Entities
Directors’ Report for the half year ended 31 December 2017
Corporate Costs
0
20
40
60
1H FY15 1H FY16 1H FY17 1H FY18
A$ m
Energy Investments Revenue & EBITDA
Note: “Divested & transferred investments” relate mainly to AGN which
was sold in FY2014. DPS and EPX earnings are classified as divested &
transferred investments within Energy Investments up until financial close
during FY2016 when they became fully owned by APA and transferred to
Energy Infrastructure, for the purpose of the segment reporting.
-5
0
5
10
15
1H FY15 1H FY16 1H FY17 1H FY18
A$ m
Divested &
transferred
investments
Continuing
investments
6.3 Energy Investments
APA has interests in a number of complementary energy investments across Australia.
APA’s ability to manage these
investments and provide
operational and/or corporate
support services provides flexibility in
growing the business, harnesses in-
house expertise, and ensures
synergies are delivered from a lower
cost base over a broader portfolio
of assets.
Earnings from Energy Investments
were relatively flat period on period.
The minor change resulted from a
higher tax charge within equity accounted earnings from an associate.
6.4 Corporate Costs
Corporate costs for the six month period
decreased by $1.4 million over the previous
corresponding period to $28.3 million (1H FY2017:
$29.7 million). This reflects an ongoing focus on
cost control within the business.

12
Australian Pipeline Trust (ARSN 091 678 778) and its Controlled Entities
Directors’ Report for the half year ended 31 December 2017
7 Capital and Investment Expenditure
Committed capital expenditure by APA is at unprecedented levels for FY2018 and FY2019
as the company continues to grow its asset footprint and energy expertise. The $1.2 plus
billion of committed capex projects that were announced during FY2017 and FY2018 are
all under way and well progressed, with all projects either, on or ahead of schedule and
budget. A number of smaller projects are also underway and will add further revenues as
they are commissioned late in FY2018 and beyond.
Capital and investment expenditure for the period totalled $320.8 million (including stay-in-
business capital expenditure), and compares with $162.7 million spent in the previous
corresponding period. The 97.2% increase for the period signifies that APA’s largest capital
growth program to date, is well on track.
During the period, APA acquired the Orbost Gas Processing Plant in Victoria for $20 million.
APA will invest a further $250 million in recommissioning, refurbishing and updating the
facility underwritten by a multi-year gas processing agreement with Cooper Energy to
process gas from their Sole gas field. The asset provides scope to process gas from Cooper
Energy’s nearby Manta gas field, and other gas fields in the immediate vicinity.
Growth capital expenditure of $265.7 million during the period (1H FY2017: $135.7 million)
was related to the following projects:
completion of works in Victoria to finalise the latest stages of expansion of the
northern interconnect with NSW;
ongoing works for the Reedy Creek Wallumbilla Pipeline construction project;
construction of the Emu Downs Solar Farm, plus commencement of construction of
the Darling Downs Solar Farm in Queensland and the Badgingarra Wind Farm in
Western Australia;
acquisition and commencement of the Orbost Gas Processing plant upgrade; and
additional works off APA’s Eastern Goldfields Pipeline in Western Australia in relation
to the Yamarna Gas Pipeline and Power Station construction works and the building
of Mt Morgans Gas Pipeline for Dacian Gold.
APA’s growth capital expenditure continues to be either underwritten by long-term
contractual arrangements or approved through a relevant access arrangement. APA
remains on track for FY2018 total growth capex spend in excess of $800 million as indicated
at the FY2017 results announcement and in the timeline diagram below.

13
Australian Pipeline Trust (ARSN 091 678 778) and its Controlled Entities
Directors’ Report for the half year ended 31 December 2017
Capital and investment expenditure
212.6
295.7
162.7
320.8
0
100
200
300
400
1H FY15 1H FY16 1H FY17 1H FY18
A$ m Acquisitions
& other
investment
cash flows
Growth
capex
SIB capex
Capex expenditure for FY2018-19 growth projects remains on track
Note: Above diagram is illustrative only.
Stay-in business capital expenditure of $55.1 million was higher than the previous
corresponding period (1H FY2017: $27.0 million), mainly due to higher maintenance cost for
scheduled overhauls on generating assets including Diamantina Power Station, but is not
out of line with APA’s most recently advised expectations on an annual basis.
We continue to engage in discussions with customers that we are confident will lead to
further announcements in respect of growth capital expenditure going forward.
In that regard, beyond FY2018, APA
continues to expect in the order of
$300 million to $400 million per annum
of growth capex over the next two to
three years across all sectors APA
operates in.

14
Australian Pipeline Trust (ARSN 091 678 778) and its Controlled Entities
Directors’ Report for the half year ended 31 December 2017
A record year of capital growth - project update
Construction of the 45MW Yamarna Power Station which will supply gas-fired electricity to the Gruyere
Gold mine has commenced and is on track for commissioning during 2H 2018. Concrete foundations have
been poured and civil works largely completed. The 11 gas engines have now been delivered to site ready
for installation. The gas-fired power station has a 15 year energy supply agreement with the Gruyere Joint
Venture.
Construction will commence on the 198km Yamarna Gas Pipeline in February 2018 with the first shipment of
coated line pipe arriving on site. The project is on track to meet the scheduled commissioning timeframe
of July 2018. Gas will be transported almost 1,500km through four connected APA pipelines to supply the
Yamarna Power Station. The Yamarna Gas Pipeline is underpinned by a 15-year gas transportation
agreement.
The 50 km Reedy Creek Wallumbilla Pipeline is on track for completion and commissioning in May 2018.
APA has entered into a 20-year contract with APLNG.
Construction of the 5 km greenfield Mt Morgans Gas Pipeline and meter/delivery station for Dacian Gold
was largely completed during the period. Commissioning took place in January 2018 and first gas was
supplied to the power station on site in early February 2018. The pipeline is connected to APA’s Eastern
Goldfields Pipeline and gas will flow through four connected APA pipelines.
APA acquired the Orbost Gas Processing Plant from Cooper Energy in November 2017. Detailed design
work for the plant recommissioning, refurbishment and expansion is currently underway, as are earthworks
and civils on site. All major procurement and construction contracts have been awarded. Under a multi-
year gas processing agreement with Cooper Energy, the plant will process gas from the offshore Sole gas
field from mid-2019.
Construction of the 20MW Emu Downs Solar Farm was largely completed during the period and
commissioning commenced in December 2017. The new solar farm has been integrated into the existing
80MW Emu Downs Wind Farm substation and connection point. APA has received $5.5 million in funding for
this project from the Australian Renewable Energy Agency (ARENA). The solar farm has a 13 year power
purchase agreement with Synergy.
Construction of the 130MW Badgingarra Wind Farm project has commenced on a site adjacent to both
the existing 80MW Emu Downs Wind Farm and soon to be commissioned 20MW Emu Downs Solar Farm.
The Badgingarra Wind Farm has entered into a new connection agreement with the network owner
Western Power. Earthworks and civil works for turbine foundations have commenced, including the
installation of concrete foundations to hold the 37 erected towers and wind turbine generators, which are
due on site progressively from late February 2018. Alinta Energy has entered into a 12-year offtake
agreement for both the energy and the LGCs.
Construction of the 110MW Darling Downs Solar Farm in Queensland is progressing with the installation of
the mounting frames and the 423,000 solar panels, both well under way. Panel installation commenced in
January 2018. A long term offtake agreement with Origin Energy until 2030 is in place with construction
expected to be completed in late 2018. The project has received a $20 million grant from ARENA.
In addition to the above committed projects, APA continues to develop opportunities with
our customers to deliver more energy to users. Three such opportunities include a pipeline
looking to connect a possible LNG import facility to the domestic gas market; the Western
Slopes Pipeline; and a feasibility study to connect Northern Queensland gas basins to APA’s
East Coast Grid.
Western Slopes Pipeline: APA has a project development agreement with a subsidiary of
Santos Limited to develop the new ~450km Western Slopes Pipeline. The pipeline would
connect the proposed Santos Narrabri Gas Project to APA’s Moomba Sydney Pipeline. A
significant program of targeted ecology, cultural heritage and soil surveys has been
undertaken across the proposed pipeline route, and a range of community consultation
activities are progressing. This will continue as the timetable progresses towards the
lodgement of an Environmental Impact Statement during 2H2018. The development of the
Western Slopes Pipeline is subject to Santos’ final investment decision on the Narrabri Gas
Project.

15
Australian Pipeline Trust (ARSN 091 678 778) and its Controlled Entities
Directors’ Report for the half year ended 31 December 2017
8 Financing Activities
8.1 Capital Management
As at 31 December 2017, APA had 1,114,307,369 securities on issue. This is unchanged from
30 June 2017.
APA’s debt portfolio has a broad spread of maturities extending out to FY2035, with an
average maturity of drawn debt of 7.0 years as at 31 December 2017. APA’s gearing1 of
68.9% at 31 December 2017 continues to provide strong support to APA’s two investment
grade credit ratings.
APA debt maturity profile and diversity of funding sources
Notes: (1) APA debt maturity profile as at 31 December 2017.
(2) USD denominated obligations translated to AUD at the prevailing rate at inception (USD144A - AUD/USD=0.7879,
EMTN & Sterling AUD/USD=0.7772).
(3) For full details, refer to “Redemption of APA Subordinated Notes” sub-section below.
As at 31 December 2017, APA had around $1,350 million in cash and committed undrawn
facilities available to assist in the ongoing funding of the business. APA remains committed
to funding its growth with appropriate levels of equity, cash retained in the business, and
funding from debt facilities in order to maintain strong BBB and Baa2 metrics.
APA has a prudent treasury policy which requires high levels of interest rate hedging to
minimise the potential impacts from adverse movements in interest rates. As at 31
December 2017, 94.4% (30 June 2017: 94.5%) of interest obligations on gross borrowings was
either hedged into or issued at fixed interest rates for varying periods extending out to 2035.
Following redemption of the APA Subordinated Notes on 31 March 2018, all of APA’s drawn
debt will be issued in, or hedged into, fixed interest rates out to 2035.
The majority of the revenues to be received over the next 18 years from the foundation
contracts on the Wallumbilla Gladstone Pipeline will be received in US dollars (USD). The
US$3.7 billion of debt raised to assist with funding of that acquisition is being managed as a
“designated hedge” for those revenues and therefore has been retained in USD. Net USD
1 For the purpose of the calculation, drawn debt that has been kept in USD (rather than AUD) and is in a
designated hedge relationship with USD revenue, has been nominally exchanged at AUD/USD exchange rates of
0.7772 for Euro and GBP MTN issuances and 0.7879 for US144A notes at respective inception dates.
$0m
$200m
$400m
$600m
$800m
$1,000m
$1,200m
$1,400m
$1,600mSterling MTN
Euro MTN
US 144A Notes
First Call Date - 60 year
Sub Notes
Canadian MTN
Japanese MTN
Australian MTN
US Private Placement
Notes
USD denominated
obligations(2)
(3)

16
Australian Pipeline Trust (ARSN 091 678 778) and its Controlled Entities
Directors’ Report for the half year ended 31 December 2017
cash flow (after servicing the USD interest costs) that is not part of that “designated
relationship” will continue to be hedged into AUD on a rolling basis for an appropriate
period of time, in-line with APA’s treasury policy. To date, the following net USD cash flow
hedging has been undertaken:
Period Average forward USD/AUD exchange rate
FY2018 0.7282
1H FY2019 (to Dec 2018) 0.6724
A large portion of the net revenue from March 2019 is in that designated hedge
relationship with the USD debt and as such, when that revenue is receivable, it will be
recognised in the profit and loss at an average rate of around 0.78 AUD/USD.
Redemption of APA Subordinated Notes
On 21 February 2018, APT Pipelines Limited gave notification of its intention to redeem all of
the $515 million APA Group Subordinated Notes (AQHHA) on 31 March 2018, in
accordance with the terms of those Notes.
Capital Raising - Entitlement Offer
On 21 February 2018, APA Group announced a fully underwritten pro-rata accelerated
institutional tradeable retail renounceable entitlement offer (Entitlement Offer) to raise
approximately $500 million. The proceeds raised will be used to assist in the funding of
APA’s growth projects and capital expenditure program, funding of the redemption of APA
Group Subordinated Notes, and for other general corporate purposes. The Offer includes
both an Institutional component and a Retail Securityholder component, with funds to be
received prior to the end of March 2018.
The new securities issued under the Entitlement Offer will not be entitled to the interim
distribution to be paid by APA on 14 March 2018, but in all other respects rank pari passu
with the other APA securities on issue at this date.
8.2 Borrowings and finance costs
As at 31 December 2017, APA had borrowings of $9,250.5 million ($9,249.7 million at 30 June
2017) from a mix of US Private Placement Notes, Medium Term Notes in several currencies,
Australian Medium Term Notes, United States 144A Notes and APA Group Subordinated
Notes.
For the 6 months, net finance costs increased by $7.9 million, or 3.1%, to $262.7 million (1H
FY2017: $254.7 million). The increase is primarily due to additional borrowings used to fund
growth projects, including the Emu Downs Solar Farm, Darling Downs Solar Farm, Orbost
Gas Processing plant, Yamarna Gas Pipeline and Power Station, and the Reedy Creek
Wallumbilla Pipeline. The average interest rate (including credit margins)1 that applied to
drawn debt was 5.60% for the current period, up marginally from 5.56% in FY2017.
APA’s interest cover ratio for the current period was 2.6 times (June 2017: 2.8 times). The
interest cover ratio remains well in excess of its debt covenant default ratio of 1.1 times and
distribution lock up ratio of 1.3 times, and APA’s FFO/Interest ratio of 2.9 times (June 2017:
3.0 times) continues to support its strong and stable BBB and Baa2 credit ratings.
1 For the purpose of the calculation, drawn debt that has been kept in USD (rather than AUD) and is in a
designated hedge relationship with USD revenue, has been nominally exchanged at AUD/USD exchange rates of
0.7772 for Euro and GBP MTN issuances and 0.7879 for US144A notes at respective inception dates.
17
Australian Pipeline Trust (ARSN 091 678 778) and its Controlled Entities
Directors’ Report for the half year ended 31 December 2017
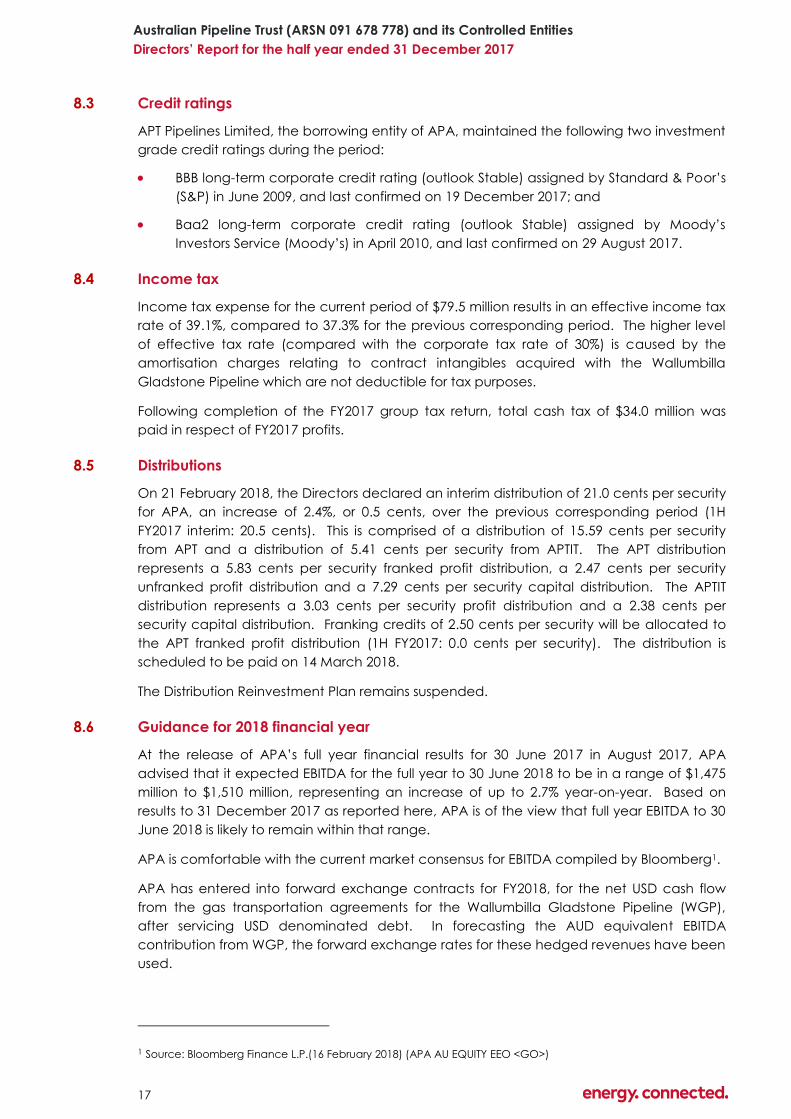
8.3 Credit ratings
APT Pipelines Limited, the borrowing entity of APA, maintained the following two investment
grade credit ratings during the period:
BBB long-term corporate credit rating (outlook Stable) assigned by Standard & Poor’s
(S&P) in June 2009, and last confirmed on 19 December 2017; and
Baa2 long-term corporate credit rating (outlook Stable) assigned by Moody’s
Investors Service (Moody’s) in April 2010, and last confirmed on 29 August 2017.
8.4 Income tax
Income tax expense for the current period of $79.5 million results in an effective income tax
rate of 39.1%, compared to 37.3% for the previous corresponding period. The higher level
of effective tax rate (compared with the corporate tax rate of 30%) is caused by the
amortisation charges relating to contract intangibles acquired with the Wallumbilla
Gladstone Pipeline which are not deductible for tax purposes.
Following completion of the FY2017 group tax return, total cash tax of $34.0 million was
paid in respect of FY2017 profits.
8.5 Distributions
On 21 February 2018, the Directors declared an interim distribution of 21.0 cents per security
for APA, an increase of 2.4%, or 0.5 cents, over the previous corresponding period (1H
FY2017 interim: 20.5 cents). This is comprised of a distribution of 15.59 cents per security
from APT and a distribution of 5.41 cents per security from APTIT. The APT distribution
represents a 5.83 cents per security franked profit distribution, a 2.47 cents per security
unfranked profit distribution and a 7.29 cents per security capital distribution. The APTIT
distribution represents a 3.03 cents per security profit distribution and a 2.38 cents per
security capital distribution. Franking credits of 2.50 cents per security will be allocated to
the APT franked profit distribution (1H FY2017: 0.0 cents per security). The distribution is
scheduled to be paid on 14 March 2018.
The Distribution Reinvestment Plan remains suspended.
8.6 Guidance for 2018 financial year
At the release of APA’s full year financial results for 30 June 2017 in August 2017, APA
advised that it expected EBITDA for the full year to 30 June 2018 to be in a range of $1,475
million to $1,510 million, representing an increase of up to 2.7% year-on-year. Based on
results to 31 December 2017 as reported here, APA is of the view that full year EBITDA to 30
June 2018 is likely to remain within that range.
APA is comfortable with the current market consensus for EBITDA compiled by Bloomberg1.
APA has entered into forward exchange contracts for FY2018, for the net USD cash flow
from the gas transportation agreements for the Wallumbilla Gladstone Pipeline (WGP),
after servicing USD denominated debt. In forecasting the AUD equivalent EBITDA
contribution from WGP, the forward exchange rates for these hedged revenues have been
used.
1 Source: Bloomberg Finance L.P.(16 February 2018) (APA AU EQUITY EEO <GO>)

18
Australian Pipeline Trust (ARSN 091 678 778) and its Controlled Entities
Directors’ Report for the half year ended 31 December 2017
Based on actual expenditure to date and our further expectations for the balance of the
financial year, net interest cost is now expected to be in a range of $510 million to $515
million, down from the previously advised higher range of $525 million to $535 million.
Distributions per security for the 2018 financial year are expected to be in the order of 45.0
cents per security, with the 2.5 cents per security of franking credits announced for the half
year and any further franking credits which may be allocated to the final distribution
attaching to that cash payout.
As per current APA distribution policy, all distributions will be fully covered by operating
cash flows.
9 Regulatory Matters
Gas Policy developments
Australia’s economic regulatory regime for gas pipelines is set out in the National Gas Law
(NGL) and the National Gas Rules (NGR). Some of APA’s pipelines have been covered by
the National Gas Access Regime since it was introduced in the 1990s. This regime includes
mechanisms for regulatory pricing approval for “fully regulated” pipelines, and lesser
obligations for “light regulation” pipelines.
A new, additional regulatory regime came into effect in August 2017 (December 2017 in
WA) and applies to APA’s unregulated pipelines. APA has worked with the Gas Market
Reform Group, Australian Energy Markets Operator and the industry on the design and
implementation of the new market mechanisms which include additional information
disclosure to support commercial negotiation for pipeline services, with an option to seek
an arbitrated outcome available in the event negotiation is unsuccessful.
Under the new regime, pipeline operators are required to publish their pricing
methodologies for unregulated pipelines. This information for APA’s East Coast and Central
Region gas transmission assets was published on APA’s website on 31 January 2018. It
includes APA’s pricing methodology and other information in relation to pipeline services
and tariffs for these assets consistent with the requirements of the National Gas Rules (Part
23). The published tariffs are consistent with tariffs that APA has agreed with its customers
over a number of years and with competitive outcomes. APA supports this initiative of
improved information transparency. Additional disclosure provisions require publication by
31 October 2018 of individual pipeline financial statements and average prices.
The commercial arbitration regime provides negotiating parties who cannot reach
agreement, access to an arbitrator to determine a commercial outcome that would occur
in a workably competitive market.
The COAG Energy Council has agreed to final recommendations on the design and
implementation of a pipeline capacity trading reform package following industry
discussions that APA participated in, including:
A Capacity Trading Platform to be operated by the Australian Energy Market
Operator, to facilitate the secondary trade of pipeline capacity between shippers;
A daily auction of un-nominated, contracted shipper capacity run by the Australian
Energy Market Operator, on all major pipelines;
The new capacity trading market mechanisms are scheduled to commence in March
2019.

19
Australian Pipeline Trust (ARSN 091 678 778) and its Controlled Entities
Directors’ Report for the half year ended 31 December 2017
During the period, at the request of the Victorian government, the AEMC undertook a
review of the Victorian Declared Wholesale Gas Market (DWGM). The Victorian
Government has not initiated any material changes to the structure of the market.
Limited Merits Review
On 31 October 2017, the Australian Government abolished limited merits review by the
Australian Competition Tribunal in relation to decisions by the Australian Energy Regulator
or Economic Regulation Authority (WA). Judicial review continues to be available as a
means of challenging an error by the regulator in its access arrangement determinations.
AEMC review of economic regulatory rules
In May 2017, the Australian Energy Market Commission (AEMC) started a review of the
scope of economic regulation applied to regulated pipelines under Parts 8-12 of the
National Gas Rules.
The AEMC review is broad in scope, and is looking at the nature of economic regulation for
gas pipelines and networks. The review is expected to report in June 2018, with a draft
report due in February 2018.
APA is engaging with the AEMC on matters under review.
Regulatory resets
The diagram below outlines the scheduled regulatory reset dates for pipelines owned and
operated by APA. During 1H FY2018, approximately 9.9% of APA’s Energy Infrastructure
revenues were delivered from regulated assets under approved access arrangements.
Key regulatory matters addressed during the half year period included:
Victorian Transmission System access arrangement
In November 2017, the Australian Energy Regulator published its final decision on the
access arrangement applying to the Victorian Transmission System. The Australian Energy
Regulator approved APA’s recent significant expansions of the system to enable gas flows
between Victoria and New South Wales, as well as the need for further future expansions of
the Victorian system, as prudent expenditure. Average tariffs will be largely unchanged
from the previous period.
Roma Brisbane Pipeline access arrangement
In November 2017, the Australian Energy Regulator also published its final decision on the
Roma Brisbane Access Arrangement which will apply from 1 January 2018. The Regulator in
its decision recognises changes in the pipeline configuration and demand profile since the
Note: Asset will cease to be covered as of 1 July 2019 in accordance with the National Gas Law and
Rules

20
Australian Pipeline Trust (ARSN 091 678 778) and its Controlled Entities
Directors’ Report for the half year ended 31 December 2017
Regulator’s last review through the approval of a bi-directional postage stamp tariff
structure. The new tariff is in line with that applying in the previous period, and APA’s
ongoing revenues that flow from longer term contracts that are currently in place, are
unchanged by the determination.
Environmental reporting
In October 2017, APA complied with Australia’s National Greenhouse and Energy Reporting
(NGER) obligations for FY2017.
APA’s main sources of emissions are from the combustion of natural gas in compressor
stations, from fugitive emissions associated with natural gas pipelines, and from gas fired
power stations. NGER compliance reporting applies to assets under APA’s operational
control, which includes gas transmission/distribution pipelines, power generation facilities
(including wind farms), gas storage, gas processing, cogeneration, electricity transmission
interconnectors and corporate offices.
APA’s summary of Scope 1 emissions and energy consumption for the 2017 financial year
as reported under the NGER, are set out in the following table:
FY2017 FY2016* Change
Scope 1 CO2 emissions (tonnes) 1,228,807 1,084,200 11.77%
Energy consumption (GJ) 23,930,506 19,510937 18.4%
* FY2016 figures do not include Daandine Power Station as these were reported in the on-site service provider’s
report only
10 Corporate Governance
New APA Corporate Governance Framework
The Board is committed to the highest standards of corporate governance, and on 1 July
2017 the Board adopted a new APA corporate governance framework which is designed
to be as consistent, as far as is practicable, with the best practice procedures of public
listed companies. The new APA Corporate Governance Framework gives Securityholders a
number of additional entitlements in relation to governance and remuneration matters. This
includes giving Securityholders the right to remove Directors from the Board, and to also
vote on APA’s annual Remuneration Report. If at two consecutive Annual Meetings at least
25% of the votes cast on the Remuneration Report are voted against its adoption, then the
‘two strikes’ mechanism under the Corporations Act would be triggered, giving
Securityholders the opportunity to spill the Board. A summary of the Corporate
Governance Framework and those additional entitlements is available on APA’s website.
The Remuneration Report for the year ended 30 June 2017 was voted on by Securityholders
at the 2017 Annual Meeting and was adopted.

21
Australian Pipeline Trust (ARSN 091 678 778) and its Controlled Entities
Directors’ Report for the half year ended 31 December 2017
Board changes
On 27 October 2017, Leonard Bleasel, AM, retired as Chairman of APA and was
succeeded by Michael Fraser following his re-election as a Director at the 2017 Annual
Meeting.
During the period, John Fletcher advised of his intention to retire from the Board effective
21 February 2018 and Patricia McKenzie advised of her intention to retire at the 2018
Annual Meeting.
A process for Board renewal and the appointment of new directors is ongoing. APA’s
Nomination Committee, is overseeing the non-executive director appointment process.
On 21 February 2018, APA announced the appointment of Shirley In’t Veld and Peter
Wasow as Directors of the Board effective 19 March 2018.
11 Auditor’s independence declaration
A copy of the independence declaration of the auditor, Deloitte Touche Tohmatsu
(“Auditor”) as required under section 307C of the Corporations Act is included at page 42.
12 Rounding of Amounts
APA is an entity of the kind referred to in ASIC Corporations Instrument 2016/191 and, in
accordance with that Instrument, amounts in the Directors’ report and the financial report
are rounded to the nearest thousand dollars, unless otherwise indicated.
13 Authorisation
The Directors’ report is signed in accordance with a resolution of the Directors of the
Responsible Entity.
On behalf of the Directors
Michael Fraser Debra Goodin
Chairman Director
21 February 2018
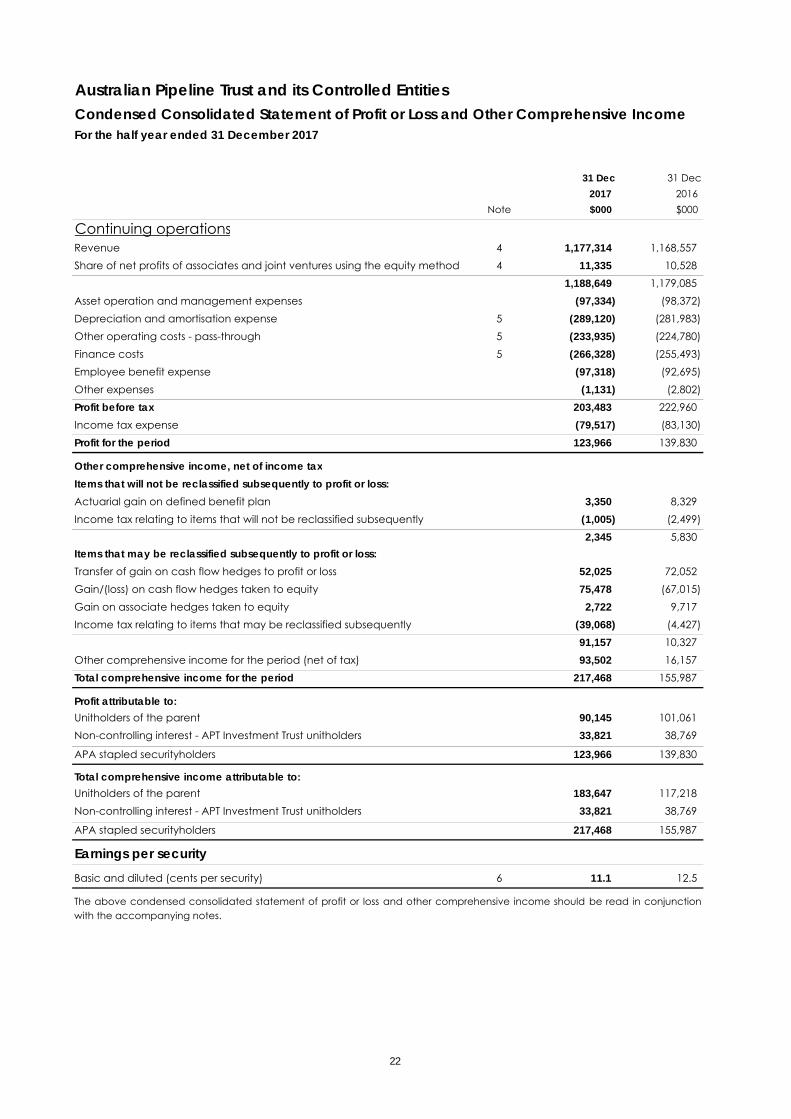
Australian Pipeline Trust and its Controlled EntitiesCondensed Consolidated Statement of Profit or Loss and Other Comprehensive IncomeFor the half year ended 31 December 2017
31 Dec 31 Dec2017 2016
Note $000 $000
Continuing operationsRevenue 4 1,177,314 1,168,557 Share of net profits of associates and joint ventures using the equity method 4 11,335 10,528
1,188,649 1,179,085 Asset operation and management expenses (97,334) (98,372) Depreciation and amortisation expense 5 (289,120) (281,983) Other operating costs - pass-through 5 (233,935) (224,780) Finance costs 5 (266,328) (255,493) Employee benefit expense (97,318) (92,695) Other expenses (1,131) (2,802) Profit before tax 203,483 222,960 Income tax expense (79,517) (83,130) Profit for the period 123,966 139,830
Other comprehensive income, net of income taxItems that will not be reclassified subsequently to profit or loss:Actuarial gain on defined benefit plan 3,350 8,329 Income tax relating to items that will not be reclassified subsequently (1,005) (2,499)
2,345 5,830 Items that may be reclassified subsequently to profit or loss:Transfer of gain on cash flow hedges to profit or loss 52,025 72,052 Gain/(loss) on cash flow hedges taken to equity 75,478 (67,015) Gain on associate hedges taken to equity 2,722 9,717 Income tax relating to items that may be reclassified subsequently (39,068) (4,427)
91,157 10,327 Other comprehensive income for the period (net of tax) 93,502 16,157 Total comprehensive income for the period 217,468 155,987
Profit attributable to:Unitholders of the parent 90,145 101,061 Non-controlling interest - APT Investment Trust unitholders 33,821 38,769
APA stapled securityholders 123,966 139,830
Total comprehensive income attributable to:Unitholders of the parent 183,647 117,218 Non-controlling interest - APT Investment Trust unitholders 33,821 38,769
APA stapled securityholders 217,468 155,987
Earnings per security Basic and diluted (cents per security) 6 11.1 12.5
The above condensed consolidated statement of profit or loss and other comprehensive income should be read in conjunctionwith the accompanying notes.
22

Australian Pipeline Trust and its Controlled EntitiesCondensed Consolidated Statement of Financial PositionAs at 31 December 2017
31 Dec 30 Jun2017 2017$000 $000
Current assetsCash and cash equivalents 273,234 394,501 Trade and other receivables 267,603 289,709 Other financial assets 80,231 52,334 Inventories 25,988 25,260 Other 12,380 10,527 Total current assets 659,436 772,331
Non-current assetsTrade and other receivables 14,780 15,496 Other financial assets 561,587 458,773 Investments accounted for using the equity method 264,186 259,882 Property, plant and equipment 9,290,543 9,150,165 Goodwill 1,183,604 1,183,604 Other intangible assets 3,083,100 3,174,282 Other 34,748 31,415 Total non-current assets 14,432,548 14,273,617 Total assets 15,091,984 15,045,948
Current liabilitiesTrade and other payables 310,145 312,611 Borrowings 205,029 126,858 Other financial liabilities 181,469 145,768 Provisions 77,344 93,773 Unearned revenue 32,854 19,225 Total current liabilities 806,841 698,235
Non-current liabilitiesTrade and other payables 6,331 4,984 Borrowings 9,528,569 9,573,907 Other financial liabilities 108,055 182,087 Deferred tax liabilities 596,392 502,265 Provisions 68,218 69,051 Unearned revenue 38,218 37,236 Total non-current liabilities 10,345,783 10,369,530 Total liabilities 11,152,624 11,067,765 Net assets 3,939,360 3,978,183
The above condensed consolidated statement of financial position should be read in conjunction with the accompanying notes.
23
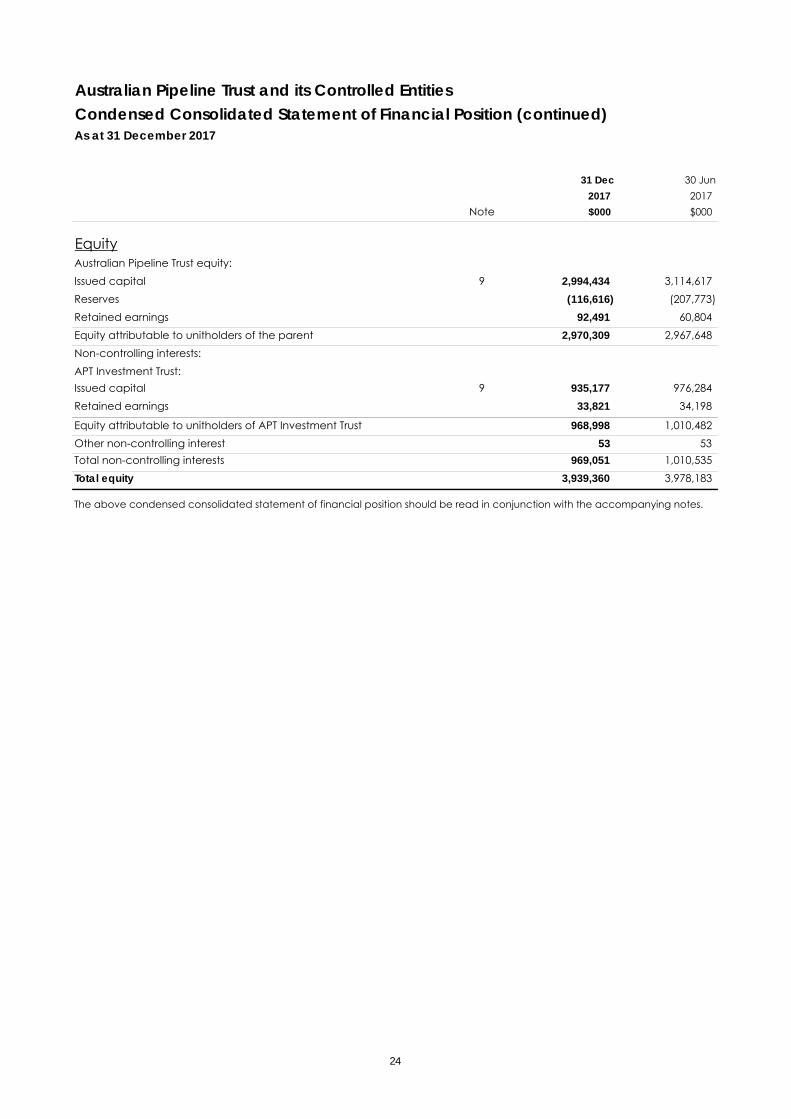
Australian Pipeline Trust and its Controlled EntitiesCondensed Consolidated Statement of Financial Position (continued)As at 31 December 2017
31 Dec 30 Jun2017 2017
Note $000 $000
EquityAustralian Pipeline Trust equity:Issued capital 9 2,994,434 3,114,617 Reserves (116,616) (207,773) Retained earnings 92,491 60,804 Equity attributable to unitholders of the parent 2,970,309 2,967,648 Non-controlling interests:APT Investment Trust:Issued capital 9 935,177 976,284 Retained earnings 33,821 34,198
Equity attributable to unitholders of APT Investment Trust 968,998 1,010,482 Other non-controlling interest 53 53 Total non-controlling interests 969,051 1,010,535 Total equity 3,939,360 3,978,183
The above condensed consolidated statement of financial position should be read in conjunction with the accompanying notes.
24

Australian Pipeline Trust and its Controlled EntitiesCondensed Consolidated Statement of Changes in EquityFor the half year ended 31 December 2017
AttributableAsset to owner APT Other non-
Issued Revaluation Hedging Retained of the Issued Retained Investment Issued Retained controllingCapital Reserve Reserve earnings parent Capital earnings Trust Capital Other earnings Interest Total
$000 $000 $000 $000 $000 $000 $000 $000 $000 $000 $000 $000 $000
Balance at 1 July 2016 3,195,445 8,669 (404,004) 182,062 2,982,172 1,005,074 41,812 1,046,886 4 1 48 53 4,029,111
Profit for the period - - - 101,061 101,061 - 38,769 38,769 - - - - 139,830
Other comprehensive income - - 14,754 8,329 23,083 - - - - - - - 23,083
Income tax relating to components of other
comprehensive income - - (4,427) (2,499) (6,926) - - - - - - - (6,926)
Total comprehensive income for the period - - 10,327 106,891 117,218 - 38,769 38,769 - - - - 155,987
Payment of distributions (19,869) - - (182,063) (201,932) (6,976) (41,811) (48,787) - - - - (250,719)
Balance at 31 December 2016 3,175,576 8,669 (393,677) 106,890 2,897,458 998,098 38,770 1,036,868 4 1 48 53 3,934,379
Balance at 1 July 2017 3,114,617 8,669 (216,442) 60,804 2,967,648 976,284 34,198 1,010,482 4 1 48 53 3,978,183
Profit for the period - - - 90,145 90,145 - 33,821 33,821 - - - - 123,966
Other comprehensive income - - 130,225 3,350 133,575 - - - - - - - 133,575
Income tax relating to components of other
comprehensive income - - (39,068) (1,005) (40,073) - - - - - - - (40,073)
Total comprehensive income for the period - - 91,157 92,490 183,647 - 33,821 33,821 - - - - 217,468
Payment of distributions (120,183) - - (60,803) (180,986) (41,107) (34,198) (75,305) - - - - (256,291)
Balance at 31 December 2017 2,994,434 8,669 (125,285) 92,491 2,970,309 935,177 33,821 968,998 4 1 48 53 3,939,360
The above condensed consolidated statement of changes in equity should be read in conjunction with the accompanying notes.
Australian Pipeline Trust APT Investment Trust Other non-controlling interest
25

Australian Pipeline Trust and its Controlled EntitiesCondensed Consolidated Statement of Cash FlowsFor the half year ended 31 December 2017
31 Dec 31 Dec2017 2016
Notes $000 $000
Cash flows from operating activitiesReceipts from customers 1,308,637 1,295,330 Payments to suppliers and employees (588,516) (555,202) Dividends received from associates and joint ventures 9,754 11,799 Proceeds from repayment of finance leases 887 1,242 Interest received 6,133 2,194 Interest and other costs of finance paid (237,995) (237,008) Income tax paid (36,373) (108) Net cash provided by operating activities 462,527 518,247
Cash flows from investing activitiesPayments for property, plant and equipment (320,705) (126,212) Proceeds from sale of property, plant and equipment 256 402 Payments for equity accounted investments - (35,250) Payments for controlled entities - (760) Payments for intangible assets (345) (912) Net cash used in investing activities (320,794) (162,732)
Cash flows from financing activitiesProceeds from borrowings - 803,782 Repayments of borrowings (5,731) (861,639) Payment of debt issue costs (835) (982) Release of restricted cash - 2,149 Distributions paid to:
Unitholders of APT 7 (180,986) (201,932) Unitholders of non-controlling interests - APTIT 7 (75,305) (48,787)
Net cash used in financing activities (262,857) (307,409)
Net (decrease)/increase in cash and cash equivalents (121,124) 48,106 Cash and cash equivalents at beginning of the period 394,501 84,506 Unrealised foreign exchange loss on cash held (143) (26) Cash and cash equivalents at end of the period 273,234 132,586
The above condensed consolidated statement of cash flows should be read in conjunction with the accompanying notes.
26

Australian Pipeline Trust and its Controlled EntitiesNotes to the condensed consolidated financial statementsFor the half year ended 31 December 2017
Basis of Preparation
1. About this report
1. About this report 3. Segment information
2. General information 4. Revenue
5. Expenses
6. Earnings per security
7. Distributions
8. Financial risk management 10. Contingencies
9. Issued capital 11.
12.
2. General information
In the following financial statements, note disclosures are grouped into four sections being: Basis of Preparation; FinancialPerformance; Capital Management; and Other.
Adoption of new and revised Accounting Standards
Events occurring after reporting date
The condensed consolidated general purpose financial statements for the half year ended 31 December 2017 have beenprepared in accordance with AASB 134 'Interim Financial Reporting' and the Corporations Act 2001. Compliance with AASB134 ensures compliance with International Financial Reporting Standard IAS 34 "Interim Financial Reporting". The half yearfinancial report is presented in Australian dollars and all values are rounded to the nearest thousand dollars ($000) inaccordance with ASIC Corporations Instrument 2016/191 unless otherwise stated.
The half year financial report does not include all of the notes of the type normally included in an annual financial report.Accordingly this report should be read in conjunction with the most recent annual financial report and any publicannouncements made by APA Group during the half year reporting period in accordance with the continuous disclosurerequirements of the Corporations Act 2001.
The accounting policies are consistent with those adopted and disclosed in the annual report for the financial year ended30 June 2017.
Basis of Preparation Financial Performance
OtherCapital Management
27

Australian Pipeline Trust and its Controlled EntitiesNotes to the condensed consolidated financial statements (continued)For the half year ended 31 December 2017
Basis of Preparation
2. General information (continued)Working capital position
Financial Performance
3. Segment information
APA Group comprises the following reportable segments:
●
●
●
Reportable segments
Energy Asset Energy
Infrastructure Management Investments ConsolidatedHalf year ended 31 December 2017 $000 $000 $000 $000
Segment revenue (a)
External sales revenue 898,823 39,557 - 938,380 Equity accounted net profits - - 11,335 11,335 Pass-through revenue 20,334 213,601 - 233,935 Finance lease and investment interest income 747 - 577 1,324 Total segment revenue 919,904 253,158 11,912 1,184,974 Other interest income 3,675 Consolidated revenue 1,188,649 (a) The revenue reported above represents revenue generated from external customers. Any intersegment sales were immaterial.
The working capital position as at 31 December 2017 for APA Group is that current liabilities exceed current assets by $147.4million (30 June 2017: current assets exceeded current liabilities by $74.1 million) primarily as a result of current borrowings of $205.0 million.
As at 31 December 2017, APA Group has access to committed, un-drawn bank facilities of $1,068.8 million (30 June 2017:$1,068.8 million) to meet the repayment of current borrowings on the due date.
The Directors continually monitor APA Group's working capital position, including forecast working capital requirementsand have ensured that there are appropriate refinancing strategies and adequate committed funding facilities in place toaccommodate debt repayments as and when they fall due.
Energy Investments, which includes APA Group's strategic stakes in a number of investment entities that house energyinfrastructure assets, generally characterised by long term secure cash flows, with low capital expenditurerequirements.
APA Group operates in one geographical segment, being Australia and the revenue from major products and services isshown by the reportable segments.
Energy Infrastructure, which includes all wholly or majority owned pipelines, gas storage and processing assets, andpower generation assets;Asset Management, which provides commercial, operating services and/or asset maintenance services to the majorityof APA Group's energy investments and Australian Gas Networks Limited for appropriate fees; and
28

Australian Pipeline Trust and its Controlled EntitiesNotes to the condensed consolidated financial statements (continued)For the half year ended 31 December 2017
Financial Performance
3. Segment information (continued)
Reportable segments (continued)
Energy Asset Energy
Infrastructure Management Investments Other ConsolidatedHalf year ended 31 December 2017 $000 $000 $000 $000 $000
Segment result
745,016 25,920 - - 770,936
- - 11,335 - 11,335
Finance lease and investment interest income 747 - 577 - 1,324 Corporate costs - - - (28,339) (28,339) Total EBITDA 745,763 25,920 11,912 (28,339) 755,256 Depreciation and amortisation (283,638) (5,482) - - (289,120) Earnings before interest and tax ("EBIT") 462,125 20,438 11,912 (28,339) 466,136
Net finance costs (b) (262,653) Profit before tax 203,483 Income tax expense (79,517) Profit for the period 123,966
Energy Asset EnergyInfrastructure Management Investments Consolidated
Segment assets and liabilities as at 31 December 2017 $000 $000 $000 $000
Segment assets 13,679,473 233,297 10,665 13,923,435 Carrying value of investments using the equity method - - 264,186 264,186
Unallocated assets (c) 904,363 Total assets 15,091,984
Segment liabilities 338,778 57,470 - 396,248
Unallocated liabilities (d) 10,756,376 Total liabilities 11,152,624
(b)
(c) Unallocated assets consist of cash and cash equivalents, fair value of interest rate swaps, foreign exchange contracts and equity forwards.(d) Unallocated liabilities consist of current and non-current borrowings, deferred tax liabilities, fair value of interest rate swaps and foreign exchange
contracts.
Excluding finance lease and investment interest income, and any gains or losses on revaluation of derivatives included as part of EBIT for segmentreporting purposes, but including other interest income.
Earnings before interest, tax, depreciation and amortisation ("EBITDA")Share of net profits of joint ventures and associates using the equity method
29

Australian Pipeline Trust and its Controlled EntitiesNotes to the condensed consolidated financial statements (continued)For the half year ended 31 December 2017
Financial Performance
3. Segment information (continued)
Reportable segments (continued)
Energy Asset Energy
Infrastructure Management Investments Other Consolidated
Half year ended 31 December 2016 $000 $000 $000 $000 $000
Segment revenue (a)
External sales revenue 900,995 39,157 - - 940,152
Equity accounted net profits - - 10,528 - 10,528
Pass-through revenue 26,417 198,363 - - 224,780 Finance lease and investment interest income 849 - 2,022 - 2,871
Total segment revenue 928,261 237,520 12,550 - 1,178,331
Other interest income 754
Consolidated revenue 1,179,085
Segment result
750,833 25,193 - - 776,026
- - 10,528 - 10,528
Finance lease and investment interest income 849 - 2,022 - 2,871
Corporate costs - - - (29,743) (29,743)
Total EBITDA 751,682 25,193 12,550 (29,743) 759,682
Depreciation and amortisation (276,526) (5,457) - - (281,983)
Earnings before interest and tax ("EBIT") 475,156 19,736 12,550 (29,743) 477,699
Net finance costs (b) (254,739)
Profit before tax 222,960
Income tax expense (83,130)
Profit for the period 139,830
Energy Asset EnergyInfrastructure Management Investments Consolidated
Segment assets and liabilities as at 30 June 2017 $000 $000 $000 $000
Segment assets 13,670,034 210,449 10,662 13,891,145
Carrying value of investments using the equity method - - 259,882 259,882
Unallocated assets (c) 894,921
Total assets 15,045,948
Segment liabilities 376,220 55,626 - 431,846
Unallocated liabilities (d) 10,635,919
Total liabilities 11,067,765
(a) The revenue reported above represents revenue generated from external customers. Any intersegment sales were immaterial.(b)
(c) Unallocated assets consist of cash and cash equivalents, fair value of interest rate swaps, foreign exchange contracts and equity forwards.(d) Unallocated liabilities consist of current and non-current borrowings, deferred tax liabilities, fair value of interest rate swaps and foreign exchange
contracts.
Excluding finance lease and investment interest income, and any gains or losses on revaluation of derivatives included as part of EBIT for segmentreporting purposes, but including other interest income.
Earnings before interest, tax, depreciation and amortisation ("EBITDA")Share of net profits of joint ventures and associates using the equity method
30
Australian Pipeline Trust and its Controlled EntitiesNotes to the condensed consolidated financial statements (continued)For the half year ended 31 December 2017
Financial Performance
3. Segment information (continued)
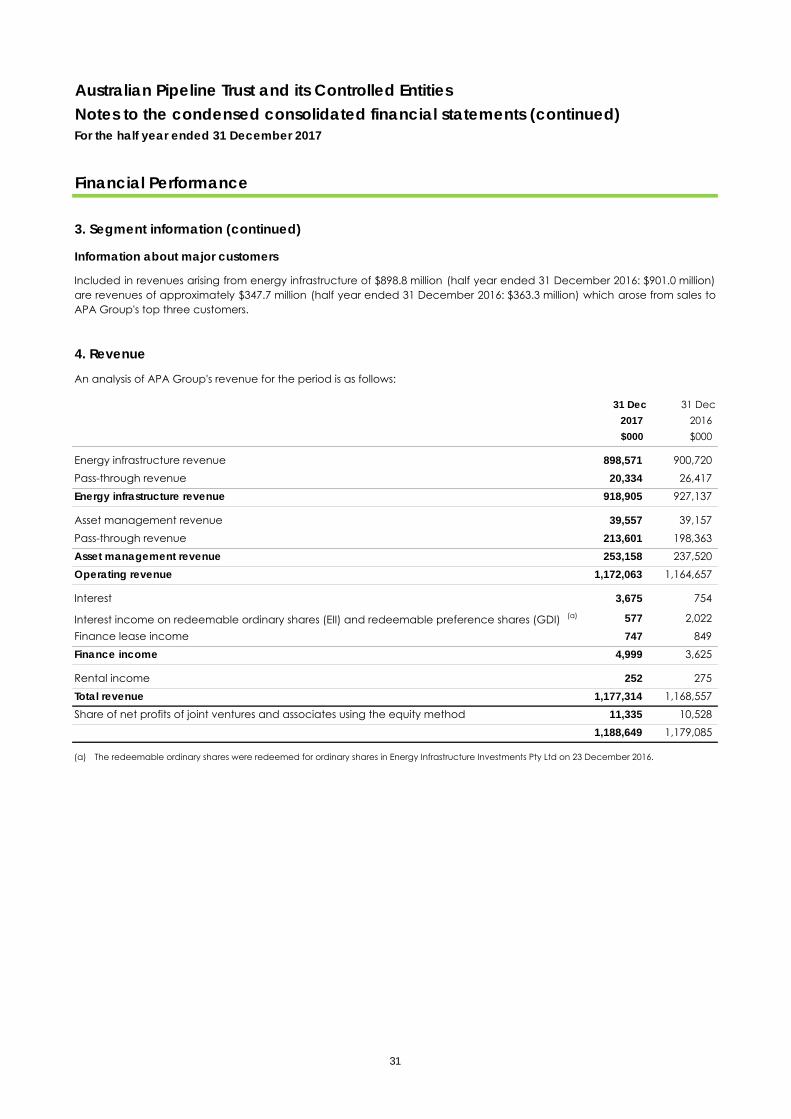
Information about major customers
4. Revenue
An analysis of APA Group's revenue for the period is as follows:
31 Dec 31 Dec2017 2016$000 $000
Energy infrastructure revenue 898,571 900,720 Pass-through revenue 20,334 26,417 Energy infrastructure revenue 918,905 927,137
Asset management revenue 39,557 39,157 Pass-through revenue 213,601 198,363 Asset management revenue 253,158 237,520 Operating revenue 1,172,063 1,164,657
Interest 3,675 754
Interest income on redeemable ordinary shares (EII) and redeemable preference shares (GDI) (a) 577 2,022 Finance lease income 747 849 Finance income 4,999 3,625
Rental income 252 275 Total revenue 1,177,314 1,168,557 Share of net profits of joint ventures and associates using the equity method 11,335 10,528
1,188,649 1,179,085
(a) The redeemable ordinary shares were redeemed for ordinary shares in Energy Infrastructure Investments Pty Ltd on 23 December 2016.
Included in revenues arising from energy infrastructure of $898.8 million (half year ended 31 December 2016: $901.0 million)are revenues of approximately $347.7 million (half year ended 31 December 2016: $363.3 million) which arose from sales toAPA Group's top three customers.
31

Australian Pipeline Trust and its Controlled EntitiesNotes to the condensed consolidated financial statements (continued)For the half year ended 31 December 2017
Financial Performance
5. Expenses31 Dec 31 Dec
2017 2016$000 $000
Depreciation of non-current assets 197,594 190,587 Amortisation of non-current assets 91,526 91,396 Depreciation and amortisation expense 289,120 281,983
Energy infrastructure costs - pass-through 20,334 26,417 Asset management costs - pass-through 213,601 198,363 Other operating costs - pass-through 233,935 224,780
Interest on borrowings 261,313 248,864 Amortisation of deferred borrowing costs 4,916 4,721 Other finance costs 3,257 2,645
269,486 256,230 Less: amounts included in the cost of qualifying assets (5,930) (2,881)
263,556 253,349 Loss on derivatives 307 261 Unwinding of discount on non-current liabilities 2,465 1,883 Finance costs 266,328 255,493
6. Earnings per security31 Dec 31 Dec
2017 2016
Basic and diluted earnings per security (cents) 11.1 12.5
31 Dec 31 Dec2017 2016
$000 $000
Net profit attributable to securityholders for calculating basic and diluted earnings per security 123,966 139,830
31 Dec 31 Dec2017 2016No. of No. of
securities securities
000 000
Adjusted weighted average number of ordinary securities used in the calculation of basic and diluted earnings per security 1,114,307 1,114,307
The earnings and weighted average number of ordinary securities used in the calculation of basic and diluted earningsper security are as follows:
32
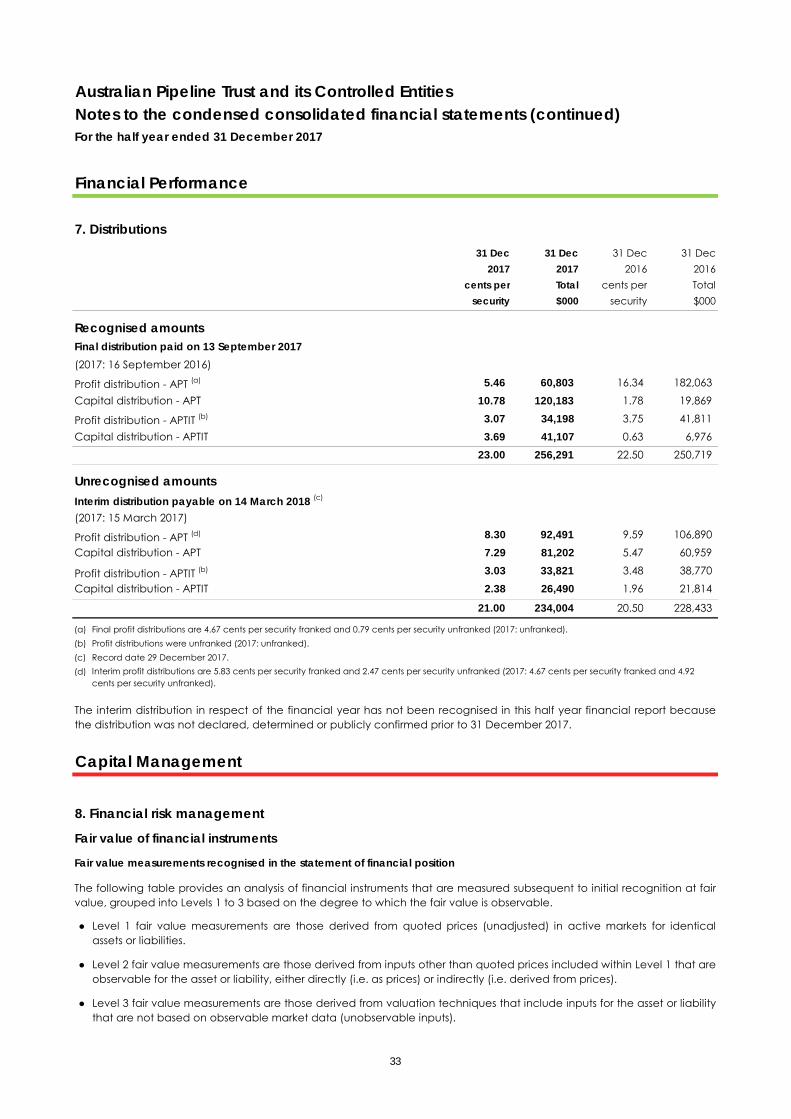
Australian Pipeline Trust and its Controlled EntitiesNotes to the condensed consolidated financial statements (continued)For the half year ended 31 December 2017
Financial Performance
7. Distributions31 Dec 31 Dec 31 Dec 31 Dec
2017 2017 2016 2016cents per Total cents per Total
security $000 security $000
Recognised amountsFinal distribution paid on 13 September 2017(2017: 16 September 2016)
Profit distribution - APT (a) 5.46 60,803 16.34 182,063 Capital distribution - APT 10.78 120,183 1.78 19,869
Profit distribution - APTIT (b) 3.07 34,198 3.75 41,811 Capital distribution - APTIT 3.69 41,107 0.63 6,976
23.00 256,291 22.50 250,719
Unrecognised amountsInterim distribution payable on 14 March 2018 (c)
(2017: 15 March 2017)
Profit distribution - APT (d) 8.30 92,491 9.59 106,890 Capital distribution - APT 7.29 81,202 5.47 60,959
Profit distribution - APTIT (b) 3.03 33,821 3.48 38,770 Capital distribution - APTIT 2.38 26,490 1.96 21,814
21.00 234,004 20.50 228,433
(a) Final profit distributions are 4.67 cents per security franked and 0.79 cents per security unfranked (2017: unfranked).(b) Profit distributions were unfranked (2017: unfranked). (c) Record date 29 December 2017.(d)
Capital Management
8. Financial risk management
Fair value of financial instruments
Fair value measurements recognised in the statement of financial position
●
●
●
Interim profit distributions are 5.83 cents per security franked and 2.47 cents per security unfranked (2017: 4.67 cents per security franked and 4.92 cents per security unfranked).
The interim distribution in respect of the financial year has not been recognised in this half year financial report becausethe distribution was not declared, determined or publicly confirmed prior to 31 December 2017.
Level 3 fair value measurements are those derived from valuation techniques that include inputs for the asset or liabilitythat are not based on observable market data (unobservable inputs).
The following table provides an analysis of financial instruments that are measured subsequent to initial recognition at fairvalue, grouped into Levels 1 to 3 based on the degree to which the fair value is observable.
Level 1 fair value measurements are those derived from quoted prices (unadjusted) in active markets for identicalassets or liabilities.
Level 2 fair value measurements are those derived from inputs other than quoted prices included within Level 1 that areobservable for the asset or liability, either directly (i.e. as prices) or indirectly (i.e. derived from prices).
33

Australian Pipeline Trust and its Controlled EntitiesNotes to the condensed consolidated financial statements (continued)For the half year ended 31 December 2017
Capital Management
8. Financial risk management (continued)
Fair value of financial instruments (continued)
Fair value measurements recognised in the statement of financial position (continued)
Fair value of the Group's financial assets and liabilities that are measured at fair value on a recurring basis
●
●
●
●
●
●
The fair values of financial assets and financial liabilities are measured at the end of each reporting period anddetermined as follows:
Transfers between levels of the fair value hierarchy occur at the end of the reporting period. There have been no transfersbetween the levels during the 6 months to 31 December 2017 (year ended 30 June 2017: none). Transfers between level 1and level 2 are triggered when there are quoted prices available in active markets. Transfers into level 3 are triggeredwhen the observable inputs become no longer observable, or vice versa for transfer out of level 3.
the fair values of available-for-sale financial assets and financial liabilities with standard terms and conditions andtraded on active liquid markets are determined with reference to quoted market prices. These instruments are classifiedin the fair value hierarchy at level 1;
the fair values of forward foreign exchange contracts included in hedging assets and liabilities are calculated usingdiscounted cash flow analysis based on observable forward exchange rates at the end of the reporting period andcontract forward rates discounted at a rate that reflects the credit risk of the various counterparties. These instrumentsare classified in the fair value hierarchy at level 2;
the fair values of interest rate swaps, cross currency swaps, equity forwards and other derivative instruments included inhedging assets and liabilities are calculated using discounted cash flow analysis using observable yield curves at theend of the reporting period and contract rates discounted at a rate that reflects the credit risk of the variouscounterparties. These instruments are classified in the fair value hierarchy at level 2;
the fair values of other financial assets and financial liabilities (excluding derivative instruments) are determined inaccordance with generally accepted pricing models based on discounted cash flow analysis using prices fromobservable current markets discounted at a rate that reflects the credit risk of the various counterparties. Theseinstruments are classified in the fair value hierarchy at level 2;
the fair value of financial guarantee contracts is determined based upon the probability of default by the specifiedcounterparty extrapolated from market-based credit information and the amount of loss, given the default. Theseinstruments are classified in the fair value hierarchy at level 2; and
the carrying value of financial assets and liabilities recorded at amortised cost in the financial statements approximatetheir fair value having regard to the specific terms of the agreements underlying those assets and liabilities.
34

Australian Pipeline Trust and its Controlled EntitiesNotes to the condensed consolidated financial statements (continued)For the half year ended 31 December 2017
Capital Management
8. Financial risk management (continued)
Fair value of financial instruments (continued)Fair value hierarchy
Level 1 Level 2 Level 3 TotalAs at 31 December 2017 $000 $000 $000 $000
Financial assets measured at fair valueEquity forwards designated as fair value through profit or loss - 1,031 - 1,031 Cross currency interest rate swaps used for hedging - 544,289 - 544,289 Forward foreign exchange contracts used for hedging - 63,587 - 63,587
- 608,907 - 608,907
Financial liabilities measured at fair valueInterest rate swaps used for hedging - 2,879 - 2,879 Cross currency interest rate swaps used for hedging - 243,052 - 243,052 Forward foreign exchange contracts used for hedging - 27,301 - 27,301
- 273,232 - 273,232
As at 30 June 2017Financial assets measured at fair valueEquity forwards designated as fair value through profit or loss - 2,673 - 2,673
Cross currency interest rate swaps used for hedging - 416,256 - 416,256 Forward foreign exchange contracts used for hedging - 65,485 - 65,485
- 484,414 - 484,414
Financial liabilities measured at fair valueInterest rate swaps used for hedging - 4,977 - 4,977 Cross currency interest rate swaps used for hedging - 269,019 - 269,019 Forward foreign exchange contracts used for hedging - 27,912 - 27,912
- 301,908 - 301,908
35

Australian Pipeline Trust and its Controlled EntitiesNotes to the condensed consolidated financial statements (continued)For the half year ended 31 December 2017
Capital Management
8. Financial risk management (continued)
Fair value of financial instruments (continued)
Fair value measurements of financial instruments measured at amortised cost
31 Dec 30 Jun 31 Dec 30 Jun2017 2017 2017 2017
$000 $000 $000 $000
Financial liabilitiesUnsecured long term Private Placement Notes 702,544 710,742 757,104 774,803 Unsecured Australian Dollar Medium Term Notes 500,000 500,000 534,611 534,030 Unsecured Japanese Yen Medium Term Notes 113,704 115,738 114,173 116,681 Unsecured Canadian Dollar Medium Term Notes 306,380 301,230 311,839 308,490 Unsecured US Dollar 144A Medium Term Notes 3,842,459 3,906,504 4,006,642 4,008,505 Unsecured British Pound Medium Term Notes 1,644,476 1,610,281 1,775,293 1,721,799 Unsecured Euro Medium Term Notes 2,076,311 2,007,377 2,075,829 1,976,924
9,185,874 9,151,872 9,575,491 9,441,232
(a) The fair values have been determined in accordance with generally accepted pricing models based on discounted cash flow analysis using pricesfrom observable current markets, discounted at a rate that reflects the credit risk of the various counterparties. These instruments are classified in thefair value hierarchy at level 2.
The financial liabilities included in the following table are fixed rate borrowings. Other debts held by APA Group arefloating rate borrowings and amortised cost as recorded in the financial statements at their approximate fair values.
Carrying amount Fair value (level 2) (a)
36

Australian Pipeline Trust and its Controlled EntitiesNotes to the condensed consolidated financial statements (continued)For the half year ended 31 December 2017
Capital Management
9. Issued capital31 Dec 30 Jun
2017 2017$000 $000
APT units
1,114,307,369 units, fully paid (2017: 1,114,307,369 units, fully paid) 2,994,434 3,114,617
31 Dec 30 Jun
2017 2017No. of No. of
securities securities000 $000 000 $000
Movements
Balance at beginning of financial year 1,114,307 3,114,617 1,114,307 3,195,445
Capital distributions paid (Note 7) - (120,183) - (80,828)
1,114,307 2,994,434 1,114,307 3,114,617
31 Dec 30 Jun
2017 2017
$000 $000
APTIT units
1,114,307,369 units, fully paid (2017: 1,114,307,369 units, fully paid)(a)935,177 976,284
31 Dec 30 Jun
2017 2017No. of No. of
securities securities
000 $000 000 $000
Movements
Balance at beginning of financial year 1,114,307 976,284 1,114,307 1,005,074 Capital distributions paid (Note 7) - (41,107) - (28,790)
1,114,307 935,177 1,114,307 976,284
(a) Fully paid securities carry one vote per security and carry the right to distributions.
37

Australian Pipeline Trust and its Controlled EntitiesNotes to the condensed consolidated financial statements (continued)For the half year ended 31 December 2017
Other items
10. Contingencies31 Dec 30 Jun
2017 2017$000 $000
Contingent liabilitiesBank guarantees 52,713 43,034
APA Group had no contingent assets as at 31 December 2017 (30 June 2017: None)
11. Adoption of new and revised Accounting StandardsStandards and Interpretations affecting amounts reported in the current period (and/or prior periods)
Standards and Interpretations issued not yet adopted
Effective for annual Expected to bereporting periods initially applied in the
Standard/Interpretation beginning on or after financial year ending
● AASB 9 ‘Financial Instruments’, and the relevant amending 1 January 2018 30 June 2019standards
● AASB 15 'Revenue from Contracts with Customers' 1 January 2018 30 June 2019
● AASB 16 'Leases' 1 January 2019 30 June 2020
There have not been any new or revised Standards and Interpretations issued by the AASB that are relevant to APA Group'soperations that are effective for the current reporting period.
At the date of authorisation of the financial statements, the Standards and Interpretations listed below were on issue butnot yet effective.
and AASB 2015-8 'Amendments to Australian Accounting Standards - Effective date of AASB 15'
As per the table above a number of new standards and amendments to standards are effective for annual periodsbeginning after 1 January 2018 with earlier adoption permitted. APA Group has chosen not to early adopt the new oramended standards in preparing these condensed consolidated interim financial statements.
38

Australian Pipeline Trust and its Controlled EntitiesNotes to the condensed consolidated financial statements (continued)For the half year ended 31 December 2017
Other items
11. Adoption of new and revised Accounting Standards (continued)The expected impacts of the new standards on APA group include:
AASB 9 ‘Financial Instruments’
AASB 15 'Revenue from Contracts with Customers'
APA Group has completed an initial assessment of the potential impact of the adoption of AASB 15 on the consolidatedfinancial statements. Based upon this assessment, it is not expected that AASB 15 will have a material impact to APAGroup’s Consolidated Statement of Profit or Loss. The Group is yet to conclude which transition method will be applied.
AASB 15 is effective for annual periods beginning on or after 1 January 2018, with early adoption permitted. APA Group will apply this new standard from 1 July 2018.
APA Group has completed an assessment of the potential impact of the adoption of AASB 9 on the consolidated financialstatements and does not expect the new standard to affect the classification and measurement of its financial assets orfinancial liabilities. The new hedge accounting rules will align the accounting for hedging instruments more closely withAPA Group’s risk management practices. AASB 9 will expand the range of eligible hedging instruments, and allow for aportfolio management approach to hedge accounting. Changes in the fair value of foreign exchange forward contractsattributable to forward points, and basis spread in relation to cross currency swaps, provide the option to be deferred in anew cost of hedging reserve within equity. The deferred amounts are to be recognised against the related hedgetransaction when it occurs. APA Group confirms that its current hedge relationships will qualify as continuing hedges uponthe adoption of AASB 9.
APA Group will apply the new rules retrospectively, except for hedge accounting which is applied prospectively, withpractical expedients permitted under the standard, although no material changes are expected. A review of the currentclassification and measurement of financial assets and liabilities has been undertaken to see if any changes are required.However due to the nature of instruments held, no changes were identified. A detailed assessment of all current hedgerelationships has been undertaken to ensure they comply under the new rules and confirm if any of the new conceptscould be employed to better manage the existing risks. Once again nothing has been identified. New hedgedocumentation has been completed for each type of current hedge relationship and regression testing completed in theTreasury Management System for a sample of relationships to ensure no system errors or constraints result, and thateffectiveness results are as expected. Recognition of impairment is also not expected to change. The history of collectionrates shows that APA Group does not have an expected loss on collection of debtors or loans.
AASB 9 requires the recognition of impairment provisions based on expected credit losses rather than only incurred creditlosses as is the case under AASB 139. Based upon this assessment, aside from the additional disclosure requirements, it isnot expected that AASB 9 will have any material impact to APA Group’s accounts.
AASB 9 is effective for annual periods beginning on or after 1 January 2018, with early adoption permitted. APA Group willapply this new standard from 1 July 2018. AASB 9 addresses the classification, measurement and de-recognition offinancial assets and financial liabilities, introduces new rules for hedge accounting and a new impairment model forfinancial assets.
39

Australian Pipeline Trust and its Controlled EntitiesNotes to the condensed consolidated financial statements (continued)For the half year ended 31 December 2017
Other items
11. Adoption of new and revised Accounting Standards (continued)AASB 16 'Leases'
AASB 16 is effective for annual periods beginning on or after 1 January 2019. Early adoption is permitted for entities that apply AASB 15 at or before the date of initial application of AASB 16. The Group will apply AASB 16 in the financial year beginning 1 July 2019.
Under AASB 16, the Group’s accounting for leases as a lessee will result in the recognition of a right-of-use (ROU) asset and an associated lease liability in the Consolidated Statement of Financial Position. The lease liability represents the present value of future lease payments, with the exception of short-term leases. An interest expense will be recognised on the lease liabilities and a depreciation charge will be recognised for the ROU assets. There will also be additional disclosure requirements under the new standard. The Group’s accounting for leases as a lessor remains unchanged under AASB 16.
As at 30 June 2017, APA Group had non-cancellable undiscounted operating lease commitments of $81.1 million as disclosed in Note 17 of the 2017 APA Group consolidated financial statements. These commitments predominantly relate to commercial offices, motor vehicles and crown leases which will require recognition as ROU assets and associated lease liabilities. The Group is currently assessing the impact of the new requirements on the Group’s reported assets and liabilities, however the implementation of AASB 16 is not expected to result in the recognition of ROU assets or lease liabilities each totalling more than the reported commitments as at 30 June 2017.
APA Group has not yet fully quantified the total impact on its consolidated statement of Profit or Loss as a result of the adoption of AASB 16. The quantitative effect will depend on, inter alia, the transition method chosen, discount rates applied, the extent to which APA Group uses the practical expedients and recognition exemptions, and any additional leases that APA Group enters into. However APA Group does not expect the adoption of AASB 16 to materially affect its financial results or to impact its ability to comply with any of its loan covenants.
12. Events occurring after reporting dateOn 21 February 2018, the Directors declared an interim distribution of 21.0 cents per security ($234.0 million) for APA Group, an increase of 2.44%, or 0.5 cents per security over the previous corresponding period (31 December 2016: 20.5 cents). This is comprised of a distribution of 15.59 cents per security from APT and a distribution of 5.41 cents per security from APTIT. The APT distribution represents a 5.83 cents per security franked profit distribution, a 2.47 cents per security unfranked profit distribution and 7.29 cents per security capital distribution. The APTIT distribution represents a 3.03 cent per security unfranked profit distribution and a 2.38 cents capital distribution. Franking credits of 2.5 cents per security will be allocated to the franked profit distribution. The distribution will be paid on 14 March 2018.
On 21 February 2018, APA Group announced a fully underwritten pro-rata accelerated institutional tradeable renounceable entitlement offer (Entitlement Offer) to raise $500 million. It is proposed that the proceeds raised will be used to assist in the funding of APA Group's growth projects and capital expenditure program, the funding of the redemption of APA Group Subordinated Notes, and for other general corporate purposes.
On 21 February 2018, APA Group announced APT Pipelines Limited (the issuer) has given notification of its intention to redeem all of the $515 million APA Group Subordinated Notes (AQHHA) on 31 March 2018, in accordance with the terms of the APA Group Subordinated Notes.
Other than the events disclosed above, there have not been any events or transactions that have occurred subsequent to the period end that would require adjustment to or disclosure in the accounts.
40
Australian Pipeline Trust and its Controlled EntitiesDeclaration by the Directors of Australian Pipeline LimitedFor the half year ended 31 December 2017
The Directors declare that:
(a)
(b)
On behalf of the Directors
Michael Fraser
Chairman
Debra Goodin
Director
SYDNEY, 21 February 2018
in the Directors’ opinion, there are reasonable grounds to believe that Australian Pipeline Trust will be able to pay itsdebts as and when they become due and payable; and
in the Directors’ opinion, the attached financial statements and notes thereto are in accordance with the CorporationsAct 2001, including compliance with Accounting Standards and give a true and fair view of the financial position andperformance of APA Group.
Signed in accordance with a resolution of the Directors of the Responsible Entity made pursuant to section 295(5) of theCorporations Act 2001.
41

Liability limited by a scheme approved under Professional Standards Legislation.
Member of Deloitte Touche Tohmatsu Limited
42
Deloitte Touche Tohmatsu A.B.N. 74 490 121 060 Grosvenor Place 225 George Street Sydney NSW 2000 PO Box N250 Grosvenor Place Sydney NSW 1220 Australia DX 10307SSE Tel: +61 (0) 2 9322 7000 Fax: +61 (0) 2 9322 7001 www.deloitte.com.au
The Directors
Australian Pipeline Limited as responsible entity for Australian Pipeline Trust
Level 25, 580 George Street
Sydney NSW 2000
21 February 2018
Dear Directors
Auditor’s Independence Declaration to Australian Pipeline Limited as responsible entity for
Australian Pipeline Trust
In accordance with section 307C of the Corporations Act 2001, I am pleased to provide the
following declaration of independence to the directors of Australian Pipeline Limited as
responsible entity for Australian Pipeline Trust.
As lead audit partner for the review of the financial statements of Australian Pipeline Trust for the
half year ended 31 December 2017, I declare that to the best of my knowledge and belief, there
have been no contraventions of:
(i) the auditor independence requirements of the Corporations Act 2001 in relation to the
review; and
(ii) any applicable code of professional conduct in relation to the review.
Yours faithfully
DELOITTE TOUCHE TOHMATSU
A V Griffiths
Partner
Chartered Accountants

Liability limited by a scheme approved under Professional Standards Legislation.
Member of Deloitte Touche Tohmatsu Limited
43
Deloitte Touche Tohmatsu A.B.N. 74 490 121 060 Grosvenor Place 225 George Street Sydney NSW 2000 PO Box N250 Grosvenor Place Sydney NSW 1220 Australia DX 10307SSE Tel: +61 (0) 2 9322 7000 Fax: +61 (0) 2 9322 7001 www.deloitte.com.au
Independent Auditor’s Review Report
to the Unitholders of Australian Pipeline Trust
We have reviewed the accompanying half-year financial report of Australian Pipeline Trust, which
comprises the condensed consolidated statement of financial position as at 31 December 2017, the
condensed consolidated statement of profit or loss and other comprehensive income, the condensed
consolidated statement of changes in equity and the condensed consolidated statement of cash flows
for the half-year ended on that date, notes comprising a summary of significant accounting policies and
other explanatory information, and the directors’ declaration of the consolidated entity comprising the
Trust and the entities it controlled at the end of the half-year or from time to time during the half-year
as set out on pages 22 to 41.
Directors’ Responsibility for the Half-Year Financial Report
The directors of Australian Pipeline Limited as responsible entity for Australian Pipeline Trust are
responsible for the preparation of the half-year financial report that gives a true and fair view in
accordance with Australian Accounting Standards and the Corporations Act 2001 and for such internal
control as the directors determine is necessary to enable the preparation of the half-year financial
report that gives a true and fair view and is free from material misstatement, whether due to fraud or
error.
Auditor’s Responsibility
Our responsibility is to express a conclusion on the half-year financial report based on our review. We
conducted our review in accordance with Auditing Standard on Review Engagements ASRE 2410 Review
of a Financial Report Performed by the Independent Auditor of the Entity, in order to state whether, on
the basis of the procedures described, we have become aware of any matter that makes us believe that
the half-year financial report is not in accordance with the Corporations Act 2001 including: giving a
true and fair view of the consolidated entity’s financial position as at 31 December 2017 and its
performance for the half-year ended on that date; and complying with Accounting Standard AASB 134
Interim Financial Reporting and the Corporations Regulations 2001. As the auditor of Australian
Pipeline Trust, ASRE 2410 requires that we comply with the ethical requirements relevant to the audit
of the annual financial report.

44
A review of a half-year financial report consists of making enquiries, primarily of persons responsible
for financial and accounting matters, and applying analytical and other review procedures. A review is
substantially less in scope than an audit conducted in accordance with Australian Auditing Standards
and consequently does not enable us to obtain assurance that we would become aware of all
significant matters that might be identified in an audit. Accordingly, we do not express an audit opinion.
Auditor’s Independence Declaration
In conducting our review, we have complied with the independence requirements of the Corporations
Act 2001. We confirm that the independence declaration required by the Corporations Act 2001, which
has been given to the directors of Australian Pipeline Limited as responsible entity for Australian
Pipeline Trust, would be in the same terms if given to the directors as at the time of this auditor’s
review report.
Conclusion
Based on our review, which is not an audit, we have not become aware of any matter that makes us
believe that the half-year financial report of Australian Pipeline Trust is not in accordance with the
Corporations Act 2001, including:
(a) giving a true and fair view of the consolidated entity’s financial position as at 31 December 2017
and of its performance for the half-year ended on that date; and
(b) complying with Accounting Standard AASB 134 Interim Financial Reporting and the
Corporations Regulations 2001.
DELOITTE TOUCHE TOHMATSU
A V Griffiths
Partner
Chartered Accountants
Sydney, 21 February 2018

45
APT Investment Trust (ARSN 115 585 441) and its Controlled Entity
Interim Financial Report for the half year ended 31 December 2017
APT INVESTMENT TRUST DIRECTORS’ REPORT
The Directors of Australian Pipeline Limited (“Responsible Entity”) submit their interim
financial report of APT Investment Trust (“APTIT”) and its controlled entity (together
“Consolidated Entity”) for the half year ended 31 December 2017. This report and financial
statements attached refer to the consolidated results of APTIT, one of the two stapled
entities of APA Group, with the other stapled entity being Australian Pipeline Trust (together
“APA”).
1 Directors
The names of the Directors of the Responsible Entity during the half year and since the half
year ended 31 December 2017 are:
Michael Fraser Chairman
Len Bleasel AM Retired as Chairman and Director on 27 October 2017
Michael (Mick) McCormack Chief Executive Officer and Managing Director
Steven (Steve) Crane
John Fletcher Retired 21 February 2018
Debra (Debbie) Goodin
Russell Higgins AO
Patricia McKenzie
The Company Secretary of the Responsible Entity during the half year and since the half
year ended 31 December 2017 is as follows:
Nevenka Codevelle
2 Principal Activities
The Consolidated Entity operates as an investment and financing entity within the APA
stapled group.
3 State of Affairs
No significant change in the state of affairs of the Consolidated Entity occurred during the
half year.
4 Subsequent Events
The following events have occurred subsequent to the period end:
On 21 February 2018, APA Group announced a fully underwritten pro-rata
accelerated institutional tradeable retail renounceable entitlement offer
(Entitlement Offer) to raise approximately $500 million. It is proposed that the
proceeds raised will be used to assist in the funding of APA’s growth projects and
capital expenditure program, the funding of the redemption of APA Group
Subordinated Notes, and for other general corporate purposes.

46
APT Investment Trust (ARSN 115 585 441) and its Controlled Entity
Interim Financial Report for the half year ended 31 December 2017
On 21 February 2018, the Directors declared an interim distribution for the 2017
financial year of 5.41 cents per unit ($60.3 million). The distribution represents a 3.03
cents per unit unfranked profit distribution and 2.38 cents per unit capital
distribution. The distribution will be paid on 14 March 2018.
Other than what is noted above and as disclosed elsewhere in this report, there has not
arisen in the interval between the end of the half year ended 31 December 2017 and the
date of this report any matter or circumstance that has significantly affected, or may
significantly affect, the Group’s operations, the results of those operations, or Group’s state
of affairs, in future financial years.
5 Review and Results of Operations
The Consolidated Entity reported net profit after tax of $33.8 million (1H FY2017: $38.8
million) for the half year ended 31 December 2017 and total revenue of $33.8 million (1H
FY2017: $38.8 million).
6 Distributions
On 21 February 2018, the Directors declared an interim distribution of 5.41 cents per security
($60.3 million), comprising of a 3.03 cents unfranked profit distribution and 2.38 cents
capital distribution. The distribution is payable on 14 March 2018.
7 Auditor’s Independence Declaration
A copy of the independence declaration of the auditor, Deloitte Touche Tohmatsu
(“Auditor”) as required under section 307C of the Corporations Act is included at page 57.
8 Rounding of Amounts
The Consolidated Entity is an entity of the kind referred to in ASIC Corporations Instrument
2016/191 and, in accordance with that Instrument, amounts in the Directors’ report and the
financial report are rounded to the nearest thousand dollars, unless otherwise indicated.
9 Authorisation
The Directors’ report is signed in accordance with a resolution of the Directors of the
Responsible Entity.
On behalf of the Directors
Michael Fraser Debra Goodin
Chairman Director
21 February 2018

APT Investment Trust and its Controlled EntityCondensed Consolidated Statement of Profit or Loss and Other Comprehensive IncomeFor the half year ended 31 December 2017
31 Dec 31 Dec2017 2016
Note $000 $000
Continuing operationsRevenue 3 33,821 38,769 Profit before tax 33,821 38,769 Income tax expense - - Profit for the period 33,821 38,769
Other comprehensive incomeItems that may be reclassified subsequently to profit or loss:Other comprehensive income for the period (net of tax) - - Total comprehensive income for the period 33,821 38,769
Profit Attributable to:Unitholders of the parent 33,821 38,769
33,821 38,769
Total comprehensive income attributable to:Unitholders of the parent 33,821 38,769
Earnings per unitBasic and diluted (cents per unit) 4 3.0 3.5
The above condensed consolidated statement of profit or loss and other comprehensive income should be read in conjunction withthe accompanying notes.
47

APT Investment Trust and its Controlled EntityCondensed Consolidated Statement of Financial PositionFor the half year ended 31 December 2017
31 Dec 30 Jun2017 2017
Note $000 $000
Current assetsReceivables 756 738
Non-current assetsReceivables 8,128 8,511 Other financial assets 960,126 1,001,246 Total non-current assets 968,254 1,009,757 Total assets 969,010 1,010,495
Current liabilitiesTrade and other payables 12 13 Total liabilities 12 13 Net assets 968,998 1,010,482
EquityIssued capital 6 935,177 976,284 Retained earnings 33,821 34,198 Total equity 968,998 1,010,482
The above condensed consolidated statement of financial position should be read in conjunction with the accompanying notes.
48
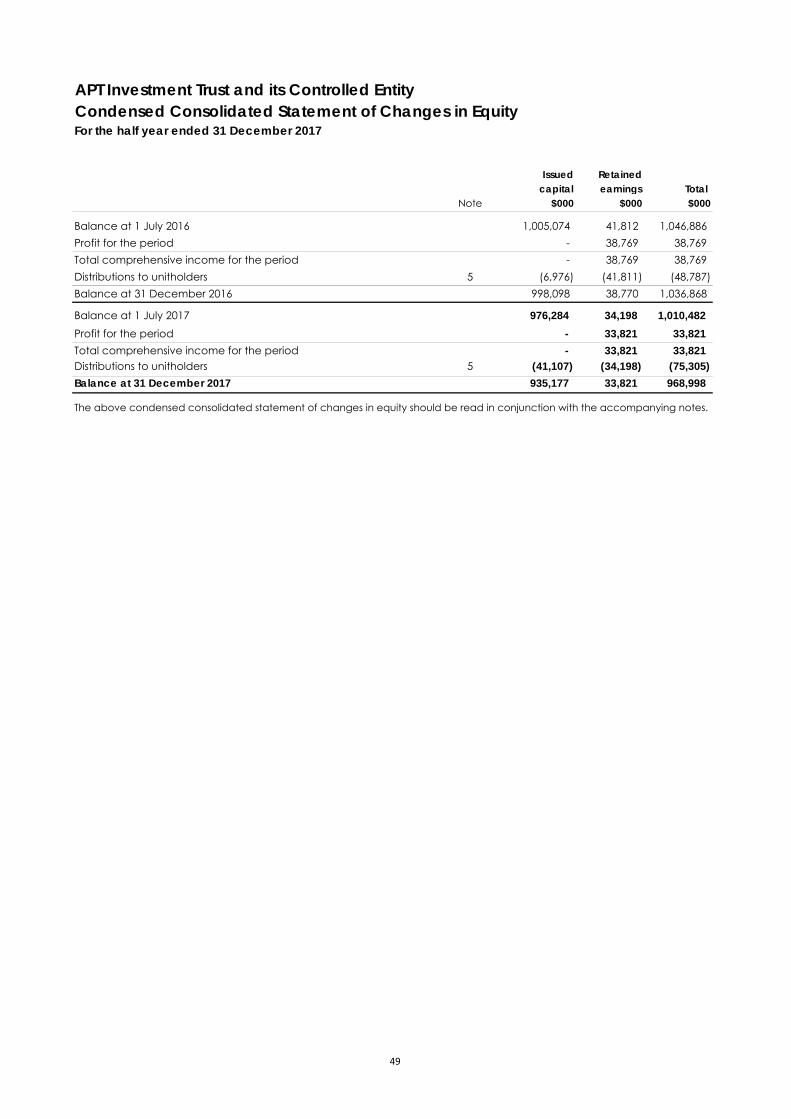
APT Investment Trust and its Controlled EntityCondensed Consolidated Statement of Changes in EquityFor the half year ended 31 December 2017
Issued Retainedcapital earnings Total
Note $000 $000 $000
Balance at 1 July 2016 1,005,074 41,812 1,046,886 Profit for the period - 38,769 38,769 Total comprehensive income for the period - 38,769 38,769 Distributions to unitholders 5 (6,976) (41,811) (48,787) Balance at 31 December 2016 998,098 38,770 1,036,868
Balance at 1 July 2017 976,284 34,198 1,010,482 Profit for the period - 33,821 33,821 Total comprehensive income for the period - 33,821 33,821 Distributions to unitholders 5 (41,107) (34,198) (75,305) Balance at 31 December 2017 935,177 33,821 968,998
The above condensed consolidated statement of changes in equity should be read in conjunction with the accompanying notes.
49

APT Investment Trust and its Controlled EntityCondensed Consolidated Statement of Cash FlowsFor the half year ended 31 December 2017
31 Dec 31 Dec2017 2016
Note $000 $000
Cash flows from operating activitiesTrust distribution - related party 14,042 15,063 Interest received - related parties 19,409 25,230 Proceeds from repayment of finance leases 584 584 Receipts from customers 151 137 Net cash provided by operating activities 34,186 41,014
Cash flows from investing activitiesProceeds from related parties 41,119 7,773 Net cash provided by in investing activities 41,119 7,773
Distributions to unitholders 5 (75,305) (48,787) Net cash used in financing activities (75,305) (48,787)
Net increase in cash and cash equivalents - - Cash and cash equivalents at beginning of the period - - Cash and cash equivalents at end of the period - -
The above condensed consolidated statement of cash flows should be read in conjunction with the accompanying notes.
Cash flows from financing activities
50

APT Investment Trust and its Controlled EntityNotes to the condensed consolidated financial statements For the half year ended 31 December 2017
Basis of Preparation
1. About this report
1. About this report 3. Profit from operations
2. General information 4. Earnings per unit
5. Distributions
6. Issued capital 7. Contingencies
8.
9.
2. General information
Segment information
In the following financial statements, note disclosures are grouped into four sections being: Basis of Preparation; FinancialPerformance; Capital Management; and Other.
The condensed consolidated general purpose financial statements for the half year ended 31 December 2017 have beenprepared in accordance with AASB 134 'Interim Financial Reporting' and the Corporations Act 2001. Compliance withAASB 134 ensures compliance with International Financial Reporting Standard IAS 34 "Interim Financial Reporting". The halfyear financial report is presented in Australian dollars and all values are rounded to the nearest thousand dollars ($000) inaccordance with ASIC Corporations Instrument 2016/191 unless otherwise stated.
The Consolidated Entity is an investing entity within the Australian Pipeline Trust stapled group. As the Trust only operates inone segment, it has not disclosed segment information separately.
Events occurring after reporting date
Adoption of new and revised Accounting Standards
The Consolidated Entity has one reportable segment being energy infrastructure investment.
The half year financial report does not include all of the notes of the type normally included in an annual financial report.Accordingly this report should be read in conjunction with the most recent annual financial report and any publicannouncements made by APA Group during the half year reporting period in accordance with the continuous disclosurerequirements of the Corporations Act 2001.
The accounting policies are consistent with those adopted and disclosed in the annual report for the financial year ended 30 June 2017.
Basis of Preparation Financial Performance
OtherCapital Management
51

APT Investment Trust and its Controlled EntityNotes to the condensed consolidated financial statements (continued)For the half year ended 31 December 2017
Financial Performance
3. Profit from operationsProfit before income tax includes the following items of income and expense:
31 Dec 31 Dec2017 2016$000 $000
RevenueDistributionsTrust distribution - related party 14,042 15,063
14,042 15,063
Finance incomeInterest - related parties 19,409 23,843 Loss on financial asset held at fair value through profit or loss - (510) Finance lease income - related party 219 236
19,628 23,569
Other revenueOther 151 137 Total revenue 33,821 38,769
4. Earnings per unit31 Dec 31 Dec
2017 2016
Basic and diluted (cents per unit) 3.0 3.5
31 Dec 31 Dec2017 2016$000 $000
Net profit attributable to unitholders for calculating basic and diluted earnings per unit 33,821 38,769
31 Dec 31 Dec2017 2016
No. of No. ofunits units
000 000
Adjusted weighted average number of ordinary units used in the calculation of basic and diluted earnings per unit 1,114,307 1,114,307
The earnings and weighted average number of units used in the calculation of basic and diluted earnings per unit are as follows:
52

APT Investment Trust and its Controlled EntityNotes to the condensed consolidated financial statements (continued)For the half year ended 31 December 2017
Financial Performance
5. Distributions31 Dec 31 Dec 31 Dec 31 Dec
2017 2017 2016 2016cents per Total cents per Total
unit $000 unit $000
Recognised amountsFinal distribution paid on 13 September 2017(2017: 16 September 2016)
Profit distribution (a) 3.07 34,198 3.75 41,811 Capital distribution 3.69 41,107 0.63 6,976
6.76 75,305 4.38 48,787
Unrecognised amountsInterim distribution payable on 14 March 2018 (b)
(2017: 15 March 2017)
Profit distribution (a) 3.03 33,821 3.48 38,770 Capital distribution 2.38 26,490 1.96 21,814
5.41 60,311 5.44 60,584
(a) Profit distributions unfranked (2017: unfranked). (b) Record date 29 December 2017.
6. Issued capital31 Dec 30 Jun
2017 2017$000 $000
1,114,307,369 units, fully paid (2017: 1,114,307,369 units, fully paid) (a) 935,177 976,284
30 Dec 30 Jun2017 2017
No. of No. ofunits units000 $000 000 $000
MovementsBalance at beginning of financial year 1,114,307 976,284 1,114,307 1,005,074 Capital distributions paid (Note 5) - (41,107) - (28,790)
1,114,307 935,177 1,114,307 976,284
(a)
The interim distribution in respect of the financial year has not been recognised in this half year financial report becausethe distribution was not declared, determined or publicly confirmed prior to 31 December 2017.
Fully paid units carry one vote per unit and carry the right to distributions.
53

APT Investment Trust and its Controlled EntityNotes to the condensed consolidated financial statements (continued)For the half year ended 31 December 2017
Other items
7. Contingencies
8. Adoption of new and revised Accounting Standards
Standards and Interpretations affecting amounts reported in the current period (and/or prior periods)
Standards and Interpretations issued not yet adopted
Effective for annual Expected to bereporting periods initially applied in the
Standard/Interpretation beginning on or after financial year ending
● AASB 9 ‘Financial Instruments’, and the relevant amending 1 January 2018 30 June 2019standards
● AASB 15 'Revenue from Contracts with Customers', 1 January 2018 30 June 2019
● AASB 16 'Leases' 1 January 2019 30 June 2020
AASB 9 ‘Financial Instruments’
The Consolidated Entity had no material contingent assets, liabilities and commitments as at 31 December 2017 (30 June2017: $nil).
AASB 9 is effective for annual periods beginning on or after 1 January 2018, with early adoption permitted. TheConsolidated Entity will apply this new standard from 1 July 2018. AASB 9 addresses the classification, measurement andde-recognition of financial assets and financial liabilities, introduces new rules for hedge accounting and a newimpairment model for financial assets.
The Consolidated Entity has completed an assessment of the potential impact of the adoption of AASB 9 on theconsolidated financial statements and does not expect the new standard to affect the classification and measurement ofits financial assets or financial liabilities. The new hedge accounting rules will align the accounting for hedging instrumentsmore closely with APA Group’s risk management practices. The new impairment model requires the recognition ofimpairment provisions based on expected credit losses rather than only incurred credit losses as is the case under AASB139. Based upon the Consolidated Entity's assessment, aside from the additional disclosure requirements, it is not expectedthat AASB 9 will have any material impact to the Consolidated Entity’s accounts.
Due to the nature of instruments held, no changes are required to the current classification and measurement of financialassets and liabilities. The Consolidated Entity currently has not entered into any hedge relationships, and as a result will notbe impacted by the hedge accounting changes in AASB 9. Recognition of impairment is not expected to change, withhistoric collection rates demonstrating that the Consolidated Entity does not have an expected loss on collection ofdebtors or loans.
There have not been any new or revised Standards and Interpretations issued by the AASB that are relevant to theConsolidated Entity's operations that are effective for the current reporting period.
and AASB 2015-8 'Amendments to Australian Accounting Standards -Effective date of AASB 15'
At the date of authorisation of the financial statements, the Standards and Interpretations listed below were on issue butnot yet effective.
The expected impacts of the new standards on the Consolidated Entity include:
As per the table above a number of new standards and amendments to standards are effective for annual periodsbeginning after 1 January 2018 with earlier application permitted. The Consolidated Entity has not chosen to early adoptthe new or amended standards in preparing these condensed consolidated interim financial statements.
54

APT Investment Trust and its Controlled EntityNotes to the condensed consolidated financial statements (continued)For the half year ended 31 December 2017
Other items
8. Adoption of new and revised Accounting Standards (continued)AASB 15 'Revenue from Contracts with Customers' AASB 15 is effective for annual periods beginning on or after 1 January 2018, with early adoption permitted. The Consolidated Entity will apply this new standard from 1 July 2018 (financial year ended 30 June 2019).
The Consolidated Entity has completed an initial assessment of the potential impact of the adoption of AASB 15. As the revenue of the Consolidated Entity is limited to interest earnt on inter-entity loans, distribution revenue and finance lease income, AASB 15 is not expected to have any impact on the Consolidated Entity.
AASB 16 'Leases'AASB 16 is effective for annual periods beginning on or after 1 January 2019. Early adoption is permitted for entities that apply AASB 15 at or before the date of initial application of AASB 16. The consolidated entity will apply AASB 16 in the financial year beginning 1 July 2019.
The Consolidated Entity has completed an initial assessment of the potential impact of the adoption of AASB 16, as the Consolidated Entity is a lessor only, the new standard will not have a material impact on the consolidated financial statements.
9. Events occurring after reporting dateOn 21 February 2018, the Directors declared an interim distribution for the 2018 financial year of 5.41 cents per unit ($60.3 million). The distribution represents a 3.03 cents per unit unfranked profit distribution and 2.38 cents per unit capital distribution. The distribution will be paid on 14 March 2018.
On 21 February 2018, APA Group announced a fully underwritten pro-rata accelerated institutional tradeable renounceable entitlement offer (Entitlement Offer) to raise $500 million. It is proposed that the proceeds raised will be used to assist in the funding of APA Group's growth projects and capital expenditure program, the funding of the redemption of APA Group Subordinated Notes, and for other general corporate purposes.
Other than the events disclosed above, there have not been any events or transactions that have occurred subsequent to the period end that would require adjustment to or disclosure in the accounts.
55

APT Investment Trust and its Controlled EntityDeclaration by the Directors of Australian Pipeline LimitedFor the half year ended 31 December 2017
The Directors declare that:
(a)
(b)
On behalf of the Directors
Michael FraserChairman
Debra GoodinDirector
SYDNEY, 21 February 2018
in the Directors’ opinion, there are reasonable grounds to believe that APT Investment Trust will be able to pay its debtsas and when they become due and payable; and
in the Directors’ opinion, the attached financial statements and notes thereto are in accordance with theCorporations Act 2001, including compliance with Accounting Standards and give a true and fair view of the financialposition and performance of the Consolidated Entity.
Signed in accordance with a resolution of the Directors of the Responsible Entity made pursuant to section 295(5) of theCorporations Act 2001.
56

Liability limited by a scheme approved under Professional Standards Legislation.
Member of Deloitte Touche Tohmatsu Limited
57
Deloitte Touche Tohmatsu A.B.N. 74 490 121 060 Grosvenor Place 225 George Street Sydney NSW 2000 PO Box N250 Grosvenor Place Sydney NSW 1220 Australia DX 10307SSE Tel: +61 (0) 2 9322 7000 Fax: +61 (0) 2 9322 7001 www.deloitte.com.au
The Directors
Australian Pipeline Limited as responsible entity for APT Investment Trust
Level 25, 580 George Street
Sydney NSW 2000
21 February 2018
Dear Directors
Auditors Independence Declaration to Australian Pipeline Limited as responsible entity for APT
Investment Trust
In accordance with section 307C of the Corporations Act 2001, I am pleased to provide the
following declaration of independence to the directors of Australian Pipeline Limited as
responsible entity for APT Investment Trust.
As lead audit partner for the review of the financial statements of APT Investment Trust for the
half year ended 31 December 2017, I declare that to the best of my knowledge and belief, there
have been no contraventions of:
(i) the auditor independence requirements of the Corporations Act 2001 in relation to
the review; and
(ii) any applicable code of professional conduct in relation to the review.
Yours faithfully
DELOITTE TOUCHE TOHMATSU
A V Griffiths
Partner
Chartered Accountants

Liability limited by a scheme approved under Professional Standards Legislation. Member of Deloitte Touche Tohmatsu Limited 58
Deloitte Touche Tohmatsu
A.B.N. 74 490 121 060
Grosvenor Place
225 George Street
Sydney NSW 2000
PO Box N250 Grosvenor Place
Sydney NSW 1220 Australia
DX 10307SSE
Tel: +61 (0) 2 9322 7000
Fax: +61 (0) 2 9322 7001
www.deloitte.com.au
Independent Auditor’s Review Report
to the Unitholders of APT Investment Trust
We have reviewed the accompanying half-year financial report of APT Investment Trust, which
comprises the condensed consolidated statement of financial position as at 31 December 2017, the
condensed consolidated statement of profit or loss and other comprehensive income, the condensed
consolidated statement of changes in equity, the condensed consolidated statement of cash flows for
the half-year ended on that date, notes comprising a summary of significant accounting policies and
other explanatory information, and the directors’ declaration of the consolidated entity comprising
the Trust and the entities it controlled at the end of the half-year or from time to time during the
half-year as set out on pages 47 to 56.
Directors’ Responsibility for the Half-Year Financial Report
The directors of Australian Pipeline Limited as responsible entity for APT Investment Trust are
responsible for the preparation of the half-year financial report that gives a true and fair view in
accordance with Australian Accounting Standards and the Corporations Act 2001 and for such
internal control as the directors determine is necessary to enable the preparation of the half-year
financial report that gives a true and fair view and is free from material misstatement, whether due
to fraud or error.
Auditor’s Responsibility
Our responsibility is to express a conclusion on the half-year financial report based on our review.
We conducted our review in accordance with Auditing Standard on Review Engagements ASRE 2410
Review of a Financial Report Performed by the Independent Auditor of the Entity, in order to state
whether, on the basis of the procedures described, we have become aware of any matter that makes
us believe that the half-year financial report is not in accordance with the Corporations Act 2001
including: giving a true and fair view of the consolidated entity’s financial position as at 31 December
2017 and its performance for the half-year ended on that date; and complying with Accounting
Standard AASB 134 Interim Financial Reporting and the Corporations Regulations 2001. As the
auditor of APT Investment Trust, ASRE 2410 requires that we comply with the ethical requirements
relevant to the audit of the annual financial report.
A review of a half-year financial report consists of making enquiries, primarily of persons responsible
for financial and accounting matters, and applying analytical and other review procedures. A review
is substantially less in scope than an audit conducted in accordance with Australian Auditing
Standards and consequently does not enable us to obtain assurance that we would become aware of
all significant matters that might be identified in an audit. Accordingly, we do not express an audit
opinion.

59
Auditor’s Independence Declaration
In conducting our review, we have complied with the independence requirements of the Corporations
Act 2001. We confirm that the independence declaration required by the Corporations Act 2001,
which has been given to the directors of Australian Pipeline Limited as responsible entity for APT
Investment Trust, would be in the same terms if given to the directors as at the time of this auditor’s
review report.
Conclusion
Based on our review, which is not an audit, we have not become aware of any matter that makes us
believe that the half-year financial report of APT Investment Trust is not in accordance with the
Corporations Act 2001, including:
(a) giving a true and fair view of the consolidated entity’s financial position as at 31 December
2017 and of its performance for the half-year ended on that date; and
(b) complying with Accounting Standard AASB 134 Interim Financial Reporting and the
Corporations Regulations 2001.
DELOITTE TOUCHE TOHMATSU
A V Griffiths
Partner
Chartered Accountants
Sydney, 21 February 2018