Embed Size (px)
Citation preview
Dealtracker 2017Australian M&A and IPO market insightsOctober 2017
M&A
Financial Advisory
M&A deal volumes 06
Sector composition 08
Top 10 deals in the 18 months to June 2017 12
The Buyers 14
Top 5 Cross-Border Inbound Deals 17
Australia’s Core M&A: Mid-Market Business 18
Investment Managers 20
Valuation multiples by target size 22
Valuation multiples by target sector 24
Domestic vs international valuation multiples 26
Corporate M&A versus IM valuation multiples 28
Share price performance of listed companies 31
IPO activity in Australia 34
IPO size by sector 37
Top IPOs in each sector (6 months to 30 June 17) 38
Listing multiples and immediate price returns 39
Private equity story 41
Working together 43
Depth of experience 44
Corporate finance services 45
Mergers & aquisitions 46
Transaction advisory services 47
Valuation services 48
Financial modelling services 49
About us 51
Dealtracker 2017 3
Welcome to the fifth edition of Dealtracker, our analysis of the Australian mergers and acquisition (M&A) and equity markets. This edition covers transactions during the 18 month period from 1 January 2016 to 30 June 2017.
4 Dealtracker 2017
Our key insights
Strong deal activity
Deal volume has remained consistent with the prior Dealtracker period, driven by strong M&A activity for the most part across both IM and corporate acquirers during CY2016. This has been assisted by a significant rebound in the Materials sector, due to consolidation by opportunistic corporates and a slow resurgence in commodity prices.
Summary of findings
Continued flow of overseas acquirers
Overseas purchasers comprised 28% of transactions, up from 26% in the previous Dealtracker period. There has been continued appetite for Australian Information Technology businesses, primarily from the US and Canada, as the domestic technology landscape strengthens in its international reputation. Foreign buyers continue to acquire larger mid market businesses and are willing to pay higher multiples to secure premium strategic assets.
Dealtracker 2017 5
Investment Managers
The growth in Investment Manager activity in the current Dealtracker period was driven by successful fundraisings by a consolidated group of active fund managers, following high exit volumes in CY2013 to CY2015 and a number of significant infrastructure transactions. Compared to the previous Dealtracker, IM interest in Consumer Staples and Industrials was seen to be shifting towards Healthcare, Financial Services and Information Technology sector opportunities.
Deal multiples
The median multiples of EBITDA across the market as analysed during this Dealtracker period was higher than recent years, driven by outperformance in the Utilities, Industrials, IT and Telco industries. Deal multiples in the Utilities sector was driven by a number of mega deals (>$1bn transaction value) which was in contrast to the reduced ASX trading multiples of this sector as regulatory uncertainty dampened market sentiment.
Period of exits
The IPO market has slowed post the high activity level observed in CY2015, with a 37% decline in the value of IPO proceeds when comparing to CY2015 to CY2016. The slower activity resulted from increased market volatility at the beginning of CY2016 and at the lower end of the market, the amendments made to the ASX disclosure and listing requirements.
IntroductionThis fifth edition of Dealtracker focuses on Australian mergers and acquisitions (M&A), and equity market activity during the 18 month period to 30 June 2017. Our previous Dealtracker (edition four) covered the 18 months to 31 December 2015 and edition three covered the 18 months prior.
The data in this report was compiled from several sources including S&P Capital IQ, the Australian Securities Exchange, Mergermarket, IBISWorld, transaction surveys, company announcements and other publicly available documents. We consider this consolidated mutli-source analysis – supplemented with our own proprietary sources – to provide the most comprehensive insight into recent Australian deal activity.
This survey is limited to going concern business sales, excluding those with a significant real estate nature.
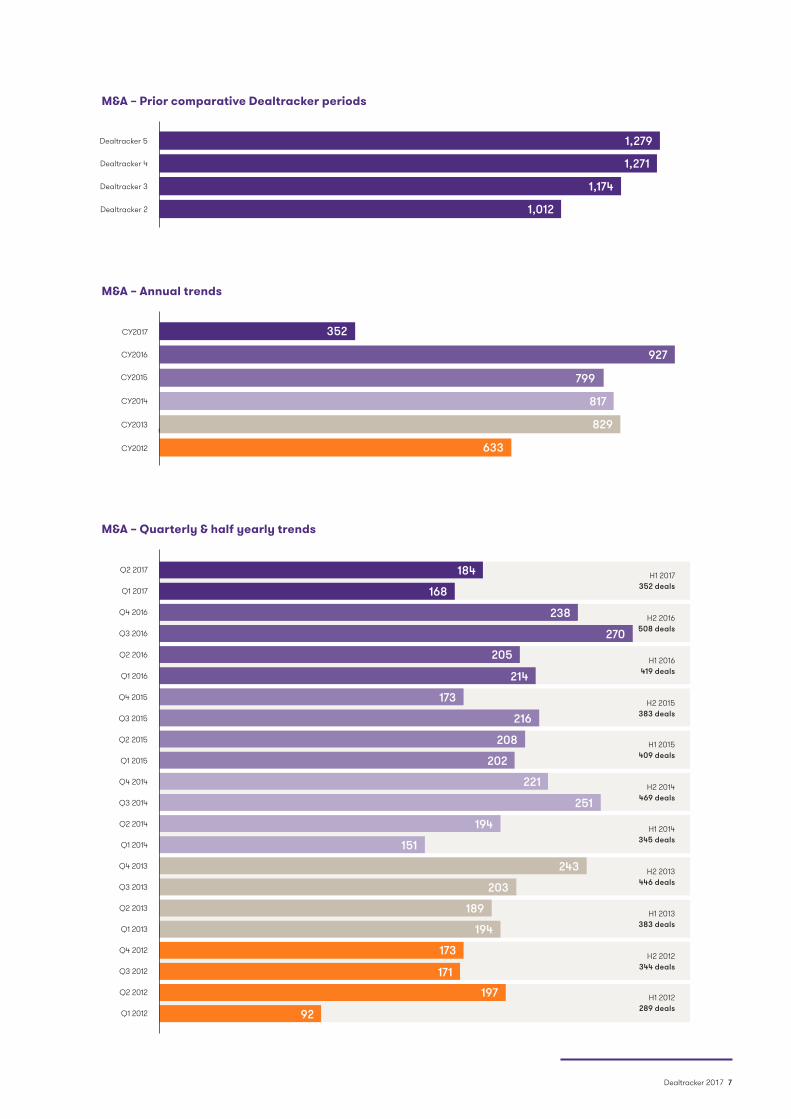
M&A deal trendsOur analysis shows that M&A deal volumes remained steady through the 18 months to 30 June 2017, with transactions growing by only 1% compared to the previous Dealtracker period (edition four).
On a calendar year basis, 2016 activity was at a record high with 927 deals, surpassing the previous high water mark of 829 deals in 2013. The record activity level is attributable to the second half of CY2016, with H1 likely subdued in part due to political uncertainty around the July 2016 federal election.
Despite the strong level of activity in CY2016, a downward trend has been experienced in Q1 and Q2 2017; deal numbers are 15% and 7% below the average deal volumes experienced over the previous 20 quarters, respectively. The recent decline in activity over Q1 and Q2 2017 is most likely driven by increased equity market volatility, global political and regulatory uncertainty, and a continuation of on-going deleveraging.
Deal volumes were strong through calendar year 2016, recording a record number of deals when compared to historical Dealtracker reports. Activity over 2017 appears to be moderating, likely driven by recent political and economic uncertainty and a volatile business environment.
M&A deal volumes
6 Dealtracker 2017
M&A – Prior comparative Dealtracker periods
Dealtracker 5
Dealtracker 4
Dealtracker 3
Dealtracker 2
1,279
1,271
1,174
1,012
M&A – Annual trends
CY2017
CY2016
CY2015
CY2014
CY2013
CY2012
352
927
799
817
829
633
M&A – Quarterly & half yearly trends
Q2 2017
Q2 2015
Q2 2013
Q1 2017
Q1 2015
Q1 2013
Q4 2016
Q4 2014
Q4 2012
Q3 2016
Q3 2014
Q3 2012
Q2 2016
Q2 2014
Q2 2012
Q1 2016
Q1 2014
Q1 2012
Q4 2015
Q4 2013
Q3 2015
Q3 2013
184 H1 2017 352 deals
H1 2016 419 deals
H1 2015 409 deals
H1 2014 345 deals
H1 2013 383 deals
H2 2016 508 deals
H2 2015 383 deals
H2 2014 469 deals
H2 2013 446 deals
H2 2012 344 deals
H1 2012 289 deals
168
238
270
205
214
173
216
208
202
221
251
194
151
243
203
189
194
173
171
197
92
Dealtracker 2017 7
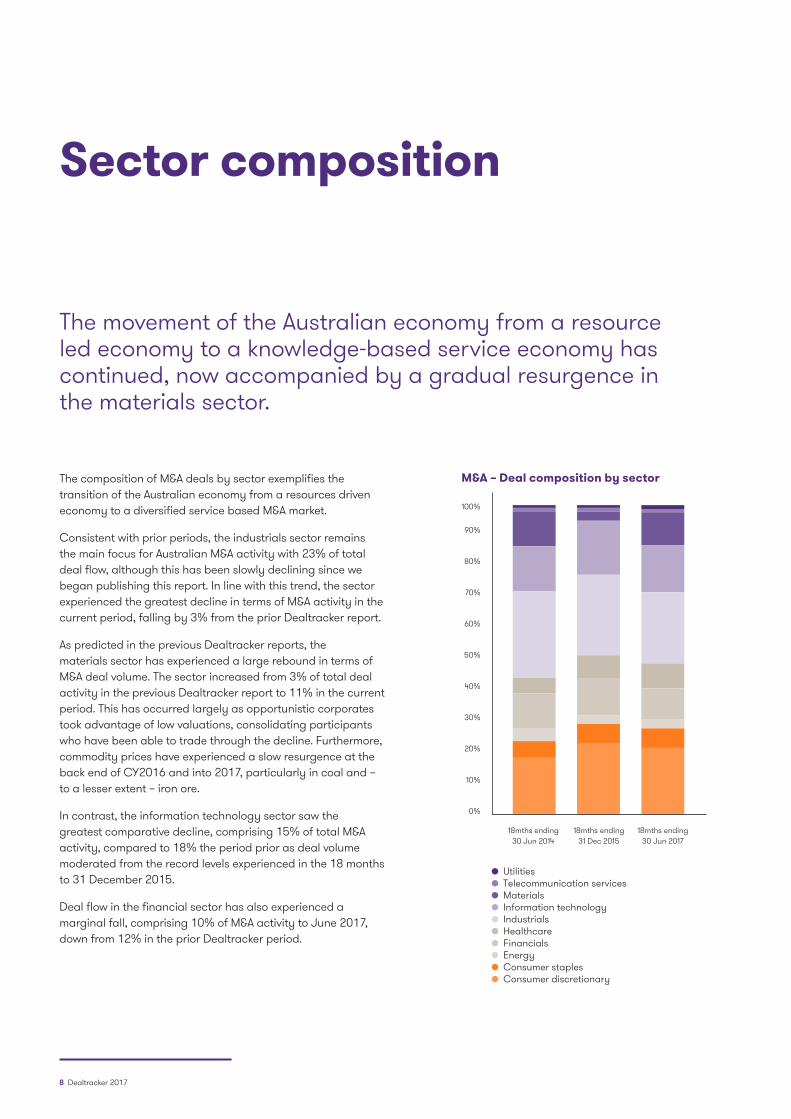
The composition of M&A deals by sector exemplifies the transition of the Australian economy from a resources driven economy to a diversified service based M&A market.
Consistent with prior periods, the industrials sector remains the main focus for Australian M&A activity with 23% of total deal flow, although this has been slowly declining since we began publishing this report. In line with this trend, the sector experienced the greatest decline in terms of M&A activity in the current period, falling by 3% from the prior Dealtracker report.
As predicted in the previous Dealtracker reports, the materials sector has experienced a large rebound in terms of M&A deal volume. The sector increased from 3% of total deal activity in the previous Dealtracker report to 11% in the current period. This has occurred largely as opportunistic corporates took advantage of low valuations, consolidating participants who have been able to trade through the decline. Furthermore, commodity prices have experienced a slow resurgence at the back end of CY2016 and into 2017, particularly in coal and – to a lesser extent – iron ore.
In contrast, the information technology sector saw the greatest comparative decline, comprising 15% of total M&A activity, compared to 18% the period prior as deal volume moderated from the record levels experienced in the 18 months to 31 December 2015.
Deal flow in the financial sector has also experienced a marginal fall, comprising 10% of M&A activity to June 2017, down from 12% in the prior Dealtracker period.
The movement of the Australian economy from a resource led economy to a knowledge-based service economy has continued, now accompanied by a gradual resurgence in the materials sector.
Sector composition
M&A – Deal composition by sector
100%
18mths ending 30 Jun 2014
18mths ending 31 Dec 2015
18mths ending 30 Jun 2017
90%
80%
70%
60%
50%
40%
30%
20%
10%
0%
Utilities Telecommunication services Materials Information technology Industrials Healthcare Financials Energy Consumer staples Consumer discretionary
8 Dealtracker 2017
The Materials sector has experienced a strong rebound in deal flow with the continuing importance of the services sector moderating to a certain degree.”
“
Dealtracker 2017 9
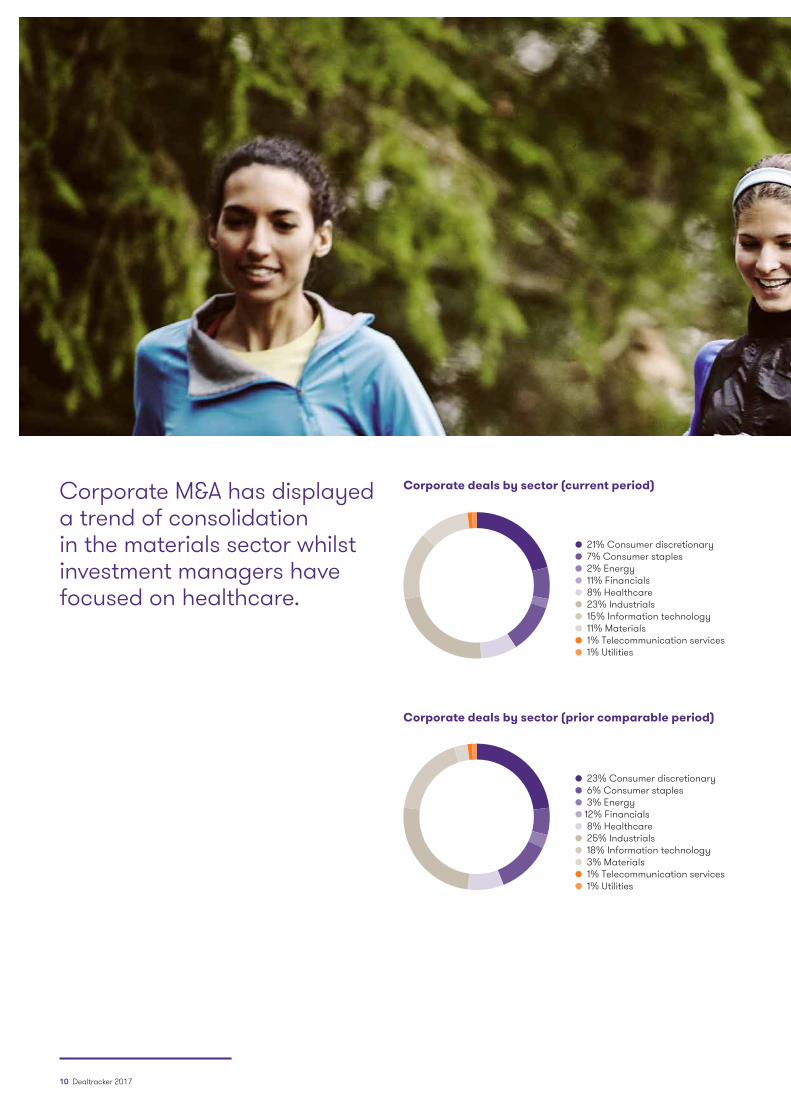
Corporate M&A has displayed a trend of consolidation in the materials sector whilst investment managers have focused on healthcare.
21% Consumer discretionary 7% Consumer staples 2% Energy 11% Financials 8% Healthcare 23% Industrials 15% Information technology 11% Materials 1% Telecommunication services 1% Utilities
23% Consumer discretionary 6% Consumer staples 3% Energy 12% Financials 8% Healthcare 25% Industrials 18% Information technology 3% Materials 1% Telecommunication services 1% Utilities
Corporate deals by sector (current period)
Corporate deals by sector (prior comparable period)
10 Dealtracker 2017
• Consistent with the prior period, a large portion of corporate acquisitions remains in the industrials sector (23%), continuing the consolidation theme. Corporate activity across other sector groups were similarly on par to the prior comparable period, aside from the materials sector which experienced a large increase in corporate deal volume from 3% of total activity in the prior period to 11% in the current period.
• In regards to IM acquisitions, there has been a change in strategy over the most recent period, with investment managers moving away from a focus in consumer staples and industrials to enter the healthcare sector. IM activity in the healthcare sector was proportionately larger (17%) in the 18 months to June 2017 than in the prior 18 month period (8%).
• The largest decline in IM deal flow was seen in the industrials sector, declining from 35% in the prior period, to 17% in the current period. This is supported by our experience in the market and liaison with IMs where investment focus remains in the areas of consumer discretionary, healthcare, information technology and financials.
30% Consumer discretionary 5% Consumer staples 7% Energy 7% Financials 17% Healthcare 17% Industrials 12% Information technology 3% Materials 1% Utilities
26% Consumer discretionary 5% Consumer staples 5% Energy 9% Financials 8% Healthcare 35% Industrials 10% Information technology 1% Materials 1% Utilities
IM deals by sector (current period)
IM deals by sector (prior comparable period)
Dealtracker 2017 11
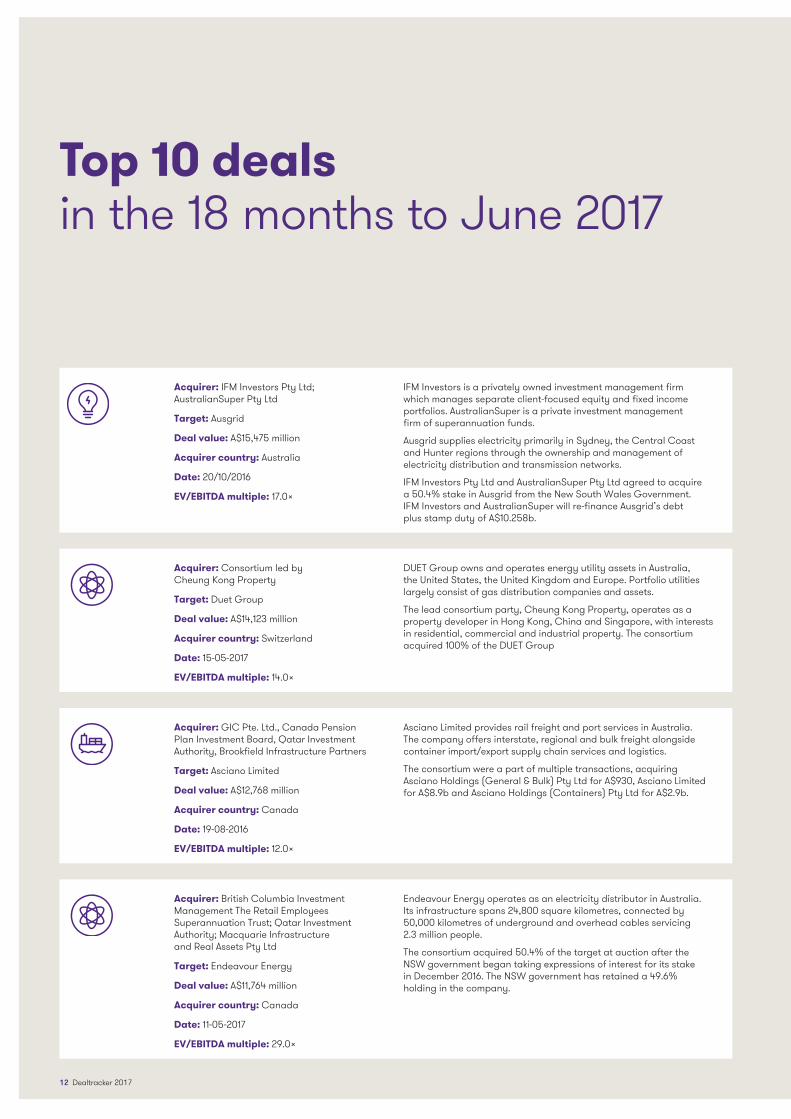
Top 10 deals in the 18 months to June 2017
Acquirer: Consortium led by Cheung Kong Property
Target: Duet Group
Deal value: A$14,123 million
Acquirer country: Switzerland
Date: 15-05-2017
EV/EBITDA multiple: 14.0x
DUET Group owns and operates energy utility assets in Australia, the United States, the United Kingdom and Europe. Portfolio utilities largely consist of gas distribution companies and assets.
The lead consortium party, Cheung Kong Property, operates as a property developer in Hong Kong, China and Singapore, with interests in residential, commercial and industrial property. The consortium acquired 100% of the DUET Group
Acquirer: British Columbia Investment Management The Retail Employees Superannuation Trust; Qatar Investment Authority; Macquarie Infrastructure and Real Assets Pty Ltd
Target: Endeavour Energy
Deal value: A$11,764 million
Acquirer country: Canada
Date: 11-05-2017
EV/EBITDA multiple: 29.0x
Endeavour Energy operates as an electricity distributor in Australia. Its infrastructure spans 24,800 square kilometres, connected by 50,000 kilometres of underground and overhead cables servicing 2.3 million people.
The consortium acquired 50.4% of the target at auction after the NSW government began taking expressions of interest for its stake in December 2016. The NSW government has retained a 49.6% holding in the company.
Acquirer: IFM Investors Pty Ltd; AustralianSuper Pty Ltd
Target: Ausgrid
Deal value: A$15,475 million
Acquirer country: Australia
Date: 20/10/2016
EV/EBITDA multiple: 17.0x
IFM Investors is a privately owned investment management firm which manages separate client-focused equity and fixed income portfolios. AustralianSuper is a private investment management firm of superannuation funds.
Ausgrid supplies electricity primarily in Sydney, the Central Coast and Hunter regions through the ownership and management of electricity distribution and transmission networks.
IFM Investors Pty Ltd and AustralianSuper Pty Ltd agreed to acquire a 50.4% stake in Ausgrid from the New South Wales Government. IFM Investors and AustralianSuper will re-finance Ausgrid’s debt plus stamp duty of A$10.258b.
Acquirer: GIC Pte. Ltd., Canada Pension Plan Investment Board, Qatar Investment Authority, Brookfield Infrastructure Partners
Target: Asciano Limited
Deal value: A$12,768 million
Acquirer country: Canada
Date: 19-08-2016
EV/EBITDA multiple: 12.0x
Asciano Limited provides rail freight and port services in Australia. The company offers interstate, regional and bulk freight alongside container import/export supply chain services and logistics.
The consortium were a part of multiple transactions, acquiring Asciano Holdings (General & Bulk) Pty Ltd for A$930, Asciano Limited for A$8.9b and Asciano Holdings (Containers) Pty Ltd for A$2.9b.
12 Dealtracker 2017
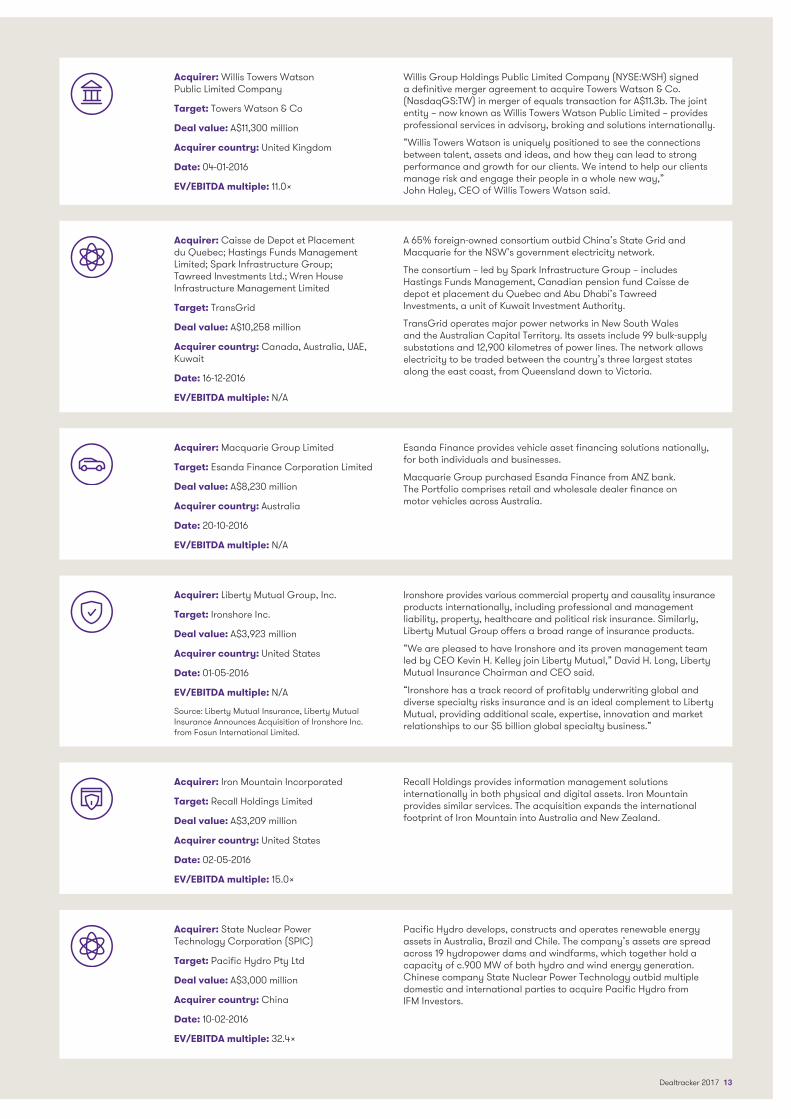
Acquirer: Willis Towers Watson Public Limited Company
Target: Towers Watson & Co
Deal value: A$11,300 million
Acquirer country: United Kingdom
Date: 04-01-2016
EV/EBITDA multiple: 11.0x
Willis Group Holdings Public Limited Company (NYSE:WSH) signed a definitive merger agreement to acquire Towers Watson & Co. (NasdaqGS:TW) in merger of equals transaction for A$11.3b. The joint entity – now known as Willis Towers Watson Public Limited – provides professional services in advisory, broking and solutions internationally.
“Willis Towers Watson is uniquely positioned to see the connections between talent, assets and ideas, and how they can lead to strong performance and growth for our clients. We intend to help our clients manage risk and engage their people in a whole new way,” John Haley, CEO of Willis Towers Watson said.
Acquirer: Caisse de Depot et Placement du Quebec; Hastings Funds Management Limited; Spark Infrastructure Group; Tawreed Investments Ltd.; Wren House Infrastructure Management Limited
Target: TransGrid
Deal value: A$10,258 million
Acquirer country: Canada, Australia, UAE, Kuwait
Date: 16-12-2016
EV/EBITDA multiple: N/A
A 65% foreign-owned consortium outbid China’s State Grid and Macquarie for the NSW’s government electricity network.
The consortium – led by Spark Infrastructure Group – includes Hastings Funds Management, Canadian pension fund Caisse de depot et placement du Quebec and Abu Dhabi’s Tawreed Investments, a unit of Kuwait Investment Authority.
TransGrid operates major power networks in New South Wales and the Australian Capital Territory. Its assets include 99 bulk-supply substations and 12,900 kilometres of power lines. The network allows electricity to be traded between the country’s three largest states along the east coast, from Queensland down to Victoria.
Acquirer: State Nuclear Power Technology Corporation (SPIC)
Target: Pacific Hydro Pty Ltd
Deal value: A$3,000 million
Acquirer country: China
Date: 10-02-2016
EV/EBITDA multiple: 32.4x
Pacific Hydro develops, constructs and operates renewable energy assets in Australia, Brazil and Chile. The company’s assets are spread across 19 hydropower dams and windfarms, which together hold a capacity of c.900 MW of both hydro and wind energy generation. Chinese company State Nuclear Power Technology outbid multiple domestic and international parties to acquire Pacific Hydro from IFM Investors.
Acquirer: Macquarie Group Limited
Target: Esanda Finance Corporation Limited
Deal value: A$8,230 million
Acquirer country: Australia
Date: 20-10-2016
EV/EBITDA multiple: N/A
Esanda Finance provides vehicle asset financing solutions nationally, for both individuals and businesses.
Macquarie Group purchased Esanda Finance from ANZ bank. The Portfolio comprises retail and wholesale dealer finance on motor vehicles across Australia.
Acquirer: Liberty Mutual Group, Inc.
Target: Ironshore Inc.
Deal value: A$3,923 million
Acquirer country: United States
Date: 01-05-2016
EV/EBITDA multiple: N/A
Source: Liberty Mutual Insurance, Liberty Mutual Insurance Announces Acquisition of Ironshore Inc. from Fosun International Limited.
Ironshore provides various commercial property and causality insurance products internationally, including professional and management liability, property, healthcare and political risk insurance. Similarly, Liberty Mutual Group offers a broad range of insurance products.
“We are pleased to have Ironshore and its proven management team led by CEO Kevin H. Kelley join Liberty Mutual,” David H. Long, Liberty Mutual Insurance Chairman and CEO said.
“Ironshore has a track record of profitably underwriting global and diverse specialty risks insurance and is an ideal complement to Liberty Mutual, providing additional scale, expertise, innovation and market relationships to our $5 billion global specialty business.”
Acquirer: Iron Mountain Incorporated
Target: Recall Holdings Limited
Deal value: A$3,209 million
Acquirer country: United States
Date: 02-05-2016
EV/EBITDA multiple: 15.0x
Recall Holdings provides information management solutions internationally in both physical and digital assets. Iron Mountain provides similar services. The acquisition expands the international footprint of Iron Mountain into Australia and New Zealand.
Dealtracker 2017 13
14 Dealtracker 2017
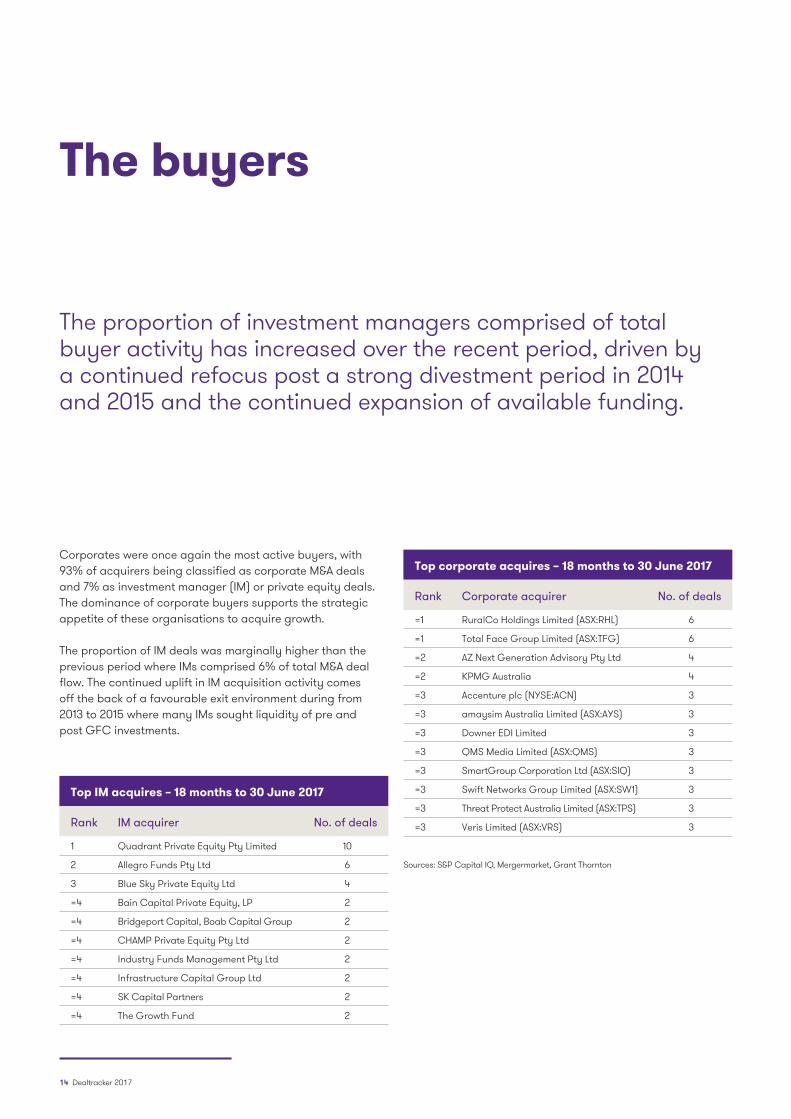
Corporates were once again the most active buyers, with 93% of acquirers being classified as corporate M&A deals and 7% as investment manager (IM) or private equity deals. The dominance of corporate buyers supports the strategic appetite of these organisations to acquire growth.
The proportion of IM deals was marginally higher than the previous period where IMs comprised 6% of total M&A deal flow. The continued uplift in IM acquisition activity comes off the back of a favourable exit environment during from 2013 to 2015 where many IMs sought liquidity of pre and post GFC investments.
The buyers
The proportion of investment managers comprised of total buyer activity has increased over the recent period, driven by a continued refocus post a strong divestment period in 2014 and 2015 and the continued expansion of available funding.
Top corporate acquires – 18 months to 30 June 2017
Rank Corporate acquirer No. of deals
=1 RuralCo Holdings Limited (ASX:RHL) 6
=1 Total Face Group Limited (ASX:TFG) 6
=2 AZ Next Generation Advisory Pty Ltd 4
=2 KPMG Australia 4
=3 Accenture plc (NYSE:ACN) 3
=3 amaysim Australia Limited (ASX:AYS) 3
=3 Downer EDI Limited 3
=3 QMS Media Limited (ASX:QMS) 3
=3 SmartGroup Corporation Ltd (ASX:SIQ) 3
=3 Swift Networks Group Limited (ASX:SW1) 3
=3 Threat Protect Australia Limited (ASX:TPS) 3
=3 Veris Limited (ASX:VRS) 3
Sources: S&P Capital IQ, Mergermarket, Grant Thornton
Top IM acquires – 18 months to 30 June 2017
Rank IM acquirer No. of deals
1 Quadrant Private Equity Pty Limited 10
2 Allegro Funds Pty Ltd 6
3 Blue Sky Private Equity Ltd 4
=4 Bain Capital Private Equity, LP 2
=4 Bridgeport Capital, Boab Capital Group 2
=4 CHAMP Private Equity Pty Ltd 2
=4 Industry Funds Management Pty Ltd 2
=4 Infrastructure Capital Group Ltd 2
=4 SK Capital Partners 2
=4 The Growth Fund 2
Dealtracker 2017 15
Dealmakers by typeOf the corporate buyers Ruralco Holdings was the most active, acquiring across the utilities space through Hunter, Riverland and Mildura Irrigation. Ruralco Holdings also acquired Newham Rural Supplies – within consumer discretionary – and Great Northern Rural Services and Ausure Consolidated Brokers, operating within the consumer staples and financial sectors respectively.
Equal first in terms of M&A activity was Total Face Group, acquiring five businesses within the healthcare sector and one within consumer discretionary.
One of the top acquirers was big four professional services firm KPMG, which has continued the trend observed in the previous Dealtracker by undertaking a number of acquisitions in order to add depth to – and broaden – their base of service offerings. Notable deals include KPMG’s acquisition of TRACE Chartered Accountants – a Penrith based accounting practice – and Acuity Research and Insights, which provides market research services.
The largest IM dealmaker by deal volume was Quadrant which completed 10 deals, followed by Allegro Funds and Blue Sky Private Equity, completing six and four deals respectively. Quadrant has continued to build its footprint in the fitness and wellbeing space with the acquisitions of Fitness First Australia, Jetts Fitness and Ardent Leisure Group’s Health Clubs Division. Quadrant also added further acquisitions in the healthcare sector with Injury Treatment, Qscan Services and St Ives Home Care.
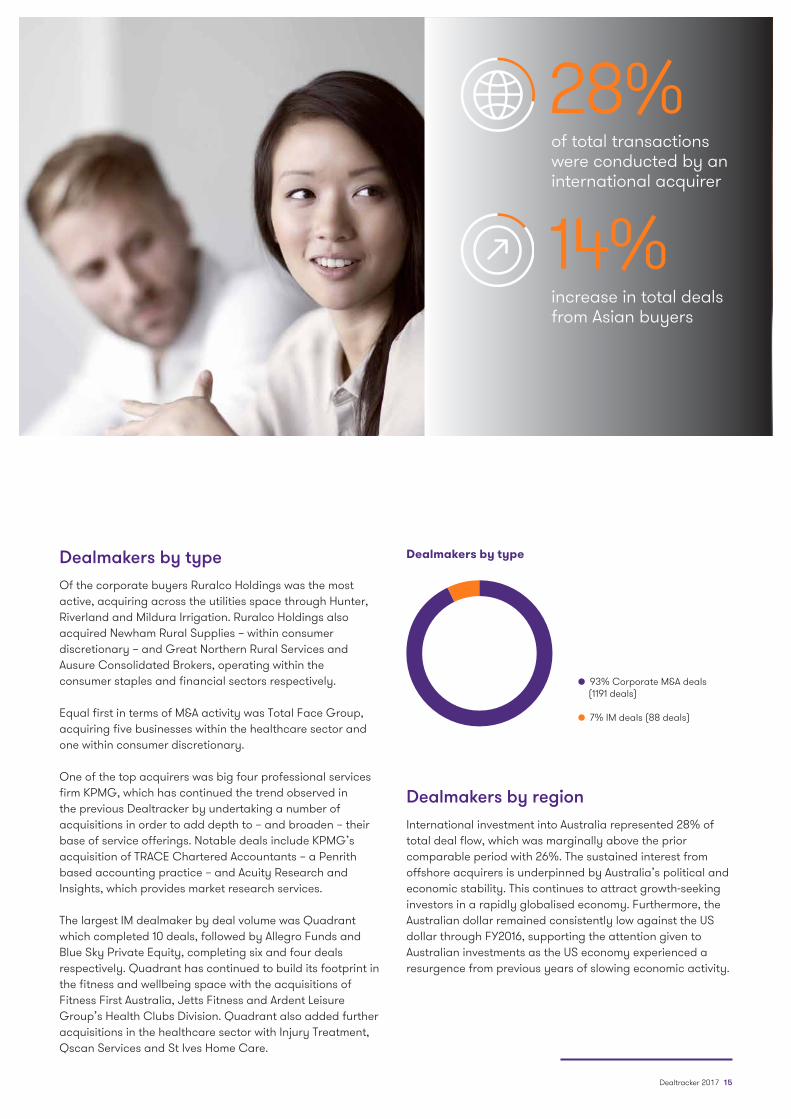
Dealmakers by regionInternational investment into Australia represented 28% of total deal flow, which was marginally above the prior comparable period with 26%. The sustained interest from offshore acquirers is underpinned by Australia’s political and economic stability. This continues to attract growth-seeking investors in a rapidly globalised economy. Furthermore, the Australian dollar remained consistently low against the US dollar through FY2016, supporting the attention given to Australian investments as the US economy experienced a resurgence from previous years of slowing economic activity.
93% Corporate M&A deals (1191 deals)
7% IM deals (88 deals)
Dealmakers by type
28%
14%
of total transactions were conducted by an international acquirer
increase in total deals from Asian buyers
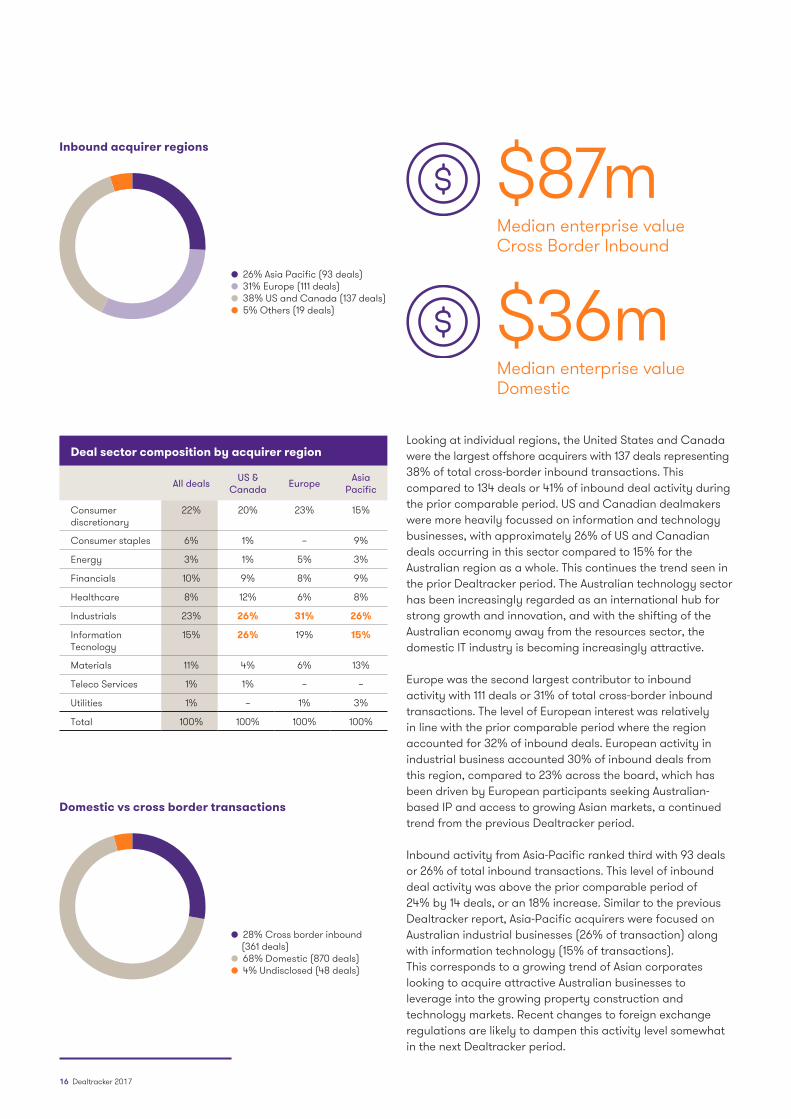
Looking at individual regions, the United States and Canada were the largest offshore acquirers with 137 deals representing 38% of total cross-border inbound transactions. This compared to 134 deals or 41% of inbound deal activity during the prior comparable period. US and Canadian dealmakers were more heavily focussed on information and technology businesses, with approximately 26% of US and Canadian deals occurring in this sector compared to 15% for the Australian region as a whole. This continues the trend seen in the prior Dealtracker period. The Australian technology sector has been increasingly regarded as an international hub for strong growth and innovation, and with the shifting of the Australian economy away from the resources sector, the domestic IT industry is becoming increasingly attractive.
Europe was the second largest contributor to inbound activity with 111 deals or 31% of total cross-border inbound transactions. The level of European interest was relatively in line with the prior comparable period where the region accounted for 32% of inbound deals. European activity in industrial business accounted 30% of inbound deals from this region, compared to 23% across the board, which has been driven by European participants seeking Australian- based IP and access to growing Asian markets, a continued trend from the previous Dealtracker period.
Inbound activity from Asia-Pacific ranked third with 93 deals or 26% of total inbound transactions. This level of inbound deal activity was above the prior comparable period of 24% by 14 deals, or an 18% increase. Similar to the previous Dealtracker report, Asia-Pacific acquirers were focused on Australian industrial businesses (26% of transaction) along with information technology (15% of transactions). This corresponds to a growing trend of Asian corporates looking to acquire attractive Australian businesses to leverage into the growing property construction and technology markets. Recent changes to foreign exchange regulations are likely to dampen this activity level somewhat in the next Dealtracker period.
28% Cross border inbound (361 deals)
68% Domestic (870 deals) 4% Undisclosed (48 deals)
Domestic vs cross border transactions
Deal sector composition by acquirer region
All deals US & Canada Europe Asia
Pacific
Consumer discretionary
22% 20% 23% 15%
Consumer staples 6% 1% – 9%
Energy 3% 1% 5% 3%
Financials 10% 9% 8% 9%
Healthcare 8% 12% 6% 8%
Industrials 23% 26% 31% 26%
Information Tecnology
15% 26% 19% 15%
Materials 11% 4% 6% 13%
Teleco Services 1% 1% – –
Utilities 1% – 1% 3%
Total 100% 100% 100% 100%
$87mMedian enterprise value Cross Border Inbound
$36mMedian enterprise value Domestic
26% Asia Pacific (93 deals) 31% Europe (111 deals) 38% US and Canada (137 deals) 5% Others (19 deals)
Inbound acquirer regions
16 Dealtracker 2017
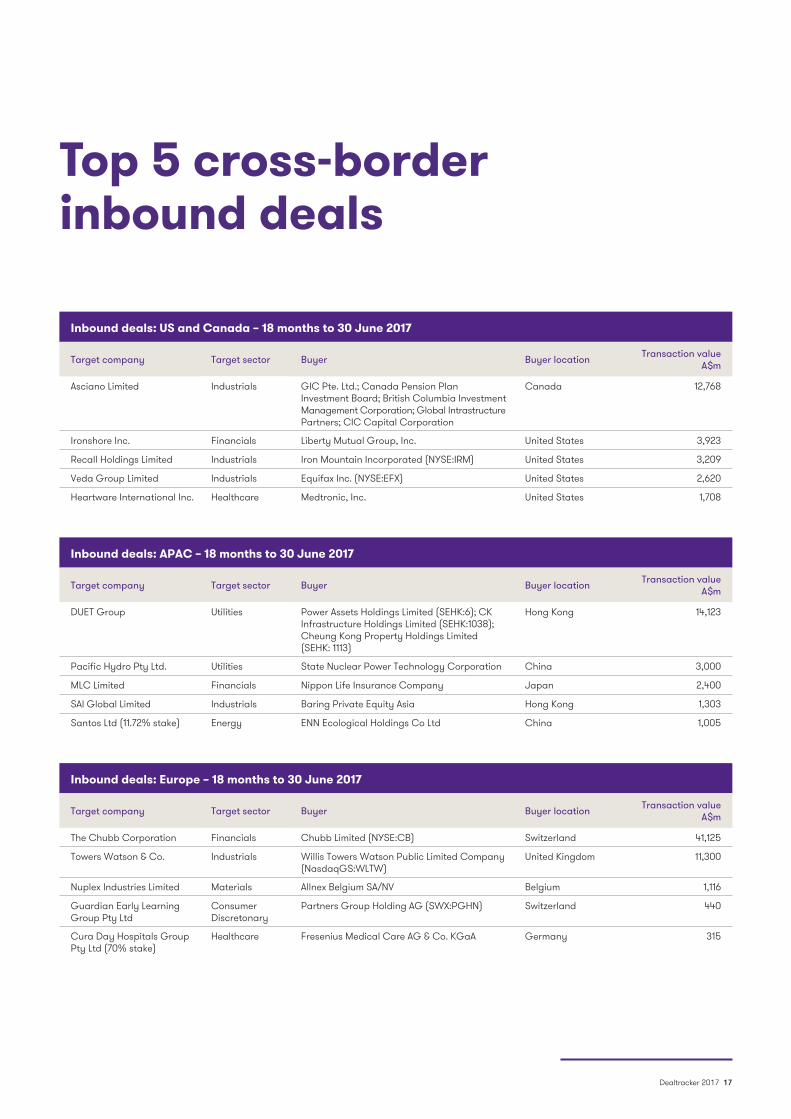
Inbound deals: US and Canada – 18 months to 30 June 2017
Target company Target sector Buyer Buyer location Transaction value A$m
Asciano Limited Industrials GIC Pte. Ltd.; Canada Pension Plan Investment Board; British Columbia Investment Management Corporation; Global Intrastructure Partners; CIC Capital Corporation
Canada 12,768
Ironshore Inc. Financials Liberty Mutual Group, Inc. United States 3,923
Recall Holdings Limited Industrials Iron Mountain Incorporated (NYSE:IRM) United States 3,209
Veda Group Limited Industrials Equifax Inc. (NYSE:EFX) United States 2,620
Heartware International Inc. Healthcare Medtronic, Inc. United States 1,708
Inbound deals: APAC – 18 months to 30 June 2017
Target company Target sector Buyer Buyer location Transaction value A$m
DUET Group Utilities Power Assets Holdings Limited (SEHK:6); CK Infrastructure Holdings Limited (SEHK:1038); Cheung Kong Property Holdings Limited (SEHK: 1113)
Hong Kong 14,123
Pacific Hydro Pty Ltd. Utilities State Nuclear Power Technology Corporation China 3,000
MLC Limited Financials Nippon Life Insurance Company Japan 2,400
SAI Global Limited Industrials Baring Private Equity Asia Hong Kong 1,303
Santos Ltd (11.72% stake) Energy ENN Ecological Holdings Co Ltd China 1,005
Inbound deals: Europe – 18 months to 30 June 2017
Target company Target sector Buyer Buyer location Transaction value A$m
The Chubb Corporation Financials Chubb Limited (NYSE:CB) Switzerland 41,125
Towers Watson & Co. Industrials Willis Towers Watson Public Limited Company (NasdaqGS:WLTW)
United Kingdom 11,300
Nuplex Industries Limited Materials Allnex Belgium SA/NV Belgium 1,116
Guardian Early Learning Group Pty Ltd
Consumer Discretonary
Partners Group Holding AG (SWX:PGHN) Switzerland 440
Cura Day Hospitals Group Pty Ltd (70% stake)
Healthcare Fresenius Medical Care AG & Co. KGaA Germany 315
Top 5 cross-border inbound deals
Dealtracker 2017 17
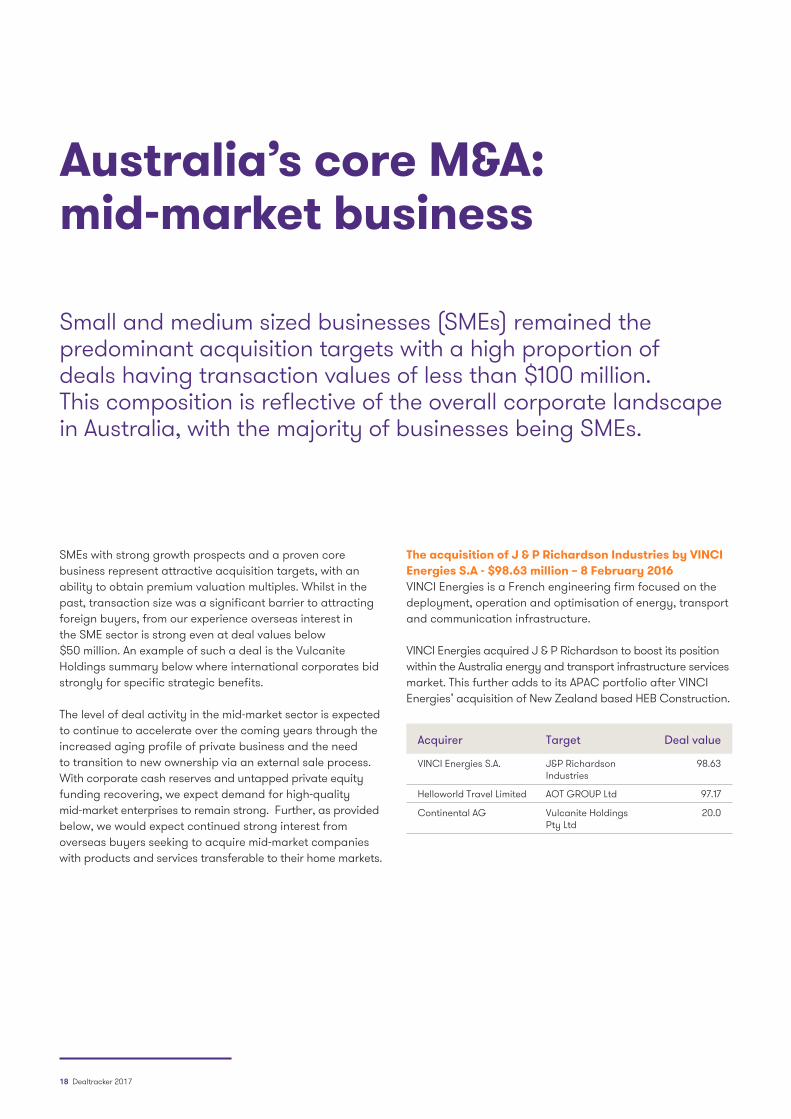
SMEs with strong growth prospects and a proven core business represent attractive acquisition targets, with an ability to obtain premium valuation multiples. Whilst in the past, transaction size was a significant barrier to attracting foreign buyers, from our experience overseas interest in the SME sector is strong even at deal values below $50 million. An example of such a deal is the Vulcanite Holdings summary below where international corporates bid strongly for specific strategic benefits.
The level of deal activity in the mid-market sector is expected to continue to accelerate over the coming years through the increased aging profile of private business and the need to transition to new ownership via an external sale process. With corporate cash reserves and untapped private equity funding recovering, we expect demand for high-quality mid-market enterprises to remain strong. Further, as provided below, we would expect continued strong interest from overseas buyers seeking to acquire mid-market companies with products and services transferable to their home markets.
The acquisition of J & P Richardson Industries by VINCI Energies S.A - $98.63 million – 8 February 2016 VINCI Energies is a French engineering firm focused on the deployment, operation and optimisation of energy, transport and communication infrastructure.
VINCI Energies acquired J & P Richardson to boost its position within the Australia energy and transport infrastructure services market. This further adds to its APAC portfolio after VINCI Energies’ acquisition of New Zealand based HEB Construction.
Acquirer Target Deal value
VINCI Energies S.A. J&P Richardson Industries
98.63
Helloworld Travel Limited AOT GROUP Ltd 97.17
Continental AG Vulcanite Holdings Pty Ltd
20.0
Small and medium sized businesses (SMEs) remained the predominant acquisition targets with a high proportion of deals having transaction values of less than $100 million. This composition is reflective of the overall corporate landscape in Australia, with the majority of businesses being SMEs.
Australia’s core M&A: mid-market business
18 Dealtracker 2017
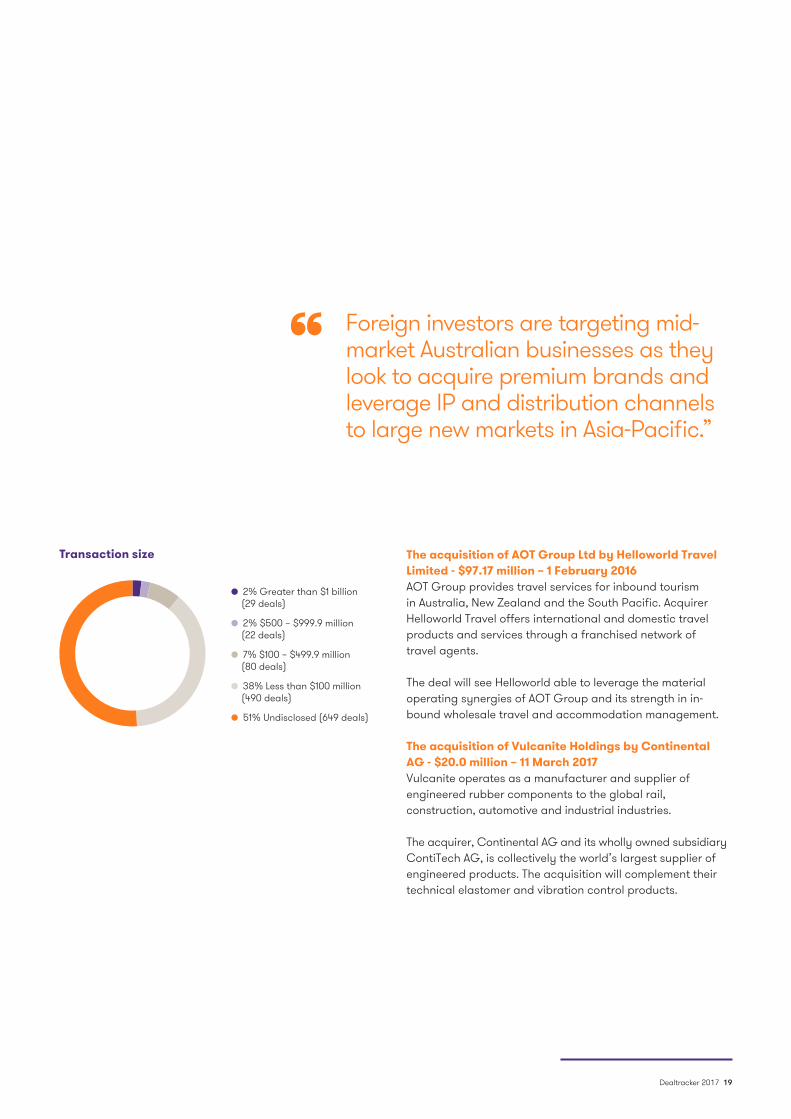
The acquisition of AOT Group Ltd by Helloworld Travel Limited - $97.17 million – 1 February 2016AOT Group provides travel services for inbound tourism in Australia, New Zealand and the South Pacific. Acquirer Helloworld Travel offers international and domestic travel products and services through a franchised network of travel agents.
The deal will see Helloworld able to leverage the material operating synergies of AOT Group and its strength in in-bound wholesale travel and accommodation management.
The acquisition of Vulcanite Holdings by Continental AG - $20.0 million – 11 March 2017Vulcanite operates as a manufacturer and supplier of engineered rubber components to the global rail, construction, automotive and industrial industries.
The acquirer, Continental AG and its wholly owned subsidiary ContiTech AG, is collectively the world’s largest supplier of engineered products. The acquisition will complement their technical elastomer and vibration control products.
Foreign investors are targeting mid-market Australian businesses as they look to acquire premium brands and leverage IP and distribution channels to large new markets in Asia-Pacific.”
“
Transaction size
2% Greater than $1 billion (29 deals)
2% $500 – $999.9 million (22 deals)
7% $100 – $499.9 million (80 deals)
38% Less than $100 million (490 deals)
51% Undisclosed (649 deals)
Dealtracker 2017 19
The chart below shows the number of IM deals recorded per each period specified, including both those with and without valuation details. The number of IM deals in the current period increased to 88 deals, from 80 in the prior Dealtracker period. This increased level of activity has followed significant exit volume during the period CY2013 to CY2015 and recent successful fund raising by a consolidated group of active fund managers, particularly in mid market private equity. In addition, there has been significant growth in deal by deal operators and family office investors which has filled the supply gap that arose from the closure of a number of closed end funds.
The period covered by this report has seen an increase in IM deals to 88 transactions with particularly strong activity in CY2016.
Investment managers
Successful fund raising, particularly in mid market private equity and significant growth in deal by deal operators and family office investors has driven deal activity by investment managers.”
“
20 Dealtracker 2017
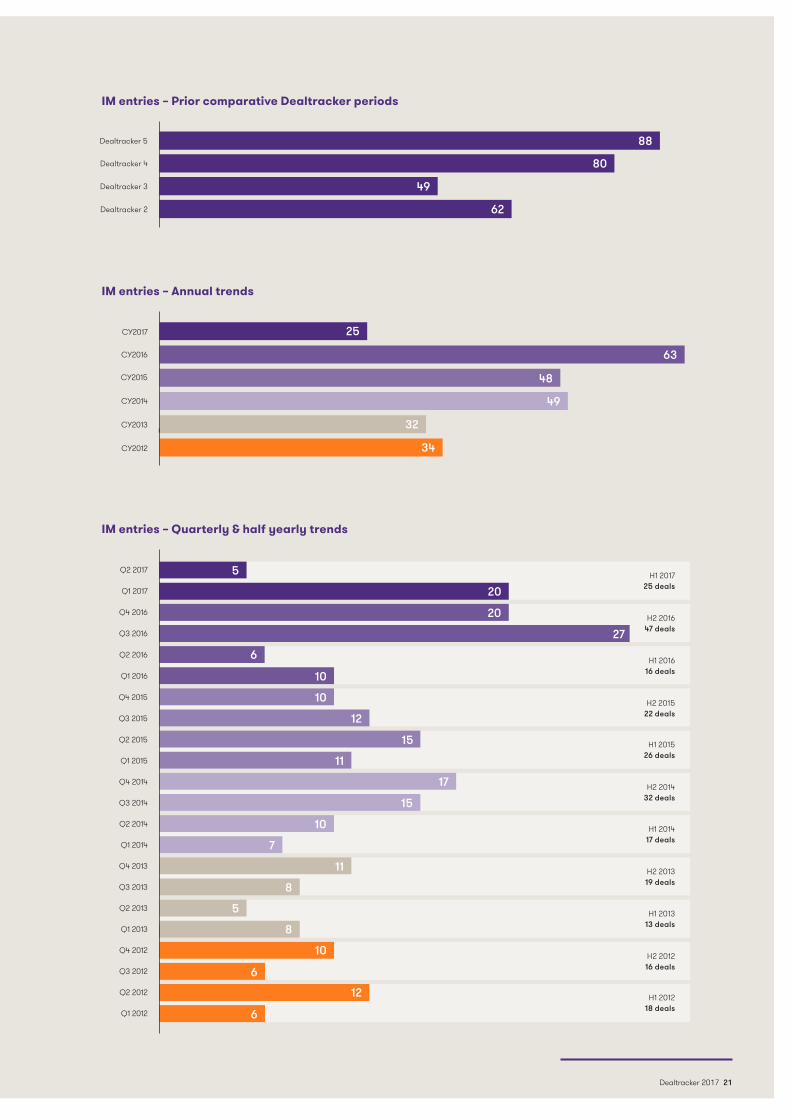
H1 2017 25 deals
H1 2016 16 deals
H1 2015 26 deals
H1 2014 17 deals
H1 2013 13 deals
H2 2016 47 deals
H2 2015 22 deals
H2 2014 32 deals
H2 2013 19 deals
H2 2012 16 deals
H1 2012 18 deals
IM entries – Prior comparative Dealtracker periods
Dealtracker 5
Dealtracker 4
Dealtracker 3
Dealtracker 2
88
80
49
62
IM entries – Annual trends
CY2017
CY2016
CY2015
CY2014
CY2013
CY2012
25
63
48
49
32
34
IM entries – Quarterly & half yearly trends
Q2 2017
Q2 2015
Q2 2013
Q1 2017
Q1 2015
Q1 2013
Q4 2016
Q4 2014
Q4 2012
Q3 2016
Q3 2014
Q3 2012
Q2 2016
Q2 2014
Q2 2012
Q1 2016
Q1 2014
Q1 2012
Q4 2015
Q4 2013
Q3 2015
Q3 2013
5
20
20
27
6
10
10
12
15
11
17
15
10
7
11
8
5
8
10
6
12
6
Dealtracker 2017 21
EBITDA is typically used as a measure of earnings for valuation purposes as it reflects the financial performance of the business prior to taking into account how it is funded. A multiple of EBITDA provides an enterprise value (EV) of the business (i.e. the value of the business before deducting net debt).
The multiples included in the table opposite are based upon the most recent financial statements prior to the transaction and accordingly, doesn’t necessarily factor in forecast profit performance that is built into deal valuations.
As has been the result over prior Dealtracker periods, larger businesses attracted greater valuation multiples than smaller businesses. This is because larger businesses typically have greater stability and consistency in their earnings base as compared to smaller businesses.
When assessing comparable deal multiples (particularly at the lower end of the market) attention needs to be focused on the individual target growth prospects, inherent risks and strategic premium available to the buyer pools. From our experience and historical data, it remains our general view that SMEs’ historical EV/EBITDA multiples average in the range of 5.0x to 6.0x with one turn of multiple increase applicable to each of our size brackets.
The median trailing EBITDA multiples observed on businesses with less than $20 million in revenues was 7.2x, significantly above the respective long-term average of 6.1x for businesses of this size. In part, this is attributable to a number of deals attracting a large strategic premium above market. For example, the acquisition of Mareterram Limited – an agribusiness focusing on the processing and supply of seafood – attracted a valuation of 21.0x EBITDA. The high multiples can also be attributable to a number of deals occurring in sectors characterised by high multiples such as financial services and the fact that capital available is being concentrated on high quality businesses which is driving competition and therefore valuations. It also demonstrates the ability of mid-sized businesses to drive strong valuation outcomes through evidencing strong forecast growth prospects. Deals involving targets of over $200m revenue were similarly above long-term averages. Targets with revenue between $200m an $500m, and those above $500m, obtained median EBITDA multiples of 10.2x and 11.9x respectively. Within the $500m+ revenue range, the high valuations were likely attributable to the significant proportion of mega- transactions, with 12 of the 19 targets (with available deal multiples) having revenues greater than $1 billion.
Inline with previous Dealtracker reports, our analysis shows that size is a significant determinate of value, with larger businesses generally transacting at higher multiples than smaller businesses.
Valuation multiples by target size
22 Dealtracker 2017
Revenue range No. of deals
Current dealtracker
median EV/EBITDA
multiples
Prior 2016 dealtracker
median EV/EBITDA
multiples
Prior 2014 dealtracker
median EV/EBITDA
multiples
Average
Less than $20 million 28 7.2X 5.5X 5.5X 6.1X
Between $20 million to $50 million 14 5.9X 8.8X 6.7X 7.1X
Between $50 million to $100 million 17 8.9X 6.1X 8.0X 7.7X
Between $100 million to $200 million 12 7.6X 10.8X 7.8X 8.7X
Between $200 million to $500 million 14 10.2X 8.5X 8.8X 9.1X
Over $500 million 19 11.9X 10.9X 7.1X 10.0X
Median (overall) 9.0X 7.8X 7.3X 8.0X
Total 104 Sources: S&P Capital IQ, Mergermarket, Grant Thornton
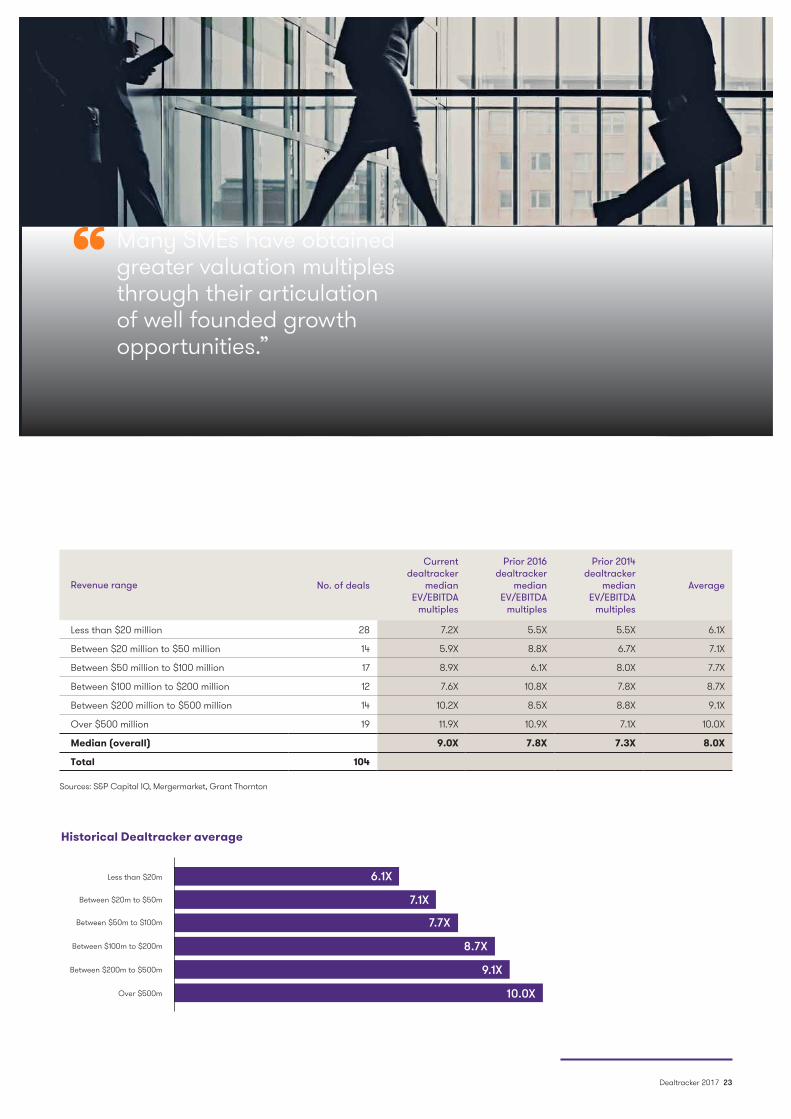
Many SMEs have obtained greater valuation multiples through their articulation of well founded growth opportunities.”
“
Historical Dealtracker average
Less than $20m
Between $20m to $50m
Between $50m to $100m
Between $100m to $200m
Between $200m to $500m
Over $500m
6.1X
7.1X
7.7X
8.7X
9.1X
10.0X
Dealtracker 2017 23
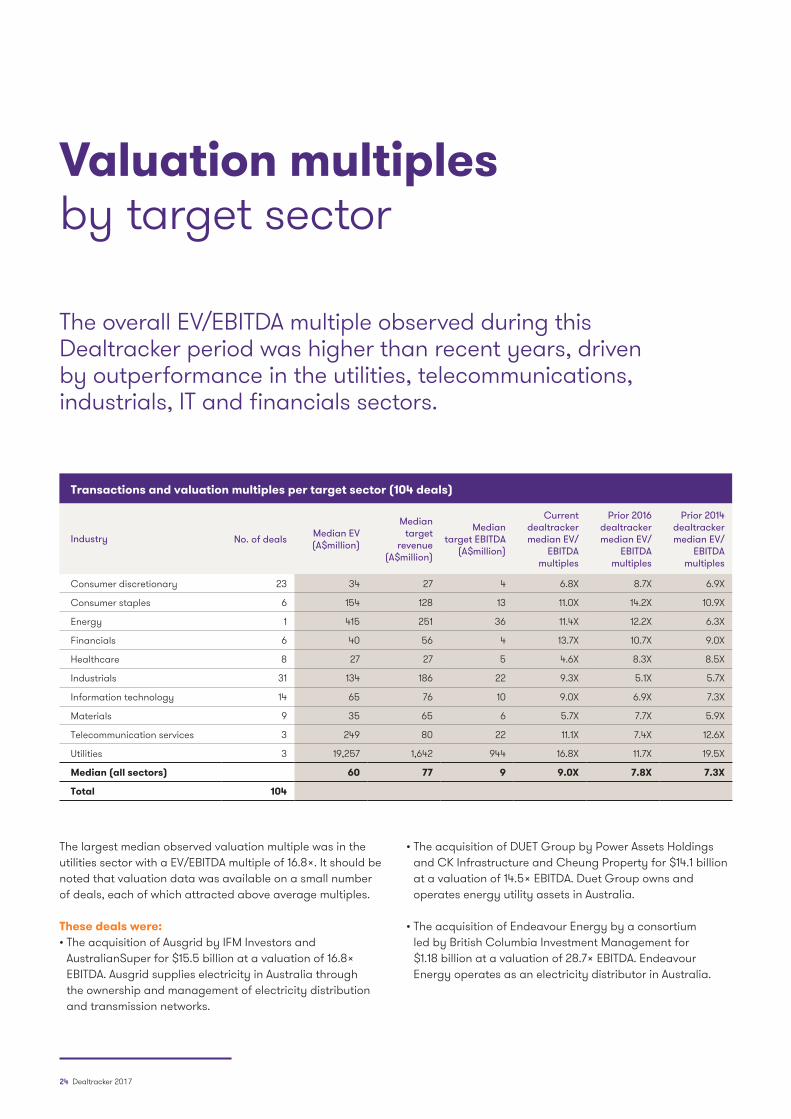
The largest median observed valuation multiple was in the utilities sector with a EV/EBITDA multiple of 16.8x. It should be noted that valuation data was available on a small number of deals, each of which attracted above average multiples.
These deals were:• The acquisition of Ausgrid by IFM Investors and
AustralianSuper for $15.5 billion at a valuation of 16.8x EBITDA. Ausgrid supplies electricity in Australia through the ownership and management of electricity distribution and transmission networks.
• The acquisition of DUET Group by Power Assets Holdings and CK Infrastructure and Cheung Property for $14.1 billion at a valuation of 14.5x EBITDA. Duet Group owns and operates energy utility assets in Australia.
• The acquisition of Endeavour Energy by a consortium led by British Columbia Investment Management for $1.18 billion at a valuation of 28.7x EBITDA. Endeavour Energy operates as an electricity distributor in Australia.
The overall EV/EBITDA multiple observed during this Dealtracker period was higher than recent years, driven by outperformance in the utilities, telecommunications, industrials, IT and financials sectors.
Valuation multiples by target sector
Transactions and valuation multiples per target sector (104 deals)
Industry No. of deals Median EV (A$million)
Median target
revenue (A$million)
Median target EBITDA
(A$million)
Current dealtracker median EV/
EBITDA multiples
Prior 2016 dealtracker median EV/
EBITDA multiples
Prior 2014 dealtracker median EV/
EBITDA multiples
Consumer discretionary 23 34 27 4 6.8X 8.7X 6.9X
Consumer staples 6 154 128 13 11.0X 14.2X 10.9X
Energy 1 415 251 36 11.4X 12.2X 6.3X
Financials 6 40 56 4 13.7X 10.7X 9.0X
Healthcare 8 27 27 5 4.6X 8.3X 8.5X
Industrials 31 134 186 22 9.3X 5.1X 5.7X
Information technology 14 65 76 10 9.0X 6.9X 7.3X
Materials 9 35 65 6 5.7X 7.7X 5.9X
Telecommunication services 3 249 80 22 11.1X 7.4X 12.6X
Utilities 3 19,257 1,642 944 16.8X 11.7X 19.5X
Median (all sectors) 60 77 9 9.0X 7.8X 7.3X
Total 104
24 Dealtracker 2017
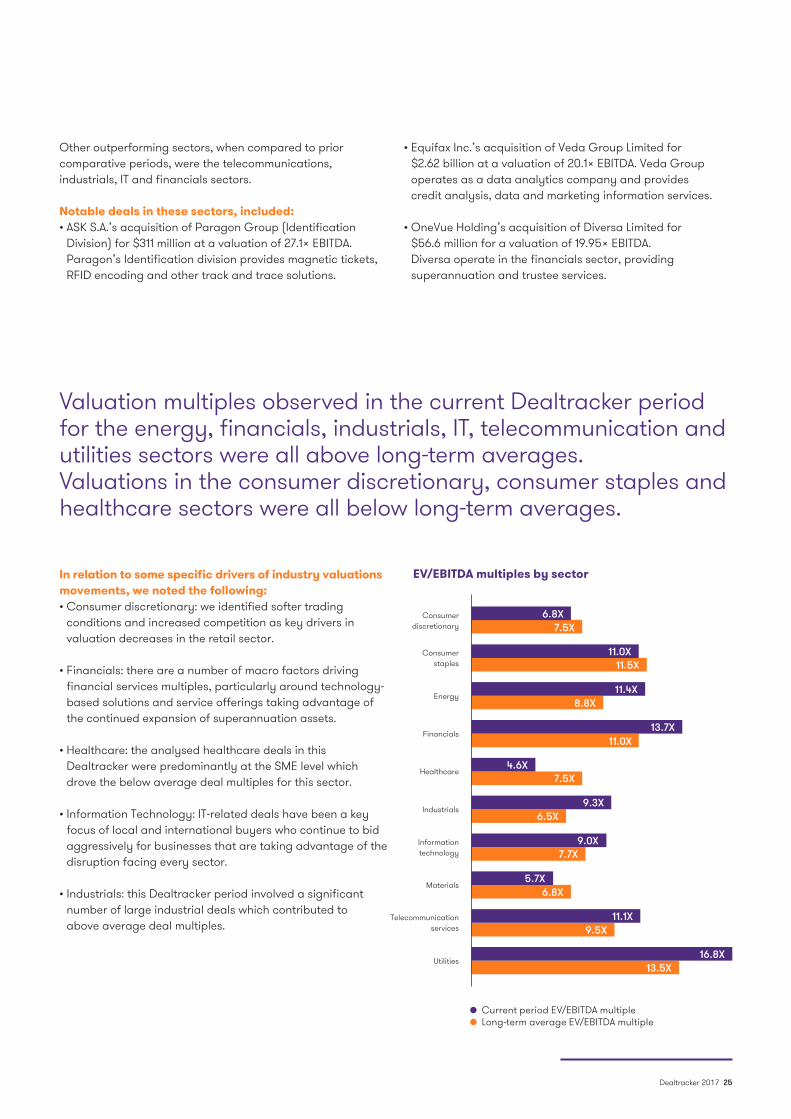
Valuation multiples observed in the current Dealtracker period for the energy, financials, industrials, IT, telecommunication and utilities sectors were all above long-term averages. Valuations in the consumer discretionary, consumer staples and healthcare sectors were all below long-term averages.
EV/EBITDA multiples by sector
Consumer discretionary
Consumer staples
Energy
Financials
Healthcare
Industrials
Information technology
Materials
Telecommunication services
Utilities
6.8X
11.0X
11.4X
13.7X
4.6X7.5X
9.3X6.5X
9.0X7.7X
5.7X6.8X
11.1X9.5X
16.8X13.5X
11.0X
8.8X
11.5X
7.5X
Current period EV/EBITDA multiple Long-term average EV/EBITDA multiple
Dealtracker 2017 25
In relation to some specific drivers of industry valuations movements, we noted the following:• Consumer discretionary: we identified softer trading
conditions and increased competition as key drivers in valuation decreases in the retail sector.
• Financials: there are a number of macro factors driving financial services multiples, particularly around technology- based solutions and service offerings taking advantage of the continued expansion of superannuation assets.
• Healthcare: the analysed healthcare deals in this Dealtracker were predominantly at the SME level which drove the below average deal multiples for this sector.
• Information Technology: IT-related deals have been a key focus of local and international buyers who continue to bid aggressively for businesses that are taking advantage of the disruption facing every sector.
• Industrials: this Dealtracker period involved a significant number of large industrial deals which contributed to above average deal multiples.
Other outperforming sectors, when compared to prior comparative periods, were the telecommunications, industrials, IT and financials sectors.
Notable deals in these sectors, included: • ASK S.A.’s acquisition of Paragon Group (Identification
Division) for $311 million at a valuation of 27.1x EBITDA. Paragon’s Identification division provides magnetic tickets, RFID encoding and other track and trace solutions.
• Equifax Inc.’s acquisition of Veda Group Limited for $2.62 billion at a valuation of 20.1x EBITDA. Veda Group operates as a data analytics company and provides credit analysis, data and marketing information services.
• OneVue Holding’s acquisition of Diversa Limited for $56.6 million for a valuation of 19.95x EBITDA. Diversa operate in the financials sector, providing superannuation and trustee services.
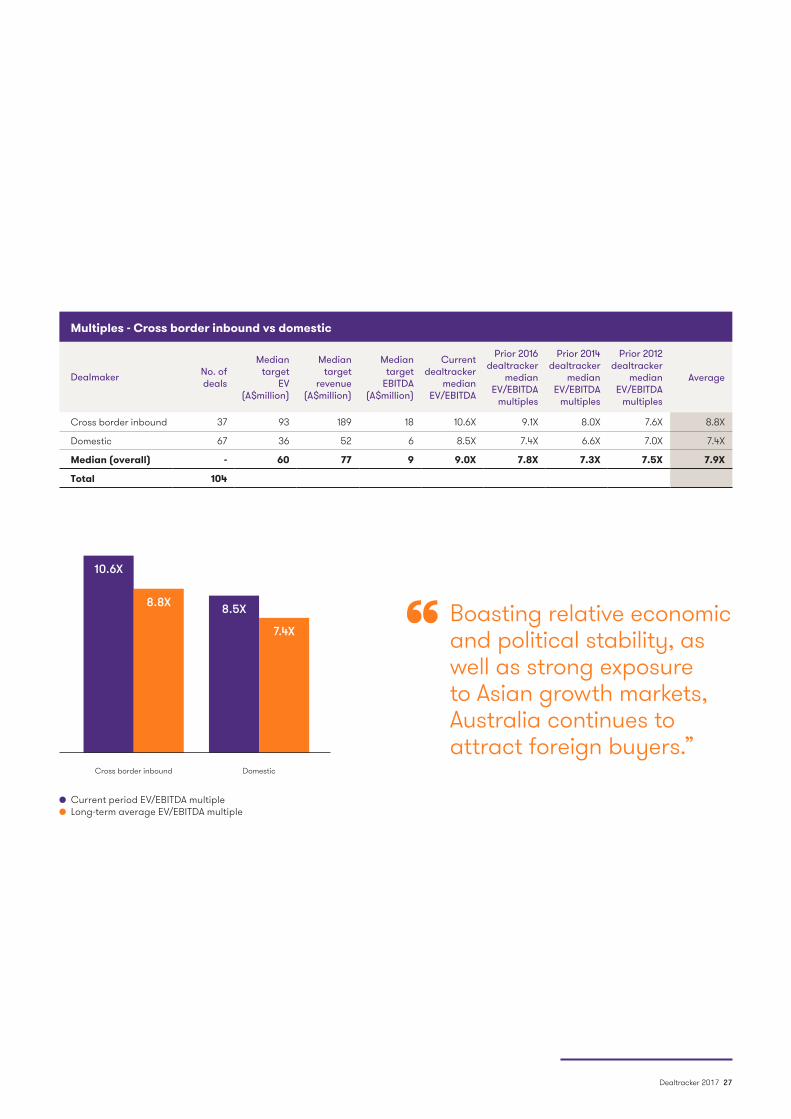
Of the total 104 deals with valuation data, 67 involved domestic acquirers while 37 targets were acquired by buyers outside of Australia. Of these foreign acquirers the composition between the USA, Europe and Asia was 32%, 37% and 26% respectively, with the remaining 5% from Africa and the Middle East.
Foreign buyers were interested in larger targets and willing to pay more than their domestic counterparts. This was shown through a median target enterprise value of A$93m (A$57m above that of the domestic acquirers) and an EBITDA multiple of 10.6x (2.1x above the corresponding domestic EBITDA multiple). The relatively low Australian dollar during this period – in particular during CY2016 – contributed to this as competition from international buyers intensified. It is noted however, that the median transaction size for inbound buyers has been decreasing since 1 January 2010 when this report began when the median target EV of international buyers was $171 million.
As noted previously the level of interest from overseas acquirers continues to rise. Total inbound deal volume grew from 26% to 28% of total deals. This is due to improvements in technology making it easier for businesses to target and operate businesses on a global basis. Furthermore, Australia’s continued outperformance in economic terms and relative political stability, continues to contribute to Australia being seen as an attractive place to invest. As a global network of firms, Grant Thornton corporate finance teams are increasingly collaborating on cross-border opportunities as buyer pools become truly global even for SMEs.
As seen in prior Dealtracker publications, international acquirers continued to buy larger businesses and pay higher valuation multiples than that achieved fromdomestic acquirers. This was reflected across all industries where there were international acquirers.
Domestic vs international valuation multiples
26 Dealtracker 2017
Multiples - Cross border inbound vs domestic
Dealmaker No. of deals
Median target
EV (A$million)
Median target
revenue (A$million)
Median target
EBITDA (A$million)
Current dealtracker
median EV/EBITDA
Prior 2016 dealtracker
median EV/EBITDA
multiples
Prior 2014 dealtracker
median EV/EBITDA
multiples
Prior 2012 dealtracker
median EV/EBITDA
multiples
Average
Cross border inbound 37 93 189 18 10.6X 9.1X 8.0X 7.6X 8.8X
Domestic 67 36 52 6 8.5X 7.4X 6.6X 7.0X 7.4X
Median (overall) - 60 77 9 9.0X 7.8X 7.3X 7.5X 7.9X
Total 104
Boasting relative economic and political stability, as well as strong exposure to Asian growth markets, Australia continues to attract foreign buyers.”
“
Current period EV/EBITDA multiple Long-term average EV/EBITDA multiple
Cross border inbound Domestic
10.6X
8.8X 8.5X
7.4X
Dealtracker 2017 27
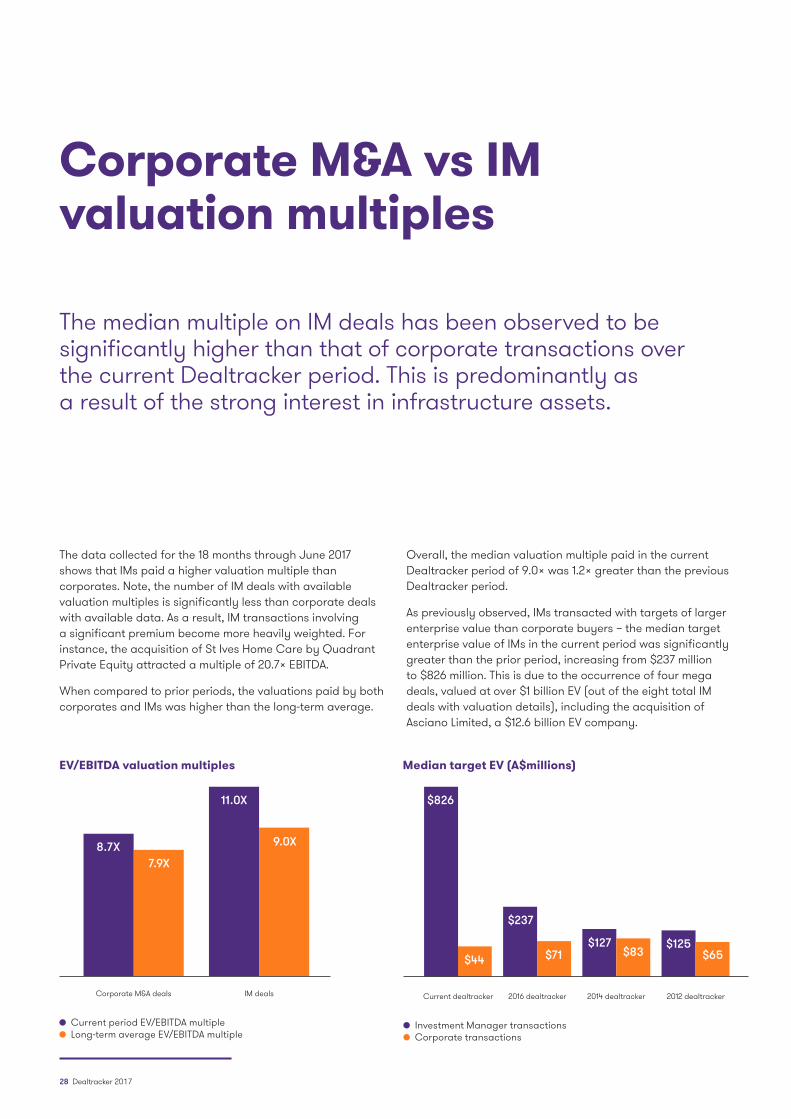
The median multiple on IM deals has been observed to be significantly higher than that of corporate transactions over the current Dealtracker period. This is predominantly as a result of the strong interest in infrastructure assets.
Corporate M&A vs IM valuation multiples
The data collected for the 18 months through June 2017 shows that IMs paid a higher valuation multiple than corporates. Note, the number of IM deals with available valuation multiples is significantly less than corporate deals with available data. As a result, IM transactions involving a significant premium become more heavily weighted. For instance, the acquisition of St Ives Home Care by Quadrant Private Equity attracted a multiple of 20.7x EBITDA.
When compared to prior periods, the valuations paid by both corporates and IMs was higher than the long-term average.
Overall, the median valuation multiple paid in the current Dealtracker period of 9.0x was 1.2x greater than the previous Dealtracker period.
As previously observed, IMs transacted with targets of larger enterprise value than corporate buyers – the median target enterprise value of IMs in the current period was significantly greater than the prior period, increasing from $237 million to $826 million. This is due to the occurrence of four mega deals, valued at over $1 billion EV (out of the eight total IM deals with valuation details), including the acquisition of Asciano Limited, a $12.6 billion EV company.
Current period EV/EBITDA multiple Long-term average EV/EBITDA multiple
Corporate M&A deals IM deals
8.7X7.9X
11.0X
9.0X
EV/EBITDA valuation multiples
Investment Manager transactions Corporate transactions
Current dealtracker 2016 dealtracker 2014 dealtracker 2012 dealtracker
Median target EV (A$millions)
$826
$44
$237
$127$83
$125$65$71
28 Dealtracker 2017
Dealmaker No. of deals
Median target
EV (A$million)
Median target
revenue (A$million)
Median target
EBITDA (A$million)
Current dealtracker
median EV/EBITDA
Prior 2016 dealtracker
median EV/EBITDA
multiples
Prior 2014 dealtracker
median EV/EBITDA
multiples
Prior 2012 dealtracker
median EV/EBITDA
multiples
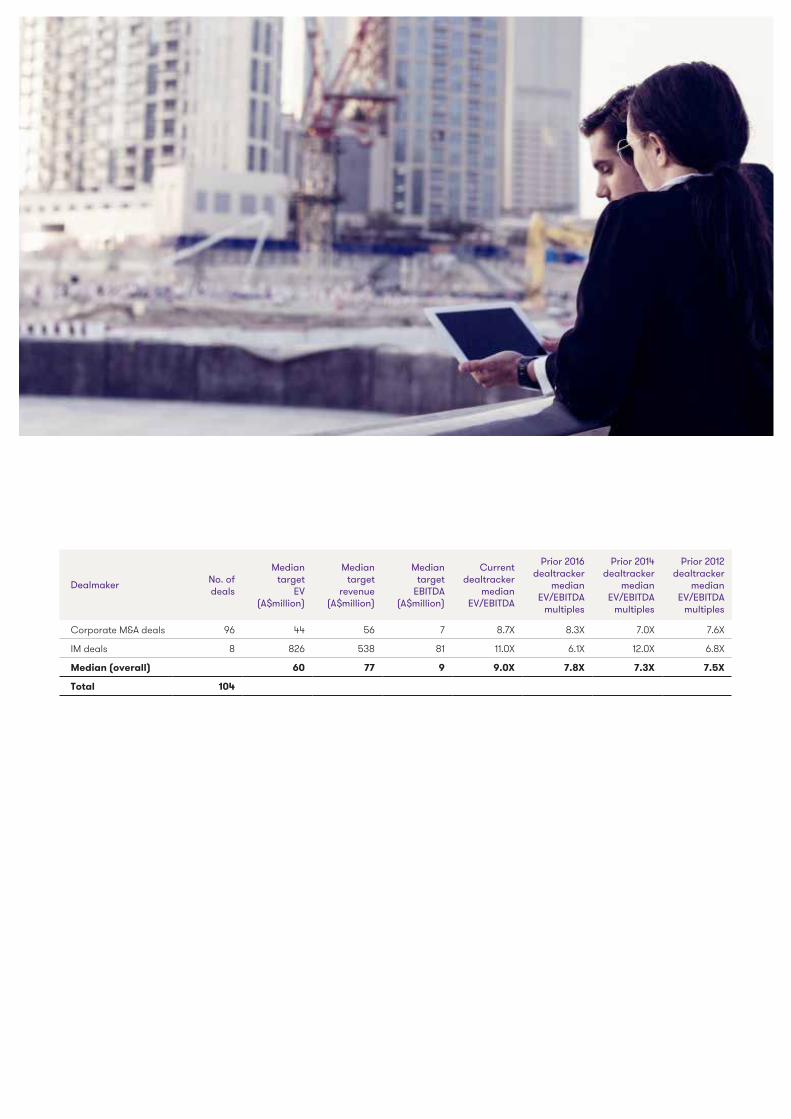
Corporate M&A deals 96 44 56 7 8.7X 8.3X 7.0X 7.6X
IM deals 8 826 538 81 11.0X 6.1X 12.0X 6.8X
Median (overall) 60 77 9 9.0X 7.8X 7.3X 7.5X
Total 104
Dealtracker 2017 29

30 Dealtracker 2017
Many of the sector valuations being achieved in M&A deals are not necessarily being reflected in public market trading. This evidences the flight to quality and its effect on deal multiples for leading sector participants.”
“
Sectors with the highest valuation multiplesInformation TechnologyThe information technology sector has experienced strong valuation growth up to a peak reached at 31 December 2016 of 14.3x EBITDA. However, the industry multiple fell slightly to 12.8x EBITDA by 30 June 2017 as many of these businesses continued to mature and growth moderated accordingly.
Financial ServicesThe financials sector has seen a significant increase in valuations, reaching a multiple of 11.4x EBITDA at 30 June 2017, an increase of 1.5 turns from 30 June 2016. The recent increase in valuation reflects the continued expansion of the sector, driven by compulsory superannuation growth.
Sectors with lower multiples
The industries trading at notably lower median multiples were the telecommunications and utilities industries.
TelecommunicationsThe telecommunications sector has experienced a decrease in the last 18 months, falling from 11.7x at 30 June 2016 to 9.1x at 30 June 2017, with both Telstra and the second tier providers experiencing tougher trading conditions.
The utilities sector similarly experienced a decline in its trading multiple from 11.4x at 30 June 2016 to 9.9x at 30 June 2017, affected by continued volatility in macro trading conditions and regulatory uncertainty.
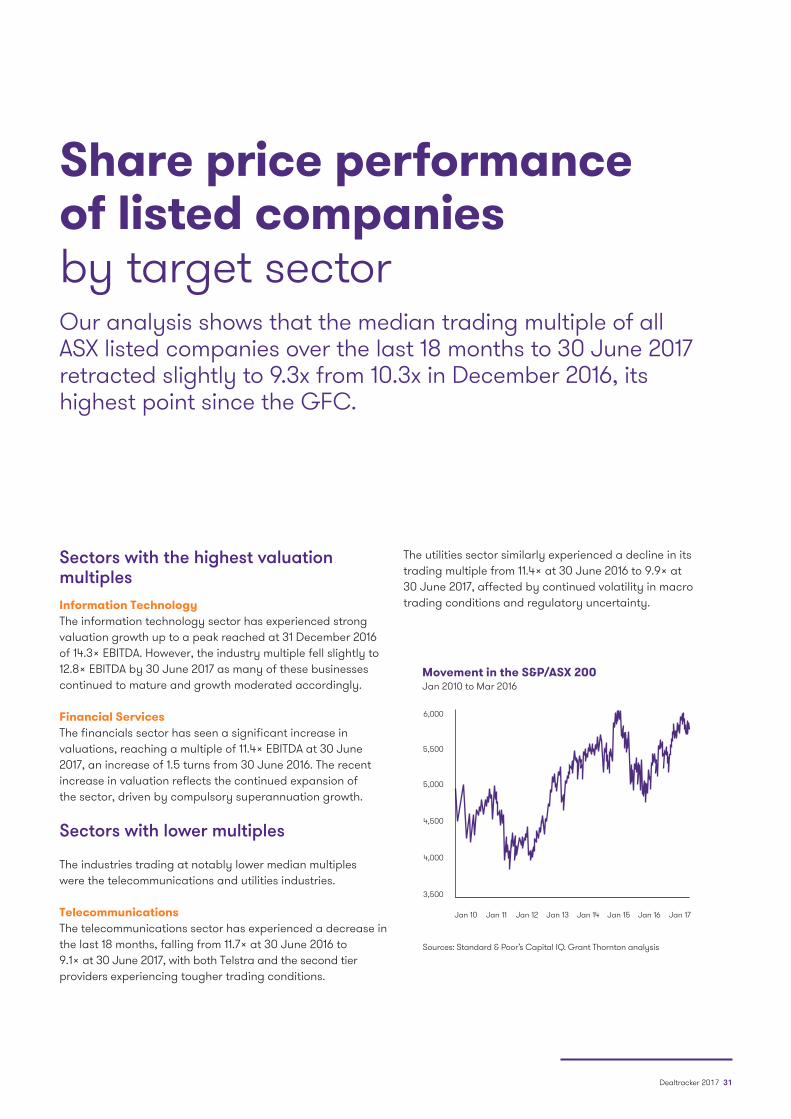
Our analysis shows that the median trading multiple of all ASX listed companies over the last 18 months to 30 June 2017 retracted slightly to 9.3x from 10.3x in December 2016, its highest point since the GFC.
Share price performance of listed companies by target sector
Dealtracker 2017 31
Jan 10 Jan 11 Jan 12 Jan 13 Jan 14 Jan 15 Jan 16 Jan 17
Movement in the S&P/ASX 200Jan 2010 to Mar 2016
6,000
5,500
5,000
4,500
4,000
3,500
Sources: Standard & Poor’s Capital IQ. Grant Thornton analysis
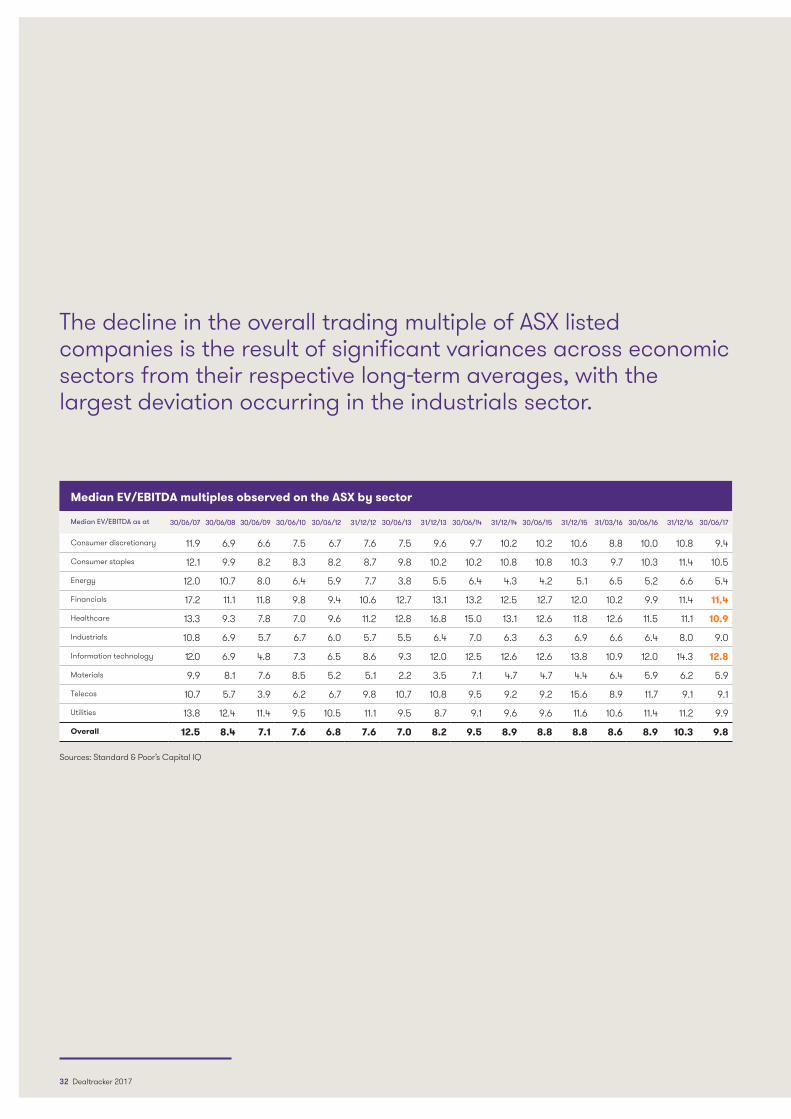
Median EV/EBITDA multiples observed on the ASX by sector
Median EV/EBITDA as at 30/06/07 30/06/08 30/06/09 30/06/10 30/06/12 31/12/12 30/06/13 31/12/13 30/06/14 31/12/14 30/06/15 31/12/15 31/03/16 30/06/16 31/12/16 30/06/17
Consumer discretionary 11.9 6.9 6.6 7.5 6.7 7.6 7.5 9.6 9.7 10.2 10.2 10.6 8.8 10.0 10.8 9.4
Consumer staples 12.1 9.9 8.2 8.3 8.2 8.7 9.8 10.2 10.2 10.8 10.8 10.3 9.7 10.3 11.4 10.5
Energy 12.0 10.7 8.0 6.4 5.9 7.7 3.8 5.5 6.4 4.3 4.2 5.1 6.5 5.2 6.6 5.4
Financials 17.2 11.1 11.8 9.8 9.4 10.6 12.7 13.1 13.2 12.5 12.7 12.0 10.2 9.9 11.4 11.4
Healthcare 13.3 9.3 7.8 7.0 9.6 11.2 12.8 16.8 15.0 13.1 12.6 11.8 12.6 11.5 11.1 10.9
Industrials 10.8 6.9 5.7 6.7 6.0 5.7 5.5 6.4 7.0 6.3 6.3 6.9 6.6 6.4 8.0 9.0
Information technology 12.0 6.9 4.8 7.3 6.5 8.6 9.3 12.0 12.5 12.6 12.6 13.8 10.9 12.0 14.3 12.8
Materials 9.9 8.1 7.6 8.5 5.2 5.1 2.2 3.5 7.1 4.7 4.7 4.4 6.4 5.9 6.2 5.9
Telecos 10.7 5.7 3.9 6.2 6.7 9.8 10.7 10.8 9.5 9.2 9.2 15.6 8.9 11.7 9.1 9.1
Utilities 13.8 12.4 11.4 9.5 10.5 11.1 9.5 8.7 9.1 9.6 9.6 11.6 10.6 11.4 11.2 9.9
Overall 12.5 8.4 7.1 7.6 6.8 7.6 7.0 8.2 9.5 8.9 8.8 8.8 8.6 8.9 10.3 9.8 Sources: Standard & Poor’s Capital IQ
The decline in the overall trading multiple of ASX listed companies is the result of significant variances across economic sectors from their respective long-term averages, with the largest deviation occurring in the industrials sector.
32 Dealtracker 2017
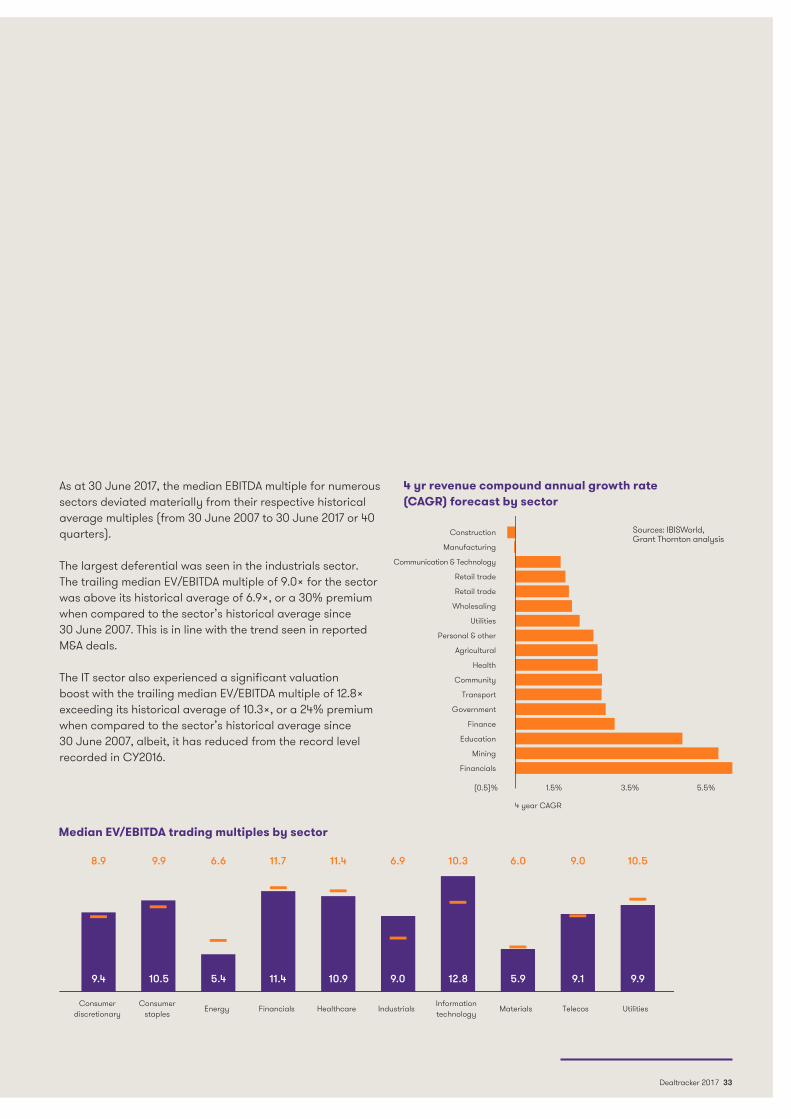
As at 30 June 2017, the median EBITDA multiple for numerous sectors deviated materially from their respective historical average multiples (from 30 June 2007 to 30 June 2017 or 40 quarters).
The largest deferential was seen in the industrials sector. The trailing median EV/EBITDA multiple of 9.0x for the sector was above its historical average of 6.9x, or a 30% premium when compared to the sector’s historical average since 30 June 2007. This is in line with the trend seen in reported M&A deals.
The IT sector also experienced a significant valuation boost with the trailing median EV/EBITDA multiple of 12.8x exceeding its historical average of 10.3x, or a 24% premium when compared to the sector’s historical average since 30 June 2007, albeit, it has reduced from the record level recorded in CY2016.
Median EV/EBITDA trading multiples by sector
Consumer discretionary
Consumer staples
Energy Financials Healthcare IndustrialsInformation technology
Materials
(0.5)% 1.5% 3.5%
4 year CAGR
5.5%
Telecos Utilities
9.4
8.9
10.5
9.9
5.4
6.6
11.4
11.7
10.9
11.4
9.0
6.9
12.8
10.3
5.9
6.0
9.1
9.0
9.9
10.5
4 yr revenue compound annual growth rate (CAGR) forecast by sector
Construction
Agricultural
Manufacturing
Health
Communication & Technology
Community
Retail trade
Transport
Retail trade
Government
Wholesaling
Finance
Utilities
Education
Personal & other
Mining
Financials
Sources: IBISWorld, Grant Thornton analysis
Dealtracker 2017 33
Comment• In contrast to CY2015 – the best IPO market of the decade –
this Dealtracker period saw weaker capital raising conditions.
• The proceeds of IPO activity through CY2016 totalled $21.2 billion, compared to CY2015 with $33.4 billion – a decline of 37%.
• Proceeds from secondary offerings reached a five-year peak in CY2015 with $56.6 billion raised – CY2016 saw a return to the level of proceeds experienced post-GFC, falling 41% to $33.3 billion.
• The run-rate for H12017 indicates a further dampening
of market activity expected for CY2017.
• The IPO market made significant comebacks in 2010 and 2013, each raising additional funds of $17 billion YoY.
• As predicted in the previous Dealtracker, the formerly buoyant IPO market has moderated considerably through CY2016 and H1CY2017, driven by the significant increases in market volatility since the start of the 2016 calendar year – and to a lesser extent at the lower end of the market – the amendments to the ASX disclosure and listing requirements.
• Despite lower capital raising results, Australian IPO activity during CY2016 was strong with 89 listings, up from 85 listings during CY2015, a 5% increase.
• The value of CY2016 listings was A$6.7 billion, marginally down from CY2015 with A$7.1 billion.
• The average IPO value remained steady at $79 million over CY2015 and CY2016. This solidifies the return to ‘normal’ and underpins the impact of the mega-deals experienced during CY2013-14, including the A$5.7 billion listing of Medibank.
In line with the prediction provided in the previous Dealtracker, IPO activity dampened in the 18 months to June 2017 as the market slowed post the CY2016 strong activity levels.
IPO activity in Australia
34 Dealtracker 2017
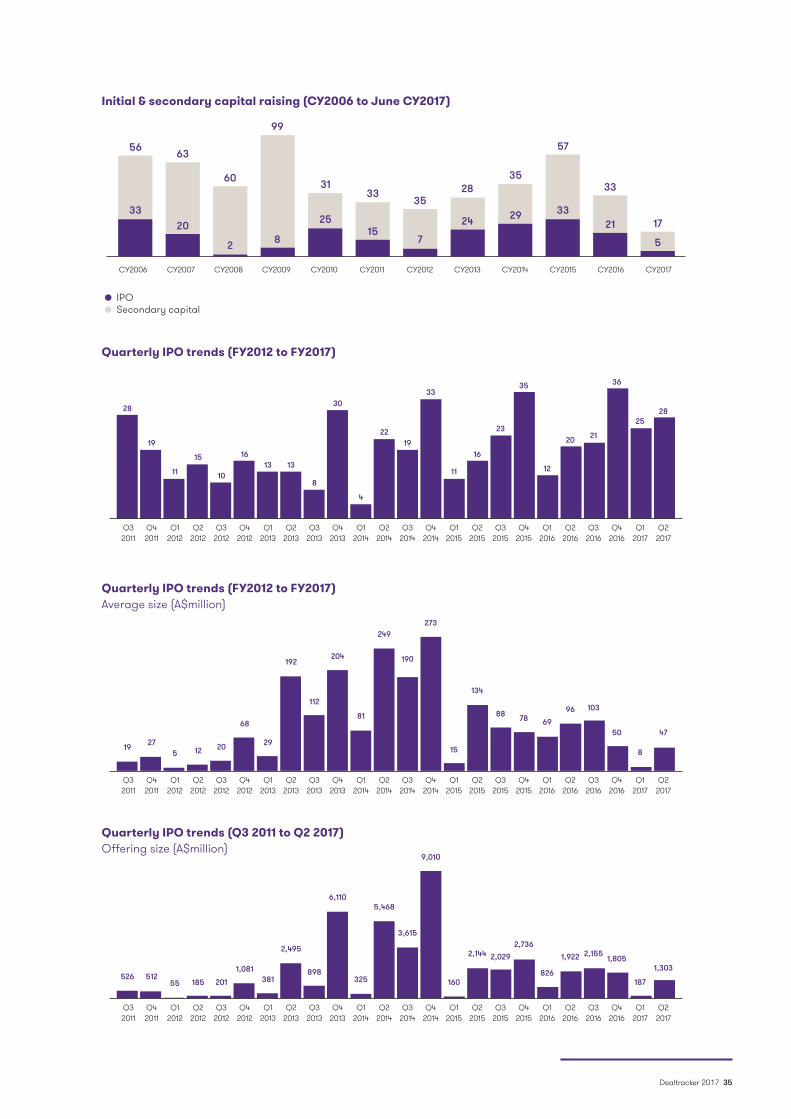
Quarterly IPO trends (FY2012 to FY2017)Average size (A$million)
Quarterly IPO trends (Q3 2011 to Q2 2017)Offering size (A$million)
Dealtracker 2017 35
Initial & secondary capital raising (CY2006 to June CY2017)
CY2006 CY2007 CY2008 CY2009 CY2010 CY2011 CY2012 CY2013 CY2014 CY2015 CY2016 CY2017
IPO Secondary capital
56 63
60
99
3133
3528
35
57
33
1733
20
2 8
2515
7
24 29 3321
5
Quarterly IPO trends (FY2012 to FY2017)
Q32011
Q42011
Q12012
Q22012
Q32012
Q42012
Q12013
Q22013
Q32013
Q42013
Q12014
Q22014
Q32014
Q42014
Q12015
Q22015
Q32015
Q42015
Q12016
Q22016
Q32016
Q42016
Q12017
Q22017
19
28
11
15
10
1613 13
8
30
4
2219
33
11
16
23
35
12
20 21
36
2528
8
Q32011
Q42011
Q12012
Q22012
Q32012
Q42012
Q12013
Q22013
Q32013
Q42013
Q12014
Q22014
Q32014
Q42014
Q12015
Q22015
Q32015
Q42015
Q12016
Q22016
Q32016
Q42016
Q12017
Q22017
27195 12 20
68
29
192
112
204
81
249
190
273
15
134
88 78 6996 103
50
8
47
Q32011
Q42011
Q12012
Q22012
Q32012
Q42012
Q12013
Q22013
Q32013
Q42013
Q12014
Q22014
Q32014
Q42014
Q12015
Q22015
Q32015
Q42015
Q12016
Q22016
Q32016
Q42016
Q12017
Q22017
51252655 185 201
1,081381
2,495
898
6,110
325
5,468
3,615
9,010
160
2,144 2,0292,736
826
1,922 2,155 1,805
187
1,303
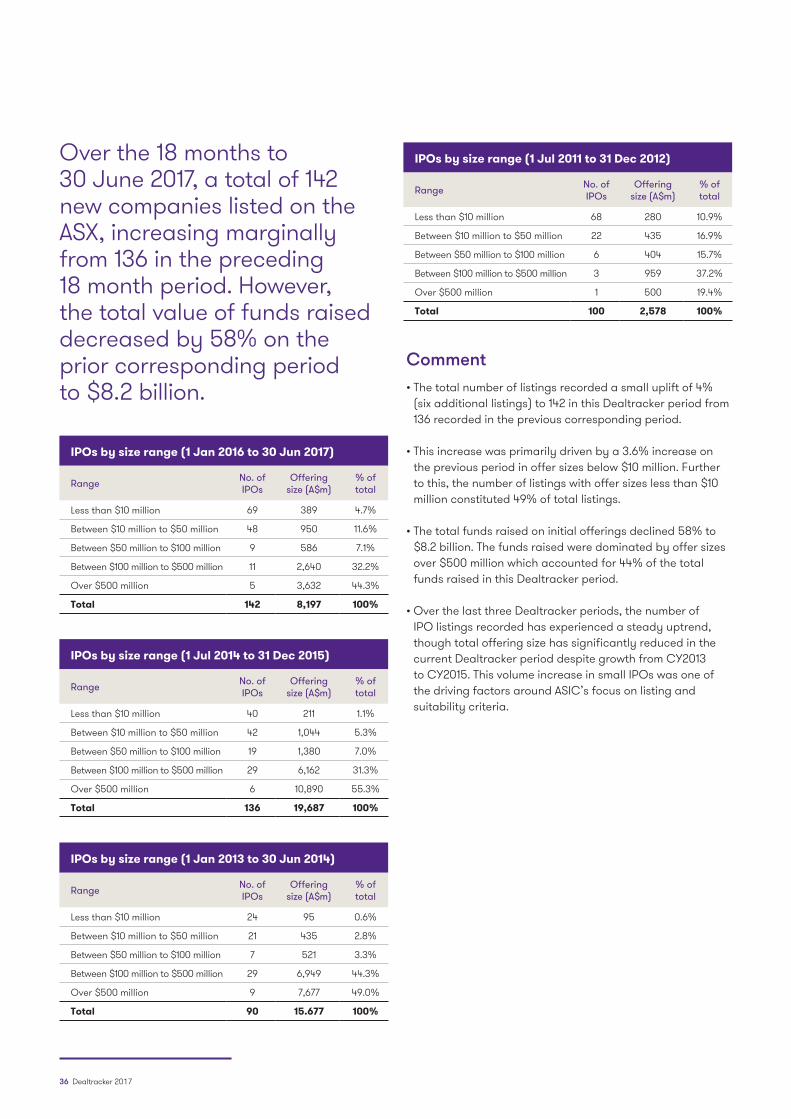
Over the 18 months to 30 June 2017, a total of 142 new companies listed on the ASX, increasing marginally from 136 in the preceding 18 month period. However, the total value of funds raised decreased by 58% on the prior corresponding period to $8.2 billion.
Comment• The total number of listings recorded a small uplift of 4%
(six additional listings) to 142 in this Dealtracker period from 136 recorded in the previous corresponding period.
• This increase was primarily driven by a 3.6% increase on the previous period in offer sizes below $10 million. Further to this, the number of listings with offer sizes less than $10 million constituted 49% of total listings.
• The total funds raised on initial offerings declined 58% to $8.2 billion. The funds raised were dominated by offer sizes over $500 million which accounted for 44% of the total funds raised in this Dealtracker period.
• Over the last three Dealtracker periods, the number of IPO listings recorded has experienced a steady uptrend, though total offering size has significantly reduced in the current Dealtracker period despite growth from CY2013 to CY2015. This volume increase in small IPOs was one of the driving factors around ASIC’s focus on listing and suitability criteria.
IPOs by size range (1 Jan 2016 to 30 Jun 2017)
Range No. of IPOs
Offering size (A$m)
% of total
Less than $10 million 69 389 4.7%
Between $10 million to $50 million 48 950 11.6%
Between $50 million to $100 million 9 586 7.1%
Between $100 million to $500 million 11 2,640 32.2%
Over $500 million 5 3,632 44.3%
Total 142 8,197 100%
IPOs by size range (1 Jul 2011 to 31 Dec 2012)
Range No. of IPOs
Offering size (A$m)
% of total
Less than $10 million 68 280 10.9%
Between $10 million to $50 million 22 435 16.9%
Between $50 million to $100 million 6 404 15.7%
Between $100 million to $500 million 3 959 37.2%
Over $500 million 1 500 19.4%
Total 100 2,578 100%
IPOs by size range (1 Jul 2014 to 31 Dec 2015)
Range No. of IPOs
Offering size (A$m)
% of total
Less than $10 million 40 211 1.1%
Between $10 million to $50 million 42 1,044 5.3%
Between $50 million to $100 million 19 1,380 7.0%
Between $100 million to $500 million 29 6,162 31.3%
Over $500 million 6 10,890 55.3%
Total 136 19,687 100%
IPOs by size range (1 Jan 2013 to 30 Jun 2014)
Range No. of IPOs
Offering size (A$m)
% of total
Less than $10 million 24 95 0.6%
Between $10 million to $50 million 21 435 2.8%
Between $50 million to $100 million 7 521 3.3%
Between $100 million to $500 million 29 6,949 44.3%
Over $500 million 9 7,677 49.0%
Total 90 15.677 100%
36 Dealtracker 2017
IPO size by sector
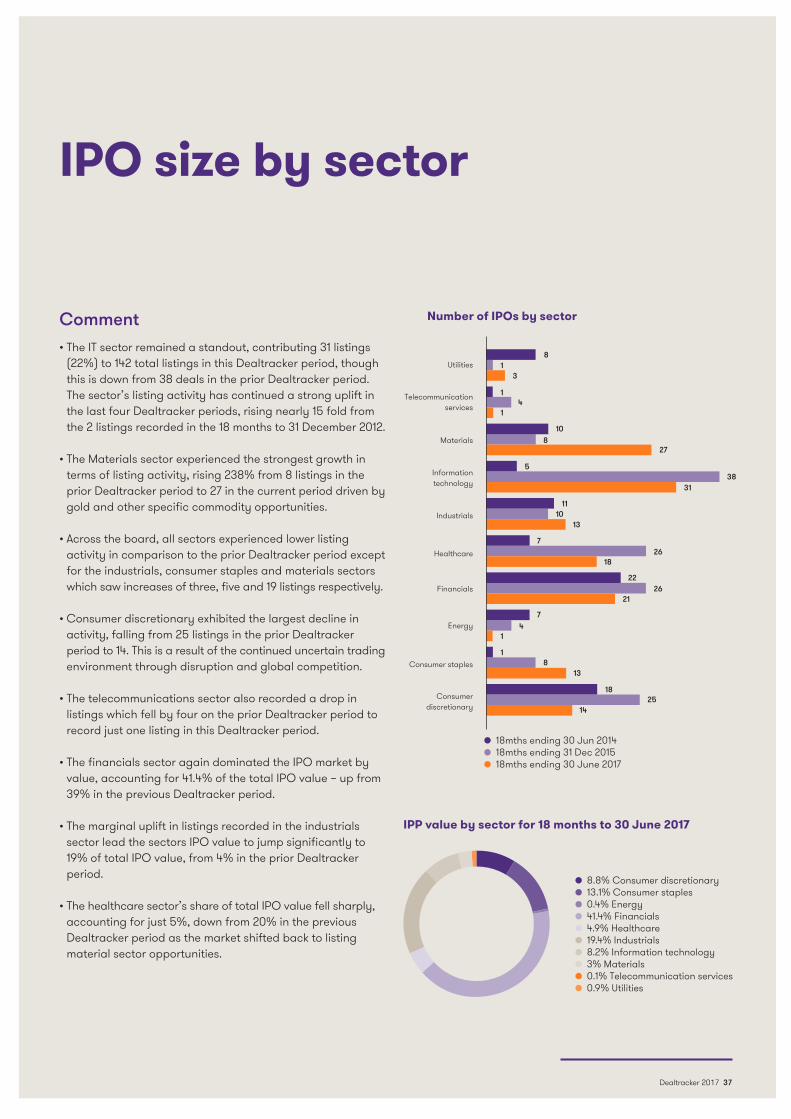
Comment• The IT sector remained a standout, contributing 31 listings
(22%) to 142 total listings in this Dealtracker period, though this is down from 38 deals in the prior Dealtracker period. The sector’s listing activity has continued a strong uplift in the last four Dealtracker periods, rising nearly 15 fold from the 2 listings recorded in the 18 months to 31 December 2012.
• The Materials sector experienced the strongest growth in terms of listing activity, rising 238% from 8 listings in the prior Dealtracker period to 27 in the current period driven by gold and other specific commodity opportunities.
• Across the board, all sectors experienced lower listing activity in comparison to the prior Dealtracker period except for the industrials, consumer staples and materials sectors which saw increases of three, five and 19 listings respectively.
• Consumer discretionary exhibited the largest decline in activity, falling from 25 listings in the prior Dealtracker period to 14. This is a result of the continued uncertain trading environment through disruption and global competition.
• The telecommunications sector also recorded a drop in listings which fell by four on the prior Dealtracker period to record just one listing in this Dealtracker period.
• The financials sector again dominated the IPO market by value, accounting for 41.4% of the total IPO value – up from 39% in the previous Dealtracker period.
• The marginal uplift in listings recorded in the industrials sector lead the sectors IPO value to jump significantly to 19% of total IPO value, from 4% in the prior Dealtracker period.
• The healthcare sector’s share of total IPO value fell sharply, accounting for just 5%, down from 20% in the previous Dealtracker period as the market shifted back to listing material sector opportunities.
8.8% Consumer discretionary 13.1% Consumer staples 0.4% Energy 41.4% Financials 4.9% Healthcare 19.4% Industrials 8.2% Information technology 3% Materials 0.1% Telecommunication services 0.9% Utilities
IPP value by sector for 18 months to 30 June 2017
Number of IPOs by sector
Utilities
Telecommunication services
Materials
Information technology
Industrials
Healthcare
Financials
Energy
Consumer staples
Consumer discretionary
81
3
14
1
108
27
538
31
1110
13
726
18
2226
21
74
1
18
13
1825
14
18mths ending 30 Jun 2014 18mths ending 31 Dec 2015 18mths ending 30 June 2017
Dealtracker 2017 37
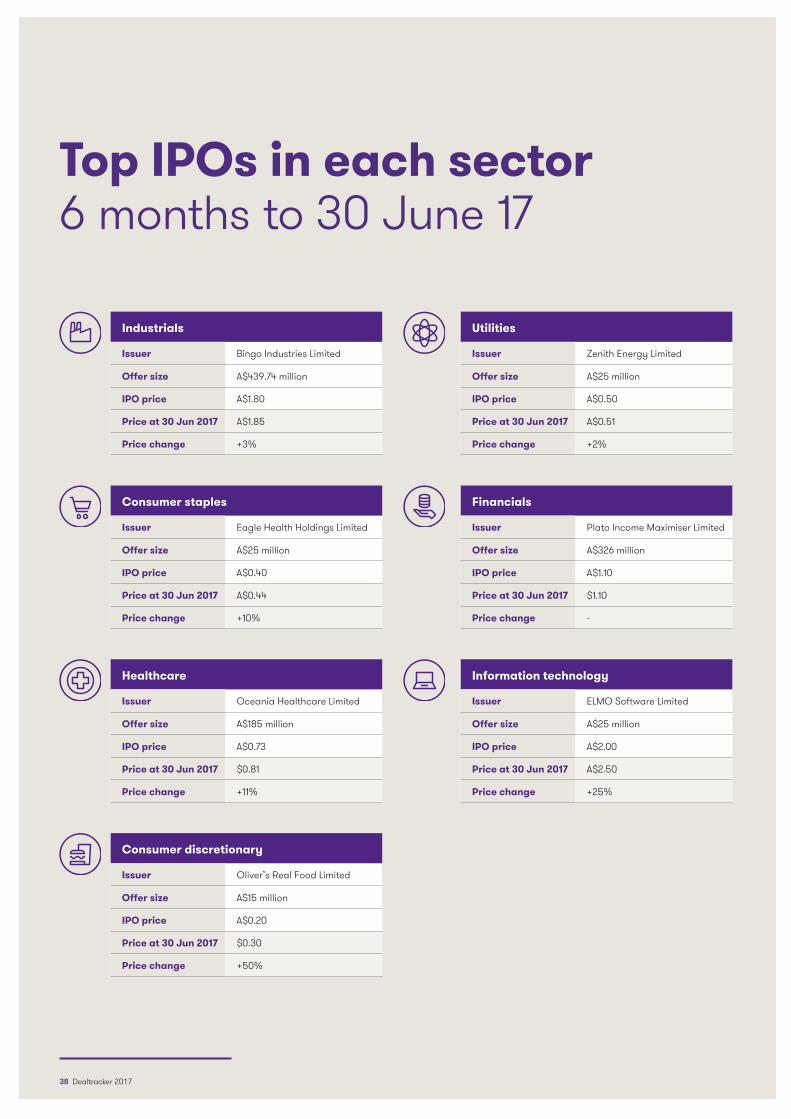
Top IPOs in each sector 6 months to 30 June 17
Industrials
Issuer Bingo Industries Limited
Offer size A$439.74 million
IPO price A$1.80
Price at 30 Jun 2017 A$1.85
Price change +3%
Consumer staples
Issuer Eagle Health Holdings Limited
Offer size A$25 million
IPO price A$0.40
Price at 30 Jun 2017 A$0.44
Price change +10%
Healthcare
Issuer Oceania Healthcare Limited
Offer size A$185 million
IPO price A$0.73
Price at 30 Jun 2017 $0.81
Price change +11%
Consumer discretionary
Issuer Oliver’s Real Food Limited
Offer size A$15 million
IPO price A$0.20
Price at 30 Jun 2017 $0.30
Price change +50%
Utilities
Issuer Zenith Energy Limited
Offer size A$25 million
IPO price A$0.50
Price at 30 Jun 2017 A$0.51
Price change +2%
Financials
Issuer Plato Income Maximiser Limited
Offer size A$326 million
IPO price A$1.10
Price at 30 Jun 2017 $1.10
Price change -
Information technology
Issuer ELMO Software Limited
Offer size A$25 million
IPO price A$2.00
Price at 30 Jun 2017 A$2.50
Price change +25%
38 Dealtracker 2017
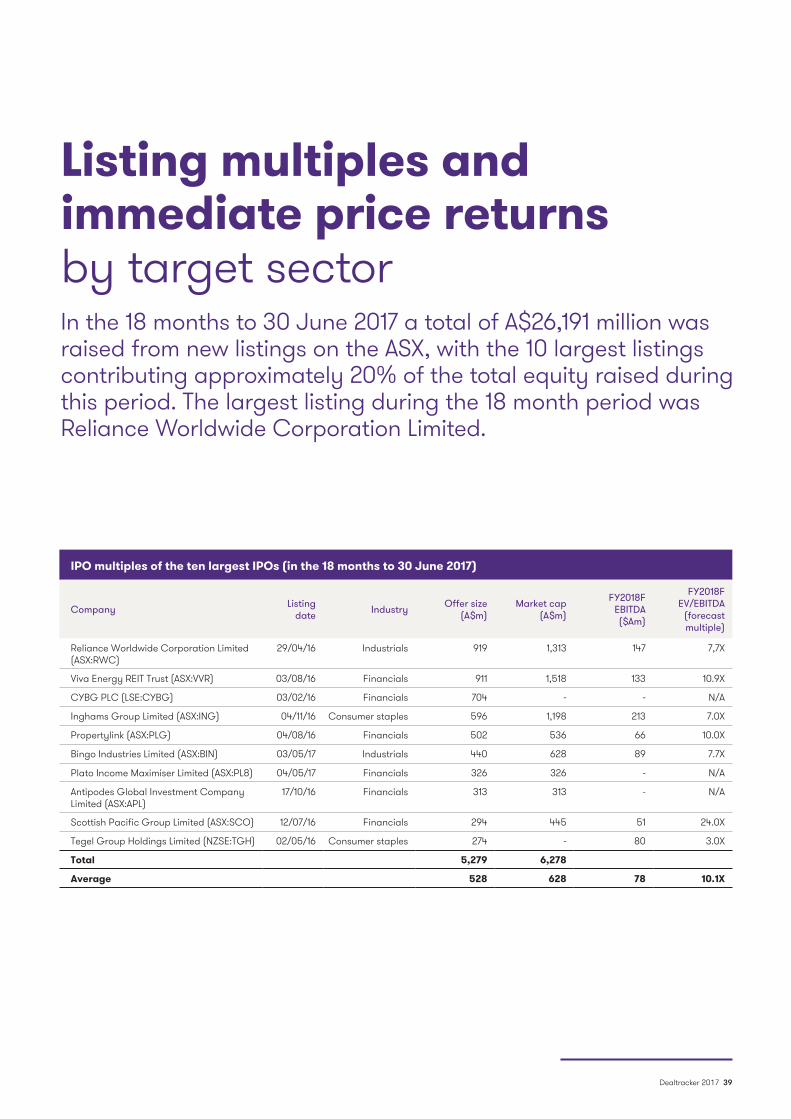
In the 18 months to 30 June 2017 a total of A$26,191 million was raised from new listings on the ASX, with the 10 largest listings contributing approximately 20% of the total equity raised during this period. The largest listing during the 18 month period was Reliance Worldwide Corporation Limited.
Listing multiples and immediate price returns by target sector
IPO multiples of the ten largest IPOs (in the 18 months to 30 June 2017)
Company Listing date Industry Offer size
(A$m)Market cap
(A$m)
FY2018F EBITDA ($Am)
FY2018F EV/EBITDA
(forecast multiple)
Reliance Worldwide Corporation Limited (ASX:RWC)
29/04/16 Industrials 919 1,313 147 7,7X
Viva Energy REIT Trust (ASX:VVR) 03/08/16 Financials 911 1,518 133 10.9X
CYBG PLC (LSE:CYBG) 03/02/16 Financials 704 - - N/A
Inghams Group Limited (ASX:ING) 04/11/16 Consumer staples 596 1,198 213 7.0X
Propertylink (ASX:PLG) 04/08/16 Financials 502 536 66 10.0X
Bingo Industries Limited (ASX:BIN) 03/05/17 Industrials 440 628 89 7.7X
Plato Income Maximiser Limited (ASX:PL8) 04/05/17 Financials 326 326 - N/A
Antipodes Global Investment Company Limited (ASX:APL)
17/10/16 Financials 313 313 - N/A
Scottish Pacific Group Limited (ASX:SCO) 12/07/16 Financials 294 445 51 24.0X
Tegel Group Holdings Limited (NZSE:TGH) 02/05/16 Consumer staples 274 - 80 3.0X
Total 5,279 6,278
Average 528 628 78 10.1X
Dealtracker 2017 39
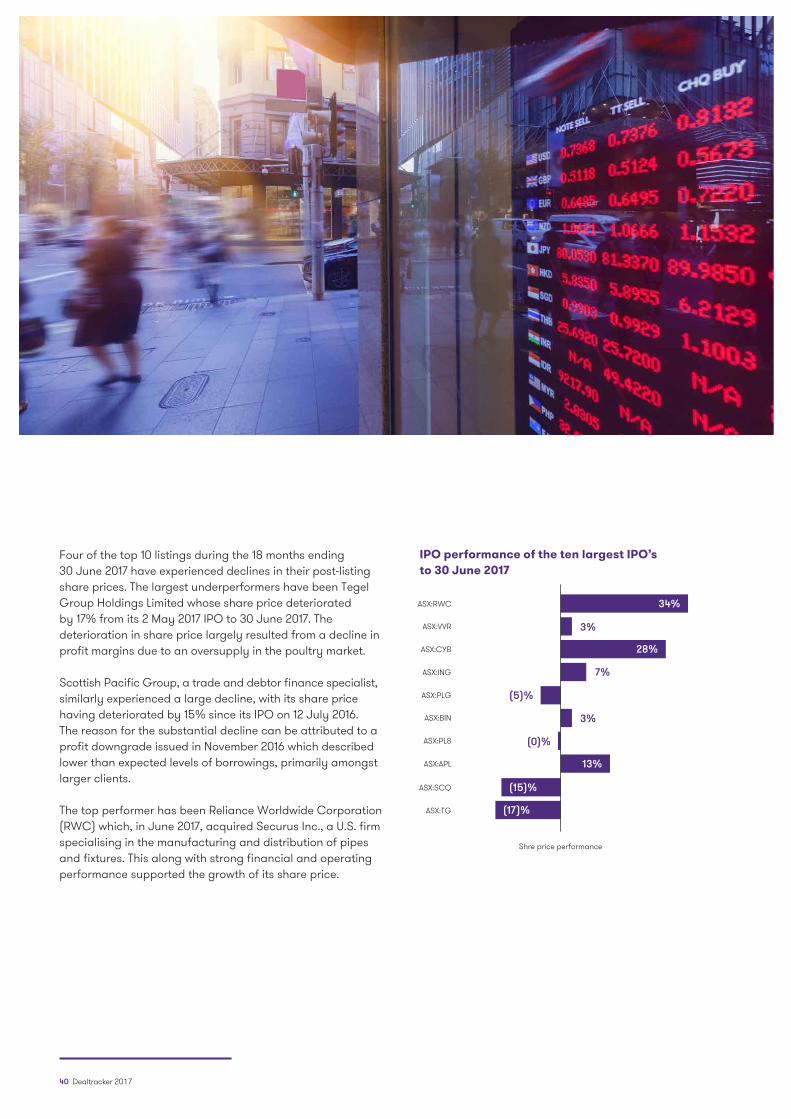
Four of the top 10 listings during the 18 months ending 30 June 2017 have experienced declines in their post-listing share prices. The largest underperformers have been Tegel Group Holdings Limited whose share price deteriorated by 17% from its 2 May 2017 IPO to 30 June 2017. The deterioration in share price largely resulted from a decline in profit margins due to an oversupply in the poultry market.
Scottish Pacific Group, a trade and debtor finance specialist, similarly experienced a large decline, with its share price having deteriorated by 15% since its IPO on 12 July 2016. The reason for the substantial decline can be attributed to a profit downgrade issued in November 2016 which described lower than expected levels of borrowings, primarily amongst larger clients.
The top performer has been Reliance Worldwide Corporation (RWC) which, in June 2017, acquired Securus Inc., a U.S. firm specialising in the manufacturing and distribution of pipes and fixtures. This along with strong financial and operating performance supported the growth of its share price.
IPO performance of the ten largest IPO’s to 30 June 2017
ASX:RWC
ASX:PLG
ASX:VVR
ASX:BIN
ASX:CYB
ASX:PL8
ASX:SCQ
ASX:ING
ASX:APL
ASX:TG
34%
28%
13%
3%
3%
7%
(5)%
(0)%
(15)%
(17)%
Shre price performance
40 Dealtracker 2017
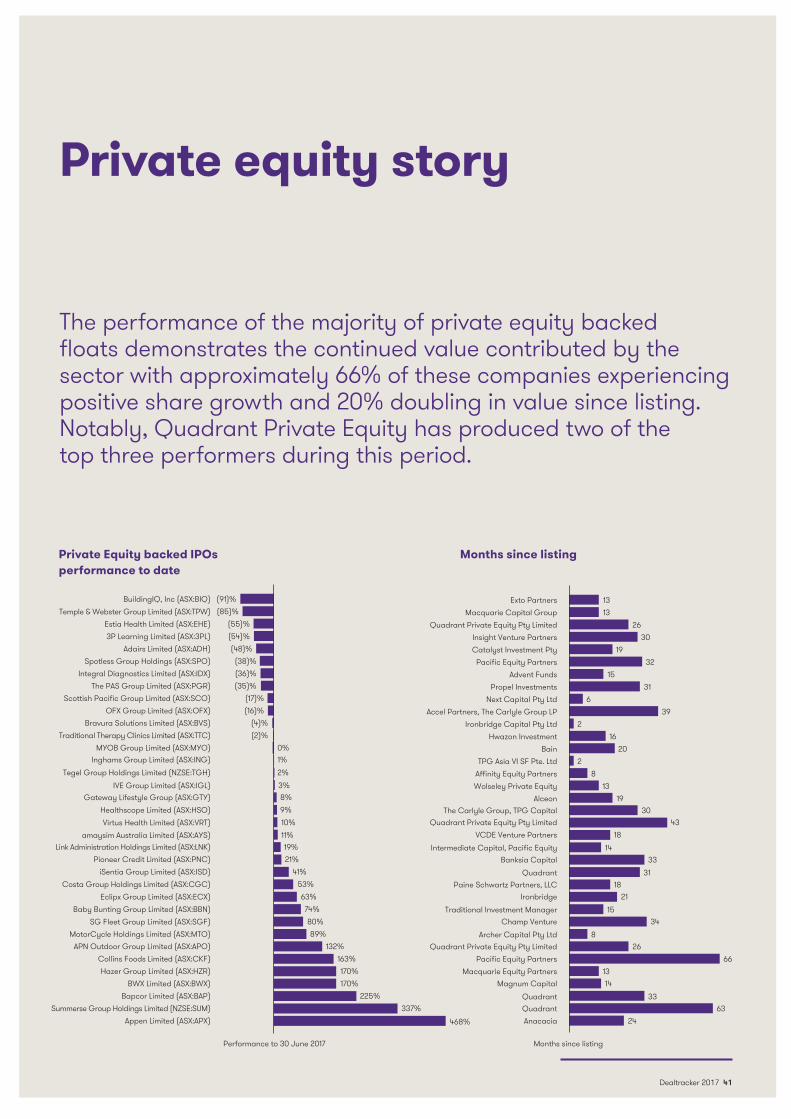
The performance of the majority of private equity backed floats demonstrates the continued value contributed by the sector with approximately 66% of these companies experiencing positive share growth and 20% doubling in value since listing. Notably, Quadrant Private Equity has produced two of the top three performers during this period.
Private equity story
Private Equity backed IPOs performance to date
Months since listing
Performance to 30 June 2017 Months since listing
(91)%(85)%
BuildingIQ, Inc (ASX:BIQ)
Spotless Group Holdings (ASX:SPO)
Bravura Solutions Limited (ASX:BVS)
IVE Group Limited (ASX:IGL)
Pioneer Credit Limited (ASX:PNC)
APN Outdoor Group Limited (ASX:APO)
Temple & Webster Group Limited (ASX:TPW)
Integral Diagnostics Limited (ASX:IDX)
Traditional Therapy Clinics Limited (ASX:TTC)
Gateway Lifestyle Group (ASX:GTY)
iSentia Group Limited (ASX:ISD)
Collins Foods Limited (ASX:CKF)
Estia Health Limited (ASX:EHE)
The PAS Group Limited (ASX:PGR)
MYOB Group Limited (ASX:MYO)
Healthscope Limited (ASX:HSO)
Costa Group Holdings Limited (ASX:CGC)
Hazer Group Limited (ASX:HZR)
3P Learning Limited (ASX:3PL)
Scottish Pacific Group Limited (ASX:SCO)
Inghams Group Limited (ASX:ING)
Virtus Health Limited (ASX:VRT)
Eclipx Group Limited (ASX:ECX)
BWX Limited (ASX:BWX)
Summerse Group Holdings Limited (NZSE:SUM)
Adairs Limited (ASX:ADH)
OFX Group Limited (ASX:OFX)
Tegel Group Holdings Limited (NZSE:TGH)
Link Administration Holdings Limited (ASX:LNK)
MotorCycle Holdings Limited (ASX:MTO)
amaysim Australia Limited (ASX:AYS)
SG Fleet Group Limited (ASX:SGF)Baby Bunting Group Limited (ASX:BBN)
Bapcor Limited (ASX:BAP)
Appen Limited (ASX:APX)
(55)%(54)%(48)%(38)%(36)%(35)%
(17)%(16)%
(4)%(2)%
0%
13Exto Partners13Macquarie Capital Group
26Quadrant Private Equity Pty Limited30Insight Venture Partners
19Catalyst Investment Pty32Pacific Equity Partners
15Advent Funds31Propel Investments
6Next Capital Pty Ltd39Accel Partners, The Carlyle Group LP
2Ironbridge Capital Pty Ltd16Hwazon Investment
20Bain2TPG Asia VI SF Pte. Ltd
8Affinity Equity Partners13Wolseley Private Equity
19Alceon30The Carlyle Group, TPG Capital
43Quadrant Private Equity Pty Limited18VCDE Venture Partners
14Intermediate Capital, Pacific Equity33Banksia Capital
31Quadrant18Paine Schwartz Partners, LLC
21Ironbridge15Traditional Investment Manager
34Champ Venture8Archer Capital Pty Ltd
26Quadrant Private Equity Pty Limited
13Macquarie Equity Partners14Magnum Capital
33Quadrant
24Anacacia63Quadrant
66Pacific Equity Partners
1%2%3%8%9%10%11%19%21%
41%53%63%74%80%89%
132%163%170%170%
225%337%
468%
Dealtracker 2017 41

42 Dealtracker 2017
Dealtracker 2017 43
In the constant state of change in which dynamic organisations operate, ultimate success depends on their ability to identify trends as they emerge and seize those opportunities in front of their competitors. Our team’s constant focus is to help these dynamic organisations unlock their potential for growth through market leading insights and expertise.”
Paul Gooley, National Head of Corporate Finance
“
Working together
Trust=
Relates to our actions
and is revealed by keeping our
promises
Relates to our emotions: do people feel safe talking
about difficult agendas?
Relates to our words and
is revealed in our credentials
and honesty
Credibility Responsibility Intimacy+ +
Self-orientationRelates to our caring and is revealed in
our focus – ourselves or the group
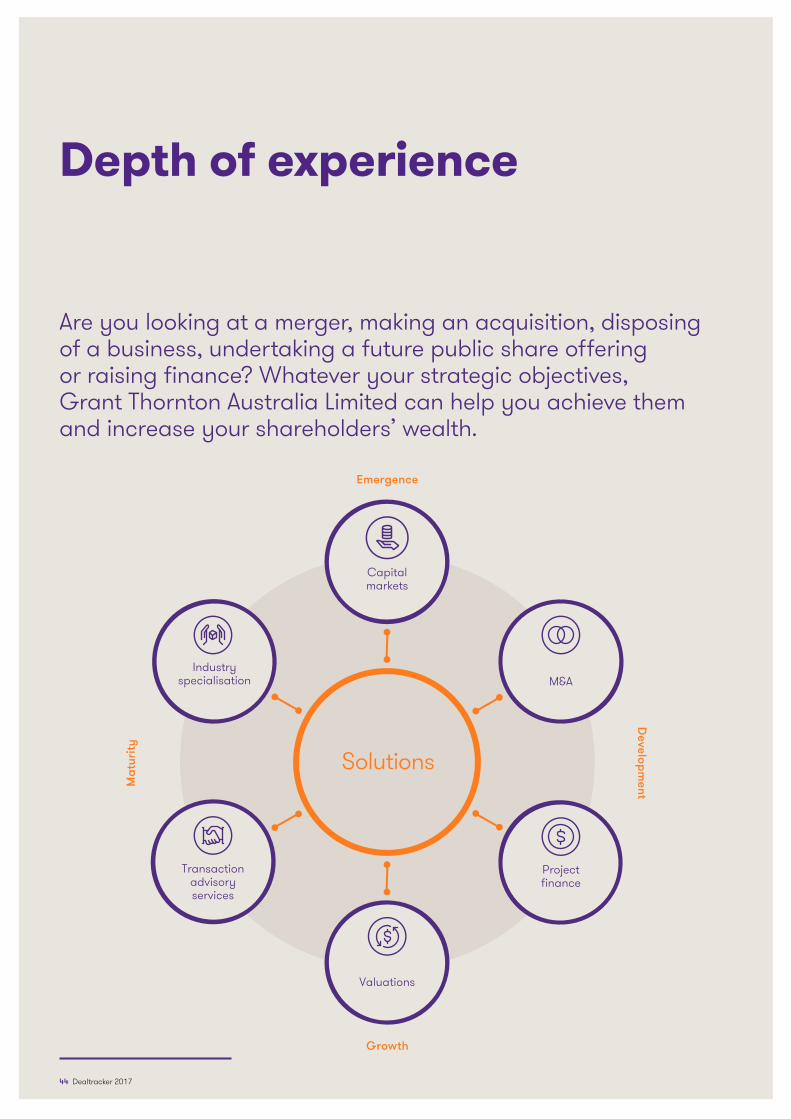
Solutions
Capital markets
Valuations
M&A
Project finance
Industry specialisation
Transaction advisory services
Emergence
Developm
ent
Growth
Mat
urity
Are you looking at a merger, making an acquisition, disposing of a business, undertaking a future public share offering or raising finance? Whatever your strategic objectives, Grant Thornton Australia Limited can help you achieve them and increase your shareholders’ wealth.
Depth of experience
44 Dealtracker 2017
Corporate Finance services
Our success is built on the importance we place on developing deep, long-lasting relationships, both with our clients and with third parties such as private equity houses, banks, other financial intermediaries, lawyers and government bodies. The strength of our partnerships and our multidisciplined team allows us to provide a rapid response, tailored to your particular circumstances.
1. In an ever changing market environment, it is important to effectively manage costs and maximise returns. Our team acts as a strategic advisor and is committed to taking the time to genuinely listen to your individual needs. This enables us to present you with solutions which add value and ensure your shareholder wealth is maximised.
2. Clients expect the highest level of service and value for money from their financial advisor. Grant Thornton Australia firmly believes that we will exceed your expectations. By adopting a truly Partner-led approach we set ourselves apart from other firms whilst maintaining competitive and sustainable fee arrangements. Our clients appreciate the proactive and commercial advice and solutions which are tailored to meet their individual needs today and in the future.
3. In today’s market, knowing your business environment and market is critical. It is therefore important to be able to trust that your advisor has strong industry skills and is aware of current issues relevant to you, your customers and your stakeholders. With extensive experience in providing corporate advisory services for both large and medium size organisations we have the ability to share best practice solutions and industry insights with you.
4. As one of Australia’s leading advisors, we work with dynamic, growing organisations to unlock their potential for growth. You will benefit from working with your local team who understand the issues you face and is able to draw upon the expertise and resources of dedicated industry specialist and technical experts throughout Australia and internationally.
Working with our clients has given our team extensive experience in all aspects of corporate finance.
Merger & acquisition services
Mergers & acquisitions
Buy/sell side lead advisory
Private equity transactions
MBIs/MBOs
Cross border transactions
Industry consolidation
Debt refinancing
ASX/AIM listings
Corporate structuring
Capital raisings
Information memorandum preparation
Transaction advisory services
Acquisition due diligence
Vendor due diligence
Tax due diligence
Commercial due diligence
Investigating accountants’ report
Forecast reviews
Management assessment
Data room services
Pre-lend reviews
Valuations
Independent valuations
Independent expert reports
Majority/minority interests
Purchase price allocations
Employee share and option plans
Hybrid financial instruments
Intangible assets
Disputes and litigation support
Impairment testing
Tax consolidation
Financial modelling
Financial model construction
Financial model review
Project analysisProject feasibility
Project financing
Dealtracker 2017 45
To assist our clients with their ambitions, Grant Thornton Australia’s M&A team can provide an independent view and insight into the risks and opportunities available for companies aiming to grow both organically and through acquisition or shareholders realising value.
We understand our clients are looking for more than just an advisor. They need a partner who will work through the whole transaction process with them to achieve the optimal outcome.
We work closely with our Tax, Assurance and other Specialist Advisory Services practitioners to provide a seamless service that caters for the various financial and commercial issues that arise. We take this approach with every assignment, with the ultimate goal of building strong ongoing relationships with our valued clients.
Our team brings together multidisciplinary financial backgrounds and strong relationships with financial sponsors, banks and leading corporates. In addition, our national and international capability provides clients with true integrated cross-border transaction capabilities.
Our M&A team
Will provide hands-on strategy and transaction execution advice
Is independent of all debt and equity providers and will provide impartial advice
Will provide overall process and transaction management and ensure timely progress of the various pieces of the strategy
Will provide a seamless suite of advisory services in a co-ordinated manner
Will provide access to relevant parties both domestically and internationally through our worldwide network
Adding valueSeamless support from Grant Thornton brings real value to the M&A process, ensuring parties remain informed, processes are completed smoothly and efficiently and superior outcomes are positively achieved.
Mergers & acquisitions
Undertaking a merger, acquisition, or divestment can be a watershed event in a company’s evolution. Grant Thornton Australia’s Mergers & Acquisitions (M&A) team are highly skilled and entrepreneurial and have the experience and expertise you need.
Our services
46 Dealtracker 2017
Transaction advisory services
Whether you are acquiring, divesting or considering an initial public offering, our transaction advisory team will identify and resolve key business issues through our rigorous risk and business analysis process.
Tailoring a reporting method to suit your preferred medium and help you make informed decisions, you will receive balanced and objective advice, giving you insight and confidence around the numbers and key questions in respect of your transaction.
Our national team of advisors is experienced, capable and hands on. We work to develop a real understanding of our clients’ businesses and requirements, with partner-led service and long-term working relationships.
We also offer cross-border transaction experience and depth. Working with transaction advisory teams in other countries via our international network enables seamless delivery of cross border opportunities.
Operational Deal ServicesOur Operational Deal Services (ODS) team provides practical advice to ensure the greatest possible outcome and value from business transactions.
We work with you through all stages of the deal to maximise deal value and performance, through a robust approach to strategic planning, stakeholder engagement, value mapping and change management.
Our services have been developed to meet the needs of the middle to large market sectors and include:
Acquisition financial and tax due diligence
Vendor financial and tax due diligence
Agreed upon procedures reports
Investigating accountant reports
Reporting accountant reports (Alternative Investment Market)
Forecast modelling and review
Pre-acquisition/disposal planning
Pre bid analysis and valuation
Tax planning and structuring
Sell side preparation
Data room facilitation and management
Transaction accounting advice including purchase price allocation
Transaction cost analysis
Transaction project management
Completion accounts review and comments on sale agreement
Operational Deal Services, including post acquisition integration and reviews
Our services
Dealtracker 2017 47
Our services
Valuation services
Grant Thornton Australia’s valuation team provides clients access to dedicated practitioners with in-depth expertise in the valuation of shares, hybrid securities, businesses and related intangible assets.
Valuation services include:
Preparation of Independent expert’s reports for public transactions in accordance with the requirements of the Corporations Act and the ASX listing rules
Valuation for mergers, acquisitions, disposals and pre-bid support
Purchase price allocation
Valuation for pre-lending review process
Impairment testing for intangible assets
Valuation for taxation purposes, including entering the tax consolidation regime, capital gains tax and stamp duty
Option valuations
Valuation for dispute resolution and expert determination
48 Dealtracker 2017
Our services
Financial modelling services
Financial modelling is the process of forecasting performance of businesses and assets, using relationships among a range of variables. The central aim of all financial modelling is decision making or valuation under uncertain conditions, which provides management with leading insights into the short term or even long term business environment.
In an environment of increasing corporate governance requirements, financial models also assist with monitoring compliance with debt covenants and assisting with financial reporting.
Financial models are commonly required when businesses are contemplating:
Improving existing decision making processes
Financing/refinancing
Business expansion
Improving efficiency in the finance team
Acquisitions of businesses
Sales and divestments
Public offerings (IPO)
ASX continuous disclosure
Reviewing financial modelsAll major business decisions and transactions require financial analysis. The critical factor of any financial analysis is ensuring that the appropriate analysis is being conducted on the correct information.
Our team has extensive experience in providing financial model reviews for both the public and private sectors, in M&A and other internal operational contexts.
Developing financial modelsOur team specialises in providing custom-built financial models that can be used for a wide variety of situations to enhance the decision making process, including:
• Feasibility analysis• Scenario analysis• Forecasting• Cash flow management
Key decision making toolA financial model is not seen as a piece of software but rather as a key decision making tool that has the ability to make or break a business or investment. Therefore all of our models are fully tested to ensure the highest level of integrity in their construction. Likewise our financial model review process is systematic and thorough and conducted by practitioners with capabilities in advanced modelling.
Our financial models
Are user friendly
Have assumptions easily identified and easy to manipulate
Are easy to follow, with a logical layout
Are sophisticated in logic but not overly complex
Contain automated scenario analysis around key business risks
Are well summarized, with visual outputs and dashboards
Dealtracker 2017 49
In preparing this publication, we have relied upon the following key sources of information, including: Standard & Poor’s Capital IQ, the Australian Securities Exchange, MergerMarket, IBISWorld, company announcements and other publicly available information. We have considered transactions during the period between 1 January 2011 to 30 December 2015 where the target company’s primary sector was resident in Australia and the acquirer gained control of the company.
Our analysis is based on the assumption that the information derived from the different sources mentioned above are correct and that no material information is missing. Whilst all reasonable actions have been observed to ensure that the information in this report is not false or misleading, Grant Thornton does not accept any liability for damage incurred as a result of facts or deficiencies in this report. Conclusions and judgements reflect our assessment at the time of the publication’s completion.
50 Dealtracker 2017
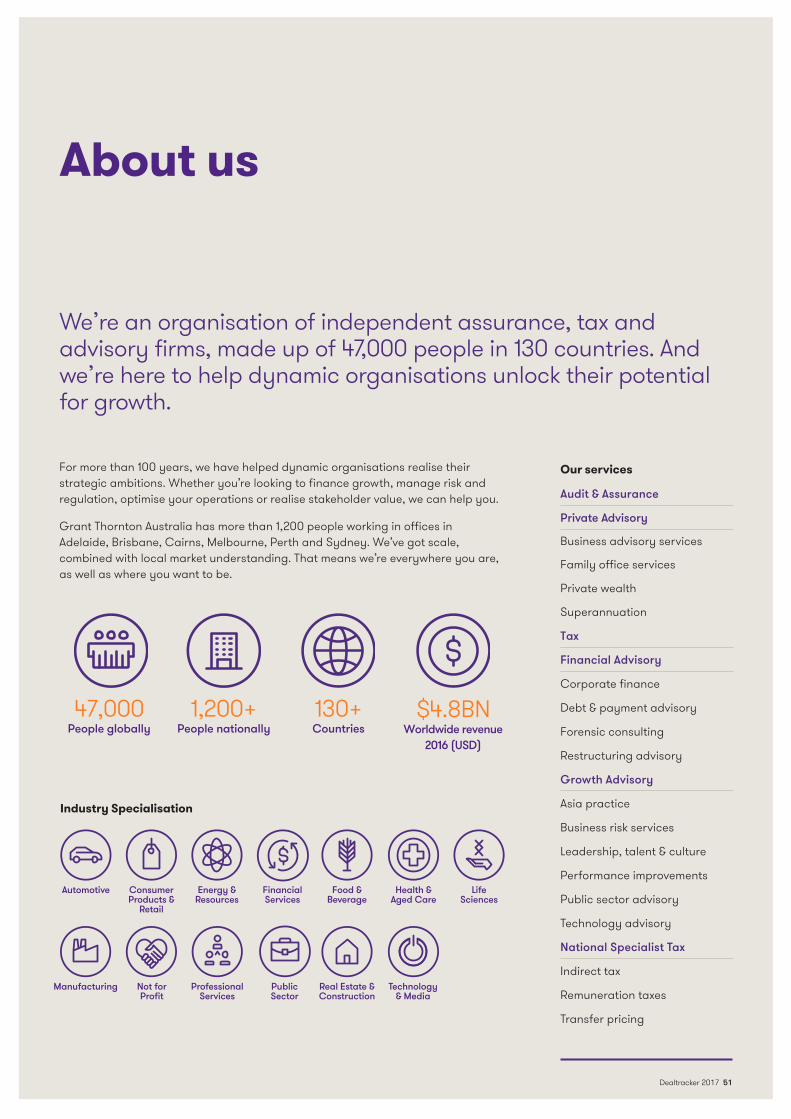
Our services
Audit & Assurance
Private Advisory
Business advisory services
Family office services
Private wealth
Superannuation
Tax
Financial Advisory
Corporate finance
Debt & payment advisory
Forensic consulting
Restructuring advisory
Growth Advisory
Asia practice
Business risk services
Leadership, talent & culture
Performance improvements
Public sector advisory
Technology advisory
National Specialist Tax
Indirect tax
Remuneration taxes
Transfer pricing
About us
We’re an organisation of independent assurance, tax and advisory firms, made up of 47,000 people in 130 countries. And we’re here to help dynamic organisations unlock their potential for growth.
For more than 100 years, we have helped dynamic organisations realise their strategic ambitions. Whether you’re looking to finance growth, manage risk and regulation, optimise your operations or realise stakeholder value, we can help you.
Grant Thornton Australia has more than 1,200 people working in offices in Adelaide, Brisbane, Cairns, Melbourne, Perth and Sydney. We’ve got scale, combined with local market understanding. That means we’re everywhere you are, as well as where you want to be.
Industry Specialisation
47,000 People globally
130+Countries
1,200+People nationally
$4.8BNWorldwide revenue
2016 (USD)
Health & Aged Care
Automotive Life Sciences
Consumer Products &
Retail
Manufacturing
Energy & Resources
Not for Profit
Financial Services
Professional Services
Food & Beverage
Public Sector
Real Estate & Construction
Technology & Media
Dealtracker 2017 51
grantthornton.com.au
The information contained herein is of a general nature and is not intended to address the circumstances of any particular individual or entity. -Although we endeavour to provide accurate and timely information, there can be no guarantee that such information is accurate as of the date it is received or that it will continue to be accurate in the future. No one is entitled to rely on this information and no one should act on such information without appropriate professional advice obtained after a thorough examination of the particular situation.
“Grant Thornton” refers to the brand under which the Grant Thornton member firms provide assurance, tax and advisory services to their clients and/or refers to one or more member firms, as the context requires. Grant Thornton Australia Ltd is a member firm of Grant Thornton International Ltd (GTIL). GTIL and the member firms are not a worldwide partnership. GTIL and each member firm is a separate legal entity. Services are delivered by the member firms. GTIL does not provide services to clients. GTIL and its member firms are not agents of, and do not obligate one another and are not liable for one another’s acts or omissions. In the Australian context only, the use of the term ‘Grant Thornton’ may refer to Grant Thornton Australia Limited ABN 41 127 556 389 and its Australian subsidiaries and related entities. GTIL is not an Australian related entity to Grant Thornton Australia Limited.
Liability limited by a scheme approved under Professional Standards Legislation. Liability is limited in those States where a current scheme applies
Offices Adelaide Grant Thornton House Level 3, 170 Frome Street Adelaide SA 5000 E [email protected]
Brisbane Level 18, 145 Ann Street Brisbane QLD 4000 T +61 7 3222 0200 E [email protected]
Cairns Cairns Corporate Tower Level 13, 15 Lake Street Cairns QLD 4870 T +61 7 4046 8888 E [email protected]
Melbourne Collins Square 727 Collins Street Melbourne VIC 3000 T +61 3 8320 2222 E [email protected]
Perth Central Park Level 43, 152–158 St Georges Terrace Perth WA 6000 T +61 8 9480 2000 E [email protected]
Sydney Level 17, 383 Kent Street Sydney NSW 2000 T +61 2 8297 2400 E [email protected]
Contacts Adelaide George Stavrou Partner T +61 8 8372 6517 E [email protected]
Brisbane Graham McManus Partner T +61 7 3222 0224 E [email protected]
Harley Mitchell Partner T +61 7 3222 0309 E [email protected]
John Dowell Partner T +61 7 3222 0313 E [email protected]
Melbourne Peter Thornely Partner T +61 3 8663 6229 E [email protected]
Cameron Bacon Partner T +61 3 8663 6000 E [email protected]
Jannaya James Partner T +61 3 8663 6376 E [email protected]
Perth Mitesh Ramji Partner T +61 8 9480 2110 E [email protected]
Sydney Paul Gooley Partner T +61 2 8297 2586 E [email protected]
Holly Stiles Partner T +61 2 8297 2487 E [email protected]
Andrea De Cian Partner T +61 2 8297 2554 E [email protected]
Neil Cooke Partner T +61 2 8297 2521 E [email protected]
Tim Goodman Partner T +61 2 8297 2772 E [email protected]