Embed Size (px)
Citation preview
Australian Horticulture Statistics Handbook
Other horticulture2015/16
24/05/2017
Any views contained in this publica�on do not necessarily represent the views of
Hor�culture Innova�on Australia Limited (Hort Innova�on) or its commitment to a
par�cular course of ac�on. Hort Innova�on makes no representa�ons and expressly
disclaims all warran�es (to the extent permi ed by law) about the accuracy,
completeness, or currency of informa�on in the Australian Hor�culture Sta�s�cs
Handbook 2015/16 (“the Handbook”).
Reliance on any informa�on provided by Hort Innova�on is en�rely at your own risk. Hort
Innova�on is not responsible for, and will not be liable for, any loss, damage, claim,
expense, cost (including legal costs) or other liability arising in any way, including from
any Hort Innova�on or other person’s negligence or otherwise from your use or non-use
of the Handbook, or from reliance on informa�on contained in the material or that Hort
Innova�on provides to you by any other means.
Copyright © Hor�culture Innova�on Australian Limited 2017
Copyright subsists in the Handbook. Hort Innova�on owns the copyright, other than as
permi ed under the Copyright ACT 1968 (Cth). The Handbook (in part or as a whole)
cannot be reproduced, published, communicated or adapted without the prior wri en
consent of Hort Innova�on. Any request or enquiry to use the Handbook should be
addressed to:
Communica�ons Manager
Hor�culture Innova�on Australia Limited
Level 8, 1 Chifley Square
Sydney NSW 2000
Australia
Email: communica�ons@hor�culture.com.au
Phone: 02 8295 2300
The Australian Hor�culture Sta�s�cs Handbook 2015/16 has been funded by Hor�culture
Innova�on Australia Limited using the across industry levy and funds from the Australian
Government.
2
Disclaimer
2015/16 Australian Hor�culture
Sta�s�cs Handbook
24/05/2017
3
2015/16 Australian Hor�culture
Sta�s�cs Handbook
24/05/2017
4
Overview
2015/16 Australian Hor�culture
Sta�s�cs Handbook
This Handbook is an analysis that combines all available data on
produc�on, interna�onal trade, processing volumes and fresh market
distribu�on in order to produce sta�s�cs on 75 hor�cultural categories
over the year ending 30 June 2016.
Summary of Approach
The Handbook adopts a modelling approach that centres on determining
the fresh market value and volume for each category, that reconciles
produc�on with local and interna�onal distribu�on channel throughputs.
Fresh market supply volume is determined as follows:
Fresh Supply = Produc�on - Fresh Exports - Processing + Fresh Imports
• Farm gate produc�on quan�ty has been informed through a number of
sources, including Hort Innova�on funded data projects, hor�cultural
government levy data where available, and refined through
consulta�on with informed industry bodies. The corresponding value of
produc�on is calculated from wholesale pricing informa�on, before
removing known logis�cal, marke�ng and wholesale costs to reflect
product value at the farm gate.
• Export and import trade volume and value is based on Australian
Customs data as reported in IHS Global Trade Atlas data.
• Processing data has been obtained through consulta�on with industry
processors1.
See pages 18 and 19 under ‘research method’ for a detailed descrip�on on
this Handbook’s methodology.
1Note that the $ value of processing volumes has not been included in the analysis.
24/05/2017
This publica�on covers the year ending 30 June 2016 and examines the
produc�on and distribu�on of hor�culture products. Some of the key
influences on hor�cultural produc�on and distribu�on over this period are
summarised below.
Further growth in export markets has liGed the profile of Hor�culture,
s�mula�ng more interest as some categories pass the �pping point of
distribu�ng more volume through export than domes�c markets. Total
fresh hor�culture exports liGed to $2.1 billion, with significant increases in
the exports of citrus, table grapes, macadamias, and carrots.
The more consolidated and invested producer base shows the capacity
influence of the domes�c supply chain. This is reflected in; the control of
plant variety rights; longer term contracts with trading partners and the
differen�a�on of products, which combine to enable these suppliers to
assert more influence on where their product is distributed and how value
is captured.
The domes�c market remains dominated by the compe��ve intensity in
the retail channel with the growth generated being a ributed to products
in smaller por�ons and meal ready forms. The food service channel is
genera�ng growth as consumers are drawn into using more technology-
enabled ordering tools and are spending more of their food dollars on
ea�ng out, confirmed by a moderate increase of 2.2% in the turnover of
Cafes, Restaurants and Catering Services over the 2015/16 period, per ABS
Retail Trade Sta�s�cs.
These influences are expected to prevail in the near term.
5
Overview
2015/16 Australian Hor�culture
Sta�s�cs Handbook
24/05/2017
Introduc�on ................................... 7
Data Sharing—List of Projects ... 8
Abbrevia�ons .............................. 10
Defini�ons .................................... 11
How to use this book ................. 12
Research Method ....................... 18
Interna�onal Trade Total Imports ............................... 22
Total Exports................................ 23
Fresh Imports by region ............ 24
Fresh Exports by region ............. 26
Fresh Imports by state ............... 28
Fresh Exports by state ............... 30
Data Tables Produc�on.................................... 32
Value of Produc�on ................... 34
Volume of Fresh Exports .......... 36
Value of Fresh Exports .............. 38
Volume of Fresh Imports ......... 40
Value of Fresh Imports .............. 42
Fresh Supply ................................ 44
Wholesale Value ......................... 46
All Hor�culture Hor�culture Overview .......... 48
Fruit Category Overview ................ 52
Apples ........................................... 54
Avocados ...................................... 60
Bananas ........................................ 66
Berries Overview ............... 70
Blueberries .............................. 72
Rubus Berries ......................... 78
Strawberries ........................... 84
Cherries ......................................... 90
Citrus Fruit Overview ......... 96
Grapefruit ................................ 98
Lemons/Limes ...................... 104
Mandarins ............................. 110
Oranges.................................. 116
Custard Apples .......................... 122
Kiwifruit ...................................... 126
Lychees ....................................... 132
Mangoes ..................................... 136
Melons Overview............. 142
Muskmelons ............................ 144
Watermelons ........................... 150
Nashi ............................................ 156
Passionfruit ................................ 160
Papaya/Pawpaw ....................... 164
Pears ............................................ 170
Persimmons ............................... 176
Pineapples .................................. 182
Summerfruit Overview .... 186
Apricots .................................. 188
Nectarines/Peaches ............ 194
Plums ...................................... 200
Table Grapes .............................. 206
Dried Grapes .............................. 212
Prunes ......................................... 216
Other Dried Tree Fruit ............. 220
Canning Fruit ............................. 224
Olives ........................................... 228
Vegetables Category Overview ............. 232
Ar�chokes .................................. 234
Asparagus ................................... 240
Beans ........................................... 246
Beetroot ...................................... 252
Broccoli/Baby Broccoli ............ 258
Brussels Sprouts ........................ 264
Cabbages .................................... 270
Capsicums ................................... 276
Carrots ......................................... 282
Cauliflowers ............................... 288
Celery .......................................... 292
Chilies .......................................... 296
Cucumbers ................................. 302
Eggplants .................................... 308
Eng,Spinach/Silverbeet/Kale . 314
Fresh Herbs Overview ...... 320
Fennel ...................................... 322
Parsley and other Herbs ...... 326
Garlic ........................................... 330
Ginger .......................................... 336
Head LeDuces ............................ 342
Leafy Asian Vegetables ............ 346
Leafy Salad Vegetables ............ 352
Leeks ............................................ 358
Mushrooms ................................ 364
Onions ......................................... 370
Parsnips....................................... 376
Peas ............................................. 380
Potatoes ...................................... 386
Pumpkins .................................... 392
Sweet Corn ................................. 398
Sweetpotatoes .......................... 402
Tomatoes .................................... 408
Zucchini ....................................... 414
Nuts Category Overview ............. 418
Almonds ...................................... 420
Chestnuts .................................... 426
Hazelnuts .................................... 430
Macadamias ............................... 436
Pecans ......................................... 442
Pistachios .................................... 448
Walnuts ....................................... 454
Other Categories Category Overview ............. 460
Cut Flowers ................................ 462
Nursery ....................................... 468
Turf .............................................. 474
6
Table of Contents
2015/16 Australian Hor�culture
Sta�s�cs Handbook
24/05/2017
Availability of valid sta�s�cal informa�on is a key enabler across hor�culture. The
Australian Hor�culture Sta�s�cs Handbook for the year ending 30 June 2016, is
presented by Hor�culture Innova�on Australia for the purpose of consolida�ng
hor�culture sta�s�cal informa�on for use by hor�culture industry members and
other stakeholders.
The informa�on sources for this publica�on have drawn on data available from
the Australian Bureau of Sta�s�cs, Hort Innova�on funded projects, interna�onal
trade sources and hor�culture industry representa�ve bodies (IRBs) where
available. In this publica�on these sources have been expanded to include and
draw on household consump�on and local market distribu�on channel
informa�on, as assessed by Freshlogic, to provide a reconciled profile of each
supply chain.
The 2015/16 Handbook has been compiled by Freshlogic. In this edi�on, there
have been some changes to the way some categories and products have been
profiled compared to the 2014/15 edi�on. Major changes include:
• Olives now profiles the produc�on of table olives, and olive oil, with a focus
on olive oil as this is the predominant product form for Australian olives.
• Prunes (Dried Plums) has been separated from the “Other Dried Tree Fruit”
category.
Where addi�onal informa�on has led to a change in the previously quoted value
from the 2014/15 edi�on for a category, this has been noted on the page of the
relevant category.
This edi�on of the Handbook is made available electronically via the Hort
Innova�on website, at www.hor�culture.com.au
Hort Innova�on will evaluate the uptake and usage of the Handbook to ensure
that future edi�ons are delivered according to user needs.
Any comments regarding the Handbook should be forwarded to Hort Innova�on
at: feedback@hor�culture.com.au
7
Introduc�on
2015/16 Australian Hor�culture
Sta�s�cs Handbook
24/05/2017
8
% YoY % increase/decrease this year compared to last year
$ Australian Dollars
$b Billion Australian Dollars
$m Million Australian Dollars
2015/16 Year ending 30 June 2016
ABS Australian Bureau of Sta�s�cs
CIF Cost of Insurance and Freight (a measure of import value)
FOB Free On Board (a measure of export value)
g Grams
GTA Global Trade Atlas
kg Kilograms
KWE Kernel Weight Equivalent
ha Hectares
ISWE In-Shell Weight Equivalent
L Litres
m2 Metres squared (a measure of area)
m m2 Million metres squared (a measure of area)
ML Mega Litres (1 million litres)
N/A Not Available
t Tonnes (1 thousand kilograms)
States Countries
NSW New South Wales PNG Papua New Guinea
NT Northern Territory UAE United Arab Emirates
VIC Victoria UK United Kingdom
QLD Queensland US United States of America
SA South Australia
TAS Tasmania
WA Western Australia
Abbrevia�ons
2015/16 Australian Hor�culture
Sta�s�cs Handbook
24/05/2017
Category—A par�cular hor�cultural commodity (e.g. bananas), or in some cases a
combina�on of like commodi�es (e.g. the category ‘rubus berries’ covers raspberries
and blackberries and other rubus).
Produc�on—The volume in tonnes of the category that was grown in Australia over
the year. This refers to produc�on which was sold by the producer, either to the
Australian fresh or processing markets, or to interna�onal trade markets. This does
not cover any produc�on that was not harvested, nor does it refer to any other forms
of produc�on of the category that do not enter these markets.
Value of Produc�on—Some�mes referred to as ‘Farm Gate Value,’ this is the value of
the produc�on received by the producer.
Processing Volume—The volume in tonnes of the category that was sent to be
processed, such as juicing, freezing or preserving.
Fresh Exports—The volume in tonnes of the produc�on that was exported in a fresh
form to other countries. Due to the way trade informa�on is recorded, this may
include some dried products, and will be marked as such where appropriate.
Value of Fresh Exports—The value in million dollars of the category’s fresh exports.
This is recorded in FOB (Free on Board) dollars.
Fresh Imports—The volume in tonnes of the category that was imported into
Australia from another country in a fresh form.
Value of Fresh Imports—The value in million dollars of the category’s fresh imports.
This is recorded in CIF (Cost of Insurance and Freight) dollars.
Fresh Supply—The volume in tonnes of the category that was available to the
Australian market in a fresh form. Volume supplied to the fresh market is typically
either sold at retail or supplied to food service outlets.
Wholesale Value—The value in million dollars of the fresh supply at a wholesale
market level, inclusive of net interna�onal trade flows. Note that the Wholesale
value is dis�nct from the Gross Value of Produc�on tracked by the ABS, as that
measure includes value of processing and exported product, and does not include
imported product.
In-Shell (Nut categories) —A measure of volume that includes the weight of the
inedible shell around the kernel.
Kernel (Nut categories) —A measure of volume that only includes the edible kernel.
Crack Out Yield (Nut categories) —The percentage of edible kernel obtained from
the in-shell volume during the cracking process.
9
Defini�ons
2015/16 Australian Hor�culture
Sta�s�cs Handbook
24/05/2017
2015/16 Australian Hor�culture
Sta�s�cs Handbook 10
This sec�on outlines how to interpret the various graphs, tables and supply chain
models used to profile each of the hor�cultural commodi�es covered in this
handbook.
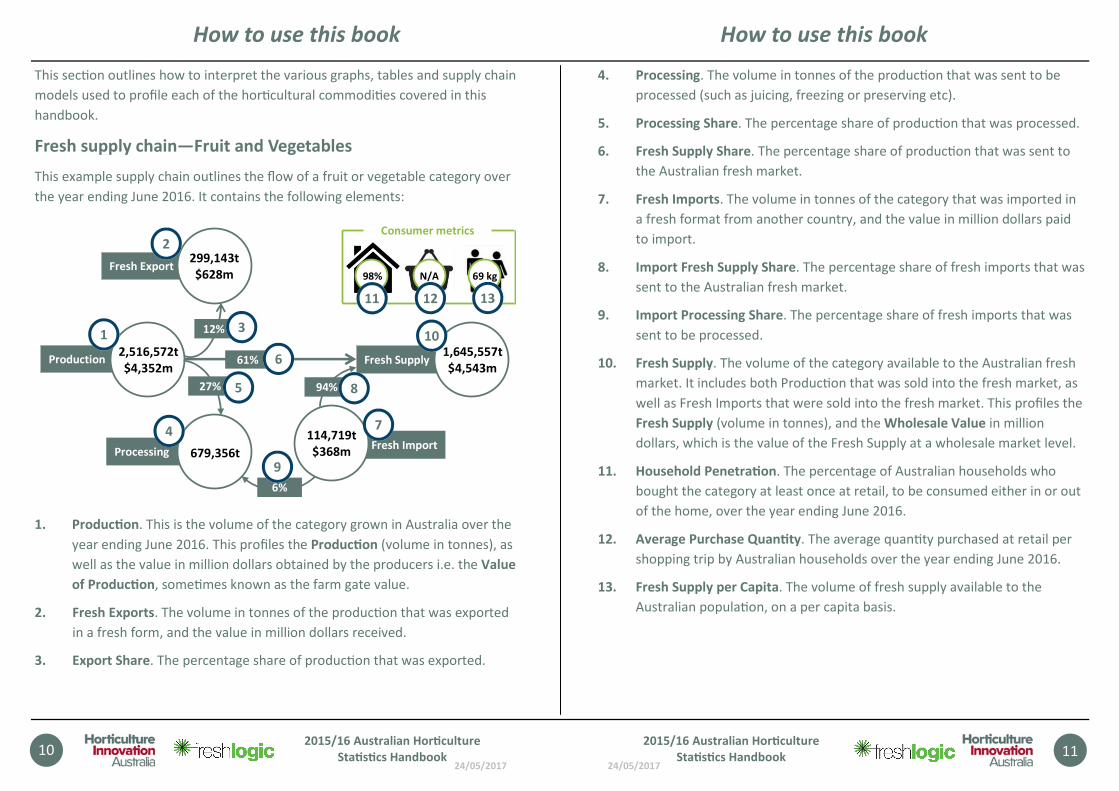
Fresh supply chain—Fruit and Vegetables
This example supply chain outlines the flow of a fruit or vegetable category over
the year ending June 2016. It contains the following elements:
1. Produc�on. This is the volume of the category grown in Australia over the
year ending June 2016. This profiles the Produc�on (volume in tonnes), as
well as the value in million dollars obtained by the producers i.e. the Value
of Produc�on, some�mes known as the farm gate value.
2. Fresh Exports. The volume in tonnes of the produc�on that was exported
in a fresh form, and the value in million dollars received.
3. Export Share. The percentage share of produc�on that was exported.
Production2,516,572t
$4,352m
Processing 679,356t
Fresh Export299,143t
$628m
27%
12%
Fresh Supply1,645,557t
$4,543m61%
Fresh Import114,719t
$368m
N/A98% 69 kg
Consumer metrics
94%
6%
1
2
4
3
5
7
8
6
10
9
11 12 13
How to use this book
24/05/2017
4. Processing. The volume in tonnes of the produc�on that was sent to be
processed (such as juicing, freezing or preserving etc).
5. Processing Share. The percentage share of produc�on that was processed.
6. Fresh Supply Share. The percentage share of produc�on that was sent to
the Australian fresh market.
7. Fresh Imports. The volume in tonnes of the category that was imported in
a fresh format from another country, and the value in million dollars paid
to import.
8. Import Fresh Supply Share. The percentage share of fresh imports that was
sent to the Australian fresh market.
9. Import Processing Share. The percentage share of fresh imports that was
sent to be processed.
10. Fresh Supply. The volume of the category available to the Australian fresh
market. It includes both Produc�on that was sold into the fresh market, as
well as Fresh Imports that were sold into the fresh market. This profiles the
Fresh Supply (volume in tonnes), and the Wholesale Value in million
dollars, which is the value of the Fresh Supply at a wholesale market level.
11. Household Penetra�on. The percentage of Australian households who
bought the category at least once at retail, to be consumed either in or out
of the home, over the year ending June 2016.
12. Average Purchase Quan�ty. The average quan�ty purchased at retail per
shopping trip by Australian households over the year ending June 2016.
13. Fresh Supply per Capita. The volume of fresh supply available to the
Australian popula�on, on a per capita basis.
2015/16 Australian Hor�culture
Sta�s�cs Handbook 11
How to use this book
24/05/2017
12
How to use this book
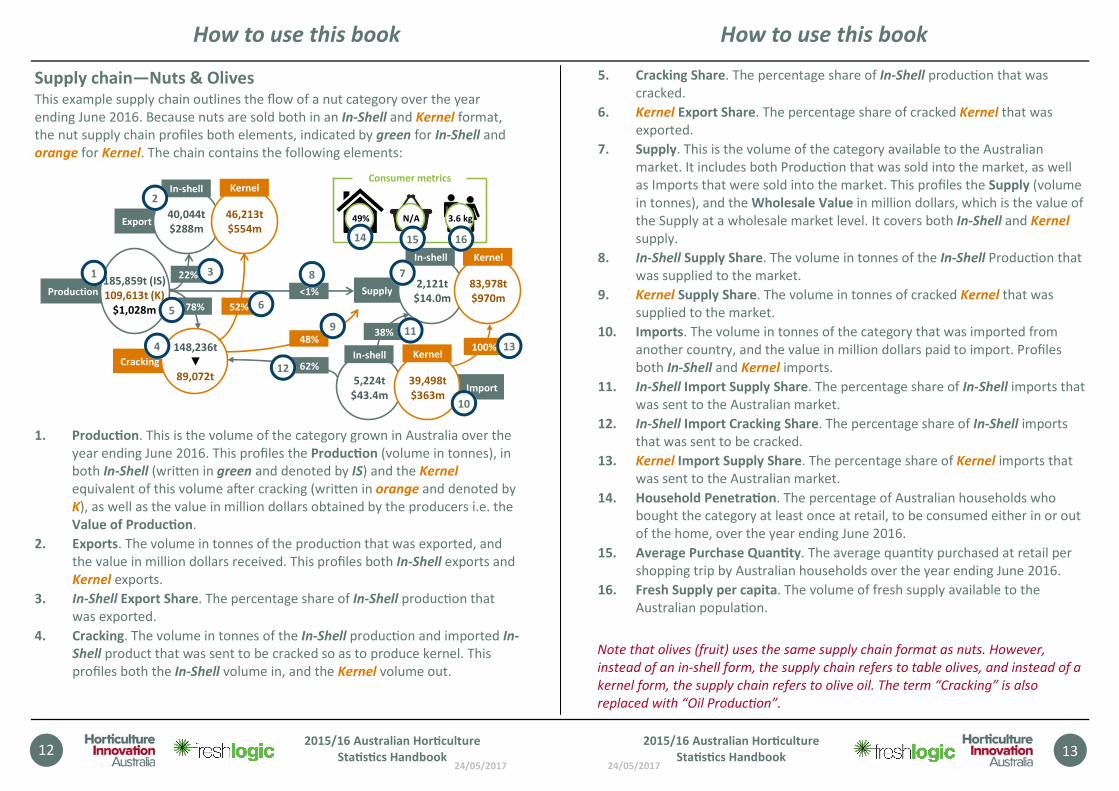
Supply chain—Nuts & Olives This example supply chain outlines the flow of a nut category over the year
ending June 2016. Because nuts are sold both in an In-Shell and Kernel format,
the nut supply chain profiles both elements, indicated by green for In-Shell and
orange for Kernel. The chain contains the following elements:
1. Produc�on. This is the volume of the category grown in Australia over the
year ending June 2016. This profiles the Produc�on (volume in tonnes), in
both In-Shell (wri en in green and denoted by IS) and the Kernel
equivalent of this volume aGer cracking (wri en in orange and denoted by
K), as well as the value in million dollars obtained by the producers i.e. the
Value of Produc�on.
2. Exports. The volume in tonnes of the produc�on that was exported, and
the value in million dollars received. This profiles both In-Shell exports and
Kernel exports.
3. In-Shell Export Share. The percentage share of In-Shell produc�on that
was exported.
4. Cracking. The volume in tonnes of the In-Shell produc�on and imported In-
Shell product that was sent to be cracked so as to produce kernel. This
profiles both the In-Shell volume in, and the Kernel volume out.
38%
78%
22%
N/A49% 3.6 kg
Consumer metrics
Export40,044t
$288m
In-shell
46,213t
$554m
Kernel
100%
Import
In-shell
39,498t
$363m
Kernel
5,224t
$43.4m
Production185,859t (IS)
109,613t (K)
$1,028m
Supply2,121t
$14.0m<1%
83,978t
$970m
Cracking
148,236t
▼
89,072t
48%
52%
KernelIn-shell
62%
2015/16 Australian Hor�culture
Sta�s�cs Handbook
5
1
2
3
4
6
7
9
8
11
13
10
14 15 16
12
24/05/2017
5. Cracking Share. The percentage share of In-Shell produc�on that was
cracked.
6. Kernel Export Share. The percentage share of cracked Kernel that was
exported.
7. Supply. This is the volume of the category available to the Australian
market. It includes both Produc�on that was sold into the market, as well
as Imports that were sold into the market. This profiles the Supply (volume
in tonnes), and the Wholesale Value in million dollars, which is the value of
the Supply at a wholesale market level. It covers both In-Shell and Kernel
supply.
8. In-Shell Supply Share. The volume in tonnes of the In-Shell Produc�on that
was supplied to the market.
9. Kernel Supply Share. The volume in tonnes of cracked Kernel that was
supplied to the market.
10. Imports. The volume in tonnes of the category that was imported from
another country, and the value in million dollars paid to import. Profiles
both In-Shell and Kernel imports.
11. In-Shell Import Supply Share. The percentage share of In-Shell imports that
was sent to the Australian market.
12. In-Shell Import Cracking Share. The percentage share of In-Shell imports
that was sent to be cracked.
13. Kernel Import Supply Share. The percentage share of Kernel imports that
was sent to the Australian market.
14. Household Penetra�on. The percentage of Australian households who
bought the category at least once at retail, to be consumed either in or out
of the home, over the year ending June 2016.
15. Average Purchase Quan�ty. The average quan�ty purchased at retail per
shopping trip by Australian households over the year ending June 2016.
16. Fresh Supply per capita. The volume of fresh supply available to the
Australian popula�on.
Note that olives (fruit) uses the same supply chain format as nuts. However,
instead of an in-shell form, the supply chain refers to table olives, and instead of a
kernel form, the supply chain refers to olive oil. The term “Cracking” is also
replaced with “Oil Produc�on”.
13
How to use this book
2015/16 Australian Hor�culture
Sta�s�cs Handbook
24/05/2017
14
How to use this book
2015/16 Australian Hor�culture
Sta�s�cs Handbook
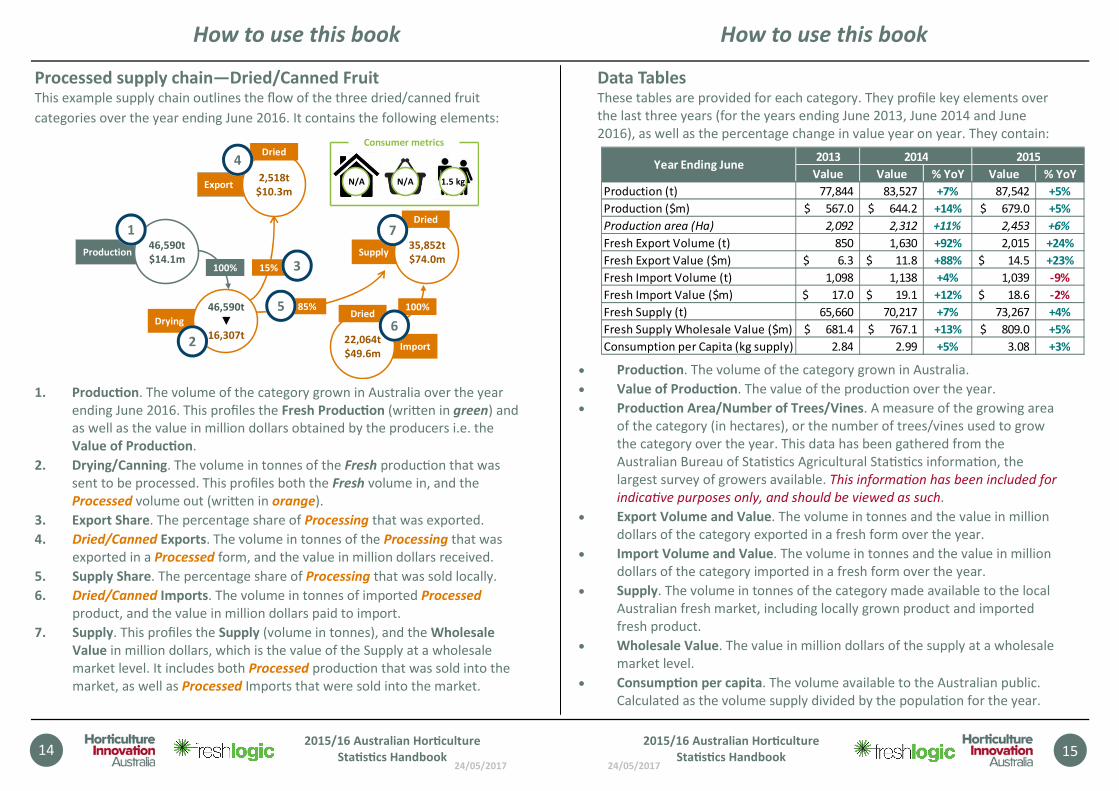
Processed supply chain—Dried/Canned Fruit This example supply chain outlines the flow of the three dried/canned fruit
categories over the year ending June 2016. It contains the following elements:
1. Produc�on. The volume of the category grown in Australia over the year
ending June 2016. This profiles the Fresh Produc�on (wri en in green) and
as well as the value in million dollars obtained by the producers i.e. the
Value of Produc�on.
2. Drying/Canning. The volume in tonnes of the Fresh produc�on that was
sent to be processed. This profiles both the Fresh volume in, and the
Processed volume out (wri en in orange).
3. Export Share. The percentage share of Processing that was exported.
4. Dried/Canned Exports. The volume in tonnes of the Processing that was
exported in a Processed form, and the value in million dollars received.
5. Supply Share. The percentage share of Processing that was sold locally.
6. Dried/Canned Imports. The volume in tonnes of imported Processed
product, and the value in million dollars paid to import.
7. Supply. This profiles the Supply (volume in tonnes), and the Wholesale
Value in million dollars, which is the value of the Supply at a wholesale
market level. It includes both Processed produc�on that was sold into the
market, as well as Processed Imports that were sold into the market.
15%100%
N/AN/A 1.5 kg
Consumer metrics
Export2,518t
$10.3m
Dried
100%
Import22,064t
$49.6m
Dried
Production46,590t
$14.1mSupply
35,852t
$74.0m
Drying
46,590t
▼
16,307t
85%
Dried1
2
4
3
5
7
6
24/05/2017
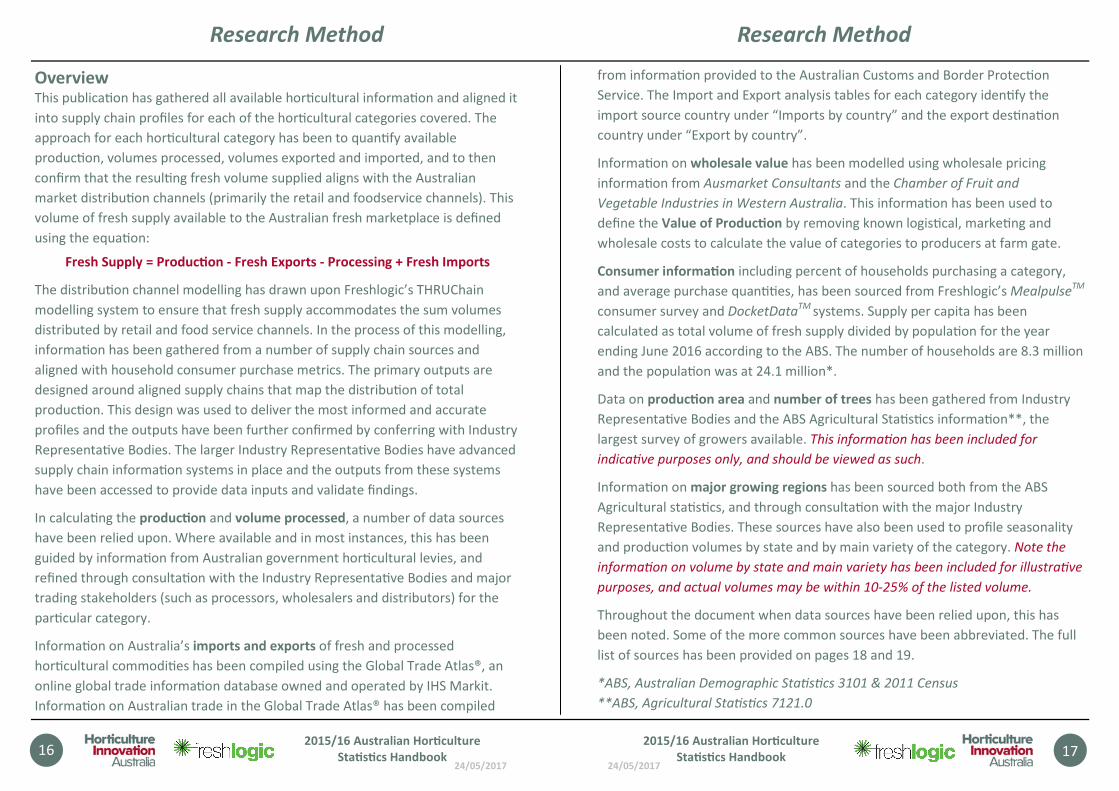
Data Tables These tables are provided for each category. They profile key elements over
the last three years (for the years ending June 2013, June 2014 and June
2016), as well as the percentage change in value year on year. They contain:
• Produc�on. The volume of the category grown in Australia.
• Value of Produc�on. The value of the produc�on over the year.
• Produc�on Area/Number of Trees/Vines. A measure of the growing area
of the category (in hectares), or the number of trees/vines used to grow
the category over the year. This data has been gathered from the
Australian Bureau of Sta�s�cs Agricultural Sta�s�cs informa�on, the
largest survey of growers available. This informa�on has been included for
indica�ve purposes only, and should be viewed as such.
• Export Volume and Value. The volume in tonnes and the value in million
dollars of the category exported in a fresh form over the year.
• Import Volume and Value. The volume in tonnes and the value in million
dollars of the category imported in a fresh form over the year.
• Supply. The volume in tonnes of the category made available to the local
Australian fresh market, including locally grown product and imported
fresh product.
• Wholesale Value. The value in million dollars of the supply at a wholesale
market level.
• Consump�on per capita. The volume available to the Australian public.
Calculated as the volume supply divided by the popula�on for the year.
2013
Value Value % YoY Value % YoY
Production (t) 77,844 83,527 +7% 87,542 +5%
Production ($m) 567.0$ 644.2$ +14% 679.0$ +5%
Production area (Ha) 2,092 2,312 +11% 2,453 +6%
Fresh Export Volume (t) 850 1,630 +92% 2,015 +24%
Fresh Export Value ($m) 6.3$ 11.8$ +88% 14.5$ +23%
Fresh Import Volume (t) 1,098 1,138 +4% 1,039 -9%
Fresh Import Value ($m) 17.0$ 19.1$ +12% 18.6$ -2%
Fresh Supply (t) 65,660 70,217 +7% 73,267 +4%
Fresh Supply Wholesale Value ($m) 681.4$ 767.1$ +13% 809.0$ +5%
Consumption per Capita (kg supply) 2.84 2.99 +5% 3.08 +3%
2014 2015Year Ending June
15
How to use this book
2015/16 Australian Hor�culture
Sta�s�cs Handbook
24/05/2017
16
Research Method
Overview This publica�on has gathered all available hor�cultural informa�on and aligned it
into supply chain profiles for each of the hor�cultural categories covered. The
approach for each hor�cultural category has been to quan�fy available
produc�on, volumes processed, volumes exported and imported, and to then
confirm that the resul�ng fresh volume supplied aligns with the Australian
market distribu�on channels (primarily the retail and foodservice channels). This
volume of fresh supply available to the Australian fresh marketplace is defined
using the equa�on:
Fresh Supply = Produc�on - Fresh Exports - Processing + Fresh Imports
The distribu�on channel modelling has drawn upon Freshlogic’s THRUChain
modelling system to ensure that fresh supply accommodates the sum volumes
distributed by retail and food service channels. In the process of this modelling,
informa�on has been gathered from a number of supply chain sources and
aligned with household consumer purchase metrics. The primary outputs are
designed around aligned supply chains that map the distribu�on of total
produc�on. This design was used to deliver the most informed and accurate
profiles and the outputs have been further confirmed by conferring with Industry
Representa�ve Bodies. The larger Industry Representa�ve Bodies have advanced
supply chain informa�on systems in place and the outputs from these systems
have been accessed to provide data inputs and validate findings.
In calcula�ng the produc�on and volume processed, a number of data sources
have been relied upon. Where available and in most instances, this has been
guided by informa�on from Australian government hor�cultural levies, and
refined through consulta�on with the Industry Representa�ve Bodies and major
trading stakeholders (such as processors, wholesalers and distributors) for the
par�cular category.
Informa�on on Australia’s imports and exports of fresh and processed
hor�cultural commodi�es has been compiled using the Global Trade Atlas®, an
online global trade informa�on database owned and operated by IHS Markit.
Informa�on on Australian trade in the Global Trade Atlas® has been compiled
2015/16 Australian Hor�culture
Sta�s�cs Handbook
24/05/2017
from informa�on provided to the Australian Customs and Border Protec�on
Service. The Import and Export analysis tables for each category iden�fy the
import source country under “Imports by country” and the export des�na�on
country under “Export by country”.
Informa�on on wholesale value has been modelled using wholesale pricing
informa�on from Ausmarket Consultants and the Chamber of Fruit and
Vegetable Industries in Western Australia. This informa�on has been used to
define the Value of Produc�on by removing known logis�cal, marke�ng and
wholesale costs to calculate the value of categories to producers at farm gate.
Consumer informa�on including percent of households purchasing a category,
and average purchase quan��es, has been sourced from Freshlogic’s MealpulseTM
consumer survey and DocketDataTM
systems. Supply per capita has been
calculated as total volume of fresh supply divided by popula�on for the year
ending June 2016 according to the ABS. The number of households are 8.3 million
and the popula�on was at 24.1 million*.
Data on produc�on area and number of trees has been gathered from Industry
Representa�ve Bodies and the ABS Agricultural Sta�s�cs informa�on**, the
largest survey of growers available. This informa�on has been included for
indica�ve purposes only, and should be viewed as such.
Informa�on on major growing regions has been sourced both from the ABS
Agricultural sta�s�cs, and through consulta�on with the major Industry
Representa�ve Bodies. These sources have also been used to profile seasonality
and produc�on volumes by state and by main variety of the category. Note the
informa�on on volume by state and main variety has been included for illustra�ve
purposes, and actual volumes may be within 10-25% of the listed volume.
Throughout the document when data sources have been relied upon, this has
been noted. Some of the more common sources have been abbreviated. The full
list of sources has been provided on pages 18 and 19.
*ABS, Australian Demographic Sta�s�cs 3101 & 2011 Census
**ABS, Agricultural Sta�s�cs 7121.0
17
Research Method
2015/16 Australian Hor�culture
Sta�s�cs Handbook
24/05/2017
18
Research Method
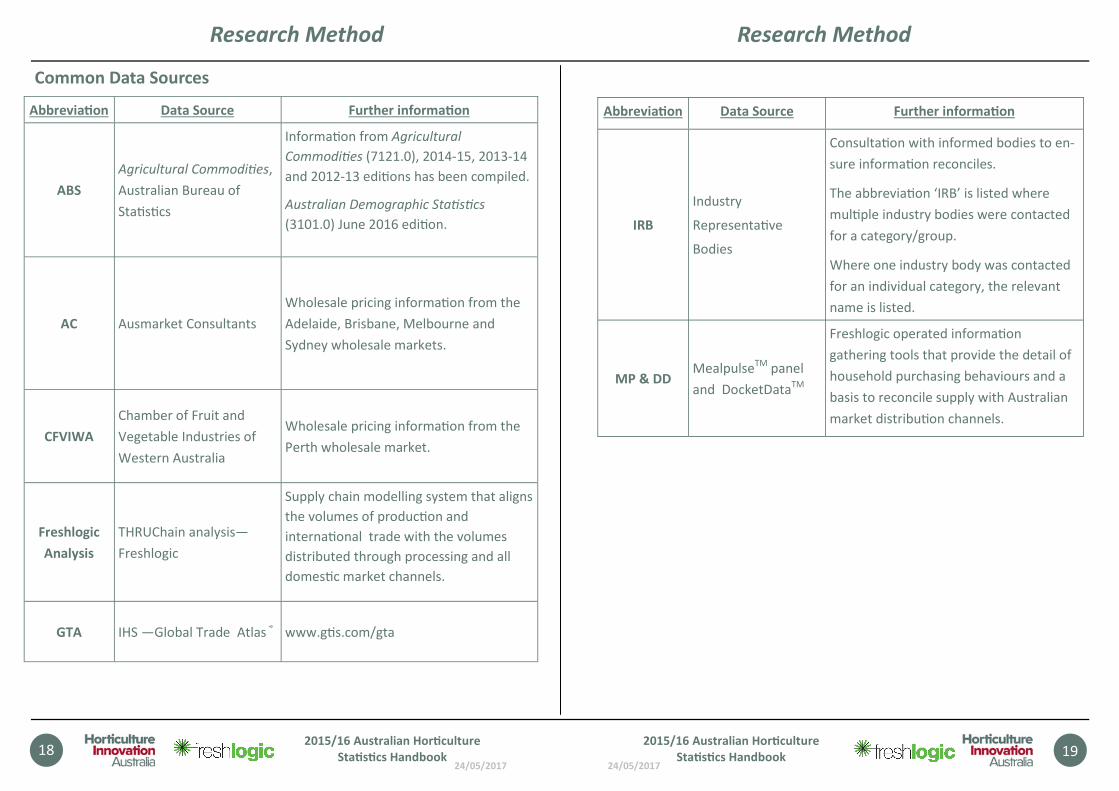
Common Data Sources
2015/16 Australian Hor�culture
Sta�s�cs Handbook
Abbrevia�on Data Source Further informa�on
ABS
Agricultural Commodi�es,
Australian Bureau of
Sta�s�cs
Informa�on from Agricultural
Commodi�es (7121.0), 2014-15, 2013-14
and 2012-13 edi�ons has been compiled.
Australian Demographic Sta�s�cs
(3101.0) June 2016 edi�on.
AC Ausmarket Consultants
Wholesale pricing informa�on from the
Adelaide, Brisbane, Melbourne and
Sydney wholesale markets.
CFVIWA
Chamber of Fruit and
Vegetable Industries of
Western Australia
Wholesale pricing informa�on from the
Perth wholesale market.
Freshlogic
Analysis
THRUChain analysis—
Freshlogic
Supply chain modelling system that aligns
the volumes of produc�on and
interna�onal trade with the volumes
distributed through processing and all
domes�c market channels.
GTA IHS —Global Trade Atlas® www.g�s.com/gta
24/05/2017
19
Research Method
2015/16 Australian Hor�culture
Sta�s�cs Handbook
Abbrevia�on Data Source Further informa�on
IRB
Industry
Representa�ve
Bodies
Consulta�on with informed bodies to en-
sure informa�on reconciles.
The abbrevia�on ‘IRB’ is listed where
mul�ple industry bodies were contacted
for a category/group.
Where one industry body was contacted
for an individual category, the relevant
name is listed.
MP & DD Mealpulse
TM panel
and DocketDataTM
Freshlogic operated informa�on
gathering tools that provide the detail of
household purchasing behaviours and a
basis to reconcile supply with Australian
market distribu�on channels.
24/05/2017
20
Data sharing-List of projects
2015/16 Australian Hor�culture
Sta�s�cs Handbook
Project Code Project Title
AL11005
(Almonds)
Australian almond
industry communica�ons
AL16003
(Almonds) Almond industry sta�s�cs
AP13035
(Apples)
Apple and pear
industry data collec�on
AP15008
(Apples) Data analysis—infoPome 3
AP16002
(Apples) Apple and pear crop es�mate
AV13003
(Avocados)
Australian avocado benchmarking program
development rounds II and III
AV15004
(Avocados)
Avocado data management and quality innova�on
extension program
BA11013
(Bananas)
Value of the Australian banana industry to regional and
na�onal economies
BA11026
(Bananas) Banana enterprise performance comparison—phase 3
CT13037
(Citrus)
Delivering robust citrus market informa�on for a more
compe��ve industry
CT14010
(Citrus) Delivering a na�onal citrus plan�ngs database - 2014
List of projects In addi�on to common data sources, a number of Hort Innova�on funded projects
have provided data outputs which have informed the informa�on provided in this
handbook. These are outlined in the table below. Hort Innova�on would like to
acknowledge their input.
24/05/2017
21
Data sharing-List of projects
2015/16 Australian Hor�culture
Sta�s�cs Handbook
Project Code Project Title
MC15009
(Macadamias) Macadamia crop forecas�ng 2015-2018
MG15003
(Mangoes)
Data collec�on to facilitate supply chain
transparency—Stage 3
MT14006
(Mul� Industry) Export—import market intelligence project 2014-2016
PI13006
(Pineapples)
Study groups enabling industry adap�on to pineapple
market changes (V)
VG12083
(Vegetables)
Understanding the nature, origins, volume and values of
vegetable imports
VG12090
(Vegetables)
Conveying the posi�ve social, sconomic, environmental
and other benefits of Australian vegetables
VG13068
(Vegetables)
Financial performance of Australian vegetable farms
2013-14 to 2015-16
MC15005
(Macadamias) Benchmarking the macadamia industry 2015-2018
CU15000
(Custard Apples) Custard apple dispatch system 2
24/05/2017
22
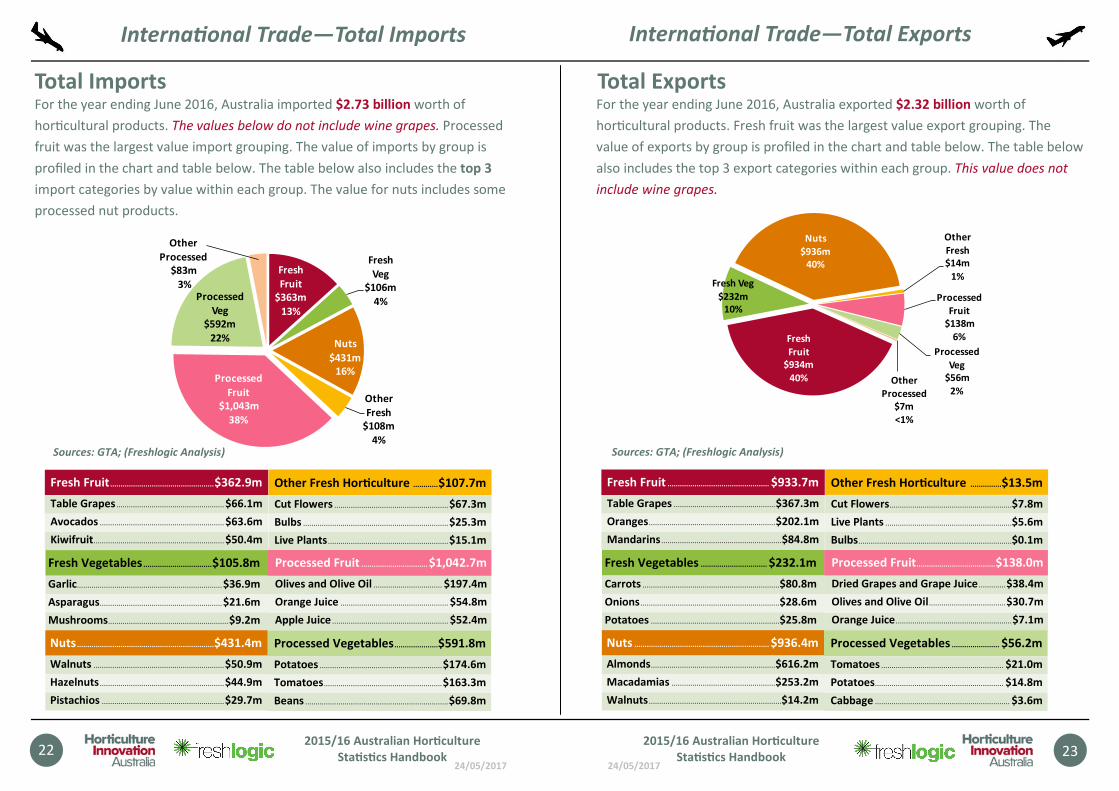
Total Imports For the year ending June 2016, Australia imported $2.73 billion worth of
hor�cultural products. The values below do not include wine grapes. Processed
fruit was the largest value import grouping. The value of imports by group is
profiled in the chart and table below. The table below also includes the top 3
import categories by value within each group. The value for nuts includes some
processed nut products.
Fresh
Fruit
$363m
13%
Fresh
Veg
$106m
4%
Nuts
$431m
16%
Other
Fresh
$108m
4%
Processed
Fruit
$1,043m
38%
Processed
Veg
$592m
22%
Other
Processed
$83m
3%
Interna�onal Trade—Total Imports
Sources: GTA; (Freshlogic Analysis)
2015/16 Australian Hor�culture
Sta�s�cs Handbook
Fresh Fruit .................................................. $362.9m
Table Grapes .................................................... $66.1m
Avocados ............................................................ $63.6m
Kiwifruit ............................................................... $50.4m
Fresh Vegetables ................................. $105.8m
Garlic...................................................................... $36.9m
Asparagus ........................................................... $21.6m
Mushrooms .......................................................... $9.2m
Nuts .................................................................. $431.4m
Walnuts ............................................................... $50.9m
Hazelnuts ............................................................ $44.9m
Pistachios ........................................................... $29.7m
Other Fresh Hor�culture ............ $107.7m
Cut Flowers ....................................................... $67.3m
Bulbs ...................................................................... $25.3m
Live Plants .......................................................... $15.1m
Processed Fruit ................................ $1,042.7m
Olives and Olive Oil ................................. $197.4m
Orange Juice .................................................... $54.8m
Apple Juice ........................................................ $52.4m
Processed Vegetables ..................... $591.8m
Potatoes ........................................................... $174.6m
Tomatoes ......................................................... $163.3m
Beans ..................................................................... $69.8m
24/05/2017
Total Exports For the year ending June 2016, Australia exported $2.32 billion worth of
hor�cultural products. Fresh fruit was the largest value export grouping. The
value of exports by group is profiled in the chart and table below. The table below
also includes the top 3 export categories within each group. This value does not
include wine grapes.
Fresh
Fruit
$934m
40%
Fresh Veg
$232m
10%
Nuts
$936m
40%
Other
Fresh
$14m
1%
Processed
Fruit
$138m
6%
Processed
Veg
$56m
2%Other
Processed
$7m
<1%
23
Interna�onal Trade—Total Exports
2015/16 Australian Hor�culture
Sta�s�cs Handbook
Fresh Fruit ................................................. $933.7m
Table Grapes ................................................. $367.3m
Oranges ............................................................. $202.1m
Mandarins .......................................................... $84.8m
Fresh Vegetables ................................ $232.1m
Carrots .................................................................. $80.8m
Onions ................................................................... $28.6m
Potatoes .............................................................. $25.8m
Nuts ................................................................. $936.4m
Almonds ............................................................ $616.2m
Macadamias .................................................. $253.2m
Walnuts ................................................................$14.2m
Other Fresh Hor�culture ............... $13.5m
Cut Flowers ...........................................................$7.8m
Live Plants .............................................................$5.6m
Bulbs ..........................................................................$0.1m
Processed Fruit ...................................... $138.0m
Dried Grapes and Grape Juice ............. $38.4m
Olives and Olive Oil ..................................... $30.7m
Orange Juice ........................................................ $7.1m
Processed Vegetables ....................... $56.2m
Tomatoes ........................................................... $21.0m
Potatoes .............................................................. $14.8m
Cabbage ................................................................. $3.6m
Sources: GTA; (Freshlogic Analysis)
24/05/2017
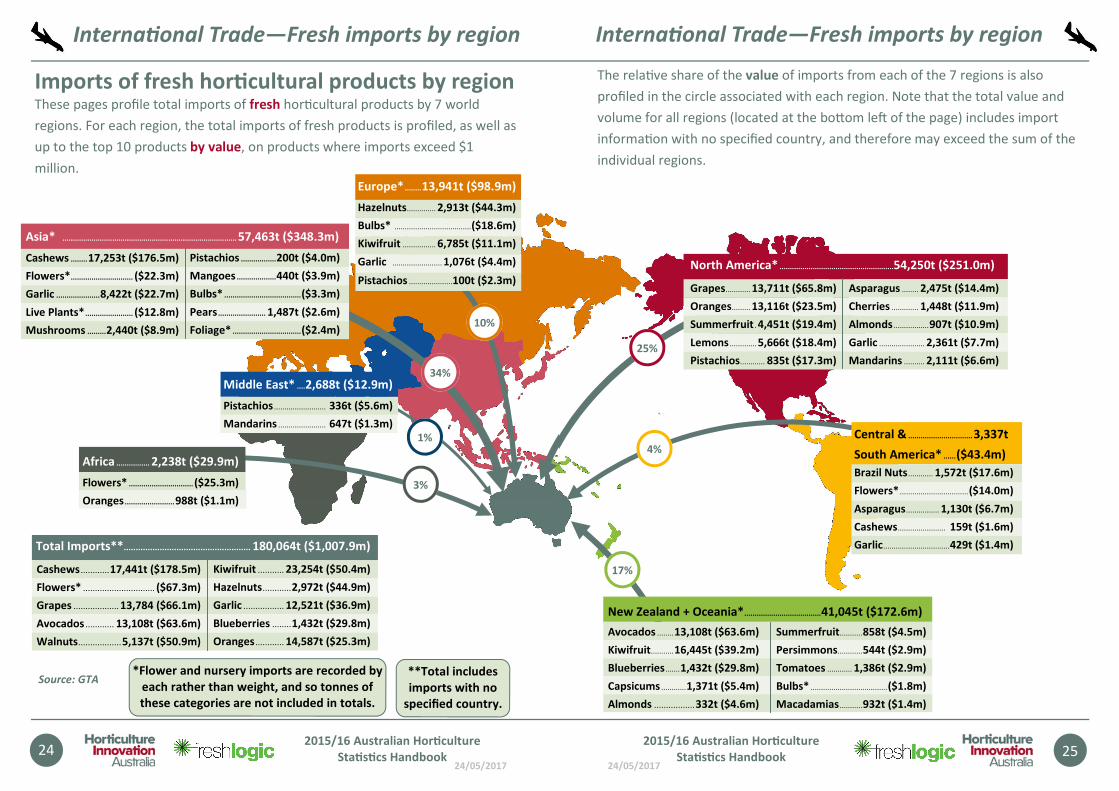
Imports of fresh hor�cultural products by region These pages profile total imports of fresh hor�cultural products by 7 world
regions. For each region, the total imports of fresh products is profiled, as well as
up to the top 10 products by value, on products where imports exceed $1
million.
Interna�onal Trade—Fresh imports by region
24
*Flower and nursery imports are recorded by
each rather than weight, and so tonnes of
these categories are not included in totals.
Total Imports**..................................................... 180,064t ($1,007.9m)
Cashews ............ 17,441t ($178.5m)
Flowers* .............................. ($67.3m)
Grapes ................... 13,784 ($66.1m)
Avocados ............ 13,108t ($63.6m)
Walnuts .................. 5,137t ($50.9m)
Kiwifruit ........... 23,254t ($50.4m)
Hazelnuts ............ 2,972t ($44.9m)
Garlic ................. 12,521t ($36.9m)
Blueberries ........ 1,432t ($29.8m)
Oranges ............ 14,587t ($25.3m)
Source: GTA
2015/16 Australian Hor�culture
Sta�s�cs Handbook
Middle East* .... 2,688t ($12.9m)
Pistachios ......................... 336t ($5.6m)
Mandarins ....................... 647t ($1.3m)
34%
10%
1%
3%
Asia* .................................................................................... 57,463t ($348.3m)
Cashews ........ 17,253t ($176.5m)
Flowers* .............................. ($22.3m)
Garlic ..................... 8,422t ($22.7m)
Live Plants* ....................... ($12.8m)
Mushrooms ......... 2,440t ($8.9m)
Pistachios ................. 200t ($4.0m)
Mangoes ................... 440t ($3.9m)
Bulbs* ..................................... ($3.3m)
Pears ....................... 1,487t ($2.6m)
Foliage* ................................. ($2.4m)
Europe* ........ 13,941t ($98.9m)
Hazelnuts.............. 2,913t ($44.3m)
Bulbs* ..................................... ($18.6m)
Kiwifruit ................ 6,785t ($11.1m)
Garlic ........................ 1,076t ($4.4m)
Pistachios .....................100t ($2.3m)
**Total includes
imports with no
specified country.
Africa ................ 2,238t ($29.9m)
Flowers* ............................... ($25.3m)
Oranges ........................ 988t ($1.1m)
24/05/2017
The rela�ve share of the value of imports from each of the 7 regions is also
profiled in the circle associated with each region. Note that the total value and
volume for all regions (located at the bo om leG of the page) includes import
informa�on with no specified country, and therefore may exceed the sum of the
individual regions.
Interna�onal Trade—Fresh imports by region
25
17%
Central & ............................... 3,337t
South America* ...... ($43.4m)
Brazil Nuts ............ 1,572t ($17.6m)
Flowers* ................................. ($14.0m)
Asparagus ................ 1,130t ($6.7m)
Cashews ....................... 159t ($1.6m)
Garlic ................................ 429t ($1.4m)
2015/16 Australian Hor�culture
Sta�s�cs Handbook
North America* .......................................................54,250t ($251.0m)
Grapes ............ 13,711t ($65.8m)
Oranges ......... 13,116t ($23.5m)
Summerfruit . 4,451t ($19.4m)
Lemons ............. 5,666t ($18.4m)
Pistachios............ 835t ($17.3m)
Asparagus ........ 2,475t ($14.4m)
Cherries ............. 1,448t ($11.9m)
Almonds ................. 907t ($10.9m)
Garlic ...................... 2,361t ($7.7m)
Mandarins .......... 2,111t ($6.6m)
New Zealand + Oceania* ..................................... 41,045t ($172.6m)
Avocados ........ 13,108t ($63.6m)
Kiwifruit........... 16,445t ($39.2m)
Blueberries ....... 1,432t ($29.8m)
Capsicums ............ 1,371t ($5.4m)
Almonds ................. 332t ($4.6m)
Summerfruit ........... 858t ($4.5m)
Persimmons............ 544t ($2.9m)
Tomatoes ............ 1,386t ($2.9m)
Bulbs* ..................................... ($1.8m)
Macadamias ........... 932t ($1.4m)
25%
4%
24/05/2017
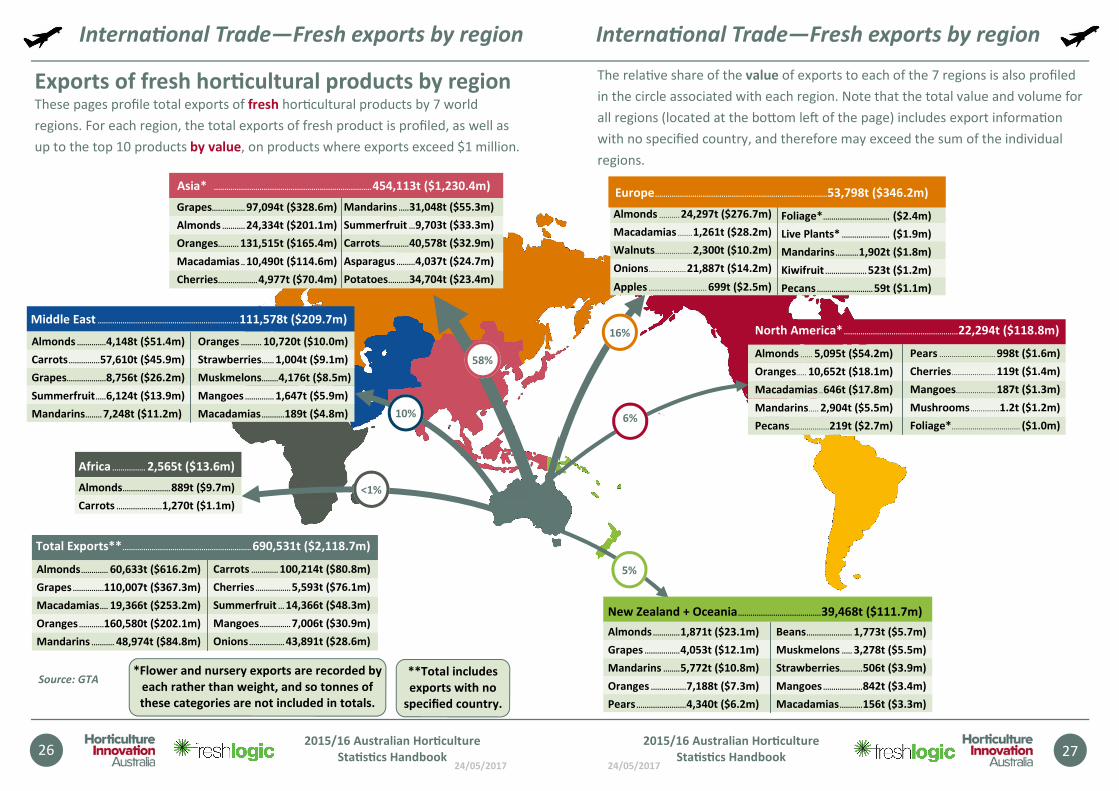
Interna�onal Trade—Fresh exports by region
26
Exports of fresh hor�cultural products by region These pages profile total exports of fresh hor�cultural products by 7 world
regions. For each region, the total exports of fresh product is profiled, as well as
up to the top 10 products by value, on products where exports exceed $1 million.
Total Exports** .............................................................. 690,531t ($2,118.7m)
Almonds ............. 60,633t ($616.2m)
Grapes ...............110,007t ($367.3m)
Macadamias .... 19,366t ($253.2m)
Oranges ............160,580t ($202.1m)
Mandarins ........... 48,974t ($84.8m)
Carrots ............. 100,214t ($80.8m)
Cherries ................. 5,593t ($76.1m)
Summerfruit ... 14,366t ($48.3m)
Mangoes ............... 7,006t ($30.9m)
Onions ................. 43,891t ($28.6m)
Source: GTA *Flower and nursery exports are recorded by
each rather than weight, and so tonnes of
these categories are not included in totals.
2015/16 Australian Hor�culture
Sta�s�cs Handbook
**Total includes
exports with no
specified country.
Middle East .................................................................... 111,578t ($209.7m)
Almonds .............. 4,148t ($51.4m)
Carrots ............... 57,610t ($45.9m)
Grapes................... 8,756t ($26.2m)
Summerfruit ..... 6,124t ($13.9m)
Mandarins ........ 7,248t ($11.2m)
Oranges .......... 10,720t ($10.0m)
Strawberries ...... 1,004t ($9.1m)
Muskmelons........ 4,176t ($8.5m)
Mangoes .............. 1,647t ($5.9m)
Macadamias ........... 189t ($4.8m)
Asia* ............................................................................ 454,113t ($1,230.4m)
Grapes................ 97,094t ($328.6m)
Almonds ........... 24,334t ($201.1m)
Oranges.......... 131,515t ($165.4m)
Macadamias .. 10,490t ($114.6m)
Cherries ................... 4,977t ($70.4m)
Mandarins ..... 31,048t ($55.3m)
Summerfruit ... 9,703t ($33.3m)
Carrots.............. 40,578t ($32.9m)
Asparagus ......... 4,037t ($24.7m)
Potatoes .......... 34,704t ($23.4m)
58%
10%
<1%
Africa ................ 2,565t ($13.6m)
Almonds....................... 889t ($9.7m)
Carrots ...................... 1,270t ($1.1m)
24/05/2017
The rela�ve share of the value of exports to each of the 7 regions is also profiled
in the circle associated with each region. Note that the total value and volume for
all regions (located at the bo om leG of the page) includes export informa�on
with no specified country, and therefore may exceed the sum of the individual
regions.
Interna�onal Trade—Fresh exports by region
27
5%
6%
2015/16 Australian Hor�culture
Sta�s�cs Handbook
New Zealand + Oceania ........................................ 39,468t ($111.7m)
Almonds ............. 1,871t ($23.1m)
Grapes ................. 4,053t ($12.1m)
Mandarins ........ 5,772t ($10.8m)
Oranges ................. 7,188t ($7.3m)
Pears ........................ 4,340t ($6.2m)
Beans ...................... 1,773t ($5.7m)
Muskmelons ..... 3,278t ($5.5m)
Strawberries........... 506t ($3.9m)
Mangoes ................... 842t ($3.4m)
Macadamias ........... 156t ($3.3m)
16%
Europe ................................................................................... 53,798t ($346.2m)
Almonds .......... 24,297t ($276.7m)
Macadamias ....... 1,261t ($28.2m)
Walnuts.................. 2,300t ($10.2m)
Onions .................. 21,887t ($14.2m)
Apples ............................ 699t ($2.5m)
Foliage* ................................ ($2.4m)
Live Plants* ....................... ($1.9m)
Mandarins ........... 1,902t ($1.8m)
Kiwifruit .................... 523t ($1.2m)
Pecans ........................... 59t ($1.1m)
North America* ....................................................... 22,294t ($118.8m)
Almonds ...... 5,095t ($54.2m)
Oranges..... 10,652t ($18.1m)
Macadamias .. 646t ($17.8m)
Mandarins ..... 2,904t ($5.5m)
Pecans ................... 219t ($2.7m)
Pears ........................... 998t ($1.6m)
Cherries ..................... 119t ($1.4m)
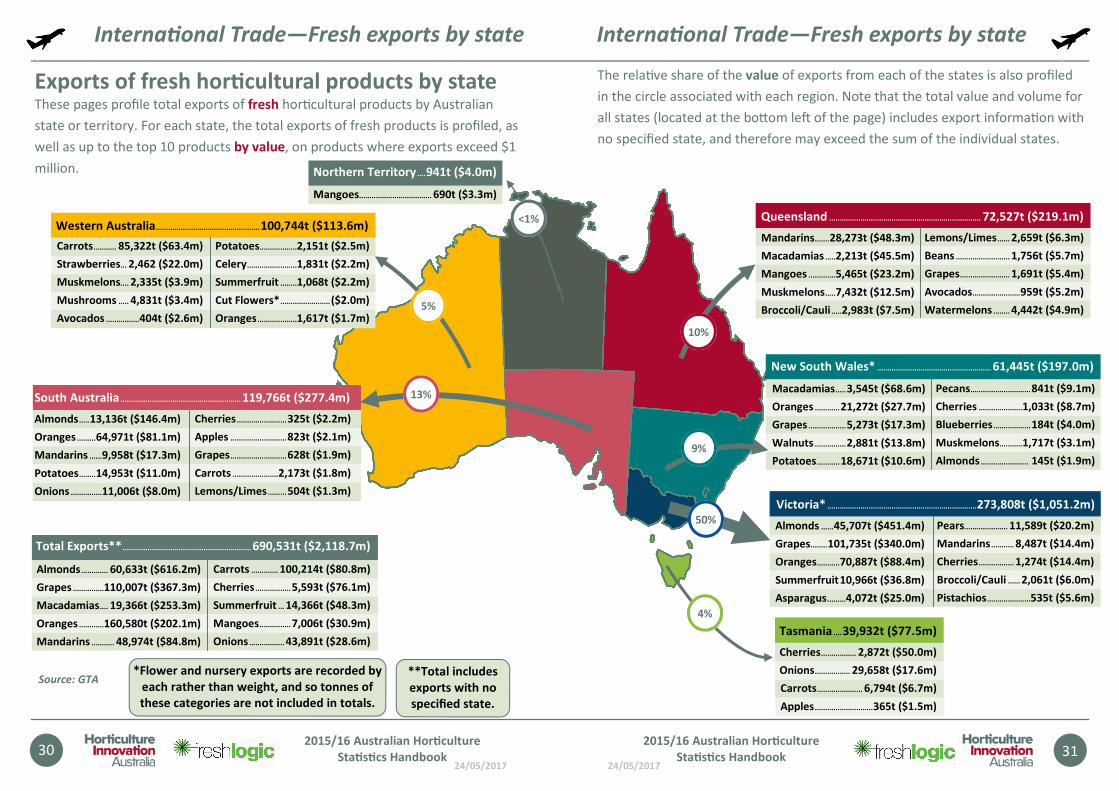
Mangoes ................... 187t ($1.3m)
Mushrooms .............. 1.2t ($1.2m)
Foliage* ................................. ($1.0m)
24/05/2017
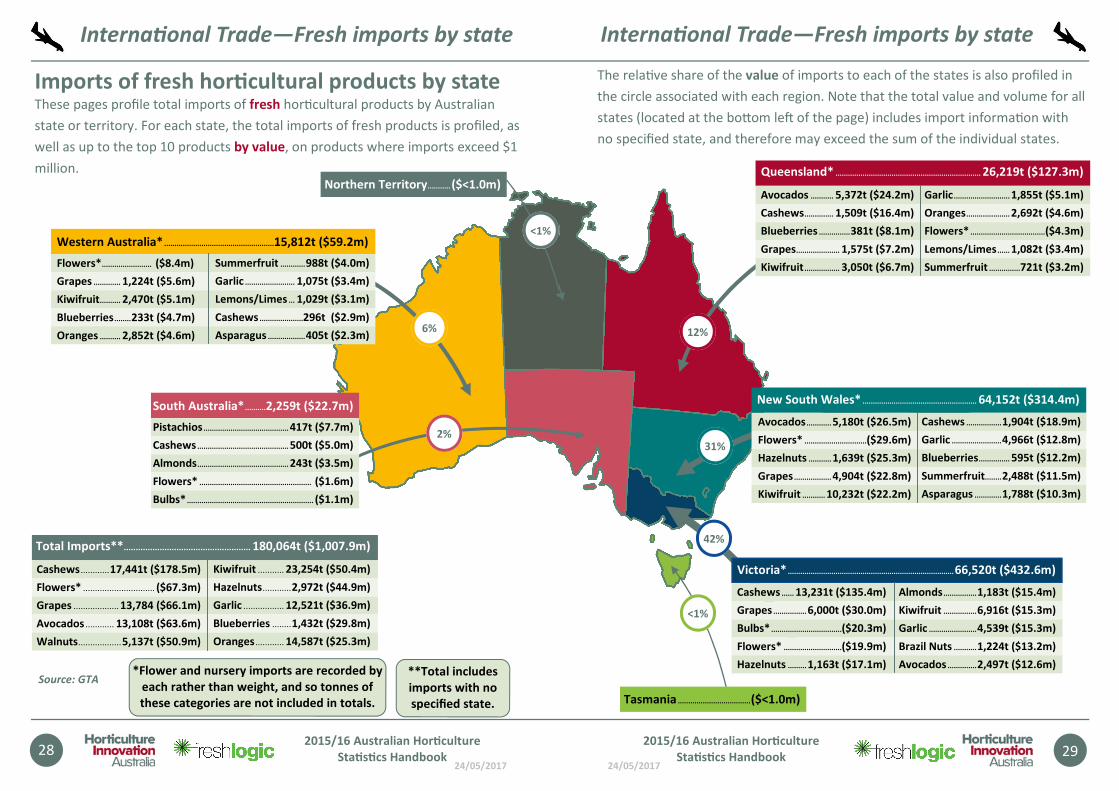
Interna�onal Trade—Fresh imports by state
South Australia* .......... 2,259t ($22.7m)
Pistachios ......................................... 417t ($7.7m)
Cashews ............................................ 500t ($5.0m)
Almonds ............................................ 243t ($3.5m)
Flowers* ...................................................... ($1.6m)
Bulbs* ............................................................. ($1.1m)
28
Imports of fresh hor�cultural products by state These pages profile total imports of fresh hor�cultural products by Australian
state or territory. For each state, the total imports of fresh products is profiled, as
well as up to the top 10 products by value, on products where imports exceed $1
million.
Source: GTA
Western Australia* .....................................................15,812t ($59.2m)
Flowers* ........................ ($8.4m)
Grapes ............. 1,224t ($5.6m)
Kiwifruit.......... 2,470t ($5.1m)
Blueberries ........ 233t ($4.7m)
Oranges .......... 2,852t ($4.6m)
Summerfruit ............ 988t ($4.0m)
Garlic ........................ 1,075t ($3.4m)
Lemons/Limes ... 1,029t ($3.1m)
Cashews .....................296t ($2.9m)
Asparagus .................. 405t ($2.3m) 6%
2%
*Flower and nursery imports are recorded by
each rather than weight, and so tonnes of
these categories are not included in totals.
2015/16 Australian Hor�culture
Sta�s�cs Handbook
Northern Territory ........... ($<1.0m)
**Total includes
imports with no
specified state.
Total Imports**..................................................... 180,064t ($1,007.9m)
Cashews ............ 17,441t ($178.5m)
Flowers* .............................. ($67.3m)
Grapes ................... 13,784 ($66.1m)
Avocados ............ 13,108t ($63.6m)
Walnuts .................. 5,137t ($50.9m)
Kiwifruit ........... 23,254t ($50.4m)
Hazelnuts ............ 2,972t ($44.9m)
Garlic ................. 12,521t ($36.9m)
Blueberries ........ 1,432t ($29.8m)
Oranges ............ 14,587t ($25.3m)
<1%
24/05/2017
The rela�ve share of the value of imports to each of the states is also profiled in
the circle associated with each region. Note that the total value and volume for all
states (located at the bo om leG of the page) includes import informa�on with
no specified state, and therefore may exceed the sum of the individual states.
Interna�onal Trade—Fresh imports by state
29
Queensland* ...................................................................... 26,219t ($127.3m)
Avocados ........... 5,372t ($24.2m)
Cashews .............. 1,509t ($16.4m)
Blueberries ............... 381t ($8.1m)
Grapes ..................... 1,575t ($7.2m)
Kiwifruit ................. 3,050t ($6.7m)
Garlic ........................... 1,855t ($5.1m)
Oranges ..................... 2,692t ($4.6m)
Flowers* .................................... ($4.3m)
Lemons/Limes ...... 1,082t ($3.4m)
Summerfruit ...............721t ($3.2m)
12%
2015/16 Australian Hor�culture
Sta�s�cs Handbook
New South Wales* ....................................................... 64,152t ($314.4m)
Avocados ............ 5,180t ($26.5m)
Flowers* ..............................($29.6m)
Hazelnuts ........... 1,639t ($25.3m)
Grapes .................. 4,904t ($22.8m)
Kiwifruit ........... 10,232t ($22.2m)
Cashews ................. 1,904t ($18.9m)
Garlic ........................ 4,966t ($12.8m)
Blueberries ............... 595t ($12.2m)
Summerfruit........ 2,488t ($11.5m)
Asparagus ............. 1,788t ($10.3m)
31%
Victoria* ................................................................................ 66,520t ($432.6m)
Cashews ...... 13,231t ($135.4m)
Grapes ................ 6,000t ($30.0m)
Bulbs* ..................................($20.3m)
Flowers* ............................($19.9m)
Hazelnuts ......... 1,163t ($17.1m)
Almonds ................ 1,183t ($15.4m)
Kiwifruit ................ 6,916t ($15.3m)
Garlic ....................... 4,539t ($15.3m)
Brazil Nuts ........... 1,224t ($13.2m)
Avocados .............. 2,497t ($12.6m)
42%
Tasmania ................................... ($<1.0m)
<1%
24/05/2017
Interna�onal Trade—Fresh exports by state
30
Source: GTA
Exports of fresh hor�cultural products by state These pages profile total exports of fresh hor�cultural products by Australian
state or territory. For each state, the total exports of fresh products is profiled, as
well as up to the top 10 products by value, on products where exports exceed $1
million.
Northern Territory .... 941t ($4.0m)
Mangoes ................................... 690t ($3.3m)
Western Australia .................................................. 100,744t ($113.6m)
Carrots ........... 85,322t ($63.4m)
Strawberries ... 2,462 ($22.0m)
Muskmelons.... 2,335t ($3.9m)
Mushrooms ..... 4,831t ($3.4m)
Avocados ................ 404t ($2.6m)
Potatoes..................2,151t ($2.5m)
Celery ........................1,831t ($2.2m)
Summerfruit ........1,068t ($2.2m)
Cut Flowers* ........................ ($2.0m)
Oranges ...................1,617t ($1.7m)
5%
**Total includes
exports with no
specified state.
*Flower and nursery exports are recorded by
each rather than weight, and so tonnes of
these categories are not included in totals.
2015/16 Australian Hor�culture
Sta�s�cs Handbook
South Australia .......................................................... 119,766t ($277.4m)
Almonds ..... 13,136t ($146.4m)
Oranges ......... 64,971t ($81.1m)
Mandarins ...... 9,958t ($17.3m)
Potatoes ........ 14,953t ($11.0m)
Onions ............... 11,006t ($8.0m)
Cherries ........................ 325t ($2.2m)
Apples ........................... 823t ($2.1m)
Grapes ........................... 628t ($1.9m)
Carrots ...................... 2,173t ($1.8m)
Lemons/Limes ......... 504t ($1.3m)
13%
<1%
Total Exports** .............................................................. 690,531t ($2,118.7m)
Almonds ............. 60,633t ($616.2m)
Grapes ...............110,007t ($367.3m)
Macadamias .... 19,366t ($253.3m)
Oranges ............160,580t ($202.1m)
Mandarins ........... 48,974t ($84.8m)
Carrots ............. 100,214t ($80.8m)
Cherries ................. 5,593t ($76.1m)
Summerfruit ... 14,366t ($48.3m)
Mangoes ............... 7,006t ($30.9m)
Onions ................. 43,891t ($28.6m)
24/05/2017
The rela�ve share of the value of exports from each of the states is also profiled
in the circle associated with each region. Note that the total value and volume for
all states (located at the bo om leG of the page) includes export informa�on with
no specified state, and therefore may exceed the sum of the individual states.
Interna�onal Trade—Fresh exports by state
31
Victoria* ........................................................................ 273,808t ($1,051.2m)
Almonds ...... 45,707t ($451.4m)
Grapes ........ 101,735t ($340.0m)
Oranges ........... 70,887t ($88.4m)
Summerfruit 10,966t ($36.8m)
Asparagus .........4,072t ($25.0m)
Pears..................... 11,589t ($20.2m)
Mandarins ........... 8,487t ($14.4m)
Cherries ................. 1,274t ($14.4m)
Broccoli/Cauli ...... 2,061t ($6.0m)
Pistachios .....................535t ($5.6m)
Queensland ......................................................................... 72,527t ($219.1m)
Mandarins ....... 28,273t ($48.3m)
Macadamias ..... 2,213t ($45.5m)
Mangoes ............. 5,465t ($23.2m)
Muskmelons ..... 7,432t ($12.5m)
Broccoli/Cauli .....2,983t ($7.5m)
Lemons/Limes ...... 2,659t ($6.3m)
Beans .......................... 1,756t ($5.7m)
Grapes ........................ 1,691t ($5.4m)
Avocados....................... 959t ($5.2m)
Watermelons ........ 4,442t ($4.9m)
10%
50%
2015/16 Australian Hor�culture
Sta�s�cs Handbook
New South Wales* ....................................................... 61,445t ($197.0m)
Macadamias ..... 3,545t ($68.6m)
Oranges ............ 21,272t ($27.7m)
Grapes .................. 5,273t ($17.3m)
Walnuts ............... 2,881t ($13.8m)
Potatoes ........... 18,671t ($10.6m)
Pecans ............................. 841t ($9.1m)
Cherries ..................... 1,033t ($8.7m)
Blueberries .................. 184t ($4.0m)
Muskmelons........... 1,717t ($3.1m)
Almonds ....................... 145t ($1.9m) 9%
4%
Tasmania .... 39,932t ($77.5m)
Cherries ................. 2,872t ($50.0m)
Onions ................. 29,658t ($17.6m)
Carrots ...................... 6,794t ($6.7m)
Apples ............................ 365t ($1.5m)
24/05/2017
32
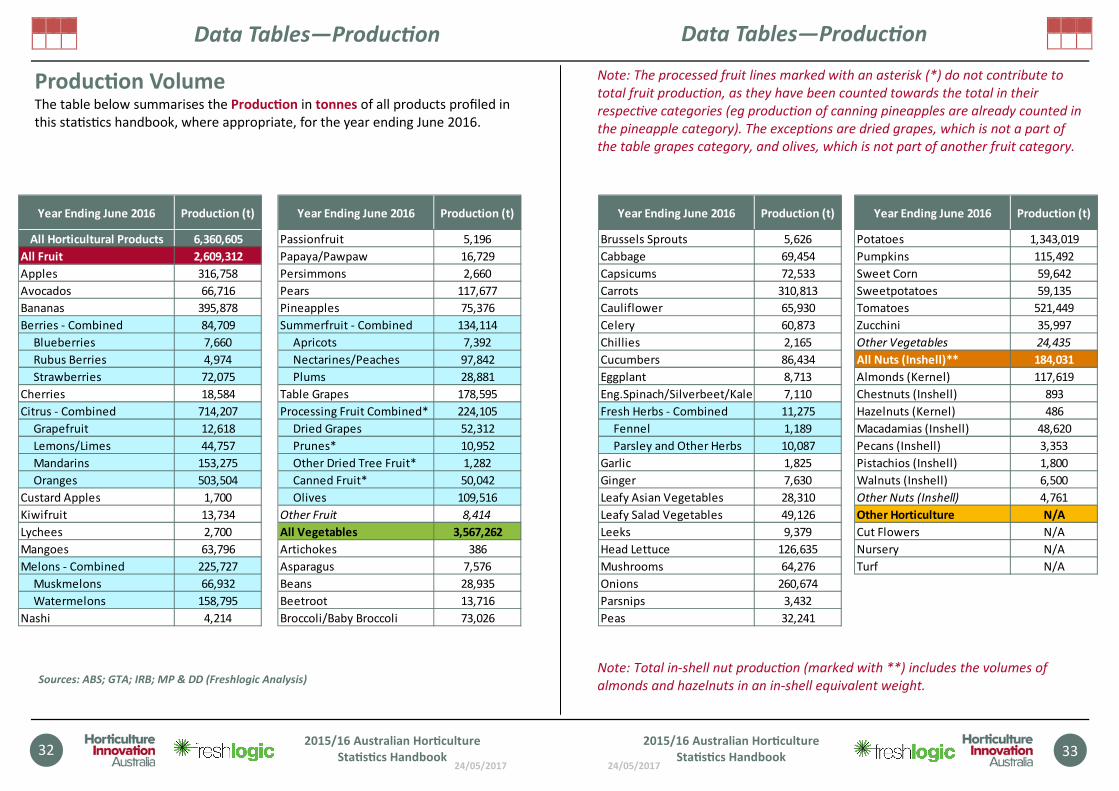
Data Tables—Produc�on
Produc�on Volume The table below summarises the Produc�on in tonnes of all products profiled in
this sta�s�cs handbook, where appropriate, for the year ending June 2016.
Sources: ABS; GTA; IRB; MP & DD (Freshlogic Analysis)
2015/16 Australian Hor�culture
Sta�s�cs Handbook
Year Ending June 2016 Production (t)
All Horticultural Products 6,360,605
All Fruit 2,609,312
Apples 316,758
Avocados 66,716
Bananas 395,878
Berries - Combined 84,709
Blueberries 7,660
Rubus Berries 4,974
Strawberries 72,075
Cherries 18,584
Citrus - Combined 714,207
Grapefruit 12,618
Lemons/Limes 44,757
Mandarins 153,275
Oranges 503,504
Custard Apples 1,700
Kiwifruit 13,734
Lychees 2,700
Mangoes 63,796
Melons - Combined 225,727
Muskmelons 66,932
Watermelons 158,795
Nashi 4,214
Year Ending June 2016 Production (t)
Passionfruit 5,196
Papaya/Pawpaw 16,729
Persimmons 2,660
Pears 117,677
Pineapples 75,376
Summerfruit - Combined 134,114
Apricots 7,392
Nectarines/Peaches 97,842
Plums 28,881
Table Grapes 178,595
Processing Fruit Combined* 224,105
Dried Grapes 52,312
Prunes* 10,952
Other Dried Tree Fruit* 1,282
Canned Fruit* 50,042
Olives 109,516
Other Fruit 8,414
All Vegetables 3,567,262
Artichokes 386
Asparagus 7,576
Beans 28,935
Beetroot 13,716
Broccoli/Baby Broccoli 73,026
24/05/2017
Note: The processed fruit lines marked with an asterisk (*) do not contribute to
total fruit produc�on, as they have been counted towards the total in their
respec�ve categories (eg produc�on of canning pineapples are already counted in
the pineapple category). The excep�ons are dried grapes, which is not a part of
the table grapes category, and olives, which is not part of another fruit category.
Note: Total in-shell nut produc�on (marked with **) includes the volumes of
almonds and hazelnuts in an in-shell equivalent weight.
33
Data Tables—Produc�on
2015/16 Australian Hor�culture
Sta�s�cs Handbook
Year Ending June 2016 Production (t)
Brussels Sprouts 5,626
Cabbage 69,454
Capsicums 72,533
Carrots 310,813
Cauliflower 65,930
Celery 60,873
Chillies 2,165
Cucumbers 86,434
Eggplant 8,713
Eng.Spinach/Silverbeet/Kale 7,110
Fresh Herbs - Combined 11,275
Fennel 1,189
Parsley and Other Herbs 10,087
Garlic 1,825
Ginger 7,630
Leafy Asian Vegetables 28,310
Leafy Salad Vegetables 49,126
Leeks 9,379
Head Lettuce 126,635
Mushrooms 64,276
Onions 260,674
Parsnips 3,432
Peas 32,241
Year Ending June 2016 Production (t)
Potatoes 1,343,019
Pumpkins 115,492
Sweet Corn 59,642
Sweetpotatoes 59,135
Tomatoes 521,449
Zucchini 35,997
Other Vegetables 24,435
All Nuts (Inshell)** 184,031
Almonds (Kernel) 117,619
Chestnuts (Inshell) 893
Hazelnuts (Kernel) 486
Macadamias (Inshell) 48,620
Pecans (Inshell) 3,353
Pistachios (Inshell) 1,800
Walnuts (Inshell) 6,500
Other Nuts (Inshell) 4,761
Other Horticulture N/A
Cut Flowers N/A
Nursery N/A
Turf N/A
24/05/2017
34
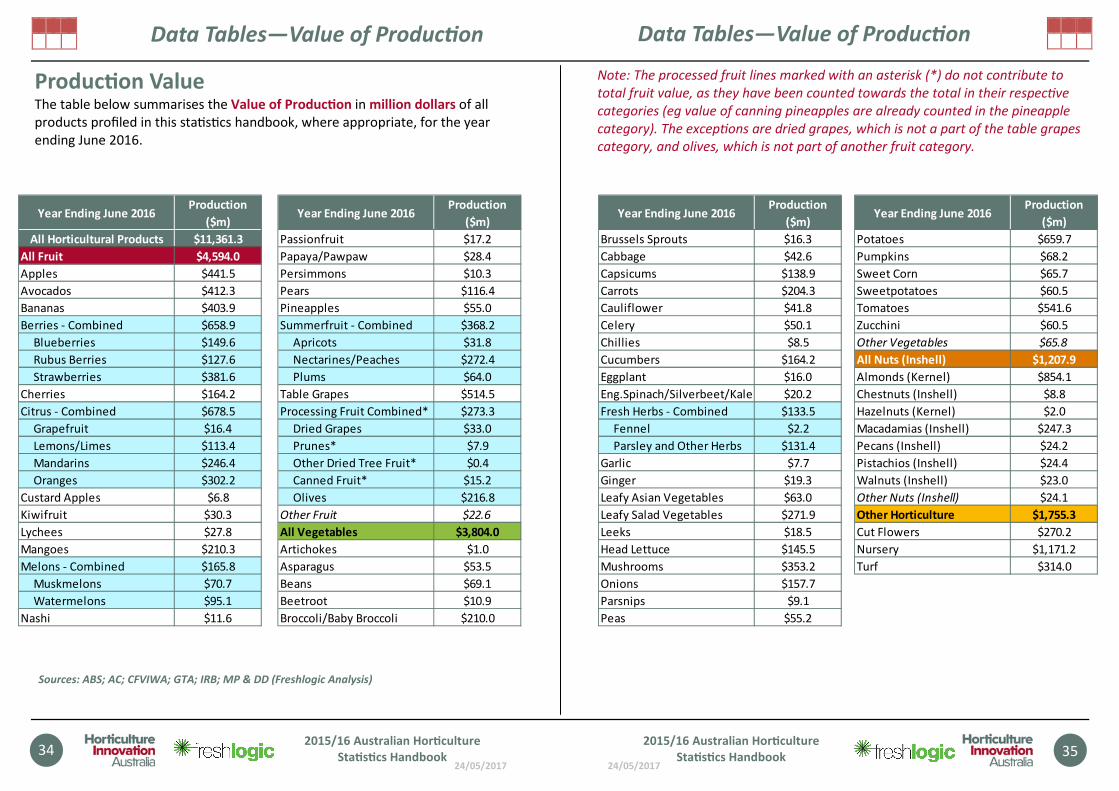
Data Tables—Value of Produc�on
Produc�on Value The table below summarises the Value of Produc�on in million dollars of all
products profiled in this sta�s�cs handbook, where appropriate, for the year
ending June 2016.
Sources: ABS; AC; CFVIWA; GTA; IRB; MP & DD (Freshlogic Analysis)
2015/16 Australian Hor�culture
Sta�s�cs Handbook
Year Ending June 2016Production
($m)
All Horticultural Products $11,361.3
All Fruit $4,594.0
Apples $441.5
Avocados $412.3
Bananas $403.9
Berries - Combined $658.9
Blueberries $149.6
Rubus Berries $127.6
Strawberries $381.6
Cherries $164.2
Citrus - Combined $678.5
Grapefruit $16.4
Lemons/Limes $113.4
Mandarins $246.4
Oranges $302.2
Custard Apples $6.8
Kiwifruit $30.3
Lychees $27.8
Mangoes $210.3
Melons - Combined $165.8
Muskmelons $70.7
Watermelons $95.1
Nashi $11.6
Year Ending June 2016Production
($m)
Passionfruit $17.2
Papaya/Pawpaw $28.4
Persimmons $10.3
Pears $116.4
Pineapples $55.0
Summerfruit - Combined $368.2
Apricots $31.8
Nectarines/Peaches $272.4
Plums $64.0
Table Grapes $514.5
Processing Fruit Combined* $273.3
Dried Grapes $33.0
Prunes* $7.9
Other Dried Tree Fruit* $0.4
Canned Fruit* $15.2
Olives $216.8
Other Fruit $22.6
All Vegetables $3,804.0
Artichokes $1.0
Asparagus $53.5
Beans $69.1
Beetroot $10.9
Broccoli/Baby Broccoli $210.0
24/05/2017
Note: The processed fruit lines marked with an asterisk (*) do not contribute to
total fruit value, as they have been counted towards the total in their respec�ve
categories (eg value of canning pineapples are already counted in the pineapple
category). The excep�ons are dried grapes, which is not a part of the table grapes
category, and olives, which is not part of another fruit category.
35
Data Tables—Value of Produc�on
2015/16 Australian Hor�culture
Sta�s�cs Handbook
Year Ending June 2016Production
($m)
Brussels Sprouts $16.3
Cabbage $42.6
Capsicums $138.9
Carrots $204.3
Cauliflower $41.8
Celery $50.1
Chillies $8.5
Cucumbers $164.2
Eggplant $16.0
Eng.Spinach/Silverbeet/Kale $20.2
Fresh Herbs - Combined $133.5
Fennel $2.2
Parsley and Other Herbs $131.4
Garlic $7.7
Ginger $19.3
Leafy Asian Vegetables $63.0
Leafy Salad Vegetables $271.9
Leeks $18.5
Head Lettuce $145.5
Mushrooms $353.2
Onions $157.7
Parsnips $9.1
Peas $55.2
Year Ending June 2016Production
($m)
Potatoes $659.7
Pumpkins $68.2
Sweet Corn $65.7
Sweetpotatoes $60.5
Tomatoes $541.6
Zucchini $60.5
Other Vegetables $65.8
All Nuts (Inshell) $1,207.9
Almonds (Kernel) $854.1
Chestnuts (Inshell) $8.8
Hazelnuts (Kernel) $2.0
Macadamias (Inshell) $247.3
Pecans (Inshell) $24.2
Pistachios (Inshell) $24.4
Walnuts (Inshell) $23.0
Other Nuts (Inshell) $24.1
Other Horticulture $1,755.3
Cut Flowers $270.2
Nursery $1,171.2
Turf $314.0
24/05/2017
36
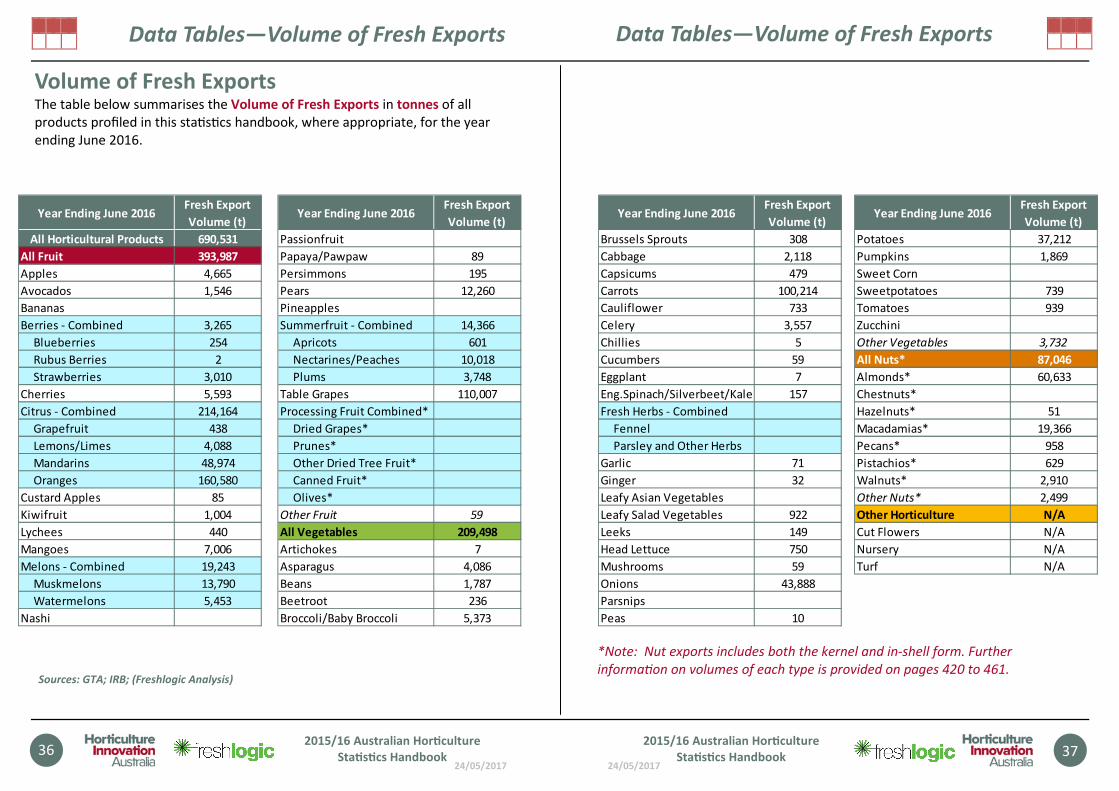
Data Tables—Volume of Fresh Exports
Volume of Fresh Exports The table below summarises the Volume of Fresh Exports in tonnes of all
products profiled in this sta�s�cs handbook, where appropriate, for the year
ending June 2016.
Sources: GTA; IRB; (Freshlogic Analysis)
2015/16 Australian Hor�culture
Sta�s�cs Handbook
Year Ending June 2016Fresh Export
Volume (t)
All Horticultural Products 690,531
All Fruit 393,987
Apples 4,665
Avocados 1,546
Bananas
Berries - Combined 3,265
Blueberries 254
Rubus Berries 2
Strawberries 3,010
Cherries 5,593
Citrus - Combined 214,164
Grapefruit 438
Lemons/Limes 4,088
Mandarins 48,974
Oranges 160,580
Custard Apples 85
Kiwifruit 1,004
Lychees 440
Mangoes 7,006
Melons - Combined 19,243
Muskmelons 13,790
Watermelons 5,453
Nashi
Year Ending June 2016Fresh Export
Volume (t)
Passionfruit
Papaya/Pawpaw 89
Persimmons 195
Pears 12,260
Pineapples
Summerfruit - Combined 14,366
Apricots 601
Nectarines/Peaches 10,018
Plums 3,748
Table Grapes 110,007
Processing Fruit Combined*
Dried Grapes*
Prunes*
Other Dried Tree Fruit*
Canned Fruit*
Olives*
Other Fruit 59
All Vegetables 209,498
Artichokes 7
Asparagus 4,086
Beans 1,787
Beetroot 236
Broccoli/Baby Broccoli 5,373
24/05/2017
*Note: Nut exports includes both the kernel and in-shell form. Further
informa�on on volumes of each type is provided on pages 420 to 461.
37
Data Tables—Volume of Fresh Exports
2015/16 Australian Hor�culture
Sta�s�cs Handbook
Year Ending June 2016Fresh Export
Volume (t)
Brussels Sprouts 308
Cabbage 2,118
Capsicums 479
Carrots 100,214
Cauliflower 733
Celery 3,557
Chillies 5
Cucumbers 59
Eggplant 7
Eng.Spinach/Silverbeet/Kale 157
Fresh Herbs - Combined
Fennel
Parsley and Other Herbs
Garlic 71
Ginger 32
Leafy Asian Vegetables
Leafy Salad Vegetables 922
Leeks 149
Head Lettuce 750
Mushrooms 59
Onions 43,888
Parsnips
Peas 10
Year Ending June 2016Fresh Export
Volume (t)
Potatoes 37,212
Pumpkins 1,869
Sweet Corn
Sweetpotatoes 739
Tomatoes 939
Zucchini
Other Vegetables 3,732
All Nuts* 87,046
Almonds* 60,633
Chestnuts*
Hazelnuts* 51
Macadamias* 19,366
Pecans* 958
Pistachios* 629
Walnuts* 2,910
Other Nuts* 2,499
Other Horticulture N/A
Cut Flowers N/A
Nursery N/A
Turf N/A
24/05/2017
38
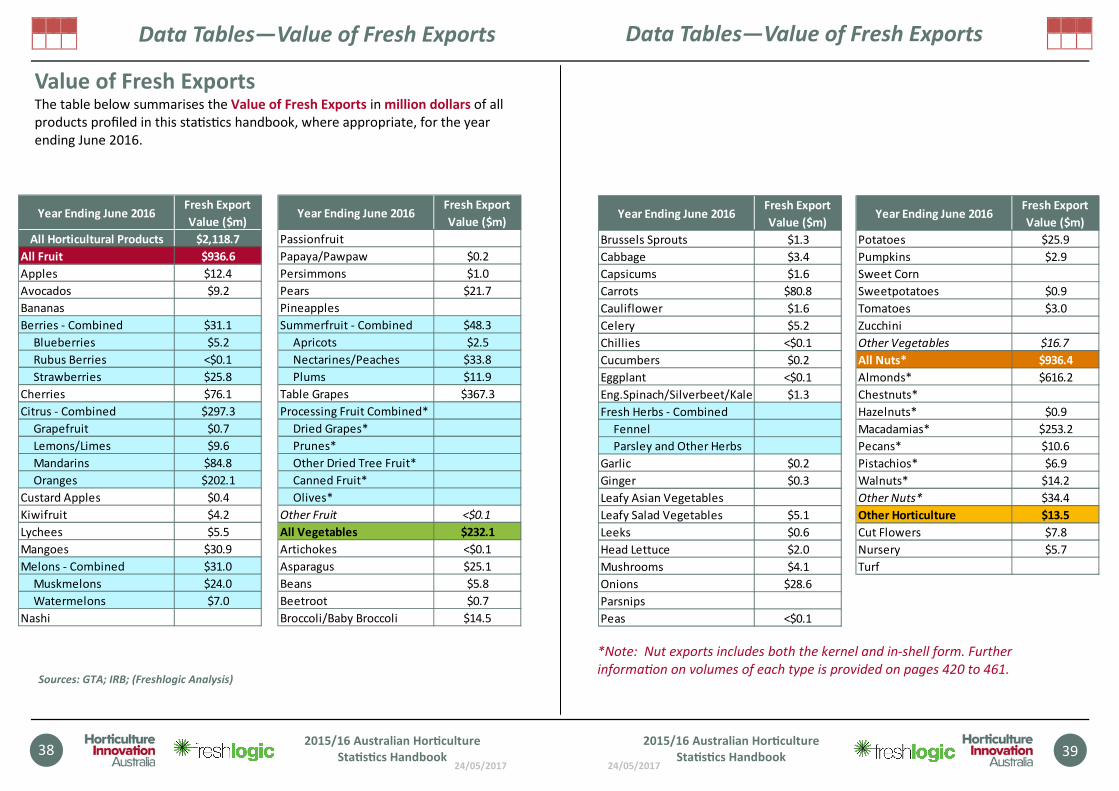
Data Tables—Value of Fresh Exports
Value of Fresh Exports The table below summarises the Value of Fresh Exports in million dollars of all
products profiled in this sta�s�cs handbook, where appropriate, for the year
ending June 2016.
Sources: GTA; IRB; (Freshlogic Analysis)
2015/16 Australian Hor�culture
Sta�s�cs Handbook
Year Ending June 2016Fresh Export
Value ($m)
All Horticultural Products $2,118.7
All Fruit $936.6
Apples $12.4
Avocados $9.2
Bananas
Berries - Combined $31.1
Blueberries $5.2
Rubus Berries <$0.1
Strawberries $25.8
Cherries $76.1
Citrus - Combined $297.3
Grapefruit $0.7
Lemons/Limes $9.6
Mandarins $84.8
Oranges $202.1
Custard Apples $0.4
Kiwifruit $4.2
Lychees $5.5
Mangoes $30.9
Melons - Combined $31.0
Muskmelons $24.0
Watermelons $7.0
Nashi
Year Ending June 2016Fresh Export
Value ($m)
Passionfruit
Papaya/Pawpaw $0.2
Persimmons $1.0
Pears $21.7
Pineapples
Summerfruit - Combined $48.3
Apricots $2.5
Nectarines/Peaches $33.8
Plums $11.9
Table Grapes $367.3
Processing Fruit Combined*
Dried Grapes*
Prunes*
Other Dried Tree Fruit*
Canned Fruit*
Olives*
Other Fruit <$0.1
All Vegetables $232.1
Artichokes <$0.1
Asparagus $25.1
Beans $5.8
Beetroot $0.7
Broccoli/Baby Broccoli $14.5
24/05/2017
*Note: Nut exports includes both the kernel and in-shell form. Further
informa�on on volumes of each type is provided on pages 420 to 461.
39
Data Tables—Value of Fresh Exports
2015/16 Australian Hor�culture
Sta�s�cs Handbook
Year Ending June 2016Fresh Export
Value ($m)
Brussels Sprouts $1.3
Cabbage $3.4
Capsicums $1.6
Carrots $80.8
Cauliflower $1.6
Celery $5.2
Chillies <$0.1
Cucumbers $0.2
Eggplant <$0.1
Eng.Spinach/Silverbeet/Kale $1.3
Fresh Herbs - Combined
Fennel
Parsley and Other Herbs
Garlic $0.2
Ginger $0.3
Leafy Asian Vegetables
Leafy Salad Vegetables $5.1
Leeks $0.6
Head Lettuce $2.0
Mushrooms $4.1
Onions $28.6
Parsnips
Peas <$0.1
Year Ending June 2016Fresh Export
Value ($m)
Potatoes $25.9
Pumpkins $2.9
Sweet Corn
Sweetpotatoes $0.9
Tomatoes $3.0
Zucchini
Other Vegetables $16.7
All Nuts* $936.4
Almonds* $616.2
Chestnuts*
Hazelnuts* $0.9
Macadamias* $253.2
Pecans* $10.6
Pistachios* $6.9
Walnuts* $14.2
Other Nuts* $34.4
Other Horticulture $13.5
Cut Flowers $7.8
Nursery $5.7
Turf
24/05/2017
40
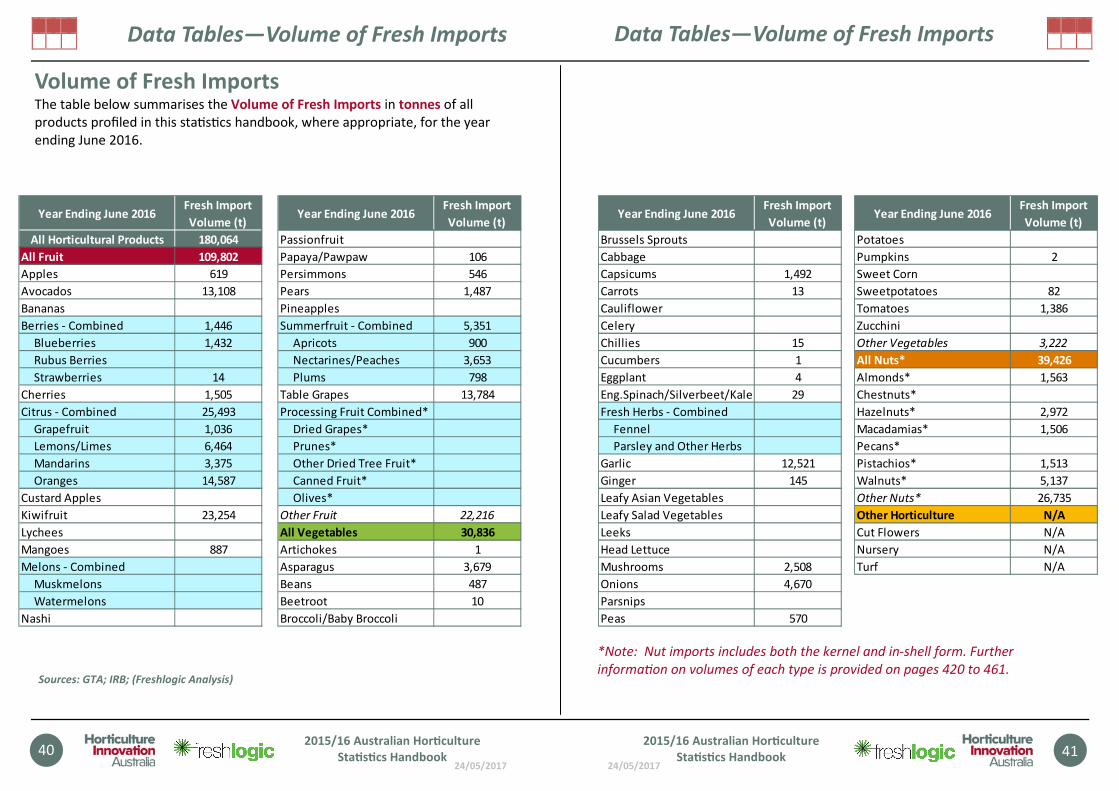
Data Tables—Volume of Fresh Imports
Volume of Fresh Imports The table below summarises the Volume of Fresh Imports in tonnes of all
products profiled in this sta�s�cs handbook, where appropriate, for the year
ending June 2016.
Sources: GTA; IRB; (Freshlogic Analysis)
2015/16 Australian Hor�culture
Sta�s�cs Handbook
Year Ending June 2016Fresh Import
Volume (t)
All Horticultural Products 180,064
All Fruit 109,802
Apples 619
Avocados 13,108
Bananas
Berries - Combined 1,446
Blueberries 1,432
Rubus Berries
Strawberries 14
Cherries 1,505
Citrus - Combined 25,493
Grapefruit 1,036
Lemons/Limes 6,464
Mandarins 3,375
Oranges 14,587
Custard Apples
Kiwifruit 23,254
Lychees
Mangoes 887
Melons - Combined
Muskmelons
Watermelons
Nashi
Year Ending June 2016Fresh Import
Volume (t)
Passionfruit
Papaya/Pawpaw 106
Persimmons 546
Pears 1,487
Pineapples
Summerfruit - Combined 5,351
Apricots 900
Nectarines/Peaches 3,653
Plums 798
Table Grapes 13,784
Processing Fruit Combined*
Dried Grapes*
Prunes*
Other Dried Tree Fruit*
Canned Fruit*
Olives*
Other Fruit 22,216
All Vegetables 30,836
Artichokes 1
Asparagus 3,679
Beans 487
Beetroot 10
Broccoli/Baby Broccoli
24/05/2017
*Note: Nut imports includes both the kernel and in-shell form. Further
informa�on on volumes of each type is provided on pages 420 to 461.
41
Data Tables—Volume of Fresh Imports
2015/16 Australian Hor�culture
Sta�s�cs Handbook
Year Ending June 2016Fresh Import
Volume (t)
Brussels Sprouts
Cabbage
Capsicums 1,492
Carrots 13
Cauliflower
Celery
Chillies 15
Cucumbers 1
Eggplant 4
Eng.Spinach/Silverbeet/Kale 29
Fresh Herbs - Combined
Fennel
Parsley and Other Herbs
Garlic 12,521
Ginger 145
Leafy Asian Vegetables
Leafy Salad Vegetables
Leeks
Head Lettuce
Mushrooms 2,508
Onions 4,670
Parsnips
Peas 570
Year Ending June 2016Fresh Import
Volume (t)
Potatoes
Pumpkins 2
Sweet Corn
Sweetpotatoes 82
Tomatoes 1,386
Zucchini
Other Vegetables 3,222
All Nuts* 39,426
Almonds* 1,563
Chestnuts*
Hazelnuts* 2,972
Macadamias* 1,506
Pecans*
Pistachios* 1,513
Walnuts* 5,137
Other Nuts* 26,735
Other Horticulture N/A
Cut Flowers N/A
Nursery N/A
Turf N/A
24/05/2017
42
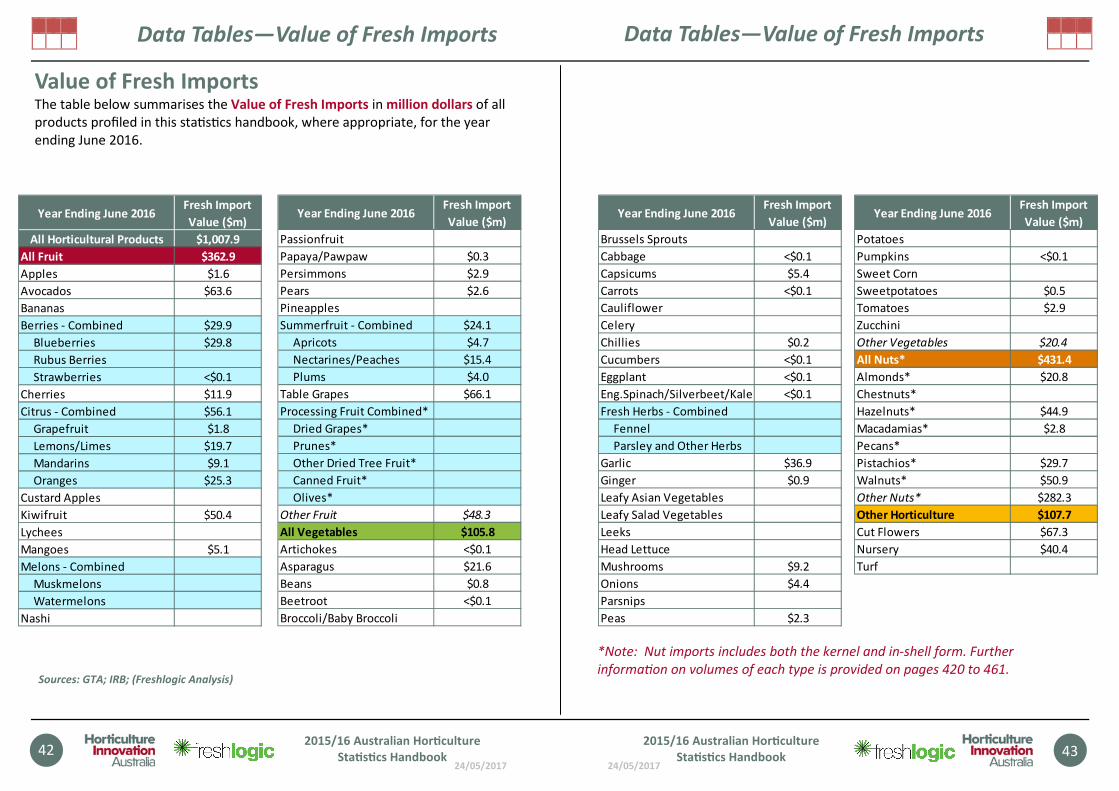
Data Tables—Value of Fresh Imports
Value of Fresh Imports The table below summarises the Value of Fresh Imports in million dollars of all
products profiled in this sta�s�cs handbook, where appropriate, for the year
ending June 2016.
Sources: GTA; IRB; (Freshlogic Analysis)
2015/16 Australian Hor�culture
Sta�s�cs Handbook
Year Ending June 2016Fresh Import
Value ($m)
All Horticultural Products $1,007.9
All Fruit $362.9
Apples $1.6
Avocados $63.6
Bananas
Berries - Combined $29.9
Blueberries $29.8
Rubus Berries
Strawberries <$0.1
Cherries $11.9
Citrus - Combined $56.1
Grapefruit $1.8
Lemons/Limes $19.7
Mandarins $9.1
Oranges $25.3
Custard Apples
Kiwifruit $50.4
Lychees
Mangoes $5.1
Melons - Combined
Muskmelons
Watermelons
Nashi
Year Ending June 2016Fresh Import
Value ($m)
Passionfruit
Papaya/Pawpaw $0.3
Persimmons $2.9
Pears $2.6
Pineapples
Summerfruit - Combined $24.1
Apricots $4.7
Nectarines/Peaches $15.4
Plums $4.0
Table Grapes $66.1
Processing Fruit Combined*
Dried Grapes*
Prunes*
Other Dried Tree Fruit*
Canned Fruit*
Olives*
Other Fruit $48.3
All Vegetables $105.8
Artichokes <$0.1
Asparagus $21.6
Beans $0.8
Beetroot <$0.1
Broccoli/Baby Broccoli
24/05/2017
*Note: Nut imports includes both the kernel and in-shell form. Further
informa�on on volumes of each type is provided on pages 420 to 461.
43
Data Tables—Value of Fresh Imports
2015/16 Australian Hor�culture
Sta�s�cs Handbook
Year Ending June 2016Fresh Import
Value ($m)
Brussels Sprouts
Cabbage <$0.1
Capsicums $5.4
Carrots <$0.1
Cauliflower
Celery
Chillies $0.2
Cucumbers <$0.1
Eggplant <$0.1
Eng.Spinach/Silverbeet/Kale <$0.1
Fresh Herbs - Combined
Fennel
Parsley and Other Herbs
Garlic $36.9
Ginger $0.9
Leafy Asian Vegetables
Leafy Salad Vegetables
Leeks
Head Lettuce
Mushrooms $9.2
Onions $4.4
Parsnips
Peas $2.3
Year Ending June 2016Fresh Import
Value ($m)
Potatoes
Pumpkins <$0.1
Sweet Corn
Sweetpotatoes $0.5
Tomatoes $2.9
Zucchini
Other Vegetables $20.4
All Nuts* $431.4
Almonds* $20.8
Chestnuts*
Hazelnuts* $44.9
Macadamias* $2.8
Pecans*
Pistachios* $29.7
Walnuts* $50.9
Other Nuts* $282.3
Other Horticulture $107.7
Cut Flowers $67.3
Nursery $40.4
Turf
24/05/2017
44
Data Tables—Fresh Supply
Fresh Supply Volume The table below summarises the Volume of Fresh Supply in tonnes of all
products profiled in this sta�s�cs handbook, where appropriate, for the year
ending June 2016.
Sources: ABS; GTA; IRB; MP & DD (Freshlogic Analysis)
2015/16 Australian Hor�culture
Sta�s�cs Handbook
Year Ending June 2016Fresh Supply
(t)
All Horticultural Products 3,885,440
All Fruit 1,708,385
Apples 219,811
Avocados 75,608
Bananas 394,694
Berries - Combined 70,142
Blueberries 7,939
Rubus Berries 4,504
Strawberries 57,698
Cherries 13,444
Citrus - Combined 305,415
Grapefruit 12,616
Lemons/Limes 43,079
Mandarins 104,670
Oranges 145,050
Custard Apples 1,615
Kiwifruit 35,984
Lychees 2,260
Mangoes 53,886
Melons - Combined 203,599
Muskmelons 51,829
Watermelons 151,770
Nashi 4,214
Year Ending June 2016Fresh Supply
(t)
Passionfruit 4,868
Papaya/Pawpaw 16,516
Persimmons 2,932
Pears 58,762
Pineapples 47,486
Summerfruit - Combined 102,852
Apricots 6,358
Nectarines/Peaches 82,062
Plums 14,432
Table Grapes 82,372
Processing Fruit Combined*
Dried Grapes*
Prunes*
Other Dried Tree Fruit*
Canned Fruit*
Olives*
Other Fruit 11,924
All Vegetables 2,100,637
Artichokes 380
Asparagus 7,169
Beans 27,635
Beetroot 5,260
Broccoli/Baby Broccoli 64,025
24/05/2017
Note: The processed fruit lines marked with an asterisk (*) do not contribute to
total fresh fruit supply volume because they are sold in a processed form.
45
Data Tables—Fresh Supply
2015/16 Australian Hor�culture
Sta�s�cs Handbook
Year Ending June 2016Fresh Supply
(t)
Brussels Sprouts 4,303
Cabbage 56,742
Capsicums 69,440
Carrots 191,626
Cauliflower 59,754
Celery 56,417
Chillies 1,675
Cucumbers 81,745
Eggplant 8,132
Eng.Spinach/Silverbeet/Kale 6,462
Fresh Herbs - Combined 10,853
Fennel 1,154
Parsley and Other Herbs 9,699
Garlic 10,043
Ginger 3,965
Leafy Asian Vegetables 28,310
Leafy Salad Vegetables 39,381
Leeks 8,974
Head Lettuce 125,180
Mushrooms 64,975
Onions 204,381
Parsnips 3,332
Peas 7,008
Year Ending June 2016Fresh Supply
(t)
Potatoes 452,951
Pumpkins 110,480
Sweet Corn 27,359
Sweetpotatoes 56,890
Tomatoes 247,049
Zucchini 35,325
Other Vegetables 23,418
All Nuts 76,418
Almonds 29,058
Chestnuts 893
Hazelnuts 3,287
Macadamias 4,139
Pecans 1,290
Pistachios 2,665
Walnuts 6,723
Other Nuts 2,499
Other Horticulture N/A
Cut Flowers N/A
Nursery N/A
Turf N/A

24/05/2017
46
Data Tables—Wholesale Value
Fresh Supply Wholesale Value The table below summarises the Wholesale Value of the Fresh Supply in million
dollars of all products profiled in this sta�s�cs handbook, where appropriate, for
the year ending June 2016.
Sources: ABS; AC; CFVIWA; GTA; IRB; MP & DD (Freshlogic Analysis)
2015/16 Australian Hor�culture
Sta�s�cs Handbook
Year Ending June 2016Wholesale
Value ($m)
All Horticultural Products $11,287.5
All Fruit $4,410.1
Apples $490.2
Avocados $514.5
Bananas $489.4
Berries - Combined $776.1
Blueberries $211.0
Rubus Berries $149.1
Strawberries $416.0
Cherries $130.8
Citrus - Combined $525.7
Grapefruit $20.2
Lemons/Limes $144.9
Mandarins $211.4
Oranges $149.2
Custard Apples $7.5
Kiwifruit $88.9
Lychees $27.1
Mangoes $214.9
Melons - Combined $163.8
Muskmelons $59.1
Watermelons $104.7
Nashi $13.6
Year Ending June 2016Wholesale
Value ($m)
Passionfruit $20.1
Papaya/Pawpaw $33.4
Persimmons $13.5
Pears $110.0
Pineapples $50.7
Summerfruit - Combined $393.1
Apricots $39.8
Nectarines/Peaches $296.8
Plums $56.4
Table Grapes $285.8
Processing Fruit Combined*
Dried Grapes*
Prunes*
Other Dried Tree Fruit*
Canned Fruit*
Olives*
Other Fruit $61.0
All Vegetables $3,998.7
Artichokes $1.1
Asparagus $77.8
Beans $76.8
Beetroot $10.6
Broccoli/Baby Broccoli $231.7
24/05/2017
Note: The processed fruit lines marked with an asterisk (*) do not contribute to
total fresh fruit wholesale value because they are sold in a processed form.
47
Data Tables—Wholesale Value
2015/16 Australian Hor�culture
Sta�s�cs Handbook
Year Ending June 2016Wholesale
Value ($m)
Brussels Sprouts $17.5
Cabbage $46.0
Capsicums $164.6
Carrots $158.3
Cauliflower $47.2
Celery $53.6
Chillies $9.8
Cucumbers $192.1
Eggplant $18.6
Eng.Spinach/Silverbeet/Kale $22.5
Fresh Herbs - Combined $156.6
Fennel $2.5
Parsley and Other Herbs $154.0
Garlic $70.3
Ginger $20.8
Leafy Asian Vegetables $74.2
Leafy Salad Vegetables $308.6
Leeks $21.1
Head Lettuce $169.0
Mushrooms $426.9
Onions $159.4
Parsnips $10.7
Peas $52.1
Year Ending June 2016Wholesale
Value ($m)
Potatoes $440.0
Pumpkins $77.1
Sweet Corn $70.0
Sweetpotatoes $70.2
Tomatoes $605.3
Zucchini $71.0
Other Vegetables $67.3
All Nuts $930.4
Almonds $385.1
Chestnuts $10.3
Hazelnuts $48.7
Macadamias $89.1
Pecans $18.6
Pistachios $62.5
Walnuts $84.0
Other Nuts $232.1
Other Horticulture $1,948.2
Cut Flowers $368.1
Nursery $1,266.2
Turf $314.0
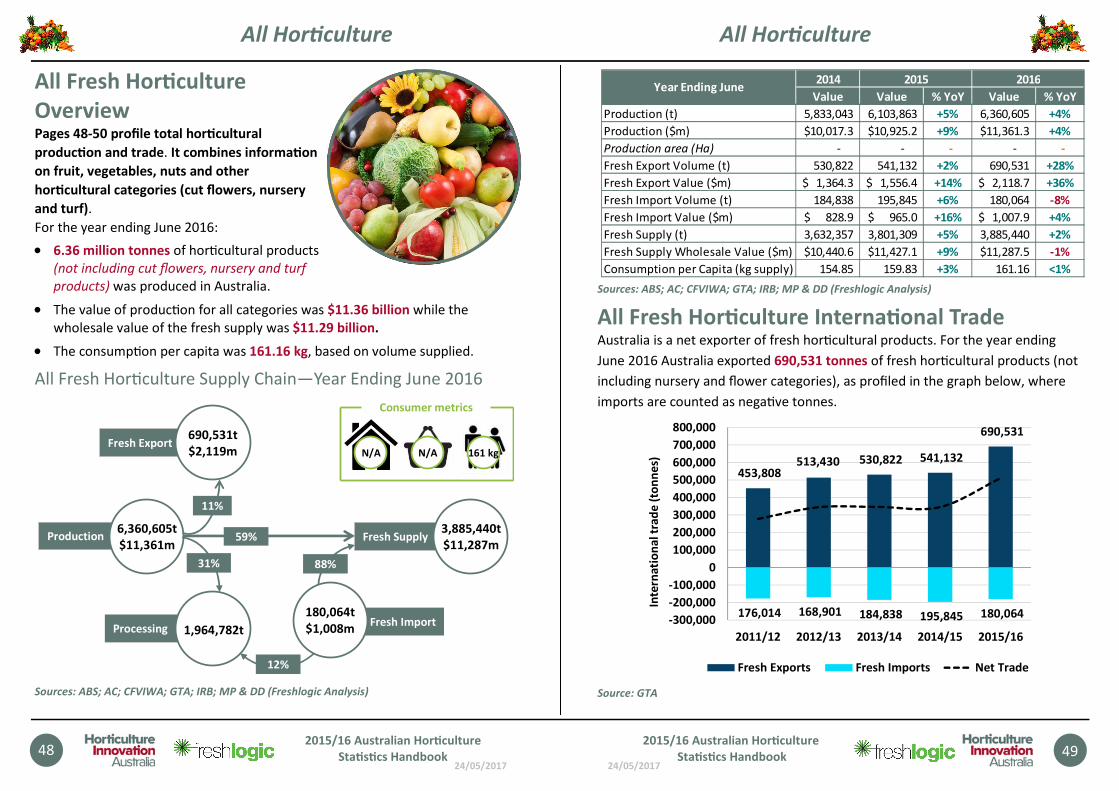
24/05/2017
48
All Hor�culture
All Fresh Hor�culture
Overview Pages 48-50 profile total hor�cultural
produc�on and trade. It combines informa�on
on fruit, vegetables, nuts and other
hor�cultural categories (cut flowers, nursery
and turf).
For the year ending June 2016:
• 6.36 million tonnes of hor�cultural products
(not including cut flowers, nursery and turf
products) was produced in Australia.
• The value of produc�on for all categories was $11.36 billion while the
wholesale value of the fresh supply was $11.29 billion.
• The consump�on per capita was 161.16 kg, based on volume supplied.
All Fresh Hor�culture Supply Chain—Year Ending June 2016
Sources: ABS; AC; CFVIWA; GTA; IRB; MP & DD (Freshlogic Analysis)
Production6,360,605t
$11,361m
Processing 1,964,782t
Fresh Export690,531t
$2,119m
31%
11%
Fresh Supply3,885,440t
$11,287m59%
Fresh Import180,064t
$1,008m
N/AN/A 161 kg
Consumer metrics
88%
12%
2015/16 Australian Hor�culture
Sta�s�cs Handbook
24/05/2017
49
Sources: ABS; AC; CFVIWA; GTA; IRB; MP & DD (Freshlogic Analysis)
All Fresh Hor�culture Interna�onal Trade Australia is a net exporter of fresh hor�cultural products. For the year ending
June 2016 Australia exported 690,531 tonnes of fresh hor�cultural products (not
including nursery and flower categories), as profiled in the graph below, where
imports are counted as nega�ve tonnes.
Source: GTA
2014
Value Value % YoY Value % YoY
Production (t) 5,833,043 6,103,863 +5% 6,360,605 +4%
Production ($m) 10,017.3$ 10,925.2$ +9% 11,361.3$ +4%
Production area (Ha) - - - - -
Fresh Export Volume (t) 530,822 541,132 +2% 690,531 +28%
Fresh Export Value ($m) 1,364.3$ 1,556.4$ +14% 2,118.7$ +36%
Fresh Import Volume (t) 184,838 195,845 +6% 180,064 -8%
Fresh Import Value ($m) 828.9$ 965.0$ +16% 1,007.9$ +4%
Fresh Supply (t) 3,632,357 3,801,309 +5% 3,885,440 +2%
Fresh Supply Wholesale Value ($m) 10,440.6$ 11,427.1$ +9% 11,287.5$ -1%
Consumption per Capita (kg supply) 154.85 159.83 +3% 161.16 <1%
Year Ending June2015 2016
453,808 513,430 530,822 541,132
690,531
176,014 168,901 184,838 195,845 180,064 -300,000
-200,000
-100,000
0
100,000
200,000
300,000
400,000
500,000
600,000
700,000
800,000
2011/12 2012/13 2013/14 2014/15 2015/16
Inte
rna
tio
na
l tra
de
(to
nn
es)
Fresh Exports Fresh Imports Net Trade
All Hor�culture
2015/16 Australian Hor�culture
Sta�s�cs Handbook
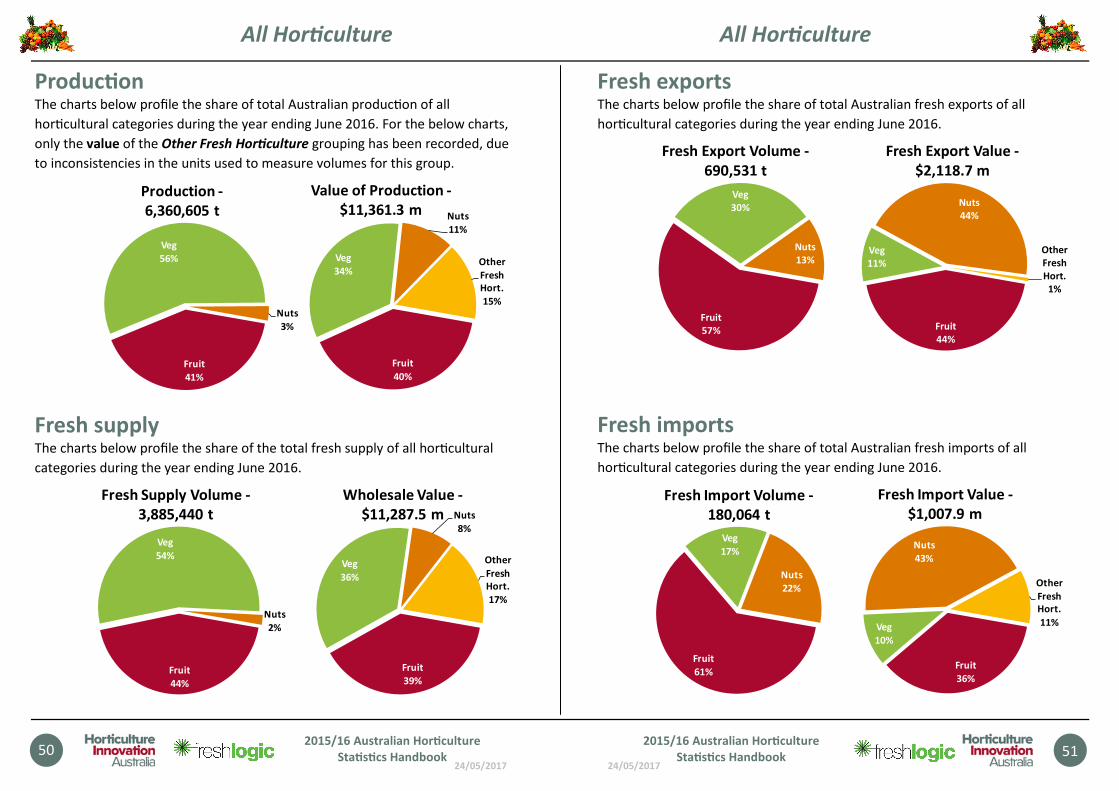
24/05/2017
50
2015/16 Australian Hor�culture
Sta�s�cs Handbook
Produc�on The charts below profile the share of total Australian produc�on of all
hor�cultural categories during the year ending June 2016. For the below charts,
only the value of the Other Fresh Hor�culture grouping has been recorded, due
to inconsistencies in the units used to measure volumes for this group.
Fresh supply The charts below profile the share of the total fresh supply of all hor�cultural
categories during the year ending June 2016.
Fruit
41%
Veg
56%
Nuts
3%
Production -
6,360,605 t
Fruit
40%
Veg
34%
Nuts
11%
Other
Fresh
Hort.
15%
Value of Production -
$11,361.3 m
Fruit
44%
Veg
54%
Nuts
2%
Fresh Supply Volume -
3,885,440 t
Fruit
39%
Veg
36%
Nuts
8%
Other
Fresh
Hort.
17%
Wholesale Value -
$11,287.5 m
All Hor�culture
24/05/2017
Fresh exports The charts below profile the share of total Australian fresh exports of all
hor�cultural categories during the year ending June 2016.
Fresh imports The charts below profile the share of total Australian fresh imports of all
hor�cultural categories during the year ending June 2016.
Fruit
57%
Veg
30%
Nuts
13%
Fresh Export Volume -
690,531 t
Fruit
44%
Veg
11%
Nuts
44%
Other
Fresh
Hort.
1%
Fresh Export Value -
$2,118.7 m
Fruit
36%
Veg
10%
Nuts
43%
Other
Fresh
Hort.
11%
Fresh Import Value -
$1,007.9 m
Fruit
61%
Veg
17%
Nuts
22%
Fresh Import Volume -
180,064 t
51
2015/16 Australian Hor�culture
Sta�s�cs Handbook
All Hor�culture
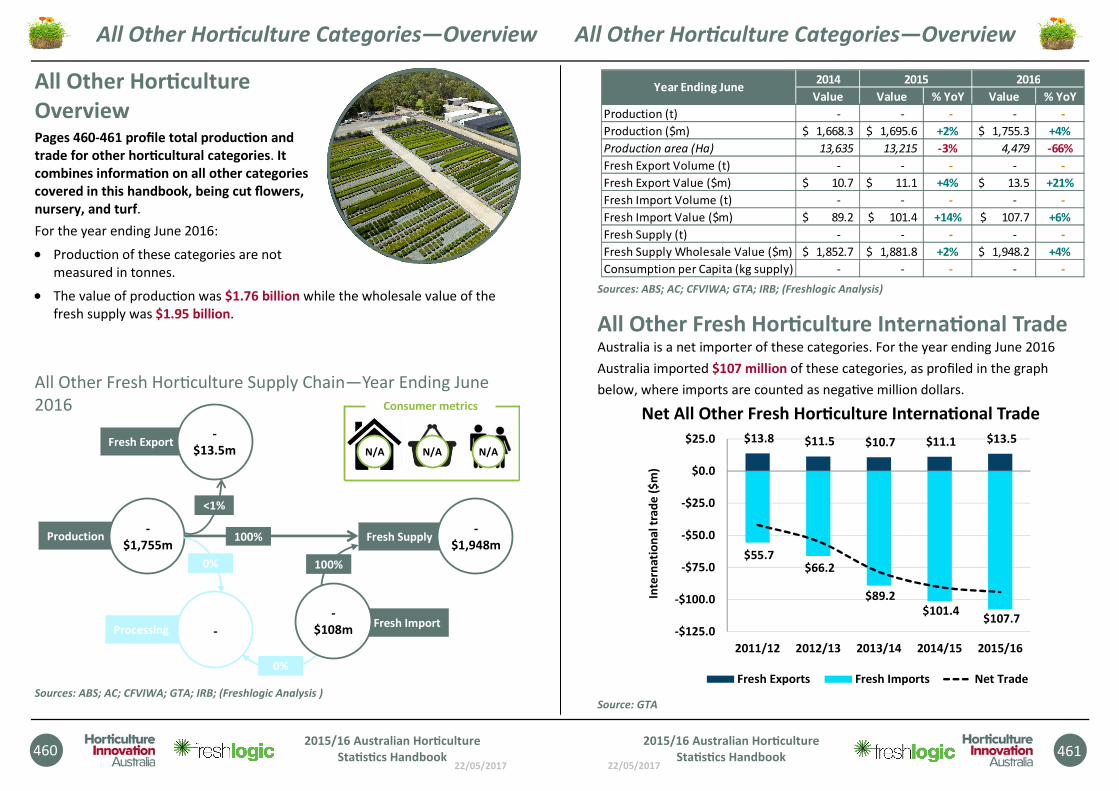
22/05/2017
460
All Other Hor�culture Categories—Overview
2015/16 Australian Hor�culture
Sta�s�cs Handbook
All Other Hor�culture
Overview Pages 460-461 profile total produc�on and
trade for other hor�cultural categories. It
combines informa�on on all other categories
covered in this handbook, being cut flowers,
nursery, and turf.
For the year ending June 2016:
• Produc�on of these categories are not
measured in tonnes.
• The value of produc�on was $1.76 billion while the wholesale value of the
fresh supply was $1.95 billion.
All Other Fresh Hor�culture Supply Chain—Year Ending June
2016
Sources: ABS; AC; CFVIWA; GTA; IRB; (Freshlogic Analysis )
Production-
$1,755m
Processing -
Fresh Export-
$13.5m
0%
<1%
Fresh Supply-
$1,948m100%
Fresh Import-
$108m
N/AN/A N/A
Consumer metrics
100%
0%
22/05/2017
Sources: ABS; AC; CFVIWA; GTA; IRB; (Freshlogic Analysis)
All Other Fresh Hor�culture Interna�onal Trade
Australia is a net importer of these categories. For the year ending June 2016
Australia imported $107 million of these categories, as profiled in the graph
below, where imports are counted as nega�ve million dollars.
Net All Other Fresh Hor�culture Interna�onal Trade
Source: GTA
2014
Value Value % YoY Value % YoY
Production (t) - - - - -
Production ($m) 1,668.3$ 1,695.6$ +2% 1,755.3$ +4%
Production area (Ha) 13,635 13,215 -3% 4,479 -66%
Fresh Export Volume (t) - - - - -
Fresh Export Value ($m) 10.7$ 11.1$ +4% 13.5$ +21%
Fresh Import Volume (t) - - - - -
Fresh Import Value ($m) 89.2$ 101.4$ +14% 107.7$ +6%
Fresh Supply (t) - - - - -
Fresh Supply Wholesale Value ($m) 1,852.7$ 1,881.8$ +2% 1,948.2$ +4%
Consumption per Capita (kg supply) - - - - -
Year Ending June2015 2016
$13.8 $11.5 $10.7 $11.1 $13.5
$55.7 $66.2
$89.2 $101.4
$107.7 -$125.0
-$100.0
-$75.0
-$50.0
-$25.0
$0.0
$25.0
2011/12 2012/13 2013/14 2014/15 2015/16In
tern
ati
on
al t
rad
e (
$m
)
Fresh Exports Fresh Imports Net Trade
461
All Other Hor�culture Categories—Overview
2015/16 Australian Hor�culture
Sta�s�cs Handbook
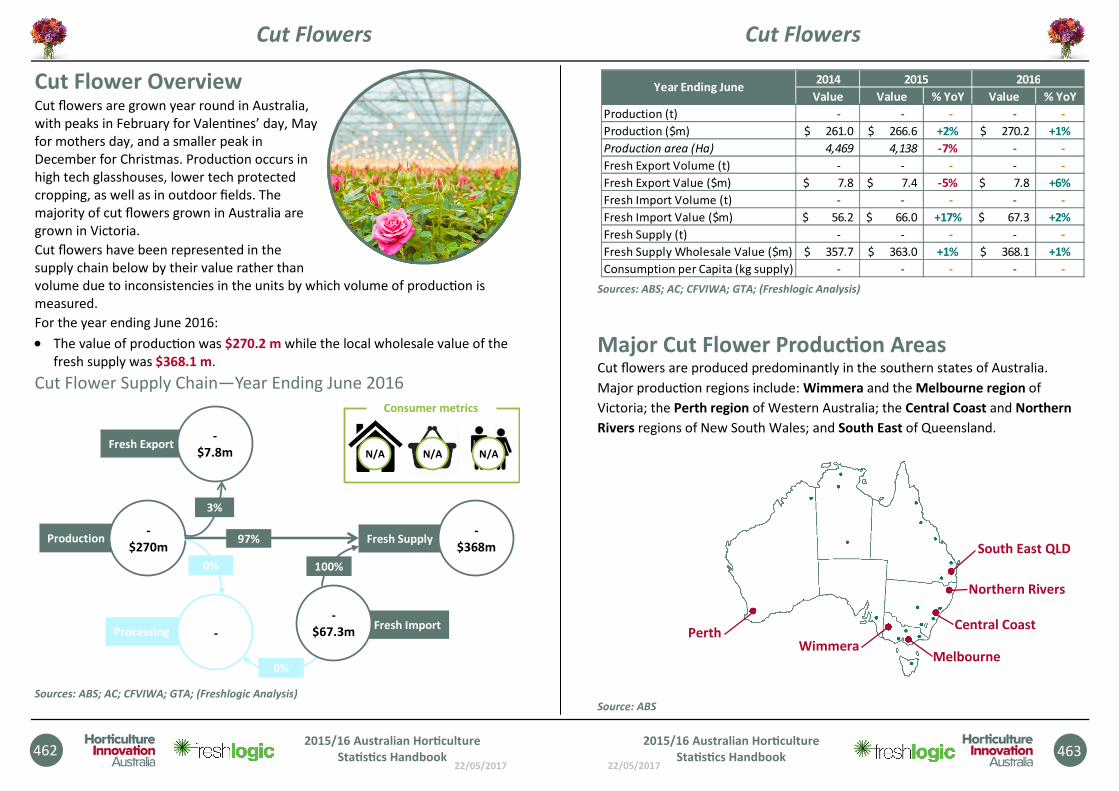
22/05/2017
Cut Flowers
462 2015/16 Australian Hor�culture
Sta�s�cs Handbook
Cut Flower Overview Cut flowers are grown year round in Australia,
with peaks in February for Valen�nes’ day, May
for mothers day, and a smaller peak in
December for Christmas. Produc�on occurs in
high tech glasshouses, lower tech protected
cropping, as well as in outdoor fields. The
majority of cut flowers grown in Australia are
grown in Victoria.
Cut flowers have been represented in the
supply chain below by their value rather than
volume due to inconsistencies in the units by which volume of produc�on is
measured.
For the year ending June 2016:
• The value of produc�on was $270.2 m while the local wholesale value of the
fresh supply was $368.1 m. Cut Flower Supply Chain—Year Ending June 2016
Sources: ABS; AC; CFVIWA; GTA; (Freshlogic Analysis)
Production-
$270m
Processing -
Fresh Export-
$7.8m
0%
3%
Fresh Supply-
$368m97%
Fresh Import-
$67.3m
N/AN/A N/A
Consumer metrics
100%
0%
22/05/2017
Sources: ABS; AC; CFVIWA; GTA; (Freshlogic Analysis)
Major Cut Flower Produc�on Areas Cut flowers are produced predominantly in the southern states of Australia.
Major produc�on regions include: Wimmera and the Melbourne region of
Victoria; the Perth region of Western Australia; the Central Coast and Northern
Rivers regions of New South Wales; and South East of Queensland.
Source: ABS
2014
Value Value % YoY Value % YoY
Production (t) - - - - -
Production ($m) 261.0$ 266.6$ +2% 270.2$ +1%
Production area (Ha) 4,469 4,138 -7% - -
Fresh Export Volume (t) - - - - -
Fresh Export Value ($m) 7.8$ 7.4$ -5% 7.8$ +6%
Fresh Import Volume (t) - - - - -
Fresh Import Value ($m) 56.2$ 66.0$ +17% 67.3$ +2%
Fresh Supply (t) - - - - -
Fresh Supply Wholesale Value ($m) 357.7$ 363.0$ +1% 368.1$ +1%
Consumption per Capita (kg supply) - - - - -
2015 2016Year Ending June
Cut Flowers
463 2015/16 Australian Hor�culture
Sta�s�cs Handbook
South East QLD
Northern Rivers
Central Coast
Melbourne Wimmera
Perth
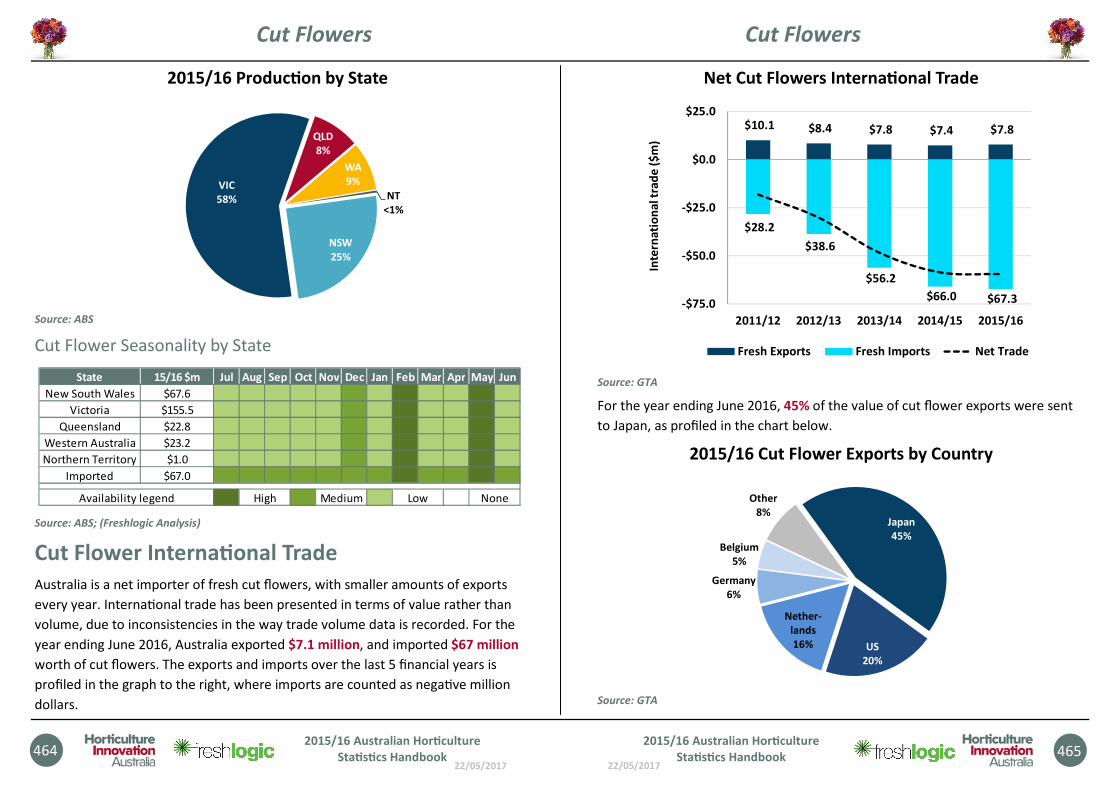
22/05/2017
464 2015/16 Australian Hor�culture
Sta�s�cs Handbook
2015/16 Produc�on by State
Source: ABS
Cut Flower Seasonality by State
Source: ABS; (Freshlogic Analysis)
Cut Flower Interna�onal Trade
Australia is a net importer of fresh cut flowers, with smaller amounts of exports
every year. Interna�onal trade has been presented in terms of value rather than
volume, due to inconsistencies in the way trade volume data is recorded. For the
year ending June 2016, Australia exported $7.1 million, and imported $67 million
worth of cut flowers. The exports and imports over the last 5 financial years is
profiled in the graph to the right, where imports are counted as nega�ve million
dollars.
NSW
25%
VIC
58%
QLD
8%
WA
9%
NT
<1%
State 15/16 $m Jul Aug Sep Oct Nov Dec Jan Feb Mar Apr May Jun
New South Wales $67.6
Victoria $155.5
Queensland $22.8
Western Australia $23.2
Northern Territory $1.0
Imported $67.0
Availability legend High Medium Low None
Cut Flowers
22/05/2017
Net Cut Flowers Interna�onal Trade
Source: GTA
For the year ending June 2016, 45% of the value of cut flower exports were sent
to Japan, as profiled in the chart below.
2015/16 Cut Flower Exports by Country
Source: GTA
$10.1 $8.4 $7.8 $7.4 $7.8
$28.2
$38.6
$56.2
$66.0 $67.3 -$75.0
-$50.0
-$25.0
$0.0
$25.0
2011/12 2012/13 2013/14 2014/15 2015/16
Inte
rna
tio
na
l tra
de
($
m)
Fresh Exports Fresh Imports Net Trade
Japan
45%
US
20%
Nether-
lands
16%
Germany
6%
Belgium
5%
Other
8%
465 2015/16 Australian Hor�culture
Sta�s�cs Handbook
Cut Flowers
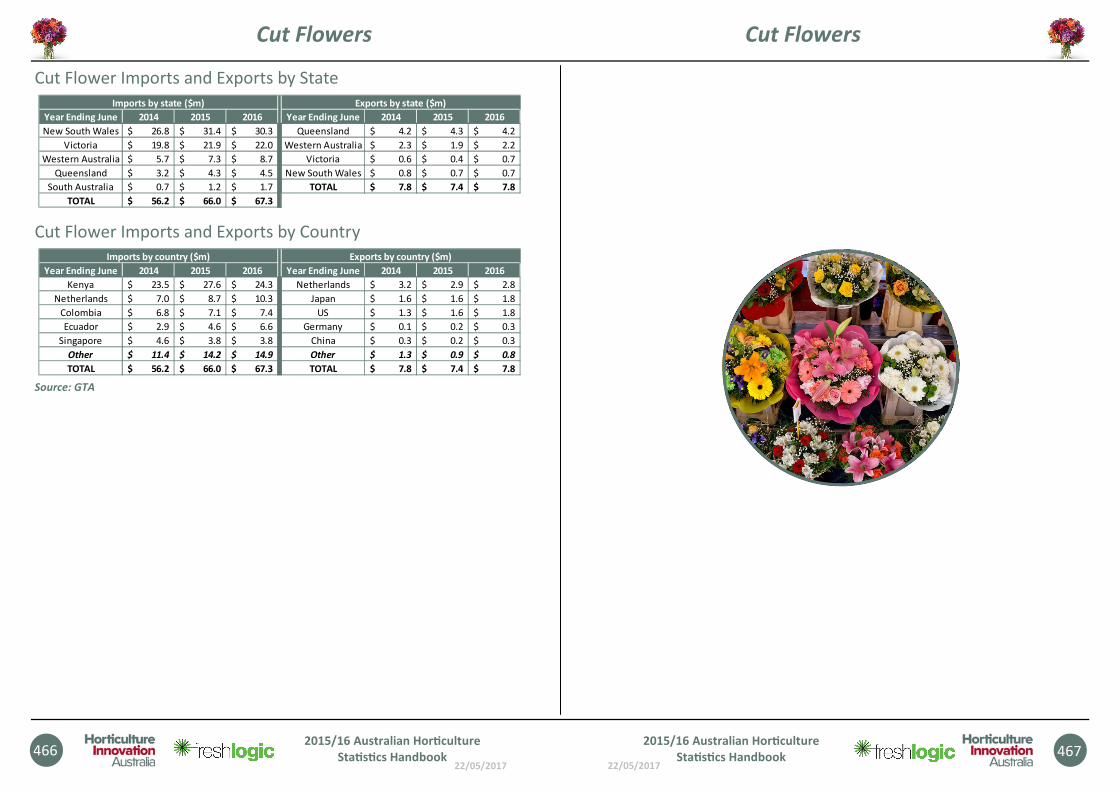
22/05/2017
466 2015/16 Australian Hor�culture
Sta�s�cs Handbook
Cut Flower Imports and Exports by State
Cut Flower Imports and Exports by Country
Source: GTA
Year Ending June 2014 2015 2016 Year Ending June 2014 2015 2016
New South Wales 26.8$ 31.4$ 30.3$ Queensland 4.2$ 4.3$ 4.2$
Victoria 19.8$ 21.9$ 22.0$ Western Australia 2.3$ 1.9$ 2.2$
Western Australia 5.7$ 7.3$ 8.7$ Victoria 0.6$ 0.4$ 0.7$
Queensland 3.2$ 4.3$ 4.5$ New South Wales 0.8$ 0.7$ 0.7$
South Australia 0.7$ 1.2$ 1.7$ TOTAL 7.8$ 7.4$ 7.8$
TOTAL 56.2$ 66.0$ 67.3$
Imports by state ($m) Exports by state ($m)
Year Ending June 2014 2015 2016 Year Ending June 2014 2015 2016
Kenya 23.5$ 27.6$ 24.3$ Netherlands 3.2$ 2.9$ 2.8$
Netherlands 7.0$ 8.7$ 10.3$ Japan 1.6$ 1.6$ 1.8$
Colombia 6.8$ 7.1$ 7.4$ US 1.3$ 1.6$ 1.8$
Ecuador 2.9$ 4.6$ 6.6$ Germany 0.1$ 0.2$ 0.3$
Singapore 4.6$ 3.8$ 3.8$ China 0.3$ 0.2$ 0.3$
Other 11.4$ 14.2$ 14.9$ Other 1.3$ 0.9$ 0.8$
TOTAL 56.2$ 66.0$ 67.3$ TOTAL 7.8$ 7.4$ 7.8$
Imports by country ($m) Exports by country ($m)
Cut Flowers
22/05/2017
467 2015/16 Australian Hor�culture
Sta�s�cs Handbook
Cut Flowers
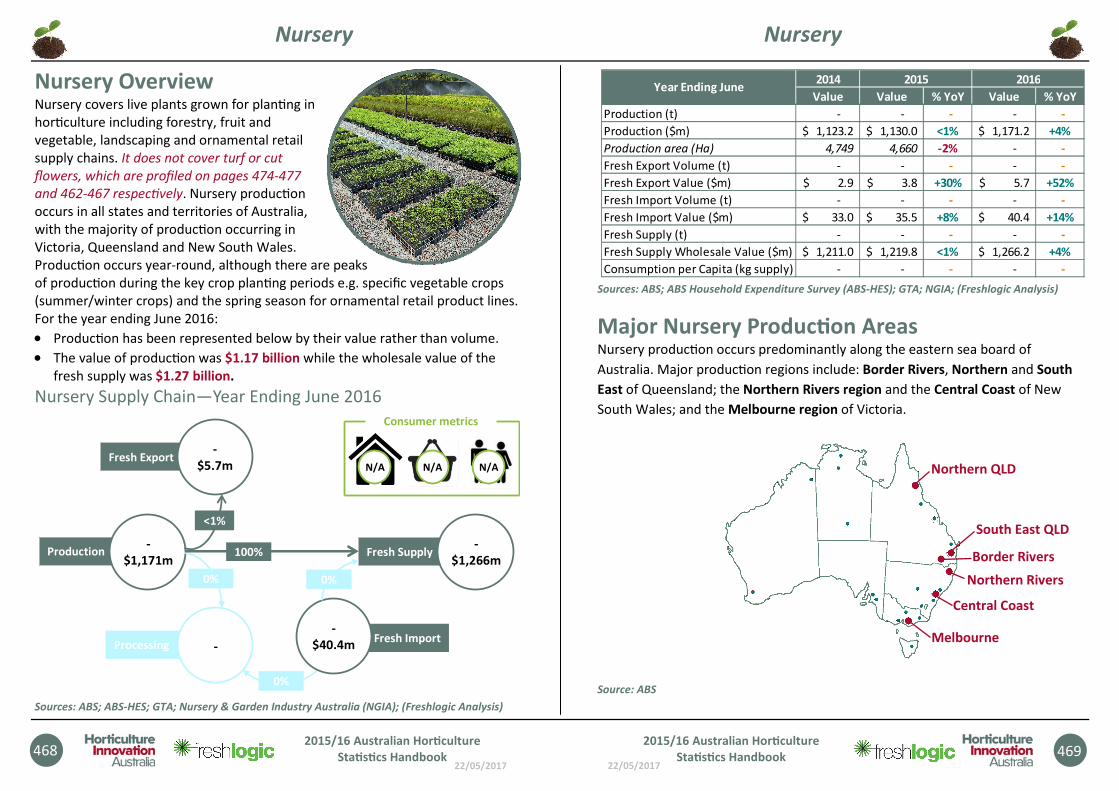
22/05/2017
Nursery
468 2015/16 Australian Hor�culture
Sta�s�cs Handbook
Nursery Overview Nursery covers live plants grown for plan�ng in
hor�culture including forestry, fruit and
vegetable, landscaping and ornamental retail
supply chains. It does not cover turf or cut
flowers, which are profiled on pages 474-477
and 462-467 respec&vely. Nursery produc�on
occurs in all states and territories of Australia,
with the majority of produc�on occurring in
Victoria, Queensland and New South Wales.
Produc�on occurs year-round, although there are peaks
of produc�on during the key crop plan�ng periods e.g. specific vegetable crops
(summer/winter crops) and the spring season for ornamental retail product lines.
For the year ending June 2016:
• Produc�on has been represented below by their value rather than volume.
• The value of produc�on was $1.17 billion while the wholesale value of the
fresh supply was $1.27 billion.
Nursery Supply Chain—Year Ending June 2016
Sources: ABS; ABS-HES; GTA; Nursery & Garden Industry Australia (NGIA); (Freshlogic Analysis)
Production-
$1,171m
Processing -
Fresh Export-
$5.7m
0%
<1%
Fresh Supply-
$1,266m100%
Fresh Import-
$40.4m
N/AN/A N/A
Consumer metrics
0%
0%
22/05/2017
Sources: ABS; ABS Household Expenditure Survey (ABS-HES); GTA; NGIA; (Freshlogic Analysis)
Major Nursery Produc�on Areas Nursery produc�on occurs predominantly along the eastern sea board of
Australia. Major produc�on regions include: Border Rivers, Northern and South
East of Queensland; the Northern Rivers region and the Central Coast of New
South Wales; and the Melbourne region of Victoria.
Source: ABS
2014
Value Value % YoY Value % YoY
Production (t) - - - - -
Production ($m) 1,123.2$ 1,130.0$ <1% 1,171.2$ +4%
Production area (Ha) 4,749 4,660 -2% - -
Fresh Export Volume (t) - - - - -
Fresh Export Value ($m) 2.9$ 3.8$ +30% 5.7$ +52%
Fresh Import Volume (t) - - - - -
Fresh Import Value ($m) 33.0$ 35.5$ +8% 40.4$ +14%
Fresh Supply (t) - - - - -
Fresh Supply Wholesale Value ($m) 1,211.0$ 1,219.8$ <1% 1,266.2$ +4%
Consumption per Capita (kg supply) - - - - -
Year Ending June2015 2016
Nursery
469 2015/16 Australian Hor�culture
Sta�s�cs Handbook
South East QLD
Northern Rivers
Central Coast
Melbourne
Border Rivers
Northern QLD
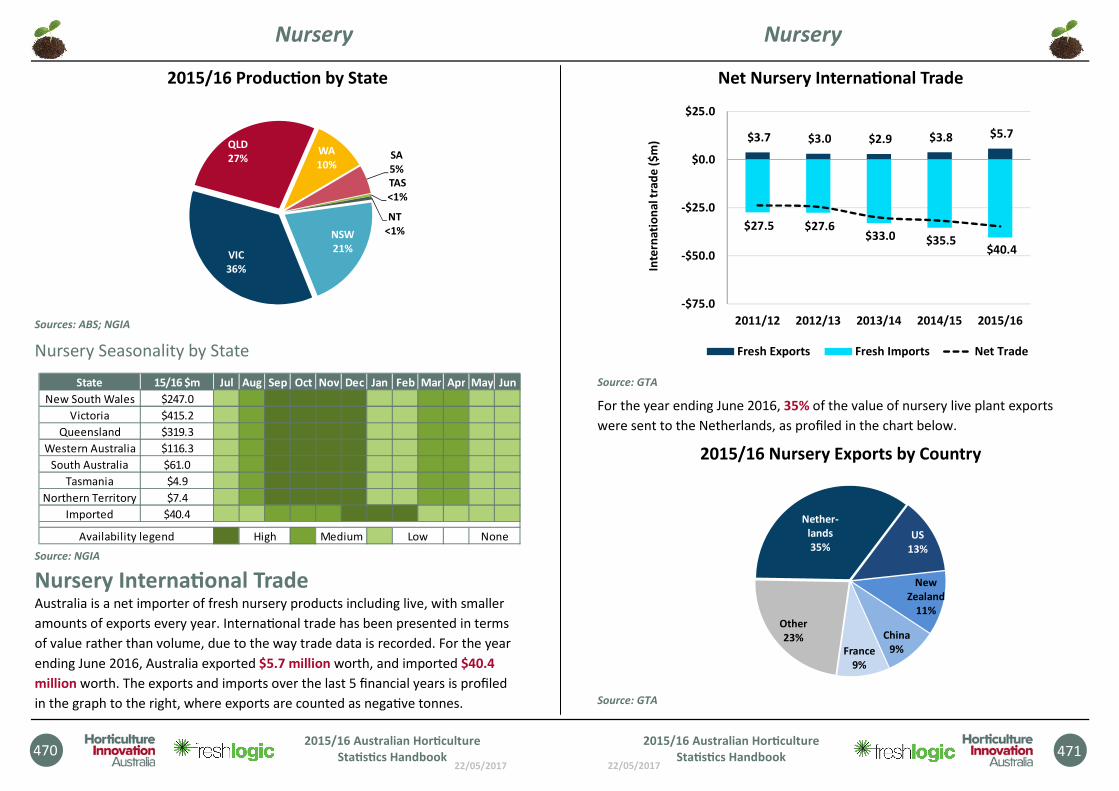
22/05/2017
470 2015/16 Australian Hor�culture
Sta�s�cs Handbook
2015/16 Produc�on by State
Sources: ABS; NGIA
Nursery Seasonality by State
Source: NGIA
Nursery Interna�onal Trade Australia is a net importer of fresh nursery products including live, with smaller
amounts of exports every year. Interna�onal trade has been presented in terms
of value rather than volume, due to the way trade data is recorded. For the year
ending June 2016, Australia exported $5.7 million worth, and imported $40.4
million worth. The exports and imports over the last 5 financial years is profiled
in the graph to the right, where exports are counted as nega�ve tonnes.
NSW
21%VIC
36%
QLD
27%WA
10%SA
5%
TAS
<1%
NT
<1%
State 15/16 $m Jul Aug Sep Oct Nov Dec Jan Feb Mar Apr May Jun
New South Wales $247.0
Victoria $415.2
Queensland $319.3
Western Australia $116.3
South Australia $61.0
Tasmania $4.9
Northern Territory $7.4
Imported $40.4
Availability legend High Medium Low None
Nursery
22/05/2017
Net Nursery Interna�onal Trade
Source: GTA
For the year ending June 2016, 35% of the value of nursery live plant exports
were sent to the Netherlands, as profiled in the chart below.
2015/16 Nursery Exports by Country
Source: GTA
$3.7 $3.0 $2.9 $3.8 $5.7
$27.5 $27.6 $33.0 $35.5
$40.4
-$75.0
-$50.0
-$25.0
$0.0
$25.0
2011/12 2012/13 2013/14 2014/15 2015/16
Inte
rna
tio
na
l tra
de
($
m)
Fresh Exports Fresh Imports Net Trade
Nether-
lands
35%US
13%
New
Zealand
11%
China
9%France
9%
Other
23%
471 2015/16 Australian Hor�culture
Sta�s�cs Handbook
Nursery
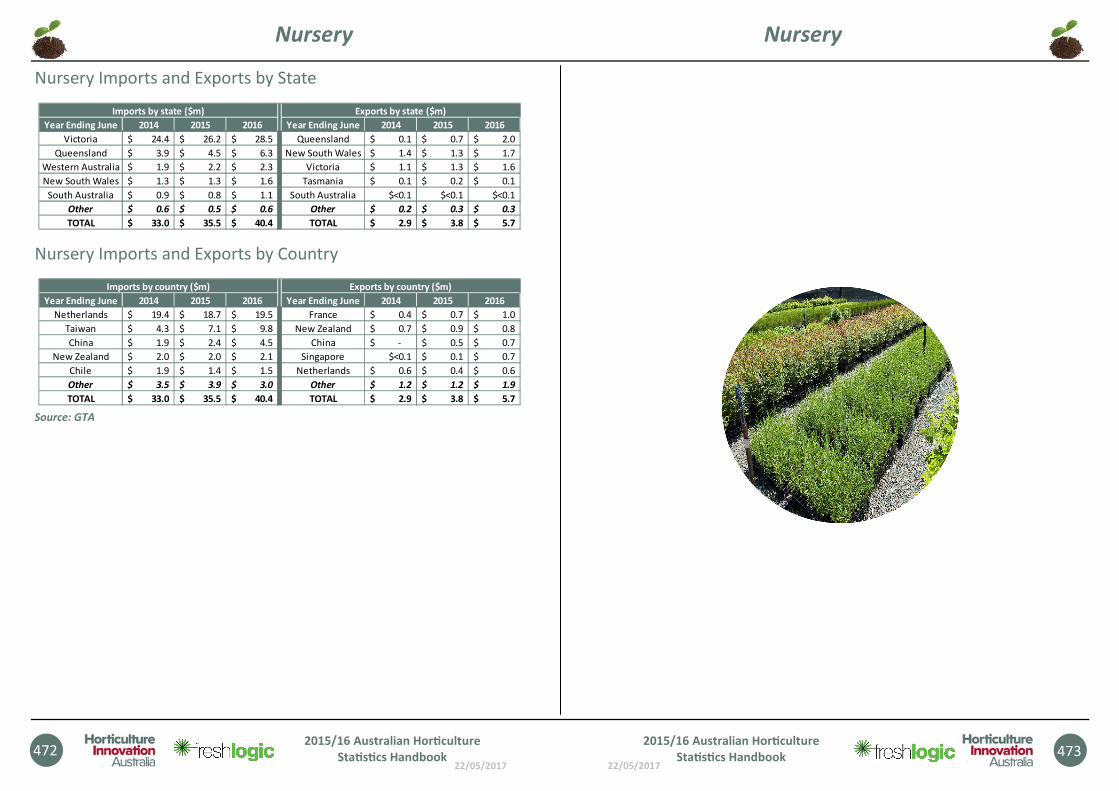
22/05/2017
472 2015/16 Australian Hor�culture
Sta�s�cs Handbook
Nursery Imports and Exports by State
Nursery Imports and Exports by Country
Source: GTA
Year Ending June 2014 2015 2016 Year Ending June 2014 2015 2016
Victoria 24.4$ 26.2$ 28.5$ Queensland 0.1$ 0.7$ 2.0$
Queensland 3.9$ 4.5$ 6.3$ New South Wales 1.4$ 1.3$ 1.7$
Western Australia 1.9$ 2.2$ 2.3$ Victoria 1.1$ 1.3$ 1.6$
New South Wales 1.3$ 1.3$ 1.6$ Tasmania 0.1$ 0.2$ 0.1$
South Australia 0.9$ 0.8$ 1.1$ South Australia $<0.1 $<0.1 $<0.1
Other 0.6$ 0.5$ 0.6$ Other 0.2$ 0.3$ 0.3$
TOTAL 33.0$ 35.5$ 40.4$ TOTAL 2.9$ 3.8$ 5.7$
Imports by state ($m) Exports by state ($m)
Year Ending June 2014 2015 2016 Year Ending June 2014 2015 2016
Netherlands 19.4$ 18.7$ 19.5$ France 0.4$ 0.7$ 1.0$
Taiwan 4.3$ 7.1$ 9.8$ New Zealand 0.7$ 0.9$ 0.8$
China 1.9$ 2.4$ 4.5$ China -$ 0.5$ 0.7$
New Zealand 2.0$ 2.0$ 2.1$ Singapore $<0.1 0.1$ 0.7$
Chile 1.9$ 1.4$ 1.5$ Netherlands 0.6$ 0.4$ 0.6$
Other 3.5$ 3.9$ 3.0$ Other 1.2$ 1.2$ 1.9$
TOTAL 33.0$ 35.5$ 40.4$ TOTAL 2.9$ 3.8$ 5.7$
Imports by country ($m) Exports by country ($m)
Nursery
22/05/2017
473 2015/16 Australian Hor�culture
Sta�s�cs Handbook
Nursery
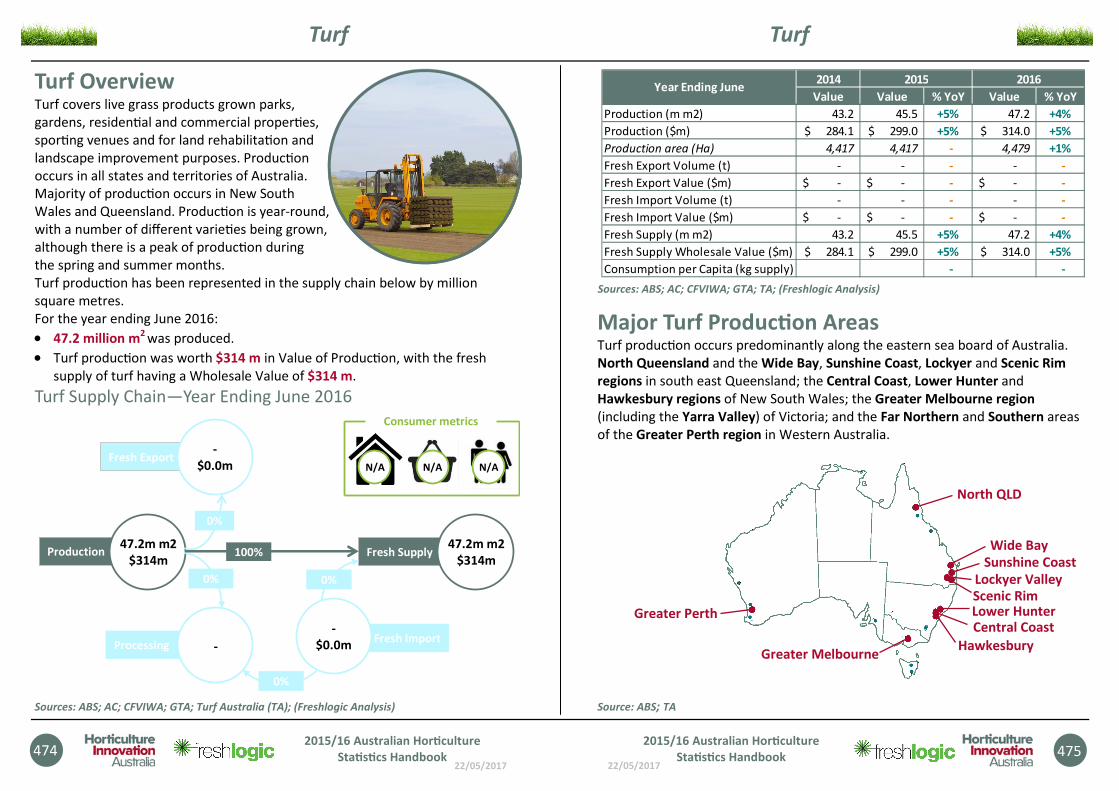
22/05/2017
Turf
474 2015/16 Australian Hor�culture
Sta�s�cs Handbook
Turf Overview Turf covers live grass products grown parks,
gardens, residen�al and commercial proper�es,
spor�ng venues and for land rehabilita�on and
landscape improvement purposes. Produc�on
occurs in all states and territories of Australia.
Majority of produc�on occurs in New South
Wales and Queensland. Produc�on is year-round,
with a number of different varie�es being grown,
although there is a peak of produc�on during
the spring and summer months. Turf produc�on has been represented in the supply chain below by million
square metres. For the year ending June 2016:
• 47.2 million m2
was produced.
• Turf produc�on was worth $314 m in Value of Produc�on, with the fresh
supply of turf having a Wholesale Value of $314 m.
Turf Supply Chain—Year Ending June 2016
Sources: ABS; AC; CFVIWA; GTA; Turf Australia (TA); (Freshlogic Analysis)
Production47.2m m2
$314m
Processing -
Fresh Export-
$0.0m
0%
0%
Fresh Supply47.2m m2
$314m100%
Fresh Import-
$0.0m
N/AN/A N/A
Consumer metrics
0%
0%
22/05/2017
Sources: ABS; AC; CFVIWA; GTA; TA; (Freshlogic Analysis)
Major Turf Produc�on Areas Turf produc�on occurs predominantly along the eastern sea board of Australia.
North Queensland and the Wide Bay, Sunshine Coast, Lockyer and Scenic Rim
regions in south east Queensland; the Central Coast, Lower Hunter and
Hawkesbury regions of New South Wales; the Greater Melbourne region
(including the Yarra Valley) of Victoria; and the Far Northern and Southern areas
of the Greater Perth region in Western Australia.
Source: ABS; TA
2014
Value Value % YoY Value % YoY
Production (m m2) 43.2 45.5 +5% 47.2 +4%
Production ($m) 284.1$ 299.0$ +5% 314.0$ +5%
Production area (Ha) 4,417 4,417 - 4,479 +1%
Fresh Export Volume (t) - - - - -
Fresh Export Value ($m) -$ -$ - -$ -
Fresh Import Volume (t) - - - - -
Fresh Import Value ($m) -$ -$ - -$ -
Fresh Supply (m m2) 43.2 45.5 +5% 47.2 +4%
Fresh Supply Wholesale Value ($m) 284.1$ 299.0$ +5% 314.0$ +5%
Consumption per Capita (kg supply) - -
Year Ending June2015 2016
Turf
475 2015/16 Australian Hor�culture
Sta�s�cs Handbook
Central Coast
Greater Melbourne Hawkesbury
Lower Hunter
Wide Bay
North QLD
Sunshine Coast
Scenic Rim Lockyer Valley
Greater Perth
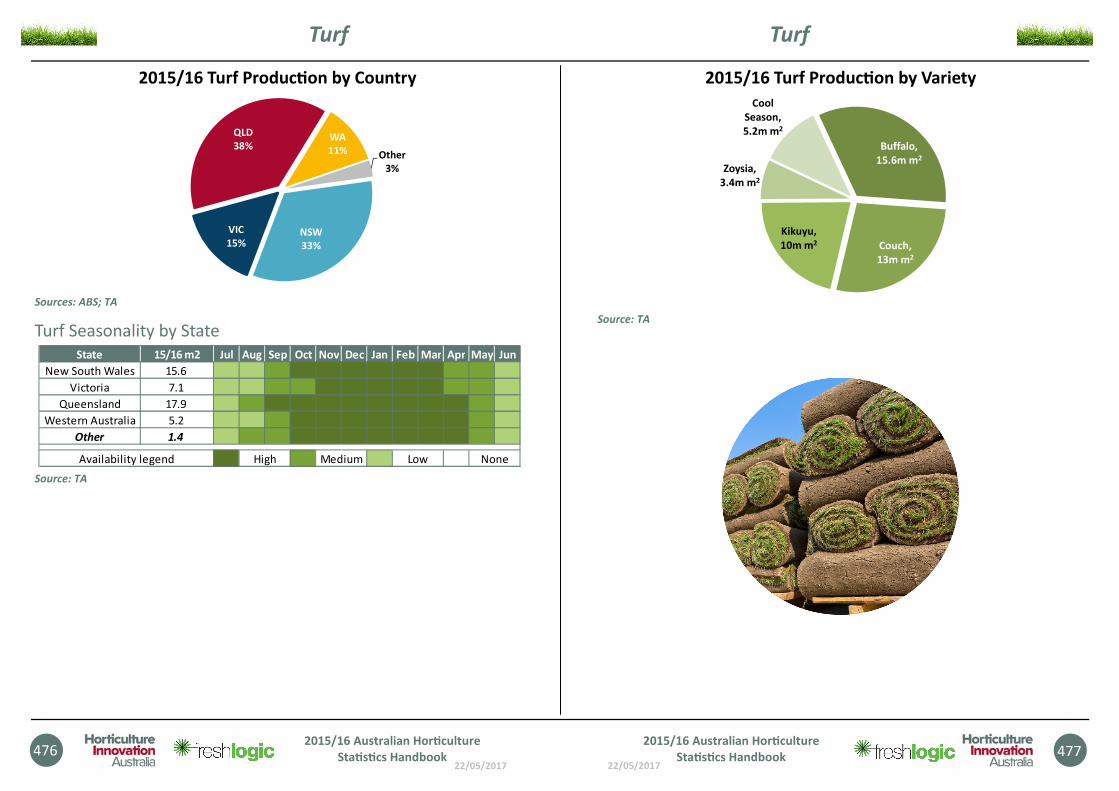
22/05/2017
476 2015/16 Australian Hor�culture
Sta�s�cs Handbook
2015/16 Turf Produc�on by Country
Sources: ABS; TA
Turf Seasonality by State
Source: TA
NSW
33%
VIC
15%
QLD
38%WA
11% Other
3%
State 15/16 m2 Jul Aug Sep Oct Nov Dec Jan Feb Mar Apr May Jun
New South Wales 15.6
Victoria 7.1
Queensland 17.9
Western Australia 5.2
Other 1.4
Availability legend High Medium Low None
Turf
22/05/2017
2015/16 Turf Produc�on by Variety
Source: TA
Buffalo,
15.6m m2
Couch,
13m m2
Kikuyu,
10m m2
Zoysia,
3.4m m2
Cool
Season,
5.2m m2
477 2015/16 Australian Hor�culture
Sta�s�cs Handbook
Turf