Embed Size (px)
Citation preview
Australian Geomechanics Vol 48 No 4 December 2013 93
THE DESIGN AND PERFORMANCE OF A SUBMARINE BUND IN PORT PHILLIP, VICTORIA
Nick Ramsey 1, Geoff Nicol 2 and Don Raisbeck 3 1 GeoConsulting Leader, Fugro, 2 Dredging Manager, Port of Melbourne,
3 Principal Geotechnical Engineer, SKM (part-time)
ABSTRACT
This paper describes the methodologies used to design a submarine bund in the Dredge Material Grounds (DMG) of Port Phillip. Due to the large footprint of the bund, which was over 4.6km in length, and relatively uncontrolled method of bund construction, the design of the DMG bund presented a series of challenges, including:
i) Assessing a “fit-for–purpose” ground model to take account of buried channel features known to occur within the bund footprint.
ii) Assessing reliable geotechnical parameters for predicting the behaviour of the bund and underlying soils.
iii) Predicting the volume of material required to construct the bund.
iv) Predicting the post-construction settlement behaviour of the bund, and contained material, to ensure that the contained material could not overtop the bund.
This paper presents details of how each of these challenges were addressed, and compares the actual and predicted performances of the bund over a three-year period.
1 INTRODUCTION As part of the Channel Deepening Project (CDP) a submarine bund was required at the southern end of the Port of Melbourne (PoM) DMG, to contain low-level contaminated material from the Yarra River and Hobsons Bay. The bund was to be constructed by dropping uncontaminated dredged material through the water column onto the seabed. The total length of the proposed submarine bund was approximately 4.6 km, with a design crest-level of 15m below Chart Datum (-15m CD) and a maximum bund-height of about 5m above mudline. Figure 1 presents a general location plan showing the PoM DMG.
This paper details how the challenges of designing the bund were addressed, by using:
a) a combination of geology, marine geophysical investigation, cone penetration testing and boreholes, to define the local ground conditions of the area;
b) a combination of field trials, cone penetration testing and bathymetric measurements, to predict the penetration of dredged spoil into the seabed and the lateral geometry of the ensuing bund, as a function of the bund height, in order to predict the volume of material required to construct the bund;
c) standard and non-standard laboratory testing to assess the strength and consolidation properties of both natural soils and dredged materials;
d) a predictive model for the calculation of the short-term and long-term settlement behaviour of the bund over its 50 year design life.
Due the unknowns associated with dropping dredged material onto the seabed, it was considered necessary to construct a trial bund along the southern part of the proposed bund alignment, using the same technique proposed for the final bund. Consequently, a trial bund was constructed during September 2005, Cone Penetration Tests (CPTs) were performed through the trial bund during January 2006, and the settlement of the trial bund was monitored for nearly six months. Figure 2 presents a detailed location plan, showing the proposed DMG Bund, previous sampling locations, bathymetric contours and CPT locations.

THE DESIGN AND PERFORMANCE OF A SUBMARINE BUND IN PORT PHILLIP, VICTORIA RAMSEY et al.
Australian Geomechanics Vol 48 No 4 December 2013 94
Figure 1: General Location Plan
Figure 2: Detailed Location Plan
THE DESIGN AND PERFORMANCE OF A SUBMARINE BUND IN PORT PHILLIP, VICTORIA RAMSEY et al.
Australian Geomechanics Vol 48 No 4 December 2013 95
2 EXISTING INFORMATION
2.1 GEOLOGY
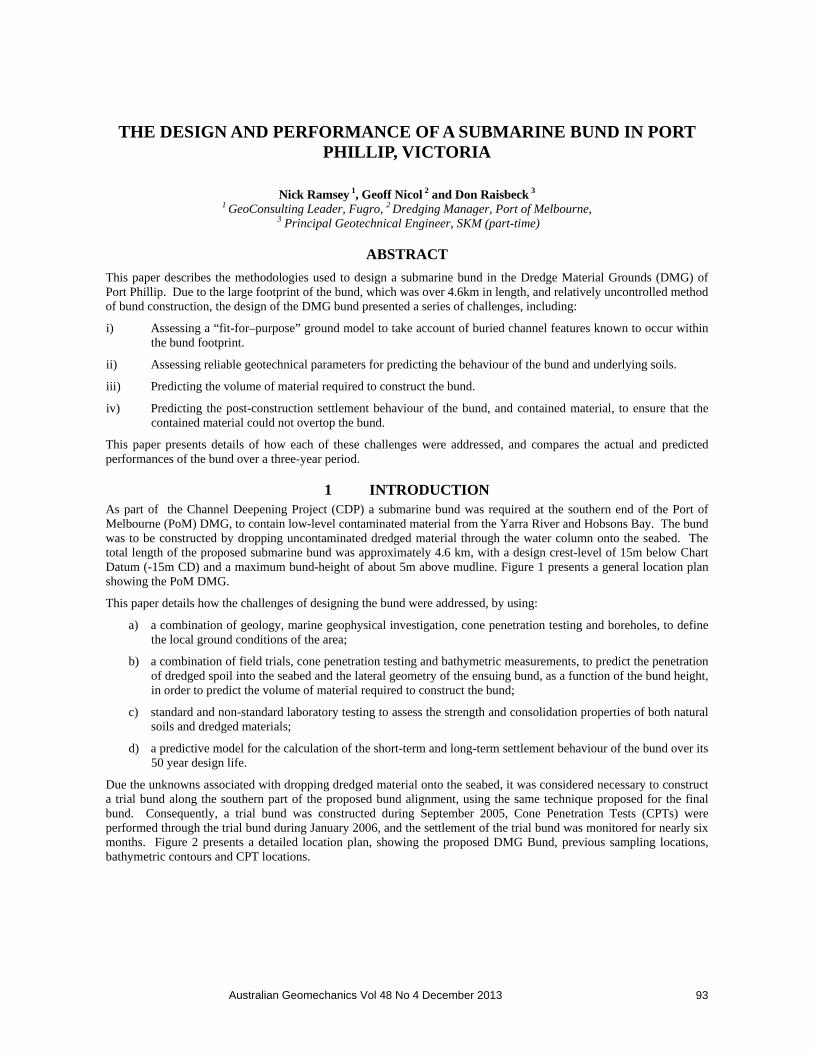
Holdgate et al. (2001) indicated that the central part of Port Phillip comprises an average of 4.4 m of softer deposits referred to as the Central Muds (CBM) overlying stiff clay material similar, in geological terms, to Fishermans Bend Silt (FBS). Additionally, Holdgate noted that occasionally there were deeper deposits of the CBM (as much as 30 m deep) associated with Late Pleistocene channels eroded into the surface of the underlying FBS. Figure 3 presents more recent information, published by Holdgate et al. (2011) including interpreted channel limits of the River Yarra, during the last glacial low stand - the DMG “Dump Ground” is clearly in the vicinity of the western channel.
2.2
Figure 3: Geology of Port Phillip (Reproduced from Holdgate et al., 2011)
2.2 GEOPHYSICS
Sub-bottom profiling using both low and high frequency geophysical pulses had been performed by Innomar Technologie GmbH during April 2005. The results indicates a “buried” channel aligned approximately NNW to SSE passed beneath part of the proposed bund area, confirming Holdgate’s 2001 and 2011 interpretations.
2.3 GEOTECHNICAL
Previous sampling and testing at the site (SKM, 2004) had provided design recommendations for the CBM and FBS soils. A summary of characteristic parameters is presented in Table 1.
Table 1: Selected Soil Parameters for Bund Stability and Settlement Analyses
SOIL TYPE Bulk Density (Mg/m3) su (kPa) CR (-) C(-)
Central Muds (CBM) 1.4 1.5 * d 0.3 0.012
Fishermans Bend Silt (FBS) 1.9 60 - -
Note: d = depth below original mudline in metres
3 TRIAL BUND The Trailer Suction Hopper Vessel, “The Queen of the Netherlands”, owned and operated by Boskalis, was used to construct the trial bund along the southern side of the DMG, using the same technique proposed for the main bund. The
THE DESIGN AND PERFORMANCE OF A SUBMARINE BUND IN PORT PHILLIP, VICTORIA RAMSEY et al.
Australian Geomechanics Vol 48 No 4 December 2013 96
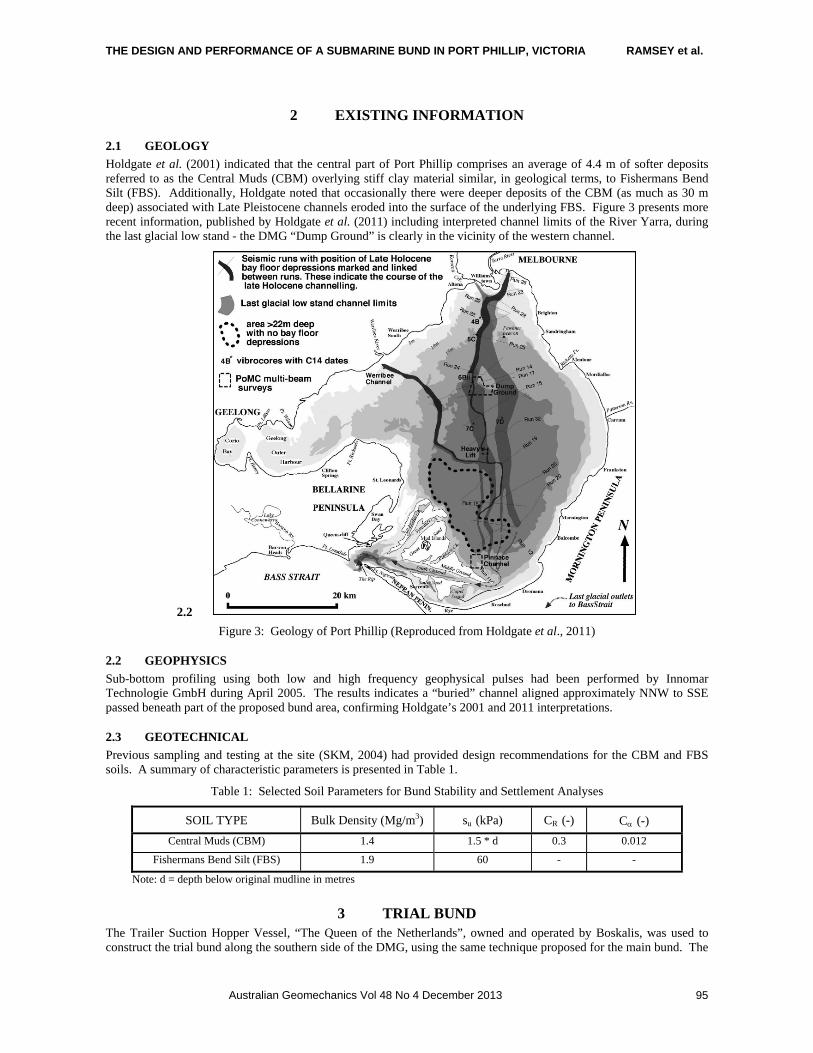
trial bund was purposely constructed at a series of heights to assess the effect of bund height on bund geometry and penetration. Representative samples of the bund material were taken during construction of the trial bund, for laboratory testing purposes. The samples were obtained by dropping a bucket beneath the hopper inlet pipe, as dredged material was deposited into the ship’s hopper. Figure 4 presents a series of photos illustrating the sampling process.
Figure 4: Sampling of Trial Bund Material
4 CONE PENETRATION TESTING
4.1 GENERAL
Cone Penetration Tests (CPTs) were performed during January 2006, approximately 120 days after the trial bund was constructed, in order to:
a) Assess the penetration of the trial bund material below mudline.
b) Estimate the strength of the trial bund material.
c) Assess the fabric of the trial bund.
d) Estimate the undrained shear strength of the CBM beneath the bund.
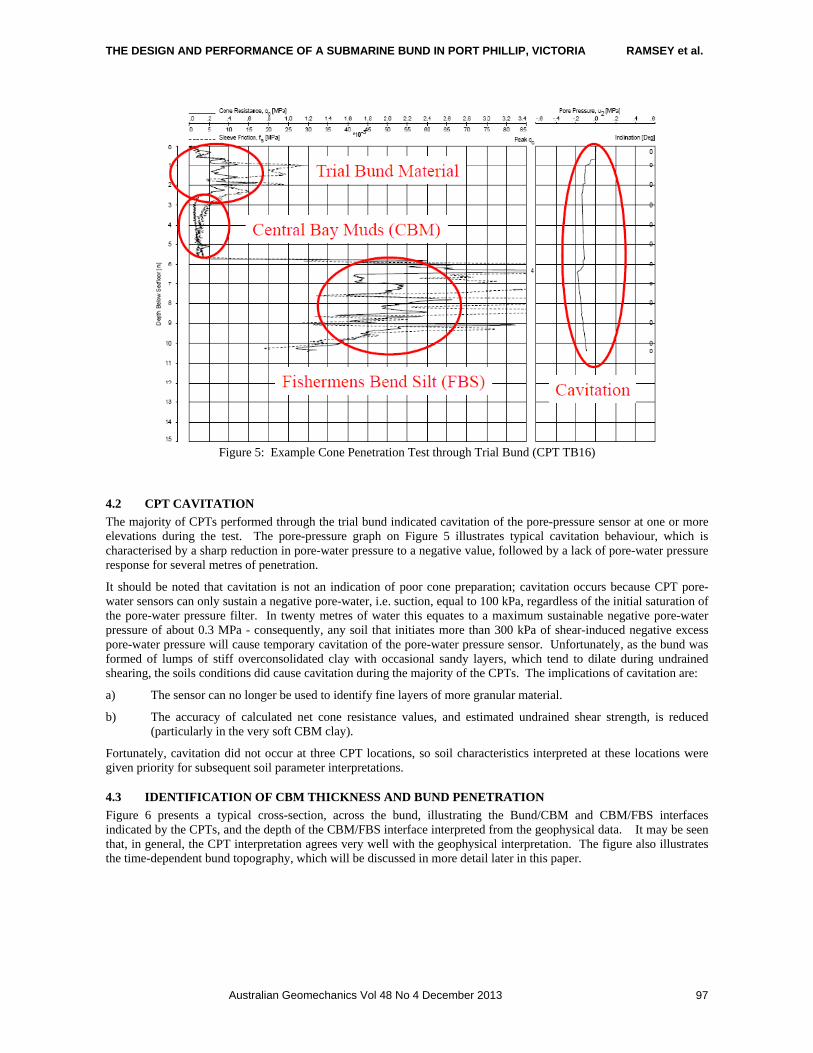
Twenty seven Cone Penetration Tests (CPTs) were performed at nine selected cross-sections across the trial bund. At each cross-section one CPT was performed on the top of the bund, one on the upstream face and one on the downstream face. The positions of the nine cross-sections are illustrated on Figure 2. The choice of cross-sections was based on a review of the available topographical and geophysical information, in order to optimise the usefulness of the acquired data. Figure 5 presents an example set of CPT results, showing the trial bund material, and the underlying CBM and FBS soils.
THE DESIGN AND PERFORMANCE OF A SUBMARINE BUND IN PORT PHILLIP, VICTORIA RAMSEY et al.
Australian Geomechanics Vol 48 No 4 December 2013 97
Figure 5: Example Cone Penetration Test through Trial Bund (CPT TB16)
4.2 CPT CAVITATION
The majority of CPTs performed through the trial bund indicated cavitation of the pore-pressure sensor at one or more elevations during the test. The pore-pressure graph on Figure 5 illustrates typical cavitation behaviour, which is characterised by a sharp reduction in pore-water pressure to a negative value, followed by a lack of pore-water pressure response for several metres of penetration.
It should be noted that cavitation is not an indication of poor cone preparation; cavitation occurs because CPT pore-water sensors can only sustain a negative pore-water, i.e. suction, equal to 100 kPa, regardless of the initial saturation of the pore-water pressure filter. In twenty metres of water this equates to a maximum sustainable negative pore-water pressure of about 0.3 MPa - consequently, any soil that initiates more than 300 kPa of shear-induced negative excess pore-water pressure will cause temporary cavitation of the pore-water pressure sensor. Unfortunately, as the bund was formed of lumps of stiff overconsolidated clay with occasional sandy layers, which tend to dilate during undrained shearing, the soils conditions did cause cavitation during the majority of the CPTs. The implications of cavitation are:
a) The sensor can no longer be used to identify fine layers of more granular material.
b) The accuracy of calculated net cone resistance values, and estimated undrained shear strength, is reduced (particularly in the very soft CBM clay).
Fortunately, cavitation did not occur at three CPT locations, so soil characteristics interpreted at these locations were given priority for subsequent soil parameter interpretations.
4.3 IDENTIFICATION OF CBM THICKNESS AND BUND PENETRATION
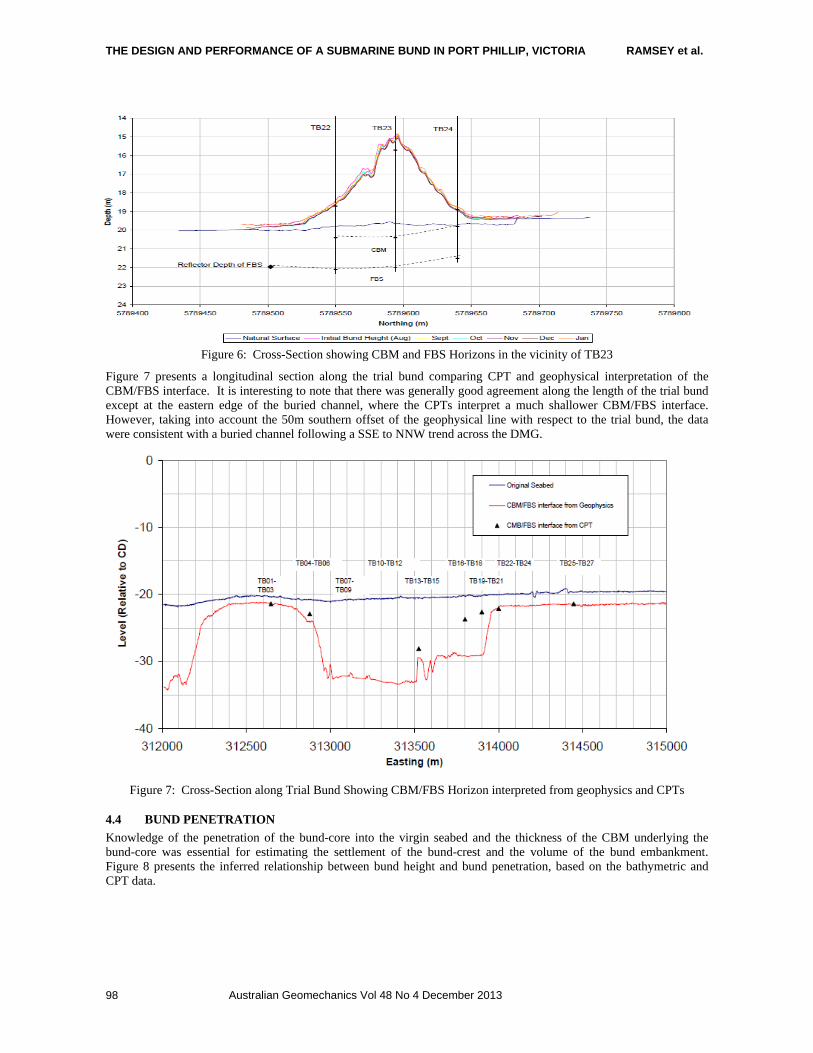
Figure 6 presents a typical cross-section, across the bund, illustrating the Bund/CBM and CBM/FBS interfaces indicated by the CPTs, and the depth of the CBM/FBS interface interpreted from the geophysical data. It may be seen that, in general, the CPT interpretation agrees very well with the geophysical interpretation. The figure also illustrates the time-dependent bund topography, which will be discussed in more detail later in this paper.
THE DESIGN AND PERFORMANCE OF A SUBMARINE BUND IN PORT PHILLIP, VICTORIA RAMSEY et al.
Australian Geomechanics Vol 48 No 4 December 2013 98
Figure 6: Cross-Section showing CBM and FBS Horizons in the vicinity of TB23
Figure 7 presents a longitudinal section along the trial bund comparing CPT and geophysical interpretation of the CBM/FBS interface. It is interesting to note that there was generally good agreement along the length of the trial bund except at the eastern edge of the buried channel, where the CPTs interpret a much shallower CBM/FBS interface. However, taking into account the 50m southern offset of the geophysical line with respect to the trial bund, the data were consistent with a buried channel following a SSE to NNW trend across the DMG.
Figure 7: Cross-Section along Trial Bund Showing CBM/FBS Horizon interpreted from geophysics and CPTs
4.4 BUND PENETRATION
Knowledge of the penetration of the bund-core into the virgin seabed and the thickness of the CBM underlying the bund-core was essential for estimating the settlement of the bund-crest and the volume of the bund embankment. Figure 8 presents the inferred relationship between bund height and bund penetration, based on the bathymetric and CPT data.

THE DESIGN AND PERFORMANCE OF A SUBMARINE BUND IN PORT PHILLIP, VICTORIA RAMSEY et al.
Australian Geomechanics Vol 48 No 4 December 2013 99
Figure 8: Bund Penetration versus Bund Height
It may be seen that:
a) Six of the data points at the crest locations are in good agreement and appear to be largely independent of the thickness of the underlying CBM clay. These data points were, therefore, considered to form the Best Estimate relationship. The bund penetration, in this instance, was just under three-fifths of the bund height above the original mudline level. For design purposes, therefore, the average penetration was assumed to be three-fifths of the bund height (or the CBM thickness if this was interpreted to be lower).
b) Two data points (Locations TB-08 and TB-23) seem to form a lower bound relationship, where the bund material did not penetrate significantly into the underlying CBM. The reasons for this behaviour are believed to be due to the presence of more sandy material at TB-08 that effectively formed a load-distributing “mat” for the second dumping sequence. At Location TB-23 the thickness of the underlying very soft clay is relatively low and the strength is higher than elsewhere, possibly as a result of previous dumping of dredged material at the location.
c) A much higher ratio of bund penetration to bund height was observed at Location TB-02. However, the CPT data indicate an unusual trend of the CBM/FBS interface, which was inferred to suggest that there was a local buried channel feature with its base below the crest. This buried channel had constrained the bund material from moving outwards and therefore increased the penetration below the crest.
4.5 BUND SLOPE
The trial bund shape was observed to be strongly influenced by the bund height. Taking this observation into account, the bund slope at each CPT cross-section was fitted using a power law relationship of the form given in Equation 1:
bxaH * (1)
Where H is the height of the bund above the original mudline, x is the horizontal distance from the edge of the bund and a and b are curve fitting parameters that vary linearly with bund-height. The best-fit equations for a and b are presented in Equations 2 and 3: a = 0.026 – 0.003*H (2) b = 0.91 + 0.104 * H (3)
THE DESIGN AND PERFORMANCE OF A SUBMARINE BUND IN PORT PHILLIP, VICTORIA RAMSEY et al.
Australian Geomechanics Vol 48 No 4 December 2013 100
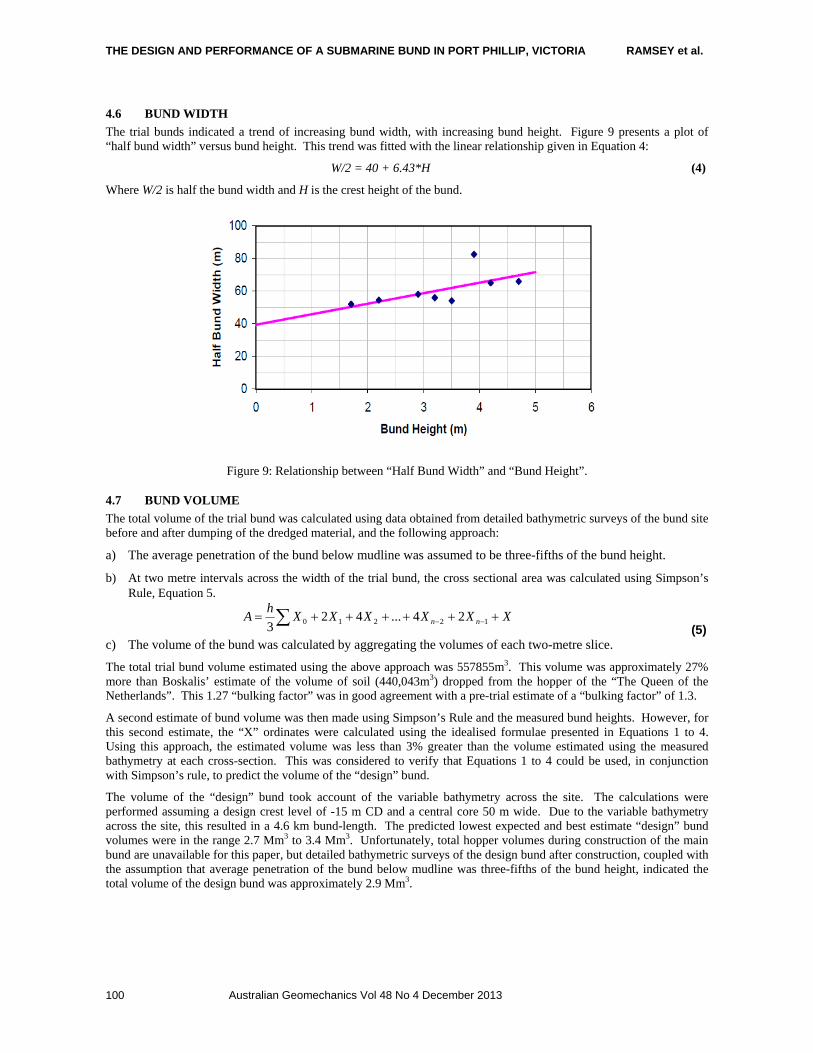
4.6 BUND WIDTH
The trial bunds indicated a trend of increasing bund width, with increasing bund height. Figure 9 presents a plot of “half bund width” versus bund height. This trend was fitted with the linear relationship given in Equation 4:
W/2 = 40 + 6.43*H (4)
Where W/2 is half the bund width and H is the crest height of the bund.
Figure 9: Relationship between “Half Bund Width” and “Bund Height”.
4.7 BUND VOLUME
The total volume of the trial bund was calculated using data obtained from detailed bathymetric surveys of the bund site before and after dumping of the dredged material, and the following approach:
a) The average penetration of the bund below mudline was assumed to be three-fifths of the bund height.
b) At two metre intervals across the width of the trial bund, the cross sectional area was calculated using Simpson’s Rule, Equation 5.
XXXXXXh
A nn 12210 24...423 (5)
c) The volume of the bund was calculated by aggregating the volumes of each two-metre slice.
The total trial bund volume estimated using the above approach was 557855m3. This volume was approximately 27% more than Boskalis’ estimate of the volume of soil (440,043m3) dropped from the hopper of the “The Queen of the Netherlands”. This 1.27 “bulking factor” was in good agreement with a pre-trial estimate of a “bulking factor” of 1.3.
A second estimate of bund volume was then made using Simpson’s Rule and the measured bund heights. However, for this second estimate, the “X” ordinates were calculated using the idealised formulae presented in Equations 1 to 4. Using this approach, the estimated volume was less than 3% greater than the volume estimated using the measured bathymetry at each cross-section. This was considered to verify that Equations 1 to 4 could be used, in conjunction with Simpson’s rule, to predict the volume of the “design” bund.
The volume of the “design” bund took account of the variable bathymetry across the site. The calculations were performed assuming a design crest level of -15 m CD and a central core 50 m wide. Due to the variable bathymetry across the site, this resulted in a 4.6 km bund-length. The predicted lowest expected and best estimate “design” bund volumes were in the range 2.7 Mm3 to 3.4 Mm3. Unfortunately, total hopper volumes during construction of the main bund are unavailable for this paper, but detailed bathymetric surveys of the design bund after construction, coupled with the assumption that average penetration of the bund below mudline was three-fifths of the bund height, indicated the total volume of the design bund was approximately 2.9 Mm3.
THE DESIGN AND PERFORMANCE OF A SUBMARINE BUND IN PORT PHILLIP, VICTORIA RAMSEY et al.
Australian Geomechanics Vol 48 No 4 December 2013 101
5 ASSESSING BUND SETTLEMENT PARAMETERS
5.1 CONSOLIDOMETER TESTING
5.1.1 General
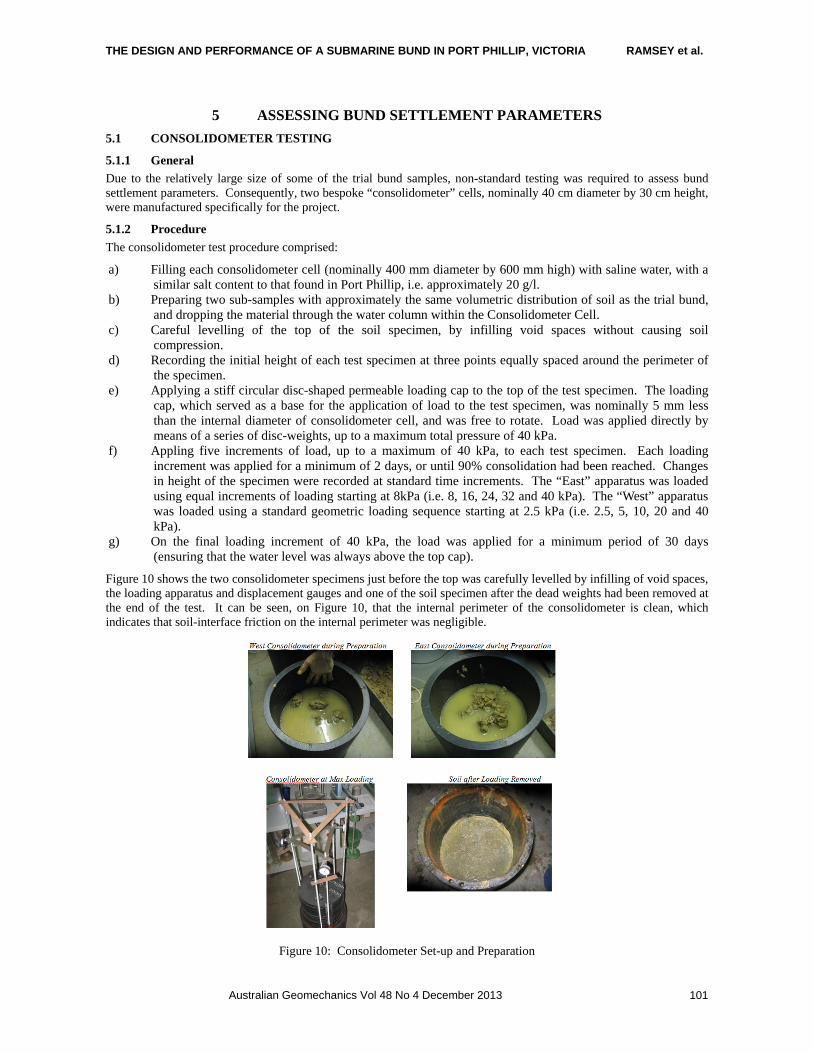
Due to the relatively large size of some of the trial bund samples, non-standard testing was required to assess bund settlement parameters. Consequently, two bespoke “consolidometer” cells, nominally 40 cm diameter by 30 cm height, were manufactured specifically for the project.
5.1.2 Procedure
The consolidometer test procedure comprised:
a) Filling each consolidometer cell (nominally 400 mm diameter by 600 mm high) with saline water, with a similar salt content to that found in Port Phillip, i.e. approximately 20 g/l.
b) Preparing two sub-samples with approximately the same volumetric distribution of soil as the trial bund, and dropping the material through the water column within the Consolidometer Cell.
c) Careful levelling of the top of the soil specimen, by infilling void spaces without causing soil compression.
d) Recording the initial height of each test specimen at three points equally spaced around the perimeter of the specimen.
e) Applying a stiff circular disc-shaped permeable loading cap to the top of the test specimen. The loading cap, which served as a base for the application of load to the test specimen, was nominally 5 mm less than the internal diameter of consolidometer cell, and was free to rotate. Load was applied directly by means of a series of disc-weights, up to a maximum total pressure of 40 kPa.
f) Appling five increments of load, up to a maximum of 40 kPa, to each test specimen. Each loading increment was applied for a minimum of 2 days, or until 90% consolidation had been reached. Changes in height of the specimen were recorded at standard time increments. The “East” apparatus was loaded using equal increments of loading starting at 8kPa (i.e. 8, 16, 24, 32 and 40 kPa). The “West” apparatus was loaded using a standard geometric loading sequence starting at 2.5 kPa (i.e. 2.5, 5, 10, 20 and 40 kPa).
g) On the final loading increment of 40 kPa, the load was applied for a minimum period of 30 days (ensuring that the water level was always above the top cap).
Figure 10 shows the two consolidometer specimens just before the top was carefully levelled by infilling of void spaces, the loading apparatus and displacement gauges and one of the soil specimen after the dead weights had been removed at the end of the test. It can be seen, on Figure 10, that the internal perimeter of the consolidometer is clean, which indicates that soil-interface friction on the internal perimeter was negligible.
Figure 10: Consolidometer Set-up and Preparation
THE DESIGN AND PERFORMANCE OF A SUBMARINE BUND IN PORT PHILLIP, VICTORIA RAMSEY et al.
Australian Geomechanics Vol 48 No 4 December 2013 102
5.1.3 Summary of Consolidometer Test Results
The Consolidometer test results are summarised in Table 2. As expected, all values, except the compression ratio, varied with the applied vertical effective stress. More detailed discussions, on each parameter, are presented in the following sub-sections.
Table 2: Summary of Consolidometer Test Results
Range of Vertical Effective Stress (kPa)
Range of Vertical Strain (%)
Bulk Density(kN/m3)
cv (m2/year)
CR (-)
C (-)
k (m/s)
0 to 40 0 to 10.4(1) 1.73 to 1.97(1) 15 to >600(1) 0.08 1E-3 to 3E-3 2E-6 to 1E-8(1)
Note: (1) = Indicated value varies with applied effective vertical stress
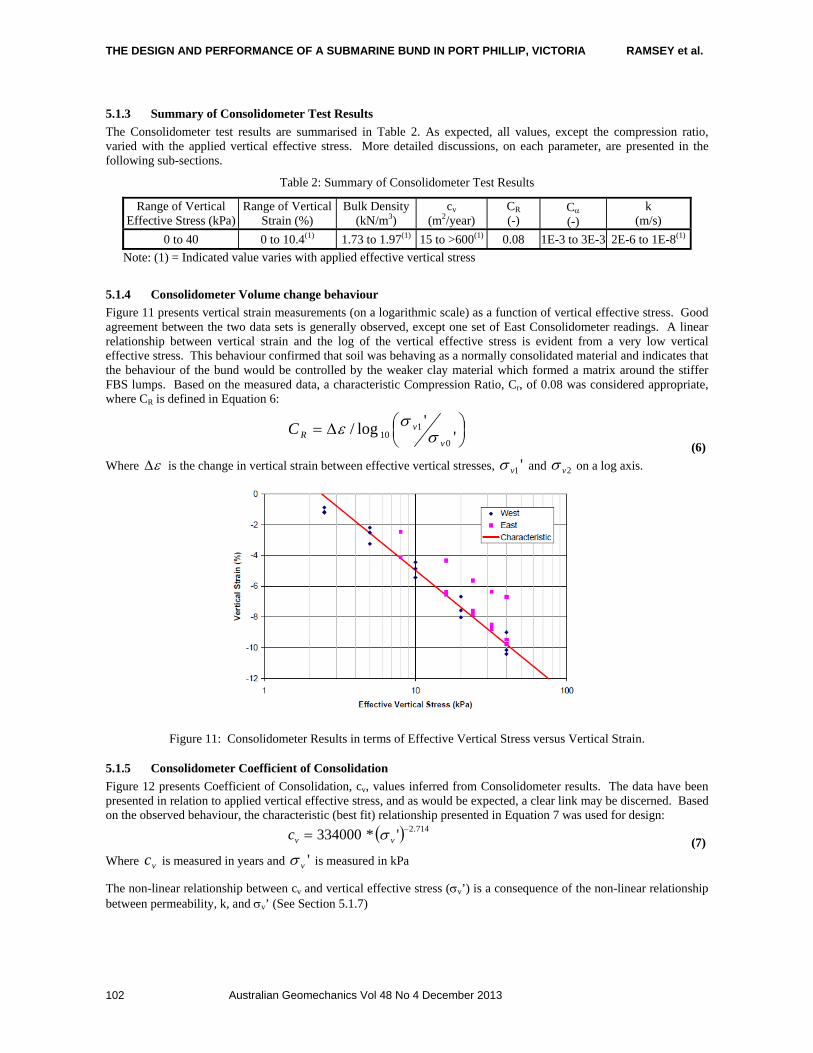
5.1.4 Consolidometer Volume change behaviour
Figure 11 presents vertical strain measurements (on a logarithmic scale) as a function of vertical effective stress. Good agreement between the two data sets is generally observed, except one set of East Consolidometer readings. A linear relationship between vertical strain and the log of the vertical effective stress is evident from a very low vertical effective stress. This behaviour confirmed that soil was behaving as a normally consolidated material and indicates that the behaviour of the bund would be controlled by the weaker clay material which formed a matrix around the stiffer FBS lumps. Based on the measured data, a characteristic Compression Ratio, Cr, of 0.08 was considered appropriate, where CR is defined in Equation 6:
'
'log/0
110
v
vRC
(6)
Where is the change in vertical strain between effective vertical stresses, '1v and 2v on a log axis.
Figure 11: Consolidometer Results in terms of Effective Vertical Stress versus Vertical Strain.
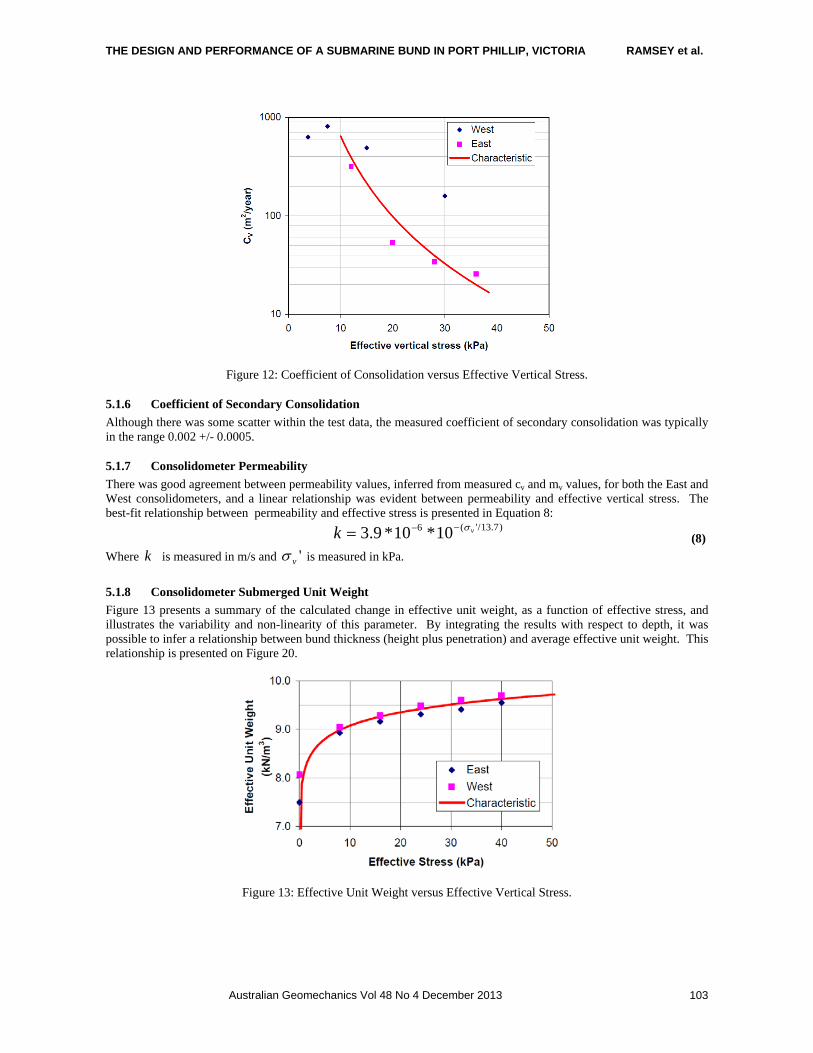
5.1.5 Consolidometer Coefficient of Consolidation
Figure 12 presents Coefficient of Consolidation, cv, values inferred from Consolidometer results. The data have been presented in relation to applied vertical effective stress, and as would be expected, a clear link may be discerned. Based on the observed behaviour, the characteristic (best fit) relationship presented in Equation 7 was used for design:
714.2'*334000 vvc
(7)
Where vc is measured in years and 'v is measured in kPa
The non-linear relationship between cv and vertical effective stress (v’) is a consequence of the non-linear relationship between permeability, k, and v’ (See Section 5.1.7)
THE DESIGN AND PERFORMANCE OF A SUBMARINE BUND IN PORT PHILLIP, VICTORIA RAMSEY et al.
Australian Geomechanics Vol 48 No 4 December 2013 103
Figure 12: Coefficient of Consolidation versus Effective Vertical Stress.
5.1.6 Coefficient of Secondary Consolidation
Although there was some scatter within the test data, the measured coefficient of secondary consolidation was typically in the range 0.002 +/- 0.0005.
5.1.7 Consolidometer Permeability
There was good agreement between permeability values, inferred from measured cv and mv values, for both the East and West consolidometers, and a linear relationship was evident between permeability and effective vertical stress. The best-fit relationship between permeability and effective stress is presented in Equation 8:
)7.13/'(6 10*10*9.3 vk (8)
Where k is measured in m/s and 'v is measured in kPa.
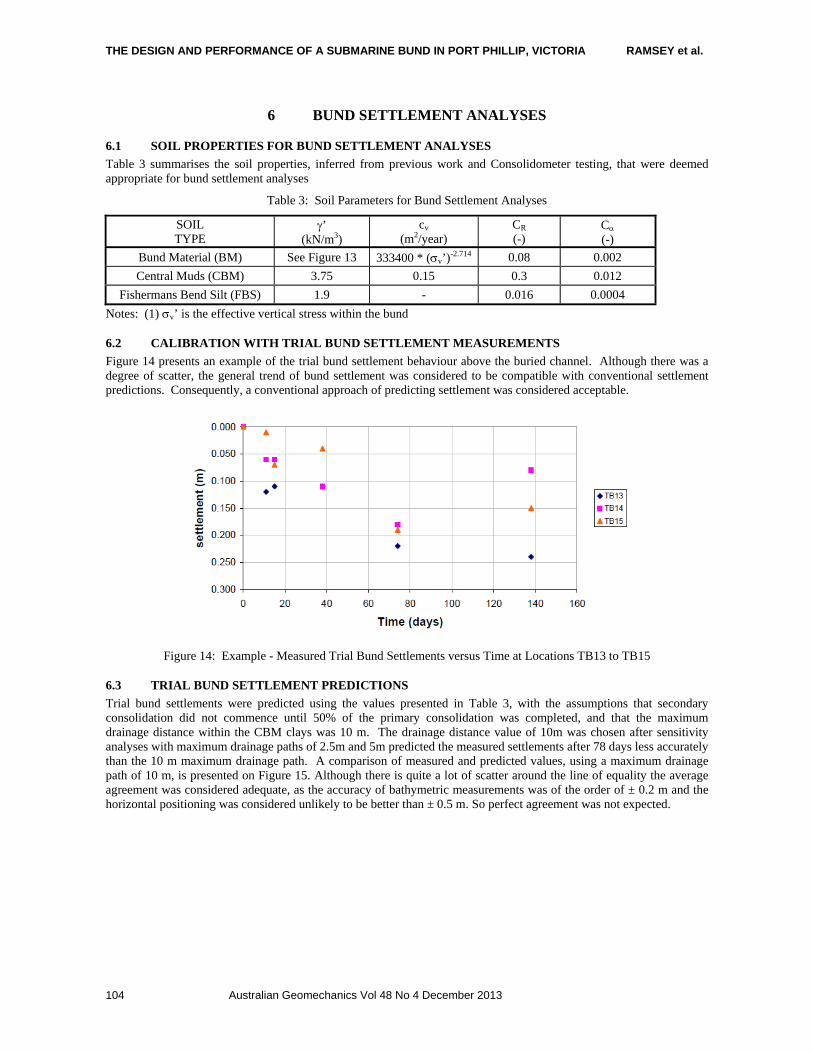
5.1.8 Consolidometer Submerged Unit Weight
Figure 13 presents a summary of the calculated change in effective unit weight, as a function of effective stress, and illustrates the variability and non-linearity of this parameter. By integrating the results with respect to depth, it was possible to infer a relationship between bund thickness (height plus penetration) and average effective unit weight. This relationship is presented on Figure 20.
Figure 13: Effective Unit Weight versus Effective Vertical Stress.
THE DESIGN AND PERFORMANCE OF A SUBMARINE BUND IN PORT PHILLIP, VICTORIA RAMSEY et al.
Australian Geomechanics Vol 48 No 4 December 2013 104
6 BUND SETTLEMENT ANALYSES
6.1 SOIL PROPERTIES FOR BUND SETTLEMENT ANALYSES
Table 3 summarises the soil properties, inferred from previous work and Consolidometer testing, that were deemed appropriate for bund settlement analyses
Table 3: Soil Parameters for Bund Settlement Analyses
SOIL TYPE
’ (kN/m3)
cv (m2/year)
CR (-)
C (-)
Bund Material (BM) See Figure 13 333400 * (v’)-2.714 0.08 0.002
Central Muds (CBM) 3.75 0.15 0.3 0.012
Fishermans Bend Silt (FBS) 1.9 - 0.016 0.0004
Notes: (1) v’ is the effective vertical stress within the bund
6.2 CALIBRATION WITH TRIAL BUND SETTLEMENT MEASUREMENTS
Figure 14 presents an example of the trial bund settlement behaviour above the buried channel. Although there was a degree of scatter, the general trend of bund settlement was considered to be compatible with conventional settlement predictions. Consequently, a conventional approach of predicting settlement was considered acceptable.
Figure 14: Example - Measured Trial Bund Settlements versus Time at Locations TB13 to TB15
6.3 TRIAL BUND SETTLEMENT PREDICTIONS
Trial bund settlements were predicted using the values presented in Table 3, with the assumptions that secondary consolidation did not commence until 50% of the primary consolidation was completed, and that the maximum drainage distance within the CBM clays was 10 m. The drainage distance value of 10m was chosen after sensitivity analyses with maximum drainage paths of 2.5m and 5m predicted the measured settlements after 78 days less accurately than the 10 m maximum drainage path. A comparison of measured and predicted values, using a maximum drainage path of 10 m, is presented on Figure 15. Although there is quite a lot of scatter around the line of equality the average agreement was considered adequate, as the accuracy of bathymetric measurements was of the order of ± 0.2 m and the horizontal positioning was considered unlikely to be better than ± 0.5 m. So perfect agreement was not expected.
THE DESIGN AND PERFORMANCE OF A SUBMARINE BUND IN PORT PHILLIP, VICTORIA RAMSEY et al.
Australian Geomechanics Vol 48 No 4 December 2013 105
Figure 15: Predicted and Measured Settlements of Trial Bund after 78 days.
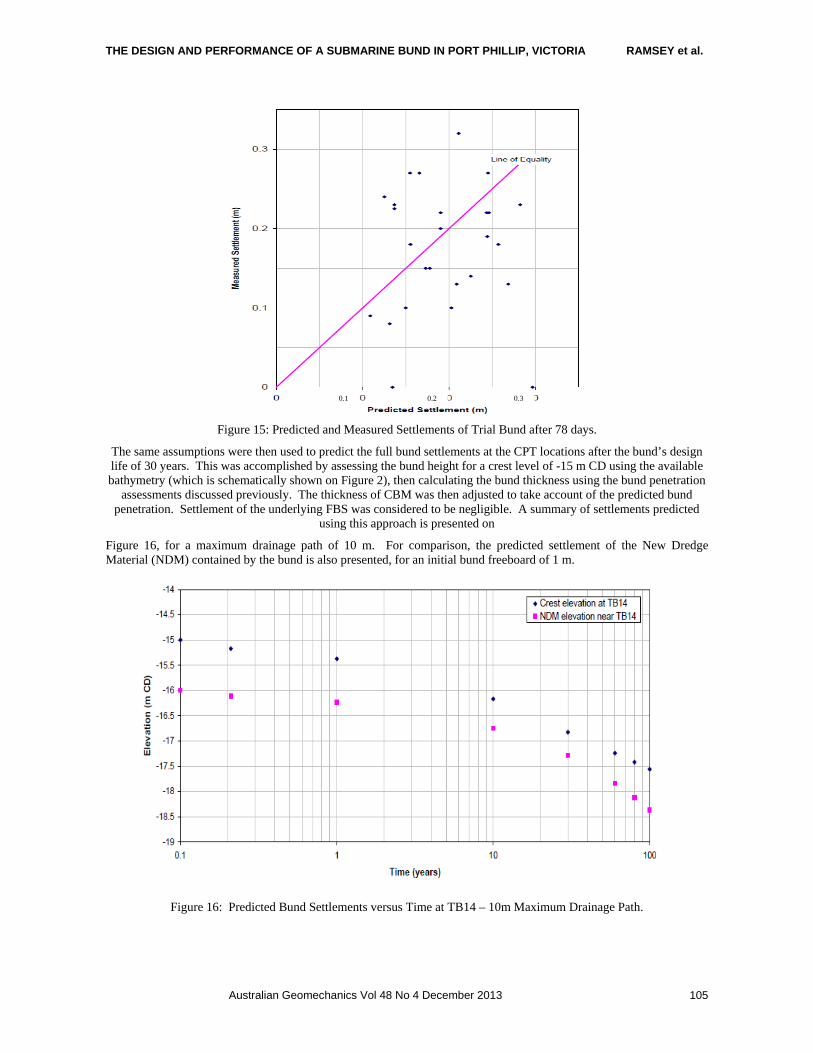
The same assumptions were then used to predict the full bund settlements at the CPT locations after the bund’s design life of 30 years. This was accomplished by assessing the bund height for a crest level of -15 m CD using the available bathymetry (which is schematically shown on Figure 2), then calculating the bund thickness using the bund penetration
assessments discussed previously. The thickness of CBM was then adjusted to take account of the predicted bund penetration. Settlement of the underlying FBS was considered to be negligible. A summary of settlements predicted
using this approach is presented on
Figure 16, for a maximum drainage path of 10 m. For comparison, the predicted settlement of the New Dredge Material (NDM) contained by the bund is also presented, for an initial bund freeboard of 1 m.
Figure 16: Predicted Bund Settlements versus Time at TB14 – 10m Maximum Drainage Path.
0.1 0.2 0.3
THE DESIGN AND PERFORMANCE OF A SUBMARINE BUND IN PORT PHILLIP, VICTORIA RAMSEY et al.
Australian Geomechanics Vol 48 No 4 December 2013 106
7 BUND STABILITY
7.1 UNDRAINED SHEAR STRENGTH INFERRED FROM LABORATORY RESULTS
On completion of each Consolidometer test, a series of sub-samples were obtained using 72 mm diameter, 2 mm wall-thickness, thin-wall “Shelby” tubes. The soil was sub-sampled, by carefully inserting thin-walled Shelby tubes. Once all the Shelby tubes had been inserted, tubes were individually removed by temporarily rotating the tube by a few degrees to initiate a drainage path on the outside of the tube and thus prevent suction build up during tube extraction.
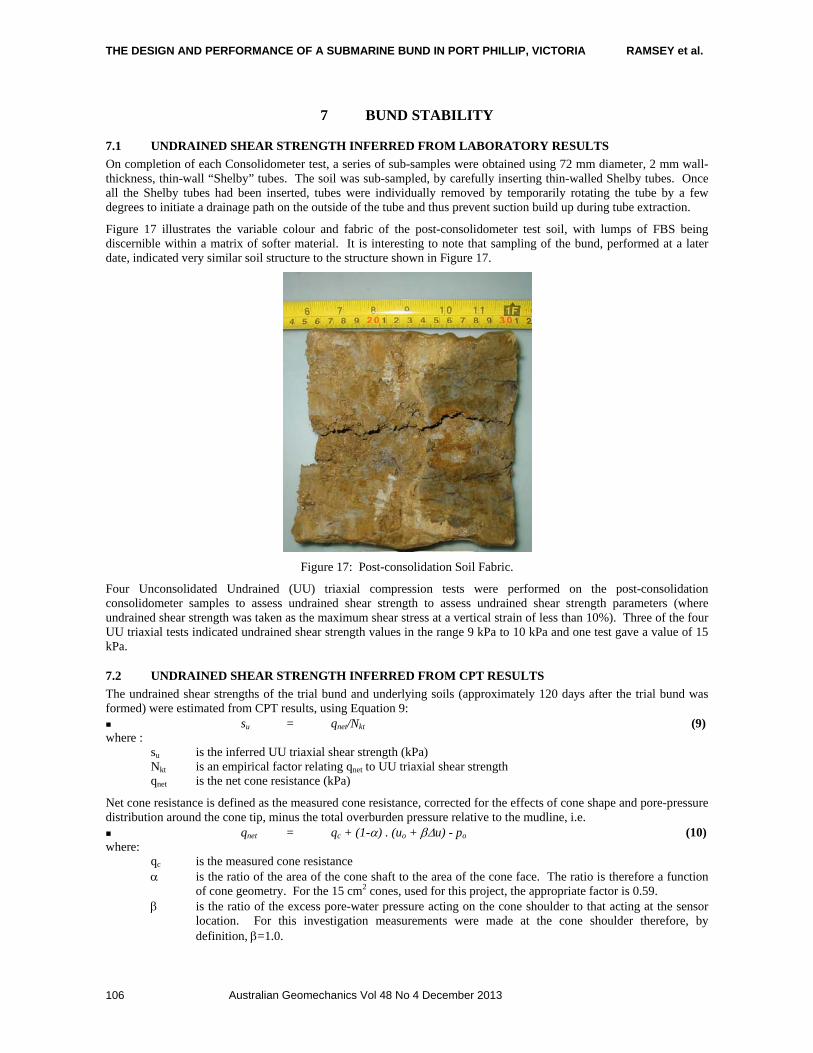
Figure 17 illustrates the variable colour and fabric of the post-consolidometer test soil, with lumps of FBS being discernible within a matrix of softer material. It is interesting to note that sampling of the bund, performed at a later date, indicated very similar soil structure to the structure shown in Figure 17.
Figure 17: Post-consolidation Soil Fabric.
Four Unconsolidated Undrained (UU) triaxial compression tests were performed on the post-consolidation consolidometer samples to assess undrained shear strength to assess undrained shear strength parameters (where undrained shear strength was taken as the maximum shear stress at a vertical strain of less than 10%). Three of the four UU triaxial tests indicated undrained shear strength values in the range 9 kPa to 10 kPa and one test gave a value of 15 kPa.
7.2 UNDRAINED SHEAR STRENGTH INFERRED FROM CPT RESULTS
The undrained shear strengths of the trial bund and underlying soils (approximately 120 days after the trial bund was formed) were estimated from CPT results, using Equation 9: su = qnet/Nkt (9) where :
su is the inferred UU triaxial shear strength (kPa) Nkt is an empirical factor relating qnet to UU triaxial shear strength qnet is the net cone resistance (kPa)
Net cone resistance is defined as the measured cone resistance, corrected for the effects of cone shape and pore-pressure distribution around the cone tip, minus the total overburden pressure relative to the mudline, i.e. qnet = qc + (1-) . (uo + u) - po (10) where:
qc is the measured cone resistance is the ratio of the area of the cone shaft to the area of the cone face. The ratio is therefore a function
of cone geometry. For the 15 cm2 cones, used for this project, the appropriate factor is 0.59. is the ratio of the excess pore-water pressure acting on the cone shoulder to that acting at the sensor
location. For this investigation measurements were made at the cone shoulder therefore, by definition, =1.0.
THE DESIGN AND PERFORMANCE OF A SUBMARINE BUND IN PORT PHILLIP, VICTORIA RAMSEY et al.
Australian Geomechanics Vol 48 No 4 December 2013 107
uo is the theoretical hydrostatic water pressure relative to mudline acting at the elevation of the cone face.
u is the pore-water pressure in excess of the theoretical hydrostatic pore-water pressure relative to mudline.
po is the total overburden pressure relative to mudline.
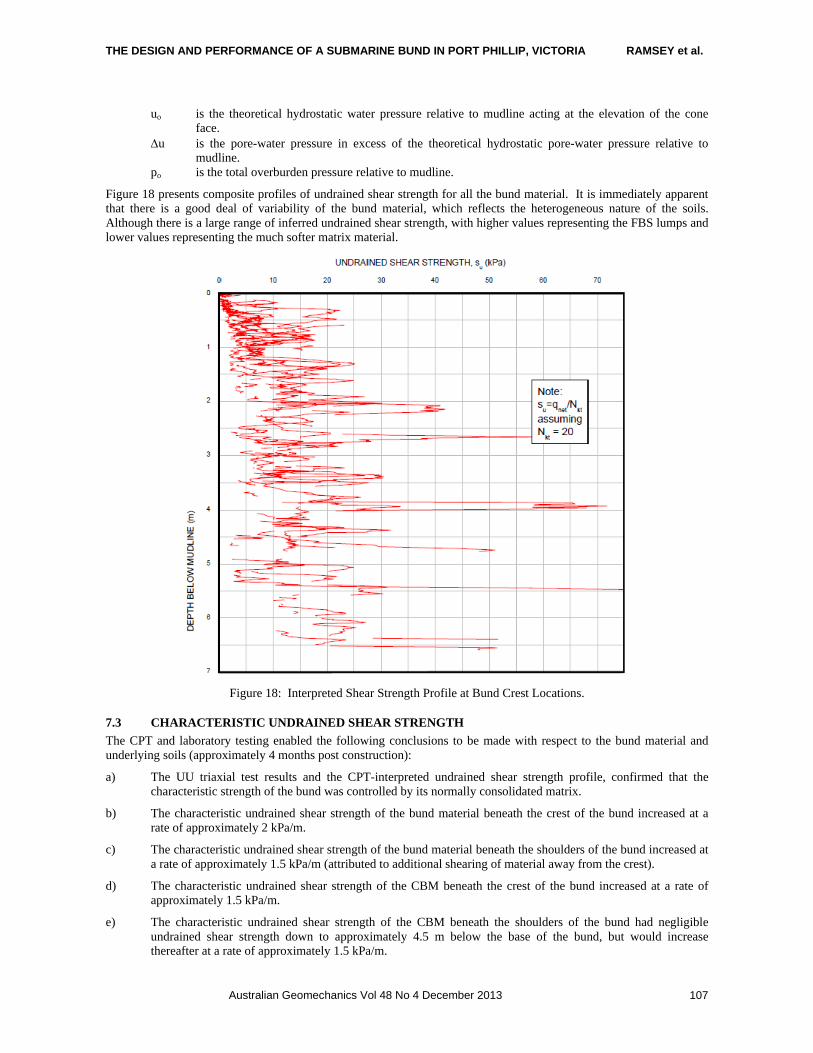
Figure 18 presents composite profiles of undrained shear strength for all the bund material. It is immediately apparent that there is a good deal of variability of the bund material, which reflects the heterogeneous nature of the soils. Although there is a large range of inferred undrained shear strength, with higher values representing the FBS lumps and lower values representing the much softer matrix material.
Figure 18: Interpreted Shear Strength Profile at Bund Crest Locations.
7.3 CHARACTERISTIC UNDRAINED SHEAR STRENGTH
The CPT and laboratory testing enabled the following conclusions to be made with respect to the bund material and underlying soils (approximately 4 months post construction):
a) The UU triaxial test results and the CPT-interpreted undrained shear strength profile, confirmed that the characteristic strength of the bund was controlled by its normally consolidated matrix.
b) The characteristic undrained shear strength of the bund material beneath the crest of the bund increased at a rate of approximately 2 kPa/m.
c) The characteristic undrained shear strength of the bund material beneath the shoulders of the bund increased at a rate of approximately 1.5 kPa/m (attributed to additional shearing of material away from the crest).
d) The characteristic undrained shear strength of the CBM beneath the crest of the bund increased at a rate of approximately 1.5 kPa/m.
e) The characteristic undrained shear strength of the CBM beneath the shoulders of the bund had negligible undrained shear strength down to approximately 4.5 m below the base of the bund, but would increase thereafter at a rate of approximately 1.5 kPa/m.
THE DESIGN AND PERFORMANCE OF A SUBMARINE BUND IN PORT PHILLIP, VICTORIA RAMSEY et al.
Australian Geomechanics Vol 48 No 4 December 2013 108
7.4 BUND STABILITY
Due to the method of construction, the factor of safety of the bund immediately after construction was effectively one, but the stability increased with time as excess pore-water pressures, developed during construction, dissipated. Due to the size and mass of the bund, and the relatively shallow slopes, the only credible problem to bund stability was considered to be the risk of a seismic event temporarily reducing effective stresses in and around the bund. It was concluded, however, that even if the seismic event was powerful enough, and of sufficient duration, to reduce the effective stress in the bund and underlying CBM, then movements would tend to be vertically downwards. Consequently, it was considered that the implications of a significant earthquake would be a requirement for further soil dumping rather than total rupture of the bund.
8 BUND MONITORING Monitoring of the bund was recommended at least once per year during the first five years after construction, and at five
yearly intervals, thereafter, during its 30-year design life. The purpose of the monitoring was primarily to ensure that the bund continued to contain the NDM, and to ensure that the NDM was always lower than the bund-crest.
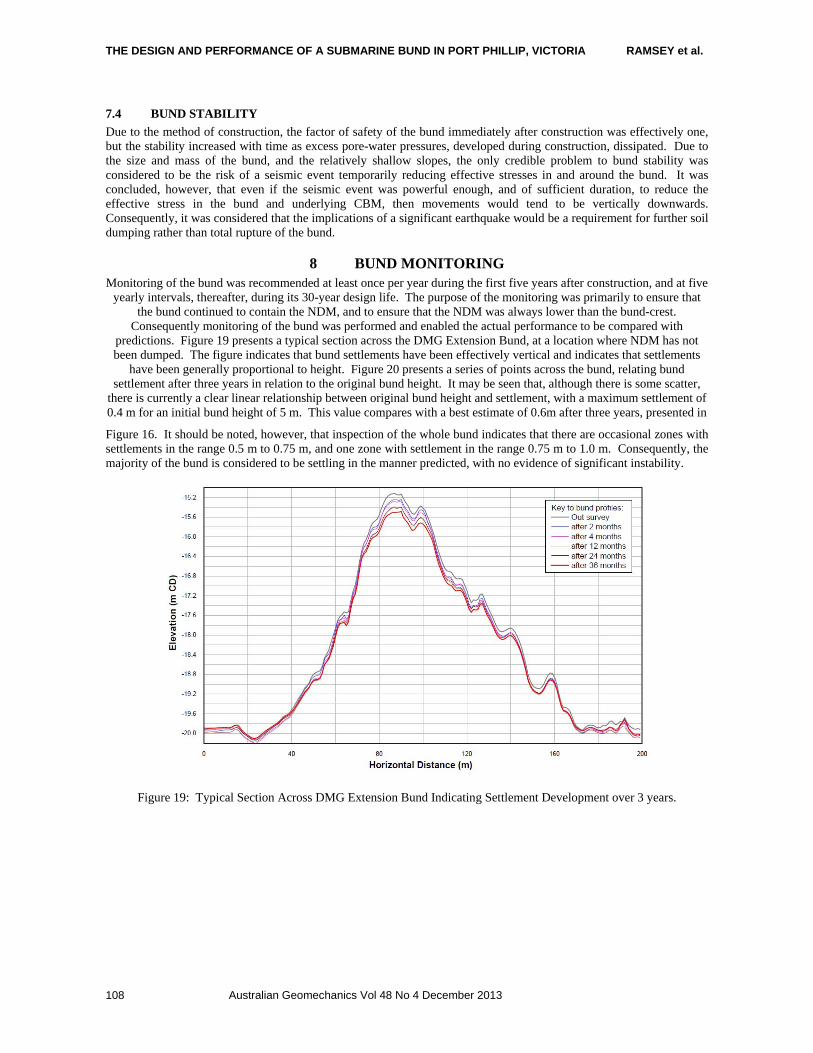
Consequently monitoring of the bund was performed and enabled the actual performance to be compared with predictions. Figure 19 presents a typical section across the DMG Extension Bund, at a location where NDM has not been dumped. The figure indicates that bund settlements have been effectively vertical and indicates that settlements
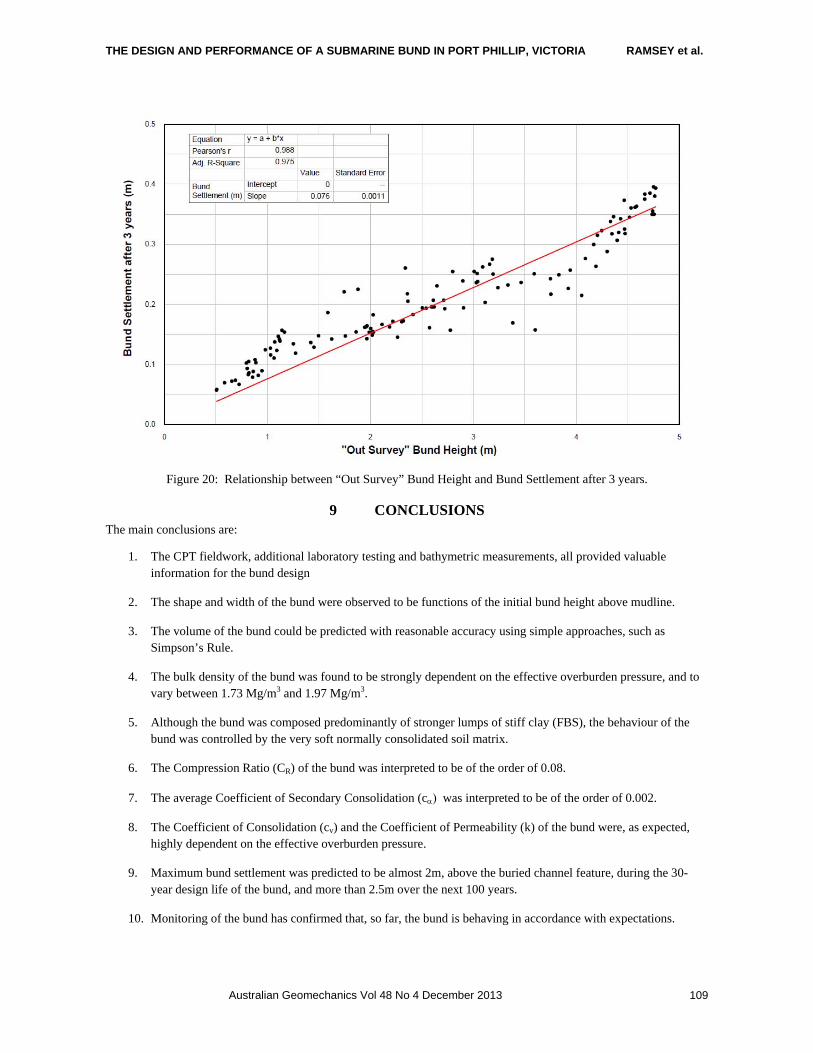
have been generally proportional to height. Figure 20 presents a series of points across the bund, relating bund settlement after three years in relation to the original bund height. It may be seen that, although there is some scatter,
there is currently a clear linear relationship between original bund height and settlement, with a maximum settlement of 0.4 m for an initial bund height of 5 m. This value compares with a best estimate of 0.6m after three years, presented in
Figure 16. It should be noted, however, that inspection of the whole bund indicates that there are occasional zones with settlements in the range 0.5 m to 0.75 m, and one zone with settlement in the range 0.75 m to 1.0 m. Consequently, the majority of the bund is considered to be settling in the manner predicted, with no evidence of significant instability.
Figure 19: Typical Section Across DMG Extension Bund Indicating Settlement Development over 3 years.
THE DESIGN AND PERFORMANCE OF A SUBMARINE BUND IN PORT PHILLIP, VICTORIA RAMSEY et al.
Australian Geomechanics Vol 48 No 4 December 2013 109
Figure 20: Relationship between “Out Survey” Bund Height and Bund Settlement after 3 years.
9 CONCLUSIONS The main conclusions are:
1. The CPT fieldwork, additional laboratory testing and bathymetric measurements, all provided valuable information for the bund design
2. The shape and width of the bund were observed to be functions of the initial bund height above mudline.
3. The volume of the bund could be predicted with reasonable accuracy using simple approaches, such as Simpson’s Rule.
4. The bulk density of the bund was found to be strongly dependent on the effective overburden pressure, and to vary between 1.73 Mg/m3 and 1.97 Mg/m3.
5. Although the bund was composed predominantly of stronger lumps of stiff clay (FBS), the behaviour of the bund was controlled by the very soft normally consolidated soil matrix.
6. The Compression Ratio (CR) of the bund was interpreted to be of the order of 0.08.
7. The average Coefficient of Secondary Consolidation (c was interpreted to be of the order of 0.002.
8. The Coefficient of Consolidation (cv) and the Coefficient of Permeability (k) of the bund were, as expected, highly dependent on the effective overburden pressure.
9. Maximum bund settlement was predicted to be almost 2m, above the buried channel feature, during the 30-year design life of the bund, and more than 2.5m over the next 100 years.
10. Monitoring of the bund has confirmed that, so far, the bund is behaving in accordance with expectations.

THE DESIGN AND PERFORMANCE OF A SUBMARINE BUND IN PORT PHILLIP, VICTORIA RAMSEY et al.
Australian Geomechanics Vol 48 No 4 December 2013 110
10 ACKNOWLEDGEMENTS The authors would like to thank Port of Melbourne Corporation, for giving permission to publish this paper, and Dr Guy Holdgate, of the University of Melbourne, for giving permission to reproduce Figure 3 of this paper.
11 REFERENCES AGS (1996), “Building on Coode Island Silt”, April 1996, Seminar Arranged by Australian Geomechanics Society AS1289 “Methods of Testing Soils for Engineering Purposes” Australian Standard. Holdgate, G R., Geurin, B., Wallace, M W., & Gallagher, S J. (2001). “Marine Geology of Port Phillip, Victoria”
Australian Journal of Earth Sciences, vol.48, no.3, pp.439-455. Holdgate, G R., Wagstaff B, Gallagher, S. (2011) “Did Port Phillip nearly dry up between ~2800 and 1000 cal. yr BP?
floor channelling evidence, seismic and core dating”, Australian Journal of Earth Sciences, 58, pp 157-175. SKM (2005) Final Bund Design Report, Channel Deepening Project – EES, Port of Melbourne – Dredged Material
Grounds, for PoMC, 21st May 2005. SKM (2006) “Supplementary Bund Design Report, Channel Deepening Project – EES, Port of Melbourne – Dredged
Material Grounds”, for PoMC, 2nd June 2006. Terzaghi K, Peck R. B, “Soil Mechanics in Engineering Practice (2nd Ed)”, John Wiley and Sons, 1948.
12 SYMBOLS AND ABBREVIATIONS Af = Skempton's pore-water pressure parameter at failure
B = Skempton's pore-pressure parameter
BML = Below Mudline
CBM = Central Bay Muds
CD = Chart Datum
CPT = Cone Penetration Test (with pore-water pressure measurements)
CR = Compression ratio
cv = coefficient of primary consolidation
c = coefficient of secondary consolidation
FBS = Fishermans Bend Silt
= effective unit weight of soil
Ip = plasticity index
k = coefficient of permeability
M = constrained modulus (one-dimensional consolidation)
mv = coefficient of compressibility
NDM = New Dredged Material, i.e. material subsequently deposited behind the bund.
Nkt = cone factor (qnet/su)
PD = particle density
PoM = Port of Melbourne
po = effective overburden pressure in situ
pc = vertical effective pre-consolidation pressure in situ
su = undrained shear strength
UU = unconsolidated undrained triaxial compression test
u = pore-water pressure
w = water content
u = change in pore-water pressure
v = vertical strain
Australian Geomechanics Vol 48 No 4 December 2013 111
OFFSHORE GROUND IMPROVEMENT RECORDS
Babak Hamidi(1), Jean-Marc Debats(2), Hamid Nikraz(3) and Serge Varaksin(4) (1) Civil Engineering Department, Curtin University
(2) Vibro Services (GFWA & Menard Bachy in Australia) & immediate past Chairman of ISSMGE TC-211 (3) Professor & Head of Civil Engineering Department, Curtin University
(4) Chairman of ISSMGE TC-211
ABSTRACT
Numerous ground improvement technologies have been in use for many years on land based projects with various applications. These techniques have provided alternatives that are frequently more affordable and require shorter construction periods than deep foundations. Implementation of these methods in the sea and marine environments is more challenging as specialised equipment is usually either only appropriate for land based projects or have low efficiency and production capability at sea. However, requirement of seabed treatment and improving the characteristics of marine foundations has necessitated the introduction of soil improvement technologies to offshore projects. Some of the ground improvement techniques that have especially evolved to satisfy the requirements of offshore and seabed ground improvement are dynamic compaction, vibro compaction, dynamic replacement, and stone columns. The first two techniques are used for the treatment of granular seabed while the latter two technologies are most appropriate for improving silty and clayey marine foundations. In this paper initially marine and offshore ground improvement techniques with a focus on the mentioned above methods will be discussed. Two case studies of ground improvement for the treatment of soft clays in record water depths will also be introduced. In the first case offshore dynamic replacement was carried out in Southeast Asia at a location where seabed was approximately 30 m below sea level. In the second project stone columns were installed beneath the quay wall and breakwater of the first and second phases of Port of Patras (Greece). The sea depth was up to approximately 40 m and the columns were as long as 20 m.
1 INTRODUCTION Ground improvement, as we know it by its modern definition, began to take the form of a branch of geotechnical engineering in the mid-20th century, and was finally realised as the 17th technical committee of ISSMGE many years ago (Varaksin and Hamidi, 2012). While it may not be immediately apparent, ground improvement methods have made considerable advances since today’s commonly practiced techniques first began to develop and evolve in the first half of the 20th century; however most techniques have gone through changes, mostly due to new ideas, advances and innovations in equipment and technological capabilities and the emergence of newer technologies has provided the geotechnical engineer with additional tools for optimising foundation design and treatment of particular soils.
It can be observed that the notion of improving the ground for engineering purposes initially developed explicitly to resolve subaerial issues as foundation problems were and are most often encountered on land. However, the 20th century was witness to a number of marine and onshore geotechnical failures such as the 1916 collapse of Gothenburg Harbour’s Stigberg Quay in Sweden (Massarsch and Fellenius, 2012) and the 1979 failure of Nice Harbour in France (Dan et al., 2007). Hence, it was inevitable that sooner or later attention would be drawn towards modifying or adjusting ground improvement techniques for application to subaqueous near shore and offshore projects.
1.1 DYNAMIC COMPACTION AND DYNAMIC REPLACEMENT
Louis Menard invented and promoted Dynamic Compaction (DC) as early as 1969 but it was not until 29 May 1970 that he officially patented his invention in France. The technique was later also patented in many other countries, including Australia in 1981 (Hamidi et al., 2009a).
The concept of this technique is improving the mechanical properties of the soil by transmitting high energy impacts to loose soils that initially have low bearing capacity and high compressibility potentials. The impact creates body and surface waves that propagate in the soil medium. In non-saturated soils the waves displace the soil grains and re-arrange them in a denser configuration. In saturated ground the soil is liquefied and the grains re-arrange in a more compact state. In both cases the decrease of voids and increase in inner granular contact will directly lead to improved soil properties. Impact energy is delivered by dropping a heavy weight or pounder from a significant height. The pounder weight is most often in the range of 8 tons to 25 tons although lighter or heavier weights are occasionally used. Drop heights are usually in the range of 10 m to 20 m although other drop heights may sometimes be used. Hamidi et al. (2011) have described the advances of dynamic compaction.
OFFSHORE GROUND IMPROVEMENT RECORDS HAMIDI et al.
Australian Geomechanics Vol 48 No 4 December 2013 112
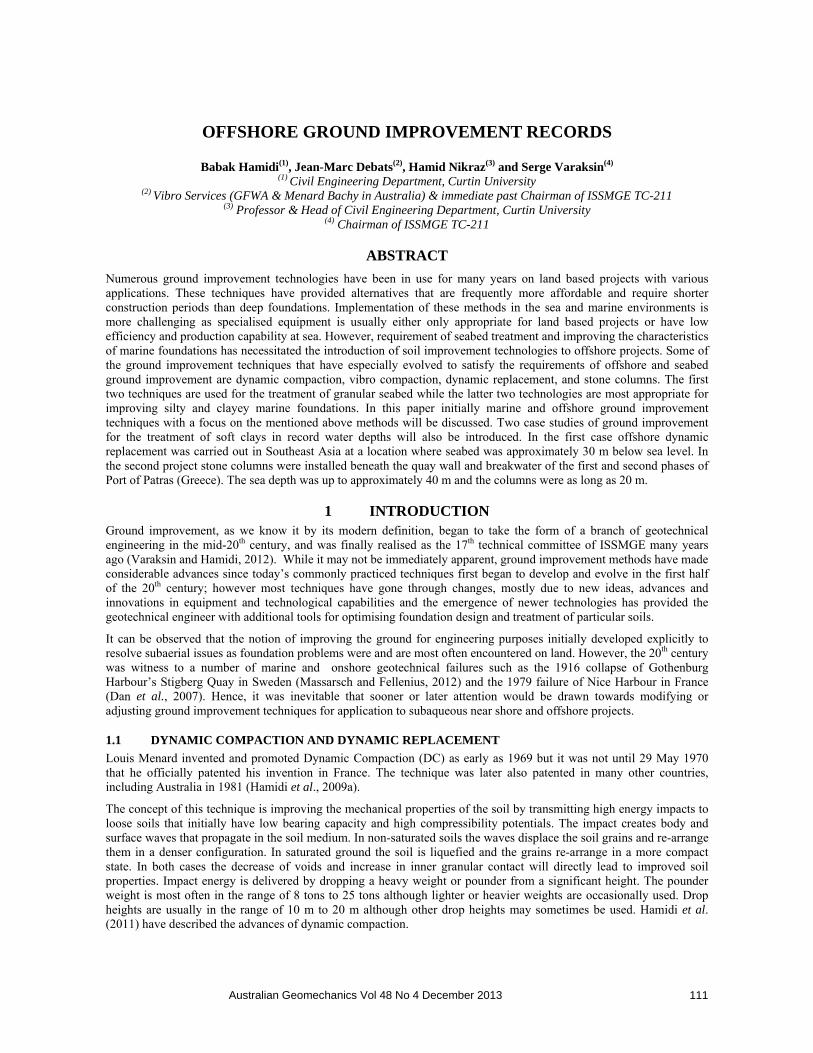
Dynamic Replacement (DR) is a ground improvement technique that was also developed by Louis Menard in 1975 for the treatment of soft cohesive soils. As shown in Figure 1, in this technique a heavy pounder is systematically dropped a number of times onto specific points in order to drive granular material into soft compressible cohesive soils and to compact the driven material sufficiently to meet the project’s design criteria.
Figure 1: The process of dynamic replacement.
1.2 VIBRO COMPACTION AND VIBRO REPLACEMENT (STONE COLUMNS)
Vibro compaction, also known as vibroflotation, is a deep ground compaction technique that was developed in 1934 with the invention of the first vibroflot by Degen and Steuermann (Better Ground website) in Germany. This technique is best suitable for the treatment of soils with limited amounts of fines. Mitchell (1981) proposes that the best desirable soils for vibro compaction are when the ground’s fines content is limited to 18%. As also deemed more appropriate by the authors through their personal experience, Woodward (2005) proposes that best results can be achieved when fines content is less than 10%.
The vibroflot, sometimes also referred to as a vibroprobe or vibrating poker, is a hollow steel tube containing an eccentric weight mounted on a vertical axis in the lower part so as to give a horizontal vibration. The vibroflot itself is connected to extension tubes that are supported by a rig, usually a crane. The vibroflot is either flushed down to the required depth in the soil using water jets or vibrated dry with air jets. When the vibroprobe reaches the required depth, during withdrawal material is added from the ground surface, and the vibroflot is moved in an up and down motion at certain intervals. The horizontal vibrations form a compacted cylinder of soil with a depression at the surface due to the reduction of void ratio in the ground. Depending on the vibroflot power, the zone of improved soil extends from 1.5 m to more than 4 m from the vibrator.
When fines content is high the vibroflot is used in an alternative process called vibro replacement or stone columns. In this method, crushed stones are fed into columnar cavities and compacted using the vibroflot to form semi rigid columns. The common construction methods for stone columns include the wet top feed and the dry bottom feed methods. The major difference between these two processes is the stone feeding system whereas in the top feed method stone is fed to the column from the ground surface while in the bottom feed method stone is fed to the tip of the vibroflot through a pipe.
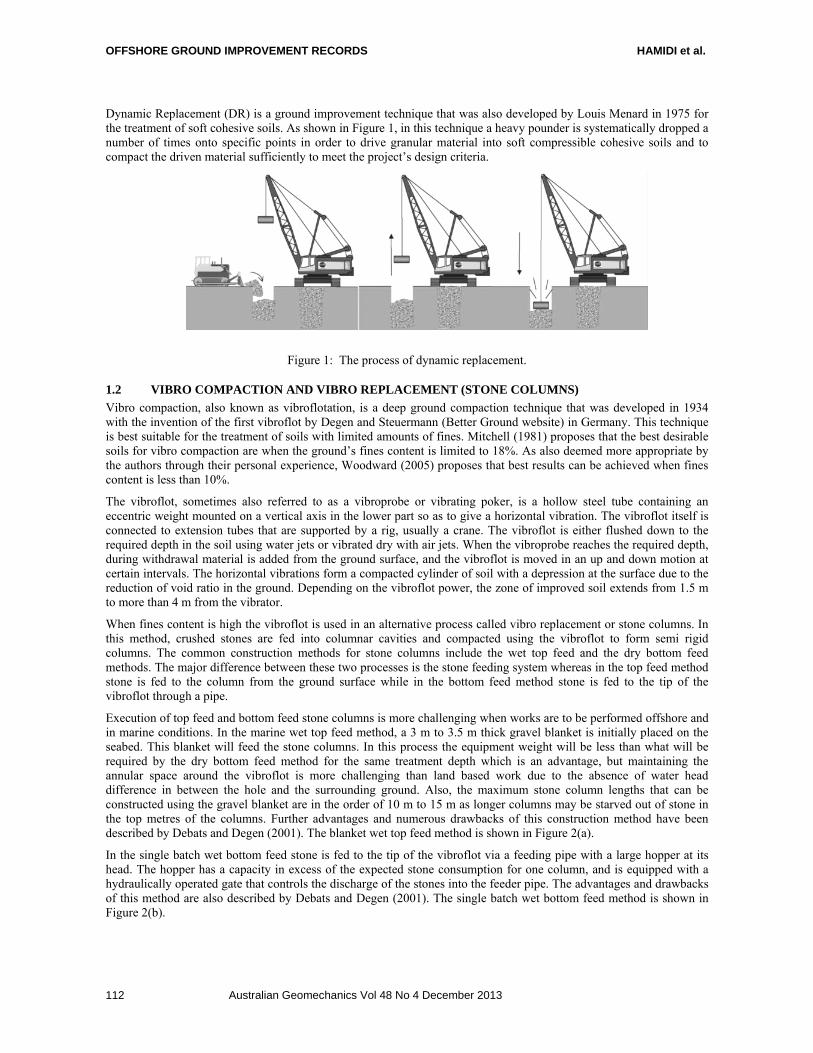
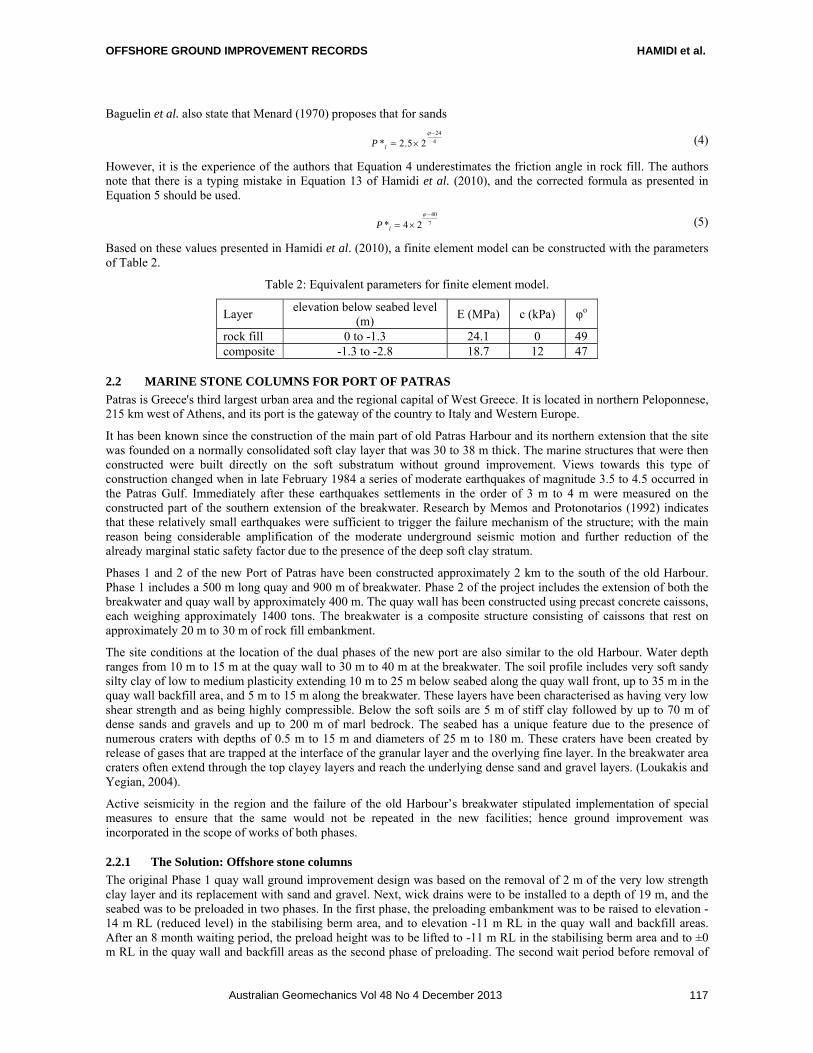
Execution of top feed and bottom feed stone columns is more challenging when works are to be performed offshore and in marine conditions. In the marine wet top feed method, a 3 m to 3.5 m thick gravel blanket is initially placed on the seabed. This blanket will feed the stone columns. In this process the equipment weight will be less than what will be required by the dry bottom feed method for the same treatment depth which is an advantage, but maintaining the annular space around the vibroflot is more challenging than land based work due to the absence of water head difference in between the hole and the surrounding ground. Also, the maximum stone column lengths that can be constructed using the gravel blanket are in the order of 10 m to 15 m as longer columns may be starved out of stone in the top metres of the columns. Further advantages and numerous drawbacks of this construction method have been described by Debats and Degen (2001). The blanket wet top feed method is shown in Figure 2(a).
In the single batch wet bottom feed stone is fed to the tip of the vibroflot via a feeding pipe with a large hopper at its head. The hopper has a capacity in excess of the expected stone consumption for one column, and is equipped with a hydraulically operated gate that controls the discharge of the stones into the feeder pipe. The advantages and drawbacks of this method are also described by Debats and Degen (2001). The single batch wet bottom feed method is shown in Figure 2(b).
OFFSHORE GROUND IMPROVEMENT RECORDS HAMIDI et al.
Australian Geomechanics Vol 48 No 4 December 2013 113
(a) (b)
Figure 2: Marine stone columns (a) blanket wet top feed and (b) single batch wet bottom feed methods (Debats and Degen, 2001).
2 MARINE GROUND IMPROVEMENT The first applications of marine ground improvement can be traced back to the 1970s. Menard carried out the first offshore dynamic compaction project in 1973 as part of the construction of Brest Naval Port’s dry dock in France. In this project a specially designed 11 ton pounder was used to compact 3 m of loose alluvium on the seabed (Menard, 1974; Boulard, 1974; Renault and Tourneur, 1974; Gambin, 1982). In Kuwait Naval Base a 32 ton pounder was used to compact a 5 m thick layer of silty sand and a 1.5 m to 2 m thick rock fill blanket at the depth of 10 m below seawater level to mitigate the risk of liquefaction of a breakwater foundation due to swell action (Gambin, 1982; Chu et al., 2009). Other dynamic compaction or dynamic replacement projects with seabed as deep as 15 m below seawater level included Pointe Noire in Gabon (Menard, 1978), Uddevalla Shipyard Wharf (Gambin, 1982), Kuwait Naval Port, Sfax Fishing Quay in Tunisia (Menard, 1981; Gambin, 1982), and Lagos Dry Dock in Nigeria (Gambin, 1982; Gambin and Bolle, 1983). More recently a deeper marine dynamic replacement has been reported by Hamidi et al. (2010) and Yee and Varaksin (2012).
The first marine ground improvement project in Australia has been carried out as part of the expansion of Port Botany in Sydney. In this project 800,000 m3 of sand was compacted using the marine vibro compaction technique to support the precast counterfort retaining walls (Berthier et al., 2009). Other published references to projects using the vibroflot techniques include Port of Patras (Debats and Degen, 2001, Loukakis and Yegian, 2004), Port of Monaco (Debats and Londez, 2003), Bay Area Rapid Transit (BART) in San Francisco Bay, USA (Wu et al., 2003), and the Golden Ears Bridge in Vancouver, Canada (Naesgaard, 2008). Other unpublished work include Aktio-Preveza Crossing (stone columns) in Greece, Bali Wharf (stone columns) in Indonesia, Cuenca de Plata Terminal (vibro compaction) in Montevideo, Dung Quat Refinery (vibro compaction) in Vietnam, Dunkirk Port and Dunkirk LNG Terminal (stone columns) in France, National City Marine Terminal (stone columns) in the USA, North Lantau Expressway (vibro compaction) in Hong Kong, Pasir Panjang Terminal Phases 3 and 4 (vibro compaction) in Singapore, and Richards Bay Berth 306 (stone columns) in South Africa.
An advance in construction methods and equipment has enabled ground improvement to be carried out in more challenging conditions and depths. The focus of this paper will be the case history of two world records for treating seabed using the dynamic replacement and stone columns techniques.

OFFSHORE GROUND IMPROVEMENT RECORDS HAMIDI et al.
Australian Geomechanics Vol 48 No 4 December 2013 114
2.1 MARINE DYNAMIC REPLACEMENT FOR A CONTAINER TERMINAL IN SOUTHEAST ASIA
Recently, dynamic replacement was carried out in Southeast Asia to treat soft marine deposits more than 30 m below seawater level for the construction of a wharf using caisson seawalls (Hamidi et al., 2010; Yee and Varaksin, 2012).
According to the original design the soft marine clay at the seabed was to be dredged down to the depth of 30 m below sea level where the shear strength of the stiff clay exceeded 250 kPa. The excavated key was to be then backfilled with sand and compacted using vibro compaction under 3 m of additional overburden sand fill. Next, the surcharge had to be removed, a rubble mound was to be placed over the sand key and as shown in Figure 3, finally caissons were to be sunk onto the mound.
Figure 3: Cross section of container terminal based on original foundation concept.
2.1.1 Soil Softening
As SPT blow counts exceeded 50 and the assumed clay shear strength of 250 kPa was achieved at dredge level, works progressed by backfilling sand and compacting the fill using vibro compaction.
While the clay at dredge level was initially very stiff, dredging works and cutting into the clay softened the upper 1 m to 1.5 m of the exposed clay surface and post dredging CPT tests performed before the removal of the overburden sand fill indicated that the clay’s shear strength had dropped to about one third of its original value; i.e. to approximately 80 kPa. Further testing at later stages by the pressuremeter test (PMT) suggested that the shear strength had even further reduced at some points to a mere 16 kPa.
2.1.2 The Solution: Offshore Dynamic Replacement
Further dredging of the softened clay and replacing it with more sand fill did not appear to be an effective method because it was expected that this would lead to the disturbance of deeper clay layers and the problem would persist.
Due to the nature of the soft soil and its thickness, marine dynamic replacement was envisaged as a possible treatment solution. Based on previous experiences, it was anticipated that if proper equipment (i.e. a large stable barge, a specialised crane with a sufficiently powerful winch system for lifting a heavy pounder and resisting tidal action, and a special pounder for transmitting sufficient impact energy to the seabed) were available, it would then be possible to drive granular material into the soft clay and improve its properties.
Unlike land based dynamic replacement where suitable material can be pushed into the crater by a loader, in offshore dynamic replacement this is not possible, and material can only be punched in from the transition layer. Hence, a stone blanket was used to feed the DR columns and to provide the transition layer for arching (Hamidi et al., 2009b). This layer also prevented the contamination of seawater by the flow and dispersion of suspended clay particles produced by the pounder’s impacts.
In the proposed dynamic replacement methodology it was assumed that a 1.8 m thick granite rock fill layer would be placed over the soft clay layer. The blanket material was chosen in such a way that 30% of the stone diameters were from 150 m to 200 mm and the remaining 70% were from 200 m to 300 m. The DR rock columns were designed to be 2 m in diameter, in a 4.5 m grid and with a replacement ratio of 15%.
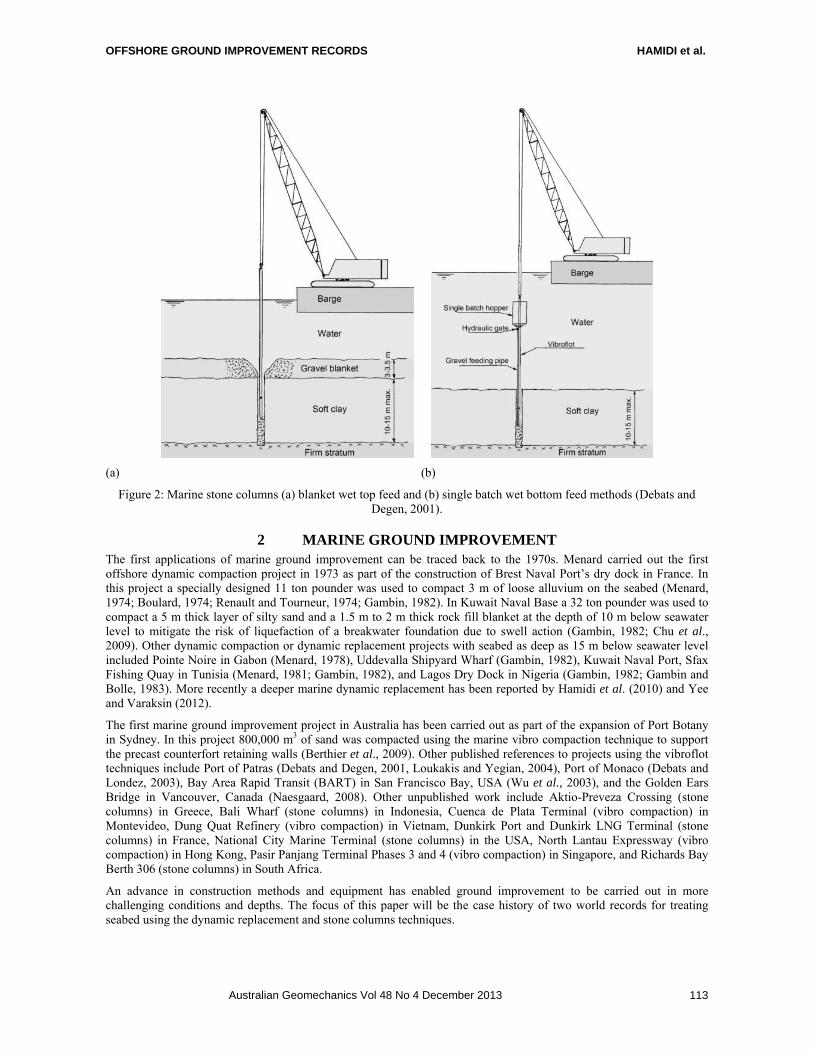
As shown in Figure 4(a), in this project a specially designed grater shaped marine pounder weighing 38.5 tons was used to drive the rock into the columns and to dynamically compact the rock blanket. The pounder’s dimensions were 1.7 m by 1.7 m on the DR side and 2.3 m by 2.3 m on the DC side. Figure 4(b) shows the 15x50 m2 barge that was used for supporting the crane, pounder and other equipment used for executing the ground improvement works.
Sand
Rubble mound
Dredged level
OFFSHORE GROUND IMPROVEMENT RECORDS HAMIDI et al.
Australian Geomechanics Vol 48 No 4 December 2013 115
Previous experiences by the working team suggested that water resistance could greatly reduce the effect of significantly high drops. Hence, the drop height during the trial was set to 5 m above seabed level. Records of the crane’s winch speed during the works indicate that the maximum drop speeds were in the range of 430 m/min. This speed is equivalent to a free fall with a drop height of 2.6 m (in air) and verifies the original assumption that much of the drops’ kinematic energies would have been lost to water resistance.
(a) (b)
Figure 4: (a) Marine DR (bottom side) - DC (top side) pounder (Chu et al., 2009), (b) barge mounted crane used for offshore dynamic replacement (Hamidi et al., 2010).
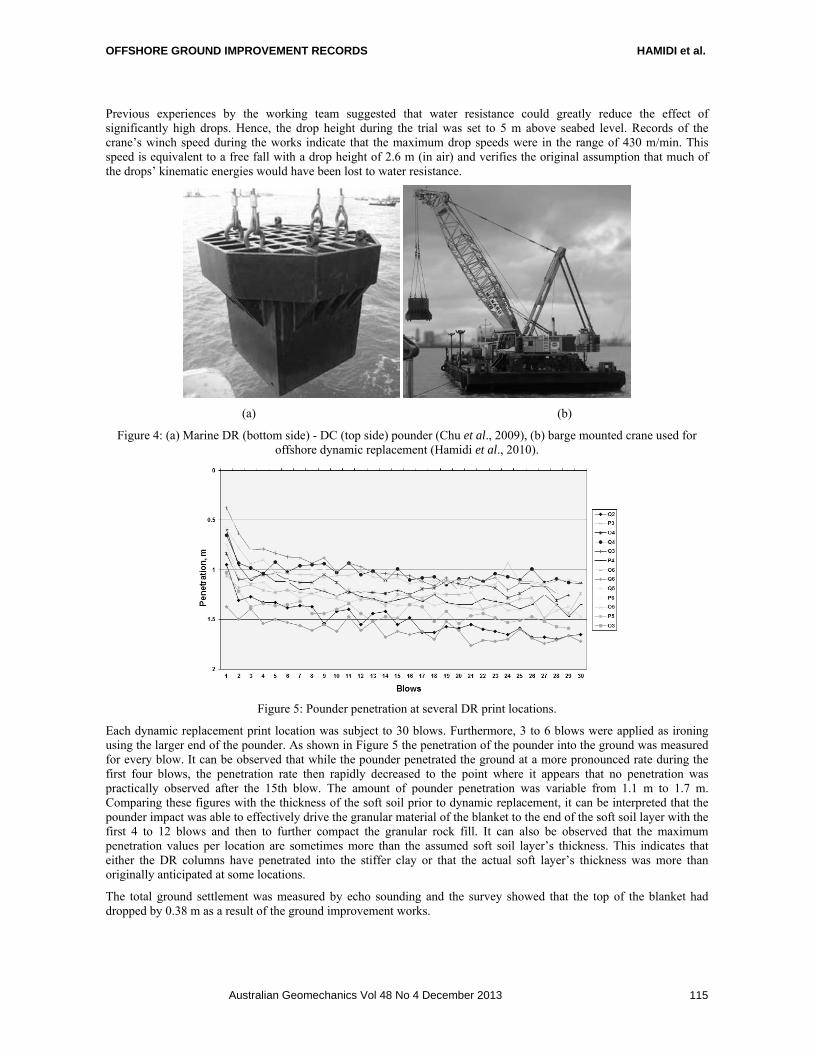
Figure 5: Pounder penetration at several DR print locations.
Each dynamic replacement print location was subject to 30 blows. Furthermore, 3 to 6 blows were applied as ironing using the larger end of the pounder. As shown in Figure 5 the penetration of the pounder into the ground was measured for every blow. It can be observed that while the pounder penetrated the ground at a more pronounced rate during the first four blows, the penetration rate then rapidly decreased to the point where it appears that no penetration was practically observed after the 15th blow. The amount of pounder penetration was variable from 1.1 m to 1.7 m. Comparing these figures with the thickness of the soft soil prior to dynamic replacement, it can be interpreted that the pounder impact was able to effectively drive the granular material of the blanket to the end of the soft soil layer with the first 4 to 12 blows and then to further compact the granular rock fill. It can also be observed that the maximum penetration values per location are sometimes more than the assumed soft soil layer’s thickness. This indicates that either the DR columns have penetrated into the stiffer clay or that the actual soft layer’s thickness was more than originally anticipated at some locations.
The total ground settlement was measured by echo sounding and the survey showed that the top of the blanket had dropped by 0.38 m as a result of the ground improvement works.
OFFSHORE GROUND IMPROVEMENT RECORDS HAMIDI et al.
Australian Geomechanics Vol 48 No 4 December 2013 116
2.1.3 Verification and Results
Divers were used to visually inspect the impact results at seabed level. Based on the larger amounts of crushed rock at the DR column location, it was determined that the columns were 2.4 m in diameter which is equal to the diagonal length of the pounder’s base on the DR side. It can be interpreted that the larger DR columns’ diameter as compared to the pounder’s base may have been formed by a combination of soft soil being pushed away laterally due to the high horizontal stresses exceeding the soil’s strength at impact location and possible rotations of the pounder during the impacts. Thus, the actual DR replacement ratio was 22.3% in lieu of the assumed 15%. Target rock friction angle was 45 degrees.
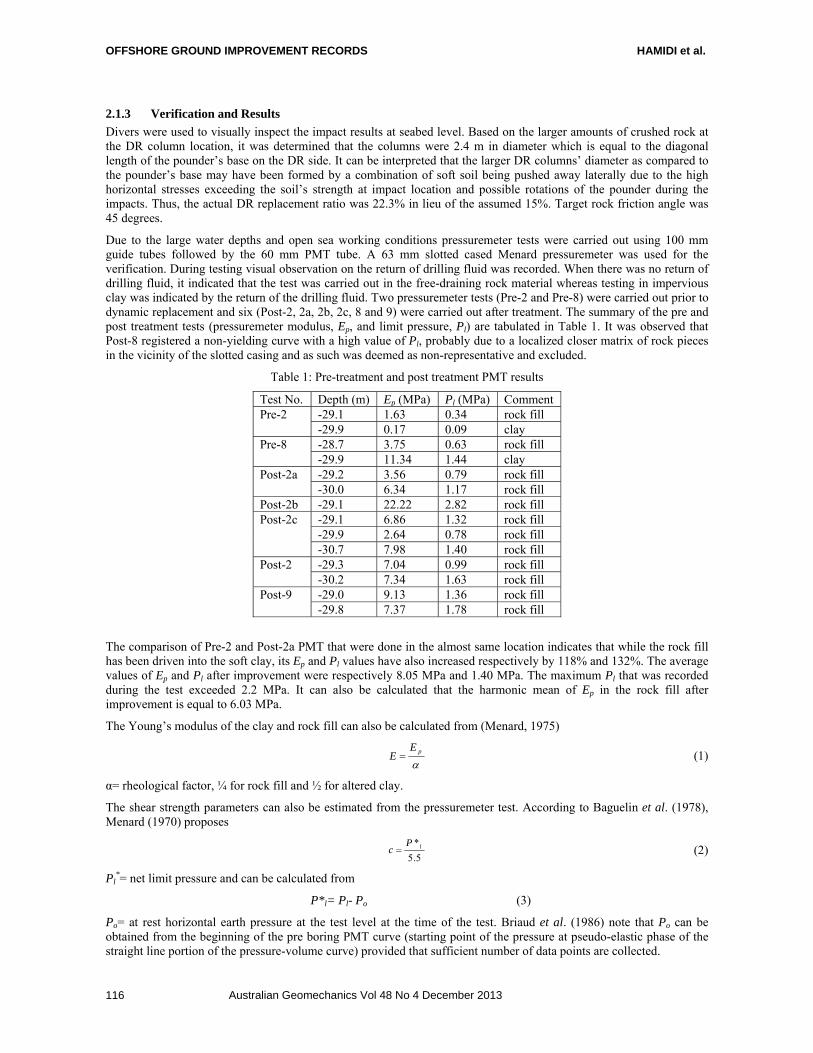
Due to the large water depths and open sea working conditions pressuremeter tests were carried out using 100 mm guide tubes followed by the 60 mm PMT tube. A 63 mm slotted cased Menard pressuremeter was used for the verification. During testing visual observation on the return of drilling fluid was recorded. When there was no return of drilling fluid, it indicated that the test was carried out in the free-draining rock material whereas testing in impervious clay was indicated by the return of the drilling fluid. Two pressuremeter tests (Pre-2 and Pre-8) were carried out prior to dynamic replacement and six (Post-2, 2a, 2b, 2c, 8 and 9) were carried out after treatment. The summary of the pre and post treatment tests (pressuremeter modulus, Ep, and limit pressure, Pl) are tabulated in Table 1. It was observed that Post-8 registered a non-yielding curve with a high value of Pl, probably due to a localized closer matrix of rock pieces in the vicinity of the slotted casing and as such was deemed as non-representative and excluded.
Table 1: Pre-treatment and post treatment PMT results
Test No. Depth (m) Ep (MPa) Pl (MPa) Comment Pre-2 -29.1 1.63 0.34 rock fill
-29.9 0.17 0.09 clay Pre-8 -28.7 3.75 0.63 rock fill
-29.9 11.34 1.44 clay Post-2a -29.2 3.56 0.79 rock fill
-30.0 6.34 1.17 rock fill Post-2b -29.1 22.22 2.82 rock fill Post-2c -29.1 6.86 1.32 rock fill
-29.9 2.64 0.78 rock fill -30.7 7.98 1.40 rock fill
Post-2 -29.3 7.04 0.99 rock fill -30.2 7.34 1.63 rock fill
Post-9 -29.0 9.13 1.36 rock fill -29.8 7.37 1.78 rock fill
The comparison of Pre-2 and Post-2a PMT that were done in the almost same location indicates that while the rock fill has been driven into the soft clay, its Ep and Pl values have also increased respectively by 118% and 132%. The average values of Ep and Pl after improvement were respectively 8.05 MPa and 1.40 MPa. The maximum Pl that was recorded during the test exceeded 2.2 MPa. It can also be calculated that the harmonic mean of Ep in the rock fill after improvement is equal to 6.03 MPa.
The Young’s modulus of the clay and rock fill can also be calculated from (Menard, 1975)
pEE (1)
α= rheological factor, ¼ for rock fill and ½ for altered clay.
The shear strength parameters can also be estimated from the pressuremeter test. According to Baguelin et al. (1978), Menard (1970) proposes
5.5
* lPc (2)
Pl*= net limit pressure and can be calculated from
P*l= Pl- Po (3)
Po= at rest horizontal earth pressure at the test level at the time of the test. Briaud et al. (1986) note that Po can be obtained from the beginning of the pre boring PMT curve (starting point of the pressure at pseudo-elastic phase of the straight line portion of the pressure-volume curve) provided that sufficient number of data points are collected.
OFFSHORE GROUND IMPROVEMENT RECORDS HAMIDI et al.
Australian Geomechanics Vol 48 No 4 December 2013 117
Baguelin et al. also state that Menard (1970) proposes that for sands
4
24
25.2*
lP (4)
However, it is the experience of the authors that Equation 4 underestimates the friction angle in rock fill. The authors note that there is a typing mistake in Equation 13 of Hamidi et al. (2010), and the corrected formula as presented in Equation 5 should be used.
7
40
24*
lP (5)
Based on these values presented in Hamidi et al. (2010), a finite element model can be constructed with the parameters of Table 2.
Table 2: Equivalent parameters for finite element model.
Layer elevation below seabed level
(m) E (MPa) c (kPa) φo
rock fill 0 to -1.3 24.1 0 49 composite -1.3 to -2.8 18.7 12 47
2.2 MARINE STONE COLUMNS FOR PORT OF PATRAS
Patras is Greece's third largest urban area and the regional capital of West Greece. It is located in northern Peloponnese, 215 km west of Athens, and its port is the gateway of the country to Italy and Western Europe.
It has been known since the construction of the main part of old Patras Harbour and its northern extension that the site was founded on a normally consolidated soft clay layer that was 30 to 38 m thick. The marine structures that were then constructed were built directly on the soft substratum without ground improvement. Views towards this type of construction changed when in late February 1984 a series of moderate earthquakes of magnitude 3.5 to 4.5 occurred in the Patras Gulf. Immediately after these earthquakes settlements in the order of 3 m to 4 m were measured on the constructed part of the southern extension of the breakwater. Research by Memos and Protonotarios (1992) indicates that these relatively small earthquakes were sufficient to trigger the failure mechanism of the structure; with the main reason being considerable amplification of the moderate underground seismic motion and further reduction of the already marginal static safety factor due to the presence of the deep soft clay stratum.
Phases 1 and 2 of the new Port of Patras have been constructed approximately 2 km to the south of the old Harbour. Phase 1 includes a 500 m long quay and 900 m of breakwater. Phase 2 of the project includes the extension of both the breakwater and quay wall by approximately 400 m. The quay wall has been constructed using precast concrete caissons, each weighing approximately 1400 tons. The breakwater is a composite structure consisting of caissons that rest on approximately 20 m to 30 m of rock fill embankment.
The site conditions at the location of the dual phases of the new port are also similar to the old Harbour. Water depth ranges from 10 m to 15 m at the quay wall to 30 m to 40 m at the breakwater. The soil profile includes very soft sandy silty clay of low to medium plasticity extending 10 m to 25 m below seabed along the quay wall front, up to 35 m in the quay wall backfill area, and 5 m to 15 m along the breakwater. These layers have been characterised as having very low shear strength and as being highly compressible. Below the soft soils are 5 m of stiff clay followed by up to 70 m of dense sands and gravels and up to 200 m of marl bedrock. The seabed has a unique feature due to the presence of numerous craters with depths of 0.5 m to 15 m and diameters of 25 m to 180 m. These craters have been created by release of gases that are trapped at the interface of the granular layer and the overlying fine layer. In the breakwater area craters often extend through the top clayey layers and reach the underlying dense sand and gravel layers. (Loukakis and Yegian, 2004).
Active seismicity in the region and the failure of the old Harbour’s breakwater stipulated implementation of special measures to ensure that the same would not be repeated in the new facilities; hence ground improvement was incorporated in the scope of works of both phases.
2.2.1 The Solution: Offshore stone columns
The original Phase 1 quay wall ground improvement design was based on the removal of 2 m of the very low strength clay layer and its replacement with sand and gravel. Next, wick drains were to be installed to a depth of 19 m, and the seabed was to be preloaded in two phases. In the first phase, the preloading embankment was to be raised to elevation -14 m RL (reduced level) in the stabilising berm area, and to elevation -11 m RL in the quay wall and backfill areas. After an 8 month waiting period, the preload height was to be lifted to -11 m RL in the stabilising berm area and to ±0 m RL in the quay wall and backfill areas as the second phase of preloading. The second wait period before removal of

OFFSHORE GROUND IMPROVEMENT RECORDS HAMIDI et al.
Australian Geomechanics Vol 48 No 4 December 2013 118
the preload was designed to be 12 months for reaching 80 to 90% consolidation. The final stage of ground improvement was envisaged to be the installation of 10 m long 0.6 m diameter stone columns within an 80 m wide zone (30 m in the front and 50 m behind the quay wall (Drettas et al., 1997; Loukakis and Yegian, 2004). The 12.8 m high caissons would then be sunk onto their insertion locations.
Additional geotechnical investigation performed by the contractor revealed an extremely irregular seabed crater pattern, particularly in the breakwater area. Furthermore, this investigation also identified several previously unknown thin sand layers within the top clayey soils. These layers appeared to be able to reduce consolidation period and downgraded the effect of the vertical drains, and evaluation of trail embankment monitoring results indicated practically no effect of vertical drain spacing on the consolidation rate.
The stone column construction method proposed in the tender assumed that works would be performed in the quay wall area either as a land operation prior to the removal of the preloading embankment or as a marine operation after removal of the preload. However, stone column trials demonstrated that vibroflot penetration into the surcharge was extremely difficult due to the composition and degree of surcharge embankment compaction. The trials also showed that a layer of approximately 3 m thickness had to be placed on the seabed prior to construction of the stone columns to generate the necessary overburden pressure required for mitigating bulging near the top of the stone columns.
Thus, in the modified construction sequence stone columns were installed after the placement of the first stage of preloading. This modification significantly improved the ground’s stability during the second stage of preloading.
Similarly in the breakwater area, the original design anticipated that the upper 2 m of the very soft seabed would be removed and replaced with sand and gravel. Next, 12 m long wick drains were to be installed and two layers of geotextiles were to cover the entire footprint of the breakwater to increase resistance against slope failure. In this area the rubble mound was designed in three stages with waiting periods in between them. Stabilising berms were to be constructed on both sides of the main rock fill embankment. The first stage included lifting the rock fill and berms to -30 m RL. After 1 month to 2 months the second stage would commence and construction would be elevated to level -24 m RL. The final stage was to begin after another 9 months of waiting period. In this stage the rock fill would be lifted to -11 m RL and the caissons would then be sunk onto their locations (Platis et al., 1997; Loukakis and Yegian, 2004).
Construction as per the above methodology was very difficult with consideration of the seabed’s crater field and water depths of approximately 40 m in some craters of the breakwater area; hence the contractor proposed an alternative construction method in which a 3 m thick gravel blanket would be placed on the seabed followed by installation of stone columns penetrating 5 m to 17 m into the clayey soils and reaching the underlying granular layer. This process not only reduced construction time by eliminating a total of 20 months of waiting period but also reduced the stabilising berms on the two sides of the main rock fill embankment due to the better ground properties and increased resistance against slope failure.
During Phase 1 of the Port construction wick drain and stone columns were installed in water depths of up to 38 m. A total of about 28,000 wick drains was installed down to the depth of 19 m below seabed level at the quay wall area, and approximately 23,000 stone columns, up to 20 m long, were installed almost equally in the quay wall and breakwater areas using the single batch bottom feed technique shown in Figure 2(b). Stone columns in the quay wall area were 0.86 m in diameter and installed in a 2.85 m square grid which equates to a replacement ratio (Hamidi et al., 2009b) of 7%. In the breakwater area the stone column diameter was 1 m and the installation square grid was 2.7 m which equates to a replacement ratio of 11%. Typical cross sections of the quay wall and breakwater ground improvement schemes are shown in Figure 6.
Similarly, in Phase 2 of the project, a combination of wick drains and surcharging followed by installation of stone columns was performed in the quay wall area. In this area, a total of 3,073 columns, 1 m in diameter, with an average length of 10 m, an average grid size of square 3.3 m and with a total length of 30,730 m were installed.
In the breakwater area initially a 2 m thick sand blanket was placed on the seabed. Then stone columns were installed to depths of 50 m below seawater level. During this process a total number of 4,830 stone columns, 1 m in diameter, with an average length of 16 m, an average square grid size of 2.7 m, and a total length of 77,280 m were installed (Debats and Degen, 2001).
OFFSHORE GROUND IMPROVEMENT RECORDS HAMIDI et al.
Australian Geomechanics Vol 48 No 4 December 2013 119
Figure 6: Typical cross sections of (a) the quay wall and (b) the breakwater.
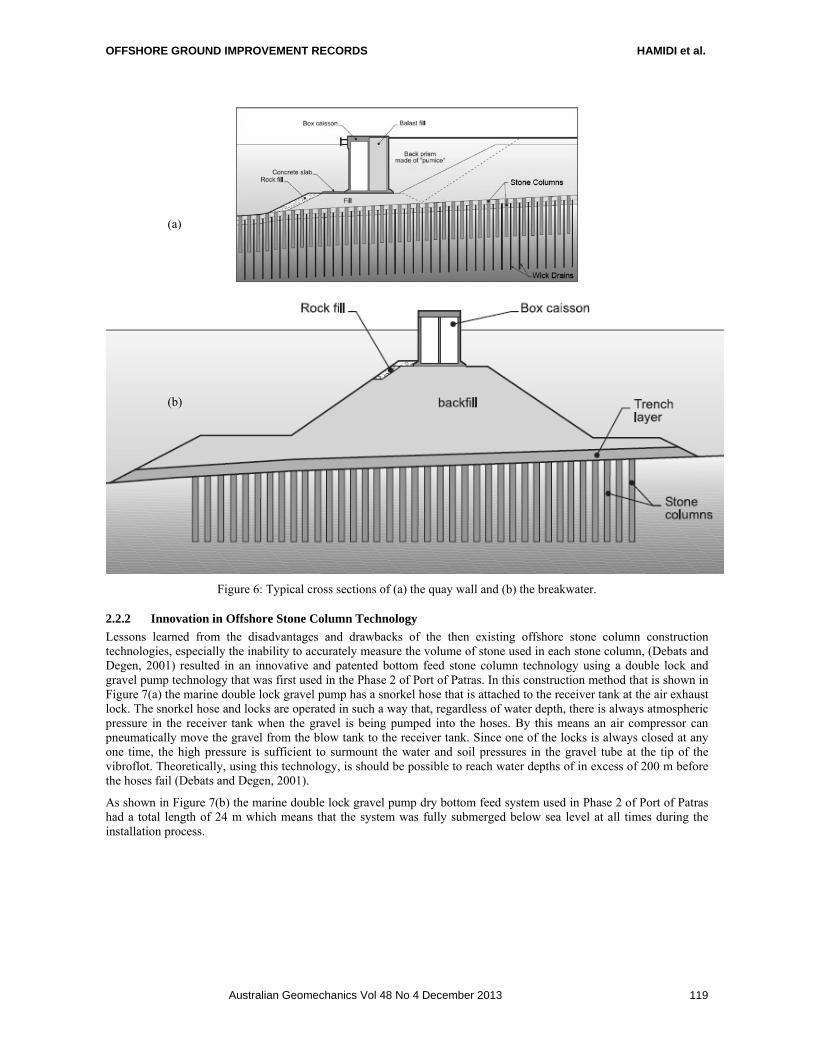
2.2.2 Innovation in Offshore Stone Column Technology
Lessons learned from the disadvantages and drawbacks of the then existing offshore stone column construction technologies, especially the inability to accurately measure the volume of stone used in each stone column, (Debats and Degen, 2001) resulted in an innovative and patented bottom feed stone column technology using a double lock and gravel pump technology that was first used in the Phase 2 of Port of Patras. In this construction method that is shown in Figure 7(a) the marine double lock gravel pump has a snorkel hose that is attached to the receiver tank at the air exhaust lock. The snorkel hose and locks are operated in such a way that, regardless of water depth, there is always atmospheric pressure in the receiver tank when the gravel is being pumped into the hoses. By this means an air compressor can pneumatically move the gravel from the blow tank to the receiver tank. Since one of the locks is always closed at any one time, the high pressure is sufficient to surmount the water and soil pressures in the gravel tube at the tip of the vibroflot. Theoretically, using this technology, is should be possible to reach water depths of in excess of 200 m before the hoses fail (Debats and Degen, 2001).
As shown in Figure 7(b) the marine double lock gravel pump dry bottom feed system used in Phase 2 of Port of Patras had a total length of 24 m which means that the system was fully submerged below sea level at all times during the installation process.
(a)
(b)
OFFSHORE GROUND IMPROVEMENT RECORDS HAMIDI et al.
Australian Geomechanics Vol 48 No 4 December 2013 120
(a) (b)
Figure 7: Typical cross sections of (a) the quay wall and (b) the breakwater (Debats and Degen, 2001).
2.2.3 Quality Control
Quality control for the project was provided by logging the installation data including the start and end times, the total installation time, the penetration time, stone column diameter, the stone volume per metre, total volume and seabed level for each column installation. Also, time and depth based graphs were prepared for each stone column with information regarding the volume of stone consumed, the diameter of the column at each level and the treatment amperage at each level.
3 CONCLUSION Recently, offshore ground improvement technologies have had major advancements and it is now possible to treat soft or loose soils at great depth. Dynamic replacement has been used to treat soft clays at the depth of 30 m below sea level and stone columns have been installed at depth of more than 50 m. To the knowledge of the authors, both of these figures are world records for the techniques, and it is expected that ground improvement can now be more effectively implemented in deep waters based on the experience and know-how that has been gained through these projects.
4 REFERENCES Baguelin, F., Jezequel, J. F. & Shields, D. H. (1978) The Pressuremeter and Foundation Engineering, Aedermannsdorf,
Trans Tech Publications, 617. Berthier, D., Debats, J. M., Shcarff, G. & Vincent, P. (2009) Marine and Land Based Compaction Works at the Port
Botany Project, Sydney. Coasts and Ports 2009 Conference, Wellington, 16-18 September. Better Ground website, History of Equipment Development, Viewed 8 December 2010,
http://www.betterground.com/index.php?option=com_content&view=article&id=59:history&catid=37:home&Itemid=65.
Boulard, J. (1974) La forme de radoub prefabriquee no. 10 du port militaire de Brest. Travaux, 17-29. Briaud, J. L., Tucker, L. M. & Makarim, C. A. (1986) Pressuremeter Standard and Pressuremeter Parameters. The
Pressuremter and its Marine Applications: Second International Symposium, ASTM Special Technical Publication 950, College Station, Texas, 2-3 May, 303-323.
OFFSHORE GROUND IMPROVEMENT RECORDS HAMIDI et al.
Australian Geomechanics Vol 48 No 4 December 2013 121
Chu, J., Varaksin, S., Klotz, U. & Mengé, P. (2009) State of the Art Report: Construction Processes. 17th International Conference on Soil Mechanics & Geotechnical Engineering: TC17 meeting ground improvement, Alexandria, Egypt, 7 October 2009, 130.
Dan, G., Sultan, N. & Savoye, B. (2007) The 1979 Nice Harbour Catastrophe Revisited: Trigger Mechanism Inferred from Geotechnical Measurements and Numerical Modelling. Marine Geology, 245, 1-4, 40-64.
Debats, J. M. & Degen, W. S. (2001) Marine Stone Columns at Patras (Greece) Harbour Extension - Phase II. Satellite Symposium of 15th International Conference on Soil Mechanics and Geotechnical Engineering, Istanbul, August.
Debats, J. M. & Londez, M. (2003) Port of Monaco: Vibrocompaction of a Coarse-Grained Fill as Submarine Foundation to Prefabricated Caissons Designed as Anchorage to a Large Floating Breakwater. Design, Implementation and Control. 13th European Conference on Soil Mechanics and Geotechnical Engineering - Ground Improvement Workshop, Prague, 29 August.
Drettas, G., Platis, A., Sioris, I. & Tsamis, V. (1997) The Foundation of Marine Structures on Soft Ground Improved by Preloading and Reinforced with Stone Columns. 3rd Hellenic Conference on Geotechnical Engineering, Prata, 20-22 March.
Gambin, M. P. (1982) Menard Dynamic Compaction, A New Method for Improving Foundation Beds off-Shore. International Symposium, Brugge, 5-7 May, pp 3.91-93.95.
Gambin, M. P. & Bolle, G. (1983) Seabed Soil Improvement for Lagos Dry Dock. 8th European Conference on Soil Mechanics and Foundation Engineering, Vol 2, Helsinki, 837-840.
Hamidi, B., Nikraz, H. & Varaksin, S. (2009a) A Review on Impact Oriented Ground Improvement Techniques. Australian Geomechanics Journal, 44, 2, 17-24.
Hamidi, B., Nikraz, H. & Varaksin, S. (2009b) Arching in Ground Improvement. Australian Geomechanics Journal, 44, 4 (December), 99-108.
Hamidi, B., Nikraz, H. & Varaksin, S. (2011) Advances in Dynamic Compaction. Indian Geotechnical Conference IGC2011, Kochi, India, 15-17 December, Paper No. H-146.
Hamidi, B., Yee, K., Varaksin, S., Nikraz, H. & Wong, L. T. (2010) Ground Improvement in Deep Waters Using Dynamic Replacement. 20th International Offshore and Polar Engineering Conference, Beijing, 20-26 June, 848-853.
Loukakis, K. & Yegian, M. K. (2004) Quay Wall and Breakwater Design and Construction of the New Port of Patras. Geo-Trans 2004 Geotechnical Engineering for Transportation Projects, ASCE Geotechnical Special Publication No. 126, Los Angeles, July 27-31, 516-525.
Massarsch, K. R. & Fellenius, B. H. (2012) Early Swedish Contributions to Geotechnical Engineering. Full-Scale Testing and Foundation Design: Honoring Bengt H. Fellenius, ASCE Geotechnical Special Publication No. 227, Reston, VA, USA, 25-29 March, 239-256.
Memos, C. D. & Protonotarios, J. N. (1992) Patras Breakwater Failure due to Seismic Loading. 23rd International Conference on Coastal Engineering, Venice, 4-9 October, 3343-3356.
Menard, L. (1970) Détermination de la Poussée Exercée par un Sol sur une Paroi de Soutènement. Publication D/38/70. Menard, L. (1974) Fondation d'une cale de radoub à Brest. 6th International Harbor Conference, Antwerp, 12-18 May. Menard, L. (1978) La consolidation dynamique comme solution aux problèmes de fondation: pour la construction de
quais, terminaux, réservoirs de stockage et iles artificielles sur sols compressibles. 7th International Harbour Conference, Antwerp.
Menard, L. (1981) L'utilisation de la consolidation dynamique pour la réalisation du nouveau port de pêche de Sfax en Tunisie. Navires, Ports et Chantiers.
Mitchell, J. K. (1981) Soil Improvement State-of-the-Art Report. 10th International Conference on Soil Mechanics and Foundation Engineering, 4, Stockholm, 509-565.
Naesgaard, E., Azizian, A., Yang, D., Uthayakumar, U. M., Amini, A. & Byrne, P. (2008) Golden Ears Bridge - Geotechnical Seismic Design Aspects. 61st Canadian Geotechnical Conference, Edmonton, Alberta, Canada, 21-24 September, 1002 – 1009.
Platis, A., Koussoulos, S., Panagopoulos, N. & Boukovalas, G. (1997) The Foundation of Marine Structures on Soft Ground Improved and Reinforced with the Use of Geosynthetics. 3rd Hellenic Conference on Geotechnical Engineering, Prata, 20-22 March.
Renault, J. & Tourneur, P. (1974) La forme de radoub No. 10 à Brest. 6th International Harbor Conference, Antwerp, 12-18 May.
Varaksin, S. & Hamidi, B. (2012) Ground Improvement Case Histories and Advances in Practice. International Conference on Ground Improvement and Ground Control - Transport Infrastructure Development and Natural Hazards Mitigation (ICGI2012), Wollongong, NSW, Australia, 30 October - 2 November, 209-222.
Woodward, J. (2005) An Introduction to Geotechnical Processes, Taylor & Francis,123.

OFFSHORE GROUND IMPROVEMENT RECORDS HAMIDI et al.
Australian Geomechanics Vol 48 No 4 December 2013 122
Wu, C., Fok, E., Fotinos, G., Tseng, W. & Oberholtzer, G. (2003) Seismic Assessment and Retrofit Concepts of the BART Transbay Tube. Advancing Mitigation Technologies and Disaster Response for Lifeline Systems, ASCE TCLEE Monographs 25, Long Beach, CA, USA, August 10-13, 203-212.
Yee, K. & Varaksin, S. (2012) Ground Reinforcement in Deep Water. International Conference on Ground Improvement and Ground Control - Transport Infrastructure Development and Natural Hazards Mitigation (ICGI2012), 2, Wollongong, NSW, Australia, 30 October - 2 November, 575-585.
Australian Geomechanics Vol 48 No 4 December 2013 123
AXIAL PIPE-SOIL INTERACTION BEHAVIOUR OF OFFSHORE PIPELINES
M.Senthilkumar1, J.Kodikara1, P.Rajeev1,2 and D.J.Robert1 1Department of Civil Engineering, Monash University, Australia
2Department of Civil & Construction Engineering, Swinburne University of Technology, Australia
ABSTRACT
Pipe-soil interaction behaviour in the axial direction is an important design parameter for offshore pipe design. Governed primarily by the axial interaction behaviour, the undue thermal expansion of the pipe wall could cause the pipe to either freely expand, or buckle on the foundation seabed. Therefore, it is emphasized that by controlling the axial interaction behaviour, the overall pipe on-bottom stability can be effectively managed. This paper presents laboratory experiments performed at Monash University to understand the pipe-soil interaction behaviour in the axial direction. A special 2-D actuator test setup was developed to study axial walking of pipe on clay seabed under drained and undrained loading conditions. The effect of pipe loading rate, pipe embedment, and shutdown cycles on axial friction force were explored. Based on the experimental results, the pre-peak, peak and residual components of the axial force-displacement curve were identified and explained using a simplified theoretical framework.
Keywords: Pipe-soil interaction, axial walking, pipeline, offshore, clay seabed
1 INTRODUCTION The increasing developments for the exploitation of hydrocarbon resources located in deep-water offshore sites require significant use of pipelines laid on seabed. These pipelines are required to operate at high temperatures and pressures to prevent the solidification of petroleum. At these operating conditions, the pipe wall can experience significant thermal stresses, which could lead to extensive expansion of the pipeline. As surface laid pipelines are partially embedded on seabed, any natural tendency to expansion will be restrained by the interaction between the pipe and seabed soil and these restraints could lead to a build-up of compressive stresses along the pipe axis.
During the operational life, the pipeline can undergo several thermal cycles resulting in expansions and contractions respectively during the heat up and cool down periods of the pipe wall. At the end of every thermal cycle, some part of the expansion may be recovered, while the irrecoverable expansion would accumulate at the free ends of the pipeline to cause the pipeline to shift towards one direction, known as Axial walking. In instances where the pipeline ends are fixed and axial forces exceed the critical buckling load, the pipe buckles laterally in the form commonly known as Lateral buckling. Though the lateral pipe-soil interaction has been well investigated in the past, and methods such as pre-buckling or snake-lay are already in practice to mitigate the buckling phenomenon (Bruton et al. 2008; Bruton et al. 2005; Randolph and White 2008; White and Randolph 2007), the research into axial interaction behaviour is only in its infancy, where the available models only explain the break out resistance under drained and undrained limit states.
Several complications for the research into pipe axial interaction phenomenon can be identified. Foremost, it is complicated to model the low interface effective stresses induced by the buoyant effect on the pipeline, or to prepare the low shear strength (0 to 10 kPa) soil that represents the deepwater seabed conditions. Since such low stress and strength properties are not common to the conventional geotechnical applications, the axial interaction phenomenon cannot be suitably tested by means of conventional shear tests. Another practical difficulty to interpret the axial interaction behaviour is the complication to account for the stress reversal and the varying rate of axial displacement. Depending on the pumping and cool down cycles, the pipeline would exhibit varying rates of displacement at different sections of the pipe axis. Due to such difficulties, it is a challenge to investigate deepwater pipe-seabed axial interaction phenomenon.
The current paper presents a laboratory testing program performed at Monash University to interpret the pipe-soil interaction behaviour and its dependency on the influencing factors, such as initial embedment, displacement rate and surface condition. Experiments were performed on a seabed prepared in the laboratory to simulate the properties of deepwater offshore seabed. Instead of simulating the actual thermal expansion of the field pipeline, pipe axial displacements were mechanically imposed using a specialised 2D electric actuator system (MAPS, Monash Advance Pipe testing System), purpose built to handle both the drained and undrained rates of axial loadings. The dependency of friction force on parameters such as the loading rate and the pipe embedments were explored, while accounting for the burial depth with varying shutdown cycles. Based on the outcomes, the pre-peak, peak and residual components of the load displacement curve are explained using a simplified theoretical framework.
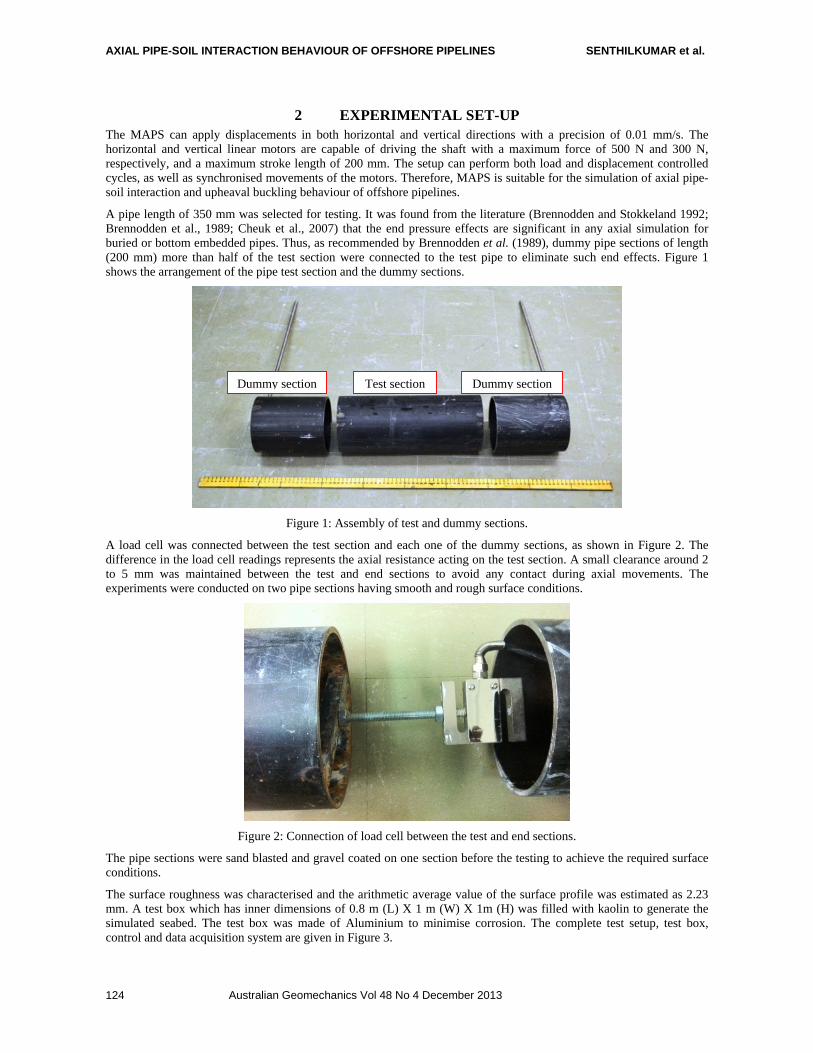
AXIAL PIPE-SOIL INTERACTION BEHAVIOUR OF OFFSHORE PIPELINES SENTHILKUMAR et al.
Australian Geomechanics Vol 48 No 4 December 2013 124
2 EXPERIMENTAL SET-UP The MAPS can apply displacements in both horizontal and vertical directions with a precision of 0.01 mm/s. The horizontal and vertical linear motors are capable of driving the shaft with a maximum force of 500 N and 300 N, respectively, and a maximum stroke length of 200 mm. The setup can perform both load and displacement controlled cycles, as well as synchronised movements of the motors. Therefore, MAPS is suitable for the simulation of axial pipe-soil interaction and upheaval buckling behaviour of offshore pipelines.
A pipe length of 350 mm was selected for testing. It was found from the literature (Brennodden and Stokkeland 1992; Brennodden et al., 1989; Cheuk et al., 2007) that the end pressure effects are significant in any axial simulation for buried or bottom embedded pipes. Thus, as recommended by Brennodden et al. (1989), dummy pipe sections of length (200 mm) more than half of the test section were connected to the test pipe to eliminate such end effects. Figure 1 shows the arrangement of the pipe test section and the dummy sections.
Figure 1: Assembly of test and dummy sections.
A load cell was connected between the test section and each one of the dummy sections, as shown in Figure 2. The difference in the load cell readings represents the axial resistance acting on the test section. A small clearance around 2 to 5 mm was maintained between the test and end sections to avoid any contact during axial movements. The experiments were conducted on two pipe sections having smooth and rough surface conditions.
Figure 2: Connection of load cell between the test and end sections.
The pipe sections were sand blasted and gravel coated on one section before the testing to achieve the required surface conditions.
The surface roughness was characterised and the arithmetic average value of the surface profile was estimated as 2.23 mm. A test box which has inner dimensions of 0.8 m (L) X 1 m (W) X 1m (H) was filled with kaolin to generate the simulated seabed. The test box was made of Aluminium to minimise corrosion. The complete test setup, test box, control and data acquisition system are given in Figure 3.
Test sectionDummy section Dummy section

AXIAL PIPE-SOIL INTERACTION BEHAVIOUR OF OFFSHORE PIPELINES SENTHILKUMAR et al.
Australian Geomechanics Vol 48 No 4 December 2013 125
Figure 3: MAPS test setup.
3 MODEL SEABED PREPARATION The test bed was prepared in several stages. The bottom 200 mm depth was filled with 8/16 mm sand to provide faster water drainage to clay layers. Subsequently, the tank was filled with water and occasionally stirred for one week time to deplete the air trapped between the grain particles. A perforated tube of 10 mm sealed at one end was placed on top of the sand layer in a zigzag shape to perform the vacuum consolidation. After the stabilisation time, two layers of permeable geotextile with a thickness of 3 mm were wrapped on top of this sand layer to prevent the sand from mixing with the clay slurry. A schematic view of the test seabed is shown in Figure 4.
Figure 4: Schematic view of the test seabed.
The commercially available Prestige NY kaolin, sourced from Granville, New South Wales, was used to prepare the seabed. Actual seabed soil would have been more appropriate for the model seabed preparation. However, obtaining such a large quantity of loose soil from the deepwater seabed location was not viable. Therefore, a soil that exhibited similar characteristics to the seabed soil was selected. By means of extensive preliminary experiments, the Prestige NY kaolin was selected for its resemblance to the seabed silt of North Western shelf, Australia.
The kaolin was homogenised at twice the liquid limit and spread on the sand layer, while having a water level above the soil to avoid any air entrapment. The consolidation process was carried out until a final consolidation height of 450 mm. Vacuum consolidation was applied to accelerate the consolidation process. In addition, a load induced consolidation was also performed to increase the shear strength of the soil at the free surface. Following the method reported by Cheuk et al. (2007), pumping out the water from the bottom of the tank was performed for 20 days to 30 days to achieve the target soil shear strength at the surface. The soil shear strength profile after every consolidation cycle was measured using a T-bar penetrometer (Stewart and Randolph 1994). Figure 5 shows the T-bar used for the shear strength measurements. Additionally, Vane shear measurements were taken at specified locations down the soil profile. The strength was measured at the centre and at the walls of the test box to quantify the boundary effects on the soil consolidation.
The T-bar was pushed into the soil using the MAPS, and the soil resistance was measured using a load cell attached to the top of the T-bar. The T-bar arrangement was calibrated before the test to account for the interface friction. The load

AXIAL PIPE-SOIL INTERACTION BEHAVIOUR OF OFFSHORE PIPELINES SENTHILKUMAR et al.
Australian Geomechanics Vol 48 No 4 December 2013 126
Figure 5: T-bar used for soil strength measurements.
In order to measure the undrained soil shear strength, the displacement rate of the pipe should be maintained fast enough to retain the undrained behaviour of the soil. In the current test, the vertical displacement rate of the T-bar was maintained as 3 mm/s. The undrained and drained T-bar displacement rates were estimated from the dimensionless
Therefore, it can be argued that the result from T-bar test is a measure of the undrained shear strength of soil. The results of both the T-bar profiling and the Vane shear spot reading are presented in Figure 6. From the results, it is evident that the vacuum consolidation was not effective in achieving the required shear strength of the soil. The use of surcharge pressure was, however, observed to strengthen the soil at the surface and down the depth.
At shallower depth, there is an inconsistency between the T-bar reading and the Vane shear measurements. This is considered to arise mainly due to the curve surface of the T-bar. The average shear strength of the seabed surface was estimated to be 0.49 kPa using the Vane shear measurements and extrapolated T-bar shear strength profiling
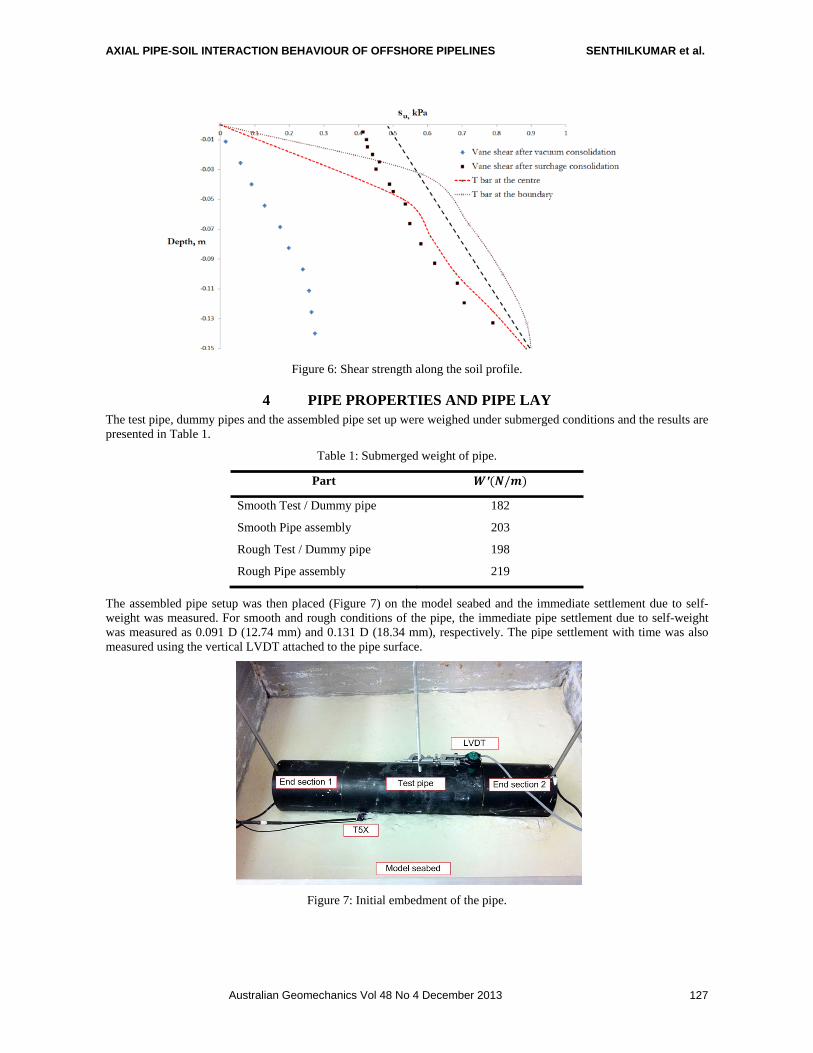
AXIAL PIPE-SOIL INTERACTION BEHAVIOUR OF OFFSHORE PIPELINES SENTHILKUMAR et al.
Australian Geomechanics Vol 48 No 4 December 2013 127
Figure 6: Shear strength along the soil profile.
4 PIPE PROPERTIES AND PIPE LAY The test pipe, dummy pipes and the assembled pipe set up were weighed under submerged conditions and the results are presented in Table 1.
Table 1: Submerged weight of pipe.
Part ′ /
Smooth Test / Dummy pipe 182
Smooth Pipe assembly 203
Rough Test / Dummy pipe 198
Rough Pipe assembly 219
The assembled pipe setup was then placed (Figure 7) on the model seabed and the immediate settlement due to self-weight was measured. For smooth and rough conditions of the pipe, the immediate pipe settlement due to self-weight was measured as 0.091 D (12.74 mm) and 0.131 D (18.34 mm), respectively. The pipe settlement with time was also measured using the vertical LVDT attached to the pipe surface.
Figure 7: Initial embedment of the pipe.
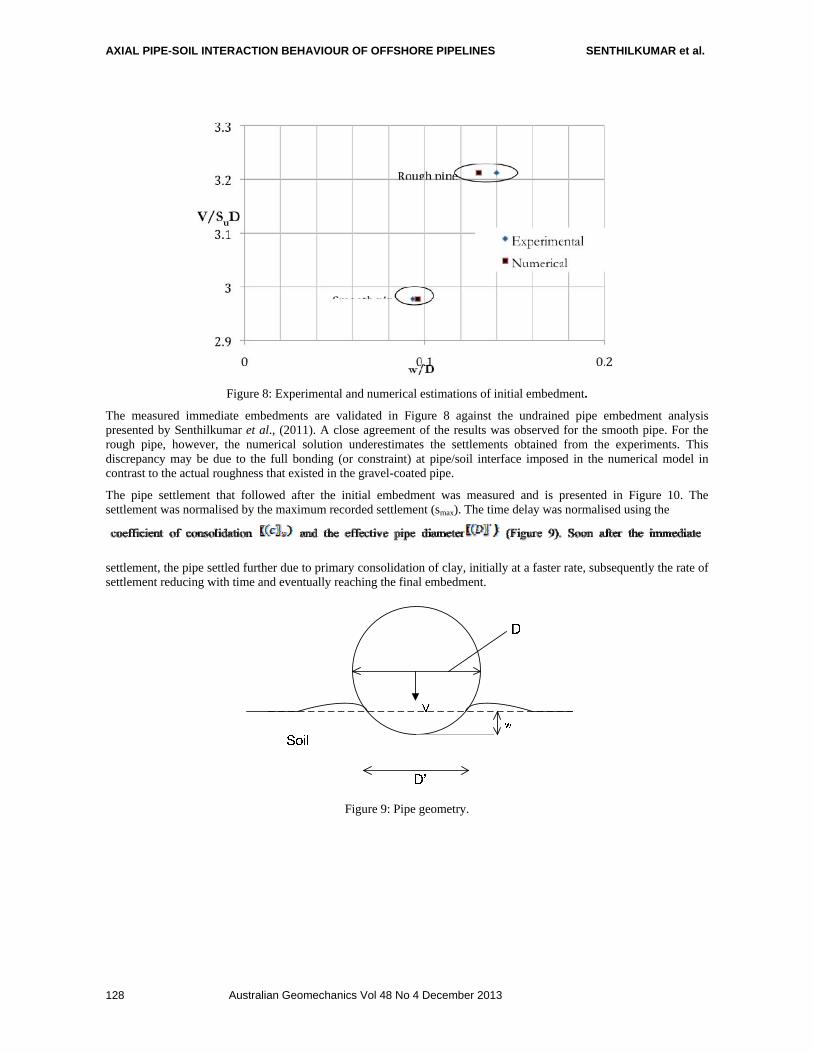
AXIAL PIPE-SOIL INTERACTION BEHAVIOUR OF OFFSHORE PIPELINES SENTHILKUMAR et al.
Australian Geomechanics Vol 48 No 4 December 2013 128
Figure 8: Experimental and numerical estimations of initial embedment.
The measured immediate embedments are validated in Figure 8 against the undrained pipe embedment analysis presented by Senthilkumar et al., (2011). A close agreement of the results was observed for the smooth pipe. For the rough pipe, however, the numerical solution underestimates the settlements obtained from the experiments. This discrepancy may be due to the full bonding (or constraint) at pipe/soil interface imposed in the numerical model in contrast to the actual roughness that existed in the gravel-coated pipe.
The pipe settlement that followed after the initial embedment was measured and is presented in Figure 10. The settlement was normalised by the maximum recorded settlement (smax). The time delay was normalised using the
settlement, the pipe settled further due to primary consolidation of clay, initially at a faster rate, subsequently the rate of settlement reducing with time and eventually reaching the final embedment.
Figure 9: Pipe geometry.

AXIAL PIPE-SOIL INTERACTION BEHAVIOUR OF OFFSHORE PIPELINES SENTHILKUMAR et al.
Australian Geomechanics Vol 48 No 4 December 2013 129
Figure 10: Settlement of a smooth pipe.
5 AXIAL SHEARING To investigate the axial interaction behaviour the pipe was axially displaced, while maintaining the final embedment reached at the end of consolidation constant. Initially a relatively slow pipe movement rate of 0.01 mm/s was induced for a maximum displacement of 10 mm of the pipe to examine the cyclic load-displacement behaviour. Once this test was completed, a shutdown period was maintained and subsequently, the next test was undertaken by increasing the rate of loading. This approach was repeated for a series of loading rates with shutdown periods in between. Thereafter, the embedment depth was increased by pushing the pipe further into soil by the actuator. After that, a series of tests were undertaken as before for a range of displacement rates. The initial load displacement of smooth and rough pipes at an embedment depth of 0.1D and at a displacement rate of 0.01 mm/s are given in Figure 11 and Figure 12 respectively (the results are presented per unit length of the pipe ).
Figure 11: Axial load-displacement relationship of smooth pipe: v= 0.01mm/s, w= 0.1D.
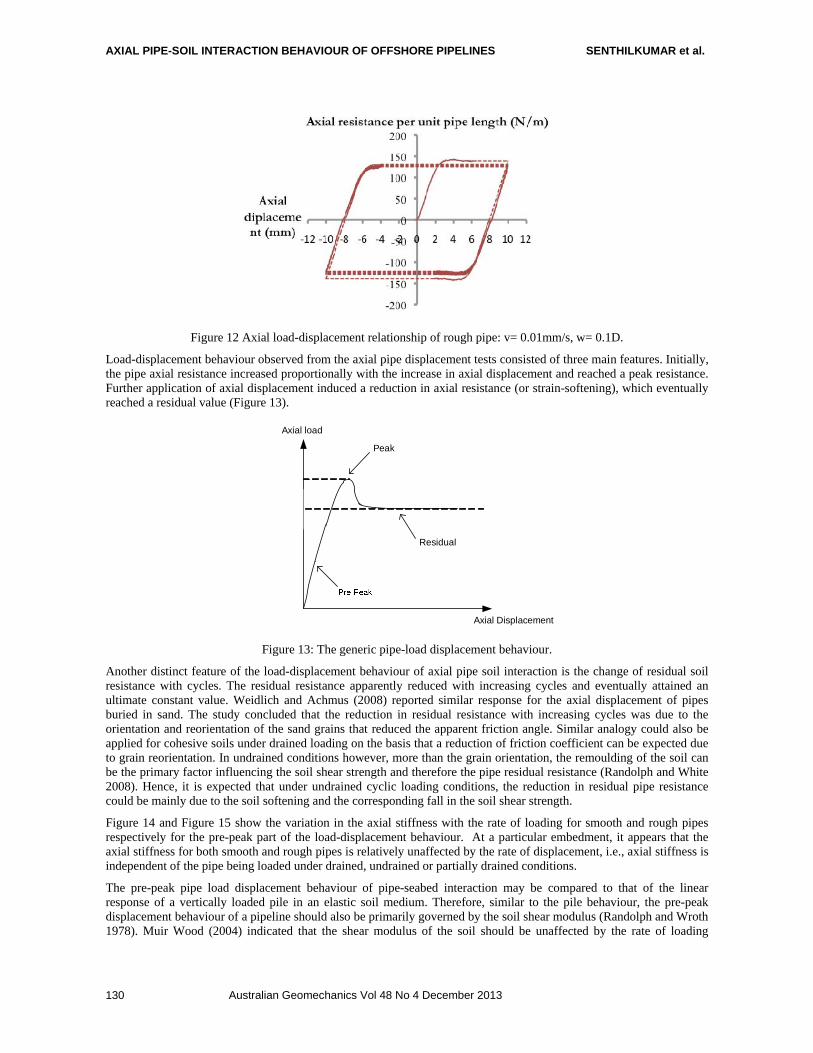
AXIAL PIPE-SOIL INTERACTION BEHAVIOUR OF OFFSHORE PIPELINES SENTHILKUMAR et al.
Australian Geomechanics Vol 48 No 4 December 2013 130
Figure 12 Axial load-displacement relationship of rough pipe: v= 0.01mm/s, w= 0.1D.
Load-displacement behaviour observed from the axial pipe displacement tests consisted of three main features. Initially, the pipe axial resistance increased proportionally with the increase in axial displacement and reached a peak resistance. Further application of axial displacement induced a reduction in axial resistance (or strain-softening), which eventually reached a residual value (Figure 13).
ResidualK
Peak
Axial load
Axial Displacement
Figure 13: The generic pipe-load displacement behaviour.
Another distinct feature of the load-displacement behaviour of axial pipe soil interaction is the change of residual soil resistance with cycles. The residual resistance apparently reduced with increasing cycles and eventually attained an ultimate constant value. Weidlich and Achmus (2008) reported similar response for the axial displacement of pipes buried in sand. The study concluded that the reduction in residual resistance with increasing cycles was due to the orientation and reorientation of the sand grains that reduced the apparent friction angle. Similar analogy could also be applied for cohesive soils under drained loading on the basis that a reduction of friction coefficient can be expected due to grain reorientation. In undrained conditions however, more than the grain orientation, the remoulding of the soil can be the primary factor influencing the soil shear strength and therefore the pipe residual resistance (Randolph and White 2008). Hence, it is expected that under undrained cyclic loading conditions, the reduction in residual pipe resistance could be mainly due to the soil softening and the corresponding fall in the soil shear strength.
Figure 14 and Figure 15 show the variation in the axial stiffness with the rate of loading for smooth and rough pipes respectively for the pre-peak part of the load-displacement behaviour. At a particular embedment, it appears that the axial stiffness for both smooth and rough pipes is relatively unaffected by the rate of displacement, i.e., axial stiffness is independent of the pipe being loaded under drained, undrained or partially drained conditions.
The pre-peak pipe load displacement behaviour of pipe-seabed interaction may be compared to that of the linear response of a vertically loaded pile in an elastic soil medium. Therefore, similar to the pile behaviour, the pre-peak displacement behaviour of a pipeline should also be primarily governed by the soil shear modulus (Randolph and Wroth 1978). Muir Wood (2004) indicated that the shear modulus of the soil should be unaffected by the rate of loading
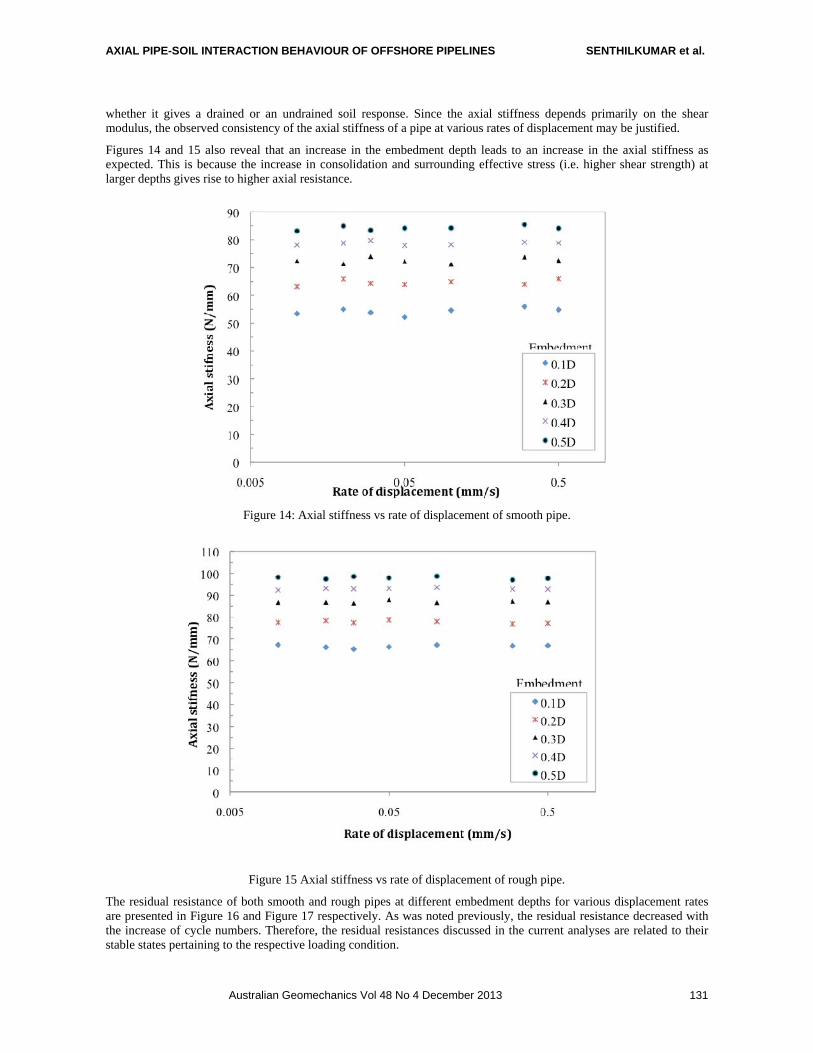
AXIAL PIPE-SOIL INTERACTION BEHAVIOUR OF OFFSHORE PIPELINES SENTHILKUMAR et al.
Australian Geomechanics Vol 48 No 4 December 2013 131
whether it gives a drained or an undrained soil response. Since the axial stiffness depends primarily on the shear modulus, the observed consistency of the axial stiffness of a pipe at various rates of displacement may be justified.
Figures 14 and 15 also reveal that an increase in the embedment depth leads to an increase in the axial stiffness as expected. This is because the increase in consolidation and surrounding effective stress (i.e. higher shear strength) at larger depths gives rise to higher axial resistance.
Figure 14: Axial stiffness vs rate of displacement of smooth pipe.
Figure 15 Axial stiffness vs rate of displacement of rough pipe.
The residual resistance of both smooth and rough pipes at different embedment depths for various displacement rates are presented in Figure 16 and Figure 17 respectively. As was noted previously, the residual resistance decreased with the increase of cycle numbers. Therefore, the residual resistances discussed in the current analyses are related to their stable states pertaining to the respective loading condition.
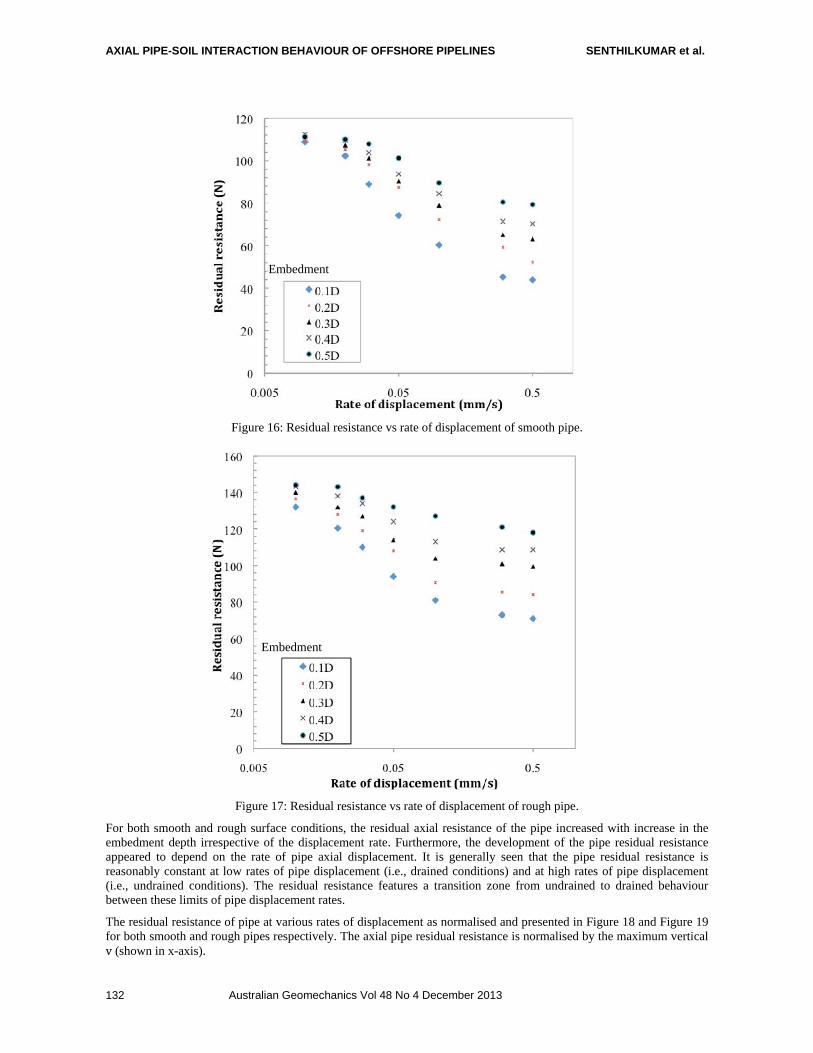
AXIAL PIPE-SOIL INTERACTION BEHAVIOUR OF OFFSHORE PIPELINES SENTHILKUMAR et al.
Australian Geomechanics Vol 48 No 4 December 2013 132
Figure 16: Residual resistance vs rate of displacement of smooth pipe.
Figure 17: Residual resistance vs rate of displacement of rough pipe.
For both smooth and rough surface conditions, the residual axial resistance of the pipe increased with increase in the embedment depth irrespective of the displacement rate. Furthermore, the development of the pipe residual resistance appeared to depend on the rate of pipe axial displacement. It is generally seen that the pipe residual resistance is reasonably constant at low rates of pipe displacement (i.e., drained conditions) and at high rates of pipe displacement (i.e., undrained conditions). The residual resistance features a transition zone from undrained to drained behaviour between these limits of pipe displacement rates.
The residual resistance of pipe at various rates of displacement as normalised and presented in Figure 18 and Figure 19 for both smooth and rough pipes respectively. The axial pipe residual resistance is normalised by the maximum vertical v (shown in x-axis).
Embedment
Embedment
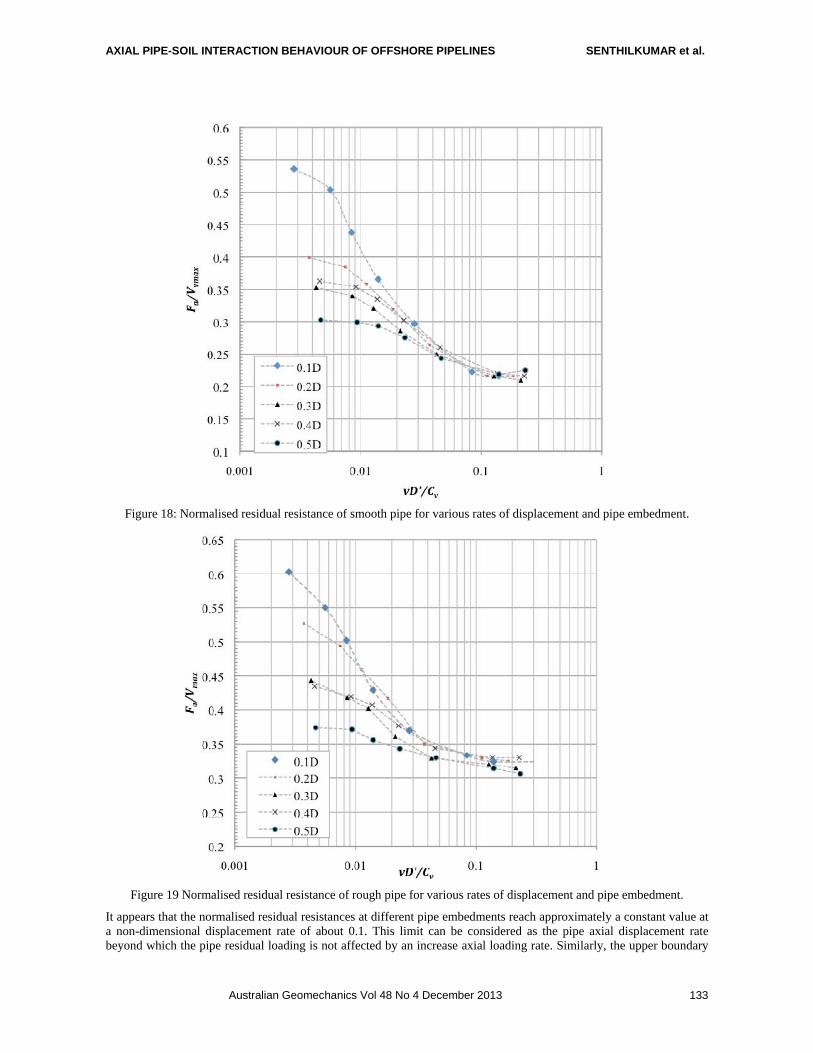
AXIAL PIPE-SOIL INTERACTION BEHAVIOUR OF OFFSHORE PIPELINES SENTHILKUMAR et al.
Australian Geomechanics Vol 48 No 4 December 2013 133
Figure 18: Normalised residual resistance of smooth pipe for various rates of displacement and pipe embedment.
Figure 19 Normalised residual resistance of rough pipe for various rates of displacement and pipe embedment.
It appears that the normalised residual resistances at different pipe embedments reach approximately a constant value at a non-dimensional displacement rate of about 0.1. This limit can be considered as the pipe axial displacement rate beyond which the pipe residual loading is not affected by an increase axial loading rate. Similarly, the upper boundary
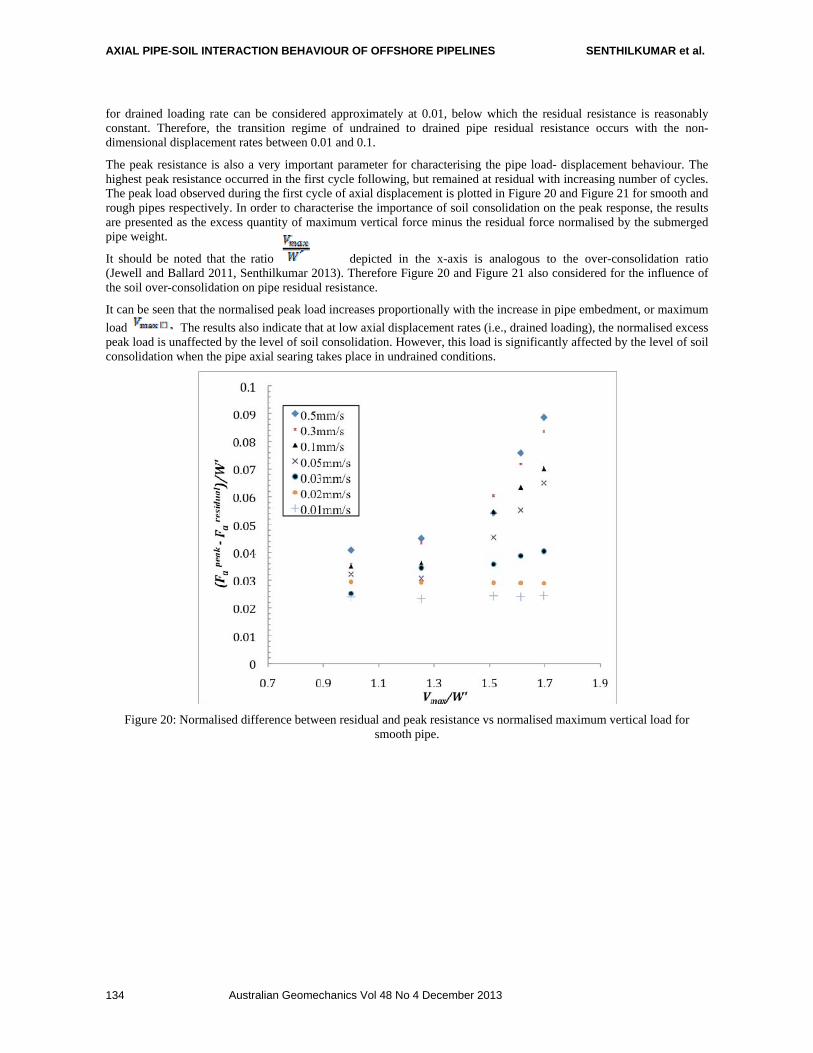
AXIAL PIPE-SOIL INTERACTION BEHAVIOUR OF OFFSHORE PIPELINES SENTHILKUMAR et al.
Australian Geomechanics Vol 48 No 4 December 2013 134
for drained loading rate can be considered approximately at 0.01, below which the residual resistance is reasonably constant. Therefore, the transition regime of undrained to drained pipe residual resistance occurs with the non-dimensional displacement rates between 0.01 and 0.1.
The peak resistance is also a very important parameter for characterising the pipe load- displacement behaviour. The highest peak resistance occurred in the first cycle following, but remained at residual with increasing number of cycles. The peak load observed during the first cycle of axial displacement is plotted in Figure 20 and Figure 21 for smooth and rough pipes respectively. In order to characterise the importance of soil consolidation on the peak response, the results are presented as the excess quantity of maximum vertical force minus the residual force normalised by the submerged pipe weight.
depicted in the x-axis is analogous to the over-consolidation ratio It should be noted that the ratio (Jewell and Ballard 2011, Senthilkumar 2013). Therefore Figure 20 and Figure 21 also considered for the influence of the soil over-consolidation on pipe residual resistance.
It can be seen that the normalised peak load increases proportionally with the increase in pipe embedment, or maximum
load The results also indicate that at low axial displacement rates (i.e., drained loading), the normalised excess peak load is unaffected by the level of soil consolidation. However, this load is significantly affected by the level of soil consolidation when the pipe axial searing takes place in undrained conditions.
Figure 20: Normalised difference between residual and peak resistance vs normalised maximum vertical load for smooth pipe.
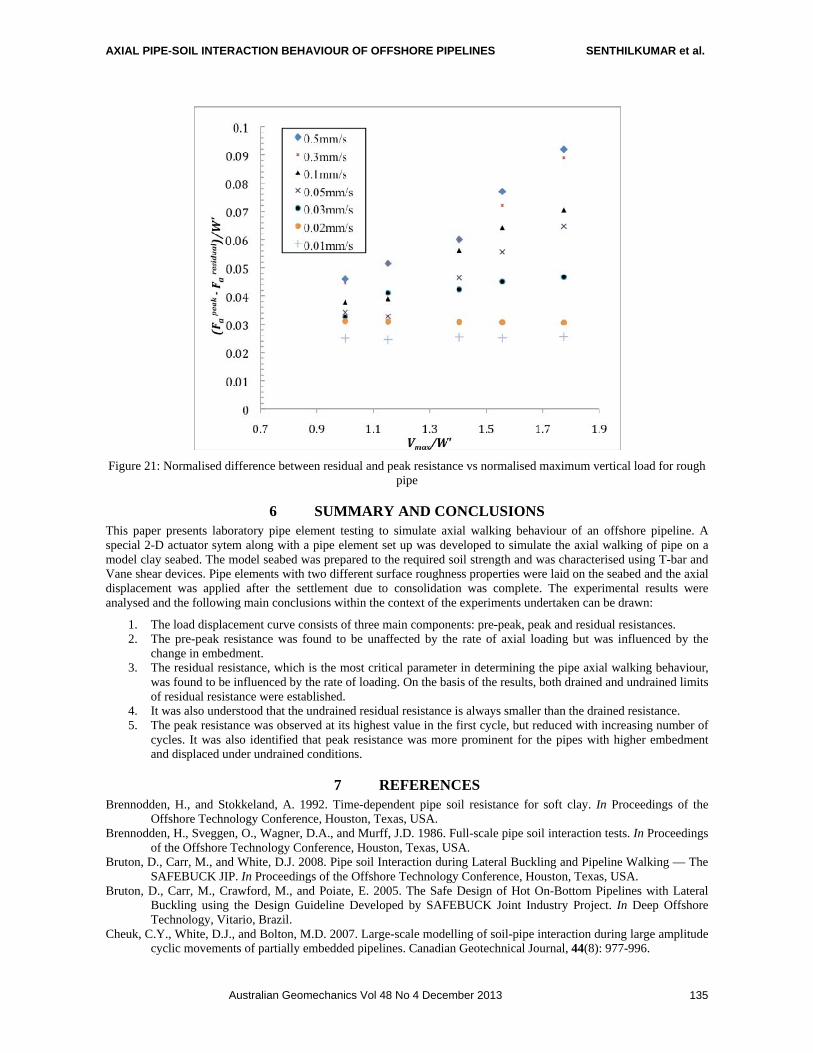
AXIAL PIPE-SOIL INTERACTION BEHAVIOUR OF OFFSHORE PIPELINES SENTHILKUMAR et al.
Australian Geomechanics Vol 48 No 4 December 2013 135
Figure 21: Normalised difference between residual and peak resistance vs normalised maximum vertical load for rough pipe
6 SUMMARY AND CONCLUSIONS This paper presents laboratory pipe element testing to simulate axial walking behaviour of an offshore pipeline. A special 2-D actuator sytem along with a pipe element set up was developed to simulate the axial walking of pipe on a model clay seabed. The model seabed was prepared to the required soil strength and was characterised using T-bar and Vane shear devices. Pipe elements with two different surface roughness properties were laid on the seabed and the axial displacement was applied after the settlement due to consolidation was complete. The experimental results were analysed and the following main conclusions within the context of the experiments undertaken can be drawn:
1. The load displacement curve consists of three main components: pre-peak, peak and residual resistances. 2. The pre-peak resistance was found to be unaffected by the rate of axial loading but was influenced by the
change in embedment. 3. The residual resistance, which is the most critical parameter in determining the pipe axial walking behaviour,
was found to be influenced by the rate of loading. On the basis of the results, both drained and undrained limits of residual resistance were established.
4. It was also understood that the undrained residual resistance is always smaller than the drained resistance. 5. The peak resistance was observed at its highest value in the first cycle, but reduced with increasing number of
cycles. It was also identified that peak resistance was more prominent for the pipes with higher embedment and displaced under undrained conditions.
7 REFERENCES Brennodden, H., and Stokkeland, A. 1992. Time-dependent pipe soil resistance for soft clay. In Proceedings of the
Offshore Technology Conference, Houston, Texas, USA. Brennodden, H., Sveggen, O., Wagner, D.A., and Murff, J.D. 1986. Full-scale pipe soil interaction tests. In Proceedings
of the Offshore Technology Conference, Houston, Texas, USA. Bruton, D., Carr, M., and White, D.J. 2008. Pipe soil Interaction during Lateral Buckling and Pipeline Walking — The
SAFEBUCK JIP. In Proceedings of the Offshore Technology Conference, Houston, Texas, USA. Bruton, D., Carr, M., Crawford, M., and Poiate, E. 2005. The Safe Design of Hot On-Bottom Pipelines with Lateral
Buckling using the Design Guideline Developed by SAFEBUCK Joint Industry Project. In Deep Offshore Technology, Vitario, Brazil.
Cheuk, C.Y., White, D.J., and Bolton, M.D. 2007. Large-scale modelling of soil-pipe interaction during large amplitude cyclic movements of partially embedded pipelines. Canadian Geotechnical Journal, 44(8): 977-996.
AXIAL PIPE-SOIL INTERACTION BEHAVIOUR OF OFFSHORE PIPELINES SENTHILKUMAR et al.
Australian Geomechanics Vol 48 No 4 December 2013 136
Jewell, R.A. and Ballard, J.C. 2011, Axial Pipe-Soil Interaction: a Suggested Framework, Offshore Technology Conference, paper OTC 22010, Houston, Texas
Muir Wood, D. 2004. Geotechnical modelling. E. & F. N. Spon Randolph, M.F., and White, D.J. 2008a. Pipeline Embedment in Deep Water: Processes and Quantitative Assessment.
In Proceedings of the Offshore Technology Conference, Houston, Texas, USA. Senthilkumar, M., Kodikara, J. and Rajeev, P. 2011. Numerical Modelling of Undrained Vertical Load-Deformation
Behaviour of Seabed Pipelines, 13th International Conference of the International Association for Computer Methods and Advances in Geomechanics, Melbourne, Australia.
Senthilkumar, M., Offshore pipe clay seabed interaction in axial direction . Doctor of Philosophy, Monash University, Clayton.
Stewart, D.P., and Randolph, M.F. 1994. T-bar penetration testing in soft clay. Journal of Geotechnical Engineering - ASCE, 120(12): 2230-2235.
Weidlich, I., and Achmus, M. 2008. Measurement of normal pressures and friction forces acting on buried pipes subjected to cyclic axial displacements in laboratory experiments. Geotechnical Testing Journal, 31(4): 334-343.
White, D.J., and Randolph, M.F. 2007. Seabed characterisation and models for pipeline-soil interaction. In International Socity of Offshore and Polar Engineering, Cupertino, USA, pp. 193-204.
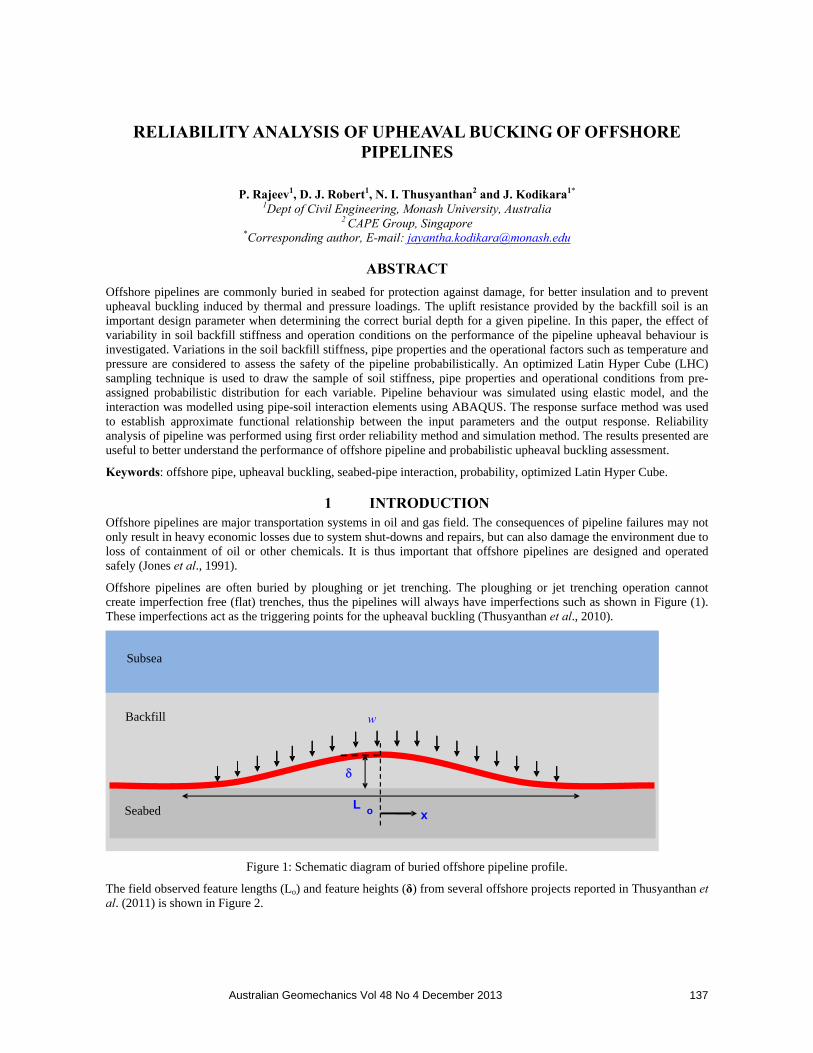
Australian Geomechanics Vol 48 No 4 December 2013 137
RELIABILITY ANALYSIS OF UPHEAVAL BUCKING OF OFFSHORE PIPELINES
P. Rajeev1, D. J. Robert1, N. I. Thusyanthan2 and J. Kodikara1* 1Dept of Civil Engineering, Monash University, Australia
2 CAPE Group, Singapore *Corresponding author, E-mail: [email protected]
ABSTRACT
Offshore pipelines are commonly buried in seabed for protection against damage, for better insulation and to prevent upheaval buckling induced by thermal and pressure loadings. The uplift resistance provided by the backfill soil is an important design parameter when determining the correct burial depth for a given pipeline. In this paper, the effect of variability in soil backfill stiffness and operation conditions on the performance of the pipeline upheaval behaviour is investigated. Variations in the soil backfill stiffness, pipe properties and the operational factors such as temperature and pressure are considered to assess the safety of the pipeline probabilistically. An optimized Latin Hyper Cube (LHC) sampling technique is used to draw the sample of soil stiffness, pipe properties and operational conditions from pre-assigned probabilistic distribution for each variable. Pipeline behaviour was simulated using elastic model, and the interaction was modelled using pipe-soil interaction elements using ABAQUS. The response surface method was used to establish approximate functional relationship between the input parameters and the output response. Reliability analysis of pipeline was performed using first order reliability method and simulation method. The results presented are useful to better understand the performance of offshore pipeline and probabilistic upheaval buckling assessment.
Keywords: offshore pipe, upheaval buckling, seabed-pipe interaction, probability, optimized Latin Hyper Cube.
1 INTRODUCTION Offshore pipelines are major transportation systems in oil and gas field. The consequences of pipeline failures may not only result in heavy economic losses due to system shut-downs and repairs, but can also damage the environment due to loss of containment of oil or other chemicals. It is thus important that offshore pipelines are designed and operated safely (Jones et al., 1991).
Offshore pipelines are often buried by ploughing or jet trenching. The ploughing or jet trenching operation cannot create imperfection free (flat) trenches, thus the pipelines will always have imperfections such as shown in Figure (1). These imperfections act as the triggering points for the upheaval buckling (Thusyanthan et al., 2010).
Figure 1: Schematic diagram of buried offshore pipeline profile.
The field observed feature lengths (Lo) and feature heights (δ) from several offshore projects reported in Thusyanthan et al. (2011) is shown in Figure 2.
x
L
o
w
Subsea
Backfill
Seabed
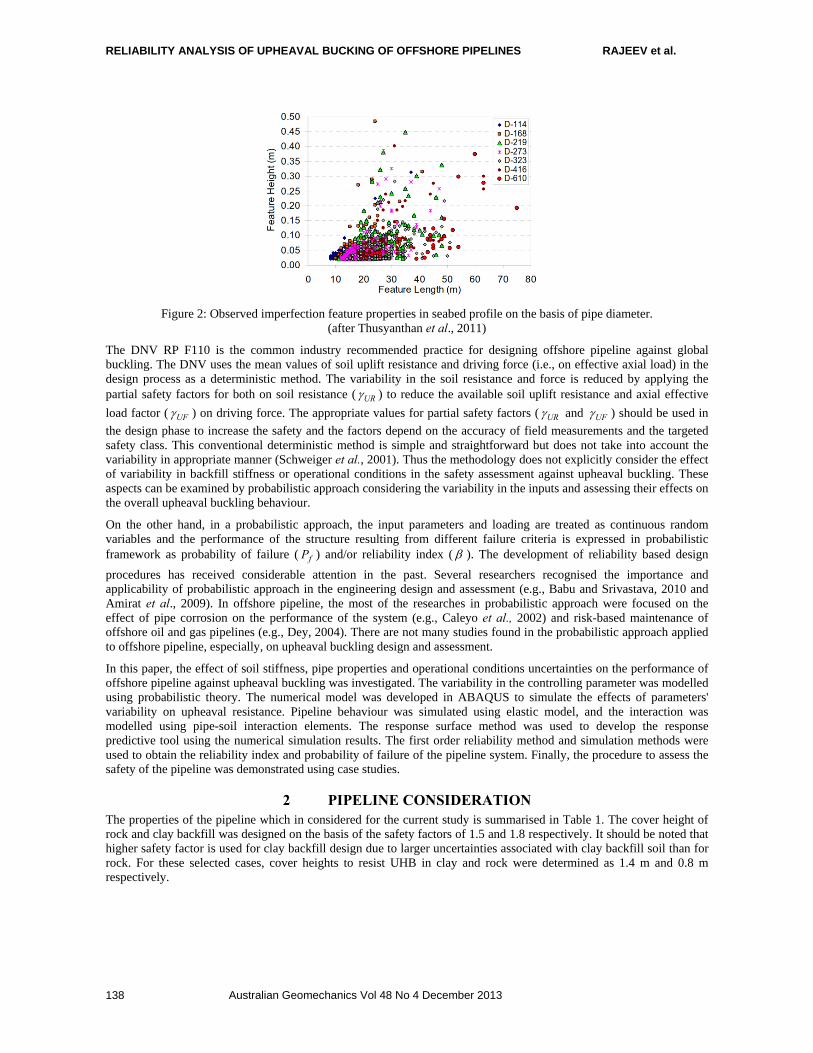
RELIABILITY ANALYSIS OF UPHEAVAL BUCKING OF OFFSHORE PIPELINES RAJEEV et al.
Australian Geomechanics Vol 48 No 4 December 2013 138
Figure 2: Observed imperfection feature properties in seabed profile on the basis of pipe diameter. (after Thusyanthan et al., 2011)
The DNV RP F110 is the common industry recommended practice for designing offshore pipeline against global buckling. The DNV uses the mean values of soil uplift resistance and driving force (i.e., on effective axial load) in the design process as a deterministic method. The variability in the soil resistance and force is reduced by applying the partial safety factors for both on soil resistance ( UR ) to reduce the available soil uplift resistance and axial effective
load factor ( UF ) on driving force. The appropriate values for partial safety factors ( UR and UF ) should be used in
the design phase to increase the safety and the factors depend on the accuracy of field measurements and the targeted safety class. This conventional deterministic method is simple and straightforward but does not take into account the variability in appropriate manner (Schweiger et al., 2001). Thus the methodology does not explicitly consider the effect of variability in backfill stiffness or operational conditions in the safety assessment against upheaval buckling. These aspects can be examined by probabilistic approach considering the variability in the inputs and assessing their effects on the overall upheaval buckling behaviour.
On the other hand, in a probabilistic approach, the input parameters and loading are treated as continuous random variables and the performance of the structure resulting from different failure criteria is expressed in probabilistic framework as probability of failure ( fP ) and/or reliability index ( ). The development of reliability based design
procedures has received considerable attention in the past. Several researchers recognised the importance and applicability of probabilistic approach in the engineering design and assessment (e.g., Babu and Srivastava, 2010 and Amirat et al., 2009). In offshore pipeline, the most of the researches in probabilistic approach were focused on the effect of pipe corrosion on the performance of the system (e.g., Caleyo et al., 2002) and risk-based maintenance of offshore oil and gas pipelines (e.g., Dey, 2004). There are not many studies found in the probabilistic approach applied to offshore pipeline, especially, on upheaval buckling design and assessment.
In this paper, the effect of soil stiffness, pipe properties and operational conditions uncertainties on the performance of offshore pipeline against upheaval buckling was investigated. The variability in the controlling parameter was modelled using probabilistic theory. The numerical model was developed in ABAQUS to simulate the effects of parameters' variability on upheaval resistance. Pipeline behaviour was simulated using elastic model, and the interaction was modelled using pipe-soil interaction elements. The response surface method was used to develop the response predictive tool using the numerical simulation results. The first order reliability method and simulation methods were used to obtain the reliability index and probability of failure of the pipeline system. Finally, the procedure to assess the safety of the pipeline was demonstrated using case studies.
2 PIPELINE CONSIDERATION The properties of the pipeline which in considered for the current study is summarised in Table 1. The cover height of rock and clay backfill was designed on the basis of the safety factors of 1.5 and 1.8 respectively. It should be noted that higher safety factor is used for clay backfill design due to larger uncertainties associated with clay backfill soil than for rock. For these selected cases, cover heights to resist UHB in clay and rock were determined as 1.4 m and 0.8 m respectively.
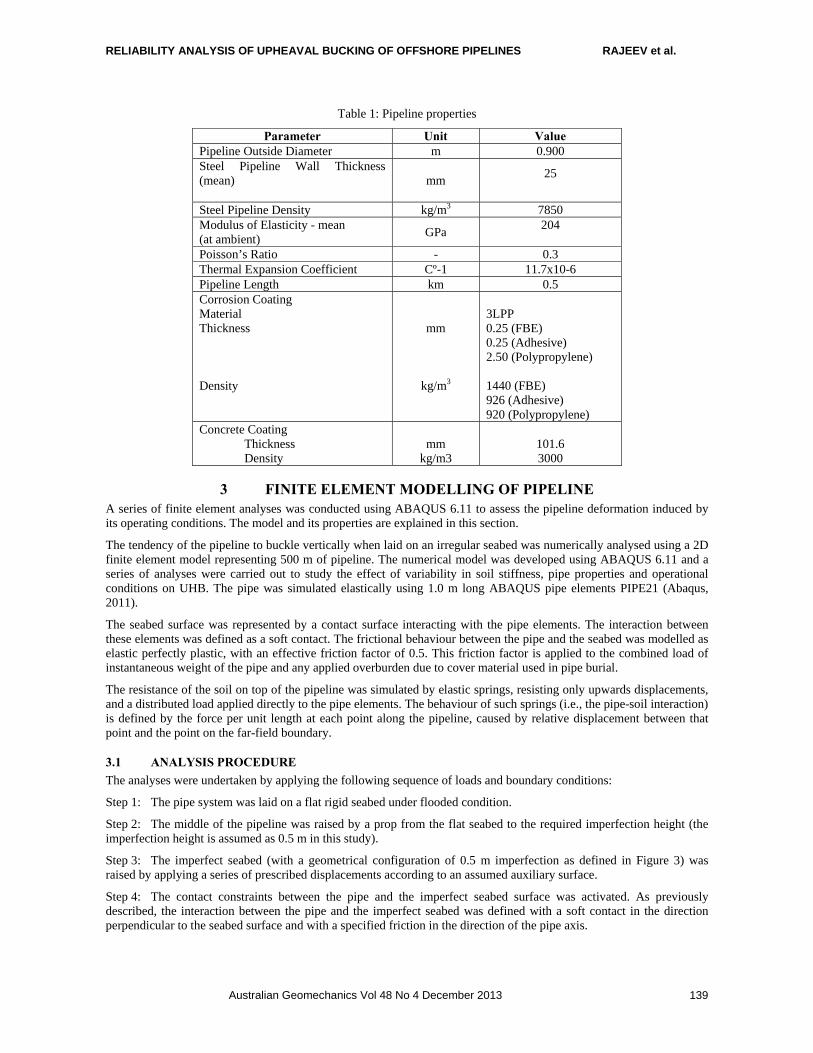
RELIABILITY ANALYSIS OF UPHEAVAL BUCKING OF OFFSHORE PIPELINES RAJEEV et al.
Australian Geomechanics Vol 48 No 4 December 2013 139
Table 1: Pipeline properties
Parameter Unit Value Pipeline Outside Diameter m 0.900 Steel Pipeline Wall Thickness (mean)
mm 25
Steel Pipeline Density kg/m3 7850 Modulus of Elasticity - mean (at ambient)
GPa 204
Poisson’s Ratio - 0.3 Thermal Expansion Coefficient Cº-1 11.7x10⁻⁶ Pipeline Length km 0.5 Corrosion Coating Material Thickness Density
mm
kg/m3
3LPP 0.25 (FBE) 0.25 (Adhesive) 2.50 (Polypropylene) 1440 (FBE) 926 (Adhesive) 920 (Polypropylene)
Concrete Coating Thickness Density
mm
kg/m3
101.6 3000
3 FINITE ELEMENT MODELLING OF PIPELINE
A series of finite element analyses was conducted using ABAQUS 6.11 to assess the pipeline deformation induced by its operating conditions. The model and its properties are explained in this section.
The tendency of the pipeline to buckle vertically when laid on an irregular seabed was numerically analysed using a 2D finite element model representing 500 m of pipeline. The numerical model was developed using ABAQUS 6.11 and a series of analyses were carried out to study the effect of variability in soil stiffness, pipe properties and operational conditions on UHB. The pipe was simulated elastically using 1.0 m long ABAQUS pipe elements PIPE21 (Abaqus, 2011).
The seabed surface was represented by a contact surface interacting with the pipe elements. The interaction between these elements was defined as a soft contact. The frictional behaviour between the pipe and the seabed was modelled as elastic perfectly plastic, with an effective friction factor of 0.5. This friction factor is applied to the combined load of instantaneous weight of the pipe and any applied overburden due to cover material used in pipe burial.
The resistance of the soil on top of the pipeline was simulated by elastic springs, resisting only upwards displacements, and a distributed load applied directly to the pipe elements. The behaviour of such springs (i.e., the pipe-soil interaction) is defined by the force per unit length at each point along the pipeline, caused by relative displacement between that point and the point on the far-field boundary.
3.1 ANALYSIS PROCEDURE
The analyses were undertaken by applying the following sequence of loads and boundary conditions:
Step 1: The pipe system was laid on a flat rigid seabed under flooded condition.
Step 2: The middle of the pipeline was raised by a prop from the flat seabed to the required imperfection height (the imperfection height is assumed as 0.5 m in this study).
Step 3: The imperfect seabed (with a geometrical configuration of 0.5 m imperfection as defined in Figure 3) was raised by applying a series of prescribed displacements according to an assumed auxiliary surface.
Step 4: The contact constraints between the pipe and the imperfect seabed surface was activated. As previously described, the interaction between the pipe and the imperfect seabed was defined with a soft contact in the direction perpendicular to the seabed surface and with a specified friction in the direction of the pipe axis.
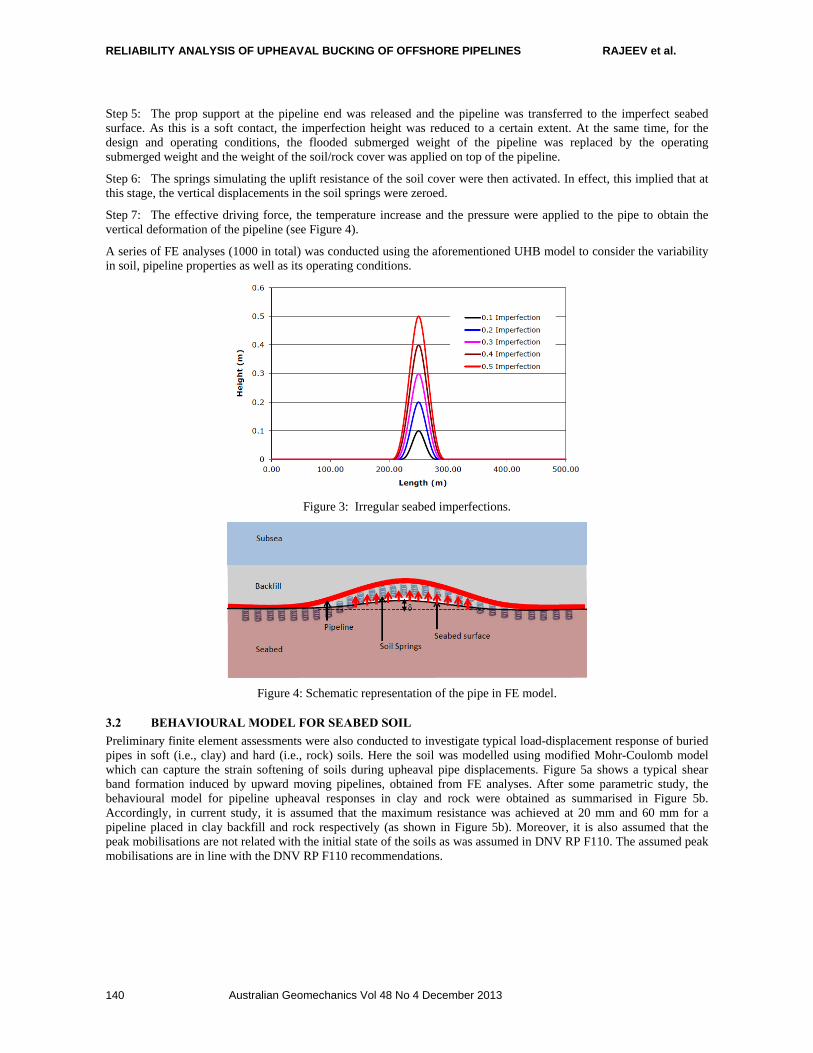
RELIABILITY ANALYSIS OF UPHEAVAL BUCKING OF OFFSHORE PIPELINES RAJEEV et al.
Australian Geomechanics Vol 48 No 4 December 2013 140
Step 5: The prop support at the pipeline end was released and the pipeline was transferred to the imperfect seabed surface. As this is a soft contact, the imperfection height was reduced to a certain extent. At the same time, for the design and operating conditions, the flooded submerged weight of the pipeline was replaced by the operating submerged weight and the weight of the soil/rock cover was applied on top of the pipeline.
Step 6: The springs simulating the uplift resistance of the soil cover were then activated. In effect, this implied that at this stage, the vertical displacements in the soil springs were zeroed.
Step 7: The effective driving force, the temperature increase and the pressure were applied to the pipe to obtain the vertical deformation of the pipeline (see Figure 4).
A series of FE analyses (1000 in total) was conducted using the aforementioned UHB model to consider the variability in soil, pipeline properties as well as its operating conditions.
Figure 3: Irregular seabed imperfections.
Figure 4: Schematic representation of the pipe in FE model.
3.2 BEHAVIOURAL MODEL FOR SEABED SOIL
Preliminary finite element assessments were also conducted to investigate typical load-displacement response of buried pipes in soft (i.e., clay) and hard (i.e., rock) soils. Here the soil was modelled using modified Mohr-Coulomb model which can capture the strain softening of soils during upheaval pipe displacements. Figure 5a shows a typical shear band formation induced by upward moving pipelines, obtained from FE analyses. After some parametric study, the behavioural model for pipeline upheaval responses in clay and rock were obtained as summarised in Figure 5b. Accordingly, in current study, it is assumed that the maximum resistance was achieved at 20 mm and 60 mm for a pipeline placed in clay backfill and rock respectively (as shown in Figure 5b). Moreover, it is also assumed that the peak mobilisations are not related with the initial state of the soils as was assumed in DNV RP F110. The assumed peak mobilisations are in line with the DNV RP F110 recommendations.
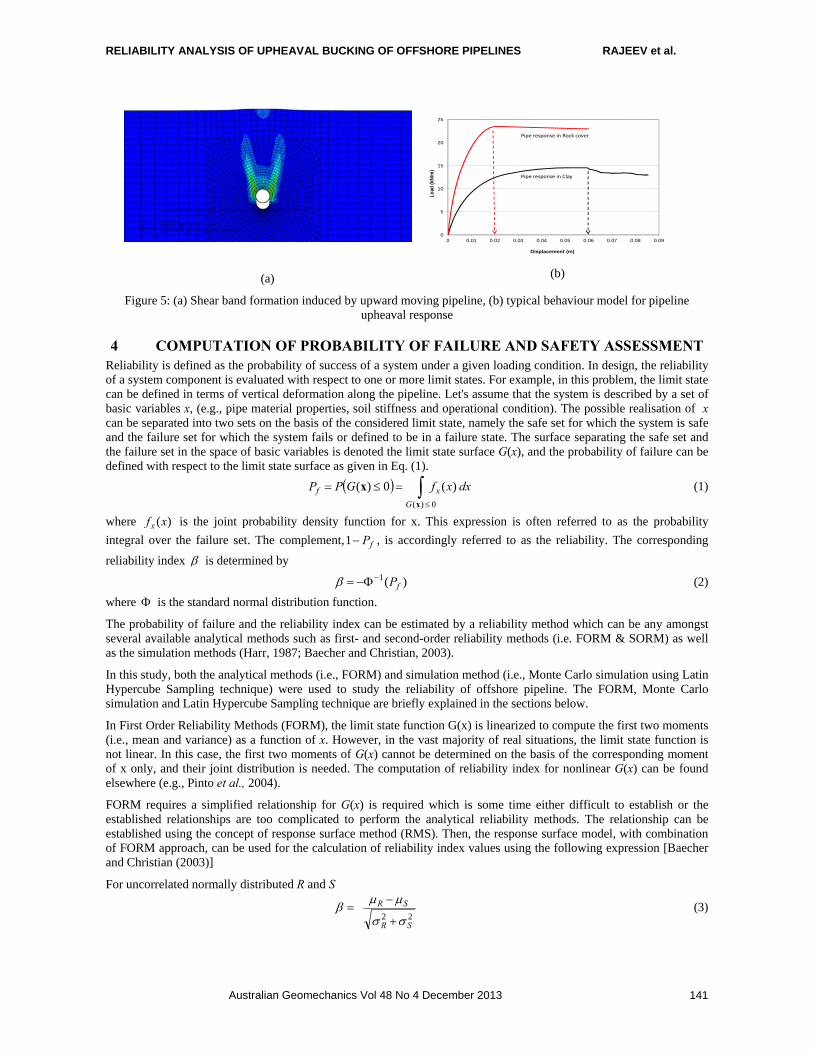
RELIABILITY ANALYSIS OF UPHEAVAL BUCKING OF OFFSHORE PIPELINES RAJEEV et al.
Australian Geomechanics Vol 48 No 4 December 2013 141
(a)
0
5
10
15
20
25
0 0.01 0.02 0.03 0.04 0.05 0.06 0.07 0.08 0.09
Load
(kN
/m)
Displacement (m)
Pipe response in Clay
Pipe response in Rock cover
(b)
Figure 5: (a) Shear band formation induced by upward moving pipeline, (b) typical behaviour model for pipeline upheaval response
4 COMPUTATION OF PROBABILITY OF FAILURE AND SAFETY ASSESSMENT Reliability is defined as the probability of success of a system under a given loading condition. In design, the reliability of a system component is evaluated with respect to one or more limit states. For example, in this problem, the limit state can be defined in terms of vertical deformation along the pipeline. Let's assume that the system is described by a set of basic variables x, (e.g., pipe material properties, soil stiffness and operational condition). The possible realisation of x can be separated into two sets on the basis of the considered limit state, namely the safe set for which the system is safe and the failure set for which the system fails or defined to be in a failure state. The surface separating the safe set and the failure set in the space of basic variables is denoted the limit state surface G(x), and the probability of failure can be defined with respect to the limit state surface as given in Eq. (1).
0 )(
)( 0)(x
xG
xf dxxfGPP (1)
where )(xfx is the joint probability density function for x. This expression is often referred to as the probability
integral over the failure set. The complement, fP1 , is accordingly referred to as the reliability. The corresponding
reliability index is determined by
)(1fP (2)
where is the standard normal distribution function.
The probability of failure and the reliability index can be estimated by a reliability method which can be any amongst several available analytical methods such as first- and second-order reliability methods (i.e. FORM & SORM) as well as the simulation methods (Harr, 1987; Baecher and Christian, 2003).
In this study, both the analytical methods (i.e., FORM) and simulation method (i.e., Monte Carlo simulation using Latin Hypercube Sampling technique) were used to study the reliability of offshore pipeline. The FORM, Monte Carlo simulation and Latin Hypercube Sampling technique are briefly explained in the sections below.
In First Order Reliability Methods (FORM), the limit state function G(x) is linearized to compute the first two moments (i.e., mean and variance) as a function of x. However, in the vast majority of real situations, the limit state function is not linear. In this case, the first two moments of G(x) cannot be determined on the basis of the corresponding moment of x only, and their joint distribution is needed. The computation of reliability index for nonlinear G(x) can be found elsewhere (e.g., Pinto et al., 2004).
FORM requires a simplified relationship for G(x) is required which is some time either difficult to establish or the established relationships are too complicated to perform the analytical reliability methods. The relationship can be established using the concept of response surface method (RMS). Then, the response surface model, with combination of FORM approach, can be used for the calculation of reliability index values using the following expression [Baecher and Christian (2003)]
For uncorrelated normally distributed R and S
22
SR
SR
(3)
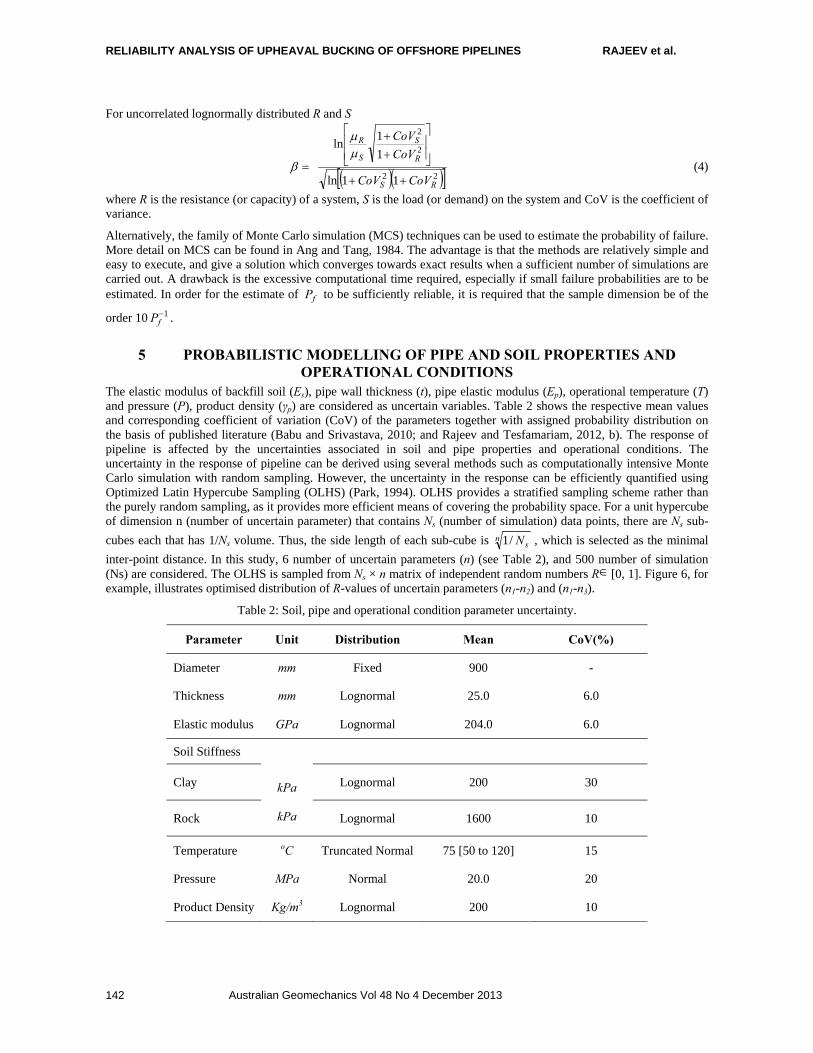
RELIABILITY ANALYSIS OF UPHEAVAL BUCKING OF OFFSHORE PIPELINES RAJEEV et al.
Australian Geomechanics Vol 48 No 4 December 2013 142
For uncorrelated lognormally distributed R and S
22
2
2
11ln
1
1ln
RS
R
S
S
R
CoVCoV
CoV
CoV
(4)
where R is the resistance (or capacity) of a system, S is the load (or demand) on the system and CoV is the coefficient of variance.
Alternatively, the family of Monte Carlo simulation (MCS) techniques can be used to estimate the probability of failure. More detail on MCS can be found in Ang and Tang, 1984. The advantage is that the methods are relatively simple and easy to execute, and give a solution which converges towards exact results when a sufficient number of simulations are carried out. A drawback is the excessive computational time required, especially if small failure probabilities are to be estimated. In order for the estimate of fP to be sufficiently reliable, it is required that the sample dimension be of the
order 10 1fP .
5 PROBABILISTIC MODELLING OF PIPE AND SOIL PROPERTIES AND OPERATIONAL CONDITIONS
The elastic modulus of backfill soil (Es), pipe wall thickness (t), pipe elastic modulus (Ep), operational temperature (T) and pressure (P), product density (γp) are considered as uncertain variables. Table 2 shows the respective mean values and corresponding coefficient of variation (CoV) of the parameters together with assigned probability distribution on the basis of published literature (Babu and Srivastava, 2010; and Rajeev and Tesfamariam, 2012, b). The response of pipeline is affected by the uncertainties associated in soil and pipe properties and operational conditions. The uncertainty in the response of pipeline can be derived using several methods such as computationally intensive Monte Carlo simulation with random sampling. However, the uncertainty in the response can be efficiently quantified using Optimized Latin Hypercube Sampling (OLHS) (Park, 1994). OLHS provides a stratified sampling scheme rather than the purely random sampling, as it provides more efficient means of covering the probability space. For a unit hypercube of dimension n (number of uncertain parameter) that contains Ns (number of simulation) data points, there are Ns sub-
cubes each that has 1/Ns volume. Thus, the side length of each sub-cube is nsN/1 , which is selected as the minimal
inter-point distance. In this study, 6 number of uncertain parameters (n) (see Table 2), and 500 number of simulation (Ns) are considered. The OLHS is sampled from Ns × n matrix of independent random numbers R[0, 1]. Figure 6, for example, illustrates optimised distribution of R-values of uncertain parameters (n1-n2) and (n1-n3).
Table 2: Soil, pipe and operational condition parameter uncertainty.
Parameter Unit Distribution Mean CoV(%)
Diameter mm Fixed 900 -
Thickness mm Lognormal 25.0 6.0
Elastic modulus GPa Lognormal 204.0 6.0
Soil Stiffness
kPa
kPa
Clay Lognormal 200 30
Rock Lognormal 1600 10
Temperature oC Truncated Normal 75 [50 to 120] 15
Pressure MPa Normal 20.0 20
Product Density Kg/m3 Lognormal 200 10
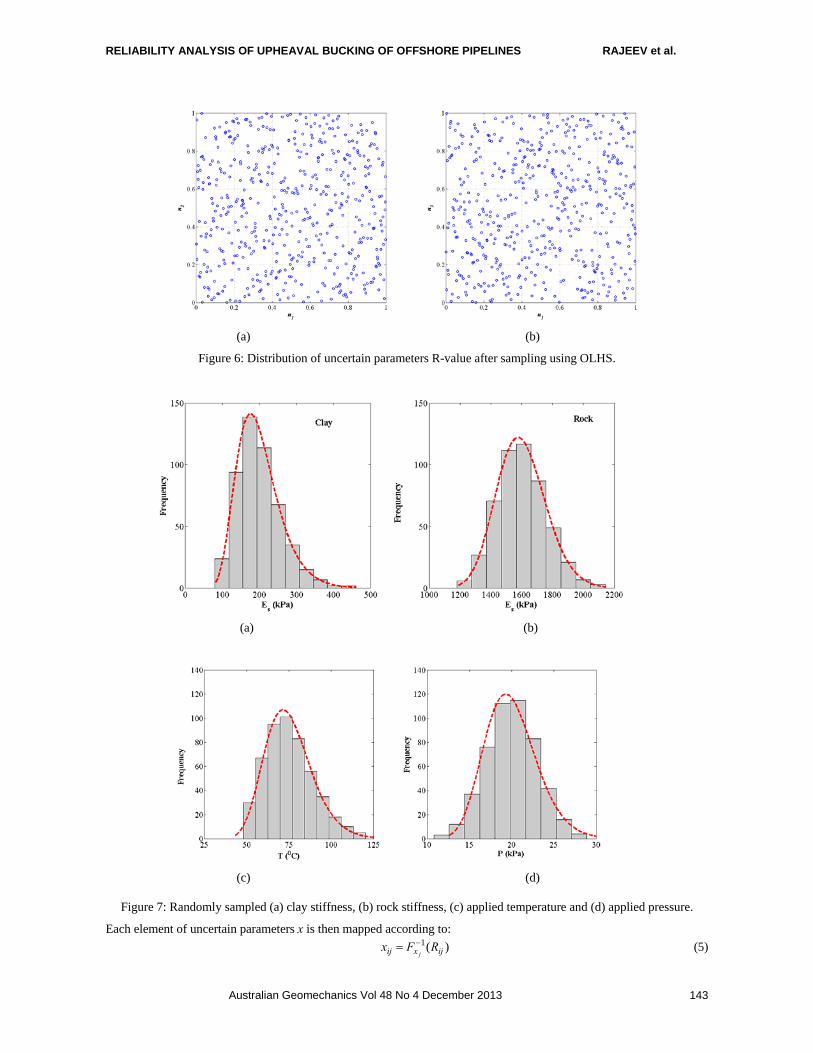
RELIABILITY ANALYSIS OF UPHEAVAL BUCKING OF OFFSHORE PIPELINES RAJEEV et al.
Australian Geomechanics Vol 48 No 4 December 2013 143
(a) (b)
Figure 6: Distribution of uncertain parameters R-value after sampling using OLHS.
(a) (b)
(c) (d)
Figure 7: Randomly sampled (a) clay stiffness, (b) rock stiffness, (c) applied temperature and (d) applied pressure.
Each element of uncertain parameters x is then mapped according to:
)(1ijxij RFx
j
(5)
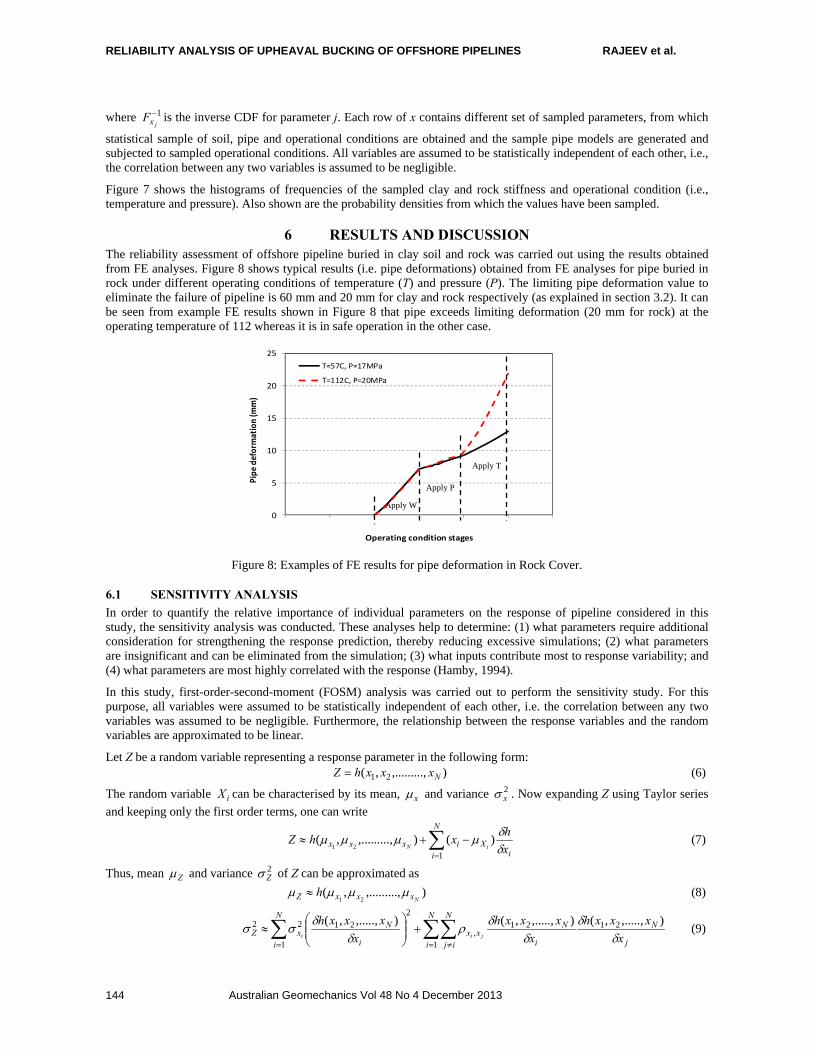
RELIABILITY ANALYSIS OF UPHEAVAL BUCKING OF OFFSHORE PIPELINES RAJEEV et al.
Australian Geomechanics Vol 48 No 4 December 2013 144
where 1jxF is the inverse CDF for parameter j. Each row of x contains different set of sampled parameters, from which
statistical sample of soil, pipe and operational conditions are obtained and the sample pipe models are generated and subjected to sampled operational conditions. All variables are assumed to be statistically independent of each other, i.e., the correlation between any two variables is assumed to be negligible.
Figure 7 shows the histograms of frequencies of the sampled clay and rock stiffness and operational condition (i.e., temperature and pressure). Also shown are the probability densities from which the values have been sampled.
6 RESULTS AND DISCUSSION The reliability assessment of offshore pipeline buried in clay soil and rock was carried out using the results obtained from FE analyses. Figure 8 shows typical results (i.e. pipe deformations) obtained from FE analyses for pipe buried in rock under different operating conditions of temperature (T) and pressure (P). The limiting pipe deformation value to eliminate the failure of pipeline is 60 mm and 20 mm for clay and rock respectively (as explained in section 3.2). It can be seen from example FE results shown in Figure 8 that pipe exceeds limiting deformation (20 mm for rock) at the operating temperature of 112 whereas it is in safe operation in the other case.
0
5
10
15
20
25
Pipe deform
ation (m
m)
Operating condition stages
T=57C, P=17MPa
T=112C, P=20MPa
Apply P
Apply T
Apply W
Figure 8: Examples of FE results for pipe deformation in Rock Cover.
6.1 SENSITIVITY ANALYSIS
In order to quantify the relative importance of individual parameters on the response of pipeline considered in this study, the sensitivity analysis was conducted. These analyses help to determine: (1) what parameters require additional consideration for strengthening the response prediction, thereby reducing excessive simulations; (2) what parameters are insignificant and can be eliminated from the simulation; (3) what inputs contribute most to response variability; and (4) what parameters are most highly correlated with the response (Hamby, 1994).
In this study, first-order-second-moment (FOSM) analysis was carried out to perform the sensitivity study. For this purpose, all variables were assumed to be statistically independent of each other, i.e. the correlation between any two variables was assumed to be negligible. Furthermore, the relationship between the response variables and the random variables are approximated to be linear.
Let Z be a random variable representing a response parameter in the following form: ),,.........,( 21 NxxxhZ (6)
The random variable iX can be characterised by its mean, x and variance 2x . Now expanding Z using Taylor series
and keeping only the first order terms, one can write
N
i iXixxx x
hxhZ
iN
1
)(),,.........,(21
(7)
Thus, mean Z and variance 2Z of Z can be approximated as
),,.........,(21 NxxxZ h (8)
N
i
N
ij j
N
i
Nxx
i
NN
ixZ x
xxxh
x
xxxh
x
xxxhjii
1
2121,
221
1
22 ),.....,,(),.....,,(),.....,,(
(9)
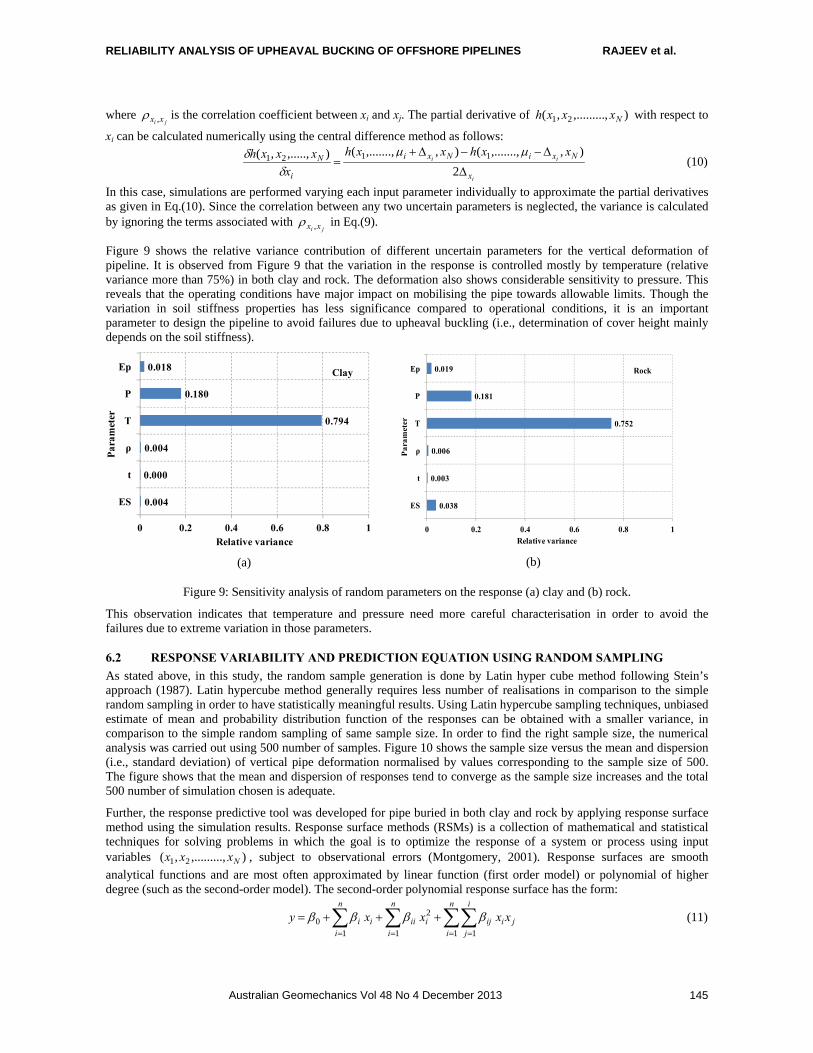
RELIABILITY ANALYSIS OF UPHEAVAL BUCKING OF OFFSHORE PIPELINES RAJEEV et al.
Australian Geomechanics Vol 48 No 4 December 2013 145
where ji xx , is the correlation coefficient between xi and xj. The partial derivative of ),,.........,( 21 Nxxxh with respect to
xi can be calculated numerically using the central difference method as follows:
i
ii
x
NxiNxi
i
Nxxhxxh
x
xxxh
2
),,.......,(),,.......,(),.....,,( 1121
(10)
In this case, simulations are performed varying each input parameter individually to approximate the partial derivatives as given in Eq.(10). Since the correlation between any two uncertain parameters is neglected, the variance is calculated by ignoring the terms associated with
ji xx , in Eq.(9).
Figure 9 shows the relative variance contribution of different uncertain parameters for the vertical deformation of pipeline. It is observed from Figure 9 that the variation in the response is controlled mostly by temperature (relative variance more than 75%) in both clay and rock. The deformation also shows considerable sensitivity to pressure. This reveals that the operating conditions have major impact on mobilising the pipe towards allowable limits. Though the variation in soil stiffness properties has less significance compared to operational conditions, it is an important parameter to design the pipeline to avoid failures due to upheaval buckling (i.e., determination of cover height mainly depends on the soil stiffness).
0.004
0.000
0.004
0.794
0.180
0.018
0 0.2 0.4 0.6 0.8 1
ES
t
ρ
T
P
Ep
Relative variance
Par
amet
er
Clay
(a)
0.038
0.003
0.006
0.752
0.181
0.019
0 0.2 0.4 0.6 0.8 1
ES
t
ρ
T
P
Ep
Relative variance
Par
am
eter
Rock
(b)
Figure 9: Sensitivity analysis of random parameters on the response (a) clay and (b) rock.
This observation indicates that temperature and pressure need more careful characterisation in order to avoid the failures due to extreme variation in those parameters.
6.2 RESPONSE VARIABILITY AND PREDICTION EQUATION USING RANDOM SAMPLING
As stated above, in this study, the random sample generation is done by Latin hyper cube method following Stein’s approach (1987). Latin hypercube method generally requires less number of realisations in comparison to the simple random sampling in order to have statistically meaningful results. Using Latin hypercube sampling techniques, unbiased estimate of mean and probability distribution function of the responses can be obtained with a smaller variance, in comparison to the simple random sampling of same sample size. In order to find the right sample size, the numerical analysis was carried out using 500 number of samples. Figure 10 shows the sample size versus the mean and dispersion (i.e., standard deviation) of vertical pipe deformation normalised by values corresponding to the sample size of 500. The figure shows that the mean and dispersion of responses tend to converge as the sample size increases and the total 500 number of simulation chosen is adequate.
Further, the response predictive tool was developed for pipe buried in both clay and rock by applying response surface method using the simulation results. Response surface methods (RSMs) is a collection of mathematical and statistical techniques for solving problems in which the goal is to optimize the response of a system or process using input variables ),,.........,( 21 Nxxx , subject to observational errors (Montgomery, 2001). Response surfaces are smooth
analytical functions and are most often approximated by linear function (first order model) or polynomial of higher degree (such as the second-order model). The second-order polynomial response surface has the form:
j
n
i
i
jiij
n
i
n
iiiiii xxxxy
1 11 1
20 (11)
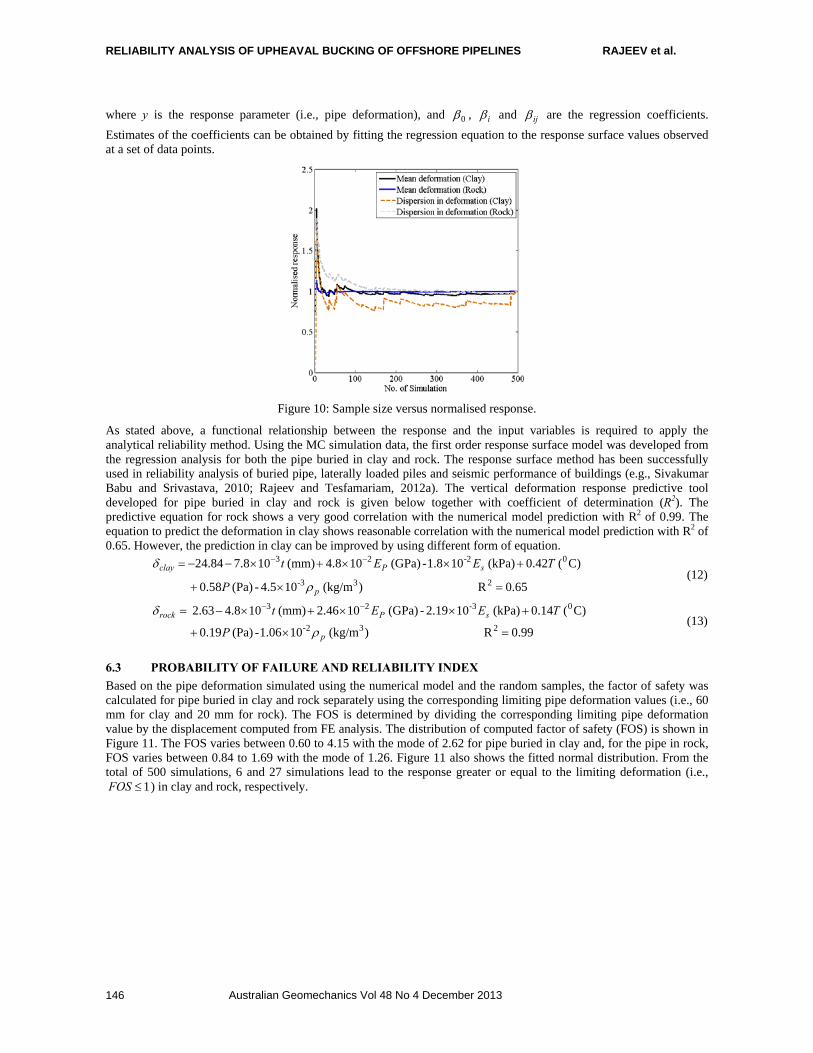
RELIABILITY ANALYSIS OF UPHEAVAL BUCKING OF OFFSHORE PIPELINES RAJEEV et al.
Australian Geomechanics Vol 48 No 4 December 2013 146
where y is the response parameter (i.e., pipe deformation), and 0 , i and ij are the regression coefficients.
Estimates of the coefficients can be obtained by fitting the regression equation to the response surface values observed at a set of data points.
Figure 10: Sample size versus normalised response.
As stated above, a functional relationship between the response and the input variables is required to apply the analytical reliability method. Using the MC simulation data, the first order response surface model was developed from the regression analysis for both the pipe buried in clay and rock. The response surface method has been successfully used in reliability analysis of buried pipe, laterally loaded piles and seismic performance of buildings (e.g., Sivakumar Babu and Srivastava, 2010; Rajeev and Tesfamariam, 2012a). The vertical deformation response predictive tool developed for pipe buried in clay and rock is given below together with coefficient of determination (R2). The predictive equation for rock shows a very good correlation with the numerical model prediction with R2 of 0.99. The equation to predict the deformation in clay shows reasonable correlation with the numerical model prediction with R2 of 0.65. However, the prediction in clay can be improved by using different form of equation.
65.0R )(kg/m 104.5-(Pa) 58.0
C)( 42.0(kPa) 101.8-(GPa) 108.4(mm) 108.784.24
233-
0-223
p
sPclay
P
TEEt
(12)
99.0R )(kg/m 101.06-(Pa) 19.0
C)( 14.0(kPa) 102.19-(GPa) 1046.2(mm) 108.463.2 232-
0-323
p
sProck
P
TEEt
(13)
6.3 PROBABILITY OF FAILURE AND RELIABILITY INDEX
Based on the pipe deformation simulated using the numerical model and the random samples, the factor of safety was calculated for pipe buried in clay and rock separately using the corresponding limiting pipe deformation values (i.e., 60 mm for clay and 20 mm for rock). The FOS is determined by dividing the corresponding limiting pipe deformation value by the displacement computed from FE analysis. The distribution of computed factor of safety (FOS) is shown in Figure 11. The FOS varies between 0.60 to 4.15 with the mode of 2.62 for pipe buried in clay and, for the pipe in rock, FOS varies between 0.84 to 1.69 with the mode of 1.26. Figure 11 also shows the fitted normal distribution. From the total of 500 simulations, 6 and 27 simulations lead to the response greater or equal to the limiting deformation (i.e.,
1FOS ) in clay and rock, respectively.
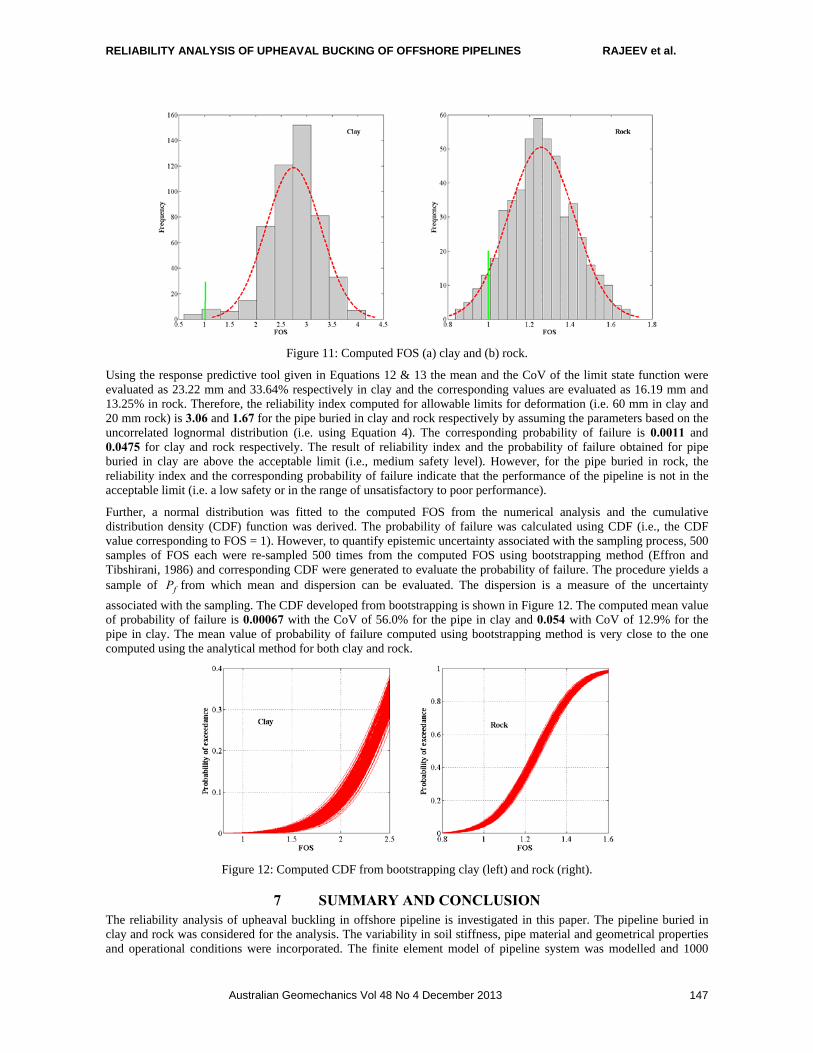
RELIABILITY ANALYSIS OF UPHEAVAL BUCKING OF OFFSHORE PIPELINES RAJEEV et al.
Australian Geomechanics Vol 48 No 4 December 2013 147
Figure 11: Computed FOS (a) clay and (b) rock.
Using the response predictive tool given in Equations 12 & 13 the mean and the CoV of the limit state function were evaluated as 23.22 mm and 33.64% respectively in clay and the corresponding values are evaluated as 16.19 mm and 13.25% in rock. Therefore, the reliability index computed for allowable limits for deformation (i.e. 60 mm in clay and 20 mm rock) is 3.06 and 1.67 for the pipe buried in clay and rock respectively by assuming the parameters based on the uncorrelated lognormal distribution (i.e. using Equation 4). The corresponding probability of failure is 0.0011 and 0.0475 for clay and rock respectively. The result of reliability index and the probability of failure obtained for pipe buried in clay are above the acceptable limit (i.e., medium safety level). However, for the pipe buried in rock, the reliability index and the corresponding probability of failure indicate that the performance of the pipeline is not in the acceptable limit (i.e. a low safety or in the range of unsatisfactory to poor performance).
Further, a normal distribution was fitted to the computed FOS from the numerical analysis and the cumulative distribution density (CDF) function was derived. The probability of failure was calculated using CDF (i.e., the CDF value corresponding to FOS = 1). However, to quantify epistemic uncertainty associated with the sampling process, 500 samples of FOS each were re-sampled 500 times from the computed FOS using bootstrapping method (Effron and Tibshirani, 1986) and corresponding CDF were generated to evaluate the probability of failure. The procedure yields a sample of fP from which mean and dispersion can be evaluated. The dispersion is a measure of the uncertainty
associated with the sampling. The CDF developed from bootstrapping is shown in Figure 12. The computed mean value of probability of failure is 0.00067 with the CoV of 56.0% for the pipe in clay and 0.054 with CoV of 12.9% for the pipe in clay. The mean value of probability of failure computed using bootstrapping method is very close to the one computed using the analytical method for both clay and rock.
Figure 12: Computed CDF from bootstrapping clay (left) and rock (right).
7 SUMMARY AND CONCLUSION The reliability analysis of upheaval buckling in offshore pipeline is investigated in this paper. The pipeline buried in clay and rock was considered for the analysis. The variability in soil stiffness, pipe material and geometrical properties and operational conditions were incorporated. The finite element model of pipeline system was modelled and 1000
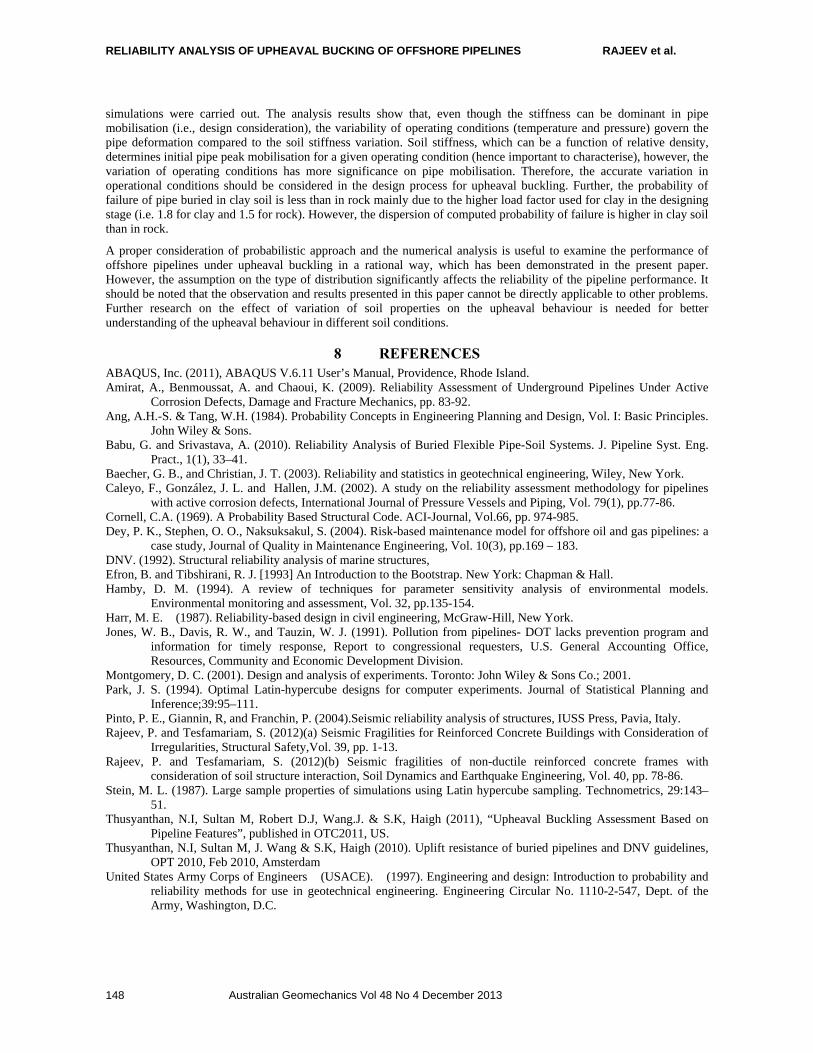
RELIABILITY ANALYSIS OF UPHEAVAL BUCKING OF OFFSHORE PIPELINES RAJEEV et al.
Australian Geomechanics Vol 48 No 4 December 2013 148
simulations were carried out. The analysis results show that, even though the stiffness can be dominant in pipe mobilisation (i.e., design consideration), the variability of operating conditions (temperature and pressure) govern the pipe deformation compared to the soil stiffness variation. Soil stiffness, which can be a function of relative density, determines initial pipe peak mobilisation for a given operating condition (hence important to characterise), however, the variation of operating conditions has more significance on pipe mobilisation. Therefore, the accurate variation in operational conditions should be considered in the design process for upheaval buckling. Further, the probability of failure of pipe buried in clay soil is less than in rock mainly due to the higher load factor used for clay in the designing stage (i.e. 1.8 for clay and 1.5 for rock). However, the dispersion of computed probability of failure is higher in clay soil than in rock.
A proper consideration of probabilistic approach and the numerical analysis is useful to examine the performance of offshore pipelines under upheaval buckling in a rational way, which has been demonstrated in the present paper. However, the assumption on the type of distribution significantly affects the reliability of the pipeline performance. It should be noted that the observation and results presented in this paper cannot be directly applicable to other problems. Further research on the effect of variation of soil properties on the upheaval behaviour is needed for better understanding of the upheaval behaviour in different soil conditions.
8 REFERENCES ABAQUS, Inc. (2011), ABAQUS V.6.11 User’s Manual, Providence, Rhode Island. Amirat, A., Benmoussat, A. and Chaoui, K. (2009). Reliability Assessment of Underground Pipelines Under Active
Corrosion Defects, Damage and Fracture Mechanics, pp. 83-92. Ang, A.H.-S. & Tang, W.H. (1984). Probability Concepts in Engineering Planning and Design, Vol. I: Basic Principles.
John Wiley & Sons. Babu, G. and Srivastava, A. (2010). Reliability Analysis of Buried Flexible Pipe-Soil Systems. J. Pipeline Syst. Eng.
Pract., 1(1), 33–41. Baecher, G. B., and Christian, J. T. (2003). Reliability and statistics in geotechnical engineering, Wiley, New York. Caleyo, F., González, J. L. and Hallen, J.M. (2002). A study on the reliability assessment methodology for pipelines
with active corrosion defects, International Journal of Pressure Vessels and Piping, Vol. 79(1), pp.77-86. Cornell, C.A. (1969). A Probability Based Structural Code. ACI-Journal, Vol.66, pp. 974-985. Dey, P. K., Stephen, O. O., Naksuksakul, S. (2004). Risk-based maintenance model for offshore oil and gas pipelines: a
case study, Journal of Quality in Maintenance Engineering, Vol. 10(3), pp.169 – 183. DNV. (1992). Structural reliability analysis of marine structures, Efron, B. and Tibshirani, R. J. [1993] An Introduction to the Bootstrap. New York: Chapman & Hall. Hamby, D. M. (1994). A review of techniques for parameter sensitivity analysis of environmental models.
Environmental monitoring and assessment, Vol. 32, pp.135-154. �Harr, M. E. (1987). Reliability-based design in civil engineering, McGraw-Hill, New York.
Jones, W. B., Davis, R. W., and Tauzin, W. J. (1991). Pollution from pipelines- DOT lacks prevention program and information for timely response, Report to congressional requesters, U.S. General Accounting Office, Resources, Community and Economic Development Division.
Montgomery, D. C. (2001). Design and analysis of experiments. Toronto: John Wiley & Sons Co.; 2001. Park, J. S. (1994). Optimal Latin-hypercube designs for computer experiments. Journal of Statistical Planning and
Inference;39:95–111. Pinto, P. E., Giannin, R, and Franchin, P. (2004).Seismic reliability analysis of structures, IUSS Press, Pavia, Italy. Rajeev, P. and Tesfamariam, S. (2012)(a) Seismic Fragilities for Reinforced Concrete Buildings with Consideration of
Irregularities, Structural Safety,Vol. 39, pp. 1-13. Rajeev, P. and Tesfamariam, S. (2012)(b) Seismic fragilities of non-ductile reinforced concrete frames with
consideration of soil structure interaction, Soil Dynamics and Earthquake Engineering, Vol. 40, pp. 78-86. Stein, M. L. (1987). Large sample properties of simulations using Latin hypercube sampling. Technometrics, 29:143–
51. Thusyanthan, N.I, Sultan M, Robert D.J, Wang.J. & S.K, Haigh (2011), “Upheaval Buckling Assessment Based on
Pipeline Features”, published in OTC2011, US. Thusyanthan, N.I, Sultan M, J. Wang & S.K, Haigh (2010). Uplift resistance of buried pipelines and DNV guidelines,
OPT 2010, Feb 2010, Amsterdam � �United States Army Corps of Engineers (USACE). (1997). Engineering and design: Introduction to probability and
reliability methods for use in geotechnical engineering. Engineering Circular No. 1110-2-547, Dept. of the Army, Washington, D.C.
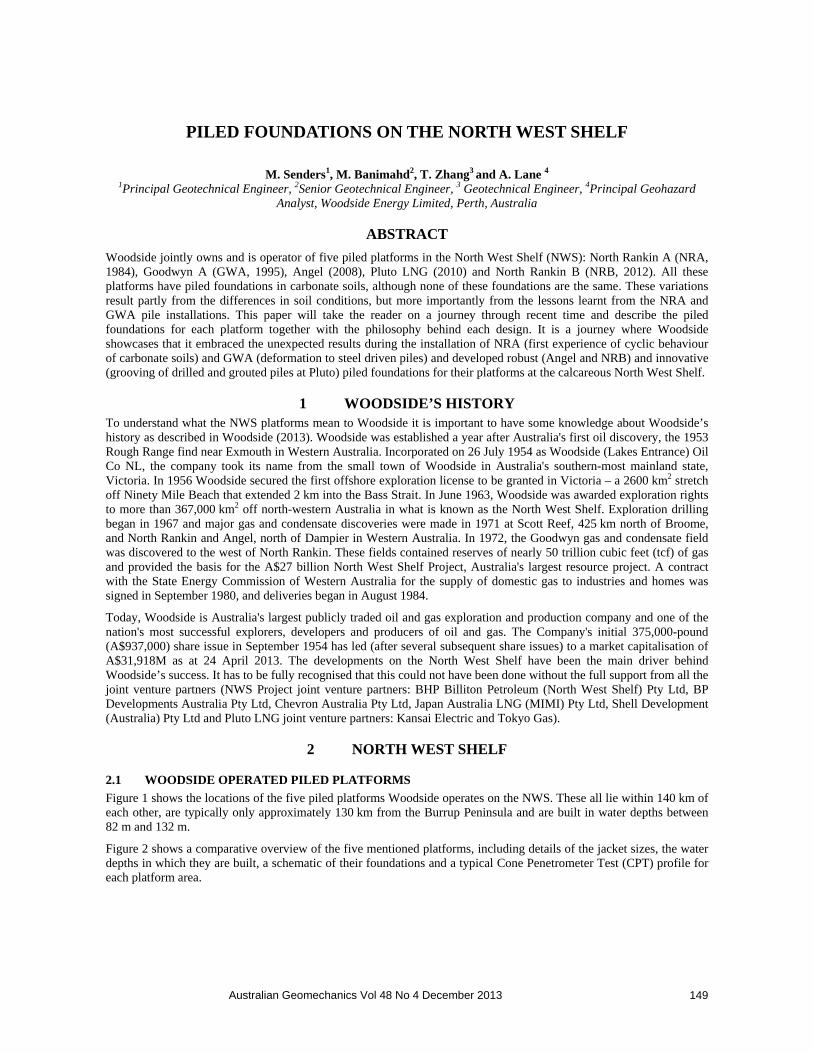
Australian Geomechanics Vol 48 No 4 December 2013 149
PILED FOUNDATIONS ON THE NORTH WEST SHELF
M. Senders1, M. Banimahd2, T. Zhang3 and A. Lane 4
1Principal Geotechnical Engineer, 2Senior Geotechnical Engineer, 3 Geotechnical Engineer, 4Principal Geohazard Analyst, Woodside Energy Limited, Perth, Australia
ABSTRACT
Woodside jointly owns and is operator of five piled platforms in the North West Shelf (NWS): North Rankin A (NRA, 1984), Goodwyn A (GWA, 1995), Angel (2008), Pluto LNG (2010) and North Rankin B (NRB, 2012). All these platforms have piled foundations in carbonate soils, although none of these foundations are the same. These variations result partly from the differences in soil conditions, but more importantly from the lessons learnt from the NRA and GWA pile installations. This paper will take the reader on a journey through recent time and describe the piled foundations for each platform together with the philosophy behind each design. It is a journey where Woodside showcases that it embraced the unexpected results during the installation of NRA (first experience of cyclic behaviour of carbonate soils) and GWA (deformation to steel driven piles) and developed robust (Angel and NRB) and innovative (grooving of drilled and grouted piles at Pluto) piled foundations for their platforms at the calcareous North West Shelf.
1 WOODSIDE’S HISTORY To understand what the NWS platforms mean to Woodside it is important to have some knowledge about Woodside’s history as described in Woodside (2013). Woodside was established a year after Australia's first oil discovery, the 1953 Rough Range find near Exmouth in Western Australia. Incorporated on 26 July 1954 as Woodside (Lakes Entrance) Oil Co NL, the company took its name from the small town of Woodside in Australia's southern-most mainland state, Victoria. In 1956 Woodside secured the first offshore exploration license to be granted in Victoria – a 2600 km2 stretch off Ninety Mile Beach that extended 2 km into the Bass Strait. In June 1963, Woodside was awarded exploration rights to more than 367,000 km2 off north-western Australia in what is known as the North West Shelf. Exploration drilling began in 1967 and major gas and condensate discoveries were made in 1971 at Scott Reef, 425 km north of Broome, and North Rankin and Angel, north of Dampier in Western Australia. In 1972, the Goodwyn gas and condensate field was discovered to the west of North Rankin. These fields contained reserves of nearly 50 trillion cubic feet (tcf) of gas and provided the basis for the A$27 billion North West Shelf Project, Australia's largest resource project. A contract with the State Energy Commission of Western Australia for the supply of domestic gas to industries and homes was signed in September 1980, and deliveries began in August 1984.
Today, Woodside is Australia's largest publicly traded oil and gas exploration and production company and one of the nation's most successful explorers, developers and producers of oil and gas. The Company's initial 375,000-pound (A$937,000) share issue in September 1954 has led (after several subsequent share issues) to a market capitalisation of A$31,918M as at 24 April 2013. The developments on the North West Shelf have been the main driver behind Woodside’s success. It has to be fully recognised that this could not have been done without the full support from all the joint venture partners (NWS Project joint venture partners: BHP Billiton Petroleum (North West Shelf) Pty Ltd, BP Developments Australia Pty Ltd, Chevron Australia Pty Ltd, Japan Australia LNG (MIMI) Pty Ltd, Shell Development (Australia) Pty Ltd and Pluto LNG joint venture partners: Kansai Electric and Tokyo Gas).
2 NORTH WEST SHELF
2.1 WOODSIDE OPERATED PILED PLATFORMS
Figure 1 shows the locations of the five piled platforms Woodside operates on the NWS. These all lie within 140 km of each other, are typically only approximately 130 km from the Burrup Peninsula and are built in water depths between 82 m and 132 m.
Figure 2 shows a comparative overview of the five mentioned platforms, including details of the jacket sizes, the water depths in which they are built, a schematic of their foundations and a typical Cone Penetrometer Test (CPT) profile for each platform area.

PILED FOUNDATIONS ON THE NORTH WEST SHELF SENDERS et al.
Australian Geomechanics Vol 48 No 4 December 2013 150
Figure 1: Overview of Woodside operated assets on the NWS.
Figure 2: Overview of Woodside’s operated piled foundations on the NWS including typical CPT profiles.
2.2 NORTH WEST SHELF GEOLOGY
The regional geology of the NWS is dominated by several hundreds of metres of carbonate sedimentation since the Australia – Antarctica final breakup at the start of the Tertiary Period (approximately 65 million years ago). The shallowest material belongs to the Delambre Formation which varies from a few tens of metres thickness near the coast

PILED FOUNDATIONS ON THE NORTH WEST SHELF SENDERS et al.
Australian Geomechanics Vol 48 No 4 December 2013 151
to 1700 m at the edge of the Continental Shelf. The Delambre includes Late Miocene/Early Pliocene to Recent sediments (approximately 5 million years to the present). The Delambre Formation is characterised by poorly sorted carbonates, in which the carbonate bioclastic fragments, often of large size, are enclosed in a matrix of silt to mud sized carbonate. They typically have low silica content, however fine grained quartz sands and possible distal turbidites are locally present. Lithology varies from deep water calcilutites and calcisiltites to shallow water calcarenite.
The carbonate material forming these sediments was extracted from the dissolved load of the sea mainly in the form of organic skeletons (biotic) with chemical (abiotic) precipitation providing a supporting role. Production is intimately tied to the ocean environment with light, temperature and nutrients exerting dominant controls on sedimentation rate. The photo-autotrophic organisms of the photic environment are most productive in biotic carbonate production, resulting in shallow water dominance of the carbonate factory (Apthorpe 1988 and Apthorpe et al., 1988).
The sediments of the NWS show the impact of water depth variations in lithology (grain size) by vertical grain size layering and lateral grain size variations. Over the last million years the sea level has varied between near to present levels to approximately 120 m lower than today.
These eustatic variations, controlled by the glacial cycles, have repeated on an approximate 125,000 year interval. These cycles provide opportunity for reworking of previous cycles to produce superimposition (Palympsest) of features with subsequent cycles disguising, masking and reworking.
Three typical cementation processes can be distinguished (Schlager, 2002):
1) Beach rock cementation: a very rapid cementation process near the beach where carbonate cement precipitates from fresh water.
2) Early diagenesis: a relatively slow cementation process which can occur in any water depth, where carbonate cement is precipitated in the pore space from sea water during the early stages of diagenesis when the deposit is still in the depositional environment.
3) Burial cementation: an extremely slow cementation process from mainly remobilized sedimentary material, which is independent of water depth, where carbonate cement is precipitated from pore fluid.
It can be concluded that the influence of water depth is therefore extremely important, since the fastest (i.e. most material) cementation process takes place around the beach zones.
Figures 1 and 2 show the relationship of the five NWS piled structures to the current water depth. Angel and Pluto are in approximately 80 m water depth and therefore the upper layers at Pluto and Angel have experienced shelf, nearshore, beach and aeolian conditions. The shallow water carbonate sedimentation and exposure above sea level to fresh water has resulted in production of calcarenite. The NRA, NRB and GWA platforms lie offshore in the 120 – 130 m water depth and so for the Late Pleistocene the top 113 m experienced shelf and nearshore environments, without exposure above sea level. This is evident in the shelfal carbonate sands and muds with local nearshore coarser and weakly cemented bands present in available cores. The calcarenites providing the main foundations from 113 m onwards at NRA, NRB and GWA are believed to be older, deposited in the Early Pleistocene. Based on the facts that Pleistocene Australian margin subsidence has provided downwarping of more than 100 m, the layer consists of relative coarse grainsize (e.g. not a deep water deposition) and the calcarenites have a (irregular) cementation signature as expected from a beach rock cementation process, it is believed that these deep calcarenites represent nearshore material which most probably experienced exposure above sea level.
2.3 CARBONATE SOILS
As described in Section 3.2 the NWS soils are classified “carbonate” (Clark and Walker, 1977). To the untrained (naked) eye the silica soils in the North Sea or Gulf of Mexico (GoM) (Figure 3a) look very similar, albeit darker in colour, to the carbonate soils of the NWS (Figure 3d). However, under the microscope it can be seen than that silica soil grains are solid (Figure 3b) whilst the carbonate soil grains consist of shells and skeletons which are typically hollow (Figure 3e). When an external force is applied to these soils they will therefore behave differently: under typical shear stress regimes below offshore structures, the silica soils stay, to a large extent intact (Figure 3c), whereas the hollow carbonate soil particles will crush and “collapse” (Figure 3f) (Randolph, 2012).

PILED FOUNDATIONS ON THE NORTH WEST SHELF SENDERS et al.
Australian Geomechanics Vol 48 No 4 December 2013 152
a. Naked eye b. Under microscope c. Post shearing Silica soil
d. Naked eye e. Under microscope f. Post shearing Carbonate soil
Figure 3: Silica soil versus Carbonate soil.
2.4 CPT PROFILES
Figure 2 includes typical cone resistance profiles at Woodside operated NWS platform locations (typically displayed to the right of each platform). The NRA and NRB platforms are 100 m apart and therefore only one profile has been displayed. It can be seen that, at every location, the soil profile include layers of (very) low cone resistances, which are representative of carbonate silt layers, and high cone resistance, which are representative of the calcarenite layers. At Angel and Pluto the (young) calcarenites are at or near the seafloor and overlie weaker material, whereas at NRA, NRB and GWA the (old) calcarenites are buried below the same weaker material. As described in Section 3.2, the cementation process, which often is the only difference between these layers, is governed by the soil being exposed to fresh water. This is determined by the sea level, which has varied by more than 120 m during the last 2 million years of deposition, covering the upper 100 m of soil and has only been relatively constant at the current waterlevel for the last 10,000 years. Since soils at similar relative depths were exposed at the same moment in time it is not surprising that the respective cone resistances are similar.
2.5 LOADING CONDITIONS
It is important to recognise that tropical cyclones occur frequently on the NWS. Design conditions for these piled platforms therefore include cyclonic storm conditions with a certain return period and a certain wave ‘signature’. In addition to 100 year return period (RP) (cyclonic) loading conditions (which represent the extreme loading conditions), these platforms are nowadays checked for 10,000 year RP (cyclonic) loading conditions (which represent the abnormal loading conditions). Within the LRFD (load and resistance factor design) framework, the load and resistance factors vary for these two cases, and are determined based on the target reliability of the structures. It is relevant to note that, since the character of these NWS storms and waves are different to those in the GoM and the North Sea, the load factors are also different. Interestingly, the material factors have always been kept the same, despite the fact that the knowledge of the behaviour of calcareous soil has (and still is) lagging behind that for silica soils.
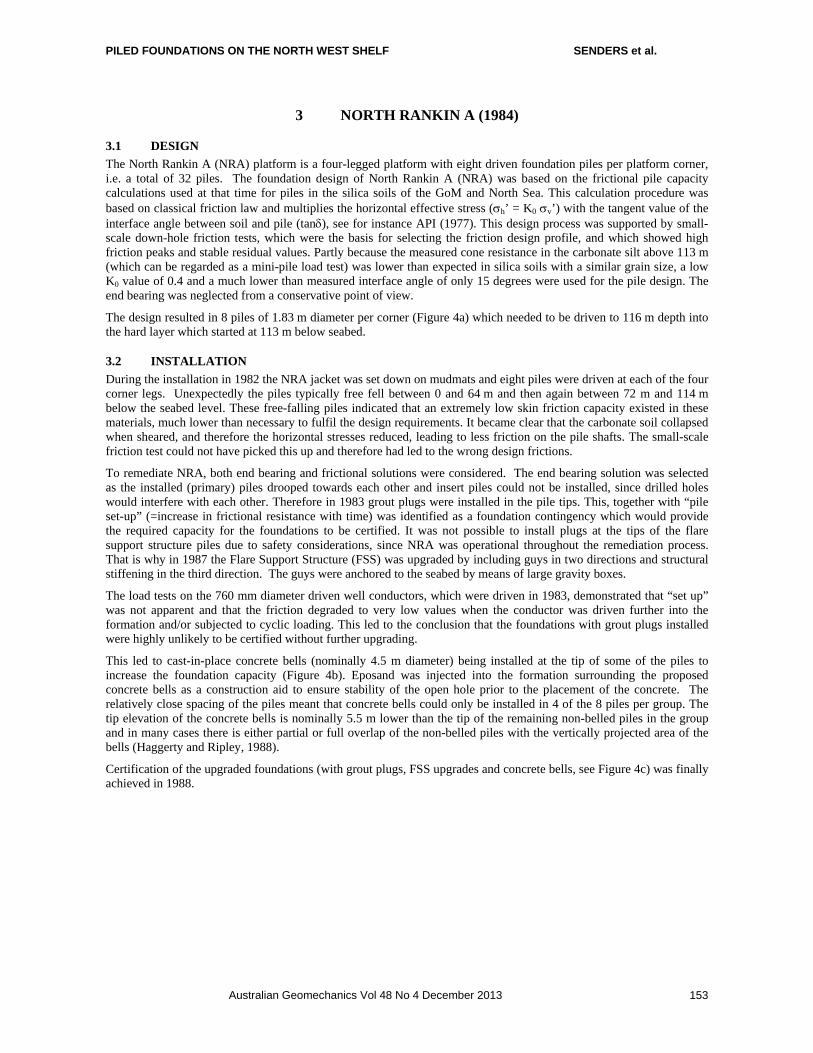
PILED FOUNDATIONS ON THE NORTH WEST SHELF SENDERS et al.
Australian Geomechanics Vol 48 No 4 December 2013 153
3 NORTH RANKIN A (1984)
3.1 DESIGN
The North Rankin A (NRA) platform is a four-legged platform with eight driven foundation piles per platform corner, i.e. a total of 32 piles. The foundation design of North Rankin A (NRA) was based on the frictional pile capacity calculations used at that time for piles in the silica soils of the GoM and North Sea. This calculation procedure was based on classical friction law and multiplies the horizontal effective stress (h’ = K0 v’) with the tangent value of the interface angle between soil and pile (tan), see for instance API (1977). This design process was supported by small-scale down-hole friction tests, which were the basis for selecting the friction design profile, and which showed high friction peaks and stable residual values. Partly because the measured cone resistance in the carbonate silt above 113 m (which can be regarded as a mini-pile load test) was lower than expected in silica soils with a similar grain size, a low K0 value of 0.4 and a much lower than measured interface angle of only 15 degrees were used for the pile design. The end bearing was neglected from a conservative point of view.
The design resulted in 8 piles of 1.83 m diameter per corner (Figure 4a) which needed to be driven to 116 m depth into the hard layer which started at 113 m below seabed.
3.2 INSTALLATION
During the installation in 1982 the NRA jacket was set down on mudmats and eight piles were driven at each of the four corner legs. Unexpectedly the piles typically free fell between 0 and 64 m and then again between 72 m and 114 m below the seabed level. These free-falling piles indicated that an extremely low skin friction capacity existed in these materials, much lower than necessary to fulfil the design requirements. It became clear that the carbonate soil collapsed when sheared, and therefore the horizontal stresses reduced, leading to less friction on the pile shafts. The small-scale friction test could not have picked this up and therefore had led to the wrong design frictions.
To remediate NRA, both end bearing and frictional solutions were considered. The end bearing solution was selected as the installed (primary) piles drooped towards each other and insert piles could not be installed, since drilled holes would interfere with each other. Therefore in 1983 grout plugs were installed in the pile tips. This, together with “pile set-up” (=increase in frictional resistance with time) was identified as a foundation contingency which would provide the required capacity for the foundations to be certified. It was not possible to install plugs at the tips of the flare support structure piles due to safety considerations, since NRA was operational throughout the remediation process. That is why in 1987 the Flare Support Structure (FSS) was upgraded by including guys in two directions and structural stiffening in the third direction. The guys were anchored to the seabed by means of large gravity boxes.
The load tests on the 760 mm diameter driven well conductors, which were driven in 1983, demonstrated that “set up” was not apparent and that the friction degraded to very low values when the conductor was driven further into the formation and/or subjected to cyclic loading. This led to the conclusion that the foundations with grout plugs installed were highly unlikely to be certified without further upgrading.
This led to cast-in-place concrete bells (nominally 4.5 m diameter) being installed at the tip of some of the piles to increase the foundation capacity (Figure 4b). Eposand was injected into the formation surrounding the proposed concrete bells as a construction aid to ensure stability of the open hole prior to the placement of the concrete. The relatively close spacing of the piles meant that concrete bells could only be installed in 4 of the 8 piles per group. The tip elevation of the concrete bells is nominally 5.5 m lower than the tip of the remaining non-belled piles in the group and in many cases there is either partial or full overlap of the non-belled piles with the vertically projected area of the bells (Haggerty and Ripley, 1988).
Certification of the upgraded foundations (with grout plugs, FSS upgrades and concrete bells, see Figure 4c) was finally achieved in 1988.
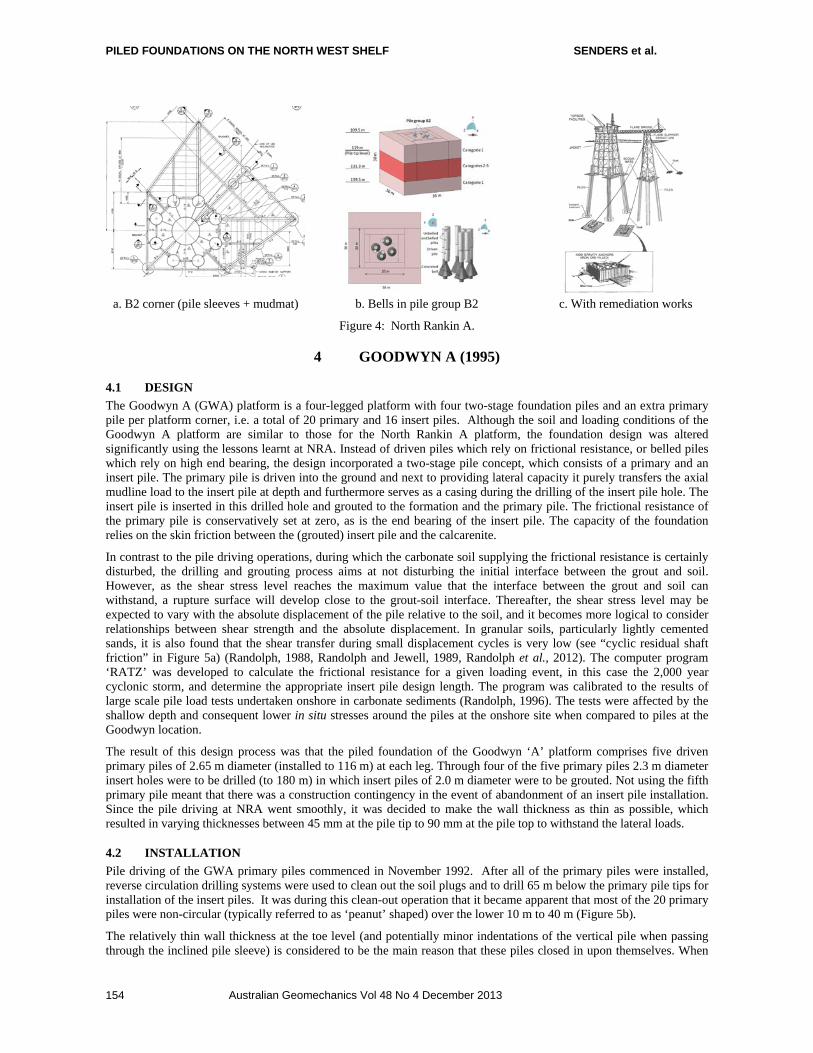
PILED FOUNDATIONS ON THE NORTH WEST SHELF SENDERS et al.
Australian Geomechanics Vol 48 No 4 December 2013 154
a. B2 corner (pile sleeves + mudmat) b. Bells in pile group B2 c. With remediation works
Figure 4: North Rankin A.
4 GOODWYN A (1995)
4.1 DESIGN
The Goodwyn A (GWA) platform is a four-legged platform with four two-stage foundation piles and an extra primary pile per platform corner, i.e. a total of 20 primary and 16 insert piles. Although the soil and loading conditions of the Goodwyn A platform are similar to those for the North Rankin A platform, the foundation design was altered significantly using the lessons learnt at NRA. Instead of driven piles which rely on frictional resistance, or belled piles which rely on high end bearing, the design incorporated a two-stage pile concept, which consists of a primary and an insert pile. The primary pile is driven into the ground and next to providing lateral capacity it purely transfers the axial mudline load to the insert pile at depth and furthermore serves as a casing during the drilling of the insert pile hole. The insert pile is inserted in this drilled hole and grouted to the formation and the primary pile. The frictional resistance of the primary pile is conservatively set at zero, as is the end bearing of the insert pile. The capacity of the foundation relies on the skin friction between the (grouted) insert pile and the calcarenite.
In contrast to the pile driving operations, during which the carbonate soil supplying the frictional resistance is certainly disturbed, the drilling and grouting process aims at not disturbing the initial interface between the grout and soil. However, as the shear stress level reaches the maximum value that the interface between the grout and soil can withstand, a rupture surface will develop close to the grout-soil interface. Thereafter, the shear stress level may be expected to vary with the absolute displacement of the pile relative to the soil, and it becomes more logical to consider relationships between shear strength and the absolute displacement. In granular soils, particularly lightly cemented sands, it is also found that the shear transfer during small displacement cycles is very low (see “cyclic residual shaft friction” in Figure 5a) (Randolph, 1988, Randolph and Jewell, 1989, Randolph et al., 2012). The computer program ‘RATZ’ was developed to calculate the frictional resistance for a given loading event, in this case the 2,000 year cyclonic storm, and determine the appropriate insert pile design length. The program was calibrated to the results of large scale pile load tests undertaken onshore in carbonate sediments (Randolph, 1996). The tests were affected by the shallow depth and consequent lower in situ stresses around the piles at the onshore site when compared to piles at the Goodwyn location.
The result of this design process was that the piled foundation of the Goodwyn ‘A’ platform comprises five driven primary piles of 2.65 m diameter (installed to 116 m) at each leg. Through four of the five primary piles 2.3 m diameter insert holes were to be drilled (to 180 m) in which insert piles of 2.0 m diameter were to be grouted. Not using the fifth primary pile meant that there was a construction contingency in the event of abandonment of an insert pile installation. Since the pile driving at NRA went smoothly, it was decided to make the wall thickness as thin as possible, which resulted in varying thicknesses between 45 mm at the pile tip to 90 mm at the pile top to withstand the lateral loads.
4.2 INSTALLATION
Pile driving of the GWA primary piles commenced in November 1992. After all of the primary piles were installed, reverse circulation drilling systems were used to clean out the soil plugs and to drill 65 m below the primary pile tips for installation of the insert piles. It was during this clean-out operation that it became apparent that most of the 20 primary piles were non-circular (typically referred to as ‘peanut’ shaped) over the lower 10 m to 40 m (Figure 5b).
The relatively thin wall thickness at the toe level (and potentially minor indentations of the vertical pile when passing through the inclined pile sleeve) is considered to be the main reason that these piles closed in upon themselves. When
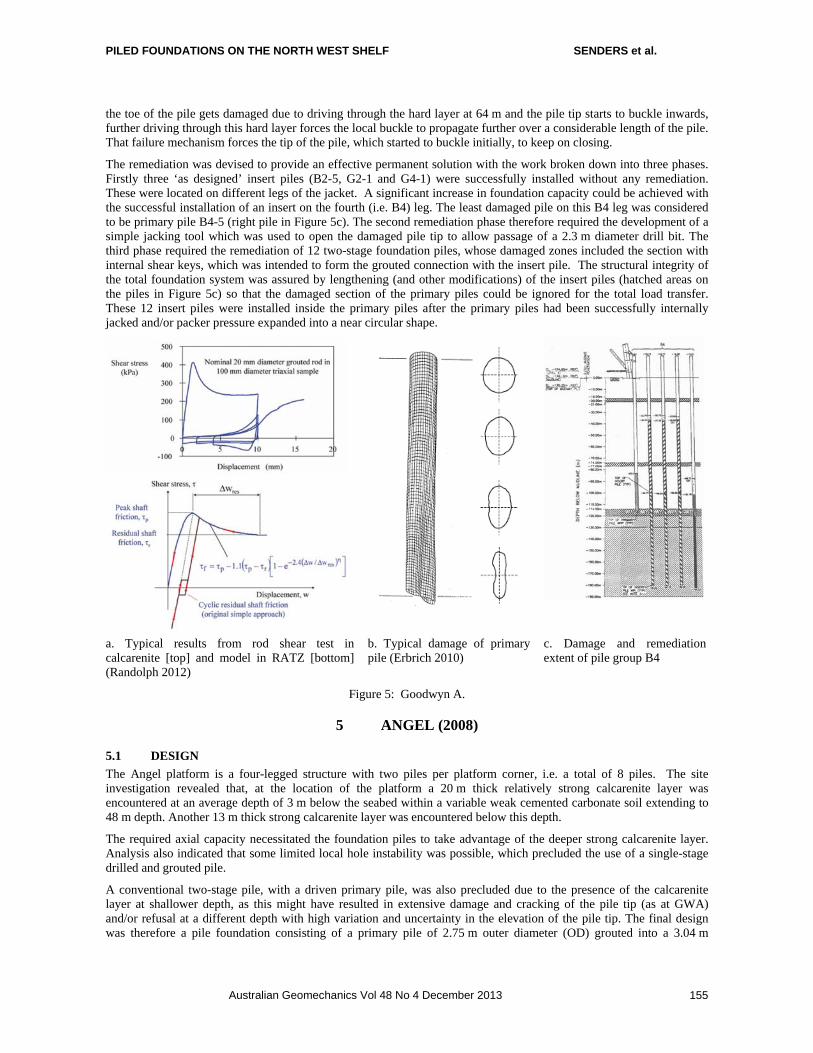
PILED FOUNDATIONS ON THE NORTH WEST SHELF SENDERS et al.
Australian Geomechanics Vol 48 No 4 December 2013 155
the toe of the pile gets damaged due to driving through the hard layer at 64 m and the pile tip starts to buckle inwards, further driving through this hard layer forces the local buckle to propagate further over a considerable length of the pile. That failure mechanism forces the tip of the pile, which started to buckle initially, to keep on closing.
The remediation was devised to provide an effective permanent solution with the work broken down into three phases. Firstly three ‘as designed’ insert piles (B2-5, G2-1 and G4-1) were successfully installed without any remediation. These were located on different legs of the jacket. A significant increase in foundation capacity could be achieved with the successful installation of an insert on the fourth (i.e. B4) leg. The least damaged pile on this B4 leg was considered to be primary pile B4-5 (right pile in Figure 5c). The second remediation phase therefore required the development of a simple jacking tool which was used to open the damaged pile tip to allow passage of a 2.3 m diameter drill bit. The third phase required the remediation of 12 two-stage foundation piles, whose damaged zones included the section with internal shear keys, which was intended to form the grouted connection with the insert pile. The structural integrity of the total foundation system was assured by lengthening (and other modifications) of the insert piles (hatched areas on the piles in Figure 5c) so that the damaged section of the primary piles could be ignored for the total load transfer. These 12 insert piles were installed inside the primary piles after the primary piles had been successfully internally jacked and/or packer pressure expanded into a near circular shape.
a. Typical results from rod shear test in calcarenite [top] and model in RATZ [bottom] (Randolph 2012)
b. Typical damage of primary pile (Erbrich 2010)
c. Damage and remediation extent of pile group B4
Figure 5: Goodwyn A.
5 ANGEL (2008)
5.1 DESIGN
The Angel platform is a four-legged structure with two piles per platform corner, i.e. a total of 8 piles. The site investigation revealed that, at the location of the platform a 20 m thick relatively strong calcarenite layer was encountered at an average depth of 3 m below the seabed within a variable weak cemented carbonate soil extending to 48 m depth. Another 13 m thick strong calcarenite layer was encountered below this depth.
The required axial capacity necessitated the foundation piles to take advantage of the deeper strong calcarenite layer. Analysis also indicated that some limited local hole instability was possible, which precluded the use of a single-stage drilled and grouted pile.
A conventional two-stage pile, with a driven primary pile, was also precluded due to the presence of the calcarenite layer at shallower depth, as this might have resulted in extensive damage and cracking of the pile tip (as at GWA) and/or refusal at a different depth with high variation and uncertainty in the elevation of the pile tip. The final design was therefore a pile foundation consisting of a primary pile of 2.75 m outer diameter (OD) grouted into a 3.04 m

PILED FOUNDATIONS ON THE NORTH WEST SHELF SENDERS et al.
Australian Geomechanics Vol 48 No 4 December 2013 156
diameter drilled hole, and an insert pile of 2.27 m OD grouted into a 2.52 m diameter drilled hole. The primary and insert piles extend to depths of 45 m and 62 m below mudline respectively (Figure 6a).
Axial capacity of the piles was again estimated using the computer program RATZ (Randolph 2012), Figure 6b. The RATZ model was calibrated against results of constant normal stiffness shear box tests. The shaft resistance response at a limited depth interval was conservatively modified to take into account the potential effect of fallen entrapped debris due to some limited local hole instability.
Lateral pile response was also assessed using a cohesive soil model developed for cemented calcareous soils (Erbrich, 2004). This model assumes that breakout of the upper rock material will occur progressively with ‘chipping’ of the surficial material, leading to a highly brittle stress strain (p-y) response. At greater depths the chipping is suppressed and a deep flow-around failure mode will occur. A diagram showing these conceptual failure modes is presented in Figure 6c. The cyclic loading effect is explicitly addressed through the use of a cycle-by-cycle lateral displacement shift which is related to the plastic deformation of the soil during each cycle. It is relevant to note that a long grouted overlap between primary and insert piles was required to ensure a high axial stiffness to assist in reducing the level of cyclic degradation of the shaft friction between the soil and grout during a design storm event (Figure 6a).
5.2 INSTALLATION
The jacket and subsequent pile installations were carried out between late October and early December 2007. The drilled holes were, in general, stable, circular and clean in spite of some sloughing of surficial soil along 50% of the primary pile hole which necessitated longer duration of circulation times to ensure that all of the loose soil was removed. Pile installation and grouting went according to plan and grout loss to the formations was within accepted limits for overages. To ensure the foundation integrity under all possible storm loads, a post-installation engineering assessment was carried out to investigate the effect of a wide variety of storm histories on the degradation of axial pile capacity. This work indicated that, despite the fact that the storm patterns had a noticeable effect on the residual axial capacity, all adopted storms and consequential degradation sequences resulted in adequate pile capacities.
Cemented carbonatesilty sand
Calcarenite
Cemented carbonate silty sand
Calcarenite
Cemented carbonate silty sand
Primary Pile2.75m
Insert Pile2.27m
4 m
45 m
62 m
Grout
Mudline
Insert Hole2.52m
a. Pile layout b. Pile capacity calculations c. Lateral failure modes
Figure 6: Angel.
6 PLUTO LNG (2010)
6.1 DESIGN
The Pluto platform is a four-legged platform with three piles per platform corner, i.e. a total of 12 piles. The site investigation revealed that a considerable variation in shallow geology with depth exists, in which a hard cemented layer was sandwiched between a relatively weak top layer of carbonate silty sand and a weak silty sand below. Although some strength increase was noted again at deeper depths, the capacity considerations and drilling constraints led to a foundation design of relatively short drilled and grouted piles, developing their entire geotechnical capacity within this strong cemented layer. Due to the limited thickness of this layer, the axial pile design therefore had to rely on very high (residual) interface shear between the grouted pile and the surrounding soil. Laboratory scale drilling tests on this material were however inconclusive and sufficient roughness could therefore not be guaranteed by normal drilling operations. This was overcome by adopting artificial roughening of the borehole wall by using a specially developed reaming tool mounted on a drill string behind the drill bit (Figure 7a). This basically transforms a “nail” foundation pile into a “screw” foundation pile (Figure 7b). The arrangement of grooves, including the grooving interval,
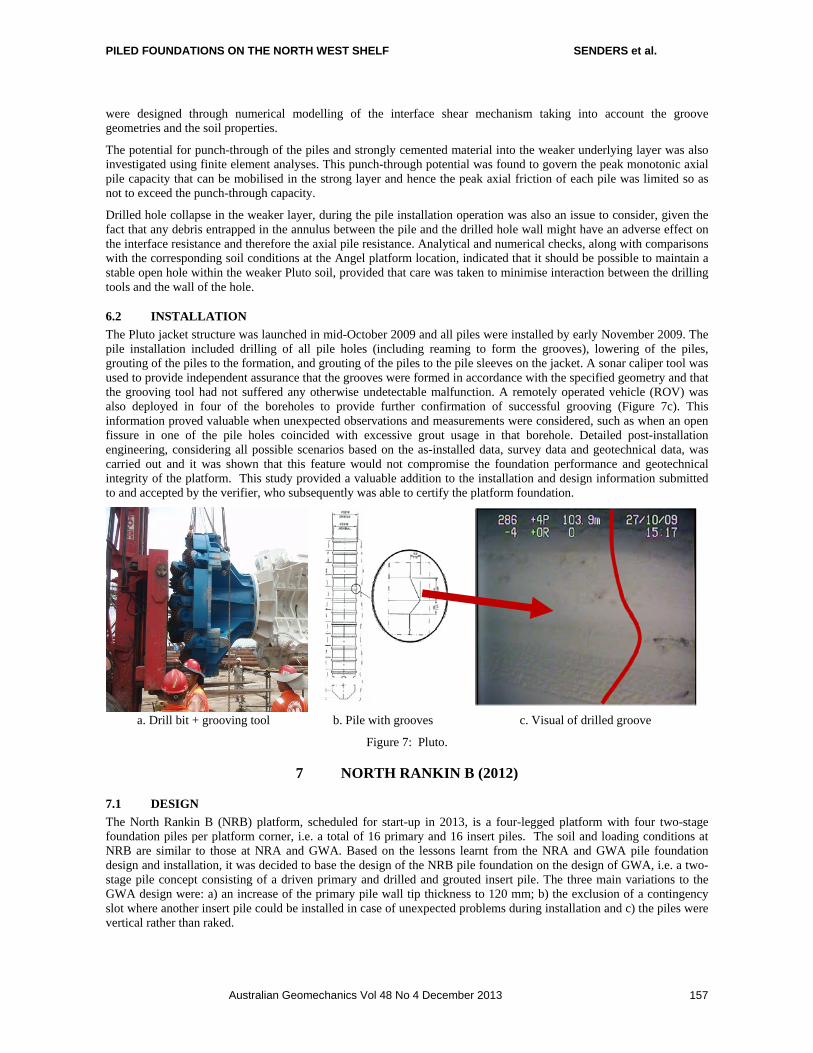
PILED FOUNDATIONS ON THE NORTH WEST SHELF SENDERS et al.
Australian Geomechanics Vol 48 No 4 December 2013 157
were designed through numerical modelling of the interface shear mechanism taking into account the groove geometries and the soil properties.
The potential for punch-through of the piles and strongly cemented material into the weaker underlying layer was also investigated using finite element analyses. This punch-through potential was found to govern the peak monotonic axial pile capacity that can be mobilised in the strong layer and hence the peak axial friction of each pile was limited so as not to exceed the punch-through capacity.
Drilled hole collapse in the weaker layer, during the pile installation operation was also an issue to consider, given the fact that any debris entrapped in the annulus between the pile and the drilled hole wall might have an adverse effect on the interface resistance and therefore the axial pile resistance. Analytical and numerical checks, along with comparisons with the corresponding soil conditions at the Angel platform location, indicated that it should be possible to maintain a stable open hole within the weaker Pluto soil, provided that care was taken to minimise interaction between the drilling tools and the wall of the hole.
6.2 INSTALLATION
The Pluto jacket structure was launched in mid-October 2009 and all piles were installed by early November 2009. The pile installation included drilling of all pile holes (including reaming to form the grooves), lowering of the piles, grouting of the piles to the formation, and grouting of the piles to the pile sleeves on the jacket. A sonar caliper tool was used to provide independent assurance that the grooves were formed in accordance with the specified geometry and that the grooving tool had not suffered any otherwise undetectable malfunction. A remotely operated vehicle (ROV) was also deployed in four of the boreholes to provide further confirmation of successful grooving (Figure 7c). This information proved valuable when unexpected observations and measurements were considered, such as when an open fissure in one of the pile holes coincided with excessive grout usage in that borehole. Detailed post-installation engineering, considering all possible scenarios based on the as-installed data, survey data and geotechnical data, was carried out and it was shown that this feature would not compromise the foundation performance and geotechnical integrity of the platform. This study provided a valuable addition to the installation and design information submitted to and accepted by the verifier, who subsequently was able to certify the platform foundation.
a. Drill bit + grooving tool b. Pile with grooves c. Visual of drilled groove
Figure 7: Pluto.
7 NORTH RANKIN B (2012)
7.1 DESIGN
The North Rankin B (NRB) platform, scheduled for start-up in 2013, is a four-legged platform with four two-stage foundation piles per platform corner, i.e. a total of 16 primary and 16 insert piles. The soil and loading conditions at NRB are similar to those at NRA and GWA. Based on the lessons learnt from the NRA and GWA pile foundation design and installation, it was decided to base the design of the NRB pile foundation on the design of GWA, i.e. a two-stage pile concept consisting of a driven primary and drilled and grouted insert pile. The three main variations to the GWA design were: a) an increase of the primary pile wall tip thickness to 120 mm; b) the exclusion of a contingency slot where another insert pile could be installed in case of unexpected problems during installation and c) the piles were vertical rather than raked.
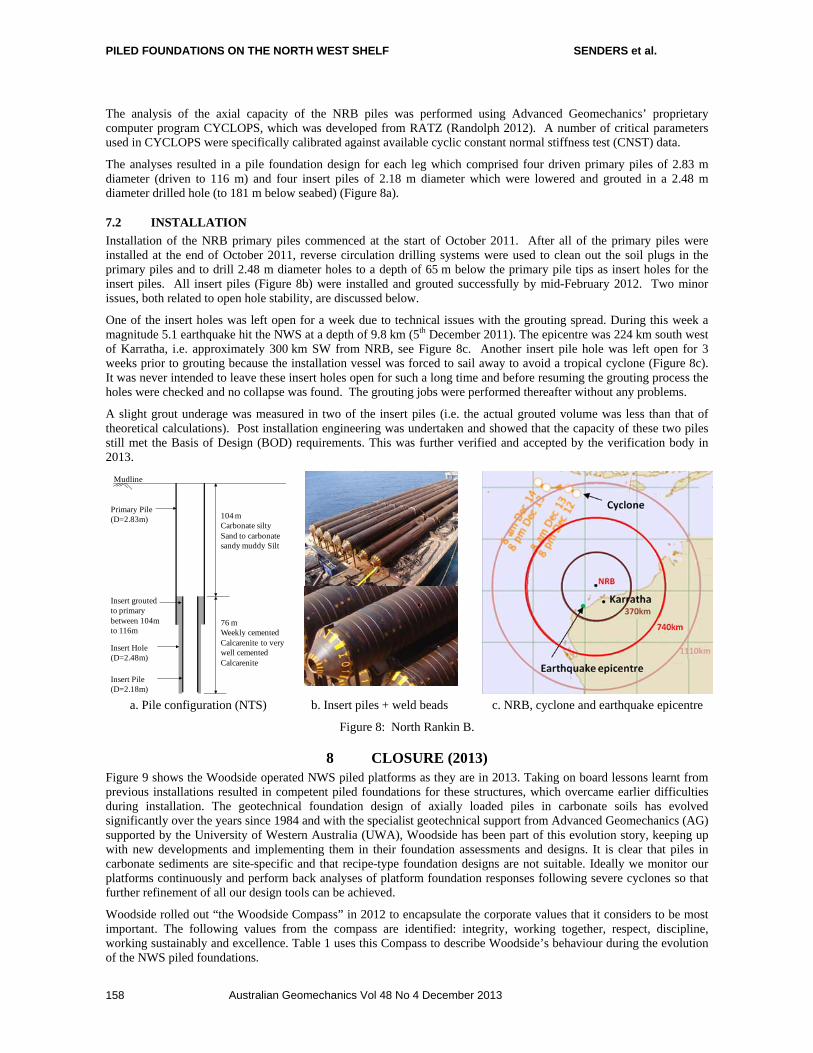
PILED FOUNDATIONS ON THE NORTH WEST SHELF SENDERS et al.
Australian Geomechanics Vol 48 No 4 December 2013 158
The analysis of the axial capacity of the NRB piles was performed using Advanced Geomechanics’ proprietary computer program CYCLOPS, which was developed from RATZ (Randolph 2012). A number of critical parameters used in CYCLOPS were specifically calibrated against available cyclic constant normal stiffness test (CNST) data.
The analyses resulted in a pile foundation design for each leg which comprised four driven primary piles of 2.83 m diameter (driven to 116 m) and four insert piles of 2.18 m diameter which were lowered and grouted in a 2.48 m diameter drilled hole (to 181 m below seabed) (Figure 8a).
7.2 INSTALLATION
Installation of the NRB primary piles commenced at the start of October 2011. After all of the primary piles were installed at the end of October 2011, reverse circulation drilling systems were used to clean out the soil plugs in the primary piles and to drill 2.48 m diameter holes to a depth of 65 m below the primary pile tips as insert holes for the insert piles. All insert piles (Figure 8b) were installed and grouted successfully by mid-February 2012. Two minor issues, both related to open hole stability, are discussed below.
One of the insert holes was left open for a week due to technical issues with the grouting spread. During this week a magnitude 5.1 earthquake hit the NWS at a depth of 9.8 km (5th December 2011). The epicentre was 224 km south west of Karratha, i.e. approximately 300 km SW from NRB, see Figure 8c. Another insert pile hole was left open for 3 weeks prior to grouting because the installation vessel was forced to sail away to avoid a tropical cyclone (Figure 8c). It was never intended to leave these insert holes open for such a long time and before resuming the grouting process the holes were checked and no collapse was found. The grouting jobs were performed thereafter without any problems.
A slight grout underage was measured in two of the insert piles (i.e. the actual grouted volume was less than that of theoretical calculations). Post installation engineering was undertaken and showed that the capacity of these two piles still met the Basis of Design (BOD) requirements. This was further verified and accepted by the verification body in 2013.
104 mCarbonate silty Sand to carbonate sandy muddy Silt
Insert Pile(D=2.18m)
Primary Pile (D=2.83m)
Mudline
Insert Hole(D=2.48m)
Insert grouted to primary between 104m to 116m
76 mWeekly cemented Calcarenite to very well cemented Calcarenite
a. Pile configuration (NTS) b. Insert piles + weld beads c. NRB, cyclone and earthquake epicentre
Figure 8: North Rankin B.
8 CLOSURE (2013) Figure 9 shows the Woodside operated NWS piled platforms as they are in 2013. Taking on board lessons learnt from previous installations resulted in competent piled foundations for these structures, which overcame earlier difficulties during installation. The geotechnical foundation design of axially loaded piles in carbonate soils has evolved significantly over the years since 1984 and with the specialist geotechnical support from Advanced Geomechanics (AG) supported by the University of Western Australia (UWA), Woodside has been part of this evolution story, keeping up with new developments and implementing them in their foundation assessments and designs. It is clear that piles in carbonate sediments are site-specific and that recipe-type foundation designs are not suitable. Ideally we monitor our platforms continuously and perform back analyses of platform foundation responses following severe cyclones so that further refinement of all our design tools can be achieved.
Woodside rolled out “the Woodside Compass” in 2012 to encapsulate the corporate values that it considers to be most important. The following values from the compass are identified: integrity, working together, respect, discipline, working sustainably and excellence. Table 1 uses this Compass to describe Woodside’s behaviour during the evolution of the NWS piled foundations.
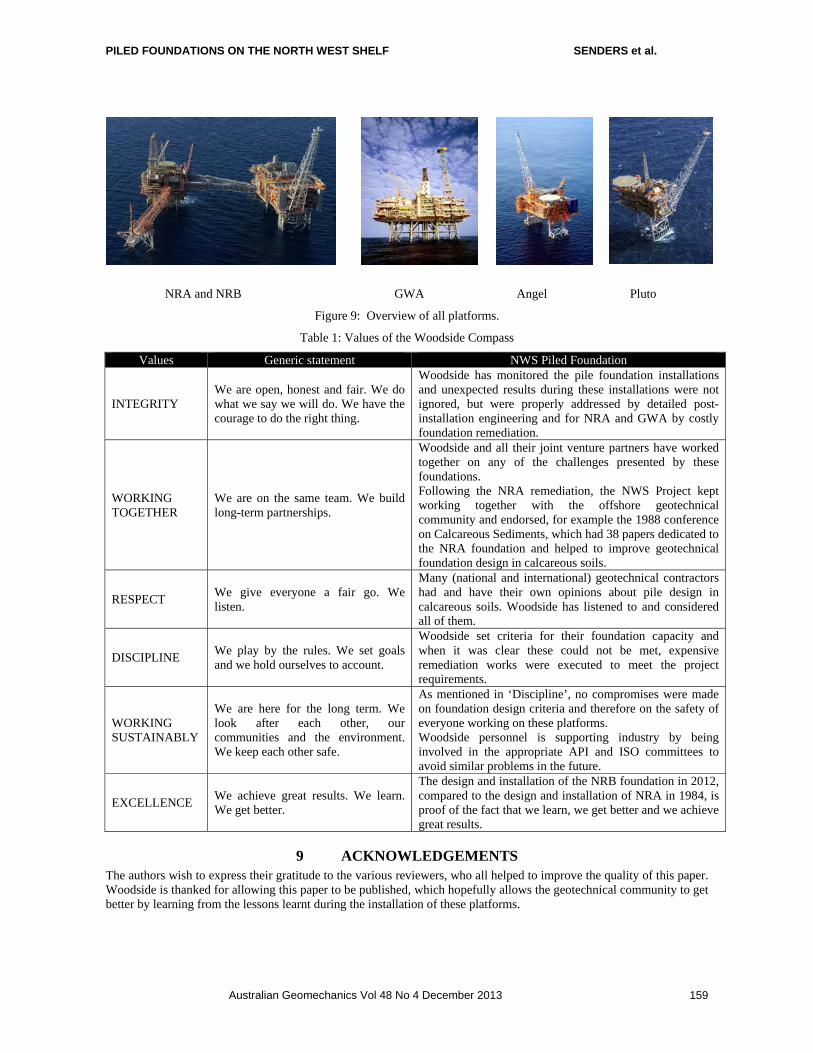
PILED FOUNDATIONS ON THE NORTH WEST SHELF SENDERS et al.
Australian Geomechanics Vol 48 No 4 December 2013 159
NRA and NRB GWA Angel Pluto
Figure 9: Overview of all platforms.
Table 1: Values of the Woodside Compass
Values Generic statement NWS Piled Foundation
INTEGRITY We are open, honest and fair. We do what we say we will do. We have the courage to do the right thing.
Woodside has monitored the pile foundation installations and unexpected results during these installations were not ignored, but were properly addressed by detailed post-installation engineering and for NRA and GWA by costly foundation remediation.
WORKING TOGETHER
We are on the same team. We build long-term partnerships.
Woodside and all their joint venture partners have worked together on any of the challenges presented by these foundations. Following the NRA remediation, the NWS Project kept working together with the offshore geotechnical community and endorsed, for example the 1988 conference on Calcareous Sediments, which had 38 papers dedicated to the NRA foundation and helped to improve geotechnical foundation design in calcareous soils.
RESPECT We give everyone a fair go. We listen.
Many (national and international) geotechnical contractors had and have their own opinions about pile design in calcareous soils. Woodside has listened to and considered all of them.
DISCIPLINE We play by the rules. We set goals and we hold ourselves to account.
Woodside set criteria for their foundation capacity and when it was clear these could not be met, expensive remediation works were executed to meet the project requirements.
WORKING SUSTAINABLY
We are here for the long term. We look after each other, our communities and the environment. We keep each other safe.
As mentioned in ‘Discipline’, no compromises were made on foundation design criteria and therefore on the safety of everyone working on these platforms. Woodside personnel is supporting industry by being involved in the appropriate API and ISO committees to avoid similar problems in the future.
EXCELLENCE We achieve great results. We learn. We get better.
The design and installation of the NRB foundation in 2012, compared to the design and installation of NRA in 1984, is proof of the fact that we learn, we get better and we achieve great results.
9 ACKNOWLEDGEMENTS The authors wish to express their gratitude to the various reviewers, who all helped to improve the quality of this paper. Woodside is thanked for allowing this paper to be published, which hopefully allows the geotechnical community to get better by learning from the lessons learnt during the installation of these platforms.
PILED FOUNDATIONS ON THE NORTH WEST SHELF SENDERS et al.
Australian Geomechanics Vol 48 No 4 December 2013 160
10 REFERENCES API, Recommended Practice for Planning, Designing and Constructing Fixed Offshore Platforms – WSD (Working
Stress Design), American Petroleum Inst., Washington, RP2A-WSD 9th edition, 1977 Apthorpe, M., Cainozoic Depositional History of the North West Shelf, in Purcell, P.G. and R.R., (Eds), The North
West Shelf, Australia: Proceedings of Petroleum Exploration Society, Australia Symposium, Perth, 1988, p.55-84
Apthorpe, M., Garstone, J. and Turner, G.J., Depositional setting and regional geology of North Rankin ‘A’ foundation sediments, Proceedings of Engineering for Calcareous Sediments, Jewell & Khorshid (Eds), 1988, Balkema, Rotterdam, Vol 2, p. 357-366
Clark, A.R. and Walker, B.F., Proposed Scheme for the Classification and Nomenclature for use in Middle Eastern Sedimentary Rocks, 1977, Géotechnique Vol. 27, No.1
Erbrich, C.T., A new method for the design of laterally loaded anchor piles in soft rock, Proceedings of Annual Offshore Technology Conference, 2004, Houston, Paper OTC 16441
Erbrich, C.T., Barbosa-Cruz, E. and Barbour, R. Soil-pile interaction during extrusion of an initially deformed pile, Proceedings of Frontiers in Offshore Geotechnics II – Gourvenec & White (Eds), 2004, Taylor & Francis Group, London, p. 489-494
Haggerty, B.C. and Ripley, L., Modifications to North Rankin ‘A’ foundations, Proceedings of Engineering for Calcareous Sediments, Jewell & Khorshid (Eds), 1988, Balkema, Rotterdam, p. 747-773
Randolph, M.F., Evaluation of grouted insert pile performance, Proceedings of Engineering for Calcareous Sediments, Jewell & Khorshid (Eds), 1988, Balkema, Rotterdam, Vol 2, 617-626.
Randolph, M.F. and Jewell, R., Axial load transfer models for piles in calcareous soil, Proc. 12th Int. Conf. on Soil Mech. and Found. Eng., Rio de Janeiro, 1989, Vol 1, 479-484.
Randolph, M.F., Joer, H. A. and Khorsid M.S.., Field & laboratory data from pile load tests in calcareous soil, Proceedings of Annual Offshore Technology Conference, 1996, Houston, Paper OTC7992.
Randolph, M.F., Cyclic Interface Shearing in Sand and Cemented Soils and Application to Axial Response of Piles, Mechanical Behaviour of Soils Under Environmentally Induced Cyclic Loads, CISM Courses and Lectures, C. di Prisco et al. (Eds.)Volume 534, 2012, p. 481-528
Schlager, W., Sedimentology and Sequence Stratigraphy of Carbonate Rocks, Vrije Univeriteit / Earth and Life Sciences, Amsterdam, 2002
Woodside, http://www.woodside.com.au/About-Us/Profile/Pages/History.aspx, last visited on 12 February 2013

Australian Geomechanics Vol 48 No 4 December 2013 149
PILED FOUNDATIONS ON THE NORTH WEST SHELF
M. Senders1, M. Banimahd2, T. Zhang3 and A. Lane 4
1Principal Geotechnical Engineer, 2Senior Geotechnical Engineer, 3 Geotechnical Engineer, 4Principal Geohazard Analyst, Woodside Energy Limited, Perth, Australia
ABSTRACT
Woodside jointly owns and is operator of five piled platforms in the North West Shelf (NWS): North Rankin A (NRA, 1984), Goodwyn A (GWA, 1995), Angel (2008), Pluto LNG (2010) and North Rankin B (NRB, 2012). All these platforms have piled foundations in carbonate soils, although none of these foundations are the same. These variations result partly from the differences in soil conditions, but more importantly from the lessons learnt from the NRA and GWA pile installations. This paper will take the reader on a journey through recent time and describe the piled foundations for each platform together with the philosophy behind each design. It is a journey where Woodside showcases that it embraced the unexpected results during the installation of NRA (first experience of cyclic behaviour of carbonate soils) and GWA (deformation to steel driven piles) and developed robust (Angel and NRB) and innovative (grooving of drilled and grouted piles at Pluto) piled foundations for their platforms at the calcareous North West Shelf.
1 WOODSIDE’S HISTORY To understand what the NWS platforms mean to Woodside it is important to have some knowledge about Woodside’s history as described in Woodside (2013). Woodside was established a year after Australia's first oil discovery, the 1953 Rough Range find near Exmouth in Western Australia. Incorporated on 26 July 1954 as Woodside (Lakes Entrance) Oil Co NL, the company took its name from the small town of Woodside in Australia's southern-most mainland state, Victoria. In 1956 Woodside secured the first offshore exploration license to be granted in Victoria – a 2600 km2 stretch off Ninety Mile Beach that extended 2 km into the Bass Strait. In June 1963, Woodside was awarded exploration rights to more than 367,000 km2 off north-western Australia in what is known as the North West Shelf. Exploration drilling began in 1967 and major gas and condensate discoveries were made in 1971 at Scott Reef, 425 km north of Broome, and North Rankin and Angel, north of Dampier in Western Australia. In 1972, the Goodwyn gas and condensate field was discovered to the west of North Rankin. These fields contained reserves of nearly 50 trillion cubic feet (tcf) of gas and provided the basis for the A$27 billion North West Shelf Project, Australia's largest resource project. A contract with the State Energy Commission of Western Australia for the supply of domestic gas to industries and homes was signed in September 1980, and deliveries began in August 1984.
Today, Woodside is Australia's largest publicly traded oil and gas exploration and production company and one of the nation's most successful explorers, developers and producers of oil and gas. The Company's initial 375,000-pound (A$937,000) share issue in September 1954 has led (after several subsequent share issues) to a market capitalisation of A$31,918M as at 24 April 2013. The developments on the North West Shelf have been the main driver behind Woodside’s success. It has to be fully recognised that this could not have been done without the full support from all the joint venture partners (NWS Project joint venture partners: BHP Billiton Petroleum (North West Shelf) Pty Ltd, BP Developments Australia Pty Ltd, Chevron Australia Pty Ltd, Japan Australia LNG (MIMI) Pty Ltd, Shell Development (Australia) Pty Ltd and Pluto LNG joint venture partners: Kansai Electric and Tokyo Gas).
2 NORTH WEST SHELF
2.1 WOODSIDE OPERATED PILED PLATFORMS
Figure 1 shows the locations of the five piled platforms Woodside operates on the NWS. These all lie within 140 km of each other, are typically only approximately 130 km from the Burrup Peninsula and are built in water depths between 82 m and 132 m.
Figure 2 shows a comparative overview of the five mentioned platforms, including details of the jacket sizes, the water depths in which they are built, a schematic of their foundations and a typical Cone Penetrometer Test (CPT) profile for each platform area.
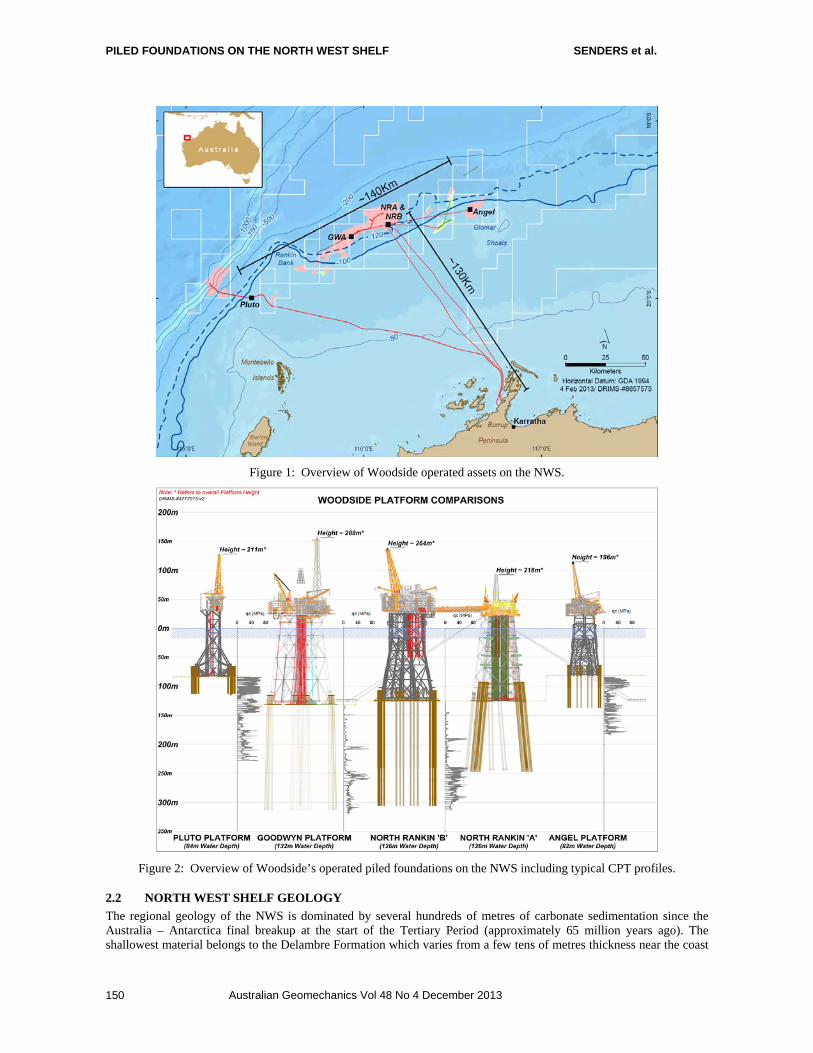
PILED FOUNDATIONS ON THE NORTH WEST SHELF SENDERS et al.
Australian Geomechanics Vol 48 No 4 December 2013 150
Figure 1: Overview of Woodside operated assets on the NWS.
Figure 2: Overview of Woodside’s operated piled foundations on the NWS including typical CPT profiles.
2.2 NORTH WEST SHELF GEOLOGY
The regional geology of the NWS is dominated by several hundreds of metres of carbonate sedimentation since the Australia – Antarctica final breakup at the start of the Tertiary Period (approximately 65 million years ago). The shallowest material belongs to the Delambre Formation which varies from a few tens of metres thickness near the coast
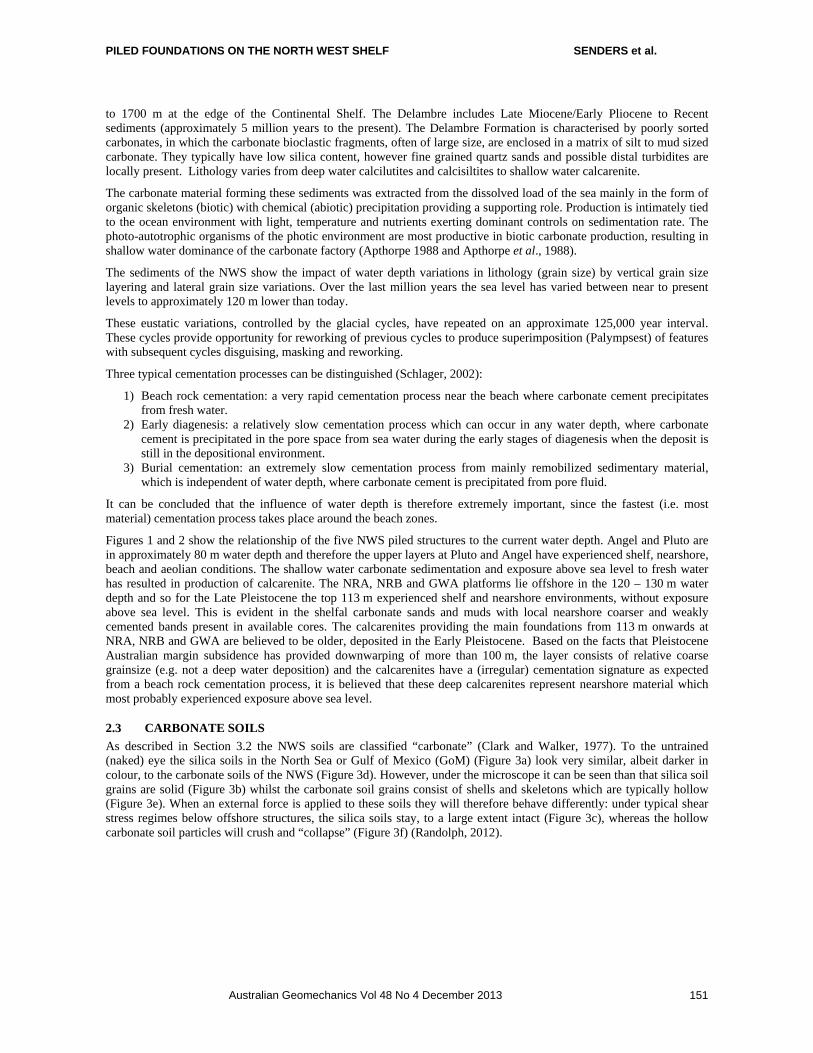
PILED FOUNDATIONS ON THE NORTH WEST SHELF SENDERS et al.
Australian Geomechanics Vol 48 No 4 December 2013 151
to 1700 m at the edge of the Continental Shelf. The Delambre includes Late Miocene/Early Pliocene to Recent sediments (approximately 5 million years to the present). The Delambre Formation is characterised by poorly sorted carbonates, in which the carbonate bioclastic fragments, often of large size, are enclosed in a matrix of silt to mud sized carbonate. They typically have low silica content, however fine grained quartz sands and possible distal turbidites are locally present. Lithology varies from deep water calcilutites and calcisiltites to shallow water calcarenite.
The carbonate material forming these sediments was extracted from the dissolved load of the sea mainly in the form of organic skeletons (biotic) with chemical (abiotic) precipitation providing a supporting role. Production is intimately tied to the ocean environment with light, temperature and nutrients exerting dominant controls on sedimentation rate. The photo-autotrophic organisms of the photic environment are most productive in biotic carbonate production, resulting in shallow water dominance of the carbonate factory (Apthorpe 1988 and Apthorpe et al., 1988).
The sediments of the NWS show the impact of water depth variations in lithology (grain size) by vertical grain size layering and lateral grain size variations. Over the last million years the sea level has varied between near to present levels to approximately 120 m lower than today.
These eustatic variations, controlled by the glacial cycles, have repeated on an approximate 125,000 year interval. These cycles provide opportunity for reworking of previous cycles to produce superimposition (Palympsest) of features with subsequent cycles disguising, masking and reworking.
Three typical cementation processes can be distinguished (Schlager, 2002):
1) Beach rock cementation: a very rapid cementation process near the beach where carbonate cement precipitates from fresh water.
2) Early diagenesis: a relatively slow cementation process which can occur in any water depth, where carbonate cement is precipitated in the pore space from sea water during the early stages of diagenesis when the deposit is still in the depositional environment.
3) Burial cementation: an extremely slow cementation process from mainly remobilized sedimentary material, which is independent of water depth, where carbonate cement is precipitated from pore fluid.
It can be concluded that the influence of water depth is therefore extremely important, since the fastest (i.e. most material) cementation process takes place around the beach zones.
Figures 1 and 2 show the relationship of the five NWS piled structures to the current water depth. Angel and Pluto are in approximately 80 m water depth and therefore the upper layers at Pluto and Angel have experienced shelf, nearshore, beach and aeolian conditions. The shallow water carbonate sedimentation and exposure above sea level to fresh water has resulted in production of calcarenite. The NRA, NRB and GWA platforms lie offshore in the 120 – 130 m water depth and so for the Late Pleistocene the top 113 m experienced shelf and nearshore environments, without exposure above sea level. This is evident in the shelfal carbonate sands and muds with local nearshore coarser and weakly cemented bands present in available cores. The calcarenites providing the main foundations from 113 m onwards at NRA, NRB and GWA are believed to be older, deposited in the Early Pleistocene. Based on the facts that Pleistocene Australian margin subsidence has provided downwarping of more than 100 m, the layer consists of relative coarse grainsize (e.g. not a deep water deposition) and the calcarenites have a (irregular) cementation signature as expected from a beach rock cementation process, it is believed that these deep calcarenites represent nearshore material which most probably experienced exposure above sea level.
2.3 CARBONATE SOILS
As described in Section 3.2 the NWS soils are classified “carbonate” (Clark and Walker, 1977). To the untrained (naked) eye the silica soils in the North Sea or Gulf of Mexico (GoM) (Figure 3a) look very similar, albeit darker in colour, to the carbonate soils of the NWS (Figure 3d). However, under the microscope it can be seen than that silica soil grains are solid (Figure 3b) whilst the carbonate soil grains consist of shells and skeletons which are typically hollow (Figure 3e). When an external force is applied to these soils they will therefore behave differently: under typical shear stress regimes below offshore structures, the silica soils stay, to a large extent intact (Figure 3c), whereas the hollow carbonate soil particles will crush and “collapse” (Figure 3f) (Randolph, 2012).
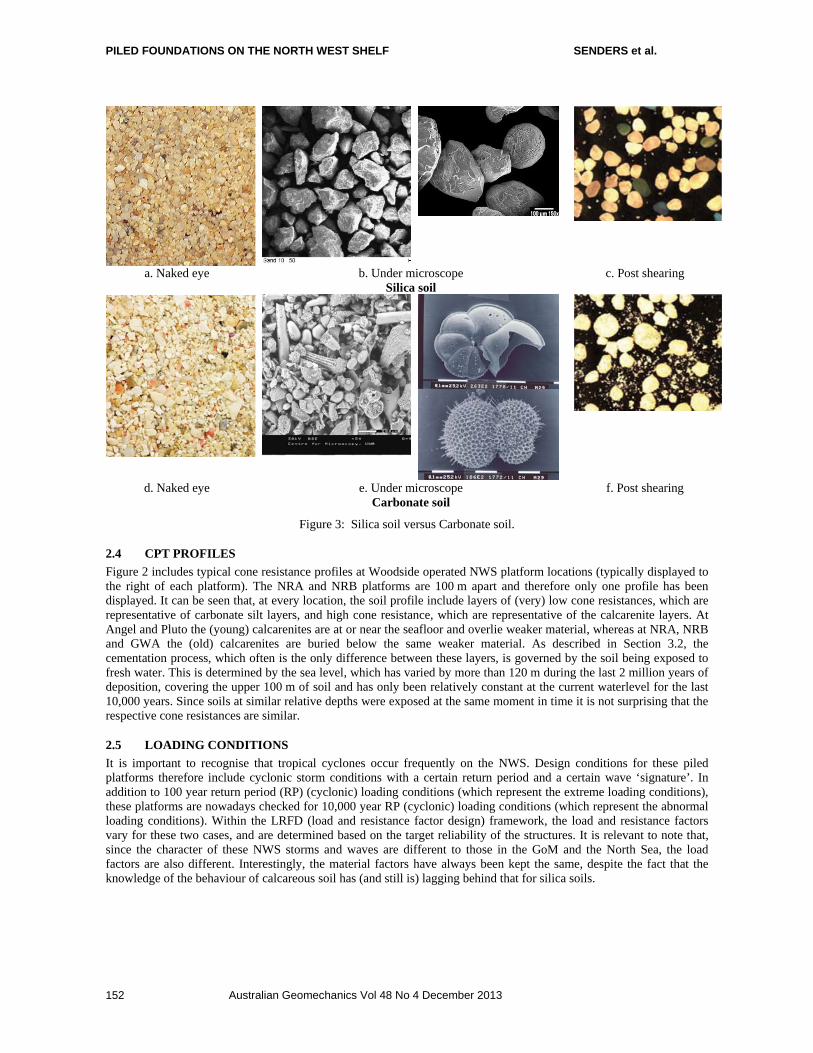
PILED FOUNDATIONS ON THE NORTH WEST SHELF SENDERS et al.
Australian Geomechanics Vol 48 No 4 December 2013 152
a. Naked eye b. Under microscope c. Post shearing Silica soil
d. Naked eye e. Under microscope f. Post shearing Carbonate soil
Figure 3: Silica soil versus Carbonate soil.
2.4 CPT PROFILES
Figure 2 includes typical cone resistance profiles at Woodside operated NWS platform locations (typically displayed to the right of each platform). The NRA and NRB platforms are 100 m apart and therefore only one profile has been displayed. It can be seen that, at every location, the soil profile include layers of (very) low cone resistances, which are representative of carbonate silt layers, and high cone resistance, which are representative of the calcarenite layers. At Angel and Pluto the (young) calcarenites are at or near the seafloor and overlie weaker material, whereas at NRA, NRB and GWA the (old) calcarenites are buried below the same weaker material. As described in Section 3.2, the cementation process, which often is the only difference between these layers, is governed by the soil being exposed to fresh water. This is determined by the sea level, which has varied by more than 120 m during the last 2 million years of deposition, covering the upper 100 m of soil and has only been relatively constant at the current waterlevel for the last 10,000 years. Since soils at similar relative depths were exposed at the same moment in time it is not surprising that the respective cone resistances are similar.
2.5 LOADING CONDITIONS
It is important to recognise that tropical cyclones occur frequently on the NWS. Design conditions for these piled platforms therefore include cyclonic storm conditions with a certain return period and a certain wave ‘signature’. In addition to 100 year return period (RP) (cyclonic) loading conditions (which represent the extreme loading conditions), these platforms are nowadays checked for 10,000 year RP (cyclonic) loading conditions (which represent the abnormal loading conditions). Within the LRFD (load and resistance factor design) framework, the load and resistance factors vary for these two cases, and are determined based on the target reliability of the structures. It is relevant to note that, since the character of these NWS storms and waves are different to those in the GoM and the North Sea, the load factors are also different. Interestingly, the material factors have always been kept the same, despite the fact that the knowledge of the behaviour of calcareous soil has (and still is) lagging behind that for silica soils.

PILED FOUNDATIONS ON THE NORTH WEST SHELF SENDERS et al.
Australian Geomechanics Vol 48 No 4 December 2013 153
3 NORTH RANKIN A (1984)
3.1 DESIGN
The North Rankin A (NRA) platform is a four-legged platform with eight driven foundation piles per platform corner, i.e. a total of 32 piles. The foundation design of North Rankin A (NRA) was based on the frictional pile capacity calculations used at that time for piles in the silica soils of the GoM and North Sea. This calculation procedure was based on classical friction law and multiplies the horizontal effective stress (h’ = K0 v’) with the tangent value of the interface angle between soil and pile (tan), see for instance API (1977). This design process was supported by small-scale down-hole friction tests, which were the basis for selecting the friction design profile, and which showed high friction peaks and stable residual values. Partly because the measured cone resistance in the carbonate silt above 113 m (which can be regarded as a mini-pile load test) was lower than expected in silica soils with a similar grain size, a low K0 value of 0.4 and a much lower than measured interface angle of only 15 degrees were used for the pile design. The end bearing was neglected from a conservative point of view.
The design resulted in 8 piles of 1.83 m diameter per corner (Figure 4a) which needed to be driven to 116 m depth into the hard layer which started at 113 m below seabed.
3.2 INSTALLATION
During the installation in 1982 the NRA jacket was set down on mudmats and eight piles were driven at each of the four corner legs. Unexpectedly the piles typically free fell between 0 and 64 m and then again between 72 m and 114 m below the seabed level. These free-falling piles indicated that an extremely low skin friction capacity existed in these materials, much lower than necessary to fulfil the design requirements. It became clear that the carbonate soil collapsed when sheared, and therefore the horizontal stresses reduced, leading to less friction on the pile shafts. The small-scale friction test could not have picked this up and therefore had led to the wrong design frictions.
To remediate NRA, both end bearing and frictional solutions were considered. The end bearing solution was selected as the installed (primary) piles drooped towards each other and insert piles could not be installed, since drilled holes would interfere with each other. Therefore in 1983 grout plugs were installed in the pile tips. This, together with “pile set-up” (=increase in frictional resistance with time) was identified as a foundation contingency which would provide the required capacity for the foundations to be certified. It was not possible to install plugs at the tips of the flare support structure piles due to safety considerations, since NRA was operational throughout the remediation process. That is why in 1987 the Flare Support Structure (FSS) was upgraded by including guys in two directions and structural stiffening in the third direction. The guys were anchored to the seabed by means of large gravity boxes.
The load tests on the 760 mm diameter driven well conductors, which were driven in 1983, demonstrated that “set up” was not apparent and that the friction degraded to very low values when the conductor was driven further into the formation and/or subjected to cyclic loading. This led to the conclusion that the foundations with grout plugs installed were highly unlikely to be certified without further upgrading.
This led to cast-in-place concrete bells (nominally 4.5 m diameter) being installed at the tip of some of the piles to increase the foundation capacity (Figure 4b). Eposand was injected into the formation surrounding the proposed concrete bells as a construction aid to ensure stability of the open hole prior to the placement of the concrete. The relatively close spacing of the piles meant that concrete bells could only be installed in 4 of the 8 piles per group. The tip elevation of the concrete bells is nominally 5.5 m lower than the tip of the remaining non-belled piles in the group and in many cases there is either partial or full overlap of the non-belled piles with the vertically projected area of the bells (Haggerty and Ripley, 1988).
Certification of the upgraded foundations (with grout plugs, FSS upgrades and concrete bells, see Figure 4c) was finally achieved in 1988.

PILED FOUNDATIONS ON THE NORTH WEST SHELF SENDERS et al.
Australian Geomechanics Vol 48 No 4 December 2013 154
a. B2 corner (pile sleeves + mudmat) b. Bells in pile group B2 c. With remediation works
Figure 4: North Rankin A.
4 GOODWYN A (1995)
4.1 DESIGN
The Goodwyn A (GWA) platform is a four-legged platform with four two-stage foundation piles and an extra primary pile per platform corner, i.e. a total of 20 primary and 16 insert piles. Although the soil and loading conditions of the Goodwyn A platform are similar to those for the North Rankin A platform, the foundation design was altered significantly using the lessons learnt at NRA. Instead of driven piles which rely on frictional resistance, or belled piles which rely on high end bearing, the design incorporated a two-stage pile concept, which consists of a primary and an insert pile. The primary pile is driven into the ground and next to providing lateral capacity it purely transfers the axial mudline load to the insert pile at depth and furthermore serves as a casing during the drilling of the insert pile hole. The insert pile is inserted in this drilled hole and grouted to the formation and the primary pile. The frictional resistance of the primary pile is conservatively set at zero, as is the end bearing of the insert pile. The capacity of the foundation relies on the skin friction between the (grouted) insert pile and the calcarenite.
In contrast to the pile driving operations, during which the carbonate soil supplying the frictional resistance is certainly disturbed, the drilling and grouting process aims at not disturbing the initial interface between the grout and soil. However, as the shear stress level reaches the maximum value that the interface between the grout and soil can withstand, a rupture surface will develop close to the grout-soil interface. Thereafter, the shear stress level may be expected to vary with the absolute displacement of the pile relative to the soil, and it becomes more logical to consider relationships between shear strength and the absolute displacement. In granular soils, particularly lightly cemented sands, it is also found that the shear transfer during small displacement cycles is very low (see “cyclic residual shaft friction” in Figure 5a) (Randolph, 1988, Randolph and Jewell, 1989, Randolph et al., 2012). The computer program ‘RATZ’ was developed to calculate the frictional resistance for a given loading event, in this case the 2,000 year cyclonic storm, and determine the appropriate insert pile design length. The program was calibrated to the results of large scale pile load tests undertaken onshore in carbonate sediments (Randolph, 1996). The tests were affected by the shallow depth and consequent lower in situ stresses around the piles at the onshore site when compared to piles at the Goodwyn location.
The result of this design process was that the piled foundation of the Goodwyn ‘A’ platform comprises five driven primary piles of 2.65 m diameter (installed to 116 m) at each leg. Through four of the five primary piles 2.3 m diameter insert holes were to be drilled (to 180 m) in which insert piles of 2.0 m diameter were to be grouted. Not using the fifth primary pile meant that there was a construction contingency in the event of abandonment of an insert pile installation. Since the pile driving at NRA went smoothly, it was decided to make the wall thickness as thin as possible, which resulted in varying thicknesses between 45 mm at the pile tip to 90 mm at the pile top to withstand the lateral loads.
4.2 INSTALLATION
Pile driving of the GWA primary piles commenced in November 1992. After all of the primary piles were installed, reverse circulation drilling systems were used to clean out the soil plugs and to drill 65 m below the primary pile tips for installation of the insert piles. It was during this clean-out operation that it became apparent that most of the 20 primary piles were non-circular (typically referred to as ‘peanut’ shaped) over the lower 10 m to 40 m (Figure 5b).
The relatively thin wall thickness at the toe level (and potentially minor indentations of the vertical pile when passing through the inclined pile sleeve) is considered to be the main reason that these piles closed in upon themselves. When

PILED FOUNDATIONS ON THE NORTH WEST SHELF SENDERS et al.
Australian Geomechanics Vol 48 No 4 December 2013 155
the toe of the pile gets damaged due to driving through the hard layer at 64 m and the pile tip starts to buckle inwards, further driving through this hard layer forces the local buckle to propagate further over a considerable length of the pile. That failure mechanism forces the tip of the pile, which started to buckle initially, to keep on closing.
The remediation was devised to provide an effective permanent solution with the work broken down into three phases. Firstly three ‘as designed’ insert piles (B2-5, G2-1 and G4-1) were successfully installed without any remediation. These were located on different legs of the jacket. A significant increase in foundation capacity could be achieved with the successful installation of an insert on the fourth (i.e. B4) leg. The least damaged pile on this B4 leg was considered to be primary pile B4-5 (right pile in Figure 5c). The second remediation phase therefore required the development of a simple jacking tool which was used to open the damaged pile tip to allow passage of a 2.3 m diameter drill bit. The third phase required the remediation of 12 two-stage foundation piles, whose damaged zones included the section with internal shear keys, which was intended to form the grouted connection with the insert pile. The structural integrity of the total foundation system was assured by lengthening (and other modifications) of the insert piles (hatched areas on the piles in Figure 5c) so that the damaged section of the primary piles could be ignored for the total load transfer. These 12 insert piles were installed inside the primary piles after the primary piles had been successfully internally jacked and/or packer pressure expanded into a near circular shape.
a. Typical results from rod shear test in calcarenite [top] and model in RATZ [bottom] (Randolph 2012)
b. Typical damage of primary pile (Erbrich 2010)
c. Damage and remediation extent of pile group B4
Figure 5: Goodwyn A.
5 ANGEL (2008)
5.1 DESIGN
The Angel platform is a four-legged structure with two piles per platform corner, i.e. a total of 8 piles. The site investigation revealed that, at the location of the platform a 20 m thick relatively strong calcarenite layer was encountered at an average depth of 3 m below the seabed within a variable weak cemented carbonate soil extending to 48 m depth. Another 13 m thick strong calcarenite layer was encountered below this depth.
The required axial capacity necessitated the foundation piles to take advantage of the deeper strong calcarenite layer. Analysis also indicated that some limited local hole instability was possible, which precluded the use of a single-stage drilled and grouted pile.
A conventional two-stage pile, with a driven primary pile, was also precluded due to the presence of the calcarenite layer at shallower depth, as this might have resulted in extensive damage and cracking of the pile tip (as at GWA) and/or refusal at a different depth with high variation and uncertainty in the elevation of the pile tip. The final design was therefore a pile foundation consisting of a primary pile of 2.75 m outer diameter (OD) grouted into a 3.04 m
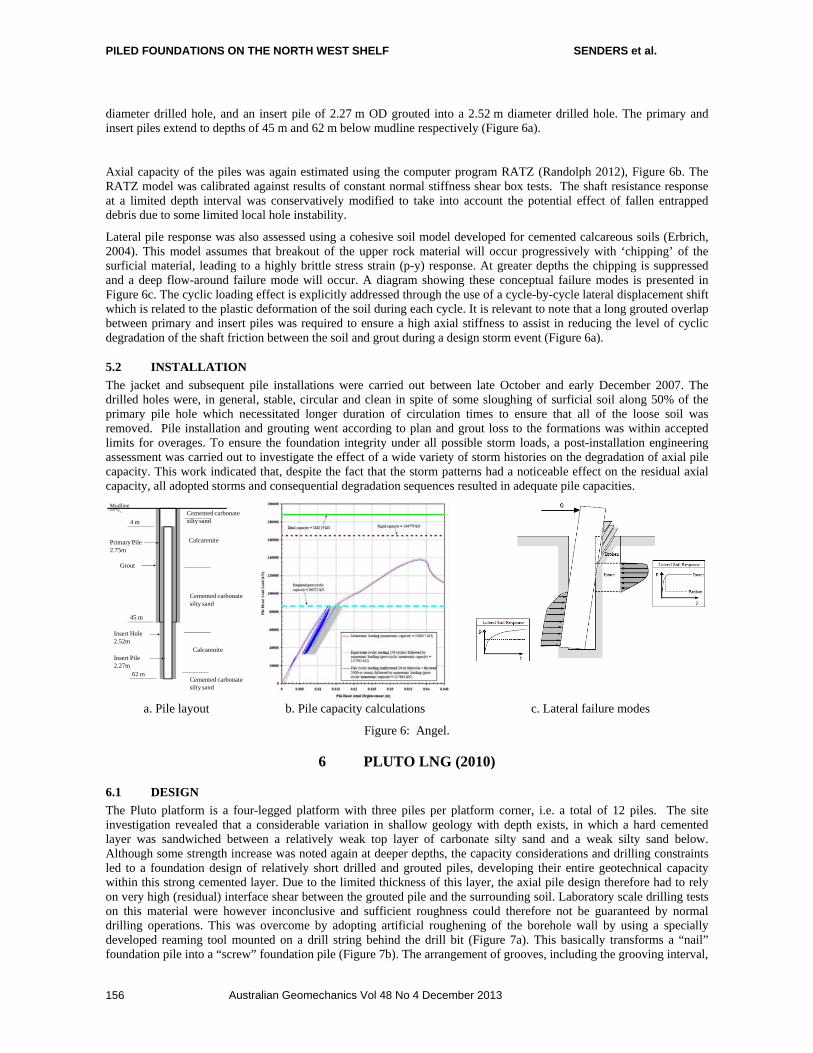
PILED FOUNDATIONS ON THE NORTH WEST SHELF SENDERS et al.
Australian Geomechanics Vol 48 No 4 December 2013 156
diameter drilled hole, and an insert pile of 2.27 m OD grouted into a 2.52 m diameter drilled hole. The primary and insert piles extend to depths of 45 m and 62 m below mudline respectively (Figure 6a).
Axial capacity of the piles was again estimated using the computer program RATZ (Randolph 2012), Figure 6b. The RATZ model was calibrated against results of constant normal stiffness shear box tests. The shaft resistance response at a limited depth interval was conservatively modified to take into account the potential effect of fallen entrapped debris due to some limited local hole instability.
Lateral pile response was also assessed using a cohesive soil model developed for cemented calcareous soils (Erbrich, 2004). This model assumes that breakout of the upper rock material will occur progressively with ‘chipping’ of the surficial material, leading to a highly brittle stress strain (p-y) response. At greater depths the chipping is suppressed and a deep flow-around failure mode will occur. A diagram showing these conceptual failure modes is presented in Figure 6c. The cyclic loading effect is explicitly addressed through the use of a cycle-by-cycle lateral displacement shift which is related to the plastic deformation of the soil during each cycle. It is relevant to note that a long grouted overlap between primary and insert piles was required to ensure a high axial stiffness to assist in reducing the level of cyclic degradation of the shaft friction between the soil and grout during a design storm event (Figure 6a).
5.2 INSTALLATION
The jacket and subsequent pile installations were carried out between late October and early December 2007. The drilled holes were, in general, stable, circular and clean in spite of some sloughing of surficial soil along 50% of the primary pile hole which necessitated longer duration of circulation times to ensure that all of the loose soil was removed. Pile installation and grouting went according to plan and grout loss to the formations was within accepted limits for overages. To ensure the foundation integrity under all possible storm loads, a post-installation engineering assessment was carried out to investigate the effect of a wide variety of storm histories on the degradation of axial pile capacity. This work indicated that, despite the fact that the storm patterns had a noticeable effect on the residual axial capacity, all adopted storms and consequential degradation sequences resulted in adequate pile capacities.
Cemented carbonatesilty sand
Calcarenite
Cemented carbonate silty sand
Calcarenite
Cemented carbonate silty sand
Primary Pile2.75m
Insert Pile2.27m
4 m
45 m
62 m
Grout
Mudline
Insert Hole2.52m
a. Pile layout b. Pile capacity calculations c. Lateral failure modes
Figure 6: Angel.
6 PLUTO LNG (2010)
6.1 DESIGN
The Pluto platform is a four-legged platform with three piles per platform corner, i.e. a total of 12 piles. The site investigation revealed that a considerable variation in shallow geology with depth exists, in which a hard cemented layer was sandwiched between a relatively weak top layer of carbonate silty sand and a weak silty sand below. Although some strength increase was noted again at deeper depths, the capacity considerations and drilling constraints led to a foundation design of relatively short drilled and grouted piles, developing their entire geotechnical capacity within this strong cemented layer. Due to the limited thickness of this layer, the axial pile design therefore had to rely on very high (residual) interface shear between the grouted pile and the surrounding soil. Laboratory scale drilling tests on this material were however inconclusive and sufficient roughness could therefore not be guaranteed by normal drilling operations. This was overcome by adopting artificial roughening of the borehole wall by using a specially developed reaming tool mounted on a drill string behind the drill bit (Figure 7a). This basically transforms a “nail” foundation pile into a “screw” foundation pile (Figure 7b). The arrangement of grooves, including the grooving interval,

PILED FOUNDATIONS ON THE NORTH WEST SHELF SENDERS et al.
Australian Geomechanics Vol 48 No 4 December 2013 157
were designed through numerical modelling of the interface shear mechanism taking into account the groove geometries and the soil properties.
The potential for punch-through of the piles and strongly cemented material into the weaker underlying layer was also investigated using finite element analyses. This punch-through potential was found to govern the peak monotonic axial pile capacity that can be mobilised in the strong layer and hence the peak axial friction of each pile was limited so as not to exceed the punch-through capacity.
Drilled hole collapse in the weaker layer, during the pile installation operation was also an issue to consider, given the fact that any debris entrapped in the annulus between the pile and the drilled hole wall might have an adverse effect on the interface resistance and therefore the axial pile resistance. Analytical and numerical checks, along with comparisons with the corresponding soil conditions at the Angel platform location, indicated that it should be possible to maintain a stable open hole within the weaker Pluto soil, provided that care was taken to minimise interaction between the drilling tools and the wall of the hole.
6.2 INSTALLATION
The Pluto jacket structure was launched in mid-October 2009 and all piles were installed by early November 2009. The pile installation included drilling of all pile holes (including reaming to form the grooves), lowering of the piles, grouting of the piles to the formation, and grouting of the piles to the pile sleeves on the jacket. A sonar caliper tool was used to provide independent assurance that the grooves were formed in accordance with the specified geometry and that the grooving tool had not suffered any otherwise undetectable malfunction. A remotely operated vehicle (ROV) was also deployed in four of the boreholes to provide further confirmation of successful grooving (Figure 7c). This information proved valuable when unexpected observations and measurements were considered, such as when an open fissure in one of the pile holes coincided with excessive grout usage in that borehole. Detailed post-installation engineering, considering all possible scenarios based on the as-installed data, survey data and geotechnical data, was carried out and it was shown that this feature would not compromise the foundation performance and geotechnical integrity of the platform. This study provided a valuable addition to the installation and design information submitted to and accepted by the verifier, who subsequently was able to certify the platform foundation.
a. Drill bit + grooving tool b. Pile with grooves c. Visual of drilled groove
Figure 7: Pluto.
7 NORTH RANKIN B (2012)
7.1 DESIGN
The North Rankin B (NRB) platform, scheduled for start-up in 2013, is a four-legged platform with four two-stage foundation piles per platform corner, i.e. a total of 16 primary and 16 insert piles. The soil and loading conditions at NRB are similar to those at NRA and GWA. Based on the lessons learnt from the NRA and GWA pile foundation design and installation, it was decided to base the design of the NRB pile foundation on the design of GWA, i.e. a two-stage pile concept consisting of a driven primary and drilled and grouted insert pile. The three main variations to the GWA design were: a) an increase of the primary pile wall tip thickness to 120 mm; b) the exclusion of a contingency slot where another insert pile could be installed in case of unexpected problems during installation and c) the piles were vertical rather than raked.

PILED FOUNDATIONS ON THE NORTH WEST SHELF SENDERS et al.
Australian Geomechanics Vol 48 No 4 December 2013 158
The analysis of the axial capacity of the NRB piles was performed using Advanced Geomechanics’ proprietary computer program CYCLOPS, which was developed from RATZ (Randolph 2012). A number of critical parameters used in CYCLOPS were specifically calibrated against available cyclic constant normal stiffness test (CNST) data.
The analyses resulted in a pile foundation design for each leg which comprised four driven primary piles of 2.83 m diameter (driven to 116 m) and four insert piles of 2.18 m diameter which were lowered and grouted in a 2.48 m diameter drilled hole (to 181 m below seabed) (Figure 8a).
7.2 INSTALLATION
Installation of the NRB primary piles commenced at the start of October 2011. After all of the primary piles were installed at the end of October 2011, reverse circulation drilling systems were used to clean out the soil plugs in the primary piles and to drill 2.48 m diameter holes to a depth of 65 m below the primary pile tips as insert holes for the insert piles. All insert piles (Figure 8b) were installed and grouted successfully by mid-February 2012. Two minor issues, both related to open hole stability, are discussed below.
One of the insert holes was left open for a week due to technical issues with the grouting spread. During this week a magnitude 5.1 earthquake hit the NWS at a depth of 9.8 km (5th December 2011). The epicentre was 224 km south west of Karratha, i.e. approximately 300 km SW from NRB, see Figure 8c. Another insert pile hole was left open for 3 weeks prior to grouting because the installation vessel was forced to sail away to avoid a tropical cyclone (Figure 8c). It was never intended to leave these insert holes open for such a long time and before resuming the grouting process the holes were checked and no collapse was found. The grouting jobs were performed thereafter without any problems.
A slight grout underage was measured in two of the insert piles (i.e. the actual grouted volume was less than that of theoretical calculations). Post installation engineering was undertaken and showed that the capacity of these two piles still met the Basis of Design (BOD) requirements. This was further verified and accepted by the verification body in 2013.
104 mCarbonate silty Sand to carbonate sandy muddy Silt
Insert Pile(D=2.18m)
Primary Pile (D=2.83m)
Mudline
Insert Hole(D=2.48m)
Insert grouted to primary between 104m to 116m
76 mWeekly cemented Calcarenite to very well cemented Calcarenite
a. Pile configuration (NTS) b. Insert piles + weld beads c. NRB, cyclone and earthquake epicentre
Figure 8: North Rankin B.
8 CLOSURE (2013) Figure 9 shows the Woodside operated NWS piled platforms as they are in 2013. Taking on board lessons learnt from previous installations resulted in competent piled foundations for these structures, which overcame earlier difficulties during installation. The geotechnical foundation design of axially loaded piles in carbonate soils has evolved significantly over the years since 1984 and with the specialist geotechnical support from Advanced Geomechanics (AG) supported by the University of Western Australia (UWA), Woodside has been part of this evolution story, keeping up with new developments and implementing them in their foundation assessments and designs. It is clear that piles in carbonate sediments are site-specific and that recipe-type foundation designs are not suitable. Ideally we monitor our platforms continuously and perform back analyses of platform foundation responses following severe cyclones so that further refinement of all our design tools can be achieved.
Woodside rolled out “the Woodside Compass” in 2012 to encapsulate the corporate values that it considers to be most important. The following values from the compass are identified: integrity, working together, respect, discipline, working sustainably and excellence. Table 1 uses this Compass to describe Woodside’s behaviour during the evolution of the NWS piled foundations.

PILED FOUNDATIONS ON THE NORTH WEST SHELF SENDERS et al.
Australian Geomechanics Vol 48 No 4 December 2013 159
NRA and NRB GWA Angel Pluto
Figure 9: Overview of all platforms.
Table 1: Values of the Woodside Compass
Values Generic statement NWS Piled Foundation
INTEGRITY We are open, honest and fair. We do what we say we will do. We have the courage to do the right thing.
Woodside has monitored the pile foundation installations and unexpected results during these installations were not ignored, but were properly addressed by detailed post-installation engineering and for NRA and GWA by costly foundation remediation.
WORKING TOGETHER
We are on the same team. We build long-term partnerships.
Woodside and all their joint venture partners have worked together on any of the challenges presented by these foundations. Following the NRA remediation, the NWS Project kept working together with the offshore geotechnical community and endorsed, for example the 1988 conference on Calcareous Sediments, which had 38 papers dedicated to the NRA foundation and helped to improve geotechnical foundation design in calcareous soils.
RESPECT We give everyone a fair go. We listen.
Many (national and international) geotechnical contractors had and have their own opinions about pile design in calcareous soils. Woodside has listened to and considered all of them.
DISCIPLINE We play by the rules. We set goals and we hold ourselves to account.
Woodside set criteria for their foundation capacity and when it was clear these could not be met, expensive remediation works were executed to meet the project requirements.
WORKING SUSTAINABLY
We are here for the long term. We look after each other, our communities and the environment. We keep each other safe.
As mentioned in ‘Discipline’, no compromises were made on foundation design criteria and therefore on the safety of everyone working on these platforms. Woodside personnel is supporting industry by being involved in the appropriate API and ISO committees to avoid similar problems in the future.
EXCELLENCE We achieve great results. We learn. We get better.
The design and installation of the NRB foundation in 2012, compared to the design and installation of NRA in 1984, is proof of the fact that we learn, we get better and we achieve great results.
9 ACKNOWLEDGEMENTS The authors wish to express their gratitude to the various reviewers, who all helped to improve the quality of this paper. Woodside is thanked for allowing this paper to be published, which hopefully allows the geotechnical community to get better by learning from the lessons learnt during the installation of these platforms.

PILED FOUNDATIONS ON THE NORTH WEST SHELF SENDERS et al.
Australian Geomechanics Vol 48 No 4 December 2013 160
10 REFERENCES API, Recommended Practice for Planning, Designing and Constructing Fixed Offshore Platforms – WSD (Working
Stress Design), American Petroleum Inst., Washington, RP2A-WSD 9th edition, 1977 Apthorpe, M., Cainozoic Depositional History of the North West Shelf, in Purcell, P.G. and R.R., (Eds), The North
West Shelf, Australia: Proceedings of Petroleum Exploration Society, Australia Symposium, Perth, 1988, p.55-84
Apthorpe, M., Garstone, J. and Turner, G.J., Depositional setting and regional geology of North Rankin ‘A’ foundation sediments, Proceedings of Engineering for Calcareous Sediments, Jewell & Khorshid (Eds), 1988, Balkema, Rotterdam, Vol 2, p. 357-366
Clark, A.R. and Walker, B.F., Proposed Scheme for the Classification and Nomenclature for use in Middle Eastern Sedimentary Rocks, 1977, Géotechnique Vol. 27, No.1
Erbrich, C.T., A new method for the design of laterally loaded anchor piles in soft rock, Proceedings of Annual Offshore Technology Conference, 2004, Houston, Paper OTC 16441
Erbrich, C.T., Barbosa-Cruz, E. and Barbour, R. Soil-pile interaction during extrusion of an initially deformed pile, Proceedings of Frontiers in Offshore Geotechnics II – Gourvenec & White (Eds), 2004, Taylor & Francis Group, London, p. 489-494
Haggerty, B.C. and Ripley, L., Modifications to North Rankin ‘A’ foundations, Proceedings of Engineering for Calcareous Sediments, Jewell & Khorshid (Eds), 1988, Balkema, Rotterdam, p. 747-773
Randolph, M.F., Evaluation of grouted insert pile performance, Proceedings of Engineering for Calcareous Sediments, Jewell & Khorshid (Eds), 1988, Balkema, Rotterdam, Vol 2, 617-626.
Randolph, M.F. and Jewell, R., Axial load transfer models for piles in calcareous soil, Proc. 12th Int. Conf. on Soil Mech. and Found. Eng., Rio de Janeiro, 1989, Vol 1, 479-484.
Randolph, M.F., Joer, H. A. and Khorsid M.S.., Field & laboratory data from pile load tests in calcareous soil, Proceedings of Annual Offshore Technology Conference, 1996, Houston, Paper OTC7992.
Randolph, M.F., Cyclic Interface Shearing in Sand and Cemented Soils and Application to Axial Response of Piles, Mechanical Behaviour of Soils Under Environmentally Induced Cyclic Loads, CISM Courses and Lectures, C. di Prisco et al. (Eds.)Volume 534, 2012, p. 481-528
Schlager, W., Sedimentology and Sequence Stratigraphy of Carbonate Rocks, Vrije Univeriteit / Earth and Life Sciences, Amsterdam, 2002
Woodside, http://www.woodside.com.au/About-Us/Profile/Pages/History.aspx, last visited on 12 February 2013

Australian Geomechanics Vol 48 No 4 December 2013 161
PERFORMANCE AND PREDICTION OF MARINE CLAY TREATED WITH VACUUM AND SURCHARGE CONSOLIDATION AT PORT OF BRISBANE
Buddhima Indraratna1, A.S. Balasubramaniam2, Harry Poulos3, Cholachat Rujikiatkamjorn4 and
Jayantha Ameratunga5 1Professor, Centre for Geomechanics and Railway Engineering, University of Wollongong, Wollongong, NSW 2522,
(corresponding author). E-mail: [email protected] 2Adjunct Professor, School of Civil Engineering Griffith University, Gold Coast, Queensland, Australia
3Senior Principal, Coffey Geotechnics, 8/12 Mars Road Lane Cove West NSW 2066 Australia 4Associate Professor, Centre for Geomechanics and Railway Engineering, University of Wollongong, Wollongong,
NSW 2522, Australia. 5Senior Principal, Coffey Geotechnics, 47 Doggett Street Newstead QLD 4006 Australia
ABSTRACT
During the past decade, the application of vacuum preloading for stabilising soft coastal clay and other low-lying estuarine soils has become popular in Australia. The cost-effectiveness is a major factor in most projects in view of the significantly reduced time for achieving a relatively high degree of consolidation. Due to an increase in trade activities at the Port of Brisbane, new facilities on Fisherman Islands at the mouth of the Brisbane River will be constructed on the new outer area (235 ha) adjacent to the existing port facilities via land reclamation. A vacuum assisted surcharge load and conventional surcharge scheme in conjunction with prefabricated vertical drains was selected to reduce the required consolidation time through the deeper subsoil layers. The performance of the combined vacuum and surcharge fill system and the construction of the embankment are described in this paper. A comparison of the performance of the vacuum combined surcharge loading system with a standard surcharge fill highlights the clear benefits of vacuum consolidation. Field monitoring data are presented to demonstrate how the embankment performed during construction. The paper also evaluates the relative performance of the two contrasting preloading systems (i.e. vacuum and non-vacuum system). An analytical solution for radial consolidation considering both time-dependent surcharge loading and vacuum pressure is proposed to predict the settlements and associated excess pore pressures of the soft Holocene clay deposits.
1 INTRODUCTION Coastal regions of Australia contain soft clays, which have unacceptable geotechnical properties such as, low shear strength and high compressibility. In the absence of suitable ground improvement, excessive differential settlement and lateral movement unfavourably affect the stability of buildings and port infrastructure built on such soft ground (Holtz et al., 1991, Indraratna and Redana, 2000). A system of vertical drains with a combined vacuum and surcharge preloading is an effective method for promoting radial flow, which accelerates soil consolidation. The behaviour of soft clay stabilized with vertical drains and vacuum pressure can now be predicted with acceptable accuracy due to significant progress that has been made in the past decade through rigorous analytical and numerical analysis. Mohamedelhassan and Shang (2002) proposed an analytical solution for one-dimensional consolidation with vacuum application. Indraratna et al. (2005) extended the unit cell radial consolidation theory for vacuum application with instantaneous loading considering the vacuum loss along the drain length.
The Port of Brisbane is Australia’s third largest container port located between the mouth of the Brisbane River and Fisherman Islands (Indraratna et al., 2011). With rapid growth in trading activities, a new outer area (235 ha) adjacent to the current port facilities is being reclaimed to maximise the available land, and to provide the additional berths suitable for cargo and container handling. In this area, the soil profile comprises a highly compressible clay layer over 30 m in thickness with an undrained shear strength of less than 15 kPa near the surface. The strength of the dredged mud used for reclamation has a much lower shear strength depending on the time of placement and the duration the capping material (surcharge) had been in place. Without surcharge preloading, it is determined that the consolidation will take more than 50 years with vertical settlements of 2.5-4.0 m expected under the required service loadings. Therefore, vacuum consolidation with prefabricated vertical drains (PVDs) was suggested to speed up the consolidation process and to limit horizontal deformation for the site located immediately adjacent to the Moreton Bay Marine Park (Austress Menard, 2008).
Chu et al. (2000) and Chai et al. (2005) discussed the application of the vacuum preloading combined with PVDs. In this method, the suction can propagate to a greater depth of the subsoil using the PVD system. Also, lengthy consolidation time due to stage construction can be minimized (Indraratna et al., 2005, Sathananthan et al., 2008). The
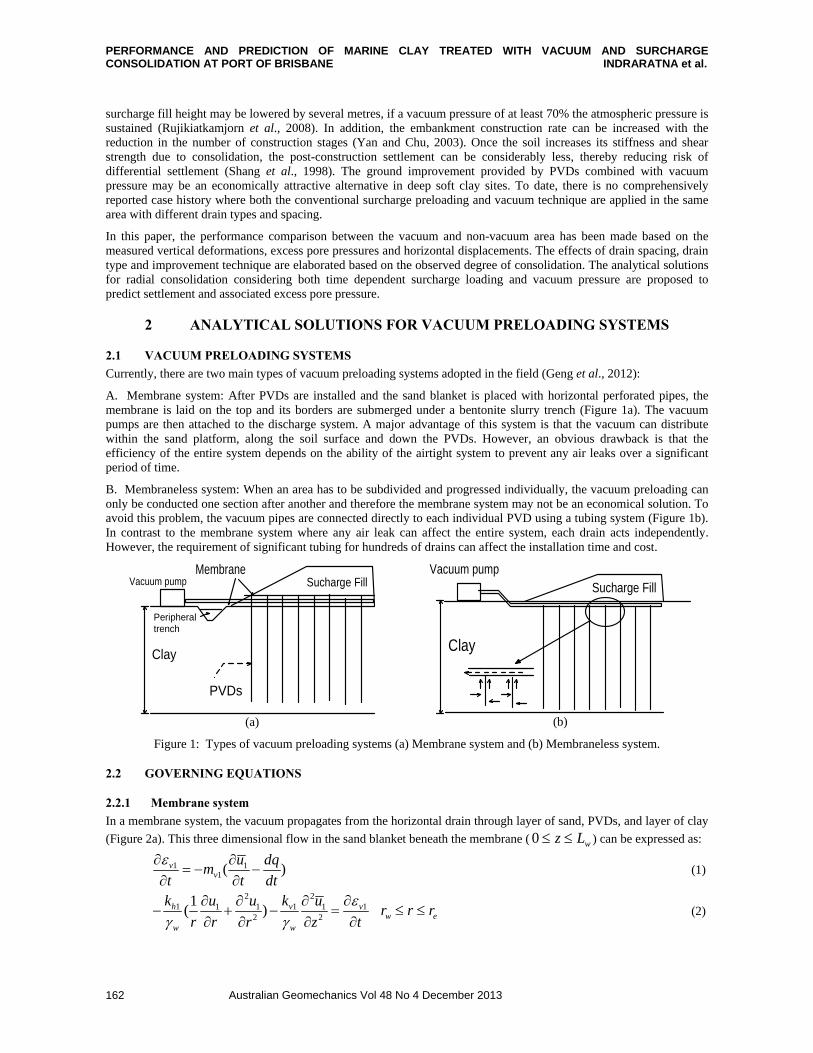
PERFORMANCE AND PREDICTION OF MARINE CLAY TREATED WITH VACUUM AND SURCHARGE CONSOLIDATION AT PORT OF BRISBANE INDRARATNA et al.
Australian Geomechanics Vol 48 No 4 December 2013 162
surcharge fill height may be lowered by several metres, if a vacuum pressure of at least 70% the atmospheric pressure is sustained (Rujikiatkamjorn et al., 2008). In addition, the embankment construction rate can be increased with the reduction in the number of construction stages (Yan and Chu, 2003). Once the soil increases its stiffness and shear strength due to consolidation, the post-construction settlement can be considerably less, thereby reducing risk of differential settlement (Shang et al., 1998). The ground improvement provided by PVDs combined with vacuum pressure may be an economically attractive alternative in deep soft clay sites. To date, there is no comprehensively reported case history where both the conventional surcharge preloading and vacuum technique are applied in the same area with different drain types and spacing.
In this paper, the performance comparison between the vacuum and non-vacuum area has been made based on the measured vertical deformations, excess pore pressures and horizontal displacements. The effects of drain spacing, drain type and improvement technique are elaborated based on the observed degree of consolidation. The analytical solutions for radial consolidation considering both time dependent surcharge loading and vacuum pressure are proposed to predict settlement and associated excess pore pressure.
2 ANALYTICAL SOLUTIONS FOR VACUUM PRELOADING SYSTEMS
2.1 VACUUM PRELOADING SYSTEMS
Currently, there are two main types of vacuum preloading systems adopted in the field (Geng et al., 2012):
A. Membrane system: After PVDs are installed and the sand blanket is placed with horizontal perforated pipes, the membrane is laid on the top and its borders are submerged under a bentonite slurry trench (Figure 1a). The vacuum pumps are then attached to the discharge system. A major advantage of this system is that the vacuum can distribute within the sand platform, along the soil surface and down the PVDs. However, an obvious drawback is that the efficiency of the entire system depends on the ability of the airtight system to prevent any air leaks over a significant period of time.
B. Membraneless system: When an area has to be subdivided and progressed individually, the vacuum preloading can only be conducted one section after another and therefore the membrane system may not be an economical solution. To avoid this problem, the vacuum pipes are connected directly to each individual PVD using a tubing system (Figure 1b). In contrast to the membrane system where any air leak can affect the entire system, each drain acts independently. However, the requirement of significant tubing for hundreds of drains can affect the installation time and cost.
Clay
Vacuum pumpMembrane
Sucharge Fill
Peripheral trench
PVDs
(a)
Clay
Vacuum pumpSucharge Fill
(b)
Figure 1: Types of vacuum preloading systems (a) Membrane system and (b) Membraneless system.
2.2 GOVERNING EQUATIONS
2.2.1 Membrane system
In a membrane system, the vacuum propagates from the horizontal drain through layer of sand, PVDs, and layer of clay
(Figure 2a). This three dimensional flow in the sand blanket beneath the membrane ( 0 wz L ) can be expressed as:
1 11( )v
v
u dqm
t t dt
(1)
2 2
1 1 11 1 12 2
1( )h v v
w w
k ku u u
r r r z t
w er r r (2)
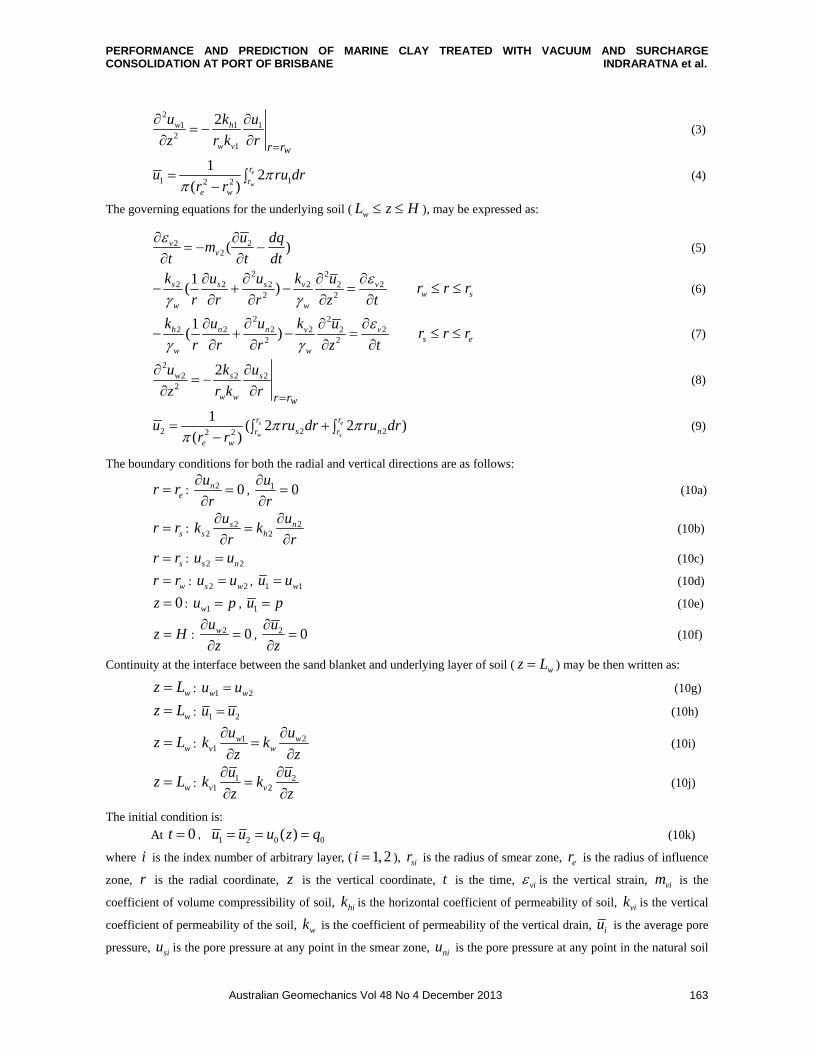
PERFORMANCE AND PREDICTION OF MARINE CLAY TREATED WITH VACUUM AND SURCHARGE CONSOLIDATION AT PORT OF BRISBANE INDRARATNA et al.
Australian Geomechanics Vol 48 No 4 December 2013 163
2
1 1 12
1
2w h
w v wr r
u k u
z r k r
(3)
1 12 2
12
( )e
w
r
re w
u ru drr r
(4)
The governing equations for the underlying soil ( wL z H ), may be expressed as:
2 22 ( )v
v
u dqm
t t dt
(5)
2 2
2 2 2 2 222 2
1( )s s s v v
w w
k u u k u
r r r z t
w sr r r (6)
2 2
2 2 2 2 222 2
1( )h n n v v
w w
k u u k u
r r r z t
s er r r (7)
2
2 2 22
2w s s
w w wr r
u k u
z r k r
(8)
2 2 22 2
1( 2 2 )
( )s e
w s
r rs nr r
e w
u ru dr ru drr r
(9)
The boundary conditions for both the radial and vertical directions are as follows:
er r : 2 0nu
r
, 1 0
u
r
(10a)
sr r : 2 22 2
s ns h
u uk k
r r
(10b)
sr r : 2 2s nu u (10c)
wr r : 2 2s wu u , 1 1wu u (10d)
0z : 1wu p , 1u p (10e)
z H : 2 0wu
z
, 2 0
u
z
(10f)
Continuity at the interface between the sand blanket and underlying layer of soil ( wz L ) may be then written as:
wz L : 1 2w wu u (10g)
wz L : 1 2u u (10h)
wz L : 1 21
w wv w
u uk k
z z
(10i)
wz L : 1 21 2v v
u uk k
z z
(10j)
The initial condition is:
At 0t , 1 2 0 0( )u u u z q (10k)
where i is the index number of arbitrary layer, ( 1,2i ), sir is the radius of smear zone, er is the radius of influence
zone, r is the radial coordinate, z is the vertical coordinate, t is the time, vi is the vertical strain, vim is the
coefficient of volume compressibility of soil, hik is the horizontal coefficient of permeability of soil, vik is the vertical
coefficient of permeability of the soil, wk is the coefficient of permeability of the vertical drain, iu is the average pore
pressure, siu is the pore pressure at any point in the smear zone, niu is the pore pressure at any point in the natural soil

PERFORMANCE AND PREDICTION OF MARINE CLAY TREATED WITH VACUUM AND SURCHARGE CONSOLIDATION AT PORT OF BRISBANE INDRARATNA et al.
Australian Geomechanics Vol 48 No 4 December 2013 164
zone, wiu is the excess pore water pressure within the vertical drain, q is the time-dependent surcharge preloading, 0q
is the initial value of preloading, wL is the thickness of the sand layer, H is the thickness of the whole layer (i.e., for
the membrane system, (both sand blanket and clay layer and for the membraneless system, only the clay layer), p is
the vacuum pressure.
2.2.2 Membraneless system
The main difference between a membrane system and a membraneless system are the boundary conditions. In the membraneless system a vacuum pump is connected directly to individual PVD’s through a system of horizontal pipes (Figure 2b). The governing equations and initial conditions of underlying soil improved by PVD’s are the same as for the membrane system (Eq. 10a)-Eq. 10d and Eq. 10k). In order to study the loss of vacuum, the vacuum pressure along the boundary of the drain was considered to vary linearly from p at the top of the drain to p at the bottom, where
is a ratio between the vacuum at the top and bottom of the drain. The value of varies between 0 and 1. If there is no
vacuum loss at the bottom of the PVDs 1, and if vacuum pressure is 0 at the bottom of the drain, 0.
The boundary conditions for a membraneless system are:
0z : wu p , 0u
z
(10m)
z H : 1wu
pz H
, 0
u
z
(10n)
The analytical solutions based on the above governing equations and boundary conditions are given in Appendix 1 for both membrane and membraneless systems.
/ 0u z
u p
( 1)1
zp
H
/ 0u z
/ 0u z
(a) (b)
Figure 2: Analysis schemes of unit cell with vertical drain: (a) membrane system and (b) membraneless system (Geng et al., 2012).
3 GENERAL DESCRIPTION OF EMBANKMENT CHARACTERISTICS AND SITE CONDITIONS
In 2003, the Port of Brisbane Corporation started to reclaim a sub-tidal land area of 235 ha at Fisherman Islands near the mouth of the Brisbane River (Figure 3). The reclaimed land is expected to provide additional berths and associated infrastructure to accommodate the future growth of the Port (Port of Brisbane Corporation, 2009). To compare the

PERFORMANCE AND PREDICTION OF MARINE CLAY TREATED WITH VACUUM AND SURCHARGE CONSOLIDATION AT PORT OF BRISBANE INDRARATNA et al.
Australian Geomechanics Vol 48 No 4 December 2013 165
performance of the vacuum system with the non-vacuum system (PVD and surcharge load), a trial area is shown in Figure 4. There were 3 contractors selected to carry out this trials. Each contractor was assigned an area of about 3 ha for the trial. The aim was to compare performance based on their design and construction work.
Contractor A had 8 trial areas in Area S3a, designated as WD1, WD2, WD3, WD4, WD5a, WD5b, VC 1 and VC 2. Areas WD1 to WD5a and WD5b had surcharge only, while VC1 and VC2 had surcharge and vacuum consolidation with membrane system.
Contractor B: Their trial area T11 consisted of seven areas. Five had surcharge and different drain types. Two had surcharge in conjunction with membraneless system.
Contractor C: Their trial area in T11 was subdivided into Areas 4, 5 and 6. Areas 4 and 5 had a surcharge period of a year, whereas Area 6 had a surcharge period of 0.5 years. Vertical drains with 1.4 m spacing were adopted in Areas 4 and 5 while Area 6 used vertical drains with a spacing of 1 m.
The upper Holocene sand underneath the dredged mud was about 2-3m thick, and overlaid the Holocene clay layer having a thickness from 6 m to 25 m. The highly compressible Holocene clay layer had a low shear strength and is generally referred to as PoB clay (Ameratunga et al., 2010). The Holocene layer overlies a Pleistocene deposit comprising of highly over-consolidated clay. Site investigations including cone penetration/piezocone tests, dissipation tests, boreholes, field vane shear tests and oedometer tests were carried out to assess the consolidation and stability design parameters. The soil profile and the corresponding soil properties are shown in Figure 5, where groundwater level is at +3.5m RL. The water contents of the soil layers were at or beyond their liquid limits. The field vane tests indicate that the undrained shear strength of the dredged mud and the Holocene clays varied from 5 kPa to 60 kPa. The compression index (Cc) varied from 0.1-1.0. The coefficient of consolidation in vertical direction (cv) was approximately the same as that in horizontal direction (ch) for the totally remoulded dredged mud layer, while cv/ch is about 2 for the Holocene clay layer.
Figure 3. Map of the proposed extension area at the Port of Brisbane (adopted from Port of Brisbane Corporation, 2009)
As the Holocene clay layer is quite thick, two preloading approaches were used to minimise the long term settlement including conventional surcharge preloading system and the vacuum consolidation system both applied to PVDs. Rigorous design specifications were considered for the design and construction of fill embankments and vacuum application over the soft Holocene deposits: (a) Service load of 15-25 kPa, (b) maximum residual settlement of not more than 250 mm over 20 years after the application of service load.
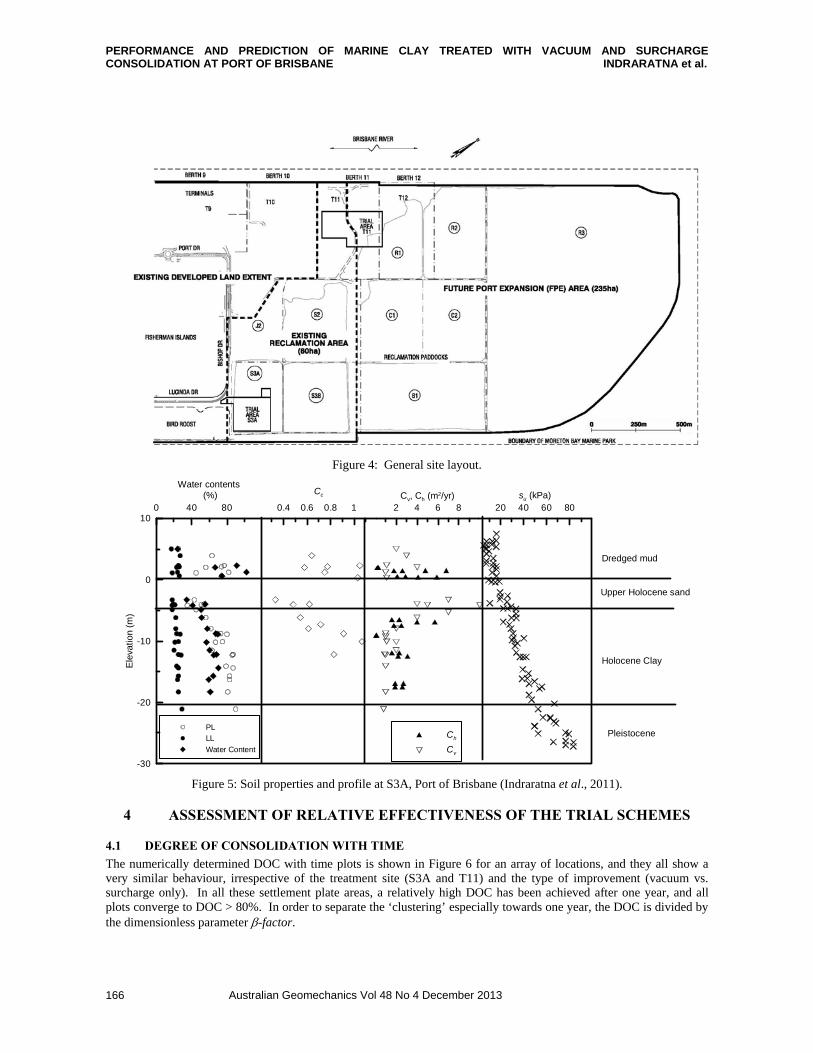
PERFORMANCE AND PREDICTION OF MARINE CLAY TREATED WITH VACUUM AND SURCHARGE CONSOLIDATION AT PORT OF BRISBANE INDRARATNA et al.
Australian Geomechanics Vol 48 No 4 December 2013 166
Figure 4: General site layout.
0 40 80
Water contents(%)
-30
-20
-10
0
10
Ele
vatio
n(m
)
PLLL
Water Content
0.4 0.6 0.8 1
Cc
2 4 6 8Cv, Ch (m2/yr)
Ch
Cv
20 40 60 80su (kPa)
Dredged mud
Upper Holocene sand
Holocene Clay
Pleistocene
Figure 5: Soil properties and profile at S3A, Port of Brisbane (Indraratna et al., 2011).
4 ASSESSMENT OF RELATIVE EFFECTIVENESS OF THE TRIAL SCHEMES
4.1 DEGREE OF CONSOLIDATION WITH TIME
The numerically determined DOC with time plots is shown in Figure 6 for an array of locations, and they all show a very similar behaviour, irrespective of the treatment site (S3A and T11) and the type of improvement (vacuum vs. surcharge only). In all these settlement plate areas, a relatively high DOC has been achieved after one year, and all plots converge to DOC > 80%. In order to separate the ‘clustering’ especially towards one year, the DOC is divided by the dimensionless parameter -factor.
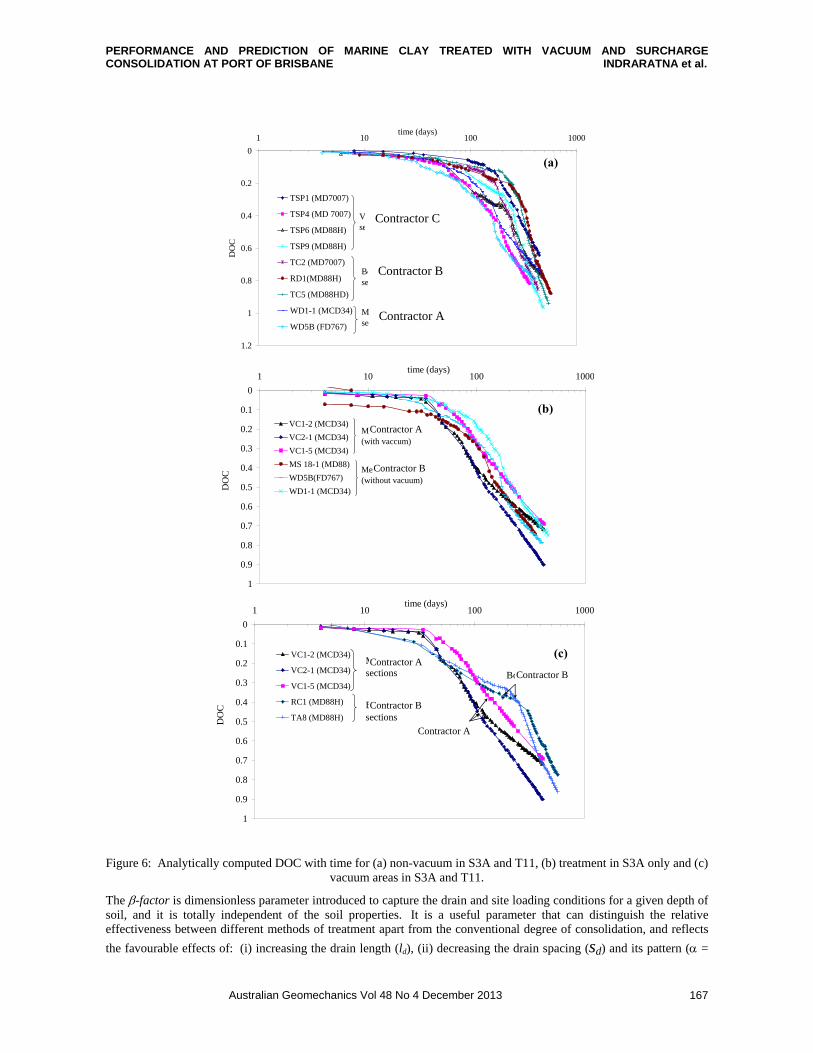
PERFORMANCE AND PREDICTION OF MARINE CLAY TREATED WITH VACUUM AND SURCHARGE CONSOLIDATION AT PORT OF BRISBANE INDRARATNA et al.
Australian Geomechanics Vol 48 No 4 December 2013 167
0
0.2
0.4
0.6
0.8
1
1.2
1 10 100 1000time (days)
DO
C
TSP1 (MD7007)
TSP4 (MD 7007)
TSP6 (MD88H)
TSP9 (MD88H)
TC2 (MD7007)
RD1(MD88H)
TC5 (MD88HD)
WD1-1 (MCD34)
WD5B (FD767)
Van Oord sections
Boskalis sections
Menard sections
0
0.1
0.2
0.3
0.4
0.5
0.6
0.7
0.8
0.9
1
1 10 100 1000time (days)
DO
C
VC1-2 (MCD34)
VC2-1 (MCD34)
VC1-5 (MCD34)
MS 18-1 (MD88)
WD5B(FD767)
WD1-1 (MCD34)
Menard sections (with vaccum)
Menard sections (without vacuum)
0
0.1
0.2
0.3
0.4
0.5
0.6
0.7
0.8
0.9
1
1 10 100 1000time (days)
DO
C
VC1-2 (MCD34)
VC2-1 (MCD34)
VC1-5 (MCD34)
RC1 (MD88H)
TA8 (MD88H)
Boskalis
Menard sections
Boskalissections
Menard
Figure 6: Analytically computed DOC with time for (a) non-vacuum in S3A and T11, (b) treatment in S3A only and (c) vacuum areas in S3A and T11.
The -factor is dimensionless parameter introduced to capture the drain and site loading conditions for a given depth of soil, and it is totally independent of the soil properties. It is a useful parameter that can distinguish the relative effectiveness between different methods of treatment apart from the conventional degree of consolidation, and reflects
the favourable effects of: (i) increasing the drain length (ld), (ii) decreasing the drain spacing (sd) and its pattern ( =
(b)
(a)
(c)
Contractor C
Contractor B
Contractor A
Contractor A
Contractor B
Contractor A
Contractor B
Contractor A
Contractor B
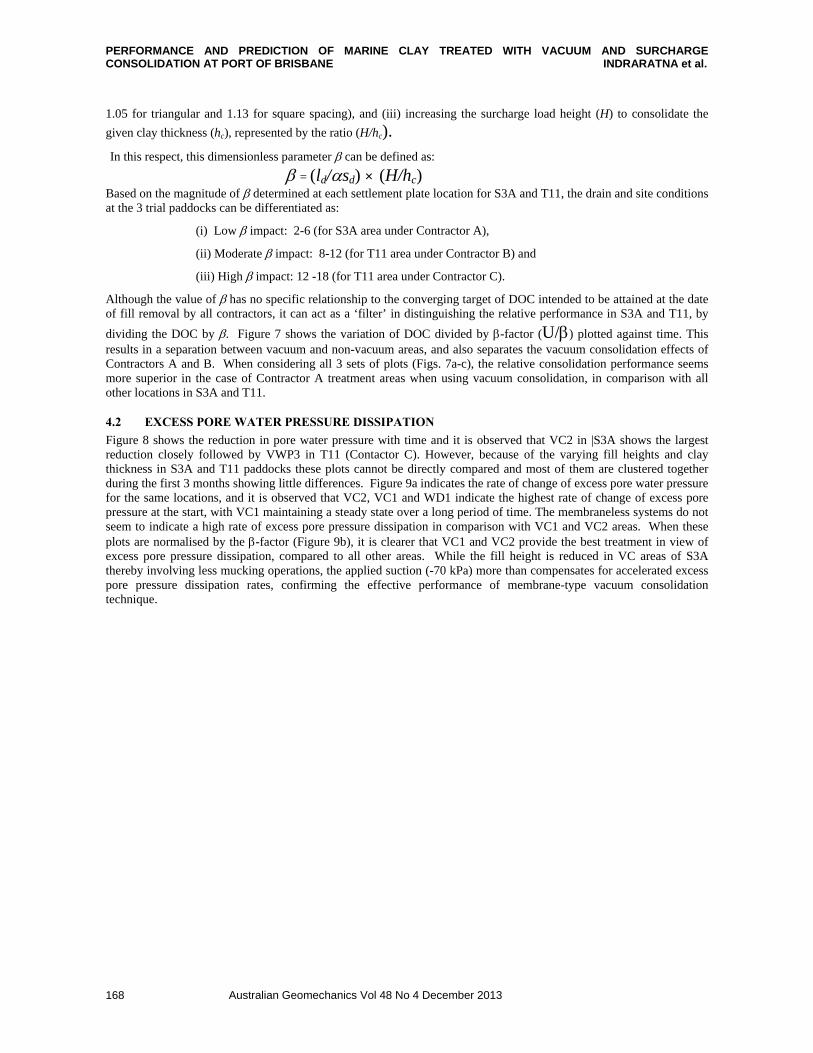
PERFORMANCE AND PREDICTION OF MARINE CLAY TREATED WITH VACUUM AND SURCHARGE CONSOLIDATION AT PORT OF BRISBANE INDRARATNA et al.
Australian Geomechanics Vol 48 No 4 December 2013 168
1.05 for triangular and 1.13 for square spacing), and (iii) increasing the surcharge load height (H) to consolidate the
given clay thickness (hc), represented by the ratio (H/hc). In this respect, this dimensionless parameter can be defined as:
= (ld/sd) × (H/hc) Based on the magnitude of determined at each settlement plate location for S3A and T11, the drain and site conditions at the 3 trial paddocks can be differentiated as:
(i) Low impact: 2-6 (for S3A area under Contractor A),
(ii) Moderate impact: 8-12 (for T11 area under Contractor B) and
(iii) High impact: 12 -18 (for T11 area under Contractor C).
Although the value of has no specific relationship to the converging target of DOC intended to be attained at the date of fill removal by all contractors, it can act as a ‘filter’ in distinguishing the relative performance in S3A and T11, by
dividing the DOC by . Figure 7 shows the variation of DOC divided by -factor (U/) plotted against time. This results in a separation between vacuum and non-vacuum areas, and also separates the vacuum consolidation effects of Contractors A and B. When considering all 3 sets of plots (Figs. 7a-c), the relative consolidation performance seems more superior in the case of Contractor A treatment areas when using vacuum consolidation, in comparison with all other locations in S3A and T11.
4.2 EXCESS PORE WATER PRESSURE DISSIPATION
Figure 8 shows the reduction in pore water pressure with time and it is observed that VC2 in |S3A shows the largest reduction closely followed by VWP3 in T11 (Contactor C). However, because of the varying fill heights and clay thickness in S3A and T11 paddocks these plots cannot be directly compared and most of them are clustered together during the first 3 months showing little differences. Figure 9a indicates the rate of change of excess pore water pressure for the same locations, and it is observed that VC2, VC1 and WD1 indicate the highest rate of change of excess pore pressure at the start, with VC1 maintaining a steady state over a long period of time. The membraneless systems do not seem to indicate a high rate of excess pore pressure dissipation in comparison with VC1 and VC2 areas. When these plots are normalised by the -factor (Figure 9b), it is clearer that VC1 and VC2 provide the best treatment in view of excess pore pressure dissipation, compared to all other areas. While the fill height is reduced in VC areas of S3A thereby involving less mucking operations, the applied suction (-70 kPa) more than compensates for accelerated excess pore pressure dissipation rates, confirming the effective performance of membrane-type vacuum consolidation technique.
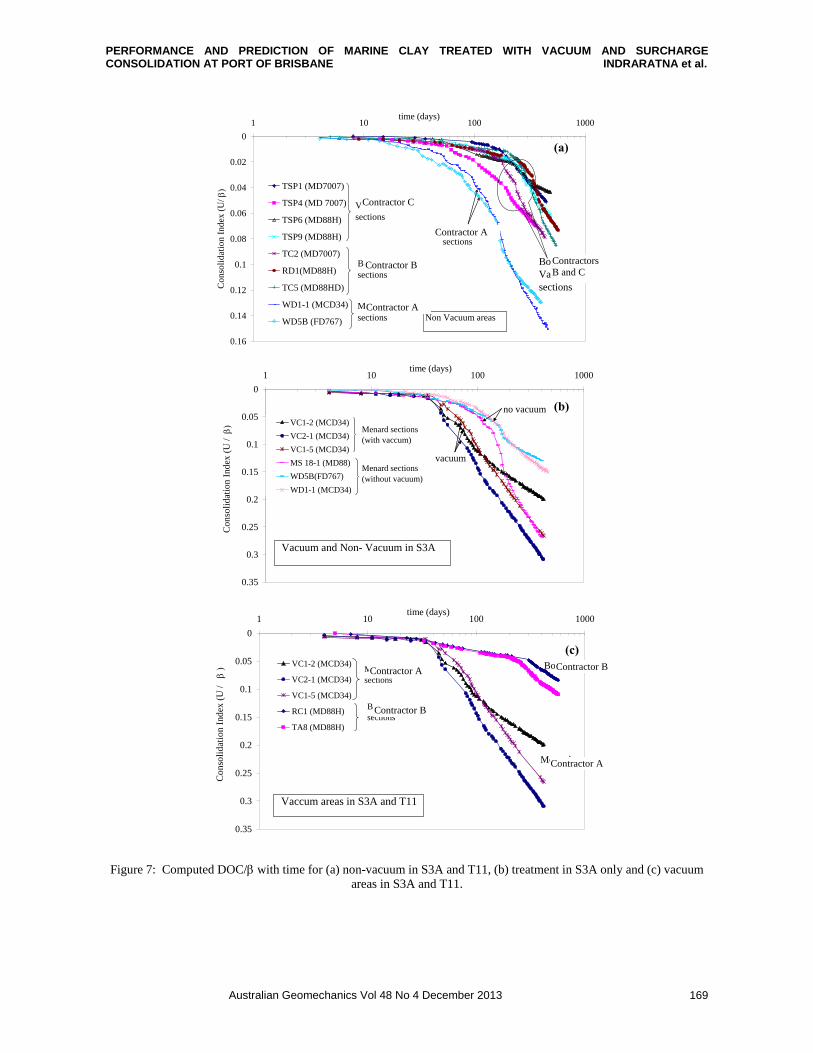
PERFORMANCE AND PREDICTION OF MARINE CLAY TREATED WITH VACUUM AND SURCHARGE CONSOLIDATION AT PORT OF BRISBANE INDRARATNA et al.
Australian Geomechanics Vol 48 No 4 December 2013 169
0
0.02
0.04
0.06
0.08
0.1
0.12
0.14
0.16
1 10 100 1000time (days)
Con
soli
dati
on I
ndex
(U
/ TSP1 (MD7007)
TSP4 (MD 7007)
TSP6 (MD88H)
TSP9 (MD88H)
TC2 (MD7007)
RD1(MD88H)
TC5 (MD88HD)
WD1-1 (MCD34)
WD5B (FD767)
Menard sections
Boskalis & Van Oord sections
Van Oord sections
Boskalis sections
Menard sections Non Vacuum areas
0
0.05
0.1
0.15
0.2
0.25
0.3
0.35
1 10 100 1000time (days)
Con
soli
dati
on I
ndex
(U
/ VC1-2 (MCD34)
VC2-1 (MCD34)
VC1-5 (MCD34)
MS 18-1 (MD88)
WD5B(FD767)
WD1-1 (MCD34)
Menard sections (with vaccum)
Menard sections (without vacuum)
vacuum
no vacuum
Vacuum and Non- Vacuum in S3A
0
0.05
0.1
0.15
0.2
0.25
0.3
0.35
1 10 100 1000time (days)
Con
soli
dati
on I
ndex
(U
/
VC1-2 (MCD34)
VC2-1 (MCD34)
VC1-5 (MCD34)
RC1 (MD88H)
TA8 (MD88H)
BoskalisMenard sections
Boskalissections
Menard
Vaccum areas in S3A and T11
Figure 7: Computed DOC/ with time for (a) non-vacuum in S3A and T11, (b) treatment in S3A only and (c) vacuum areas in S3A and T11.
(a)
(b)
(c)
Contractor A
Contractor A
Contractor B
Contractor C
Contractors B and C
Contractor A
Contractor A
Contractor B
Contractor B

PERFORMANCE AND PREDICTION OF MARINE CLAY TREATED WITH VACUUM AND SURCHARGE CONSOLIDATION AT PORT OF BRISBANE INDRARATNA et al.
Australian Geomechanics Vol 48 No 4 December 2013 170
0 100 200 300 400Time (t, days)
-80
-60
-40
-20
0
Tot
al c
hang
e in
po
re p
ress
ure
fro
m th
e fin
al s
tage
of c
ons
truc
tion
(u,
kP
a)
WD1
WD2
WD5
VC1
VC2
RC1
RD1
TA8
TC5
TC3
Section IV (VWP1)
Section V (VWP2)
Section VI (VWP3)
(a)
Figure 8: Reduction in Excess Pore Water Pressure with Time in S3A and T11 areas.
0 100 200 300 400Time (t, days)
-0.6
-0.4
-0.2
0
u/
t (k
Pa/
day)
(b)
0 100 200 300 400Time (t, days)
-0.25
-0.2
-0.15
-0.1
-0.05
0
u/
t/
(kP
a/d
ay)
(c)
Figure 9: Comparison of excess pore pressure dissipation between S3A and T11 (a) Rate of dissipation of Excess pore pressure, (b) Excess pore pressure dissipation rate normalised by
4.3 CONTROLLING THE LATERAL DISPLACEMENTS
It is well-known that the vertical drains have the advantage of reducing the lateral yield in soil and that the application of vacuum pressure further controls the lateral movement, and in some cases may even make the lateral movements go inwards rather than outwards (Indraratna et al., 1997, Indraratna et al., 2005). The use of vacuum pressure to attain strict control of lateral displacements will be very important in sensitive areas such as in the vicinity of marine parks. In this particular POB site, only very limited field data has been available from a few inclinometers. Nevertheless, in order to compare the lateral movements of selected vacuum and non-vacuum areas that have very different soil profile and surcharge load conditions, the lateral displacement can be divided by the applied effective stress at the same depth.
S3A-Contractor A
T11-Contractor B
T11-Contractor C

PERFORMANCE AND PREDICTION OF MARINE CLAY TREATED WITH VACUUM AND SURCHARGE CONSOLIDATION AT PORT OF BRISBANE INDRARATNA et al.
Australian Geomechanics Vol 48 No 4 December 2013 171
The normalised lateral displacement profiles with depth for the limited data sections are shown in Figure 10. These four plots clearly indicate that while vacuum consolidation is definitely beneficial for controlling the lateral movement, the Menard vacuum system with 70 kPa suction further demonstrates the most significant reduction in the normalised lateral displacement (i.e. compare VC1-MS28 with WD3-MS27). In the Membraneless vacuum system with 50 kPa suction, while a reduction in the lateral movement is definitely achieved (i.e. compare MS24 with MS34), the amount of this reduction is not as significant as that of Membrane system. The shape of the lateral displacement curves suggest that in all VC areas the suction head propagates significantly with depth such that both the LHC and UHC layers are favourably influenced.
-30
-25
-20
-15
-10
-5
0
5
10
0 0.2 0.4 0.6 0.8 1 1.2 1.4 1.6 1.8Lateral Disp/Total applied effective stress (mm/kPa)
Dep
th (
m)
MS 24 (with surcharge)
MS 34 (with vaccum)
VC1/MS28 (with vaccum)
WD3/MS27 (with surcharge)
VC1/MS28(Menard)
MS 34(Boskalis)
WD3/MS27(Menard)
MS 24(Boskalis
Figure 10: Role of Vacuum Consolidation on Lateral Displacement.
4.4 RESIDUAL SETTLEMENTS (RS)
All contractors have efficiently controlled the residual settlements, either to be less than 150 mm or 250 mm depending on the clay thickness and anticipated service loads in the respective areas. In Figure 11, the values of RS for both S3A and T11 paddocks are calculated plotted with the -factor based on methods provided by Terzaghi et al., (1996); Yin and Graham, (1994) and the observations suggest that the critical RS occurs in the range 4 < <16. In this critical zone, that includes locations from all 3 contractors from both S3A and T11 paddocks, the RS are close to the permissible limits. At low values of < 4, the residual settlements are much smaller mainly because of vacuum consolidation. At very high values of >16 (T11), the RS tend to decrease mainly because of the high fill surcharge levels compared to the clay thickness (i.e. relatively high H/hc ratio).
Contractor A
Contractor A
Contractor B
Contractor B
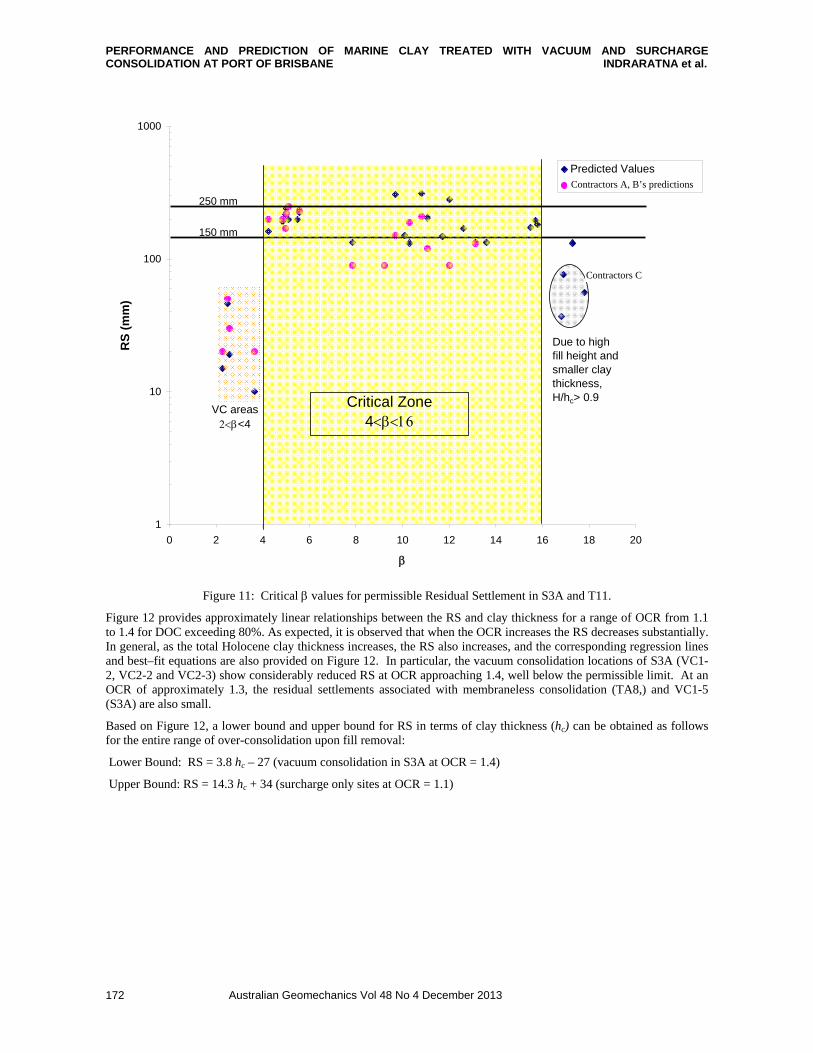
PERFORMANCE AND PREDICTION OF MARINE CLAY TREATED WITH VACUUM AND SURCHARGE CONSOLIDATION AT PORT OF BRISBANE INDRARATNA et al.
Australian Geomechanics Vol 48 No 4 December 2013 172
1
10
100
1000
0 2 4 6 8 10 12 14 16 18 20
RS
(m
m)
Predicted Values
Boskalis & Menard values
VC areas<4
Critical Zone4
150 mm
250 mm
Due to high fill height and smaller clay thickness, H/hc> 0.9
Figure 11: Critical values for permissible Residual Settlement in S3A and T11.
Figure 12 provides approximately linear relationships between the RS and clay thickness for a range of OCR from 1.1 to 1.4 for DOC exceeding 80%. As expected, it is observed that when the OCR increases the RS decreases substantially. In general, as the total Holocene clay thickness increases, the RS also increases, and the corresponding regression lines and best–fit equations are also provided on Figure 12. In particular, the vacuum consolidation locations of S3A (VC1-2, VC2-2 and VC2-3) show considerably reduced RS at OCR approaching 1.4, well below the permissible limit. At an OCR of approximately 1.3, the residual settlements associated with membraneless consolidation (TA8,) and VC1-5 (S3A) are also small.
Based on Figure 12, a lower bound and upper bound for RS in terms of clay thickness (hc) can be obtained as follows for the entire range of over-consolidation upon fill removal:
Lower Bound: RS = 3.8 hc – 27 (vacuum consolidation in S3A at OCR = 1.4)
Upper Bound: RS = 14.3 hc + 34 (surcharge only sites at OCR = 1.1)
Van Oord
Contractors A, B’s predictions
Contractors C
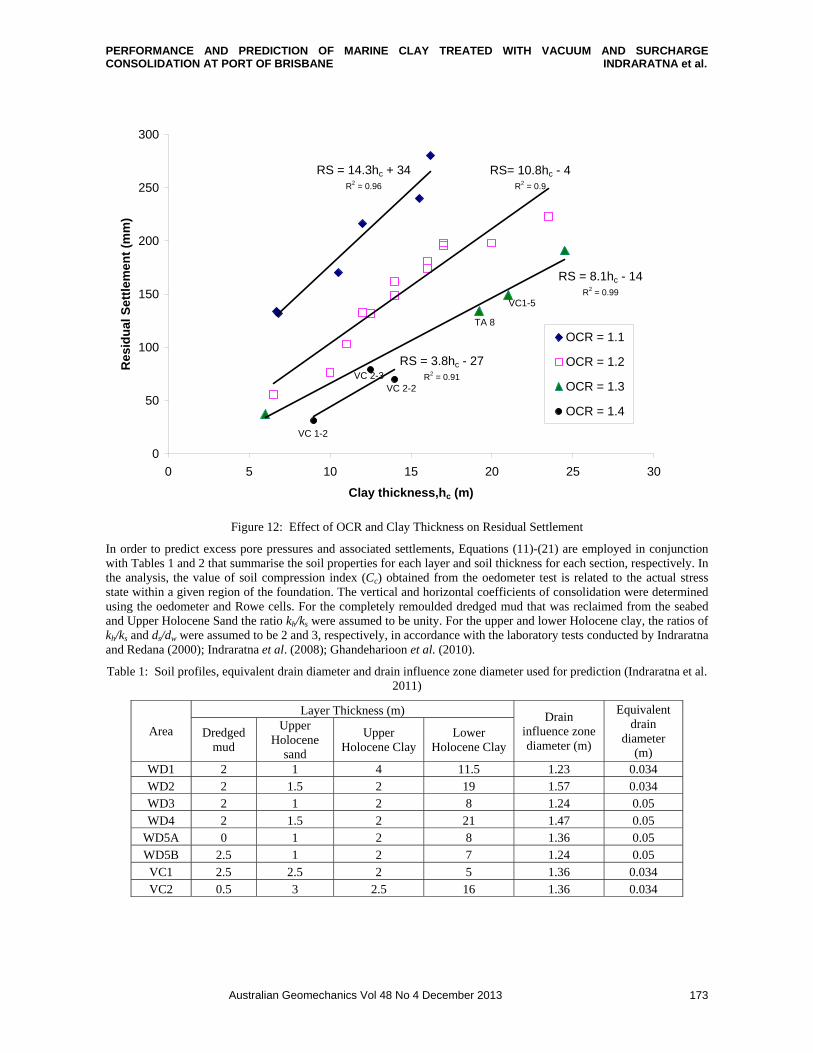
PERFORMANCE AND PREDICTION OF MARINE CLAY TREATED WITH VACUUM AND SURCHARGE CONSOLIDATION AT PORT OF BRISBANE INDRARATNA et al.
Australian Geomechanics Vol 48 No 4 December 2013 173
RS = 14.3hc + 34R2 = 0.96
RS= 10.8hc - 4R2 = 0.9
RS = 8.1hc - 14R2 = 0.99
RS = 3.8hc - 27R2 = 0.91
0
50
100
150
200
250
300
0 5 10 15 20 25 30
Clay thickness,hc (m)
Res
idu
al S
ettl
eme
nt
(mm
)
OCR = 1.1
OCR = 1.2
OCR = 1.3
OCR = 1.4
VC1-5
VC 2-3VC 2-2
VC 1-2
TA 8
Figure 12: Effect of OCR and Clay Thickness on Residual Settlement
In order to predict excess pore pressures and associated settlements, Equations (11)-(21) are employed in conjunction with Tables 1 and 2 that summarise the soil properties for each layer and soil thickness for each section, respectively. In the analysis, the value of soil compression index (Cc) obtained from the oedometer test is related to the actual stress state within a given region of the foundation. The vertical and horizontal coefficients of consolidation were determined using the oedometer and Rowe cells. For the completely remoulded dredged mud that was reclaimed from the seabed and Upper Holocene Sand the ratio kh/ks were assumed to be unity. For the upper and lower Holocene clay, the ratios of kh/ks and ds/dw were assumed to be 2 and 3, respectively, in accordance with the laboratory tests conducted by Indraratna and Redana (2000); Indraratna et al. (2008); Ghandeharioon et al. (2010).
Table 1: Soil profiles, equivalent drain diameter and drain influence zone diameter used for prediction (Indraratna et al. 2011)
Area
Layer Thickness (m) Drain influence zone diameter (m)
Equivalent drain
diameter (m)
Dredged mud
Upper Holocene
sand
Upper Holocene Clay
Lower Holocene Clay
WD1 2 1 4 11.5 1.23 0.034 WD2 2 1.5 2 19 1.57 0.034 WD3 2 1 2 8 1.24 0.05 WD4 2 1.5 2 21 1.47 0.05
WD5A 0 1 2 8 1.36 0.05 WD5B 2.5 1 2 7 1.24 0.05 VC1 2.5 2.5 2 5 1.36 0.034 VC2 0.5 3 2.5 16 1.36 0.034
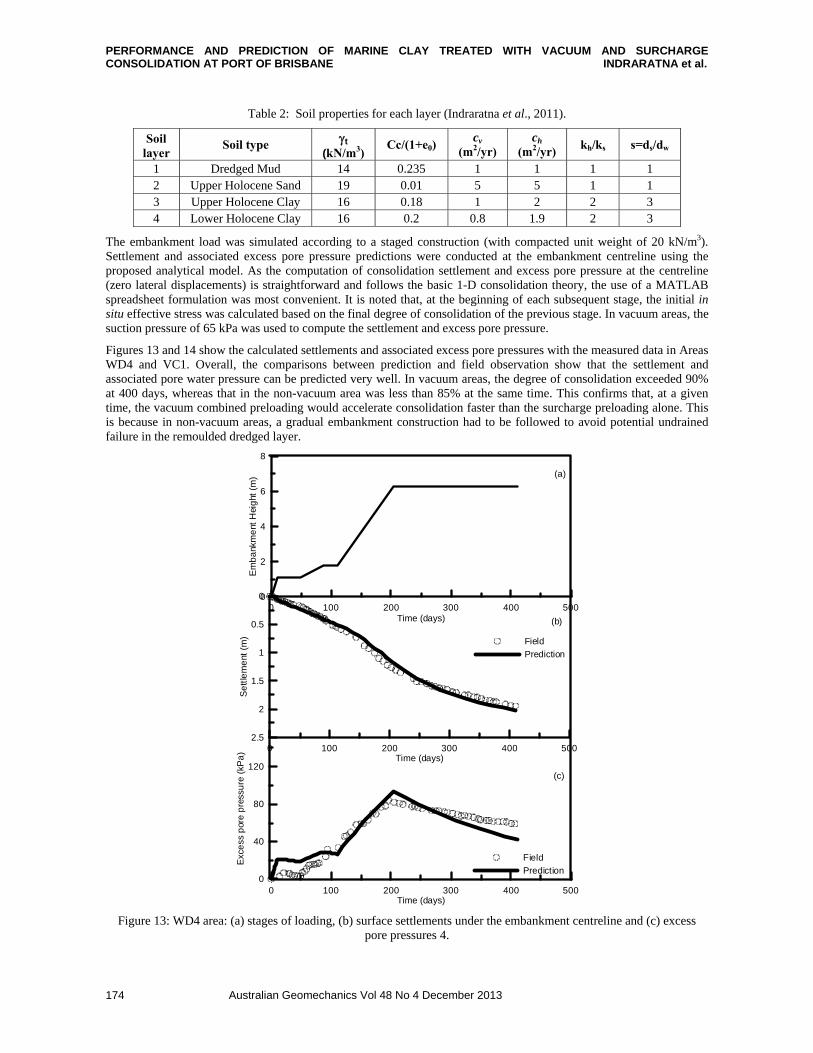
PERFORMANCE AND PREDICTION OF MARINE CLAY TREATED WITH VACUUM AND SURCHARGE CONSOLIDATION AT PORT OF BRISBANE INDRARATNA et al.
Australian Geomechanics Vol 48 No 4 December 2013 174
Table 2: Soil properties for each layer (Indraratna et al., 2011).
Soil layer
Soil type t (kN/m3) Cc/(1+e0)
cv
(m2/yr) ch
(m2/yr) kh/ks s=ds/dw
1 Dredged Mud 14 0.235 1 1 1 1 2 Upper Holocene Sand 19 0.01 5 5 1 1 3 Upper Holocene Clay 16 0.18 1 2 2 3 4 Lower Holocene Clay 16 0.2 0.8 1.9 2 3
The embankment load was simulated according to a staged construction (with compacted unit weight of 20 kN/m3). Settlement and associated excess pore pressure predictions were conducted at the embankment centreline using the proposed analytical model. As the computation of consolidation settlement and excess pore pressure at the centreline (zero lateral displacements) is straightforward and follows the basic 1-D consolidation theory, the use of a MATLAB spreadsheet formulation was most convenient. It is noted that, at the beginning of each subsequent stage, the initial in situ effective stress was calculated based on the final degree of consolidation of the previous stage. In vacuum areas, the suction pressure of 65 kPa was used to compute the settlement and excess pore pressure.
Figures 13 and 14 show the calculated settlements and associated excess pore pressures with the measured data in Areas WD4 and VC1. Overall, the comparisons between prediction and field observation show that the settlement and associated pore water pressure can be predicted very well. In vacuum areas, the degree of consolidation exceeded 90% at 400 days, whereas that in the non-vacuum area was less than 85% at the same time. This confirms that, at a given time, the vacuum combined preloading would accelerate consolidation faster than the surcharge preloading alone. This is because in non-vacuum areas, a gradual embankment construction had to be followed to avoid potential undrained failure in the remoulded dredged layer.
0 100 200 300 400 500Time (days)
0
2
4
6
8
Em
ba
nkm
ent
Hei
ght
(m)
0 100 200 300 400 500Time (days)
2.5
2
1.5
1
0.5
0
Se
ttle
me
nt(m
) Field
Prediction
0 100 200 300 400 500Time (days)
0
40
80
120
Exc
ess
por
ep
ress
ure
(kP
a)
Field
Prediction
(a)
(b)
(c)
Figure 13: WD4 area: (a) stages of loading, (b) surface settlements under the embankment centreline and (c) excess pore pressures 4.
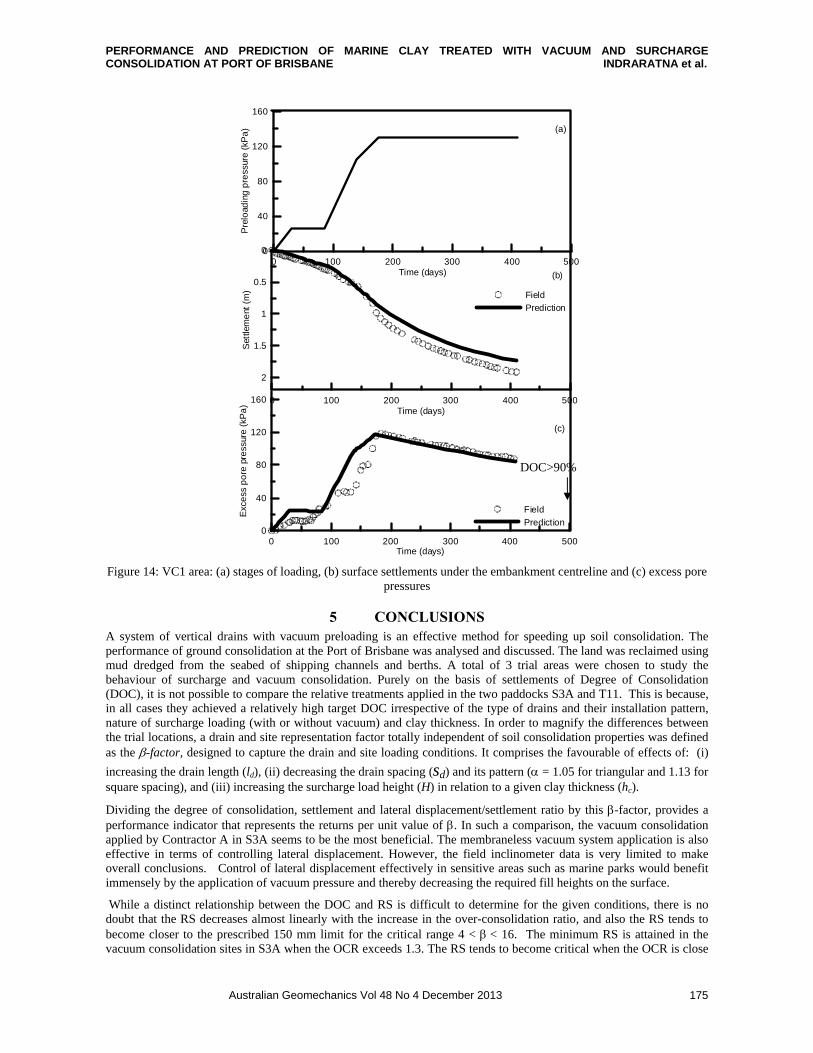
PERFORMANCE AND PREDICTION OF MARINE CLAY TREATED WITH VACUUM AND SURCHARGE CONSOLIDATION AT PORT OF BRISBANE INDRARATNA et al.
Australian Geomechanics Vol 48 No 4 December 2013 175
0 100 200 300 400 500Time (days)
0
40
80
120
160
Pre
load
ing
pre
ssur
e(k
Pa
)
0 100 200 300 400 500Time (days)
2
1.5
1
0.5
0S
ettle
me
nt(m
) Field
Prediction
0 100 200 300 400 500Time (days)
0
40
80
120
160
Exc
ess
po
repr
ess
ure
(kP
a)
Field
Prediction
(a)
(b)
(c)
Figure 14: VC1 area: (a) stages of loading, (b) surface settlements under the embankment centreline and (c) excess pore pressures
5 CONCLUSIONS A system of vertical drains with vacuum preloading is an effective method for speeding up soil consolidation. The performance of ground consolidation at the Port of Brisbane was analysed and discussed. The land was reclaimed using mud dredged from the seabed of shipping channels and berths. A total of 3 trial areas were chosen to study the behaviour of surcharge and vacuum consolidation. Purely on the basis of settlements of Degree of Consolidation (DOC), it is not possible to compare the relative treatments applied in the two paddocks S3A and T11. This is because, in all cases they achieved a relatively high target DOC irrespective of the type of drains and their installation pattern, nature of surcharge loading (with or without vacuum) and clay thickness. In order to magnify the differences between the trial locations, a drain and site representation factor totally independent of soil consolidation properties was defined as the -factor, designed to capture the drain and site loading conditions. It comprises the favourable of effects of: (i)
increasing the drain length (ld), (ii) decreasing the drain spacing (sd) and its pattern ( = 1.05 for triangular and 1.13 for square spacing), and (iii) increasing the surcharge load height (H) in relation to a given clay thickness (hc). Dividing the degree of consolidation, settlement and lateral displacement/settlement ratio by this -factor, provides a performance indicator that represents the returns per unit value of . In such a comparison, the vacuum consolidation applied by Contractor A in S3A seems to be the most beneficial. The membraneless vacuum system application is also effective in terms of controlling lateral displacement. However, the field inclinometer data is very limited to make overall conclusions. Control of lateral displacement effectively in sensitive areas such as marine parks would benefit immensely by the application of vacuum pressure and thereby decreasing the required fill heights on the surface.
While a distinct relationship between the DOC and RS is difficult to determine for the given conditions, there is no doubt that the RS decreases almost linearly with the increase in the over-consolidation ratio, and also the RS tends to become closer to the prescribed 150 mm limit for the critical range 4 < < 16. The minimum RS is attained in the vacuum consolidation sites in S3A when the OCR exceeds 1.3. The RS tends to become critical when the OCR is close
DOC>90%
PERFORMANCE AND PREDICTION OF MARINE CLAY TREATED WITH VACUUM AND SURCHARGE CONSOLIDATION AT PORT OF BRISBANE INDRARATNA et al.
Australian Geomechanics Vol 48 No 4 December 2013 176
to or less than 1.1, and this situation mainly occurs for surcharge only sites with large clay thickness, where the treatment is not as effective as when vacuum pressure is applied. It verifies that a large surcharge fill height becomes necessary in the absence of vacuum pressure in order to keep the RS less than the prescribed limit, and the need to remove a large amount of fill in order to achieve a significant OCR can be a cumbersome process in the field. The higher the service load, the greater will be the advantage of vacuum application as a means of reducing the need for excessive fill heights as well as lateral displacement control. In view of stringent residual settlement and lateral displacement control plan, the application of sufficiently high vacuum pressure in tandem with some surcharge fill to achieve a relatively high DOC (i.e. > 85%) and subsequent unloading for attaining an OCR > 1.3 would be the optimum choice for the site characteristics and loading conditions encountered here.
The unit cell theory considering time-dependent surcharge load and vacuum application was developed to predict the settlement and the associated excess pore pressure, which were shown to be in good agreement with the field measurements. At 400 days, the degree of consolidation in the vacuum areas is much greater than the non-vacuum areas for the same total stress applied at the surface. The system of PVDs subjected to vacuum combined surcharge preloading is a useful method for accelerating the radial consolidation and for controlling the lateral displacement. While the analytical model discussed here is a useful tool to predict the performance of soft clay stabilized by PVDs, the accurate modelling of pressure preloading requires field observation to examine the correct vacuum pressure distribution, as the fluctuation of suction with time and with depth has not been uncommon in numerous case studies.
6 ACKNOWLEDGEMENTS Writers acknowledge the support of the Port of Brisbane Corporation, Coffey Geotechnics and Austress Menard. The research funding from the Australia Research Council and Australia, Centre of Excellence for Geotechnical Science and Engineering is acknowledged. The assistance of Prof. A.S. Balasubramaniam of Griffith University, Daniel Berthier of Austress Menard Bachy, Prof Harry Poulos, Cynthia De Bok, Tine Birkemose and Chamari Bamunawita of Coffey Geotechnics is appreciated. More elaborate details of the contents discussed in the paper can also be found in previous publications of the first Author and his research students in ASCE and Canadian Geotechnical Journals, since the mid 1990’s. Valuable comments from A/Prof Hadi Khabbaz of UTS are greatly appreciated.
7 REFERENCES Ameratunga, J., Boyle, P., De Bok, C. and Bamunawita, C. (2010). Port of Brisbane (PoB) Clay Characteristics and Use
of Wick Drains to Improve Deep Soft Clay Deposits. Proceedings 17th Asian Geotechnical Conference, Taipei, Vol I, pp 116-119.
Austress Menard (2008). Personal communication internal report and confidential, 79p. Berthier, D., Boyle, P., Ameratunga, J., De Bok, C. and Vincent, P. (2009). A successful trial of vacuum consolidation
at in the Port of Brisbane. PIANC 2009, Christchurch, New Zealand (in CD). Chai, J.C., Carter, J.P., and Hayashi, S. (2005). Ground deformation induced by vacuum consolidation. Journal of
Geotechnical and Geoenvironmental Engineering, 131(12):1552-1561. Chu, J. Yan, S.W., and Yang, H. 2000. Soil improvement by the vacuum preloading method for an oil storage station.
Geotechnique, 50(6): 625-632. Geng, X. Y., Indraratna, B. and Rujikiatkamjorn, C. (2012). Analytical solutions for a single vertical drain with vacuum
and time-dependent surcharge preloading in membrane and membraneless systems. International Journal of Geomechanics, ASCE, 12(1), 27-42.
Ghandeharioon, A., Indraratna, B., and Rujikiatkamjorn, C. (2010). Analysis of soil disturbance associated with mandrel-driven prefabricated vertical drains using an elliptical cavity expansion theory. International Journal of Geomechanics, ASCE. 10(2), 53-64.
Holtz, R. D., Jamiolkowski, M., Lancellotta, R. and Pedroni, S. (1991). Prefabricated vertical drains: design and performance. CIRIA ground engineering report: ground improvement. Butterworth-Heinemann Ltd, UK, 131.
Indraratna, B. and Redana, I. W. (2000). Numerical modeling of vertical drains with smear and well resistance installed in soft clay. Canadian Geotechnical Journal, 37: 132-145.
Indraratna, B., Balasubramaniam, A.S. and Sivaneswaran (1997). Analysis of Settlements and Lateral Deformation of Soft Clay Foundation beneath Two Embankments. International Journal of Numerical and Analytical Methods in Geomechanics, 31(9): 599-618.
Indraratna, B., Sathananthan, I., Rujikiatkamjorn C. and Balasubramaniam, A. S. (2005). Analytical and numerical modelling of soft soil stabilized by PVD incorporating vacuum preloading. International Journal of Geomechanics, 5(2). 114-124.
Indraratna, B., Aljorany, A., and Rujikiatkamjorn C., (2008). Analytical and Numerical Modelling of Consolidation by Sand Drains beneath a Circular Embankment. International Journal of Geomechanics, ASCE. 8(3), 199-206.
PERFORMANCE AND PREDICTION OF MARINE CLAY TREATED WITH VACUUM AND SURCHARGE CONSOLIDATION AT PORT OF BRISBANE INDRARATNA et al.
Australian Geomechanics Vol 48 No 4 December 2013 177
Indraratna, B., Rujikiatkamjorn, C., Ameratunga, J., and Boyle, P. (2011) Performance and Prediction of Vacuum Combined Surcharge Consolidation at Port of Brisbane. J. of Geotechnical & Geoenvironmental Engineering, ASCE, 137 (11), 1009-1018.
Mohamedelhassan, E., and Shang, J.Q. (2002). Vacuum and surcharge combined one-dimensional consolidation of clay soils. Can. Geotech. J. 39: 1126-1138.
Port of Brisbane Corporation (2009). Annual report 2008/2009, Port of Brisbane Corporation, Brisbane, Queensland, 92p.
Rujikiatkamjorn, C., Indraratna, B. and Chu, J. 2008. 2D and 3D numerical modeling of combined surcharge and vacuum preloading with vertical drains. International Journal of Geomechanics, 8(2): 144-156.
Sathananthan, I., Indraratna, B., and Rujikiatkamjorn C., (2008). The evaluation of smear zone extent surrounding mandrel driven vertical drains using the cavity expansion theory. International Journal of Geomechanics, ASCE. 8(6), 355-365.
Shang, J.Q., Tang, M., and Miao, Z. (1998). Vacuum preloading consolidation of reclaimed land: a case study. Canadian Geotechnical Journal, 35: 740-749.
Terzaghi, K., Peck, R. B. and Mesri, G., (1996) Soil Mechanics in Engineering Practice, 3rd Ed. Wiley-Interscience. Yan, S.W. and Chu, J. (2003). Soil improvement for a road using a vacuum preloading method. Ground Improvement,
7(4): 165-172. Yin, J.-H., and Graham, J. (1994). Equivalent times and one-dimensional elastic visco-plastic modelling of time-
dependent stress-strain behaviour of clays. Canadian Geotechnical Journal, 31: 42-52.

PERFORMANCE AND PREDICTION OF MARINE CLAY TREATED WITH VACUUM AND SURCHARGE CONSOLIDATION AT PORT OF BRISBANE INDRARATNA et al.
Australian Geomechanics Vol 48 No 4 December 2013 178
APPENDIX A: ANALYTICAL SOLUTIONS
A1 MEMBRANE SYSTEM
The pore water pressure within the vertical drain and the average pore water pressure for membrane system, which can be solved by considering the applicable boundary conditions and loading pattern (detailed derivations can be found in Appendix A), in the Laplace frequency domain are:
1 1 2 21 1 2 3 4
ˆˆ ( , ) ( )a Z a Z a Z a Zwu Z S X e X e X e X e Q S (11)
1 1 2 22 1 2 3 4
ˆˆ ( , ) ( )b Z b Z b Z b Zwu Z S Y e Y e Y e Y e Q S (12)
1 1 2 2
2 2 2 21 1 2 2
1 1 2 3 42 2 2 2
ˆˆ ( , ) (1 ) (1 ) (1 ) (1 ) ( )a Z a Z a Z a Za a a au Z S X e X e X e X e Q S
B B B B (13)
1 1 2 2
2 2 2 21 1 2 2
2 1 2 3 44 4 4 4
ˆˆ ( , ) (1 ) (1 ) (1 ) (1 ) ( )b Z b Z b Z b Zb b b bu Z S Y e Y e Y e Y e Q S
B B B B (14)
where,
2
1 2 1 2 2
1
( ) ( ) 4
2
B B B B BC C Ca
2
1 2 1 2 2
2
( ) ( ) 4
2
B B B B BC C Ca
2
3 4 3 4 41
( ) ( ) 4
2
B B B B Bb
2
3 4 3 4 42
( ) ( ) 4
2
B B B B Bb
2
3 22
SK h
n
By considering the boundary conditions (Equations10a-10f), the continuity conditions at the interface between the underlying soil and sand blanket (Equations 10g-10j), and the initial condition (Equation 10k), the following matrix can
be obtained to get iX and iY ( 1, 2,3, 4i ):
8 8T TP (15)
where 8 8 as Appendix A shows,
1 2 3 4 1 2 3 4X X X X Y Y Y Yψ , ˆˆ , 0, 0, 0, 0, 0, 0, 0P Q P
21 2
1 21
8
a
K hB
F n ,
2 22 2
2 21
8 1
a
h n KB
F n
,
23 2
3 22
8
a
K hB
F n ,
2 22 4
4 22
8 1
a
h n KB
F n
,
2
1 2 2 2
3 1 1(ln ) (1 )
4 1 1 4a
nF n
n n n
,
2 2 2
2 5 5 52 2 2 2 2
3 1 1(ln ln ) (1 )(1 ) (1 )
4 1 1 4 1 4a
n n m mF K m K K
m n n n n n
,
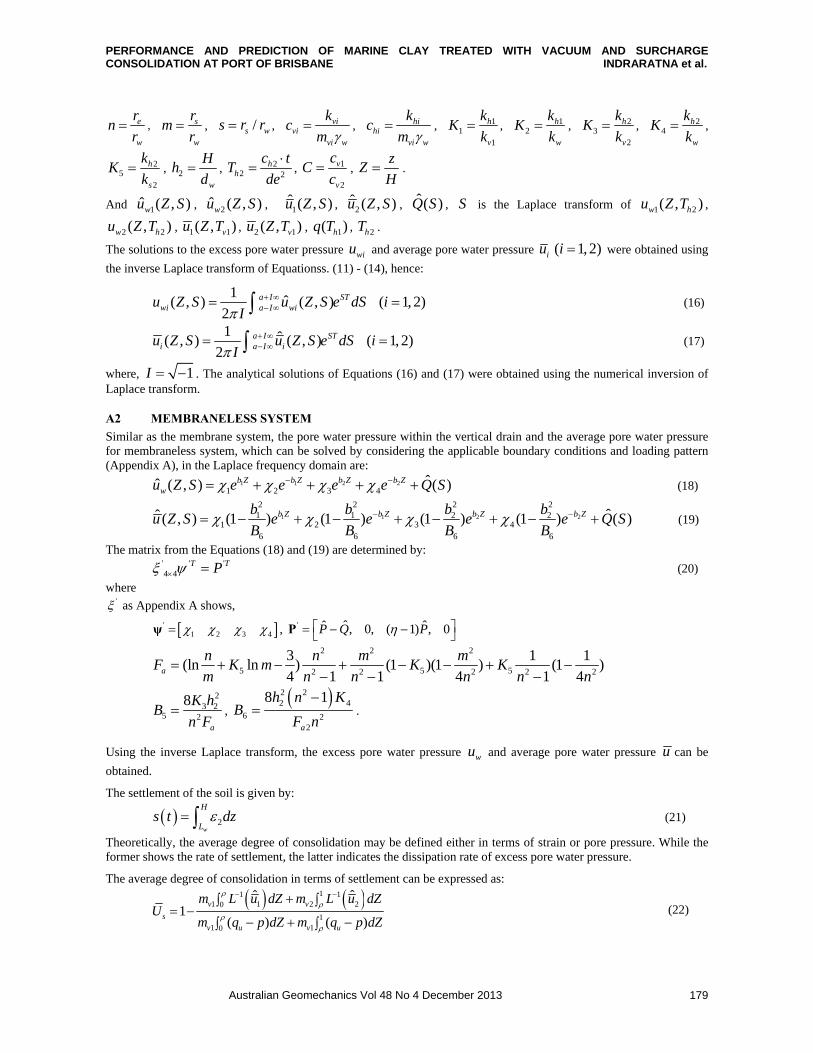
PERFORMANCE AND PREDICTION OF MARINE CLAY TREATED WITH VACUUM AND SURCHARGE CONSOLIDATION AT PORT OF BRISBANE INDRARATNA et al.
Australian Geomechanics Vol 48 No 4 December 2013 179
e
w
rn
r , s
w
rm
r , /s ws r r , vi
vivi w
kc
m , hi
hivi w
kc
m , 1
11
h
v
kK
k , 1
2h
w
kK
k , 2
32
h
v
kK
k , 2
4h
w
kK
k ,
25
2
h
s
kK
k , 2
w
Hh
d , 2
2 2h
h
c tT
de
, 1
2
v
v
cC
c ,
zZ
H .
And 1ˆ ( , )wu Z S , 2ˆ ( , )wu Z S , 1̂( , )u Z S , 2ˆ ( , )u Z S , ˆ ( )Q S , S is the Laplace transform of 1 2( , )w hu Z T ,
2 2( , )w hu Z T , 1 1( , )vu Z T , 2 1( , )vu Z T , 1( )hq T , 2hT .
The solutions to the excess pore water pressure wiu and average pore water pressure iu ( 1,2)i were obtained using
the inverse Laplace transform of Equationss. (11) - (14), hence:
1
ˆ( , ) ( , ) ( 1, 2)2
a I STwi a I wiu Z S u Z S e dS i
I (16)
1 ˆ( , ) ( , ) ( 1, 2)
2a I ST
i a I iu Z S u Z S e dS iI
(17)
where, 1I . The analytical solutions of Equations (16) and (17) were obtained using the numerical inversion of Laplace transform.
A2 MEMBRANELESS SYSTEM
Similar as the membrane system, the pore water pressure within the vertical drain and the average pore water pressure for membraneless system, which can be solved by considering the applicable boundary conditions and loading pattern (Appendix A), in the Laplace frequency domain are:
1 1 2 21 2 3 4
ˆˆ ( , ) ( )b Z b Z b Z b Zwu Z S e e e e Q S (18)
1 1 2 2
2 2 2 21 1 2 2
1 2 3 46 6 6 6
ˆˆ ( , ) (1 ) (1 ) (1 ) (1 ) ( )b Z b Z b Z b Zb b b bu Z S e e e e Q S
B B B B (19)
The matrix from the Equations (18) and (19) are determined by:
' ' '4 4
T TP (20)
where ' as Appendix A shows,
'1 2 3 4 ψ , ' ˆˆ ˆ, 0, ( 1) , 0P Q P P
2 2 2
5 5 52 2 2 2 2
3 1 1(ln ln ) (1 )(1 ) (1 )
4 1 1 4 1 4a
n n m mF K m K K
m n n n n n
2
3 25 2
8
a
K hB
n F ,
2 22 4
6 22
8 1
a
h n KB
F n
.
Using the inverse Laplace transform, the excess pore water pressure wu and average pore water pressure u can be
obtained.
The settlement of the soil is given by:
2w
H
Ls t dz (21)
Theoretically, the average degree of consolidation may be defined either in terms of strain or pore pressure. While the former shows the rate of settlement, the latter indicates the dissipation rate of excess pore water pressure.
The average degree of consolidation in terms of settlement can be expressed as:
11 1
1 1 2 20
11 10
ˆ ˆ1
( ) ( )
v v
s
v u v u
m L u dZ m L u dZU
m q p dZ m q p dZ
(22)

PERFORMANCE AND PREDICTION OF MARINE CLAY TREATED WITH VACUUM AND SURCHARGE CONSOLIDATION AT PORT OF BRISBANE INDRARATNA et al.
Australian Geomechanics Vol 48 No 4 December 2013 180
The average degree of consolidation may be defined in terms of effective stress (i.e. dissipation of excess pore water pressure) as:
11 1
1 20
1
0
ˆ ˆ1
( ) ( )p
u u
L u dZ L u dZU
q p dZ q p dZ
(23)
Australian Geomechanics Vol 48 No 4 December 2013 181
PILED CANTILEVER RETAINING WALL AT PORT HEDLAND – DRIVEABILITY AND WALL DEFLECTION
J. Thomas1, A.D. Berry2 and R.J.M. Terwijn3
1,2Principal Geotechnical Engineer, 3Principal Maritime Structures Engineer, WorleyParsons Services Pty Ltd, Perth, Australia
ABSTRACT
This paper describes the design, driveability and deflection monitoring results of a piled cantilever retaining wall at Port Hedland, Western Australia. The retaining wall was required to stabilise an existing access road and conveyor foundations to an existing wharf, prior to the dredging operations for a new export facility in the port. By designing the dredging profile (in front of the retaining wall) as an underwater batter, a cantilever retaining type structure made up of steel tubular piles was found to be feasible. The stability and deflection criteria requirements indicated that some of the retaining wall piles were required to be driven to a toe level of -30 mCD, penetrating through approximately 25 m thick very weak to medium strength rock. General experience of driving piles at Port Hedland area is that the piles are very likely to refuse on a 4 m thick medium strength Conglomerate rock layer starting at about -14 mCD. The piles equipped with external and internal shoe thickening were found to be easier to drive. Measured wall deflections were found to be lower than the initially predicted deflection due to difference in the as-built dredging profile and the assumed design dredging profile. The predicted wall deflection was found to be very similar to the measured deflection when a re-analysis was carried out considering the post dredging as-built batter slope profile. Data from static tension load test carried out on a 610 mm OD and a 1050 mm OD piles for wharfs near the retaining wall is also provided.
1 INTRODUCTION A piled retaining wall was required to stabilise the approach road and the conveyor foundations prior to dredging at a new export facility in the port of Port Hedland, Western Australia. Due to the level variations of the retained soil, the required steel tubular pile penetration toe levels vary from -8mCD (chart datum) to -30 mCD. The site soil condition consists of medium dense sand and very weak to medium strength rock. All the piles were required to be driven in to rock, in which some of the piles were required to be driven through approximately 25 m thick rock. A driveability assessment and general experience of driving piles with single shoe (internal thickening) at Port Hedland indicated that pile refusal is very likely on a 4 m thick medium strength Conglomerate rock, starting at about -14 mCD. If single-shoe piles were adopted, then the cost of constructing the retaining wall was assessed to be very high. This is because of the time and the associated pile barge related costs involved in drilling out the soil plug inside the piles prior to re-driving. Therefore, the piles were equipped with double shoe (internal and external thickening) to aid driving by reducing the internal and external shaft friction. Most of the piles equipped with double shoe were driven to target penetration without stopping. Adoption of double shoe greatly saved on the costs by reducing the barge/construction time and to help the completion of the retaining wall within schedule. Delay in the completion of the retaining wall would have caused delay in the starting of the dredging operations.
2 PROJECT DESCRIPTION
2.1 PROJECT BACKGROUND
A new wharf development in the Port of Port Hedland, Western Australia is located in close proximity to an existing causeway embankment. Associated dredging work for the new wharf’s berthing pocket would have caused instability to a part of this causeway embankment. To prevent this instability, a piled cantilever retaining wall was designed and constructed as shown in Figure 1. The retaining wall was required to be constructed under a very tight time schedule prior to the start of the wharf’s dredging operations.
The retaining wall construction started in June 2011 as shown in Figure 1a, followed by the dredging operations that were completed at the end of the first quarter of 2012. Since then, the new export wharf and berth has been constructed and is nearing completion at the time of writing this paper.
2.2 STRUCTURE DETAILS
The retaining wall is a free standing cantilever type wall and comprises steel tubular piles (1200 mm OD x 25 mm WT) at approximately 1400 mm centres, with pile lengths varying between 13 m and 37 m. The overall length of the retaining wall is approximately 175 m and consisted of a total of 125 piles. As shown in Figure 1b, the critical section
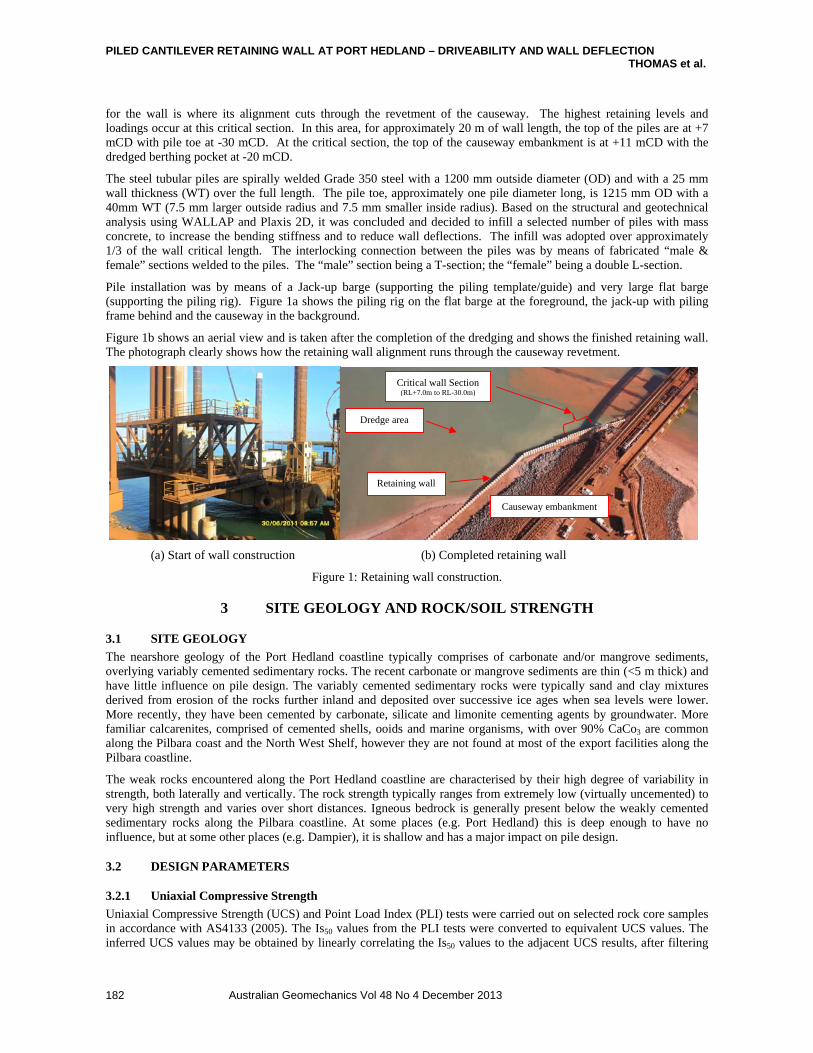
PILED CANTILEVER RETAINING WALL AT PORT HEDLAND – DRIVEABILITY AND WALL DEFLECTION THOMAS et al.
Australian Geomechanics Vol 48 No 4 December 2013 182
for the wall is where its alignment cuts through the revetment of the causeway. The highest retaining levels and loadings occur at this critical section. In this area, for approximately 20 m of wall length, the top of the piles are at +7 mCD with pile toe at -30 mCD. At the critical section, the top of the causeway embankment is at +11 mCD with the dredged berthing pocket at -20 mCD.
The steel tubular piles are spirally welded Grade 350 steel with a 1200 mm outside diameter (OD) and with a 25 mm wall thickness (WT) over the full length. The pile toe, approximately one pile diameter long, is 1215 mm OD with a 40mm WT (7.5 mm larger outside radius and 7.5 mm smaller inside radius). Based on the structural and geotechnical analysis using WALLAP and Plaxis 2D, it was concluded and decided to infill a selected number of piles with mass concrete, to increase the bending stiffness and to reduce wall deflections. The infill was adopted over approximately 1/3 of the wall critical length. The interlocking connection between the piles was by means of fabricated “male & female” sections welded to the piles. The “male” section being a T-section; the “female” being a double L-section.
Pile installation was by means of a Jack-up barge (supporting the piling template/guide) and very large flat barge (supporting the piling rig). Figure 1a shows the piling rig on the flat barge at the foreground, the jack-up with piling frame behind and the causeway in the background.
Figure 1b shows an aerial view and is taken after the completion of the dredging and shows the finished retaining wall. The photograph clearly shows how the retaining wall alignment runs through the causeway revetment.
(a) Start of wall construction (b) Completed retaining wall
Figure 1: Retaining wall construction.
3 SITE GEOLOGY AND ROCK/SOIL STRENGTH
3.1 SITE GEOLOGY
The nearshore geology of the Port Hedland coastline typically comprises of carbonate and/or mangrove sediments, overlying variably cemented sedimentary rocks. The recent carbonate or mangrove sediments are thin (<5 m thick) and have little influence on pile design. The variably cemented sedimentary rocks were typically sand and clay mixtures derived from erosion of the rocks further inland and deposited over successive ice ages when sea levels were lower. More recently, they have been cemented by carbonate, silicate and limonite cementing agents by groundwater. More familiar calcarenites, comprised of cemented shells, ooids and marine organisms, with over 90% CaCo3 are common along the Pilbara coast and the North West Shelf, however they are not found at most of the export facilities along the Pilbara coastline.
The weak rocks encountered along the Port Hedland coastline are characterised by their high degree of variability in strength, both laterally and vertically. The rock strength typically ranges from extremely low (virtually uncemented) to very high strength and varies over short distances. Igneous bedrock is generally present below the weakly cemented sedimentary rocks along the Pilbara coastline. At some places (e.g. Port Hedland) this is deep enough to have no influence, but at some other places (e.g. Dampier), it is shallow and has a major impact on pile design.
3.2 DESIGN PARAMETERS
3.2.1 Uniaxial Compressive Strength
Uniaxial Compressive Strength (UCS) and Point Load Index (PLI) tests were carried out on selected rock core samples in accordance with AS4133 (2005). The Is50 values from the PLI tests were converted to equivalent UCS values. The inferred UCS values may be obtained by linearly correlating the Is50 values to the adjacent UCS results, after filtering
Retaining wall
Causeway embankment
Critical wall Section (RL+7.0m to RL-30.0m)
Dredge area
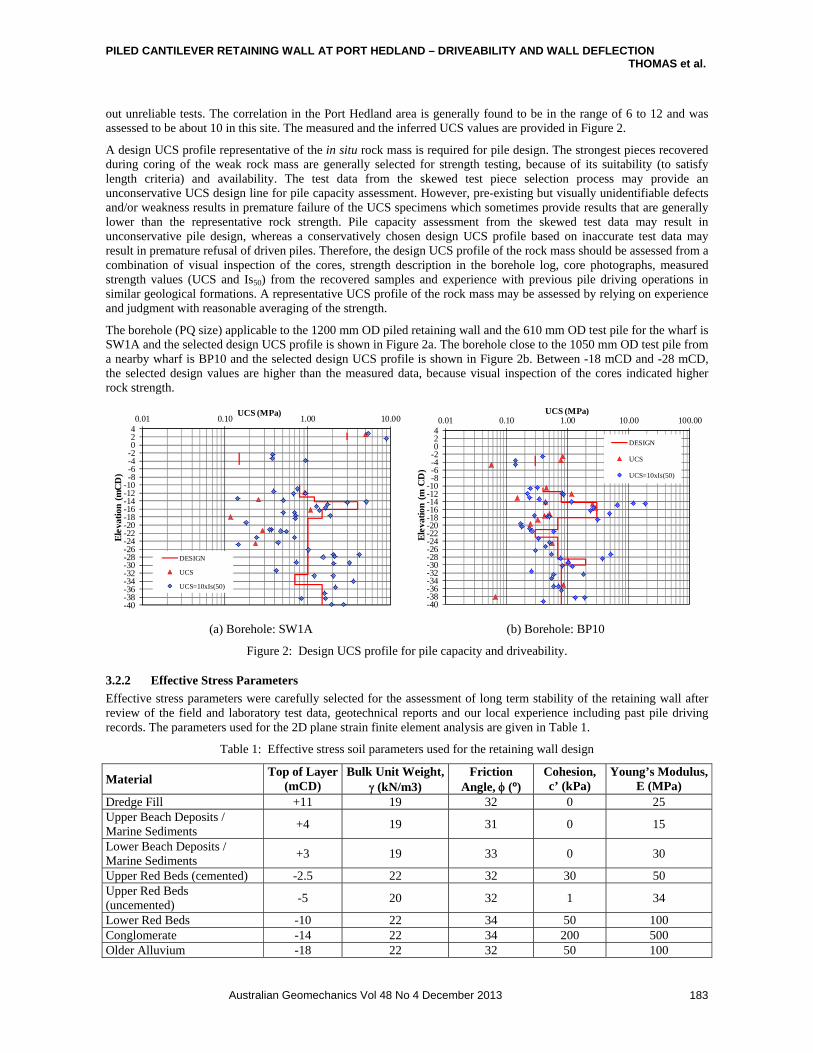
PILED CANTILEVER RETAINING WALL AT PORT HEDLAND – DRIVEABILITY AND WALL DEFLECTION THOMAS et al.
Australian Geomechanics Vol 48 No 4 December 2013 183
out unreliable tests. The correlation in the Port Hedland area is generally found to be in the range of 6 to 12 and was assessed to be about 10 in this site. The measured and the inferred UCS values are provided in Figure 2.
A design UCS profile representative of the in situ rock mass is required for pile design. The strongest pieces recovered during coring of the weak rock mass are generally selected for strength testing, because of its suitability (to satisfy length criteria) and availability. The test data from the skewed test piece selection process may provide an unconservative UCS design line for pile capacity assessment. However, pre-existing but visually unidentifiable defects and/or weakness results in premature failure of the UCS specimens which sometimes provide results that are generally lower than the representative rock strength. Pile capacity assessment from the skewed test data may result in unconservative pile design, whereas a conservatively chosen design UCS profile based on inaccurate test data may result in premature refusal of driven piles. Therefore, the design UCS profile of the rock mass should be assessed from a combination of visual inspection of the cores, strength description in the borehole log, core photographs, measured strength values (UCS and Is50) from the recovered samples and experience with previous pile driving operations in similar geological formations. A representative UCS profile of the rock mass may be assessed by relying on experience and judgment with reasonable averaging of the strength.
The borehole (PQ size) applicable to the 1200 mm OD piled retaining wall and the 610 mm OD test pile for the wharf is SW1A and the selected design UCS profile is shown in Figure 2a. The borehole close to the 1050 mm OD test pile from a nearby wharf is BP10 and the selected design UCS profile is shown in Figure 2b. Between -18 mCD and -28 mCD, the selected design values are higher than the measured data, because visual inspection of the cores indicated higher rock strength.
-40-38-36-34-32-30-28-26-24-22-20-18-16-14-12-10-8-6-4-20240.01 0.10 1.00 10.00
Ele
vati
on (
mC
D)
UCS (MPa)
DESIGN
UCS
UCS=10xIs(50)
-40-38-36-34-32-30-28-26-24-22-20-18-16-14-12-10-8-6-4-20240.01 0.10 1.00 10.00 100.00
Ele
vati
on (
m C
D)
UCS (MPa)
DESIGN
UCS
UCS=10xIs(50)
(a) Borehole: SW1A (b) Borehole: BP10
Figure 2: Design UCS profile for pile capacity and driveability.
3.2.2 Effective Stress Parameters
Effective stress parameters were carefully selected for the assessment of long term stability of the retaining wall after review of the field and laboratory test data, geotechnical reports and our local experience including past pile driving records. The parameters used for the 2D plane strain finite element analysis are given in Table 1.
Table 1: Effective stress soil parameters used for the retaining wall design
Material Top of Layer
(mCD) Bulk Unit Weight,
(kN/m3) Friction
Angle, (º) Cohesion, c’ (kPa)
Young’s Modulus, E (MPa)
Dredge Fill +11 19 32 0 25 Upper Beach Deposits / Marine Sediments
+4 19 31 0 15
Lower Beach Deposits / Marine Sediments
+3 19 33 0 30
Upper Red Beds (cemented) -2.5 22 32 30 50 Upper Red Beds (uncemented)
-5 20 32 1 34
Lower Red Beds -10 22 34 50 100 Conglomerate -14 22 34 200 500 Older Alluvium -18 22 32 50 100
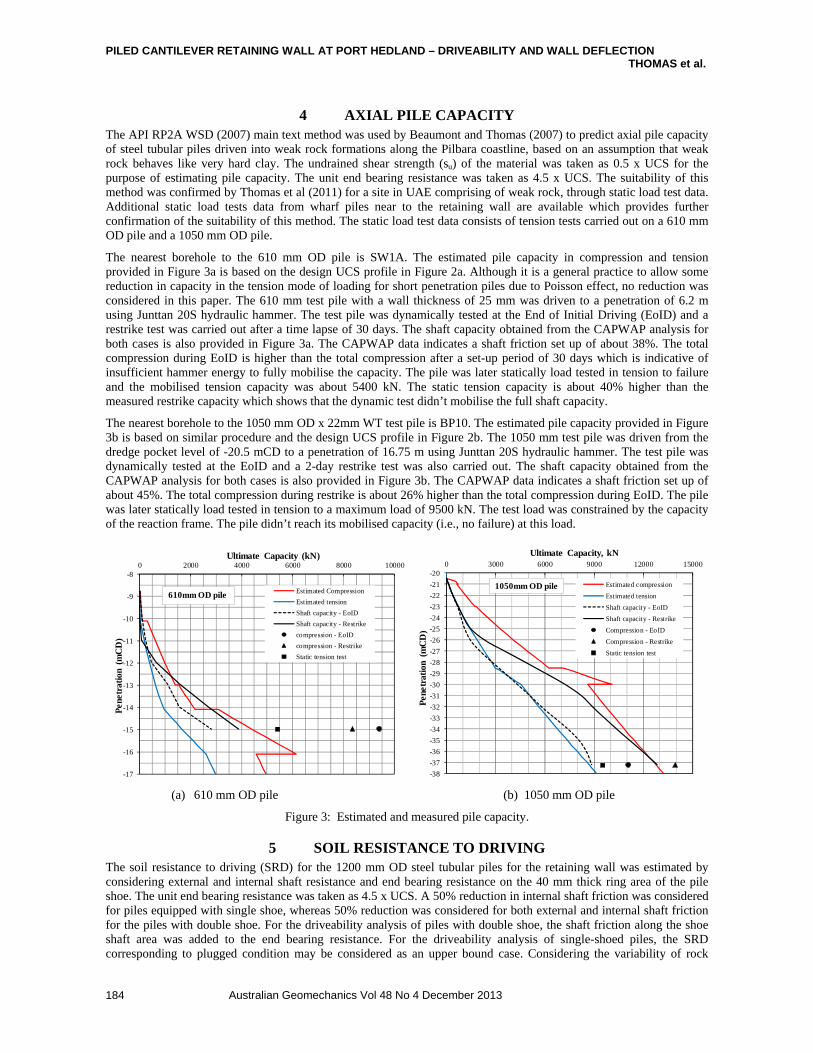
PILED CANTILEVER RETAINING WALL AT PORT HEDLAND – DRIVEABILITY AND WALL DEFLECTION THOMAS et al.
Australian Geomechanics Vol 48 No 4 December 2013 184
4 AXIAL PILE CAPACITY The API RP2A WSD (2007) main text method was used by Beaumont and Thomas (2007) to predict axial pile capacity of steel tubular piles driven into weak rock formations along the Pilbara coastline, based on an assumption that weak rock behaves like very hard clay. The undrained shear strength (su) of the material was taken as 0.5 x UCS for the purpose of estimating pile capacity. The unit end bearing resistance was taken as 4.5 x UCS. The suitability of this method was confirmed by Thomas et al (2011) for a site in UAE comprising of weak rock, through static load test data. Additional static load tests data from wharf piles near to the retaining wall are available which provides further confirmation of the suitability of this method. The static load test data consists of tension tests carried out on a 610 mm OD pile and a 1050 mm OD pile.
The nearest borehole to the 610 mm OD pile is SW1A. The estimated pile capacity in compression and tension provided in Figure 3a is based on the design UCS profile in Figure 2a. Although it is a general practice to allow some reduction in capacity in the tension mode of loading for short penetration piles due to Poisson effect, no reduction was considered in this paper. The 610 mm test pile with a wall thickness of 25 mm was driven to a penetration of 6.2 m using Junttan 20S hydraulic hammer. The test pile was dynamically tested at the End of Initial Driving (EoID) and a restrike test was carried out after a time lapse of 30 days. The shaft capacity obtained from the CAPWAP analysis for both cases is also provided in Figure 3a. The CAPWAP data indicates a shaft friction set up of about 38%. The total compression during EoID is higher than the total compression after a set-up period of 30 days which is indicative of insufficient hammer energy to fully mobilise the capacity. The pile was later statically load tested in tension to failure and the mobilised tension capacity was about 5400 kN. The static tension capacity is about 40% higher than the measured restrike capacity which shows that the dynamic test didn’t mobilise the full shaft capacity.
The nearest borehole to the 1050 mm OD x 22mm WT test pile is BP10. The estimated pile capacity provided in Figure 3b is based on similar procedure and the design UCS profile in Figure 2b. The 1050 mm test pile was driven from the dredge pocket level of -20.5 mCD to a penetration of 16.75 m using Junttan 20S hydraulic hammer. The test pile was dynamically tested at the EoID and a 2-day restrike test was also carried out. The shaft capacity obtained from the CAPWAP analysis for both cases is also provided in Figure 3b. The CAPWAP data indicates a shaft friction set up of about 45%. The total compression during restrike is about 26% higher than the total compression during EoID. The pile was later statically load tested in tension to a maximum load of 9500 kN. The test load was constrained by the capacity of the reaction frame. The pile didn’t reach its mobilised capacity (i.e., no failure) at this load.
-17
-16
-15
-14
-13
-12
-11
-10
-9
-80 2000 4000 6000 8000 10000
Pen
etra
tion
(m
CD
)
Ultimate Capacity (kN)
Estimated Compression
Estimated tension
Shaft capacity - EoID
Shaft capacity - Restrike
compression - EoID
compression - Restrike
Static tension test
610mm OD pile
-38
-37
-36
-35
-34
-33
-32
-31
-30
-29
-28
-27
-26
-25
-24
-23
-22
-21
-200 3000 6000 9000 12000 15000
Pen
etra
tion
(m
CD
)
Ultimate Capacity, kN
Estimated compression
Estimated tension
Shaft capacity - EoID
Shaft capacity - Restrike
Compression - EoID
Compression - Restrike
Static tension test
1050mm OD pile
(a) 610 mm OD pile (b) 1050 mm OD pile
Figure 3: Estimated and measured pile capacity.
5 SOIL RESISTANCE TO DRIVING The soil resistance to driving (SRD) for the 1200 mm OD steel tubular piles for the retaining wall was estimated by considering external and internal shaft resistance and end bearing resistance on the 40 mm thick ring area of the pile shoe. The unit end bearing resistance was taken as 4.5 x UCS. A 50% reduction in internal shaft friction was considered for piles equipped with single shoe, whereas 50% reduction was considered for both external and internal shaft friction for the piles with double shoe. For the driveability analysis of piles with double shoe, the shaft friction along the shoe shaft area was added to the end bearing resistance. For the driveability analysis of single-shoed piles, the SRD corresponding to plugged condition may be considered as an upper bound case. Considering the variability of rock
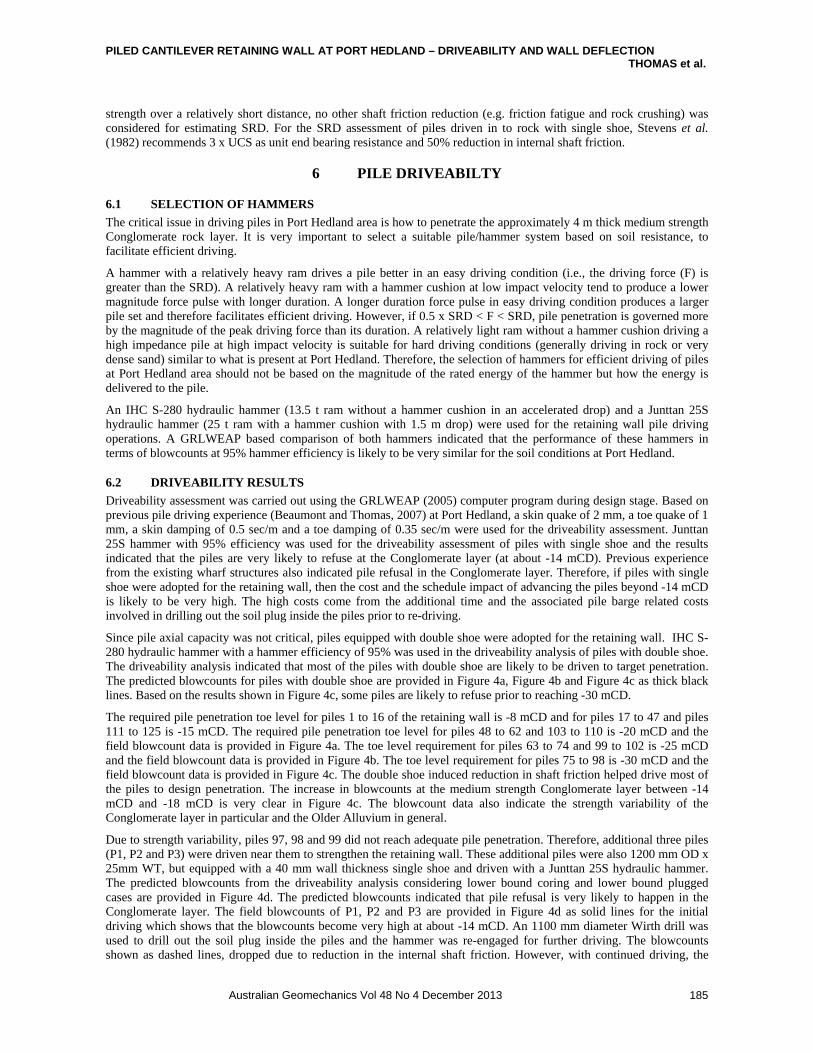
PILED CANTILEVER RETAINING WALL AT PORT HEDLAND – DRIVEABILITY AND WALL DEFLECTION THOMAS et al.
Australian Geomechanics Vol 48 No 4 December 2013 185
strength over a relatively short distance, no other shaft friction reduction (e.g. friction fatigue and rock crushing) was considered for estimating SRD. For the SRD assessment of piles driven in to rock with single shoe, Stevens et al. (1982) recommends 3 x UCS as unit end bearing resistance and 50% reduction in internal shaft friction.
6 PILE DRIVEABILTY
6.1 SELECTION OF HAMMERS
The critical issue in driving piles in Port Hedland area is how to penetrate the approximately 4 m thick medium strength Conglomerate rock layer. It is very important to select a suitable pile/hammer system based on soil resistance, to facilitate efficient driving.
A hammer with a relatively heavy ram drives a pile better in an easy driving condition (i.e., the driving force (F) is greater than the SRD). A relatively heavy ram with a hammer cushion at low impact velocity tend to produce a lower magnitude force pulse with longer duration. A longer duration force pulse in easy driving condition produces a larger pile set and therefore facilitates efficient driving. However, if 0.5 x SRD < F < SRD, pile penetration is governed more by the magnitude of the peak driving force than its duration. A relatively light ram without a hammer cushion driving a high impedance pile at high impact velocity is suitable for hard driving conditions (generally driving in rock or very dense sand) similar to what is present at Port Hedland. Therefore, the selection of hammers for efficient driving of piles at Port Hedland area should not be based on the magnitude of the rated energy of the hammer but how the energy is delivered to the pile.
An IHC S-280 hydraulic hammer (13.5 t ram without a hammer cushion in an accelerated drop) and a Junttan 25S hydraulic hammer (25 t ram with a hammer cushion with 1.5 m drop) were used for the retaining wall pile driving operations. A GRLWEAP based comparison of both hammers indicated that the performance of these hammers in terms of blowcounts at 95% hammer efficiency is likely to be very similar for the soil conditions at Port Hedland.
6.2 DRIVEABILITY RESULTS
Driveability assessment was carried out using the GRLWEAP (2005) computer program during design stage. Based on previous pile driving experience (Beaumont and Thomas, 2007) at Port Hedland, a skin quake of 2 mm, a toe quake of 1 mm, a skin damping of 0.5 sec/m and a toe damping of 0.35 sec/m were used for the driveability assessment. Junttan 25S hammer with 95% efficiency was used for the driveability assessment of piles with single shoe and the results indicated that the piles are very likely to refuse at the Conglomerate layer (at about -14 mCD). Previous experience from the existing wharf structures also indicated pile refusal in the Conglomerate layer. Therefore, if piles with single shoe were adopted for the retaining wall, then the cost and the schedule impact of advancing the piles beyond -14 mCD is likely to be very high. The high costs come from the additional time and the associated pile barge related costs involved in drilling out the soil plug inside the piles prior to re-driving.
Since pile axial capacity was not critical, piles equipped with double shoe were adopted for the retaining wall. IHC S-280 hydraulic hammer with a hammer efficiency of 95% was used in the driveability analysis of piles with double shoe. The driveability analysis indicated that most of the piles with double shoe are likely to be driven to target penetration. The predicted blowcounts for piles with double shoe are provided in Figure 4a, Figure 4b and Figure 4c as thick black lines. Based on the results shown in Figure 4c, some piles are likely to refuse prior to reaching -30 mCD.
The required pile penetration toe level for piles 1 to 16 of the retaining wall is -8 mCD and for piles 17 to 47 and piles 111 to 125 is -15 mCD. The required pile penetration toe level for piles 48 to 62 and 103 to 110 is -20 mCD and the field blowcount data is provided in Figure 4a. The toe level requirement for piles 63 to 74 and 99 to 102 is -25 mCD and the field blowcount data is provided in Figure 4b. The toe level requirement for piles 75 to 98 is -30 mCD and the field blowcount data is provided in Figure 4c. The double shoe induced reduction in shaft friction helped drive most of the piles to design penetration. The increase in blowcounts at the medium strength Conglomerate layer between -14 mCD and -18 mCD is very clear in Figure 4c. The blowcount data also indicate the strength variability of the Conglomerate layer in particular and the Older Alluvium in general.
Due to strength variability, piles 97, 98 and 99 did not reach adequate pile penetration. Therefore, additional three piles (P1, P2 and P3) were driven near them to strengthen the retaining wall. These additional piles were also 1200 mm OD x 25mm WT, but equipped with a 40 mm wall thickness single shoe and driven with a Junttan 25S hydraulic hammer. The predicted blowcounts from the driveability analysis considering lower bound coring and lower bound plugged cases are provided in Figure 4d. The predicted blowcounts indicated that pile refusal is very likely to happen in the Conglomerate layer. The field blowcounts of P1, P2 and P3 are provided in Figure 4d as solid lines for the initial driving which shows that the blowcounts become very high at about -14 mCD. An 1100 mm diameter Wirth drill was used to drill out the soil plug inside the piles and the hammer was re-engaged for further driving. The blowcounts shown as dashed lines, dropped due to reduction in the internal shaft friction. However, with continued driving, the
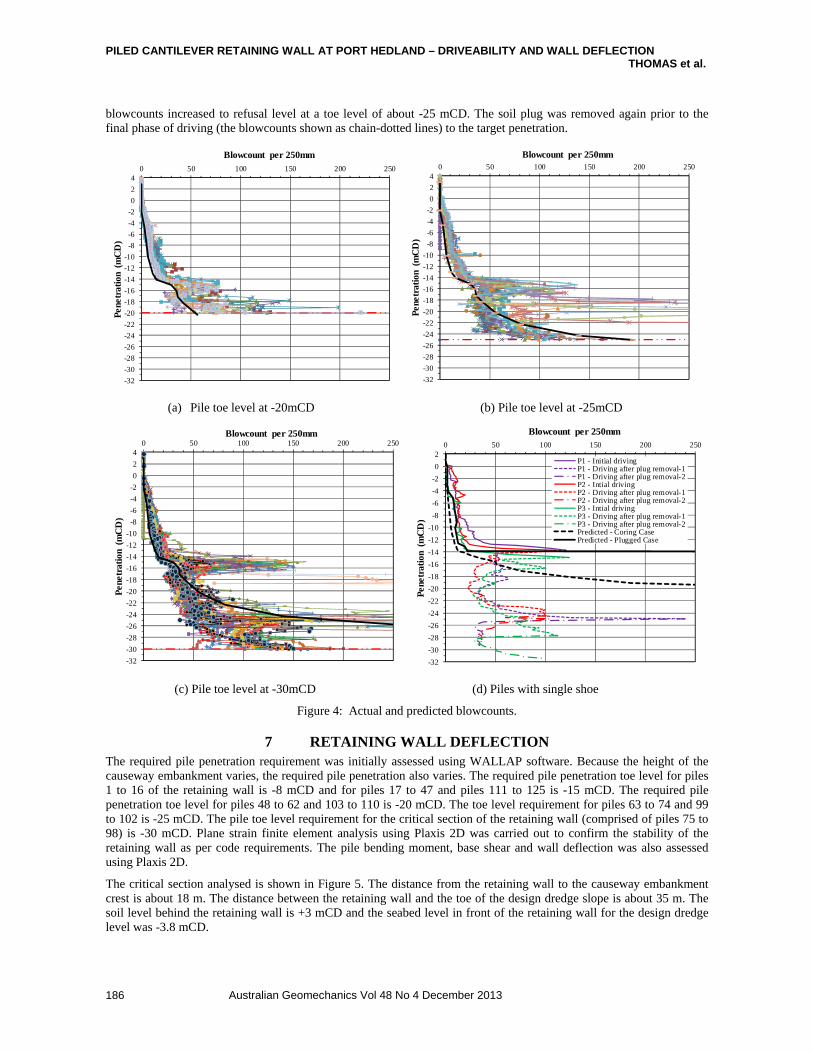
PILED CANTILEVER RETAINING WALL AT PORT HEDLAND – DRIVEABILITY AND WALL DEFLECTION THOMAS et al.
Australian Geomechanics Vol 48 No 4 December 2013 186
blowcounts increased to refusal level at a toe level of about -25 mCD. The soil plug was removed again prior to the final phase of driving (the blowcounts shown as chain-dotted lines) to the target penetration.
-32
-30
-28
-26
-24
-22
-20
-18
-16
-14
-12
-10
-8
-6
-4
-2
0
2
40 50 100 150 200 250
Pen
etra
tion
(m
CD
)
Blowcount per 250mm
-32
-30
-28
-26
-24
-22
-20
-18
-16
-14
-12
-10
-8
-6
-4
-2
0
2
40 50 100 150 200 250
Pen
etra
tion
(m
CD
)
Blowcount per 250mm
(a) Pile toe level at -20mCD (b) Pile toe level at -25mCD
-32
-30
-28
-26
-24
-22
-20
-18
-16
-14
-12
-10
-8
-6
-4
-2
0
2
40 50 100 150 200 250
Pen
etra
tion
(m
CD
)
Blowcount per 250mm
-32
-30
-28
-26
-24
-22
-20
-18
-16
-14
-12
-10
-8
-6
-4
-2
0
20 50 100 150 200 250
Pen
etra
tion
(m
CD
)Blowcount per 250mm
P1 - Initial drivingP1 - Driving after plug removal-1P1 - Driving after plug removal-2P2 - Intial drivingP2 - Driving after plug removal-1P2 - Driving after plug removal-2P3 - Intial drivingP3 - Driving after plug removal-1P3 - Driving after plug removal-2Predicted - Coring CasePredicted - Plugged Case
(c) Pile toe level at -30mCD (d) Piles with single shoe
Figure 4: Actual and predicted blowcounts.
7 RETAINING WALL DEFLECTION The required pile penetration requirement was initially assessed using WALLAP software. Because the height of the causeway embankment varies, the required pile penetration also varies. The required pile penetration toe level for piles 1 to 16 of the retaining wall is -8 mCD and for piles 17 to 47 and piles 111 to 125 is -15 mCD. The required pile penetration toe level for piles 48 to 62 and 103 to 110 is -20 mCD. The toe level requirement for piles 63 to 74 and 99 to 102 is -25 mCD. The pile toe level requirement for the critical section of the retaining wall (comprised of piles 75 to 98) is -30 mCD. Plane strain finite element analysis using Plaxis 2D was carried out to confirm the stability of the retaining wall as per code requirements. The pile bending moment, base shear and wall deflection was also assessed using Plaxis 2D.
The critical section analysed is shown in Figure 5. The distance from the retaining wall to the causeway embankment crest is about 18 m. The distance between the retaining wall and the toe of the design dredge slope is about 35 m. The soil level behind the retaining wall is +3 mCD and the seabed level in front of the retaining wall for the design dredge level was -3.8 mCD.
PILED CANTILEVER RETAINING WALL AT PORT HEDLAND – DRIVEABILITY AND WALL DEFLECTION THOMAS et al.
Australian Geomechanics Vol 48 No 4 December 2013 187
As the 1200 mm steel tubular piles were manufactured with a steel clutch both to retain the soil and to provide a shear connection between piles, they were modelled as a plate element in Plaxis with appropriate axial and bending stiffnesses. The piles in the critical section were partly concrete filled to increase the overall stiffness and also to reduce the wall deflection. The soil was modelled utilising the Hardening Soil model in Plaxis. The soil parameters used for the retaining wall analysis is provided in Table 1.
The estimated lateral deflection of the wall based on the design dredge profile is provided in Table 2 and was in the order of 90 mm. However, the maximum lateral deflection of the retaining wall measured after completion of the dredging was about 16 mm. The main reason for the difference in the estimated and the measured deflection was thought to be the difference between the design dredge profile and the as-built dredge profile. The surveyed as-built dredge profile as shown in Figure 5 was used in the Plaxis 2D for a re-analysis, without changing any other parameters/conditions. The re-analysis with as-built dredge profile predicted a retaining wall deflection of 22 mm.
Figure 5: Lateral deflection considering as-built dredge profile – Results of Plaxis 2D analysis
Table 2 Retaining wall lateral deflection.
Description Deflection, mm Estimated wall deflection based on design dredge profile 90 Measured wall deflections after dredging 16 Estimated wall deflection based on as-built dredge profile 22
8 CONCLUSIONS The API RP2A WSD (2007) main text method was found to provide good prediction for axial pile capacity and soil resistance to driving for steel tubular piles driven into weak rock formations. Static load tests data from wharf piles near to the retaining wall are available to provide further confirmation of the suitability of this method. The data from static tension load test carried out on a 610 mm OD and a 1050 mm OD piles for wharf near the retaining wall is provided in this paper.
General experience of driving piles at Port Hedland area indicated that the piles with single shoe are very likely to refuse on a 4 m thick medium strength Conglomerate rock layer starting at about -14 mCD. The piles equipped with double shoe were found to be easier to drive and most of the piles were driven to the target penetration without the need of costly soil plug removal.
The monitoring of the piled cantilever retaining wall designed to stabilise an access road and conveyor foundations to an existing wharf indicated that the measured deflection was very similar to the estimated deflection if as-built dredge profile was used in the analysis.
9 REFERENCES American Petroleum Institute Recommended Practice 2A-WSD (2007), Recommended Practice for Planning,
Designing and Constructing Fixed Offshore Platforms – Working Stress Design. AS 1289 (2000) Method of Testing Soils for Engineering Purposes. AS 4133 (2005) Methods of Testing Rocks for Engineering Purposes. Beaumont, D. and Thomas, J. (2007), “Driving Tubular Steel Piles into Weak Rock – Western Australian Experience”,
Proceedings, 10th Australia New Zealand Conference on Geomechanics, pp. 430-435.
Conglomerate
Lower red beds
Upper red beds
Uncemented red beds
Beach deposits
Retaining wall
Fill
Design dredge profile
As-built dredge profile
Causeway embankment, +11mCD
Older Alluvium
Dredge pocket, -20mCD

PILED CANTILEVER RETAINING WALL AT PORT HEDLAND – DRIVEABILITY AND WALL DEFLECTION THOMAS et al.
Australian Geomechanics Vol 48 No 4 December 2013 188
GRLWEAP (2003), Wave Equation Analysis of Pile Driving, Pile Dynamics, Inc. Version 2003. Stevens, R.F., Wiltsie, E.A., and Turton, T.H. (1982), “Evaluating Pile Driveability for Hard Clay, Dense Sand and
Rock”, Proceedings, 14th Offshore Technology Conference, Houston, OTC Paper No. 4205, Vol. 1, pp 465-481.
Thomas, J., van den Berg, M, Chow, F. and Maas, N (2011), “Behaviour of driven tubular steel piles in calcarenite for a marine jetty in Fujairah, United Arab Emirates”, Frontiers in Offshore Geotechnics II, Perth, Australia, pp. 549-554.