Embed Size (px)
Citation preview

Australian gas supply and demand balance
to 2019-20
ABARE report for the Commonwealth Department of Industry, Tourism and
Resources
Marat Fainstein, Julie Harman and Andrew Dickson
July 2002

GAS SUPPLY AND DEMAND
ABARE project 2676
© Commonwealth of Australia 2002 This work is copyright. The Copyright Act 1968 permits fair dealing for study, research, news reporting, criticism or review. Selected passages, tables or diagrams may be reproduced for such purposes provided acknowledgment of the source is included. Major extracts or the entire document may not be reproduced by any process without the written permission of the Executive Director, ABARE. Fainstein, M., Harman, J. and Dickson, A. 2002, Australian Gas Supply and Demand Balance to 2019-20, ABARE Report to the Commonwealth Department of Industry, Tourism and Resources, Canberra, August. Australian Bureau of Agricultural and Resource Economics GPO Box 1563 Canberra 2601
Telephone +61 2 6272 2000 Facsimile +61 2 6272 2001 Internet www.abareconomics.com ABARE is a professionally independent government economic research agency. Acknowledgments The authors would like to acknowledge the valuable information, expertise and feedback provided by Kim Donaldson, Ken Noble and Adam Roberts of ABARE, Rick Pickering, Peter Livingston and Carolyn Barton from the Department of Industry, Tourism and Resources, Dan Steiner and Tom Keating of Invest Australia, Edward Sellars from the Department of Foreign Affairs and Trade and Steve Le Poidevin from Geoscience Australia.

GAS SUPPLY AND DEMAND
iii
Contents
Summary 1
1. Introduction 5
2. Gas supplies 8 Natural gas reserves 8 Coal seam methane 15 Natural gas pipelines 18 International gas supplies 20
3. Gas consumption 22 Reference case 22 High gas demand scenario 23
4. Modeling results 27 Overview 27 Depleted eastern Australian reserves 31
5. Conclusions 33
Appendix A Model outline 34
References 36
Maps 1 Natural gas reserves and transmission pipelines 8
Figures A Australian natural gas reserves and production 11 B Estimated natural gas reserves, 1982 to 2001 13 C Projected gas reserves 16 D Australian primary energy consumption, by fuel 23
Tables 1 Australian natural gas reserves, production and estimated supply costs 9

GAS SUPPLY AND DEMAND
iv
2 Composition of state supplies in 2001 14 3 Coal seam methane resources 15 4 Assumed capacities of gas pipelines in 2002 19 5 Gas consumption, by industry: reference case and high demand scenario 24 6 Gas consumption, by state: reference case and high demand scenario 24 7 Proposed gas to liquids projects 25 8 Current and proposed LNG projects 26 9 Estimated gas supply and demand balance: 1999-2000 to 2019-20 28 10 Estimated gas throughputs for major pipelines 29 11 Estimated reserves to production ratio in 2019-20 32
Indicative energy content conversion factors, by basin PJ/bcm PJ/bcf Adavale 38.5 1.09 Amadeus 40.5 1.15 Bass 38.8 1.10 Bonaparte 40.5 1.15 Bowen/Surat 38.5 1.09 Carnarvon 39.2 1.11 Cooper-Eromanga 38.9 1.10 Cooper-Eromanga(ethane) 57.5 1.63 Gippsland 38.8 1.10 Gippsland (ethane) 57.5 1.63 Otway 38.8 1.10 Perth 39.2 1.11
Standard metric prefixes kilo (k) 103 (thousand) mega (M) 106 (million) giga (G) 109 (1000 million) tera (T) 1012 peta (P) 1015

GAS SUPPLY AND DEMAND
1
Summary
Highlights
• Despite a four fold increase in coal seam methane production from 1999-2000 to 2019-20, existing supplies to Queensland will need to be supplemented from alternative sources in the near future.
• The demand for gas in New South Wales, South Australia, Tasmania and Victoria is expected to continue to be met by existing sources up until 2019-20 in combination with increased production of coal seam methane in New South Wales.
• By 2019-20 known eastern Australian gas resources are expected to be nearing depletion.
Concerns have been raised about the capacity for Australia’s natural gas supplies to keep pace with growing demand, particularly in eastern Australia. In particular, it has been suggested that unless significant infrastructure investment is undertaken now the demand/supply balance situation in eastern Australia will deteriorate quickly as natural gas resources are depleted in the face of strongly growing demand.
The purpose of this study is to examine this issue and focuses on whether supplies in eastern Australia are likely to fall short of growing demand; what is the potential for coal seam methane to supplement local supplies of natural gas; and if required, what is the potential to supply eastern Australian markets from western or northern Australia, or even Papua New Guinea?
A modeling framework was developed to examine these issues at a regional level, building on ABARE’s MARKAL model of the Australian energy system. The modeling framework includes representations of all potential sources of natural gas in Australia by basin and coal seam methane, all existing and proposed pipeline options as well as regional gas demands, by industry.
Gas supplies Australia has abundant reserves of natural gas with reserves located in all Australian states except New South Wales and Tasmania. Total Australian natural gas reserves (commercial and noncommercial) as at 1 January 2000 were estimated to be 114.6 trillion cubic feet, equivalent to 127 907 petajoules (Geoscience Australia 2001). Over time, both the composition of reserves (the mix between commercial and

GAS SUPPLY AND DEMAND
2
noncommercial reserves) and the overall quantity of identified resources can change, a trend that has been clearly evident in Australia over the last two decades. In this analysis, the changing composition of Australia’s gas resource base was reflected by assuming a proportion of noncommercial reserves is upgraded annually and declared commercial and is added to the existing stock of commercial reserves. The degree to which the mix was assumed to change differed on a basin by basin basis to reflect a range of factors including: the maturity of the field; the degree to which the reserve has already been developed; and expectations of future development activities.
New natural gas discoveries Australiawide have substantially exceeded gas production over the past 20 years and Australia’s total natural gas resources are estimated to have increased four fold or by around 120 000 petajoules over the last two decades. Despite this, however, with the exception of the Otway basin, for this study it was assumed the current reserve estimates provided by Geoscience Australia will not change over the study period. This simplifying assumption reflects the fact that ABARE is not in a position to independently forecast the outcomes of current or future exploration activity, nor to revise the current estimates of Geoscience Australia. Looking forward, this most certainly means the reserve estimates used in this study represent a lower bound.
However, the issue of supply shortfalls is largely a regional issue. Known reserves in both the western and north/central areas of Australia have increased substantially since the mid 1990s while those in eastern Australian have remained relatively static in aggregate. Casting forward, in the absence of significant and positive exploration results, there is a real possibility that eastern Australian supplies will need to be supplemented within the period to 2019-20 from gas resources in Australia’s north west, Papua New Guinea or from coal seam methane.
Coal seam methane Current production of coal seam methane in Australia is relatively small with a limited number of estimates placing the total in New South Wales and Queensland at around 20 petajoules. Australia’s total coal seam methane resources are estimated to be well in excess of 250 000 petajoules. As an indication of future upside potential, coal seam methane production in the United States has increased from around 600 petajoules to over 1200 petajoules over the last decade and is based on similar technology and geology as currently exists in Australia. If only 20 per cent of Australia’s identified coal seam methane resources are recoverable, current resources could provide New South Wales and Queensland with sufficient gas to meet their needs for more than 40 years.
Gas consumption In examining the gas supply and demand balance, two alternative demand scenarios were modeled. The reference case is based on ABARE’s most recent projections of Australian energy consumption and production (Dickson, Thorpe, Harman, Donaldson
GAS SUPPLY AND DEMAND
3
and Tedesco 2001). In this scenario, natural gas consumption is projected to grow by around 3.4 per cent a year over the next twenty years with gas’ share of Australian primary energy consumption projected to increase from 18 per cent to 24 per cent. In the alternative high demand growth scenario the outlook for gas use in the mining, electricity generation and the gas to liquids industries, and for Australia’s exports of liquefied natural gas were all revised upwards. In the case of gas to liquids in particular, the alternative high demand scenario assumes a very strong and rapid growth in this sector which impacts significantly on the supply and demand balances in Western Australia and the Northern Territory.
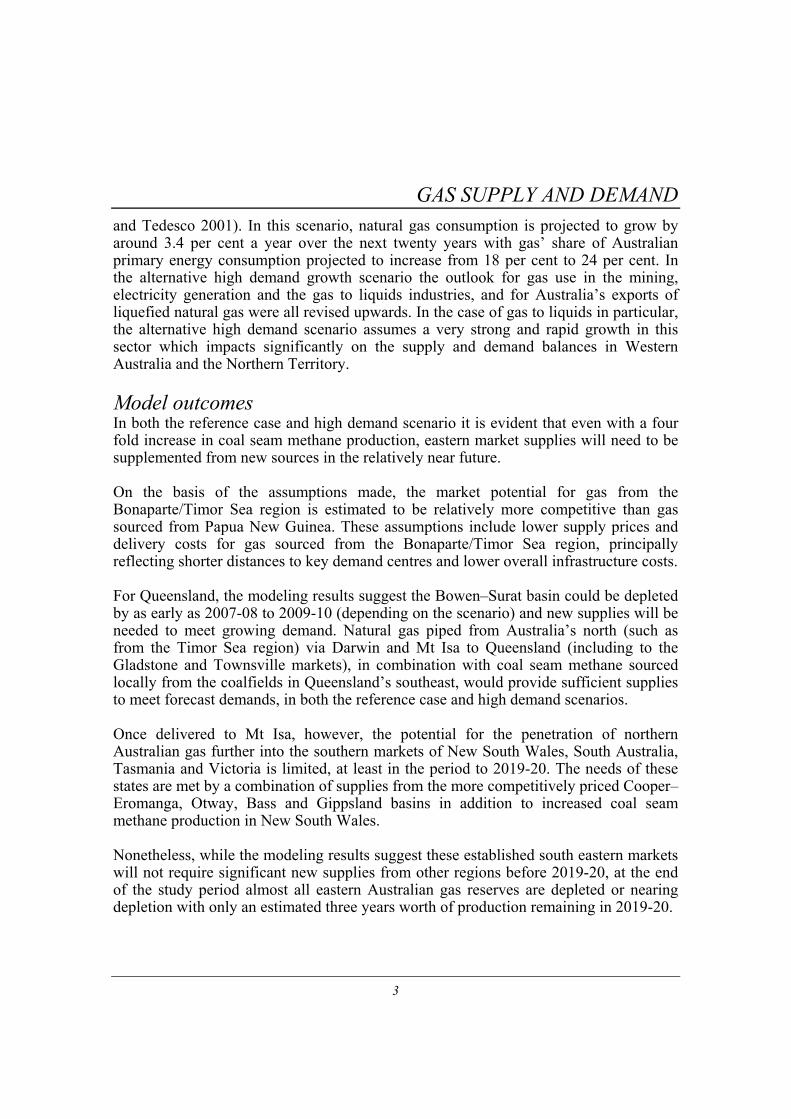
Model outcomes In both the reference case and high demand scenario it is evident that even with a four fold increase in coal seam methane production, eastern market supplies will need to be supplemented from new sources in the relatively near future.
On the basis of the assumptions made, the market potential for gas from the Bonaparte/Timor Sea region is estimated to be relatively more competitive than gas sourced from Papua New Guinea. These assumptions include lower supply prices and delivery costs for gas sourced from the Bonaparte/Timor Sea region, principally reflecting shorter distances to key demand centres and lower overall infrastructure costs.
For Queensland, the modeling results suggest the Bowen–Surat basin could be depleted by as early as 2007-08 to 2009-10 (depending on the scenario) and new supplies will be needed to meet growing demand. Natural gas piped from Australia’s north (such as from the Timor Sea region) via Darwin and Mt Isa to Queensland (including to the Gladstone and Townsville markets), in combination with coal seam methane sourced locally from the coalfields in Queensland’s southeast, would provide sufficient supplies to meet forecast demands, in both the reference case and high demand scenarios.
Once delivered to Mt Isa, however, the potential for the penetration of northern Australian gas further into the southern markets of New South Wales, South Australia, Tasmania and Victoria is limited, at least in the period to 2019-20. The needs of these states are met by a combination of supplies from the more competitively priced Cooper–Eromanga, Otway, Bass and Gippsland basins in addition to increased coal seam methane production in New South Wales.
Nonetheless, while the modeling results suggest these established south eastern markets will not require significant new supplies from other regions before 2019-20, at the end of the study period almost all eastern Australian gas reserves are depleted or nearing depletion with only an estimated three years worth of production remaining in 2019-20.

GAS SUPPLY AND DEMAND
4
The assumption that reserves do not increase in the study period undoubtedly means the results of the analysis err on the conservative side. Significant oil and gas exploration activity is currently occurring both in western and northern Australia in the Carnarvon, Browse, Bonaparte and Timor Sea basins and also in eastern Australia, particularly in the Bass, Otway and Gippsland basins. What will be the outcomes of this effort is unknown and accordingly the conclusion that eastern Australian gas reserves are depleted or nearing depletion by 2019-20 may be overstated and needs to be interpreted with caution. Nevertheless, it is unlikely this error is egregious and it is more a matter of when commercial reserves will be depleted than if. However a study that encompasses the period beyond 2019-20 and has the benefit of knowing the outcomes of current exploration effort might well reveal a qualitatively different set of outcomes.

GAS SUPPLY AND DEMAND
5
1. Introduction
Australia’s natural gas market might reasonably be described as immature and has historically been characterised by regional markets (Harman and Roberts 2001). The state based development of natural gas resources and transmission infrastructure, in concert with highly regionalised demand, led to the development of a concentrated supply structure with major demand centres, particularly on Australia’s east coast, supplied by a single supplier or joint venture (IC 1991; Bush, Dickson, Harman and Anderson 1999). Historically, the duplication of existing (monopoly) pipelines to bring alternative gas supplies to market was considered an unjustified cost. This was particularly so given that the production of natural gas and the development of transport infrastructure had substantially kept pace with demand, on the whole ensuring a balance between demand and supply. In effect, the large distances between gas fields and demand centres proved to be an effective barrier to interbasin competition between producers. Only in the recent past, with the construction of the short interconnect linking south eastern New South Wales with north eastern Victoria and Duke Energy’s Eastern Gas Pipeline linking Gippsland to Sydney through Canberra and Wollongong, has Cooper basin gas been traded in the Melbourne market and Gippsland basin gas been traded in the Sydney market.
On the demand side, the combination of oil price shocks, natural gas discoveries and the development of gas transmission and distribution infrastructure, have all collectively provided the catalyst for significant growth in natural gas consumption in Australia over the past 25 years. Over that period, the consumption of natural gas in Australia increased by an average of 6.9 per cent a year, almost tripling its share of total energy consumption. Over the same period, the share of crude oil fell from over 50 per cent to around 35 per cent. Looking forward over the medium to long term, the consumption of natural gas in Australia is expected to continue to grow strongly, with primary consumption projected to increase by an average 3.4 per cent a year between 1999-2000 and 2019-20 (Dickson et al. 2001). Gas consumption in Queensland (5.0 per cent a year) and Western Australia (3.6 per cent a year) are both projected to increase strongly, as is the largest end-use market of Victoria (2.9 per cent a year). The first sales of natural gas to Tasmania are also expected to commence by 2002-03, increasing to almost 30 petajoules a year by 2019-20. Added to this, the outlook is also positive for exports of liquefied natural gas (LNG) and for the development of a gas to liquids industry, both of which will draw on the significant resources of Australia’s north west.
Increasingly, however, concerns have been raised about the capacity for supplies to keep pace with growing demand, particularly in eastern Australia. In particular, it has

GAS SUPPLY AND DEMAND
6
been suggested that unless significant infrastructure investment is undertaken to bring Australia’s gas supplies from northern and western Australia to the eastern market, or indeed to import natural gas from the Timor Sea or the Kutubu, Hides and south east Gobe fields in the highlands of Papua New Guinea, the balance between supply and demand in eastern Australia will deteriorate quickly as natural gas resources are depleted in the face of strongly growing demand.
The purpose of this study is to examine this issue of the balance between gas supplies and demand in Australia in the context of increasing demands for gas and potentially tightening supplies. In particular, the study will examine the following key questions.
• Are supplies in eastern Australia likely to fall short of growing demand?
• What is the potential for coal seam methane to supplement natural gas supplies?
• What is the potential to supply eastern Australian markets from western or northern Australia, or even Papua New Guinea?
To examine these issues in a consistent and rigorous manner at a regional level, a modeling framework was developed building on ABARE’s MARKAL model (see, for example, Dalziell, Noble and Ofei-Mensah 1993; and Harman 2001 for previous examples of the application of ABARE’s MARKAL model to this area). The model was enhanced to include representations of all potential sources of natural gas in Australia (domestic and international), by basin (including coal seam methane), all existing and proposed pipeline configurations and regional (state based) gas demands, by industry. For this study the model was used to focus on matching (or balancing) regional demands for gas to sources of supply (by basin) in a cost effective manner, taking into account the range of relevant physical and economic factors.
The balancing exercise was undertaken for two alternative demand scenarios. A reference case was developed using ABARE’s most recent projections of Australian energy consumption and production, which covers the period 1998-99 to 2019-20 (Dickson et al. 2001). In addition, an alternative high gas demand growth scenario was developed. In this case, ABARE’s previous outlook for energy use in the mining, electricity generation and manufacturing (specifically gas to liquids) sectors and exports of LNG were specifically revised in consultation with staff from the Commonwealth Department of Industry, Tourism and Resources and industry experts.
As a point of clarification, in this report the terms natural gas and gas are used interchangeably. Coal seam methane (CSM) is referred to explicitly either as coal seam methane or using the abbreviation CSM.
In the next section a detailed assessment and discussion of the gas supply situation in Australia (including coal seam methane) is provided and covers reserves, production

GAS SUPPLY AND DEMAND
7
and transport infrastructure. Section 3 focuses on the outlook for gas demand in Australia, including a description of the reference case and alternative high demand growth scenario. In section 4 the results of the supply and demand balance modeling are discussed before the main conclusions of the paper are outlined in section 5. Appendix A provides a description of the modeling framework developed and some of the key assumptions used in the analysis.

GAS SUPPLY AND DEMAND
8
2. Gas supplies
In this section current estimates of reserves of natural gas, by basin are discussed, as are current and forecast natural gas production trends, again by basin; the potential coal seam methane resource base; and existing and proposed gas transport infrastructure developments.
Natural gas reserves Australia has abundant natural gas reserves. The location of Australia’s principal gas reserves is shown in map 1. Estimates of the total size, annual production and supply costs of these resources are outlined in table 1.
1 Natural gas reserves and transmission pipelines

GAS SUPPLY AND DEMAND
9
Gas reserves are located in all Australian states except New South Wales and Tasmania. The largest gas basins are the Carnarvon and Browse basins (Western Australia), the Bonaparte basin (Northern Territory), the Gippsland basin (Victoria) and the inland Cooper–Eromanga basin (borders South Australia and Queensland). Total Australian natural gas reserves (commercial and noncommercial reserves) as at 1 January 2000 are estimated to be 127 907 petajoules (Geoscience Australia 2001).
Commercial reserves are defined by Geoscience Australia as those reserves that have been proven (i.e. their existence has been proven) and can be supplied to markets on a profitable basis, based on current costs of production and the prevailing price of gas.
1 Australian natural gas reserves, production and estimated supply costs Reserves a Unidentified
resources Total
Resources
Product-ion b
Supply Cost c
Commercial Non-commercial
PJ PJ PJ PJ PJ $/GJ
Eastern Australia Adavale 15 – – 15 0.8 2.50 Bass – 376 – 376 – na Bowen–Surat 123 95 – 218 27 3.00 Cooper–Eromanga 3 437 1 461 – 4 898 232 2.86 Gippsland 5 164 3 204 1 358 9 726 202 2.60 Otway d 46 1 654 – 1 700 8 2.60 Subtotal 8 785 6 790 1 358 16 933 470
Northern and central Australia Amadeus 460 28 – 488 19 2.50 Bonaparte 3 24 892 6 440 31 335 – na Browse – 20 719 5 370 26 089 – na Subtotal 463 45 639 11 810 57 912 19
Western Australia Carnarvon 24 332 42 957 23 990 91 279 718 1.90 Perth 114 – – 114 10 2.70 Subtotal 24 446 42 957 23 990 91 393 729
Total 33 694 95 386 37 158 166 238 1 218 a Reserves and resources are as at 1 January 2000. b Production is for 1999-00 and includes only natural gas basin production and excludes methane (including that from coal seams, coal mines, garbage tips and sewage plants), ethane and town gas. c Estimated ex plant gas prices. d Includes new discoveries not accounted for by Geoscience Australia. Source: Geoscience Australia (2001), Department of Industry, Tourism and Resources (2000).

GAS SUPPLY AND DEMAND
10
Conversely, noncommercial reserves are defined as those that are recoverable but are not yet profitable to produce. Of Australia’s three largest identified reserves (Bonaparte, Browse and Carnarvon), only around 22 per cent of the reserves are currently considered commercial.
Australia also has substantial potential undiscovered or unidentified resources of natural gas in the Carnarvon, Bonaparte, Browse and Gippsland basins. While these reserves have yet to be discovered, Geoscience Australia nevertheless estimates that, with a conservative 95 per cent level of probability, upwards of an additional 37 158 petajoules of natural gas exists in these basins. The vast bulk of this gas is expected to be located in the Carnarvon basin (Geoscience Australia 2001).
Over time, both the composition of reserves (the mix between commercial and noncommercial) and the overall quantity of identified resources does change. Improved extraction or production technology, changes in supply costs and/or changes in gas prices can all impact on the profitability of production, and thus result in noncommercial reserves being reclassified as commercial reserves. Similarly, as geological knowledge increases, more gas reserves are discovered or proved-up, thus adding to identified resources and increasing overall reserves. The level of investment in exploration is in turn dependant, in part, on expectations of the profitability of production (i.e. changes in supply costs and/or changes in energy prices and so forth).
Both of these trends (changes in the composition of reserves and the overall increase in reserves) are evident in figure A, which maps estimates of total Australian natural gas resources since 1982. Total resources are estimated to have increased four fold in the last two decades, increasing by around 120 000 petajoules. Annual production has also increased significantly (also shown in figure A), however, annual additions to reserves far outweigh production, hence the strong growth in the total.
The mix between commercial and noncommercial reserves In this analysis, the assumption is made that, over the study period (1999-2000 to 2019-20), Australia’s gas supply industry will continue to grow and develop, such as through continued exploration and development of new gas wells or processing and pipeline infrastructure, or through technological improvements. To reflect this assumption a fixed proportion or percentage of noncommercial reserves is assumed to be upgraded on an annual basis and declared commercial and is added to existing commercial reserves. The degree to which the mix between commercial and noncommercial reserves is assumed to change over the study period differs on a basin by basin basis and reflects a number of factors including: an assessment of the maturity of the field; the degree to which the reserve has already been developed; and an expectation of future development activities. For example, in the Cooper–Eromanga basin, a high proportion of noncommercial reserves are assumed to be upgraded on an annual basis reflecting the high level of development that already exists in that field.

GAS SUPPLY AND DEMAND
11
0
20
40
60
80
100
120
140
160
180
1982
1983
1984
1985
1986
1987
1988
1989
1990
1991
1992
1993
1994
1995
1996
1997
1998
1999
2000
2001
Rese
rves
in 0
00' P
J
0
0.2
0.4
0.6
0.8
1
1.2
1.4
Prod
uctio
n in
000
' PJProduction
Commercial reserves
Non-commercial reserves
Inferred resources
The importance of this assumption is that future production (and the productive life of the reserve) is directly linked to the availability of commercial reserves. For example, again in the case of the Cooper–Eromanga basin, producing from reserves in the future that are currently considered noncommercial significantly extends the productive life of the basin. In contrast, the Browse basin is not expected to contribute to Australian gas supplies in the period 1999-2000 to 2019-20 as this resource is assumed to remain entirely noncommercial, reflecting a lack of production and distribution infrastructure. Of course, were production infrastructure to be developed in the Browse basin (such as floating LNG facilities), current reserves would be upgraded, although this is unlikely to affect the results of the demand and supply balance in eastern Australia presented here.
An assumption is also made that gas basins cannot be totally depleted but will always contain a small amount of remaining reserves. This reflects the assumption that production is expected to cease when the costs associated with extracting the last of the gas from tight formations render further production uneconomic.
A Australian natural gas reserves and production
0
20
40
60
80
100
120
140
160
180
1982
1983
1984
1985
1986
1987
1988
1989
1990
1991
1992
1993
1994
1995
1996
1997
1998
1999
2000
2001
Rese
rves
in 0
00' p
etaj
oule
s
0
0.2
0.4
0.6
0.8
1
1.2
1.4
Prod
uctio
n in
000
' pet
ajou
les
Production
Commercial reserves
Non-commercial reserves
Inferred resources
GAS SUPPLY AND DEMAND
12
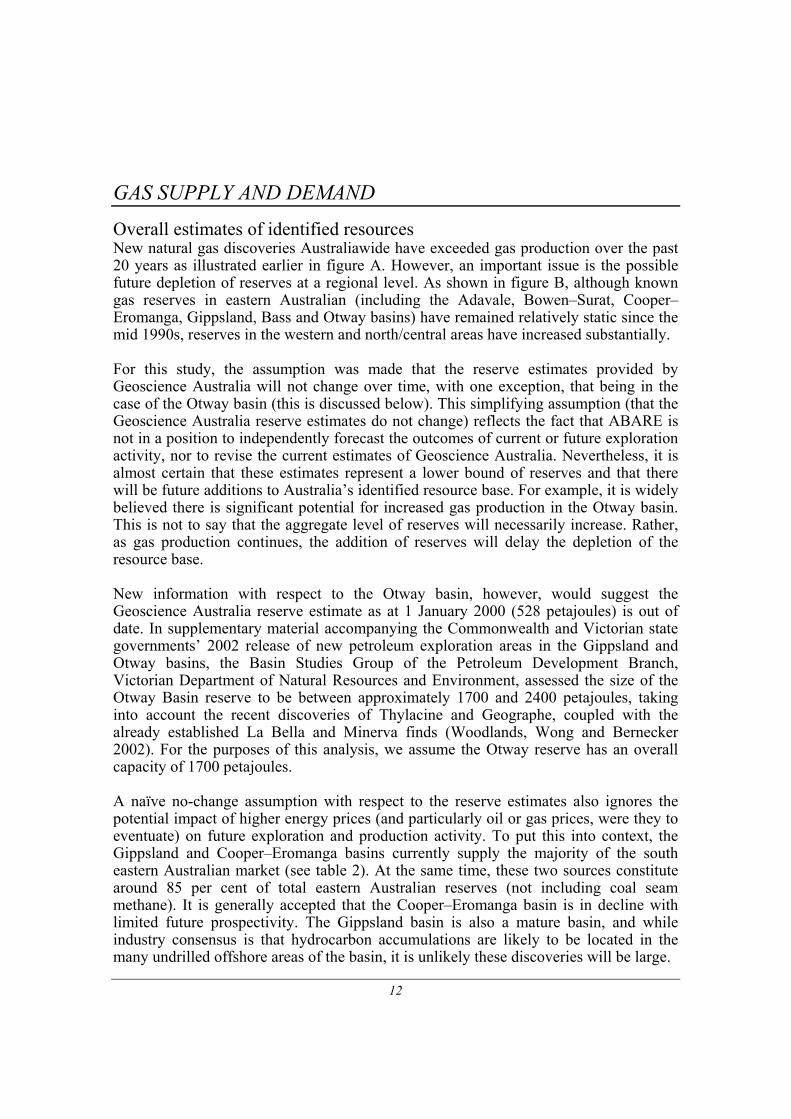
Overall estimates of identified resources New natural gas discoveries Australiawide have exceeded gas production over the past 20 years as illustrated earlier in figure A. However, an important issue is the possible future depletion of reserves at a regional level. As shown in figure B, although known gas reserves in eastern Australian (including the Adavale, Bowen–Surat, Cooper–Eromanga, Gippsland, Bass and Otway basins) have remained relatively static since the mid 1990s, reserves in the western and north/central areas have increased substantially.
For this study, the assumption was made that the reserve estimates provided by Geoscience Australia will not change over time, with one exception, that being in the case of the Otway basin (this is discussed below). This simplifying assumption (that the Geoscience Australia reserve estimates do not change) reflects the fact that ABARE is not in a position to independently forecast the outcomes of current or future exploration activity, nor to revise the current estimates of Geoscience Australia. Nevertheless, it is almost certain that these estimates represent a lower bound of reserves and that there will be future additions to Australia’s identified resource base. For example, it is widely believed there is significant potential for increased gas production in the Otway basin. This is not to say that the aggregate level of reserves will necessarily increase. Rather, as gas production continues, the addition of reserves will delay the depletion of the resource base.
New information with respect to the Otway basin, however, would suggest the Geoscience Australia reserve estimate as at 1 January 2000 (528 petajoules) is out of date. In supplementary material accompanying the Commonwealth and Victorian state governments’ 2002 release of new petroleum exploration areas in the Gippsland and Otway basins, the Basin Studies Group of the Petroleum Development Branch, Victorian Department of Natural Resources and Environment, assessed the size of the Otway Basin reserve to be between approximately 1700 and 2400 petajoules, taking into account the recent discoveries of Thylacine and Geographe, coupled with the already established La Bella and Minerva finds (Woodlands, Wong and Bernecker 2002). For the purposes of this analysis, we assume the Otway reserve has an overall capacity of 1700 petajoules.
A naïve no-change assumption with respect to the reserve estimates also ignores the potential impact of higher energy prices (and particularly oil or gas prices, were they to eventuate) on future exploration and production activity. To put this into context, the Gippsland and Cooper–Eromanga basins currently supply the majority of the south eastern Australian market (see table 2). At the same time, these two sources constitute around 85 per cent of total eastern Australian reserves (not including coal seam methane). It is generally accepted that the Cooper–Eromanga basin is in decline with limited future prospectivity. The Gippsland basin is also a mature basin, and while industry consensus is that hydrocarbon accumulations are likely to be located in the many undrilled offshore areas of the basin, it is unlikely these discoveries will be large.

GAS SUPPLY AND DEMAND
13
B Estimated natural gas reserves, 1982 to 2001 a
Commercial reserves Non-commercial reserves Inferred resources
Western Australian basins
0
20000
40000
60000
80000
100000
1982
1984
1986
1988
1990
1992
1994
1996
1998
2000
Peta
joul
es
North and central Australian basins
0
1000020000
3000040000
5000060000
70000
1982
1984
1986
1988
1990
1992
1994
1996
1998
2000
Peta
joul
es
Eastern Australian basins
0
3000
6000
9000
12000
15000
18000
1982
1984
1986
1988
1990
1992
1994
1996
1998
2000
Peta
joul
es
a Includes new Otway discoveries.

GAS SUPPLY AND DEMAND
14
Without a significant change, however, there is a real prospect that production of natural gas in eastern Australia will not keep pace with growing demand. An illustration of this possibility is provided in figure C, which presents projected natural gas reserves in eastern Australia, by basin (these results are for the high demand scenario although the results are also similar for the reference case). The projected reserve figures presented in figure C are derived from the assumptions outlined above (progressive change in the mix of commercial and noncommercial reserves; setting a minimum level below which production ceases; and assuming no change in total identified resources), combined with long term projections of gas production from each basin. These projections of Australia’s natural gas production, by basin, were estimated by ABARE using standard historical trend analysis techniques. In cases where limited historical information was available or the implied trends were untenable, the forecasts reflect ABARE’s best judgment. These production assumptions are discussed in more detail in section 4.
As can be seen, reserves in the Cooper–Eromanga, Bass, Bowen–Surat and Adavale basins are all but depleted before the end of the study period with only the Gippsland basin maintaining a significant reserve base.
Also shown in figure C is the assumed (total) production of natural gas from eastern Australian basins. At the end of the study period, the Cooper–Eromanga basin is estimated to have less than two years production remaining, while the Gippsland basin is estimated to have approximately three years remaining. Importantly, the total level of production in 2019-20 (assumed to be around 767 petajoules) is significantly less than the reference case forecast for natural gas consumption in eastern Australia, which is 1048 petajoules (the outlook for gas demand in Australia in the reference case and high
2 Composition of state supplies in 2001 State Basin %
New South Wales Cooper 85 Gippsland 15 Queensland Surat/Bowen 40 Cooper/Eromanga 40 Coal seam methane 20 Victoria Gippsland 90 Otway 7 Cooper 3 South Australia Cooper 100 Western Australia Carnarvon 97 Perth 3 Northern Territory Amadeus 100 Sources: BHP Billiton (2002); Department of Mineral and Petroleum Resources (2002), Exxon Mobil (2002), Upstream Issues Working Group (2002).

GAS SUPPLY AND DEMAND
15
demand growth scenarios is described in detail in the next section). This outcome of production falling short of demand illustrates the real possibility that eastern Australian supplies will need to be complimented within the foreseeable future from gas resources in Australia’s western or north/central areas or from coal seam methane.
Coal seam methane Coal seam methane (CSM), which is also known as coalbed methane or coal seam gas, is methane that is trapped in the micropores of a coal seam and held there by high pressure from the surrounding rock and water. Approximately 90 per cent of CSM is situated in this form with the remainder in cleats or fissures within the coal seam or dissolved in the seam water. Coal seam methane is typically clean and of high quality, containing over 95 per cent methane and small quantities of other gases such as carbon dioxide, ethane, higher hydrocarbons, nitrogen or inert gases (New South Wales Department of Mineral Resources 1994).
The concentration of methane deposits is typically dependant on a number of factors, including temperature, pressure and coal rank. The highest concentrations of methane are contained in coals that are sub-bituminous or bituminous in rank (Davidson et al. 1995). Accordingly, the vast bulk of Australia’s CSM resources are located in the black coal deposits of Queensland and New South Wales with Victoria’s lignite (brown coal) deposits providing limited prospectivity.
Major reserves of CSM are located in the Sydney, Gunnedah–Bowen and Clarence–Moreton coal basins in New South Wales and the Bowen Basin in Queensland (table 3). It is estimated the New South Wales coal deposits contain around 2560 billion cubic metres of methane, which is the equivalent of almost 100 000 petajoules of energy (Brown et al. 1996) The Bowen basin in Queensland is estimated to contain around 152 000 petajoules of energy equivalent (Davidson et al. 1995). Comparing these reserve estimates with those for natural gas presented previously (table 1) it is apparent CSM represents a potential resource that is over ten times greater than all the conventional natural gas reserves in eastern Australia combined.
3 Coal seam methane resources billion m3 PJ $/GJ b
New South Wales 2559 97 242 $3.8
Sydney 752 28 576 Gunnedah 732 27 816 Clarence–
Moreton 1 075 40 850
Gloucester na Queensland $3.6
Bowen 4 000 152 000 Surat c na
a Based on an assumption of 95 per cent pure methane and small quantities of ethane and other gases with a conversion factor of 38 PJ per billion m3. b Assumed ex plant gas price. c Queensland portion of the Surat coal basin. Sources: Brown et al. (1996); Davidson et al. (1995).

GAS SUPPLY AND DEMAND
16
C Projected gas reserves
Cooper–Eromanga basin
0
1000
2000
3000
4000
5000
6000
1999
2001
2003
2005
2007
2009
2011
2013
2015
2017
2019
Peta
Jou
les
0
50
100
150
200
250
300
Otway basin
0200400600800
10001200140016001800
1999
2001
2003
2005
2007
2009
2011
2013
2015
2017
2019
Peta
Jou
les
0102030405060708090
Bowen-Surat basin
0
50
100
150
200
250
1999
2001
2003
2005
2007
2009
2011
2013
2015
2017
2019
Peta
Jou
les
0
5
10
15
20
25
30
Adavale basin
02468
1012141618
1999
2001
2003
2005
2007
2009
2011
2013
2015
2017
2019
Peta
Jou
les
0
0.3
0.6
0.9
Eastern States basins
02000400060008000
1000012000140001600018000
1999
2001
2003
2005
2007
2009
2011
2013
2015
2017
2019
Peta
Jou
les
0100200300400500600700800900
Gippsland basin
0
2000
4000
6000
8000
10000
12000
1999
2001
2003
2005
2007
2009
2011
2013
2015
2017
2019
Peta
Jou
les
0
100
200
300
400
500
600
Bass basin
0
75
150
225
300
375
450
1999
2001
2003
2005
2007
2009
2011
2013
2015
2017
2019
Peta
joul
es
0
15
30
45Commercial reserves
Noncommercial reserves
Inferred resources
Natural gas production

GAS SUPPLY AND DEMAND
17
Currently in Australia the commercial production of CSM is located on the Fairview and Durham Ranch coal fields near Injune, Queensland (Tri Star Petroleum); on the Peat field near Wondoan and the Dawson Valley field near Moura, Queensland (Oil Company of Australia); at Scotia near Wandoan, Queensland (Santos); and at the Appin and Tower collieries near Bulli, New South Wales (BHP Billiton).
The rate at which CSM can be extracted from coal seams (described as the flow properties) is dependent on the coal rank (essentially reflecting the concentration or density of the deposit) but also on the geology of the coal seam. As the quantity of methane that is absorbed in the coal seam is proportional to the pressure and temperature exerted on the coal, a reduction in pressure through the removal of water from the seam forces the coal to de-absorb or release the methane. The greater the surface area of the coal exposed, the faster the gas is released. Fracturing the coal seam to produce cleats or fissures (typically using high water pressure which is known as hydraulic fracturing) increases the surface area, thus allowing gas to be released at a faster rate. Gathering wells are drilled into the deposit to collect the gas and typically a large number of wells is required (over 100 in most cases) to ensure a sustained and continuous gas flow.
Currently the principal impediments to the growth in the production and uptake of CSM in Australia relates to the high cost of production (see table 3). As shown, delivered prices for CSM are, on average, in the range of $1–2/GJ above current conventional natural gas prices (VENcorp 1999). This is related to a number of factors. First, as described above, CSM is extracted from the coal seams using capital and labor intensive production processes and requires multiple gathering wells. The Sydney Gas Company estimates that for every 100 wells drilled, about 10.2 petajoules of gas per year can be delivered to the Sydney market (Sydney Gas Company 2000). In contrast, natural gas is typically located in a pocket under an impermeable rock strata such as sandstone or a carbonate deposit and requires limited gathering wells to extract.
Second, the flow properties of CSM and natural gas differ significantly. Importantly, in the case of CSM, a producer’s ability to ramp up or increase production is almost entirely dependant on geological factors and significant increases in flow rates are more costly than is the case for natural gas.
It is also argued that natural gas is often an incidental discovery in the search for oil and thus the exploration costs for natural gas are potentially lower than those for CSM. This argument has little substance as the location of Australia’s CSM resources are already well known, being as they are colocated with Australia’s bituminous and sub-bituminous coal deposits.

GAS SUPPLY AND DEMAND
18
On the positive side, Australia’s CSM resources are in close proximity to the Sydney and Brisbane markets, and thus enjoy some transport cost advantage over natural gas and particularly that sourced from western and northern Australia.
Current production of CSM in Australia is relatively small although this assessment is based on limited information. The Australian Gas Association reports an estimate of 12.3 petajoules for 2000, however, this only covers one of the three producing areas in Queensland (AGA 2001). The Appin and Tower collieries near Bulli are believed to produce an additional 7–8 petajoules. More recently it was announced that a 220 MW base load gas fired power station near Townsville would be supplied by CSM from the Bowen basin (Queensland Government).
As an indication of the future upside potential of Australia’s CSM resource, CSM production in the United States has increased from almost 600 petajoules in 1992 to over 1200 petajoules currently (Riley 2002, Davidson et al. 1995). This production is based on similar technology and geology as currently exists in Australia.
Nevertheless, regardless of current low production levels, based on the assumption that only 20 per cent of Australia’s identified CSM resources are potentially recoverable, at current levels of gas consumption, Australia’s CSM resources could provide New South Wales and Queensland with sufficient gas to meet their needs for more than 40 years. Thus, in the context of rising demand and diminishing reserves (at least in east coast markets), the commercial development of CSM resources in Australia assumes increased importance.
It is also noteworthy that, over a 100 year horizon, methane has a global greenhouse warming potential 21 times that of carbon dioxide (AGO 1999). Utilising CSM which would otherwise be vented into the atmosphere, such as for safety reasons in mining operations, has unambiguous environmental benefits.
In the demand and supply balance modeling presented in section 4, CSM is an unrestrained supply source and is assumed to have an ex plant (cost of gas sold to customers) gas price of under $2/GJ. Referring back to estimates of the current cost of CSM presented in table 3, it is evident that assumption implies CSM supply prices will decline in future.
Natural gas pipelines As discussed previously, historically the Australian natural gas market has been characterised by regional markets with limited interconnections. Within these markets, vertically integrated and publicly owned statutory utilities characteristically operated in a monopoly market, in which the utilities purchased, transported and sold most electricity and gas (IC 1991). Increasingly, however, market reforms being pursued at

GAS SUPPLY AND DEMAND
19
both national and regional levels are delivering greater integration of regional gas markets through the construction of new gas pipelines and the removal of regulatory barriers to interstate trade in gas.
For example, the short interconnect linking New South Wales and Victoria (via Wagga Wagga and Wondonga) commenced operation in 1999 and can carry upwards of 19 petajoules into Victoria or limited flows (around 8 petajoules) in the reverse direction into New South Wales. Similarly, the eastern gas pipeline connecting Longford in Victoria to Horsley Park near Sydney was commissioned in 2000 and moves gas from the Gippsland basin to the New South Wales market. This pipeline is 795 km in length and has a current capacity of 65 petajoules a year. As well as the Sydney market, the pipeline also supplies gas to industrial and commercial customers in Canberra, Wollongong and regional areas of New South Wales.
Although both of these interconnections provide relatively limited transfer capacity, and in that sense limited competition to existing suppliers, the introduction of the pipelines nevertheless demonstrate the principal of interstate trade and facilitate the development of competitive secondary trading in the eastern Australian gas market which reinforces the competition effects of the interconnect.
In this study of regional gas supply and demand balances, we model all major existing and proposed transmission pipeline options in Australia. The current capacity and assumed potential maximum capacity for existing and proposed transmission pipelines is outlined in table 4. The location of these pipelines was illustrated in map 1 earlier.
4 Assumed capacities of gas pipelines in
2002 PJ/yr
Existing major transmission pipelines Moomba (Cooper) to Young 152
Young to Sydney 152
Interconnect (north/south) 19/8
Moomba (Cooper) to Adelaide 120
Port Campbell (Otway) to Melbourne 95
Longford (Gippsland) to Melbourne 420
Longford (Gippsland) to Sydney 65
Moomba (Cooper) to Ballera/Mt Isa 50
Wallumbilla (Bowen-Surat) to Brisbane 38
Palm Valley (Amadeus) to Darwin 30
Dampier (Carnarvon) to Bunbury 200
Proposed major transmission pipelines
Port Campbell (Otway) to Adelaide 50
Melbourne (Gippsland) to Adelaide 100
Longford (Gippsland) to Tasmania 50
Bayu Undan (Timor Sea) to Darwin 250
Darwin to Mt Isa/Moomba 200
Mt Isa to Townsville/Gladstone 100
Papua New Guinea to Brisbane 300
GAS SUPPLY AND DEMAND
20
One pipeline option which has not been included in the model analysis presented here, is an Australian trans-continental pipeline linking the North West Shelf region of Western Australia with eastern Australian gas markets. The development of a transcontinental gas pipeline has been mooted on a number of occasions previously (see for example AGA 1997), based principally on previous expectations that supplies in eastern Australia would decline by as early as 2000. Despite increasing concerns that eastern Australian supplies will not be able to keep pace with growing demand, there are several factors that favor development of alternative options to that of a transcontinental pipeline.
First, in connecting Dampier to Moomba through central Australia there is limited potential for demand over the length of the pipeline. Second, ABARE estimates the price of natural gas delivered via the proposed Darwin to Moomba, or alternatively the proposed Papua New Guinea to Queensland pipelines would both be lower than a Dampier to Moomba option. Similarly, ABARE estimates the delivered price of coal seam methane will be lower than that sourced from Western Australia. Third, utilising existing pipeline routes (such as from Mt Isa to Ballera in Queensland) would enable, in this case the Darwin to Moomba proposal, to economise on costs associated with establishing easements etc. There would appear to be limited scope for such duplication of existing routes with the transcontinental option.
International gas supplies Additional sources of natural gas are also available to Australia from the Timor Sea region, which is, at least in part, subject to current cooperative arrangements between Australia and East Timor, and the gas fields in the southern highlands of Papua New Guinea.
Timor Sea The Timor Sea, north of Australia is estimated to contain over 20 000 petajoules of natural gas (Office of Territory Development 2002). These resources are primarily in the areas subject to current cooperative arrangements between Australia and East Timor (i.e. the three zones of cooperation A, B and C). There are two primary gas deposits, Bayu–Undan (approximately 90 per cent Timorese – 10 per cent Australian) and the Greater Sunrise collection (approximately 18 per cent Timorese – 82 per cent Australian), which is mainly located in the Bonaparte basin.
The proposed development of a liquefied natural gas and gas to liquids industry in the Northern Territory is underpinning the extensive development of Timor Sea reserves and establishes the possibility that Timor Sea supplies could be piped through to Mt Isa in Queensland and Moomba in South Australia. For this analysis, the assumed price of Timor Sea gas delivered to Moomba is $2.86 per gigajoule.

GAS SUPPLY AND DEMAND
21
Papua New Guinea The Kutubu, Hides and south east Gobe deposits in the highlands of Papua New Guinea are estimated to contain upwards of 10 360 petajoules of natural gas reserves (Papua New Guinea Department of Petroleum Energy 2001). The proposal for a pipeline interconnection between the gas fields in Papua New Guinea’s southern highlands with Townsville and Gladstone in north central Queensland (and possibly even Brisbane), has been under consideration since at least the mid 1990s and along with Timor Sea supplies, opens up the possibility of Australia importing natural gas for the first time.
The viability of the 2500 km pipeline project (typically referred to as the PNG pipeline) relies on a large range of factors, but critically on securing sufficient foundation customers to underpin long term demand (estimated to be around 150 petajoules). The recent announcement that the proposed Townsville gas fired power station will be supplied by the Enertrade–CH4 consortium and not from the PNG pipeline illustrates the competitiveness of coal seam methane as an alternative source of supply in eastern Australia and the difficulties faced by the pipeline proponents in serving their base foundation customers (Sykes 2002). In this analysis, gas from the fields in Papua New Guinea’s southern highlands is assumed to have a delivered price, in Queensland (Brisbane), of around $0.08–0.44 per gigajoule above that assumed for Timor Sea gas and reflects both lower assumed supply prices and delivery costs for gas sources from the Timor Sea region. The decision on whether gas is routed from the Timor Sea or Papua New Guinea is determined in the modelling framework, on the basis of relative economic costs only and it is not explicitly assumed that the Papua New Guinea pipeline will go ahead in any particular year.

GAS SUPPLY AND DEMAND
22
3. Gas consumption
In this section further details on the outlook for natural gas demand are provided. As described earlier, the analysis of the gas supply and demand balance situation has been completed for both a reference case and a high demand scenario. Both of these scenarios are described in more detail below.
Reference case The reference case for gas demand used in this study is as published in Dickson et al. (2001) and the reader is referred to this report for a description of the projections. Overall, natural gas consumption is projected to increase by around 3.4 per cent a year over the period 1999-2000 to 2019-20. While slightly down on the growth in gas consumption experienced over the past decade (3.8 per cent a year), this is nevertheless relatively strong compared with growth in the other major primary fuels, coal and oil. Coal consumption in Australia is forecast to grow by around 1.1 per cent a year over the period from 1999-2000 to 2019-20, while oil consumption (largely underpinned by strong growth in the transport sector) is forecast to grow by 2.2 per cent a year over the same period. Over the twenty year period to 2019-20, gas’ share of Australian primary energy consumption is projected to increase from 18 per cent to 24 per cent (figure D).
On an industry by industry basis, gas use in the mining and electricity generation sectors is projected to increase strongly (4.4 and 4.8 per cent a year respectively), while gas use in the manufacturing, commercial and residential sectors is only forecast to increase by 3.2, 2.3 and 2.4 per cent a year, respectively (table 5).
One exception to this trend in the manufacturing sector is growth in the use of gas in the iron and steel industry. The iron and steel industry is projected to account for around 25 per cent of the forecast increase in final energy use in manufacturing with the fuel mix expected to shift strongly towards gas reflecting the development in Australia of a new direct reduced iron sector. Growth in gas consumption in the iron and steel industry is projected to average 11 per cent a year between 1998-99 and 2009-10 and 5.7 per cent a year between 2009-10 and 2019-20. In contrast, the consumption of coal byproducts and electricity (in the iron and steel sector) are each set to grow by only 1.8 per cent a year. By 2019-20 the iron and steel industry is projected to account for some 21 per cent of the manufacturing sectors’ end use demand for gas. The projected increase in gas use in the iron and steel sector (121 petajoules in total) represents 38 per cent of the total (forecast) increased use of gas in manufacturing and 27 per cent of the overall increased use of gas in final energy consumption.

GAS SUPPLY AND DEMAND
23
1999-2000
Black coal28%
Brown coal13%
Oil36%
Natural gas18%
Biomass4%
Other1%
2019-20
Black coal25%
Brown coal9%
Oil36%
Natural gas24%
Other1%
Biomass5%
Other includes hydro, wind and solar l i i
The reference case assumptions for gas consumption, on a state by state basis, are presented in table 6. Consistent with the outlook for strong overall growth in energy consumption in Western Australia and Queensland — reflecting the concentration of a range of energy intensive minerals and resource processing industries in these states — the demand for natural gas in these states is also projected to growth relatively strongly. Gas consumption in Queensland is forecast to increase three fold, while consumption in Western Australia is set to more than double.
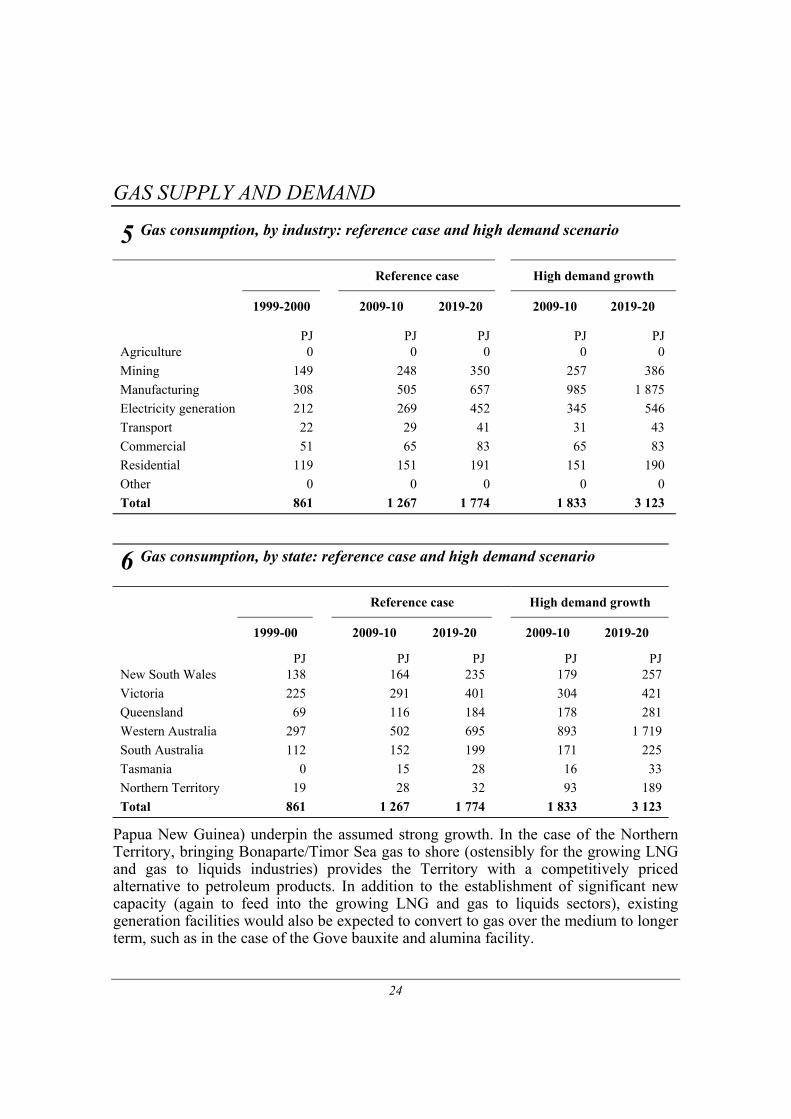
High gas demand scenario The assumptions for gas demand, by industry and by state, for the high gas demand scenario are also presented in tables 5 and 6. The principal differences between the reference case and the high demand case, in terms of the projected demand assumptions, relate to the outlook for gas use in electricity generation and the gas to liquids (GTL) industry (included in manufacturing), and for Australia’s exports of LNG. Each of these are discussed in turn below.
Electricity generation In the high demand scenario, gas consumption in electricity generation is assumed to grow over the study period by 4.8 per cent a year (rather than 3.8 per cent a year), adding almost 100 petajoules to total gas consumption. This growth is assumed to be concentrated in Queensland and the Northern Territory. In the case of Queensland, initiatives such as the current state government’s Clean Energy Policy, in addition to the expected availability of competitively priced supplies (either from northern Australia or
D Australian primary energy consumption, by fuel
GAS SUPPLY AND DEMAND
24
Papua New Guinea) underpin the assumed strong growth. In the case of the Northern Territory, bringing Bonaparte/Timor Sea gas to shore (ostensibly for the growing LNG and gas to liquids industries) provides the Territory with a competitively priced alternative to petroleum products. In addition to the establishment of significant new capacity (again to feed into the growing LNG and gas to liquids sectors), existing generation facilities would also be expected to convert to gas over the medium to longer term, such as in the case of the Gove bauxite and alumina facility.
6 Gas consumption, by state: reference case and high demand scenario Reference case High demand growth
1999-00 2009-10 2019-20 2009-10 2019-20
PJ PJ PJ PJ PJ New South Wales 138 164 235 179 257 Victoria 225 291 401 304 421 Queensland 69 116 184 178 281 Western Australia 297 502 695 893 1 719 South Australia 112 152 199 171 225 Tasmania 0 15 28 16 33 Northern Territory 19 28 32 93 189 Total 861 1 267 1 774 1 833 3 123
5 Gas consumption, by industry: reference case and high demand scenario Reference case High demand growth
1999-2000 2009-10 2019-20 2009-10 2019-20
PJ PJ PJ PJ PJ Agriculture 0 0 0 0 0 Mining 149 248 350 257 386 Manufacturing 308 505 657 985 1 875 Electricity generation 212 269 452 345 546 Transport 22 29 41 31 43 Commercial 51 65 83 65 83 Residential 119 151 191 151 190 Other 0 0 0 0 0 Total 861 1 267 1 774 1 833 3 123

GAS SUPPLY AND DEMAND
25
Gas to liquids The conversion of gas to liquids is a process that involves the catalytic conversion of methane into higher value-added hydrocarbons, such at methanol, diesel, lubricants, propellants and fuel additives. The development of a GTL industry in Australia has the potential to play an increasing role in the development of Australia’s vast gas reserves in western and northern Australia (including the Timor Sea) and has the potential to create a substantial liquid hydrocarbon industry, either for export or import replacement.
The development of a GTL industry is incorporated in the reference case, however, the growth assumed is relatively modest. In contrast, the outlook for GTL assumed in the high demand growth scenario is very strong, and illustrates the rapid increase in interest in this sector. In table 7, the details of the range of projects identified which underlie the outlook for GTL in the high demand growth scenario are presented.
This alternative outlook for GTL was prepared in consultation with the Commonwealth Department of Industry, Tourism and Resources, Invest Australia and a number of industry stakeholders and reflects a scenario where technological advances are achieved, particularly in the area of processing technologies, that drive down capital costs and enable GTL products to compete with crude oil. Other factors which are also seen as potential driving forces behind the development of GTL in Australia include the
7 Proposed gas to liquids projects Project Production Maximum gas
consumption Demand source
Startup date and location
Syntroleum Lubricants and specialty products (10 000 bpd)
41.5 PJ Domestic and export
2005-06 Sweetwater, WA
Methanex Methanol (3 million tonnes per year)
75.5 PJ Mostly exports 2008-09, WA
GTL Resources Methanol (1 million tonnes per year)
38 PJ Mostly exports 2005-06, WA
Coogee Chemicals Methanol (1 million tonnes per year)
38 PJ Mostly exports 2008-09, WA
Japan DME Ltd (Stage 1)
Di-methyl ether (4 000 tonnes per day)
60 PJ Mostly exports 2007-08, WA
DME International Corporation
Di-methyl ether (5 000 tonnes per day)
43 PJ Mostly exports 2008-09, WA
Sasol Chevron (Stage 1)
45 000 bpd of Diesel, Naphtha and LPG.
242 PJ Domestic and export
2007-08, WA
Sasol Chevron (Stage 2)
100,000 bpd of Diesel, Naphtha and LPG.
485 PJ Domestic and export
2010-11, WA
Australian Methanol
Methanol (3 million tonnes per year)
80 PJ Mostly exports 2014-15, Timor Sea

GAS SUPPLY AND DEMAND
26
expected depletion of oil reserves in the Asia Pacific along with rising exposure to middle east fuel sources, the perception of Australia as a reliable energy supplier and increased environmental standards being applied to petroleum production (especially diesel) supporting higher demand for GTL products.
LNG exports Cooling natural gas to a liquid state (at –161 degrees Celsius) reduces the storage volume of the gas by over 600 times. It is this fact that permits the economical transport of natural gas worldwide by specially built cargo ships. Australia is currently the world’s fifth largest LNG exporter behind Indonesia, Malaysia, Algeria and Qatar, supplying the markets of Japan, the Republic of Korea, Chinese Taipei and occasional spot sales to other countries such as the United States (British Petroleum 2001). In 1999-2000, Australia exported 431 petajoules or approximately 8 million tonnes of LNG from the North West Shelf project in Western Australia.
In the reference case, Australian LNG exports were projected to increase to 20 million tonnes by 2010-11 and then to increase further to 26 million tonnes by 2019-20. As with the GTL assumptions, the outlook for LNG exports was reviewed in consultation with the Department of Industry, Tourism and Resources and industry experts. In the alternative high demand growth scenario, LNG exports have been assumed to increase to 18 million tonnes by 2009-10 (2 million tonnes less than the reference case) but then to increase by a further 10 million tonnes to 28 million tonnes by 2019-20 (2 million tonnes higher than in the reference case). In the alternative scenario, around 4 million tonnes or some 14 per cent of total LNG exports are also assumed to be produced in the Northern Territory from Timor Sea supplies. Details of the upper range of currently proposed LNG projects are provided in table 8. In this analysis it has not been assumed that all of these projects will necessarily go ahead. Equally, these projects may involve floating facilities outside of Australian waters.
8 Current and proposed LNG projects Project Annual
production Maximum
consumption Startup date and location
Mt PJ North West Shelf (Trains 1–3) 8.0 436 In production, WA North West Shelf (Train 4) 4.2 232 2004-05, WA North West Shelf (Train 5) 4.0 217 2006-07, WA Gorgon 4.0 217 2010-11, WA Scott Reef/Brecknock 4.0 200 2014-15, WA Bayu–Undan 3.0 165 2006-07, Timor Sea Greater Sunrise 4.0 228 2007-08, Timor Sea

GAS SUPPLY AND DEMAND
27
4. Modeling results
In this section the results of the supply and demand balancing are presented. In table 9, a summary of the key model results is provided, including the estimated levels of production by basin, consumption by region and LNG exports for both demand scenarios. It should also be noted that for the purposes of this study, the modeling framework does not differentiate between gas produced in the Bonaparte basin or the Timor Sea more generally nor do we make any explicit assumptions regarding sharing arrangements between Australian and East Timor. Accordingly, the exact source of the gas and whether or not, strictly speaking, the gas is imported or not, is not determined.
Overview In the reference case, gas consumption in the eastern states is estimated to increase from 545 petajoules in 1999-2000 to almost 1050 petajoules by 2019-20. At the same time, however, supplies from eastern Australia (including coal seam methane) only increases to around 870 petajoules. In the high demand case this differential (of 280 petajoules) is estimated to increase to around 360 petajoules. In both cases, however, it is evident that even with a four fold increase in coal seam methane production, eastern market supplies will need to be supplemented from alternative sources in the relatively near future.
Given currently available information regarding production and transportation costs (and recognising the importance of the transportation tariff assumptions used in the analysis), the modeling results suggest the market potential for gas from the Bonaparte/Timor Sea region is high in the Northern Territory and Mt Isa markets and relatively more competitive (i.e. lower priced) than gas sourced from Papua New Guinea. In table 10, the estimated flows through the major gas interconnections represented in the model are shown for both demand scenarios.
Once delivered to Mt Isa, moderate amounts of gas can be routed to the southern markets utilising backhaul along the Ballera–Mt Isa pipeline. However, the current annual capacity of this pipeline is only 30 petajoules. Major supplies to the eastern markets requires the installation of a new pipeline to Moomba and/or Queensland.
The modeling undertaken in this study suggests the potential for the penetration of northern Australian gas into the southern markets (New South Wales, South Australia, Tasmania, Victoria) is limited, and largely relies on supply constraints developing in the southern markets. Having said that, significant potential exists for gas from northern Australia to supply both the growing markets of Queensland and the Northern Territory, as illustrated in table 10.

GAS SUPPLY AND DEMAND
28
9 Estimated gas supply and demand balance: 1999-2000 to 2019-20 Reference case High demand case
1999-2000 2009-10 2019-20 2009-10 2019-20
PJ PJ PJ PJ PJ Production Eastern Australian basins Adavale 1 1 1 1 1 Bass – 14 44 14 44 Bowen-Surat 27 10 – 10 – Cooper–Eromanga 232 223 242 222 237 Gippsland 202 308 396 344 483 Otway 8 59 85 59 90 Subtotal 471 614 767 650 855 Northern and central Australian Amadeus 19 28 7 28 7 Bonaparte and Timor Sea – – 248 348 584 Browse – – – – – Subtotal 19 28 255 376 592 Western Australian basins Carnarvon 718 1 474 1997 1 806 3 021 Perth 10 6 1 6 1 Subtotal 728 1 480 1 998 1 811 3 022
Other gas supplies Coal seam methane a 28 67 105 69 109 Others bc 46 59 63 59 63
Total gas production 1292 2 248 3 188 2 965 4 640
Consumption
New South Wales 138 164 235 179 256 Victoria 225 291 401 304 421 Queensland 69 116 184 178 281 Western Australia 297 502 695 893 1 719 South Australia 112 152 199 171 225 Tasmania 0 15 28 16 33 Northern Territory 19 28 32 93 189 Total gas 861 1 268 1 774 1 833 3 123
LNG exports 431 979 1 414 1 132 1 517 a From Queensland and New South Wales coal basins. b Includes ethane, landfill and sewage gas and town gas. c Ethane from the Cooper–Eromanga and the Gippsland basins are assumed to be constant over the period based on 1999-2000 production.

GAS SUPPLY AND DEMAND
29
10 Estimated gas throughputs for major pipelines
Current Reference case High demand scenario
2000 2009-10 2019-20 2009-10 2019-20
PJ PJ PJ PJ PJ
Existing pipelines Moomba to Sydney 122 85 98 98 124 Moomba to Adelaide 110 120 147 106 120 Longford to Melbourne 205 260 346 272 364 Longford to Sydney 0 55 75 55 85 Wallumbilla to Brisbane 28 38 42 50 56 Amadeus to Darwin 19 28 7 28 7 Dampier to Bunbury 200 215 298 277 300 Proposed pipelines Otway to Adelaide 0 26 46 35 50 Gippsland to Adelaide 0 0 0 35 55 Gippsland to Tasmania 0 14 28 16 33 Timor Sea to Darwin 0 0 140 135 265 Darwin to Mt Isa 0 0 115 70 190 Mt Isa to Townsville 0 0 85 45 134 PNG to Brisbane 0 0 0 0 0
Victoria The assumed growth in gas consumption in Victoria, in both the reference case and the high demand scenario, is relatively modest, although in the case of Victoria, base year consumption levels are significantly higher than for either South Australia or New South Wales. Nevertheless, the results indicate that the majority of Victoria’s needs will continue to be met from local Gippsland basin supplies for the foreseeable future. Given pipeline capacity constraints and relative tariffs, interstate supplies (through the short interconnect linking Cooper–Eromanga to Victoria) are only expected to meet less than 10 per cent of total Victorian requirements.
South Australia Gas consumption in South Australia has remained relatively static over recent years in the face of strong competition from imports of lower priced electricity from Victoria. This trend is assumed to continue under both scenarios with overall gas consumption assumed to increase by around 2.9 per cent a year over the study period. The results of the supply and demand balancing indicate that in the reference case any increase in the

GAS SUPPLY AND DEMAND
30
consumption of gas in South Australia is met by a combination of supplies from the Cooper–Eromanga and Otway basins. In the high demand case, additional supplies are sourced from the Gippsland basin which results in a reduction in the consumption (in South Australia) of gas sourced from the Cooper–Eromanga basin. The ongoing availability of supplies from each of these basins in the South Australian market excludes the necessity to source gas from further afield, at least in the period to 2019-20. The modeling results do not indicate there will be any backhauling of gas from Mt Isa to Ballera nor duplication of the existing pipeline.
New South Wales In the case of New South Wales, the majority of supplies will continue to be sourced from the Cooper–Eromanga and (increasingly) Gippsland basins. In the reference case the eastern gas pipeline (from the Gippsland basin) provides around 75 petajoules or 35 per cent of total New South Wales supplies by 2014-15. In the high demand scenario this figure increases to around 85 petajoules.
It is also evident from the results presented in table 10 that in the high demand case, lower consumption of Cooper–Eromanga gas by South Australia releases this gas to the Sydney and Brisbane markets. In both scenarios, however, the greater uptake of coal seam methane is also required to balance New South Wales state needs. This growth in coal seam methane depends in large part on technological advances being achieved in this sector to reduce supply prices and improve it’s relative competitive.
Queensland In both the reference case and the high demand scenario, additional (new) supplies of gas will be required to support the growth in gas consumption in Queensland, which is projected to grow by as much as 5–7 per cent a year over the period to 2019-20, depending on the demand outlook. Electricity generation and manufacturing (particularly energy intensive minerals processing) are the primary catalysts to the strong growth expected in this state and account for the majority of this forecast increase in gas use.
The results of the supply and demand balancing indicate natural gas piped from Australia’s north (such as from the Bonaparte or Timor Sea basins) via Darwin and Mt Isa to Queensland (including to the Gladstone and Townsville markets), in combination with coal seam methane sourced locally in Queensland’s southeast, would provide sufficient supplies to meet forecast demands. In the reference case, the modeling suggests additional supplies from the Bonaparte/Timor Sea region would come onstream in the period 2011-15. In the high demand case, as early as 2006–10.
Under both scenarios, gas sourced from Australia’s north would supply around 65 per cent of the Queensland market by 2019-20, equating to around 115 petajoules in the

GAS SUPPLY AND DEMAND
31
reference case and 190 petajoules in the high demand case. As indicated in table 10, 85 petajoules (in the reference case) or 134 petajoules (in the high demand case) is estimated to flow through Mt Isa and on to Queensland’s eastern markets at Townville, Gladstone and Brisbane.
As with New South Wales, coal seam methane is also expected to increase its stake in the market with supplies increasing to around 60 petajoules by 2019-20 under both scenarios, representing 20–30 per cent of the Queensland market.
Northern Territory There is a stark difference in the projected outlook for gas consumption in the Northern Territory, depending on whether you consider the reference case or the high demand case. In the former, the growth in gas consumption is projected to average 2.6 per cent a year with total gas consumption forecast to be only around 30 petajoules by 2019-20. In contrast, the high demand case has consumption increasing by some 11 per cent a year to reach 162 petajoules by the end of the period. This difference reflects revised assumptions relating to the development of LNG facilities in the Northern Territory (with production peaking at 4 million tonnes a year by 2009-10) as well as the growth in Australia’s gas to liquids sector. In total, some 370 petajoules of gas is estimated to come ashore in the Northern Territory by 2019-20. In terms of the balance modeling, all Northern Territory supplies are sourced directly from the Bonaparte/Timor Sea region.
Western Australia As with the Northern Territory, the situation in Western Australia differs significantly depending on the scenario. In the high demand case, the continued growth in Australian LNG exports, coupled with growth in gas to liquids, is forecast to result in gas consumption in 2019-20 of some 1700 petajoules, representing an increase of over 9 per cent a year. Western Australian gas demand is almost exclusively met from the Carnarvon basin with only limited supplies sourced from the Perth Basin. In terms of the supply and demand balance, however, with the transcontinental pipeline not considered a realistic option, the western Australian resources do not feature in the final analysis of eastern Australia’s gas balance.
Depleted eastern Australian reserves One of the key outcomes of the analysis is that while the south eastern markets of New South Wales, South Australia, Victoria and Tasmania all continue to be supplied from existing eastern Australian sources, at the end of the study period the Gippsland, Otway, Cooper–Eromanga and Bass basins will all be depleted or nearing depletion, suggesting that an analysis that encompassed a longer time frame might reveal different results.
In table 11, estimates of the reserves to production ratio in 2019-20 are provided for each of the gas basins. These estimates were derived by dividing estimated reserves

GAS SUPPLY AND DEMAND
32
remaining in 2019-20 by the projected level of production at that time. Collectively, the eastern Australian basins are estimated to contain only 3 years of production in 2019-20. The Bowen–Surat basin is expected to be depleted by as early as 2008-09, which largely underpins the shipping of gas from northern Australia to Queensland.
Of course as discussed previously (in section 2), the assumption we have made that total reserves do not increase over the study period is likely to lead to an underestimation of the (future) reserve to production ratio. With oil exploration expected to increase in light of declining domestic oil reserves, Australian gas discoveries could reasonably be expected to continue over the forecast period. However, as was also mentioned previously, almost all the new gas discoveries are expected to occur in the Carnarvon, Browse, Bonaparte and Timor Sea basins and hence will not necessarily alleviate the principal issue, which is a shortfall in gas supplies in eastern Australian markets, rather than a shortfall in Australian supplies in total.
In the reference case, the reserve to production ratio in Australia’s western and northern basins is still as high as 21 and 110 years, respectively. Even under the high growth scenario, including a significant ramping up in both LNG and gas to liquids, the reserve to production ratio for the Amadeus and Bonaparte basins totals 68 years. It is evident from these results that even despite conservative reserve estimates, Australia has substantial natural gas reserves to supply both domestic needs and underpin significant growth in the burgeoning LNG and GTL export industries.
11 Estimated reserves to production ratio in 2019-20 Reference case High demand scenario
years years
Eastern Australian basins 3 3 Adavale 0 0 Bass 1 1 Bowen-Surat 0 0 Cooper-Eromanga 1 1 Gippsland 3 3 Otway 6 6
Northern and central Australian basins 110 68 Amadeus 22 22 Bonaparte 57 33 Browse 0 0
Western Australian basins 21 10 Carnarvon 21 10 Perth 5 5 Total 27 16

GAS SUPPLY AND DEMAND
33
5. Conclusions
Australia has substantial natural gas reserves and has sufficient to supply domestic needs for the foreseeable future and to underpin growth in Australia’s established LNG export sector and the emerging gas to liquids industry. Australia may also access additional substantial sources of natural gas in the Timor Sea and southern highlands of Papua New Guinea with the development of the necessary transport infrastructure. Coal seam methane is also a resource that is locally available (in Queensland and New South Wales) which can add significantly to the gas supply mix.
The key conclusion from this analysis of Australia’s gas supply and demand balance is there are more than sufficient supplies (given projected reserves and production levels) to meet Australia’s growing gas demand well past 2019-20. However, given the regional distribution of resources, the eastern Australian market will be increasingly dependent on new sources of supply. The modeling results suggest the most likely source of these new supplies is gas piped from Australia’s north (such as from the Timor Sea region) via Darwin and Mt Isa to Queensland in combination with coal seam methane sourced locally from Queensland and New South Wales coal fields. Over the study period the south eastern markets of New South Wales, South Australia, Tasmania and Victoria continue to be supplied from existing (and emerging) sources in the Cooper–Eromanga, Gippsland, Bass and Otway basins, in addition to New South Wales increasing it’s utilisation of coal seam methane resources.
By the end of the study period, however, almost all eastern Australian gas resources are depleted or nearing depletion, with the eastern basins estimated to collectively have only three years worth of production remaining in 2019-20 (based on estimated 2019-20 production levels).
It is recognised that an overriding limitation of the methodology used here relates to the assumption that reserves do not increase in the study period. Undoubtedly this means the results of the analysis err on the conservative side, particularly given the recent growth in exploration activity in the Bass, Otway and Gippsland areas. Significant exploration is also occurring in the Carnarvon, Browse, Bonaparte and Timor Sea basins off western and northern Australia. Nevertheless, while the conclusions drawn here regarding the depletion of commercial gas reserves in eastern Australia may be overstated, it is unlikely this error is egregious; it is more a matter of when than if. Having said that, a study that encompasses the period beyond 2019-20 and also addresses the issue of what outcomes might be achieved from current exploration efforts, might well reveal a qualitatively different set of outcomes.

GAS SUPPLY AND DEMAND
34
Appendix A: Model outline
To examine the supply and demand balance for gas in Australia, a modeling framework was developed building on ABARE’s MARKAL model. For further details on the gas model pipeline framework, see Harman (2000). The model includes a representation of all major supply and consumption points and transportation pipelines in the Australian gas market including all potential sources of natural gas in Australia (domestic and international), by basin (including coal seam methane); all existing and proposed pipeline configurations and regional (state based) gas demands, by industry.
The model is used to provide insight to (and in fact to determine) changes in inter-regional flows and the demand and supply balances, by region (or state) under alternative consumption scenarios.
The flows of gas from producing areas to consumption points depend on the exogenously determined consumption and supply parameters and by the relative supply and transportation costs (tariffs) provided to the model as data.
As discussed previously, both a reference case and high gas demand growth scenario were simulated using the model. The gas consumption projections, by region, for the reference case were sourced from Dickson et al. (2001). The high gas demand growth scenario estimates were derived in consultation with relevant experts. In both cases it was necessary to make assumptions regarding long term changes in contracted supply for each of the defined markets. Generally speaking, the proportion of demand associated with long term contracts was reduced over the projections period.
The projections for gas consumption in the high gas demand case are reflective of a scenario where future market dynamics enhance the competitiveness of gas against other fuels (such as coal, oil and electricity) and stimulate further growth in gas consumption. In particular higher growth in gas use is assumed to occur in the electricity generation and manufacturing sectors, driven principally by lower supply prices, which are themselves assumed to flow from continued gas market reforms (and particularly upstream competition). At the same time, however, the accelerated depletion of low cost resources, particularly in the eastern states, which are supplemented from higher cost sources, will place a limit on any decreases in the price of delivered gas.
The forecast assumptions for Australia’s natural gas production, by basin, were estimated by ABARE using standard historical trend analysis techniques. In cases where limited historical information was available or the implied trends were not

GAS SUPPLY AND DEMAND
35
consistent with industry expectations, the supply projections were estimated using ABARE’s best judgment.
The gas supply price, for each source, was derived from available information and provided to the model as an input assumption. For simplicity, the assumed supply price for each basin was set as a constant and does not vary with the volume of gas sold, nor the degree to which reserves are depleted (i.e. the price does not escalate as producers begin to access gas from tighter formations). As discussed previously, at a given point gas production is expected to cease when the costs associated with extracting the last of the gas from tight formations render further production uneconomic.
It is an explicit assumption that gas consumption in any particular region will not be constrained by pipeline infrastructure; additional pipeline capacity is added to the existing stock where increases in demand warrant this new investment. In the modeling framework, existing pipeline capacities can be increased by adding compressors, through the partial duplication of the pipeline (i.e. looping) or by the addition of new pipelines. The model then estimates which investment option is preferred in terms of minimising long term energy system costs. For example, where demand in Queensland warrants new investment in pipeline capacity, the model is used to evaluate the relative merits of PNG gas, Timor sea gas or indeed coal seam methane in meeting demand.
To provide an accurate representation of the costs of transmission, the model representation includes details on pipeline capacity, new capital investment, load flows and pipeline tariffs. Information from various published access arrangements and associated sources are also used to set the appropriate tariff price paths for each of the respective pipelines. The model results depend to a large degree on the input assumptions, such as those that relate to optimal pipeline sizes, costs and tariffs for new pipelines. While not fully documented here, these details were sourced from a range of studies undertaken in this area.

GAS SUPPLY AND DEMAND
36
References
ABARE 2001, Australian Commodity Statistics 2001, Canberra (and previous issues). Australian Gas Association 1997, Gas supply and demand study 1997 – Participants’ Report, Fourth report to participants on the findings of a study into Australia’s natural gas supply and demand to the year 2030, Canberra (and previous editions).
Australian Gas Association 2001, Gas Statistics Australia 2001, Canberra. Australian Greenhouse Office (AGO) 1999, National Greenhouse Gas Inventory 1999, Canberra.
BHP Billiton 2002, Submission to the CoAG Energy Market Review, Canberra. British Petroleum 2001, BP statistical Review of World Energy, London. Brown, K., Casey, D.A., Enever, R.A. and Wright, K. 1996, New South Wales Coal Seam Methane Potential, Geological Survey of New South Wales Coal and Petroleum Geology, New South Wales Department of Mineral Resources, Sydney.
Bush, S., Dickson, A., Harman, J. and Anderson, J. 1999, Australian Energy: Market Developments and Projections to 2014-15, ABARE Research Report 99.4, Canberra.
Dalziell, I., Noble, K. and Ofei-Mensah, A. 1993, The Economics of Interconnections: Electricity Grids and Gas Pipelines in Australia, ABARE Research Report 93.12, Canberra.
Davidson, R.M., Sloss, L.L., and Clarke, L.B. 1995, Coalbed Methane Extraction, IEA Coal Research, London.
Department of Industry, Tourism and Resources (DITR) 2001, Australian Petroleum Statistics, Canberra, December (and previous issues).
Dickson, A., Thorpe, S., Harman, J., Donaldson, K., Tedesco, L. 2001, Australian Energy: Projections to 2019-20, ABARE Research Report 01.11, Canberra.
ExxonMobil 2002, Submission to the CoAG Energy Market Review, Canberra. Geoscience Australia 2001, Oil and gas resources of Australia 2000, Canberra (and previous issues).
Harman, J. 2000, ‘Gas market development and regional gas flows in eastern Australia’, ABARE Conference paper 2000.12, 23rd Annual IAEE International Conference, International Association of Energy Economics, Sydney, 7-10 June.

GAS SUPPLY AND DEMAND
37
Harman, J. and Roberts, A. 2001 ‘Gas market competition’, in Outlook 2001, Proceedings of the National OUTLOOK Conference, Canberra, 27 February-1 March, Volume 3, Minerals and Energy, ABARE, Canberra.
Industry Commission (IC) 1991, Energy generation and Distribution, Report no. 11, AGPS, Canberra.
New South Wales Department of Mineral Resources 1994, Coal seam methane, Minefact, No. 44, Sydney, (www.minerals.new.gov.au/minefacts/44htm).
Office of Territory Development 2002, Oil and gas fact sheet, (www.otd.nt.gov.au). Papua New Guinea Department of Petroleum Energy 2000, 2000 Annual Report on Petroleum Activity in Papua New Guinea, Exploration Branch, Port Morsbey (and previous editions).
Riley, M. 2002, ‘Coal bed methane: a commercial reality’, Paper presented at the Australian Coal Seam and Mine Methane Conference, 25–26 June, Sydney.
2002. Sydney Gas Company 2000, ‘Sydney Gas Aiming High’, in Minfo, Mineral Resources New South Wales, Mining and Exploration Quarterly, no. 66, pp. 6-7, Sydney.
Sykes, T. 2002, ‘It’s going to be gas, gas, gas for Macquarie’, Australian Financial Review, 20 July, pp. 12.
Upstream Issues Working Group (UIWG) 1998, Report of the National Access Regime, Position Paper, Commonwealth Department of Industry, Tourism and Resources, March, Canberra.
VENCorp 1999, Victorian and other eastern state gas supplies: 1999-2025, (www.vencorp.com.au/docs/gasplng).
Western Australian Department of Mineral and Petroleum Resources 2002, Petroleum in Western Australia, Perth.
Woollands, M., Wong, D. and Bernecker, T. 2002, Victorian Supplement 2002, Basin Studies Group, Petroleum Development Branch, Victorian Department of Natural Resources and Environment, Melbourne (www.pesa.com.au/publications/PESA).