Embed Size (px)
Citation preview
Australian Gambling Statistics
1984–85 to 2009–10
28th edition
Australian Gambling Statistics 28th edition Released December 2012 Prepared by the Government Statistician, Queensland Treasury and Trade. ISSN: 1833-6337 The cooperation of all Australian state and territory governments is gratefully acknowledged. Disclaimer While great care has been taken in the preparation of this publication and each Australian state and territory has been asked to verify its own data in detail, it is nevertheless necessary to caution users concerning the complete accuracy of all data. No warranty is given as to the correctness or completeness of the information in this publication. The State of Queensland and each Australian state and territory expressly disclaim all and any liability (including all liability from or attributable to any negligent or wrongful act or omission) to any persons whatsoever in respect of anything done or omitted to be done by any such person in reliance, whether in whole or in part, upon any of the material in this publication.
http://creativecommons.org/licenses/by/3.0/au/ Australian Gambling Statistics, 28th Edition © The State of Queensland (Queensland Treasury and Trade) (2012) For more information about the Australian Gambling Statistics including requests for further uses of the material in this publication, please contact Queensland Treasury and Trade’s Government Statistician: Phone: 07 3035 6418 Email: [email protected] Facsimile:07 3227 7437 Office: Level 8, 33 Charlotte Street, Brisbane QLD 4000 Postal: PO Box 15037, City East QLD 4002 Website: www.oesr.qld.gov.au
Australian Gambling Statistics 1984–85 to 2009–10, 28th Edition
i
CONTENTS
PART 1: EXPLANATORY NOTES ................................................................................ iii
1.1 Introduction ............................................................................................................. 1
1.2 Scope of the publication.......................................................................................... 1
1.3 Background ............................................................................................................. 1
1.4 Glossary .................................................................................................................. 2
1.5 Overview of gambling data ..................................................................................... 7
1.6 Notes on data specific to each state and territory ................................................... 8
1.6.1 New South Wales ........................................................................................... 8
1.6.2 Victoria .......................................................................................................... 10
1.6.3 Queensland ................................................................................................... 10
1.6.4 South Australia .............................................................................................. 16
1.6.5 Western Australia .......................................................................................... 18
1.6.6 Tasmania ...................................................................................................... 19
1.6.7 Australian Capital Territory ........................................................................... 21
1.6.8 Northern Territory .......................................................................................... 22
1.7 Cautionary note .................................................................................................... 23
PART 2: LIST OF TABLES .......................................................................................... 24
2.1 Summary Tables ................................................................................................... 25
2.2 Tables by State ..................................................................................................... 25
2.3 Tables by Gambling Products ............................................................................... 37

Australian Gambling Statistics 1984–85 to 2009–10, 28th Edition
ii
This page has been left intentionally blank
Australian Gambling Statistics 1984–85 to 2009–10, 28th Edition
iii
PART 1: EXPLANATORY NOTES
Australian Gambling Statistics 1984–85 to 2009–10, 28th Edition
1
1.1 Introduction Australian Gambling Statistics is the official collection of Australian data on legalised regulated gambling for which accurate figures are available. The Australian Gambling Statistics publication is produced by the Government Statistician (GS) in cooperation with all state and territory governments. GS is a part of Queensland Treasury and Trade and is the principal demographic and social statistics research agency for the Queensland Government.
1.2 Scope of the publication The 28th edition of Australian Gambling Statistics updates data for the financial years 1984−85 to 2009−10. The publication comprises statistics on turnover, expenditure and government revenue from gambling activities conducted in the Australian states and territories. It is important to note that the statistics for each individual state or territory include turnover and expenditure generated by overseas and interstate visitors as well as that generated by residents of that state or territory.
All dollar figures are in nominal terms except where a table is denoted as being in real terms. See Glossary item ‘CPI deflator’ for an explanation of how real dollar figures are calculated for the purpose of this publication.
1.3 Background The development of a database of statistics on gambling on a national basis was formally proposed at the June 1983 Conference of Government Racing Officials held in Darwin. The Conference agreed to draw attention to the relative absence of reliable economic and social data on gambling, and resolved that this information be collected, collated and shared on a national basis.
Led by the existing statistical collections of the (then) Tasmanian Racing and Gaming Commission, it was recommended that the racing and gaming administrations of other state and territory governments develop their own statistical base to assist in the development of a national gambling statistical record.
At the September 1983 Racing and Gaming Ministers’ Conference held in Melbourne, it was resolved:
That the Conference approve the establishment of a National Statistical Data Bank and each state and territory agree to submit all available racing and gaming statistics in a consistent format to the Tasmanian Racing and Gaming Commission for collation and analysis. A report is to be presented detailing the data to each Minister. A review of the effectiveness of this service will be undertaken at the next Racing and Gaming Ministers’ Conference.
In line with the conference resolution the Commission, with the assistance of a firm of economic consultants, extracted from published records a significant quantity of data relating to gambling turnover in each state and territory since 1972. This information was circulated to each state and territory for the purposes of correction and the addition of data that were not readily obtainable from available sources.
The first consolidation and assessment of these data was produced for the Racing and Gaming Ministers’ Conference in late 1984. At the Commission’s request, it was subsequently approved that the report be made publicly available. The Tasmanian Gaming Commission continued to produce annual statistics until 2004, when the Government Statistician (formerly Office of Economic and Statistical Research), within Queensland Treasury and Trade (formerly Queensland Treasury) was endorsed by jurisdictional CEOs to produce the publication on an ongoing basis.

Australian Gambling Statistics 1984–85 to 2009–10, 28th Edition
iv
This page has been left intentionally blank
Australian Gambling Statistics 1984–85 to 2009–10, 28th Edition
2
1.4 Glossary Bookmakers off-course: These figures relate to the amount wagered via off-course bookmakers. In Tasmania it represents the figure for sports betting or amounts wagered on events other than horse racing or greyhound racing.
Bookmakers on-course: These figures relate to the amount wagered via bookmakers at the race track on both horse and greyhound racing. A player can wager any amount above a set minimum and will receive the bookmaker’s odds at the time of making the wager. Those odds stand, irrespective of whether the bookmaker alters the odds at a later time. Bookmakers are licensed in each jurisdiction.
Casino gaming: The various figures reported under this heading represent wagers at casinos and include wagers on table games, gaming machines and keno systems.
Casino turnover: The casino turnover figure is actually a combination of handle and turnover. Turnover is the amount wagered on a gambling activity whereas handle is a term used to describe the amount of money exchanged for gaming chips at a gaming table. It is difficult, if not impossible, to record the amount of each wager made on a table game. Therefore it is difficult to report casino turnover accurately. Hence, the only amount that can be reported for table games is handle. Readers are therefore urged to use casino turnover figures with care.
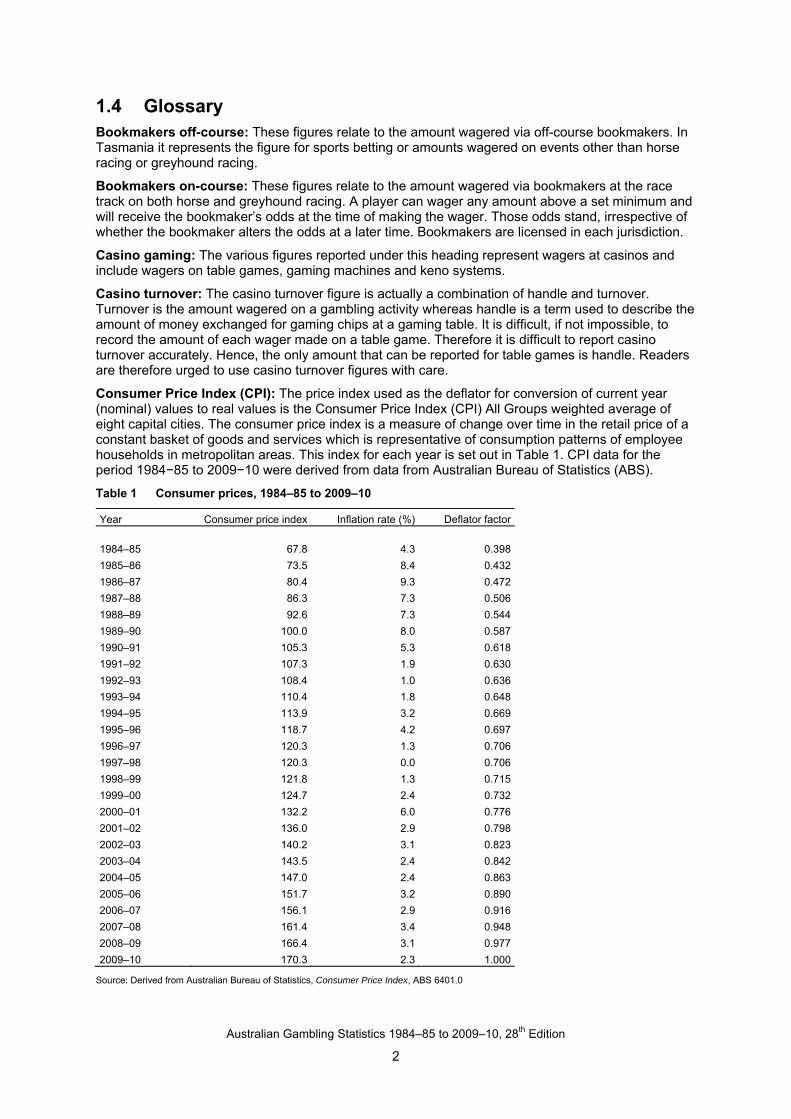
Consumer Price Index (CPI): The price index used as the deflator for conversion of current year (nominal) values to real values is the Consumer Price Index (CPI) All Groups weighted average of eight capital cities. The consumer price index is a measure of change over time in the retail price of a constant basket of goods and services which is representative of consumption patterns of employee households in metropolitan areas. This index for each year is set out in Table 1. CPI data for the period 1984−85 to 2009−10 were derived from data from Australian Bureau of Statistics (ABS).
Table 1 Consumer prices, 1984–85 to 2009–10
Year Consumer price index Inflation rate (%) Deflator factor
1984–85 67.8 4.3 0.398
1985–86 73.5 8.4 0.432
1986–87 80.4 9.3 0.472
1987–88 86.3 7.3 0.506
1988–89 92.6 7.3 0.544
1989–90 100.0 8.0 0.587
1990–91 105.3 5.3 0.618
1991–92 107.3 1.9 0.630
1992–93 108.4 1.0 0.636
1993–94 110.4 1.8 0.648
1994–95 113.9 3.2 0.669
1995–96 118.7 4.2 0.697
1996–97 120.3 1.3 0.706
1997–98 120.3 0.0 0.706
1998–99 121.8 1.3 0.715
1999–00 124.7 2.4 0.732
2000–01 132.2 6.0 0.776
2001–02 136.0 2.9 0.798
2002–03 140.2 3.1 0.823
2003–04 143.5 2.4 0.842
2004–05 147.0 2.4 0.863
2005–06 151.7 3.2 0.890
2006–07 156.1 2.9 0.916
2007–08 161.4 3.4 0.948
2008–09 166.4 3.1 0.977
2009–10 170.3 2.3 1.000
Source: Derived from Australian Bureau of Statistics, Consumer Price Index, ABS 6401.0
Australian Gambling Statistics 1984–85 to 2009–10, 28th Edition
3
Expenditure (gross profit): Expenditure is the net amount lost or, in other words, the amount wagered less the amount won, by people who gamble. Conversely, by definition, it is the gross profit (or gross winnings) due to the operators of each particular form of gambling.
Football Pools (Pools): The Pools is a numbers game of chance where the winning numbers are based on the results of the United Kingdom or Australian soccer matches.
Each week 38 soccer matches are selected to form a ‘match list’. Each match is assigned a number from 1 to 38. The results of the matches are then collected and ranked, with scored draws ranked highest and home score wins ranked lowest. The six highest-ranked match numbers are then used as the official results numbers for the Pools draw. There is also a supplementary number selected which is the seventh-highest-ranked match result. To play the Pools, players select six numbers from the 38. If the selected numbers are the same as the official results numbers, the player wins one of the five prize divisions.
The Pools is administered by SA Lotteries on behalf of the Australian Soccer Pools Bloc. The bloc was formed in June 1989 by lottery jurisdictions in Australia. The purpose of the bloc is to promote the game of Soccer Pools and produce accurate and uniform prize pools and dividends for subscribers to the game.
Gambling: Gambling is the placement of a wager or bet on the outcome of a future uncertain event. In this document, it includes lawful gaming, racing and sports betting activities. The statistics presented in this publication are for legalised regulated gambling for which accurate figures are available, and hence do not represent turnover or expenditure on all forms of gambling.
Gaming: Gaming is all legal forms of gambling other than racing and sports betting, such as lotteries, poker and gaming machines, casino gaming, football pools, interactive gaming and minor gaming (which is the collective name given to raffles, bingo, lucky envelopes and the like).
Gaming machines: All jurisdictions, except Western Australia, have a statewide gaming machine (poker machine) network operating in clubs and/or hotels. The data reported under this heading do not include gaming machine data from casinos.
Gaming machines accurately record the amount of wagers played on the machines. So turnover is an actual figure for each jurisdiction. In most jurisdictions operators must return at least 85 per cent of wagers to players as winnings, either by cash or a mixture of cash and product. Gaming machines may be linked together in order to offer major jackpots.
Government revenue: Government revenue is the revenue received by state government from gambling activities that are subject to state taxes and levies.
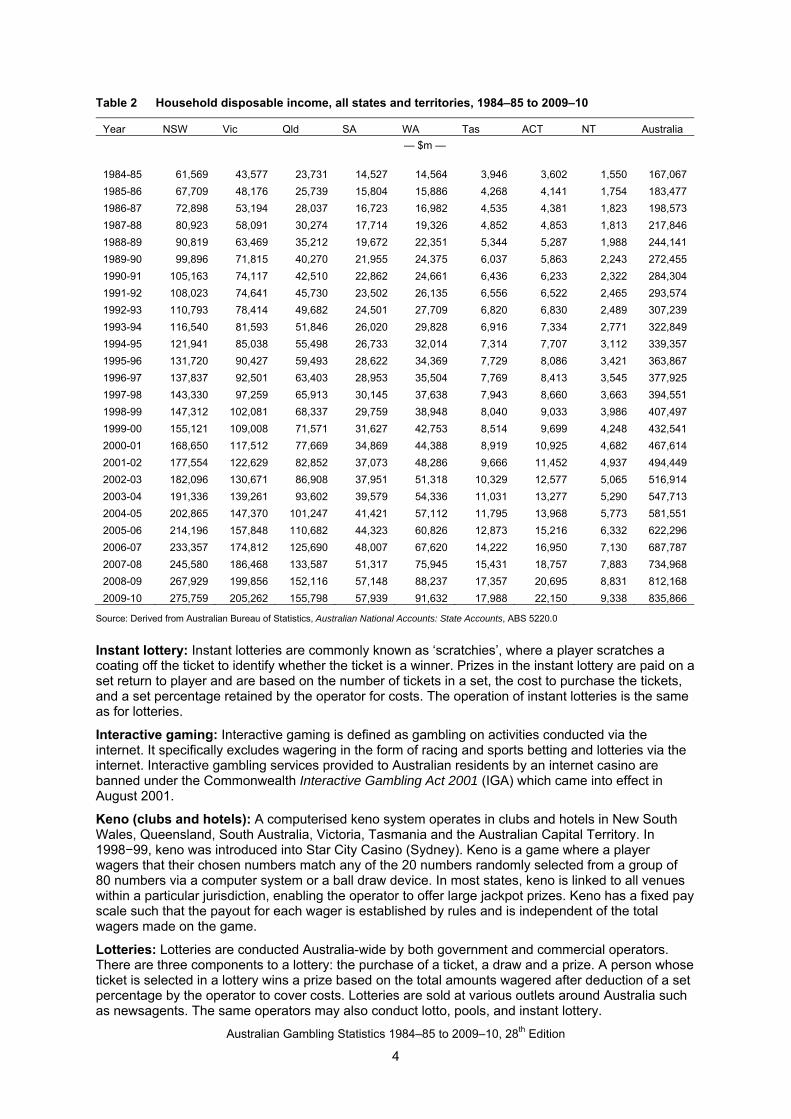
Household disposable income (HDI): Household gross disposable income is defined as gross household income less income tax payable, other current taxes on income, wealth etc., consumer debt interest, interest payable by unincorporated enterprises and dwellings owned by persons, net non-life insurance premiums and other current transfers payable by households.
Information on HDI by state and territory has been derived from data taken from the ABS. Data on HDI were taken from the revised ABS series on ‘Household Gross Disposable Income’, reported by state and territory in the Australian National Accounts: State Accounts for the 1989−90 to 2009−10 period only, with only the total Australian HDI published for the years prior to 1989−90. Annual HDI figures for each state and territory prior to 1989−90 have been estimated by GS by taking previously published estimates of household disposable income for the states and territories and raising these estimates to match the current Australian series in the period 1984−85 to 1988−89 (see Table 2).
When interpreting gambling figures as a proportion of HDI by state and territory, users of the data should note that such data represent expenditure within the jurisdiction concerned, and do not adjust for interstate or international gamblers. No relevant data are collected on interstate gamblers.
Australian Gambling Statistics 1984–85 to 2009–10, 28th Edition
4
Table 2 Household disposable income, all states and territories, 1984–85 to 2009–10
Year NSW Vic Qld SA WA Tas ACT NT Australia
— $m —
1984-85 61,569 43,577 23,731 14,527 14,564 3,946 3,602 1,550 167,067
1985-86 67,709 48,176 25,739 15,804 15,886 4,268 4,141 1,754 183,477
1986-87 72,898 53,194 28,037 16,723 16,982 4,535 4,381 1,823 198,573
1987-88 80,923 58,091 30,274 17,714 19,326 4,852 4,853 1,813 217,846
1988-89 90,819 63,469 35,212 19,672 22,351 5,344 5,287 1,988 244,141
1989-90 99,896 71,815 40,270 21,955 24,375 6,037 5,863 2,243 272,455
1990-91 105,163 74,117 42,510 22,862 24,661 6,436 6,233 2,322 284,304
1991-92 108,023 74,641 45,730 23,502 26,135 6,556 6,522 2,465 293,574
1992-93 110,793 78,414 49,682 24,501 27,709 6,820 6,830 2,489 307,239
1993-94 116,540 81,593 51,846 26,020 29,828 6,916 7,334 2,771 322,849
1994-95 121,941 85,038 55,498 26,733 32,014 7,314 7,707 3,112 339,357
1995-96 131,720 90,427 59,493 28,622 34,369 7,729 8,086 3,421 363,867
1996-97 137,837 92,501 63,403 28,953 35,504 7,769 8,413 3,545 377,925
1997-98 143,330 97,259 65,913 30,145 37,638 7,943 8,660 3,663 394,551
1998-99 147,312 102,081 68,337 29,759 38,948 8,040 9,033 3,986 407,497
1999-00 155,121 109,008 71,571 31,627 42,753 8,514 9,699 4,248 432,541
2000-01 168,650 117,512 77,669 34,869 44,388 8,919 10,925 4,682 467,614
2001-02 177,554 122,629 82,852 37,073 48,286 9,666 11,452 4,937 494,449
2002-03 182,096 130,671 86,908 37,951 51,318 10,329 12,577 5,065 516,914
2003-04 191,336 139,261 93,602 39,579 54,336 11,031 13,277 5,290 547,713
2004-05 202,865 147,370 101,247 41,421 57,112 11,795 13,968 5,773 581,551
2005-06 214,196 157,848 110,682 44,323 60,826 12,873 15,216 6,332 622,296
2006-07 233,357 174,812 125,690 48,007 67,620 14,222 16,950 7,130 687,787
2007-08 245,580 186,468 133,587 51,317 75,945 15,431 18,757 7,883 734,968
2008-09 267,929 199,856 152,116 57,148 88,237 17,357 20,695 8,831 812,168
2009-10 275,759 205,262 155,798 57,939 91,632 17,988 22,150 9,338 835,866
Source: Derived from Australian Bureau of Statistics, Australian National Accounts: State Accounts, ABS 5220.0
Instant lottery: Instant lotteries are commonly known as ‘scratchies’, where a player scratches a coating off the ticket to identify whether the ticket is a winner. Prizes in the instant lottery are paid on a set return to player and are based on the number of tickets in a set, the cost to purchase the tickets, and a set percentage retained by the operator for costs. The operation of instant lotteries is the same as for lotteries.
Interactive gaming: Interactive gaming is defined as gambling on activities conducted via the internet. It specifically excludes wagering in the form of racing and sports betting and lotteries via the internet. Interactive gambling services provided to Australian residents by an internet casino are banned under the Commonwealth Interactive Gambling Act 2001 (IGA) which came into effect in August 2001.
Keno (clubs and hotels): A computerised keno system operates in clubs and hotels in New South Wales, Queensland, South Australia, Victoria, Tasmania and the Australian Capital Territory. In 1998−99, keno was introduced into Star City Casino (Sydney). Keno is a game where a player wagers that their chosen numbers match any of the 20 numbers randomly selected from a group of 80 numbers via a computer system or a ball draw device. In most states, keno is linked to all venues within a particular jurisdiction, enabling the operator to offer large jackpot prizes. Keno has a fixed pay scale such that the payout for each wager is established by rules and is independent of the total wagers made on the game.
Lotteries: Lotteries are conducted Australia-wide by both government and commercial operators. There are three components to a lottery: the purchase of a ticket, a draw and a prize. A person whose ticket is selected in a lottery wins a prize based on the total amounts wagered after deduction of a set percentage by the operator to cover costs. Lotteries are sold at various outlets around Australia such as newsagents. The same operators may also conduct lotto, pools, and instant lottery.
Australian Gambling Statistics 1984–85 to 2009–10, 28th Edition
5
Lotto: The figures reported in this section cover a variety of lottery games, commonly known as Tattslotto, Gold Lotto, Lotto, X-Lotto or Powerball depending on the jurisdiction. Lotto is a game where a player selects any six numbers from 1 to 45 in anticipation that those numbers will be among eight numbered balls, randomly drawn from a ball draw device containing 45 balls numbered from 1 to 45. The first six of the eight balls drawn are known as the ‘winning numbers’ and the last two balls are called ‘supplementary numbers’.
There are five prize divisions, with Division 1 being the major prize. The prize payout for each division is dependent on the amount of wagers made, less the operator’s costs. A player wins if their selected numbers match those randomly drawn in a set combination.
Minor gaming: The collective name given to raffles, bingo, lucky envelopes and the like.
On-course totalisator: These figures relate to the amount wagered on a racetrack, during race meetings, or at an authorised auditoria.
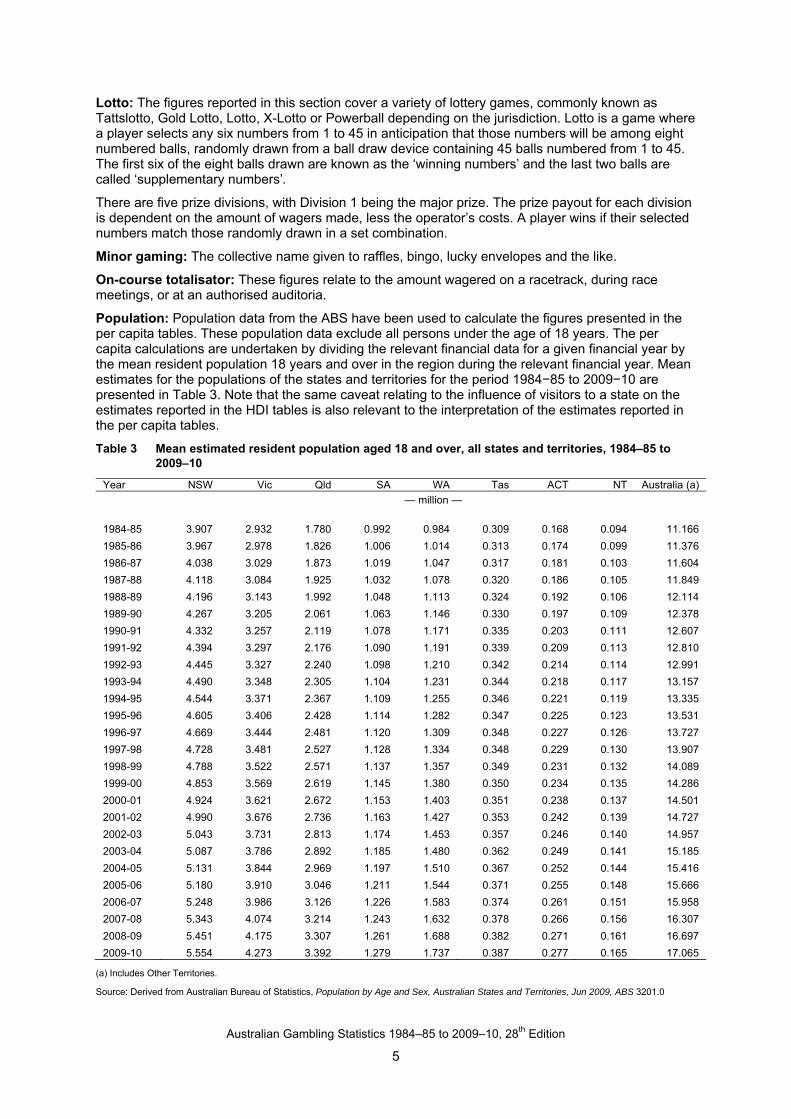
Population: Population data from the ABS have been used to calculate the figures presented in the per capita tables. These population data exclude all persons under the age of 18 years. The per capita calculations are undertaken by dividing the relevant financial data for a given financial year by the mean resident population 18 years and over in the region during the relevant financial year. Mean estimates for the populations of the states and territories for the period 1984−85 to 2009−10 are presented in Table 3. Note that the same caveat relating to the influence of visitors to a state on the estimates reported in the HDI tables is also relevant to the interpretation of the estimates reported in the per capita tables.
Table 3 Mean estimated resident population aged 18 and over, all states and territories, 1984–85 to 2009–10
Year NSW Vic Qld SA WA Tas ACT NT Australia (a)
— million —
1984-85 3.907 2.932 1.780 0.992 0.984 0.309 0.168 0.094 11.166
1985-86 3.967 2.978 1.826 1.006 1.014 0.313 0.174 0.099 11.376
1986-87 4.038 3.029 1.873 1.019 1.047 0.317 0.181 0.103 11.604
1987-88 4.118 3.084 1.925 1.032 1.078 0.320 0.186 0.105 11.849
1988-89 4.196 3.143 1.992 1.048 1.113 0.324 0.192 0.106 12.114
1989-90 4.267 3.205 2.061 1.063 1.146 0.330 0.197 0.109 12.378
1990-91 4.332 3.257 2.119 1.078 1.171 0.335 0.203 0.111 12.607
1991-92 4.394 3.297 2.176 1.090 1.191 0.339 0.209 0.113 12.810
1992-93 4.445 3.327 2.240 1.098 1.210 0.342 0.214 0.114 12.991
1993-94 4.490 3.348 2.305 1.104 1.231 0.344 0.218 0.117 13.157
1994-95 4.544 3.371 2.367 1.109 1.255 0.346 0.221 0.119 13.335
1995-96 4.605 3.406 2.428 1.114 1.282 0.347 0.225 0.123 13.531
1996-97 4.669 3.444 2.481 1.120 1.309 0.348 0.227 0.126 13.727
1997-98 4.728 3.481 2.527 1.128 1.334 0.348 0.229 0.130 13.907
1998-99 4.788 3.522 2.571 1.137 1.357 0.349 0.231 0.132 14.089
1999-00 4.853 3.569 2.619 1.145 1.380 0.350 0.234 0.135 14.286
2000-01 4.924 3.621 2.672 1.153 1.403 0.351 0.238 0.137 14.501
2001-02 4.990 3.676 2.736 1.163 1.427 0.353 0.242 0.139 14.727
2002-03 5.043 3.731 2.813 1.174 1.453 0.357 0.246 0.140 14.957
2003-04 5.087 3.786 2.892 1.185 1.480 0.362 0.249 0.141 15.185
2004-05 5.131 3.844 2.969 1.197 1.510 0.367 0.252 0.144 15.416
2005-06 5.180 3.910 3.046 1.211 1.544 0.371 0.255 0.148 15.666
2006-07 5.248 3.986 3.126 1.226 1.583 0.374 0.261 0.151 15.958
2007-08 5.343 4.074 3.214 1.243 1.632 0.378 0.266 0.156 16.307
2008-09 5.451 4.175 3.307 1.261 1.688 0.382 0.271 0.161 16.697
2009-10 5.554 4.273 3.392 1.279 1.737 0.387 0.277 0.165 17.065
(a) Includes Other Territories.
Source: Derived from Australian Bureau of Statistics, Population by Age and Sex, Australian States and Territories, Jun 2009, ABS 3201.0
Australian Gambling Statistics 1984–85 to 2009–10, 28th Edition
6
Racing betting: Within the context of this report, racing betting comprises legal betting with bookmakers and totalisators, both on racecourses and off-course (TAB). It is related to betting on the outcome of horse and greyhound races.
‘Real’ variables: Real variables refer to data that have had the effects of inflation removed. This is achieved by specifying a base year (in this instance 2009−10) and ‘deflating’ each previous year by the CPI (see Table 1). This means that all data in a table showing real values may be compared directly, the effects of inflation having been removed.
Revised figures: Figures with a revised notation detail data that have been revised from the previous edition of the Australian Gambling Statistics publication. Sports betting: Sports betting is the wagering on approved types of local, national or international sporting activities (other than the established forms of horse and greyhound racing), whether on or off-course, in person, by telephone, or via the internet.
Totalisator Agency Board (TAB): This form of wagering is Australia-wide and is the amount wagered at TAB outlets (other than those on a race track). Totalisator wagering is where a player makes a ‘unit’ wager (a unit being any multiple of 50 cents or one dollar depending on the jurisdiction). Totalisator betting is sometimes called parimutuel betting. The operator deducts a percentage of the total units wagered (for costs including tax), and the remainder is returned as dividends (winnings) to players in multiples of the unit wagered.
In several jurisdictions, the TAB has been privatised. There are three TAB pools, the Victorian TAB pool (known as the SuperTAB, to which Tasmania, Australian Capital Territory and Western Australia are parties), the New South Wales pool and the Queensland pool (to which South Australia and the Northern Territory are parties). Each jurisdiction retains the deductions from wagers made in that particular jurisdiction.
Turnover: Turnover is an expression used to describe the amount wagered. This does not include any additional charges that may also be paid at the point of purchase, such as selling agents’ commission in the case of lotteries (except where noted in tables).
Wagering: Wagering is all legal forms of gambling on racing and sporting events.
Australian Gambling Statistics 1984–85 to 2009–10, 28th Edition
7
1.5 Overview of gambling data Sources of data State and territory government racing and gaming authorities were approached to provide actual data on turnover, expenditure and government revenue, for each form of gambling within their jurisdiction. Where actual data were not available, the relevant authorities were encouraged to make estimates of the unavailable statistics and provide both these estimates and explanations of the estimation methods. The methods that have been used to estimate missing values are elaborated upon in section 1.6.
Legislative restrictions preclude several jurisdictions from releasing data until the close of the calendar year relating to the statistics. Users should note that the statistics are not available until after this period.
Goods and services tax On 1 July 2000, the goods and services tax (GST) replaced wholesale sales tax, which was applied at varying rates to a range of products. The GST is a broad-based tax of ten per cent on most supplies of goods and services consumed in Australia. This includes gaming products. Therefore, the gaming tax revenue figures shown in this publication from 2000−01 onwards are not comparable with those of preceding years.
Relevant legislation Gambling policy and legislation in Australia has traditionally been the role of the states and territories rather than the Commonwealth. Relevant state-based legislation is detailed in state and territory summaries in section 1.6.
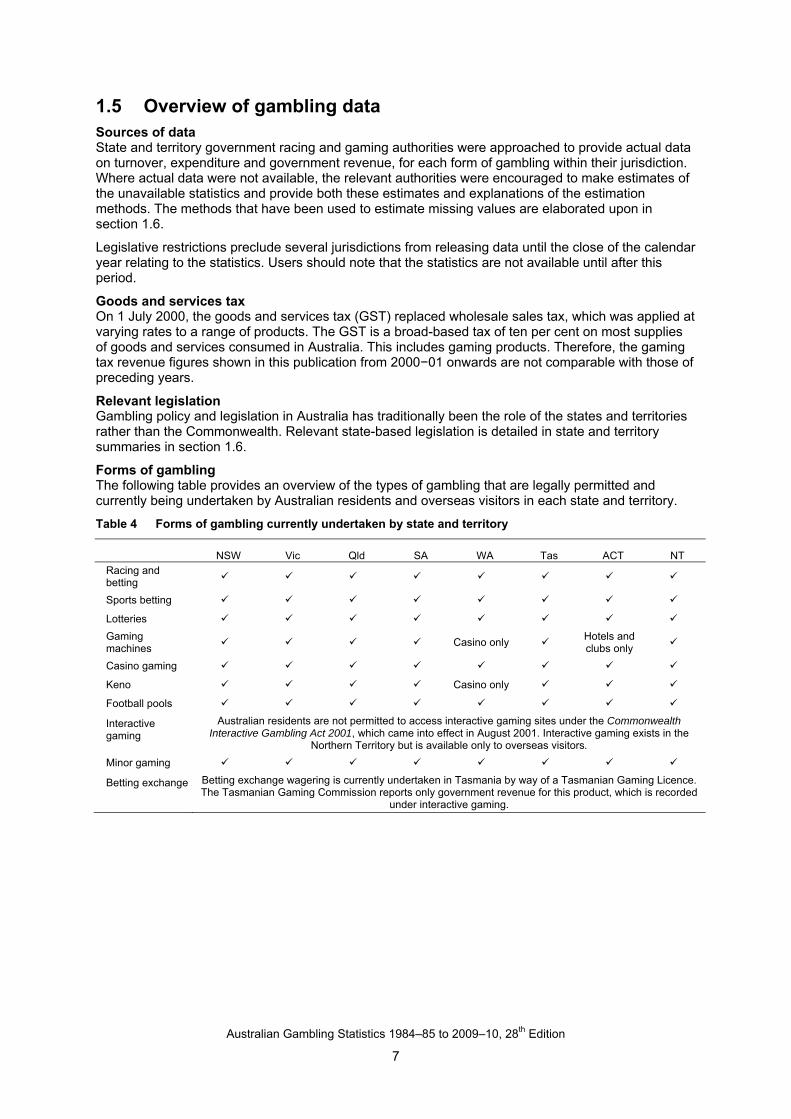
Forms of gambling The following table provides an overview of the types of gambling that are legally permitted and currently being undertaken by Australian residents and overseas visitors in each state and territory.
Table 4 Forms of gambling currently undertaken by state and territory
NSW Vic Qld SA WA Tas ACT NT Racing and betting
Sports betting
Lotteries
Gaming machines
Casino only Hotels and clubs only
Casino gaming
Keno Casino only
Football pools
Interactive gaming
Australian residents are not permitted to access interactive gaming sites under the Commonwealth Interactive Gambling Act 2001, which came into effect in August 2001. Interactive gaming exists in the
Northern Territory but is available only to overseas visitors.
Minor gaming
Betting exchange Betting exchange wagering is currently undertaken in Tasmania by way of a Tasmanian Gaming Licence. The Tasmanian Gaming Commission reports only government revenue for this product, which is recorded
under interactive gaming.
Australian Gambling Statistics 1984–85 to 2009–10, 28th Edition
8
1.6 Notes on data specific to each state and territory
1.6.1 New South Wales
Legislation
Legislation governing the regulation, supervision and control of gambling activities in New South Wales includes:
Casino Control Act 1992
Casino, Liquor and Gaming Control Authority Act 2007
Charitable Fundraising Act 1991
Gambling (Two-Up) Act 1998
Gaming Machines Act 2001
Gaming Machines Tax Act 2001
Lotteries and Art Unions Act 1901
Public Lotteries Act 1996
Racing Administration Act 1998
Totalizator Act 1997
Unlawful Gambling Act 1998.
New developments
The ownership of NSW Lotteries was transferred to the Tatts Group on 1 April 2010.
General industry information
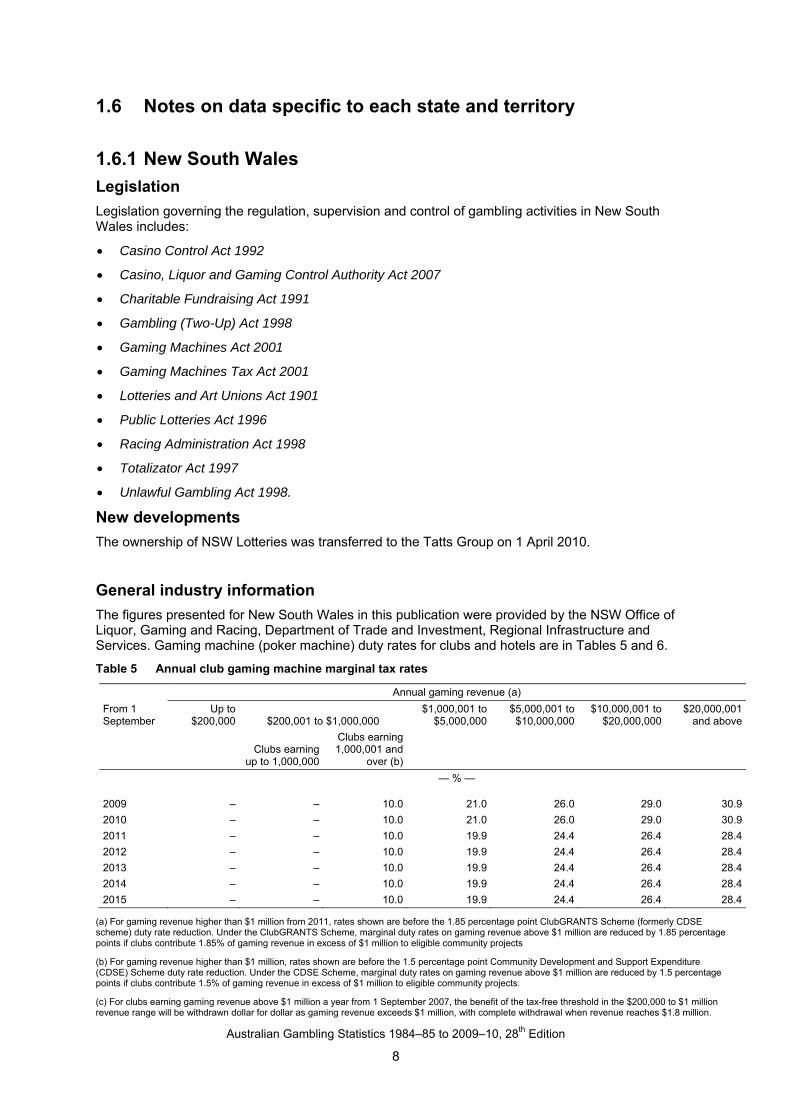
The figures presented for New South Wales in this publication were provided by the NSW Office of Liquor, Gaming and Racing, Department of Trade and Investment, Regional Infrastructure and Services. Gaming machine (poker machine) duty rates for clubs and hotels are in Tables 5 and 6.
Table 5 Annual club gaming machine marginal tax rates
Annual gaming revenue (a)
From 1 September
Up to $200,000 $200,001 to $1,000,000
$1,000,001 to $5,000,000
$5,000,001 to $10,000,000
$10,000,001 to $20,000,000
$20,000,001 and above
Clubs earning
up to 1,000,000
Clubs earning 1,000,001 and
over (b)
— % —
2009 – – 10.0 21.0 26.0 29.0 30.9
2010 – – 10.0 21.0 26.0 29.0 30.9
2011 – – 10.0 19.9 24.4 26.4 28.4
2012 – – 10.0 19.9 24.4 26.4 28.4
2013 – – 10.0 19.9 24.4 26.4 28.4
2014 – – 10.0 19.9 24.4 26.4 28.4
2015 – – 10.0 19.9 24.4 26.4 28.4
(a) For gaming revenue higher than $1 million from 2011, rates shown are before the 1.85 percentage point ClubGRANTS Scheme (formerly CDSE scheme) duty rate reduction. Under the ClubGRANTS Scheme, marginal duty rates on gaming revenue above $1 million are reduced by 1.85 percentage points if clubs contribute 1.85% of gaming revenue in excess of $1 million to eligible community projects
(b) For gaming revenue higher than $1 million, rates shown are before the 1.5 percentage point Community Development and Support Expenditure (CDSE) Scheme duty rate reduction. Under the CDSE Scheme, marginal duty rates on gaming revenue above $1 million are reduced by 1.5 percentage points if clubs contribute 1.5% of gaming revenue in excess of $1 million to eligible community projects.
(c) For clubs earning gaming revenue above $1 million a year from 1 September 2007, the benefit of the tax-free threshold in the $200,000 to $1 million revenue range will be withdrawn dollar for dollar as gaming revenue exceeds $1 million, with complete withdrawal when revenue reaches $1.8 million.
Australian Gambling Statistics 1984–85 to 2009–10, 28th Edition
9
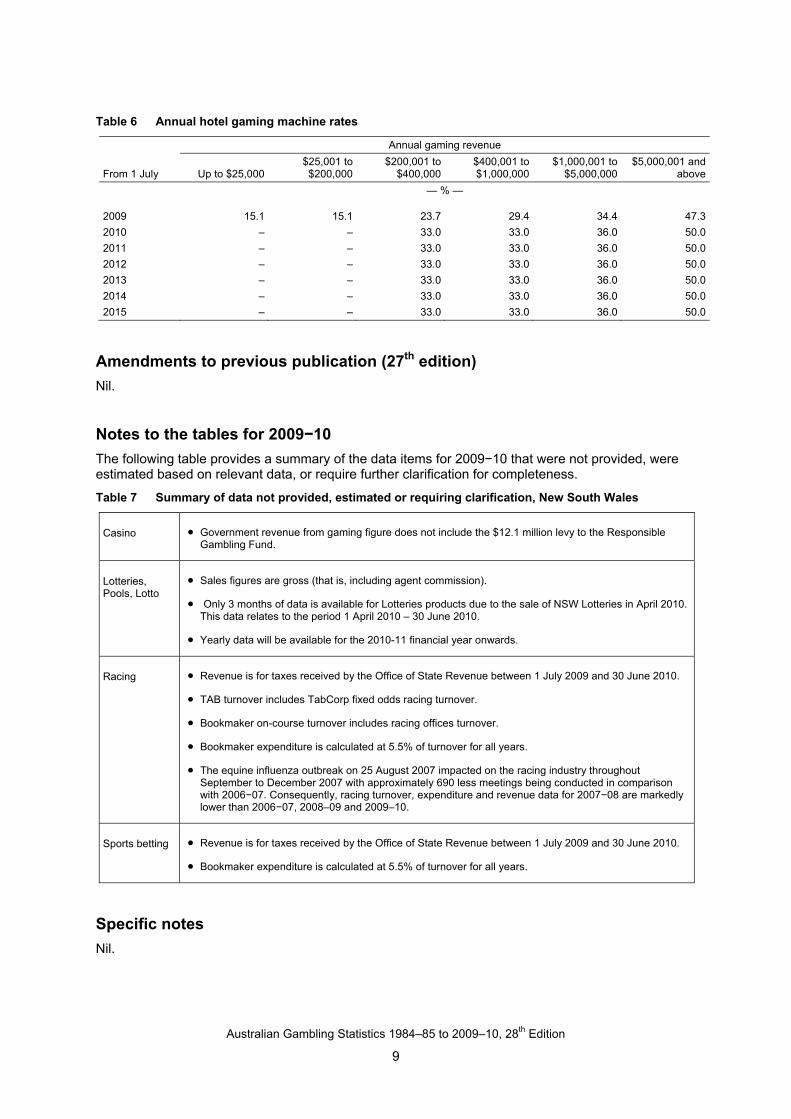
Table 6 Annual hotel gaming machine rates
Annual gaming revenue
From 1 July Up to $25,000 $25,001 to $200,000
$200,001 to $400,000
$400,001 to $1,000,000
$1,000,001 to $5,000,000
$5,000,001 and above
— % —
2009 15.1 15.1 23.7 29.4 34.4 47.3
2010 – – 33.0 33.0 36.0 50.0
2011 – – 33.0 33.0 36.0 50.0
2012 – – 33.0 33.0 36.0 50.0
2013 – – 33.0 33.0 36.0 50.0
2014 – – 33.0 33.0 36.0 50.0
2015 – – 33.0 33.0 36.0 50.0
Amendments to previous publication (27th edition)
Nil.
Notes to the tables for 2009−10
The following table provides a summary of the data items for 2009−10 that were not provided, were estimated based on relevant data, or require further clarification for completeness.
Table 7 Summary of data not provided, estimated or requiring clarification, New South Wales
Casino Government revenue from gaming figure does not include the $12.1 million levy to the Responsible Gambling Fund.
Lotteries, Pools, Lotto
Sales figures are gross (that is, including agent commission).
Only 3 months of data is available for Lotteries products due to the sale of NSW Lotteries in April 2010. This data relates to the period 1 April 2010 – 30 June 2010.
Yearly data will be available for the 2010-11 financial year onwards.
Racing Revenue is for taxes received by the Office of State Revenue between 1 July 2009 and 30 June 2010.
TAB turnover includes TabCorp fixed odds racing turnover.
Bookmaker on-course turnover includes racing offices turnover.
Bookmaker expenditure is calculated at 5.5% of turnover for all years.
The equine influenza outbreak on 25 August 2007 impacted on the racing industry throughout September to December 2007 with approximately 690 less meetings being conducted in comparison with 2006−07. Consequently, racing turnover, expenditure and revenue data for 2007−08 are markedly lower than 2006−07, 2008–09 and 2009–10.
Sports betting Revenue is for taxes received by the Office of State Revenue between 1 July 2009 and 30 June 2010.
Bookmaker expenditure is calculated at 5.5% of turnover for all years.
Specific notes
Nil.
Australian Gambling Statistics 1984–85 to 2009–10, 28th Edition
10
1.6.2 Victoria
Legislation
Legislation governing the regulation, supervision and control of gambling activities in Victoria includes:
Casino Control Act 1991
Casino (Management Agreement) Act 1993
Gambling Regulation Act 2003.
A copy of current Victorian legislation can be accessed from the Victorian Legislation and Parliamentary Documents website at www.legislation.vic.gov.au under Victorian Law Today.
New developments
Review of electronic gaming machine, Club Keno and wagering licences and funding arrangements for the Victorian racing industry post-2012
The Government has announced the new structure for Victoria’s gaming industry beyond 2012. Post-2012, the maximum number of electronic gaming machines outside Crown Casino will remain capped at 27,500, split evenly between clubs and hotels and with at least 20% in country Victoria. The maximum number of gaming machines allowed at any one venue will be maintained at 105. Regional caps and Municipal Limits on the number of machines will also continue to apply.
Victoria has two gaming operator licences, held by Tatts Group Ltd and Tabcorp Holdings Ltd. Under the new industry arrangements, the gaming machine duopoly will be replaced in 2012 by a venue operator model, in which venue operators will own 10-year gaming machine entitlements. Licensed venue operators have bid directly for 10-year gaming machine entitlements in a two stage auction in April and May 2010.
The new industry structure imposes a cap on ownership to ensure that no one venue operator can own more than 35% of machines available to hotels. A cap of 420 club gaming machine entitlements also applies to any one club with more than one venue.
The Government has also released details of a new progressive tax structure. Under the new structure, tax rates will be based on each venue’s average monthly gaming machine revenue (where gaming revenue is defined as the total amount wagered less the return to players).
The single Monitoring Licence was offered to Intralot Gaming Services on 14 September 2011. This will commence in 2012. The monitor will be responsible for operating and maintaining an electronic monitoring system of gaming machines, detect significant events and facilitate linked jackpot arrangements.
The Government has announced that it has awarded the single Keno licence on 11 March 2011 to Tabcorp Investments No. 5 Pty Ltd. This will commence in 2012 and will replace the current Club Keno arrangements.
The single Wagering and Betting licence was offered to Tabcorp Wagering (Vic) Pty Ltd on 19 July 2011. This will commence in 2012 and will replace the existing wagering licence held by Tabcorp.
Further information about post-2012 arrangements is available on the VCGLR website at www.vcglr.vic.gov.au > Gambling Arrangements 2012.
Implementation of Municipal Limits and review of Regional Caps
All 79 municipal districts in Victoria are subject to a Municipal Limit of 10 gaming machines per thousand adults. In September 2009 the then Victorian Commission for Gambling Regulation (now Victorian Commission for Gambling and Liquor Regulation) announced the maximum permissible number of gaming machines for all areas subject to Municipal Limits. Excluded from this requirement are all areas subject to a Regional Cap and the Melbourne central business district, Docklands and Southbank within the City of Melbourne.
Australian Gambling Statistics 1984–85 to 2009–10, 28th Edition
11
Four municipal districts were required to have machines removed for compliance with Municipal Limits. The machines were removed by December 2009.
Further information regarding Municipal Limits is available on the VCGLR website at www.vcglr.vic.gov.au > Industry Participants > Municipal Limits.
In October 2006, the Minister for Gaming extended Regional Caps in Victoria from five to 19 regions. The criterion that the VCGLR was required to use to determine the maximum permissible number of gaming machines available for gaming in each region was the lower of:
10 gaming machine per 1,000 adults in the region, or
the number of gaming machines per 1,000 adults in the region as at the date of the order.
On 20 October 2009, the Minister for Gaming issued an order requiring the VCGLR to determine Regional Caps based on a specified ratio of machines per thousand adults for each of the 19 regions. In addition a 20th region, the Shire of Yarra Ranges, was placed under a Regional Cap.
One region, the City of Hume, was required to have 14 machines removed after the October determination of Regional Caps. The machines were removed by December 2009.
Further information regarding Regional Caps is available on the VCGLR website at www.vcglr.vic.gov.au > Industry Participants > Regional Caps.
Crown Casino table games expansion
On 16 December 2009, the Ninth Variation to the Casino Management Agreement with Crown Casino was ratified by the Victorian Parliament. Under the Ninth Variation, the tax rate on electronic gaming machines was increased by 1.72% each year for the next six years. At the same time, the Casino licence was amended so that the maximum number of gaming tables available for gaming at any one time at the casino was increased from 350 to 400. In addition, up to 100 poker tables are also allowed at any one time, enabling the casino to operate a maximum of 500 gaming and poker tables.
The Ninth Variation also defined fully automated gaming tables as table games and limited the number of fully automated tables to 200 multi-terminal stations (excluding poker). As fully automated table games are considered as gaming tables, they are counted under the gaming table cap of 400 gaming tables.
General industry information
Crown Limited
Crown Limited holds the sole casino licence in Victoria. The licence authorises the casino operator to provide the following forms of gambling at the Melbourne Casino:
gaming on electronic gaming machines
approved casino table games.
TABCORP
TABCORP holds both a gaming operator’s licence and the wagering licence, authorising it to provide the following forms of gambling in Victoria:
Wagering on the three racing codes (gallops, harness and greyhounds) via totalisator and fixed odds at authorised outlets, via telephone and internet. No fixed odds available at race meetings, totalisator only
Gaming on electronic gaming machines at gaming venues (licensed hotels and clubs)
Club Keno at participating gaming venues throughout Victoria
Sports betting via national Sportsbet outlets and via telephone and online.
Australian Gambling Statistics 1984–85 to 2009–10, 28th Edition
12
Tattersall’s
Tattersall’s holds both a gaming operator’s licence and a public lotteries licence, authorising it to provide the following forms of gambling in Victoria:
Gaming on electronic gaming machines at gaming venues (licensed hotels and clubs).
Lotteries (Tattslotto, Monday and Wednesday Lotto, Ozlotto, Powerball, Super 66 and Soccer Pools) via accredited representatives (newsagencies and other outlets) throughout Victoria. Four other lottery products offered by Tattersall’s (Instant Tatts, Tatts Keno, Wednesday Lotto and Tatts2) have not been available after 30 June 2008.
Club Keno at participating gaming venues throughout Victoria.
Intralot
Intralot holds a public lotteries licence to conduct the following lotteries from 1 July 2008:
Keno 10/20/70
Pick 5 Heads or Tails
Cross and Match
TV Bingo
Pick 3
Instant Lottery Games (Scratchies).
Ministerial directions
The current Ministerial directions, made under section 3.2.3 of the Gambling Regulation Act 2003, provide that the maximum number of gaming machines permitted in Victoria to be available for gaming in all approved venues, other than the Melbourne Casino, is 27,500.
Under section 62A(2) of the Casino Control Act 1991, the maximum number of electronic gaming machines available for gaming at Melbourne’s Crown Casino is 2,500. The minimum and maximum number of gaming tables permitted to operate at Crown Casino is specified in the terms of the casino licence.
Further information about the structure and regulation of Victoria’s gambling industry is available from the Victorian Commission for Gambling and Liquor Regulation’s website at www.vcglr.vic.gov.au.
Amendments to previous publication (27th edition)
Nil.
Notes to the tables for 2009–10
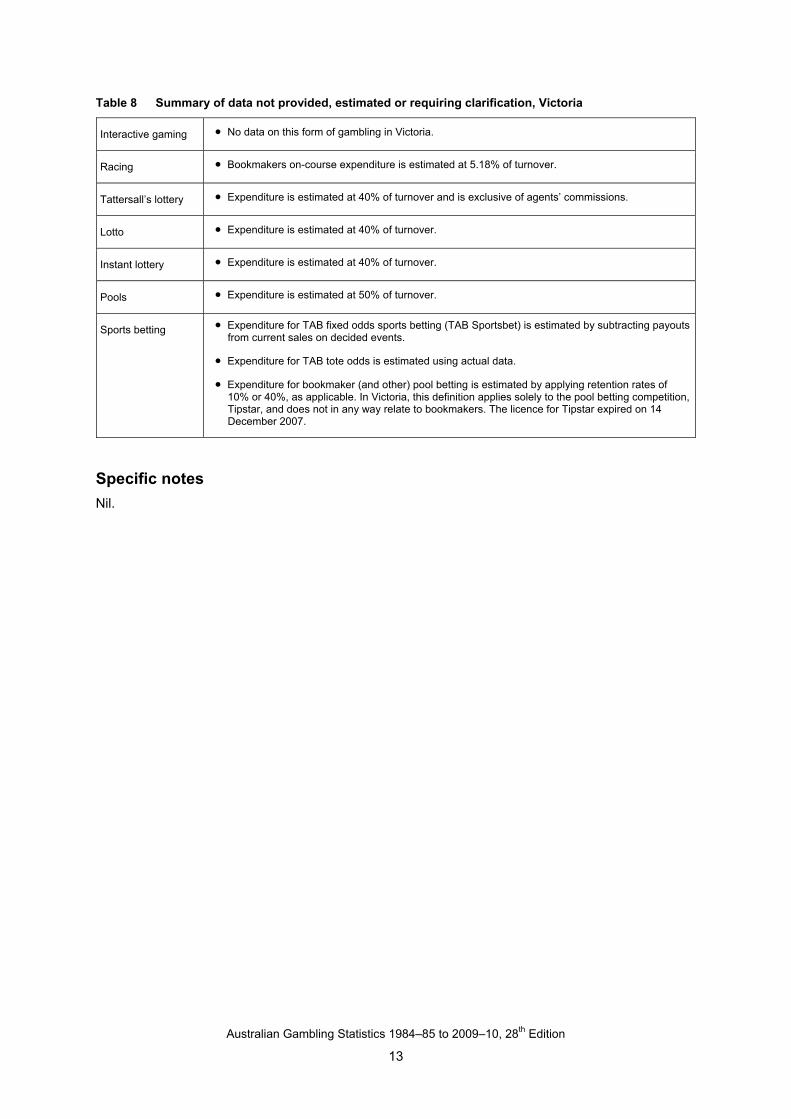
Table 8 provides a summary of the data items for 2009–10 that were not provided, were estimated based on relevant data, or require further clarification for completeness.
Australian Gambling Statistics 1984–85 to 2009–10, 28th Edition
13
Table 8 Summary of data not provided, estimated or requiring clarification, Victoria
Interactive gaming No data on this form of gambling in Victoria.
Racing Bookmakers on-course expenditure is estimated at 5.18% of turnover.
Tattersall’s lottery Expenditure is estimated at 40% of turnover and is exclusive of agents’ commissions.
Lotto Expenditure is estimated at 40% of turnover.
Instant lottery Expenditure is estimated at 40% of turnover.
Pools Expenditure is estimated at 50% of turnover.
Sports betting Expenditure for TAB fixed odds sports betting (TAB Sportsbet) is estimated by subtracting payouts from current sales on decided events.
Expenditure for TAB tote odds is estimated using actual data.
Expenditure for bookmaker (and other) pool betting is estimated by applying retention rates of 10% or 40%, as applicable. In Victoria, this definition applies solely to the pool betting competition, Tipstar, and does not in any way relate to bookmakers. The licence for Tipstar expired on 14 December 2007.
Specific notes
Nil.
Australian Gambling Statistics 1984–85 to 2009–10, 28th Edition
14
1.6.3 Queensland
Legislation
Primary legislation governing the regulation, supervision and control of gambling activities in Queensland includes:
Brisbane Casino Agreement Act 1992
Breakwater Island Casino Agreement Act 1984
Cairns Casino Agreement Act 1993
Casino Control Act 1982
Charitable and Non-Profit Gaming Act 1999
Gaming Machine Act 1991
Interactive Gambling (Player Protection) Act 1998
Jupiters Casino Agreement Act 1983
Keno Act 1996
Lotteries Act 1997
Wagering Act 1998.
New developments
Throughout 2009–10 the Office of Liquor and Gaming Regulation (sections of which now comprise the Office of Regulatory Policy) made a number of amendments to various Acts and Regulations regarding gaming.
The Gambling and Other Legislation Amendment Act was passed during 2009-10 amending all gaming Acts. The main amendments were:
Created a state-wide cap for club gaming machines.
Introduced a club gaming machine reallocation scheme to provide for the transfer of club gaming machine entitlements.
Prescribed mandatory Responsible Service of Gambling training for hotel and club staff who perform gambling roles (commenced 1 October 2010).
Created new offence provisions for gambling operators who direct promotional materials to excluded persons.
Created new offence provisions for minors who participate in lottery or wagering activities.
Increased penalties for minors who participate in keno and casino gaming.
Made provision for cashless gaming technologies in casinos.
Made provision for maximum denomination for gaming machine note acceptors in casinos, hotels and clubs to be prescribed in a regulation.
Made provision for Queensland lottery products to be sold in other jurisdictions.
General industry information
Nil.
Australian Gambling Statistics 1984–85 to 2009–10, 28th Edition
15
Amendments to previous publication (27th edition)
Nil.
Notes to the tables for 2009–10
Nil.
Specific notes
Nil.

Australian Gambling Statistics 1984–85 to 2009–10, 28th Edition
16
1.6.4 South Australia
Legislation
Legislation governing the regulation, supervision and control of gambling activities in South Australia includes:
Authorised Betting Operations Act 2000
Casino Act 1997
Gaming Machines Act 1992
Lottery and Gaming Act 1936
State Lotteries Act 1966.
New developments
It is the statutory objective of the South Australian Government to reduce the number of gaming machines that may be lawfully operated in South Australia to 12,086 (that is, 3,000 less than the number which were approved for operation immediately before 1 February 2005).
Under the Gaming Machines Act 1992 (the Act), South Australia currently has a maximum operational capacity of 12,900 gaming machines Accordingly, to meet the statutory objective, a further 814 gaming machine entitlements remain to be cancelled through the approved trading system.
Note: under the Casino Act 1997 Adelaide Casino may operate an additional 995 gaming machines but is ineligible to participate in the approved trading system.
Following an amendment to the Act on 1 July 2011 the previously fixed trading price of $50,000 per entitlement (seen as an obstacle to achieving the Government’s objective) was removed and Regulations establishing a new approved trading system were subsequently proclaimed on 14 July 2011.
The new approved trading system:
allows eligible purchasers to specify the maximum price that they are willing to pay for each gaming machine entitlement offered for sale;
allows eligible sellers to specify the minimum price that they are willing to accept for each gaming machine entitlement they offer for sale;
requires every fourth gaming machine entitlement sold in a trading round by non-profit organisations (i.e. Clubs and Community Hotels) to be transferred to the holder of the special club licence (Club One); and
to meet the statutory objective, requires every fourth gaming machine entitlement sold in a trading round by profit organisations (i.e. Hotels) to be cancelled.
General industry information
The Lottery and Gaming Regulations 2008 came into force on 1 September 2008.
The amended Responsible Gambling and Advertising Codes of Practice, which apply across all forms of gambling, came into effect on 1 December 2008.
Australian Gambling Statistics 1984–85 to 2009–10, 28th Edition
17
Amendments to previous publication (27th edition)
Nil.
Notes to the tables for 2009–10
Nil.
Specific notes
Nil.
Australian Gambling Statistics 1984–85 to 2009–10, 28th Edition
18
1.6.5 Western Australia
Legislation
Legislation governing the regulation, supervision and control of gambling activities in Western Australia includes:
Betting Control Act 1954
Bookmakers Betting Levy Act 1954
Casino (Burswood Island) Agreement Act 1985
Casino Control Act 1984
Gaming and Betting (Contracts and Securities) Act 1985
Gaming and Wagering Commission Act 1987
Gaming and Wagering Commission (Continuing Lotteries Levy) Act 2000
Racing and Wagering Western Australia Act 2003
Racing and Wagering Western Australia Tax Act 2003
Racing Restriction Act 2003.
Racing Bets Levy Act 2009.
New developments
On 11th January 2010, the Racing and Wagering Amendment Act 2009, Racing Bets Levy Act 2009, Bookmakers Betting Levy Amendment Act 2009 and associated regulations came into operation.
Collectively, this legislation establishes the legislative framework authorising the collection and disbursement of the racing bets levy to be paid by domestic and offshore betting operators publishing or otherwise making available Western Australian race fields.
General industry information
For the period, the casino gaming operations tax rates were as follows:
Electronic Gaming Machines Tax 20%
Table Games Tax 18%
International Commission Business Tax 11%.
Amendments to previous publication (27th edition)
Nil.
Notes to the tables for 2009–10
Nil.
Specific notes
Nil.
Australian Gambling Statistics 1984–85 to 2009–10, 28th Edition
19
1.6.6 Tasmania
Legislation
Legislation governing the regulation, supervision and control of gambling activities in Tasmania includes:
Gaming Control Act 1993
TT-Line Gaming Act 1993
New developments
TOTE Tasmania commenced to be regulated under the Gaming Control Act 1993 from 1 July 2009. Although now regulated under the Gaming Control Act, TOTE Tasmania is not required to pay any tax to the Tasmanian Government, however it pays a wagering levy on 1 July each year.
General industry information
Totalisator and fixed odds wagering is offered in Tasmania by TOTE Tasmania Pty Ltd (TOTE Tasmania), which is a state-owned company. TOTE Tasmania operates a number of shopfront agencies as well as internet and telephone betting services, while a number of hotels and clubs also provide TOTE outlets. Interactive (internet and telephone) wagering services are also offered by TOTE Tasmania.
TOTE Tasmania is a member of the Victorian Supertab betting pool. Other members of the pool are Victoria, Western Australia and the Australian Capital Territory.
Bookmakers offer traditional fixed price wagering on course at certain racing events in Tasmania.
There are two land based casinos operating in Tasmania: Wrest Point in Sandy Bay (Hobart) and the Country Club at Prospect (Launceston). Both casinos are owned and operated by the Federal Group.
A number of hotels and clubs in Tasmania offer gaming in the form of gaming machines and keno. These gaming services are owned and operated by Network Gaming, which is part of the Federal Group. Individual hotels and clubs rent gaming equipment from Network Gaming.
Gaming machines are also operated on the Spirit of Tasmania I and II ferries by Admirals Casino Pty Ltd.
Interactive (internet and telephone) wagering services are currently offered in Tasmania by Betfair Pty Ltd, which operates a betting exchange.
There are no providers of major lotteries currently operating in Tasmania. However, three companies hold a foreign games permit that allows their products to be offered from accredited outlets in Tasmania. Tattersalls Sweeps Pty Ltd and Intralot Australia Pty Ltd, which are both licensed in Victoria, and Golden Casket Lottery Corporation Limited which is licensed in Queensland, are the three companies that hold foreign games permits in Tasmania.
Minor gaming in Tasmania generally consists of activities such as lucky envelopes (e.g. beer / cash tickets), bingo and raffles conducted for the benefit of not-for-profit organisations. Various minor games are currently approved.
Australian Gambling Statistics 1984–85 to 2009–10, 28th Edition
20
Amendments to previous publication (27th edition)
Gaming machine numbers for casinos were incorrectly reported in the past in that gaming machines operated on the two Spirit of Tasmania ferries were not included. The gaming machine operator for the two ferries holds a gaming licence, not a casino licence.
Notes to the tables for 2009–10
The following table provides a summary of the data items for 2009–10 that were not provided, were estimated based on relevant data, or require further clarification for completeness.
Table 9 Summary of data not provided, estimated or requiring clarification, Tasmania
Racing Bookmakers’ on-course racing expenditure was estimated at 5.5% of turnover.
Government revenue from racing (bookmakers) includes both tax and product levies received.
Government revenue from betting exchanges is no longer recorded in interactive gaming and has been apportioned between government revenue from sports betting and government revenue from racing.
TOTE Tasmania no longer pays tax to the Tasmanian Government.
Gaming Casino, keno and gaming machine turnover information is no longer reported.
Information on minor gaming turnover is no longer collected. This also means that an estimate of minor gaming expenditure can no longer be made. No revenue is received for minor gaming activities.
Lottery turnover figures are net and do not include Lotteries agent commission.
Lotteries, Lotto and instant lottery expenditure was estimated at 40% of turnover (subscriptions).
Pools expenditure was estimated at 50% of turnover (subscriptions).
Sports betting Government revenue from sports betting includes tax paid on Australian and overseas non-racing events.
Government revenue from betting exchanges is no longer recorded in interactive gaming and has been apportioned between government revenue from sports betting and government revenue from racing.
Tipstar ceased trading in September 2007 and no figures are reported this year for bookmaker (and other) pool betting.
The increase in TAB fixed odds sports betting turnover from 2008–09 to 2009–10 has been attributed to TOTE Tasmania not being part of the Tabcorp fixed odds betting business TAB Sportsbet.
Specific notes
Nil.
Australian Gambling Statistics 1984–85 to 2009–10, 28th Edition
21
1.6.7 Australian Capital Territory
Legislation
The Gambling and Racing Control Act 1999 is the establishing legislation for the Australian Capital Territory (ACT) Gambling and Racing Commission. This Act outlines the functions and powers of the Commission and other administrative matters. In respect of specific gaming and racing activities, the following legislation is administered by the Commission and includes all subordinate legislation:
Betting (ACTTAB Limited) Act 1964
Casino Control Act 2006
Gaming Machine Act 2004
Interactive Gambling Act 1998
Lotteries Act 1964
Pool Betting Act 1964
Race and Sports Bookmaking Act 2001
Racing Act 1999
Unlawful Gambling Act 2009.
New developments
A problem gambling assistance fund levy on all gaming machine licensees of 0.6% of gross gaming machine revenue commenced on 1 July 2011. The levy will be used to assist in alleviating problem gambling or alleviating the disadvantages that arise from problem gambling.
General industry information
The ACT currently has four sports bookmaking licensees. Expenditure figures for sports betting are not available, as licensees are not required to provide this information.
Amendments to previous publication (27th edition)
Nil.
Notes to the tables for 2009–10
The following provides a summary of the data items for 2009–10 that were not provided, were estimated based on relevant data, or require further clarification for completeness.
Table 10 Summary of data not provided, estimated or requiring clarification, Australian Capital Territory
Racing Bookmaker on-course expenditure was calculated by assuming that bookmaker expenditure was equivalent to 5.5% of turnover.
Government revenue from TAB includes on-course totalisators. The ACT levies an annual licence fee on the TAB which is equivalent to 10% of the total licence value. The ACT Treasury has valued ACTTAB’s licence at approximately $35m.
Specific notes
Nil.
Australian Gambling Statistics 1984–85 to 2009–10, 28th Edition
22
1.6.8 Northern Territory
Legislation
Legislation governing the regulation, supervision and control of gambling activities in the Northern Territory includes:
Gaming Control Act 2005;
Gaming Machine Act 2005;
Northern Territory Licensing Commission Act 2001;
Racing and Betting Act 2004;
Soccer Football Pools Act 2004;
Totalisator Licensing and Regulation Act 2004; and
Unlawful Betting Act 2004.
New Developments
From 1 January 2010, the Government replaced the Northern Territory’s current bookmaker turnover tax with a tax based on gross wagering profits. The Government has capped the tax each Corporate Bookmaker has to pay to a maximum of $250,000 ($125,000 from January 2010 to June 2010), which is subject to annual indexation based on the Darwin consumer price index.
General industry information
A significantly greater proportion of the Territory’s gambling business comes from overseas and interstate compared with other jurisdictions. For example, a significant volume of wagering activity conducted by licensed sports bookmakers is sourced from international punters.
Amendments to previous publication (27th edition)
Nil.
Notes to the tables for 2009−10
The following provides a summary of the data items for 2009–10 that were not provided, were estimated based on relevant data, or require further clarification for completeness.
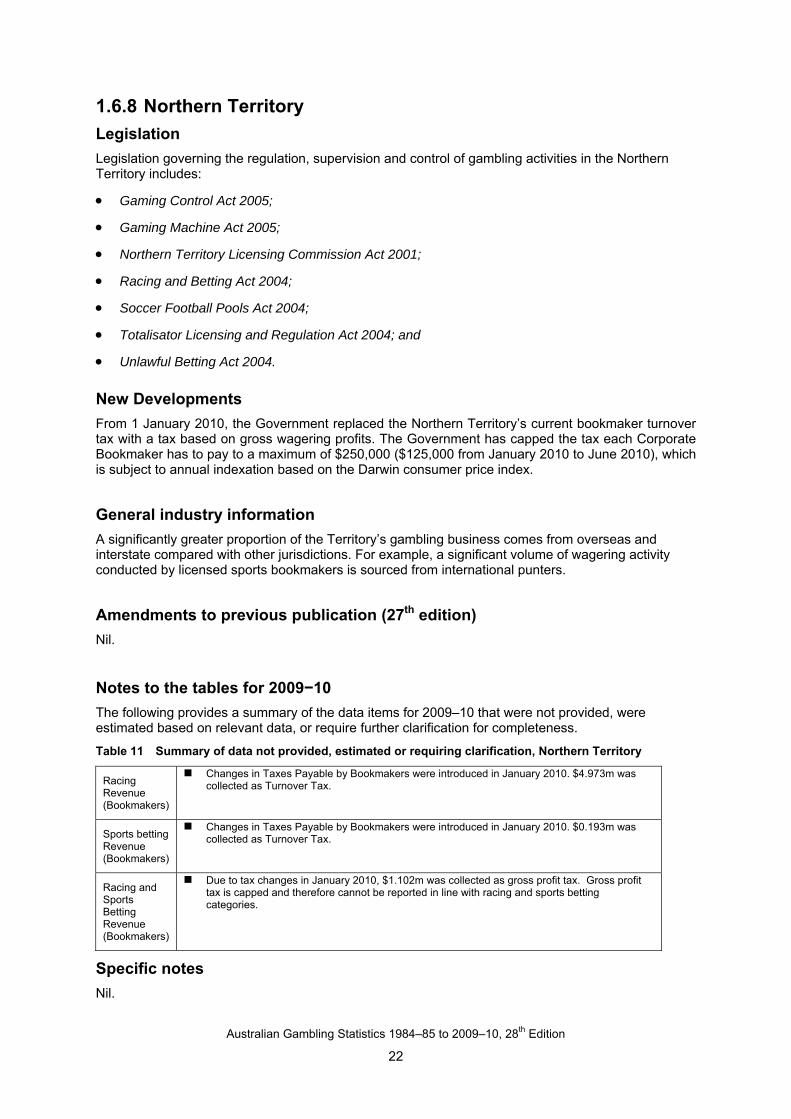
Table 11 Summary of data not provided, estimated or requiring clarification, Northern Territory
Racing Revenue (Bookmakers)
Changes in Taxes Payable by Bookmakers were introduced in January 2010. $4.973m was collected as Turnover Tax.
Sports betting Revenue (Bookmakers)
Changes in Taxes Payable by Bookmakers were introduced in January 2010. $0.193m was collected as Turnover Tax.
Racing and Sports Betting Revenue (Bookmakers)
Due to tax changes in January 2010, $1.102m was collected as gross profit tax. Gross profit tax is capped and therefore cannot be reported in line with racing and sports betting categories.
Specific notes
Nil.
Australian Gambling Statistics 1984–85 to 2009–10, 28th Edition
23
1.7 Cautionary note While all care has been taken in the preparation of this publication, and the relevant authorities of each state and territory have verified their own data in detail, it is nevertheless necessary to caution users with regard to its complete accuracy.
All tables should be read in conjunction with the explanatory notes in Part 1 of this report.
In some instances, data contained in previous editions have been corrected or amended. These corrections or amendments are noted within each table.
Caution should be used when comparing data between states and territories as each jurisdiction has different systems, processes and reporting methods. Also, the availability of certain data can vary between jurisdictions.
Data on government revenue from gambling for years prior to 2000−01 are not comparable with data from 2000−01 onwards due to the introduction of the goods and services tax on 1 July 2000.
In particular, readers are urged to use casino handle figures with extreme care. Please read Part 1.4, Glossary, which has information on casino handle (under Casino turnover) and a warning on its usage, before using any data on casino handle.

Australian Gambling Statistics 1984–85 to 2009–10, 28th Edition
24
PART 2: LIST OF TABLES
Australian Gambling Statistics 1984–85 to 2009–10, 28th Edition
25
2.1 Summary Tables
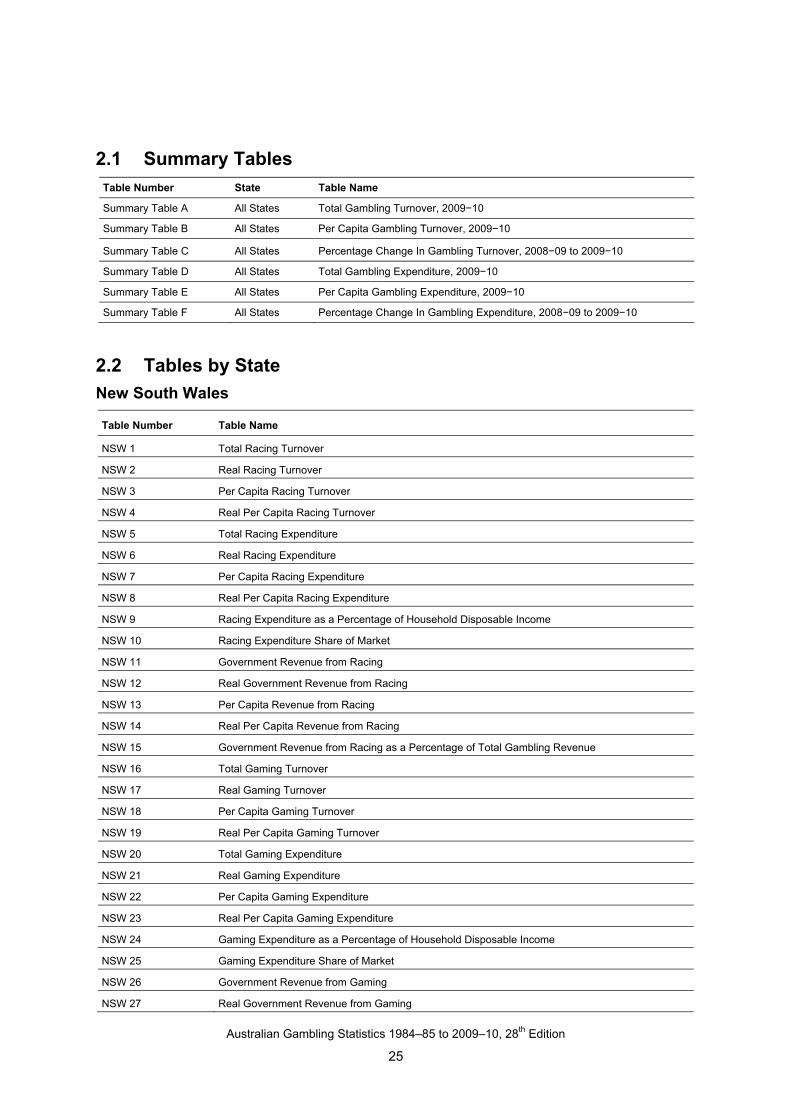
Table Number State Table Name
Summary Table A All States Total Gambling Turnover, 2009−10
Summary Table B All States Per Capita Gambling Turnover, 2009−10
Summary Table C All States Percentage Change In Gambling Turnover, 2008−09 to 2009−10
Summary Table D All States Total Gambling Expenditure, 2009−10
Summary Table E All States Per Capita Gambling Expenditure, 2009−10
Summary Table F All States Percentage Change In Gambling Expenditure, 2008−09 to 2009−10
2.2 Tables by State
New South Wales
Table Number Table Name
NSW 1 Total Racing Turnover
NSW 2 Real Racing Turnover
NSW 3 Per Capita Racing Turnover
NSW 4 Real Per Capita Racing Turnover
NSW 5 Total Racing Expenditure
NSW 6 Real Racing Expenditure
NSW 7 Per Capita Racing Expenditure
NSW 8 Real Per Capita Racing Expenditure
NSW 9 Racing Expenditure as a Percentage of Household Disposable Income
NSW 10 Racing Expenditure Share of Market
NSW 11 Government Revenue from Racing
NSW 12 Real Government Revenue from Racing
NSW 13 Per Capita Revenue from Racing
NSW 14 Real Per Capita Revenue from Racing
NSW 15 Government Revenue from Racing as a Percentage of Total Gambling Revenue
NSW 16 Total Gaming Turnover
NSW 17 Real Gaming Turnover
NSW 18 Per Capita Gaming Turnover
NSW 19 Real Per Capita Gaming Turnover
NSW 20 Total Gaming Expenditure
NSW 21 Real Gaming Expenditure
NSW 22 Per Capita Gaming Expenditure
NSW 23 Real Per Capita Gaming Expenditure
NSW 24 Gaming Expenditure as a Percentage of Household Disposable Income
NSW 25 Gaming Expenditure Share of Market
NSW 26 Government Revenue from Gaming
NSW 27 Real Government Revenue from Gaming
Australian Gambling Statistics 1984–85 to 2009–10, 28th Edition
26
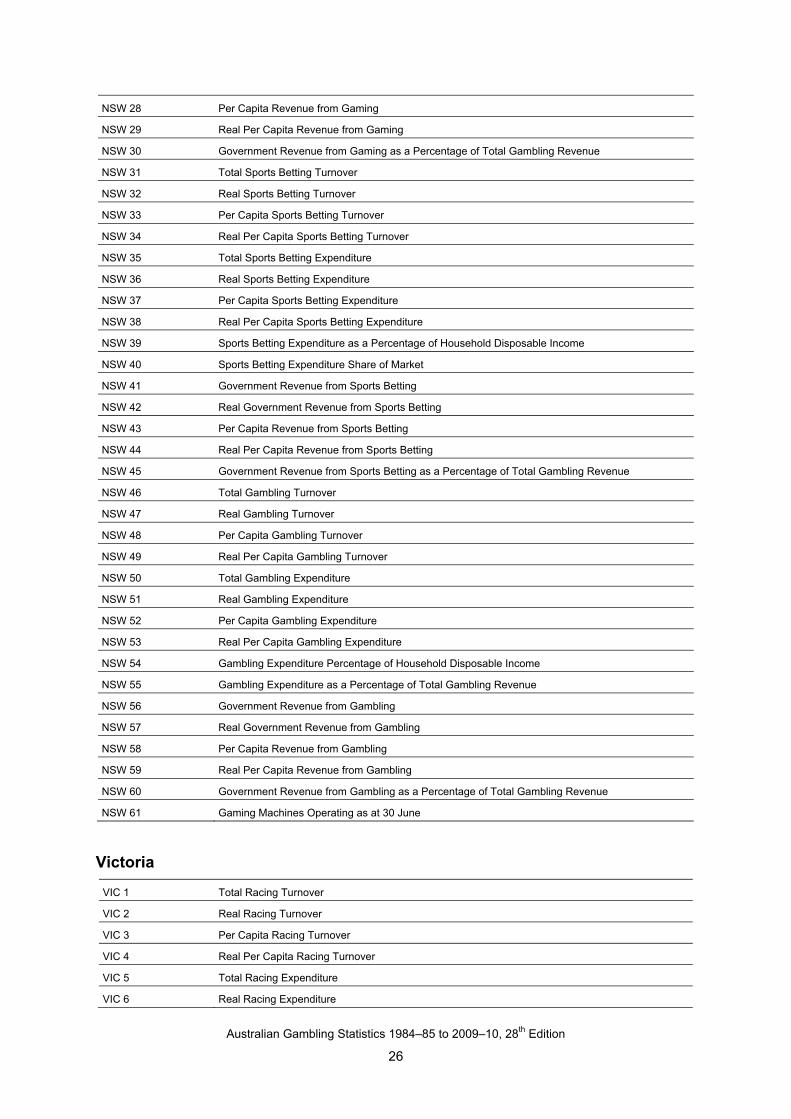
NSW 28 Per Capita Revenue from Gaming
NSW 29 Real Per Capita Revenue from Gaming
NSW 30 Government Revenue from Gaming as a Percentage of Total Gambling Revenue
NSW 31 Total Sports Betting Turnover
NSW 32 Real Sports Betting Turnover
NSW 33 Per Capita Sports Betting Turnover
NSW 34 Real Per Capita Sports Betting Turnover
NSW 35 Total Sports Betting Expenditure
NSW 36 Real Sports Betting Expenditure
NSW 37 Per Capita Sports Betting Expenditure
NSW 38 Real Per Capita Sports Betting Expenditure
NSW 39 Sports Betting Expenditure as a Percentage of Household Disposable Income
NSW 40 Sports Betting Expenditure Share of Market
NSW 41 Government Revenue from Sports Betting
NSW 42 Real Government Revenue from Sports Betting
NSW 43 Per Capita Revenue from Sports Betting
NSW 44 Real Per Capita Revenue from Sports Betting
NSW 45 Government Revenue from Sports Betting as a Percentage of Total Gambling Revenue
NSW 46 Total Gambling Turnover
NSW 47 Real Gambling Turnover
NSW 48 Per Capita Gambling Turnover
NSW 49 Real Per Capita Gambling Turnover
NSW 50 Total Gambling Expenditure
NSW 51 Real Gambling Expenditure
NSW 52 Per Capita Gambling Expenditure
NSW 53 Real Per Capita Gambling Expenditure
NSW 54 Gambling Expenditure Percentage of Household Disposable Income
NSW 55 Gambling Expenditure as a Percentage of Total Gambling Revenue
NSW 56 Government Revenue from Gambling
NSW 57 Real Government Revenue from Gambling
NSW 58 Per Capita Revenue from Gambling
NSW 59 Real Per Capita Revenue from Gambling
NSW 60 Government Revenue from Gambling as a Percentage of Total Gambling Revenue
NSW 61 Gaming Machines Operating as at 30 June
Victoria
VIC 1 Total Racing Turnover
VIC 2 Real Racing Turnover
VIC 3 Per Capita Racing Turnover
VIC 4 Real Per Capita Racing Turnover
VIC 5 Total Racing Expenditure
VIC 6 Real Racing Expenditure
Australian Gambling Statistics 1984–85 to 2009–10, 28th Edition
27
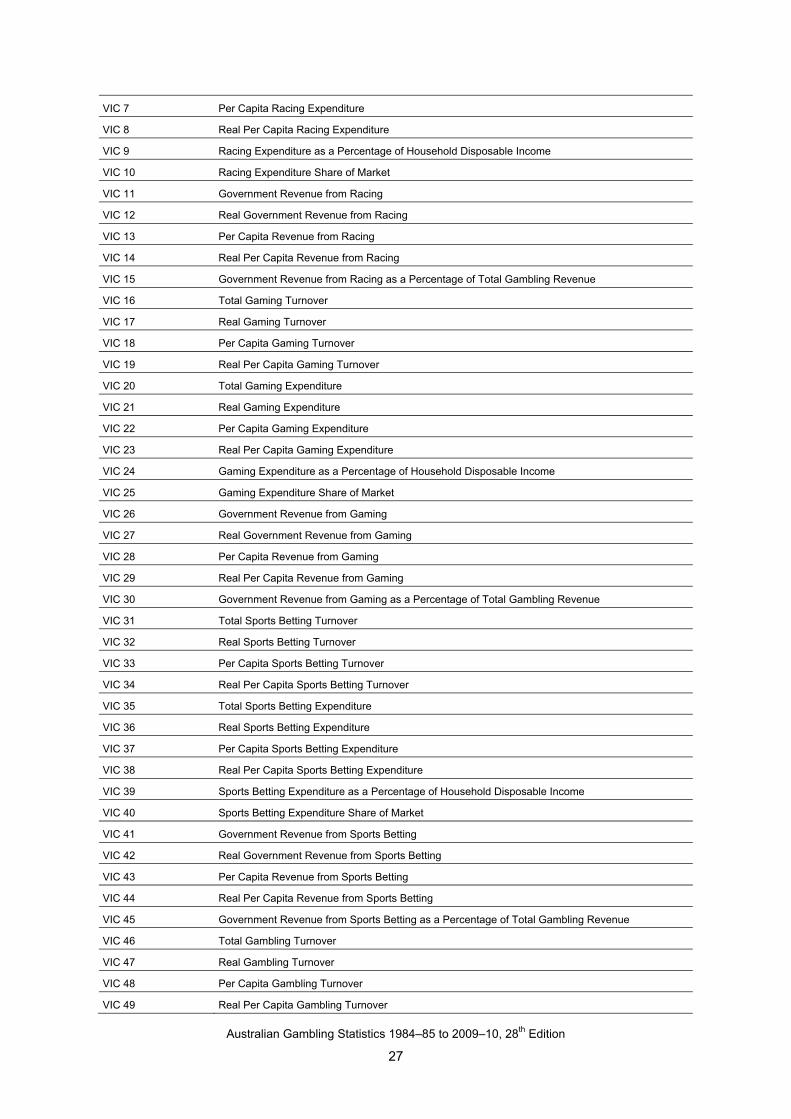
VIC 7 Per Capita Racing Expenditure
VIC 8 Real Per Capita Racing Expenditure
VIC 9 Racing Expenditure as a Percentage of Household Disposable Income
VIC 10 Racing Expenditure Share of Market
VIC 11 Government Revenue from Racing
VIC 12 Real Government Revenue from Racing
VIC 13 Per Capita Revenue from Racing
VIC 14 Real Per Capita Revenue from Racing
VIC 15 Government Revenue from Racing as a Percentage of Total Gambling Revenue
VIC 16 Total Gaming Turnover
VIC 17 Real Gaming Turnover
VIC 18 Per Capita Gaming Turnover
VIC 19 Real Per Capita Gaming Turnover
VIC 20 Total Gaming Expenditure
VIC 21 Real Gaming Expenditure
VIC 22 Per Capita Gaming Expenditure
VIC 23 Real Per Capita Gaming Expenditure
VIC 24 Gaming Expenditure as a Percentage of Household Disposable Income
VIC 25 Gaming Expenditure Share of Market
VIC 26 Government Revenue from Gaming
VIC 27 Real Government Revenue from Gaming
VIC 28 Per Capita Revenue from Gaming
VIC 29 Real Per Capita Revenue from Gaming
VIC 30 Government Revenue from Gaming as a Percentage of Total Gambling Revenue
VIC 31 Total Sports Betting Turnover
VIC 32 Real Sports Betting Turnover
VIC 33 Per Capita Sports Betting Turnover
VIC 34 Real Per Capita Sports Betting Turnover
VIC 35 Total Sports Betting Expenditure
VIC 36 Real Sports Betting Expenditure
VIC 37 Per Capita Sports Betting Expenditure
VIC 38 Real Per Capita Sports Betting Expenditure
VIC 39 Sports Betting Expenditure as a Percentage of Household Disposable Income
VIC 40 Sports Betting Expenditure Share of Market
VIC 41 Government Revenue from Sports Betting
VIC 42 Real Government Revenue from Sports Betting
VIC 43 Per Capita Revenue from Sports Betting
VIC 44 Real Per Capita Revenue from Sports Betting
VIC 45 Government Revenue from Sports Betting as a Percentage of Total Gambling Revenue
VIC 46 Total Gambling Turnover
VIC 47 Real Gambling Turnover
VIC 48 Per Capita Gambling Turnover
VIC 49 Real Per Capita Gambling Turnover
Australian Gambling Statistics 1984–85 to 2009–10, 28th Edition
28
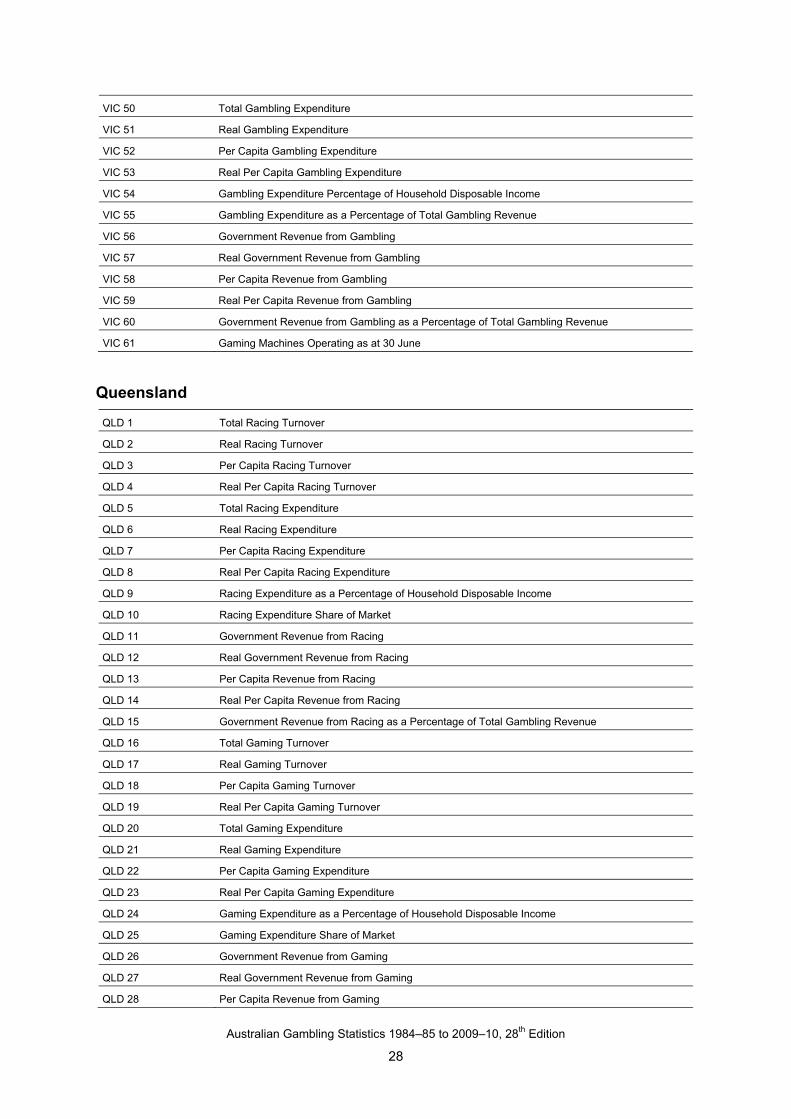
VIC 50 Total Gambling Expenditure
VIC 51 Real Gambling Expenditure
VIC 52 Per Capita Gambling Expenditure
VIC 53 Real Per Capita Gambling Expenditure
VIC 54 Gambling Expenditure Percentage of Household Disposable Income
VIC 55 Gambling Expenditure as a Percentage of Total Gambling Revenue
VIC 56 Government Revenue from Gambling
VIC 57 Real Government Revenue from Gambling
VIC 58 Per Capita Revenue from Gambling
VIC 59 Real Per Capita Revenue from Gambling
VIC 60 Government Revenue from Gambling as a Percentage of Total Gambling Revenue
VIC 61 Gaming Machines Operating as at 30 June
Queensland
QLD 1 Total Racing Turnover
QLD 2 Real Racing Turnover
QLD 3 Per Capita Racing Turnover
QLD 4 Real Per Capita Racing Turnover
QLD 5 Total Racing Expenditure
QLD 6 Real Racing Expenditure
QLD 7 Per Capita Racing Expenditure
QLD 8 Real Per Capita Racing Expenditure
QLD 9 Racing Expenditure as a Percentage of Household Disposable Income
QLD 10 Racing Expenditure Share of Market
QLD 11 Government Revenue from Racing
QLD 12 Real Government Revenue from Racing
QLD 13 Per Capita Revenue from Racing
QLD 14 Real Per Capita Revenue from Racing
QLD 15 Government Revenue from Racing as a Percentage of Total Gambling Revenue
QLD 16 Total Gaming Turnover
QLD 17 Real Gaming Turnover
QLD 18 Per Capita Gaming Turnover
QLD 19 Real Per Capita Gaming Turnover
QLD 20 Total Gaming Expenditure
QLD 21 Real Gaming Expenditure
QLD 22 Per Capita Gaming Expenditure
QLD 23 Real Per Capita Gaming Expenditure
QLD 24 Gaming Expenditure as a Percentage of Household Disposable Income
QLD 25 Gaming Expenditure Share of Market
QLD 26 Government Revenue from Gaming
QLD 27 Real Government Revenue from Gaming
QLD 28 Per Capita Revenue from Gaming
Australian Gambling Statistics 1984–85 to 2009–10, 28th Edition
29
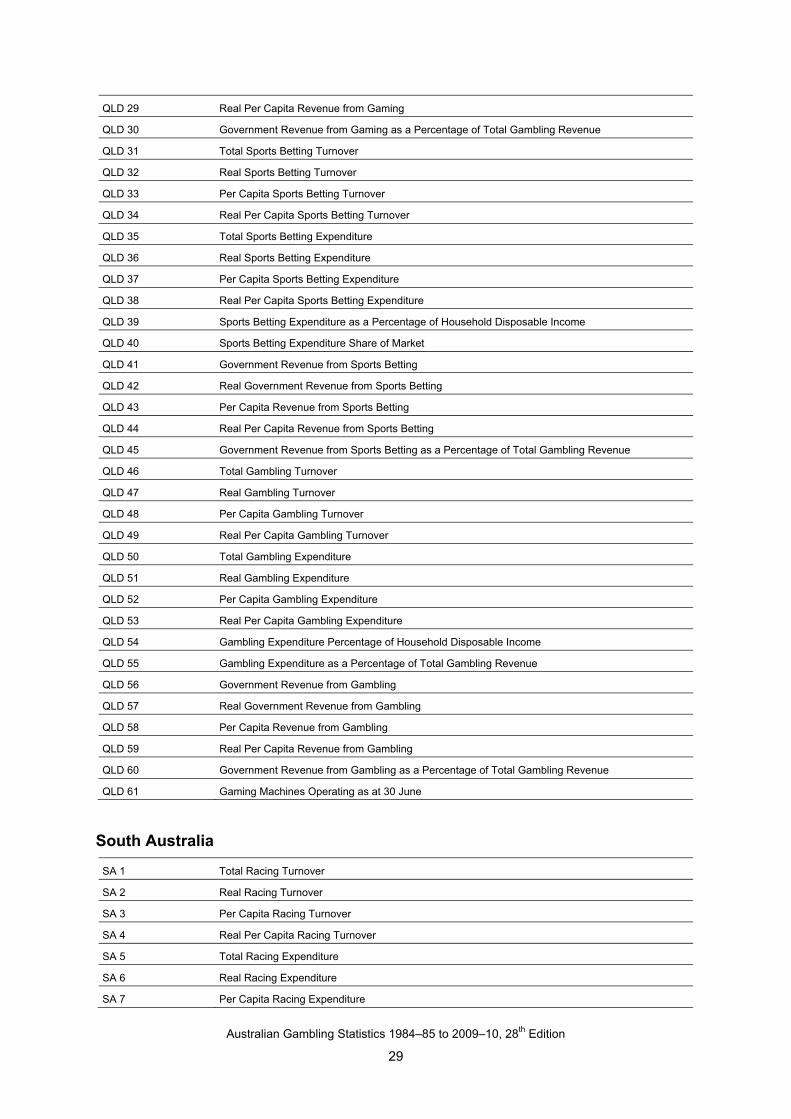
QLD 29 Real Per Capita Revenue from Gaming
QLD 30 Government Revenue from Gaming as a Percentage of Total Gambling Revenue
QLD 31 Total Sports Betting Turnover
QLD 32 Real Sports Betting Turnover
QLD 33 Per Capita Sports Betting Turnover
QLD 34 Real Per Capita Sports Betting Turnover
QLD 35 Total Sports Betting Expenditure
QLD 36 Real Sports Betting Expenditure
QLD 37 Per Capita Sports Betting Expenditure
QLD 38 Real Per Capita Sports Betting Expenditure
QLD 39 Sports Betting Expenditure as a Percentage of Household Disposable Income
QLD 40 Sports Betting Expenditure Share of Market
QLD 41 Government Revenue from Sports Betting
QLD 42 Real Government Revenue from Sports Betting
QLD 43 Per Capita Revenue from Sports Betting
QLD 44 Real Per Capita Revenue from Sports Betting
QLD 45 Government Revenue from Sports Betting as a Percentage of Total Gambling Revenue
QLD 46 Total Gambling Turnover
QLD 47 Real Gambling Turnover
QLD 48 Per Capita Gambling Turnover
QLD 49 Real Per Capita Gambling Turnover
QLD 50 Total Gambling Expenditure
QLD 51 Real Gambling Expenditure
QLD 52 Per Capita Gambling Expenditure
QLD 53 Real Per Capita Gambling Expenditure
QLD 54 Gambling Expenditure Percentage of Household Disposable Income
QLD 55 Gambling Expenditure as a Percentage of Total Gambling Revenue
QLD 56 Government Revenue from Gambling
QLD 57 Real Government Revenue from Gambling
QLD 58 Per Capita Revenue from Gambling
QLD 59 Real Per Capita Revenue from Gambling
QLD 60 Government Revenue from Gambling as a Percentage of Total Gambling Revenue
QLD 61 Gaming Machines Operating as at 30 June
South Australia
SA 1 Total Racing Turnover
SA 2 Real Racing Turnover
SA 3 Per Capita Racing Turnover
SA 4 Real Per Capita Racing Turnover
SA 5 Total Racing Expenditure
SA 6 Real Racing Expenditure
SA 7 Per Capita Racing Expenditure
Australian Gambling Statistics 1984–85 to 2009–10, 28th Edition
30
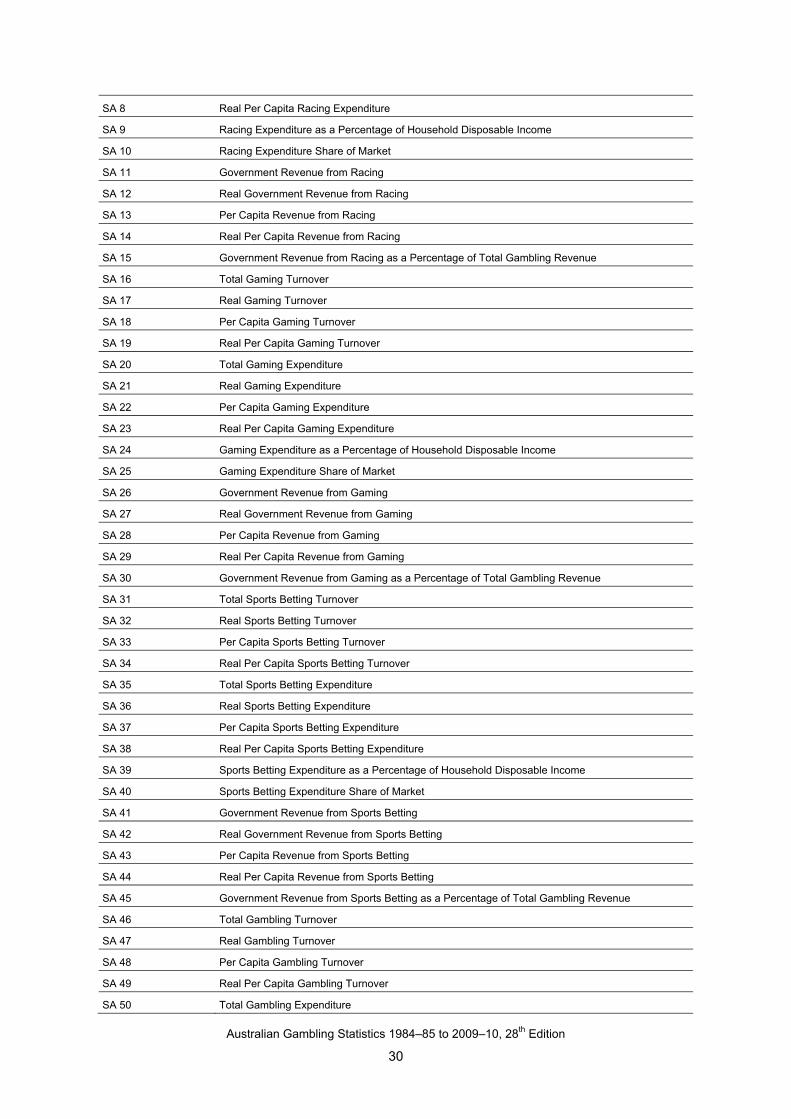
SA 8 Real Per Capita Racing Expenditure
SA 9 Racing Expenditure as a Percentage of Household Disposable Income
SA 10 Racing Expenditure Share of Market
SA 11 Government Revenue from Racing
SA 12 Real Government Revenue from Racing
SA 13 Per Capita Revenue from Racing
SA 14 Real Per Capita Revenue from Racing
SA 15 Government Revenue from Racing as a Percentage of Total Gambling Revenue
SA 16 Total Gaming Turnover
SA 17 Real Gaming Turnover
SA 18 Per Capita Gaming Turnover
SA 19 Real Per Capita Gaming Turnover
SA 20 Total Gaming Expenditure
SA 21 Real Gaming Expenditure
SA 22 Per Capita Gaming Expenditure
SA 23 Real Per Capita Gaming Expenditure
SA 24 Gaming Expenditure as a Percentage of Household Disposable Income
SA 25 Gaming Expenditure Share of Market
SA 26 Government Revenue from Gaming
SA 27 Real Government Revenue from Gaming
SA 28 Per Capita Revenue from Gaming
SA 29 Real Per Capita Revenue from Gaming
SA 30 Government Revenue from Gaming as a Percentage of Total Gambling Revenue
SA 31 Total Sports Betting Turnover
SA 32 Real Sports Betting Turnover
SA 33 Per Capita Sports Betting Turnover
SA 34 Real Per Capita Sports Betting Turnover
SA 35 Total Sports Betting Expenditure
SA 36 Real Sports Betting Expenditure
SA 37 Per Capita Sports Betting Expenditure
SA 38 Real Per Capita Sports Betting Expenditure
SA 39 Sports Betting Expenditure as a Percentage of Household Disposable Income
SA 40 Sports Betting Expenditure Share of Market
SA 41 Government Revenue from Sports Betting
SA 42 Real Government Revenue from Sports Betting
SA 43 Per Capita Revenue from Sports Betting
SA 44 Real Per Capita Revenue from Sports Betting
SA 45 Government Revenue from Sports Betting as a Percentage of Total Gambling Revenue
SA 46 Total Gambling Turnover
SA 47 Real Gambling Turnover
SA 48 Per Capita Gambling Turnover
SA 49 Real Per Capita Gambling Turnover
SA 50 Total Gambling Expenditure
Australian Gambling Statistics 1984–85 to 2009–10, 28th Edition
31
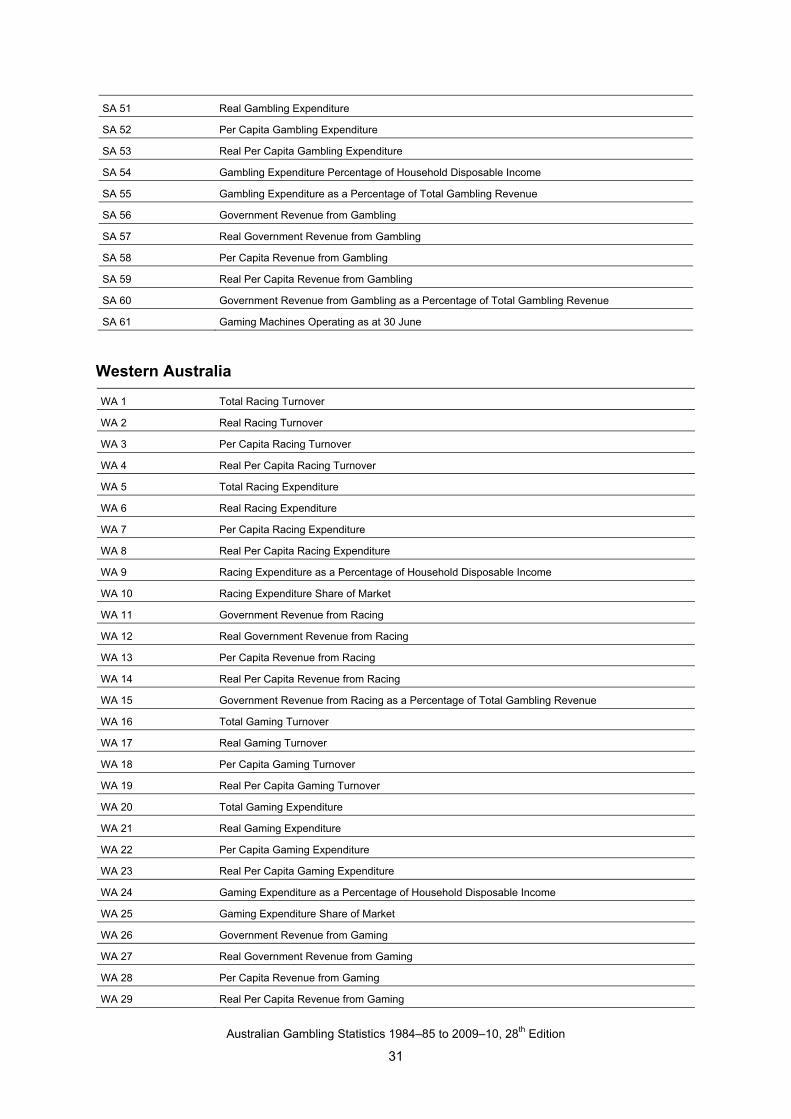
SA 51 Real Gambling Expenditure
SA 52 Per Capita Gambling Expenditure
SA 53 Real Per Capita Gambling Expenditure
SA 54 Gambling Expenditure Percentage of Household Disposable Income
SA 55 Gambling Expenditure as a Percentage of Total Gambling Revenue
SA 56 Government Revenue from Gambling
SA 57 Real Government Revenue from Gambling
SA 58 Per Capita Revenue from Gambling
SA 59 Real Per Capita Revenue from Gambling
SA 60 Government Revenue from Gambling as a Percentage of Total Gambling Revenue
SA 61 Gaming Machines Operating as at 30 June
Western Australia
WA 1 Total Racing Turnover
WA 2 Real Racing Turnover
WA 3 Per Capita Racing Turnover
WA 4 Real Per Capita Racing Turnover
WA 5 Total Racing Expenditure
WA 6 Real Racing Expenditure
WA 7 Per Capita Racing Expenditure
WA 8 Real Per Capita Racing Expenditure
WA 9 Racing Expenditure as a Percentage of Household Disposable Income
WA 10 Racing Expenditure Share of Market
WA 11 Government Revenue from Racing
WA 12 Real Government Revenue from Racing
WA 13 Per Capita Revenue from Racing
WA 14 Real Per Capita Revenue from Racing
WA 15 Government Revenue from Racing as a Percentage of Total Gambling Revenue
WA 16 Total Gaming Turnover
WA 17 Real Gaming Turnover
WA 18 Per Capita Gaming Turnover
WA 19 Real Per Capita Gaming Turnover
WA 20 Total Gaming Expenditure
WA 21 Real Gaming Expenditure
WA 22 Per Capita Gaming Expenditure
WA 23 Real Per Capita Gaming Expenditure
WA 24 Gaming Expenditure as a Percentage of Household Disposable Income
WA 25 Gaming Expenditure Share of Market
WA 26 Government Revenue from Gaming
WA 27 Real Government Revenue from Gaming
WA 28 Per Capita Revenue from Gaming
WA 29 Real Per Capita Revenue from Gaming
Australian Gambling Statistics 1984–85 to 2009–10, 28th Edition
32
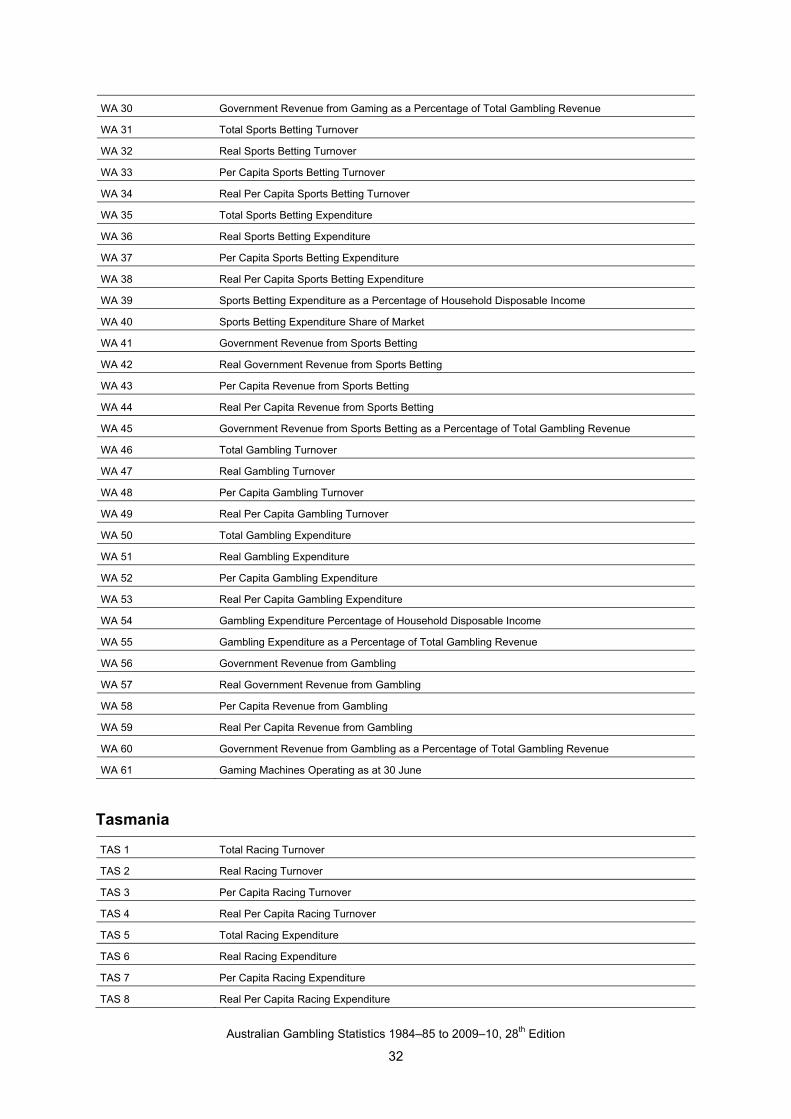
WA 30 Government Revenue from Gaming as a Percentage of Total Gambling Revenue
WA 31 Total Sports Betting Turnover
WA 32 Real Sports Betting Turnover
WA 33 Per Capita Sports Betting Turnover
WA 34 Real Per Capita Sports Betting Turnover
WA 35 Total Sports Betting Expenditure
WA 36 Real Sports Betting Expenditure
WA 37 Per Capita Sports Betting Expenditure
WA 38 Real Per Capita Sports Betting Expenditure
WA 39 Sports Betting Expenditure as a Percentage of Household Disposable Income
WA 40 Sports Betting Expenditure Share of Market
WA 41 Government Revenue from Sports Betting
WA 42 Real Government Revenue from Sports Betting
WA 43 Per Capita Revenue from Sports Betting
WA 44 Real Per Capita Revenue from Sports Betting
WA 45 Government Revenue from Sports Betting as a Percentage of Total Gambling Revenue
WA 46 Total Gambling Turnover
WA 47 Real Gambling Turnover
WA 48 Per Capita Gambling Turnover
WA 49 Real Per Capita Gambling Turnover
WA 50 Total Gambling Expenditure
WA 51 Real Gambling Expenditure
WA 52 Per Capita Gambling Expenditure
WA 53 Real Per Capita Gambling Expenditure
WA 54 Gambling Expenditure Percentage of Household Disposable Income
WA 55 Gambling Expenditure as a Percentage of Total Gambling Revenue
WA 56 Government Revenue from Gambling
WA 57 Real Government Revenue from Gambling
WA 58 Per Capita Revenue from Gambling
WA 59 Real Per Capita Revenue from Gambling
WA 60 Government Revenue from Gambling as a Percentage of Total Gambling Revenue
WA 61 Gaming Machines Operating as at 30 June
Tasmania
TAS 1 Total Racing Turnover
TAS 2 Real Racing Turnover
TAS 3 Per Capita Racing Turnover
TAS 4 Real Per Capita Racing Turnover
TAS 5 Total Racing Expenditure
TAS 6 Real Racing Expenditure
TAS 7 Per Capita Racing Expenditure
TAS 8 Real Per Capita Racing Expenditure
Australian Gambling Statistics 1984–85 to 2009–10, 28th Edition
33
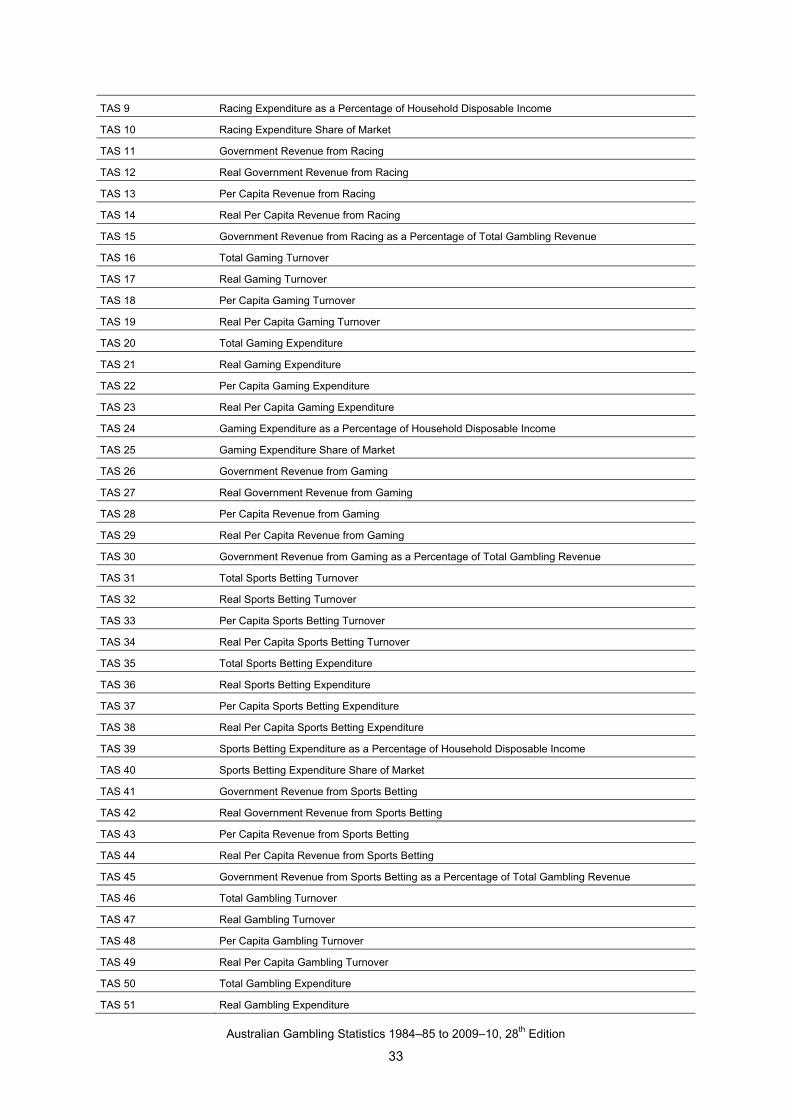
TAS 9 Racing Expenditure as a Percentage of Household Disposable Income
TAS 10 Racing Expenditure Share of Market
TAS 11 Government Revenue from Racing
TAS 12 Real Government Revenue from Racing
TAS 13 Per Capita Revenue from Racing
TAS 14 Real Per Capita Revenue from Racing
TAS 15 Government Revenue from Racing as a Percentage of Total Gambling Revenue
TAS 16 Total Gaming Turnover
TAS 17 Real Gaming Turnover
TAS 18 Per Capita Gaming Turnover
TAS 19 Real Per Capita Gaming Turnover
TAS 20 Total Gaming Expenditure
TAS 21 Real Gaming Expenditure
TAS 22 Per Capita Gaming Expenditure
TAS 23 Real Per Capita Gaming Expenditure
TAS 24 Gaming Expenditure as a Percentage of Household Disposable Income
TAS 25 Gaming Expenditure Share of Market
TAS 26 Government Revenue from Gaming
TAS 27 Real Government Revenue from Gaming
TAS 28 Per Capita Revenue from Gaming
TAS 29 Real Per Capita Revenue from Gaming
TAS 30 Government Revenue from Gaming as a Percentage of Total Gambling Revenue
TAS 31 Total Sports Betting Turnover
TAS 32 Real Sports Betting Turnover
TAS 33 Per Capita Sports Betting Turnover
TAS 34 Real Per Capita Sports Betting Turnover
TAS 35 Total Sports Betting Expenditure
TAS 36 Real Sports Betting Expenditure
TAS 37 Per Capita Sports Betting Expenditure
TAS 38 Real Per Capita Sports Betting Expenditure
TAS 39 Sports Betting Expenditure as a Percentage of Household Disposable Income
TAS 40 Sports Betting Expenditure Share of Market
TAS 41 Government Revenue from Sports Betting
TAS 42 Real Government Revenue from Sports Betting
TAS 43 Per Capita Revenue from Sports Betting
TAS 44 Real Per Capita Revenue from Sports Betting
TAS 45 Government Revenue from Sports Betting as a Percentage of Total Gambling Revenue
TAS 46 Total Gambling Turnover
TAS 47 Real Gambling Turnover
TAS 48 Per Capita Gambling Turnover
TAS 49 Real Per Capita Gambling Turnover
TAS 50 Total Gambling Expenditure
TAS 51 Real Gambling Expenditure
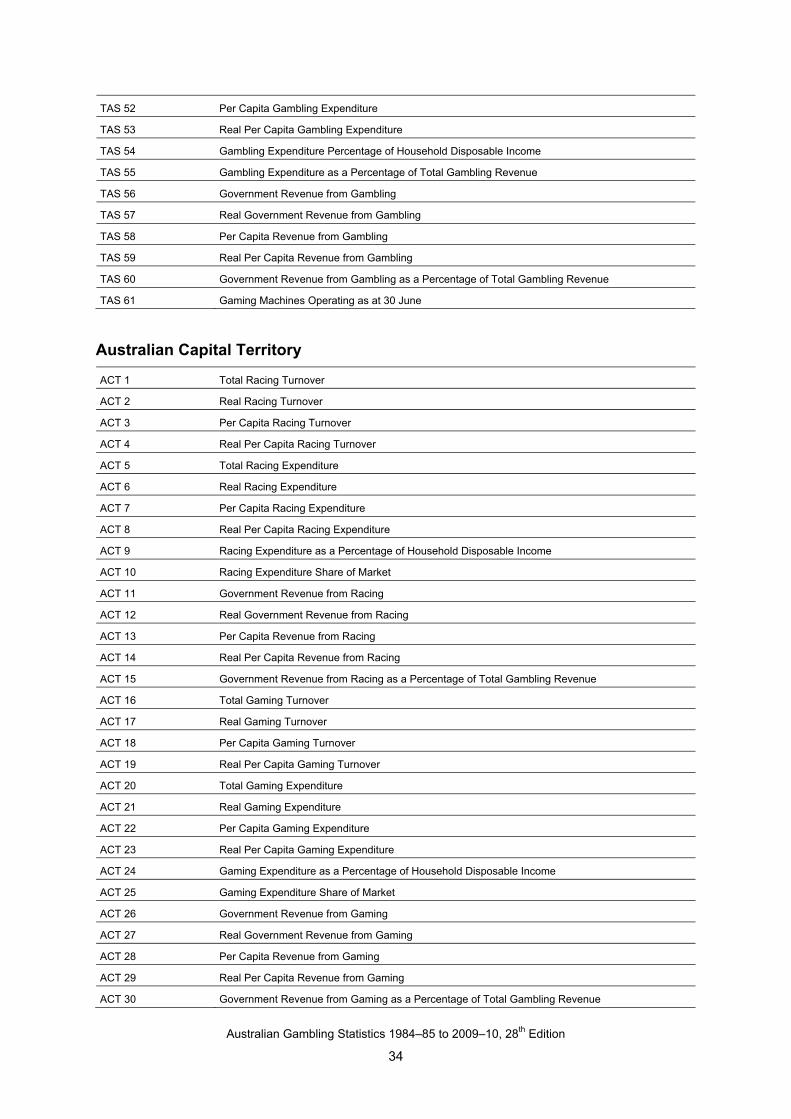
Australian Gambling Statistics 1984–85 to 2009–10, 28th Edition
34
TAS 52 Per Capita Gambling Expenditure
TAS 53 Real Per Capita Gambling Expenditure
TAS 54 Gambling Expenditure Percentage of Household Disposable Income
TAS 55 Gambling Expenditure as a Percentage of Total Gambling Revenue
TAS 56 Government Revenue from Gambling
TAS 57 Real Government Revenue from Gambling
TAS 58 Per Capita Revenue from Gambling
TAS 59 Real Per Capita Revenue from Gambling
TAS 60 Government Revenue from Gambling as a Percentage of Total Gambling Revenue
TAS 61 Gaming Machines Operating as at 30 June
Australian Capital Territory
ACT 1 Total Racing Turnover
ACT 2 Real Racing Turnover
ACT 3 Per Capita Racing Turnover
ACT 4 Real Per Capita Racing Turnover
ACT 5 Total Racing Expenditure
ACT 6 Real Racing Expenditure
ACT 7 Per Capita Racing Expenditure
ACT 8 Real Per Capita Racing Expenditure
ACT 9 Racing Expenditure as a Percentage of Household Disposable Income
ACT 10 Racing Expenditure Share of Market
ACT 11 Government Revenue from Racing
ACT 12 Real Government Revenue from Racing
ACT 13 Per Capita Revenue from Racing
ACT 14 Real Per Capita Revenue from Racing
ACT 15 Government Revenue from Racing as a Percentage of Total Gambling Revenue
ACT 16 Total Gaming Turnover
ACT 17 Real Gaming Turnover
ACT 18 Per Capita Gaming Turnover
ACT 19 Real Per Capita Gaming Turnover
ACT 20 Total Gaming Expenditure
ACT 21 Real Gaming Expenditure
ACT 22 Per Capita Gaming Expenditure
ACT 23 Real Per Capita Gaming Expenditure
ACT 24 Gaming Expenditure as a Percentage of Household Disposable Income
ACT 25 Gaming Expenditure Share of Market
ACT 26 Government Revenue from Gaming
ACT 27 Real Government Revenue from Gaming
ACT 28 Per Capita Revenue from Gaming
ACT 29 Real Per Capita Revenue from Gaming
ACT 30 Government Revenue from Gaming as a Percentage of Total Gambling Revenue
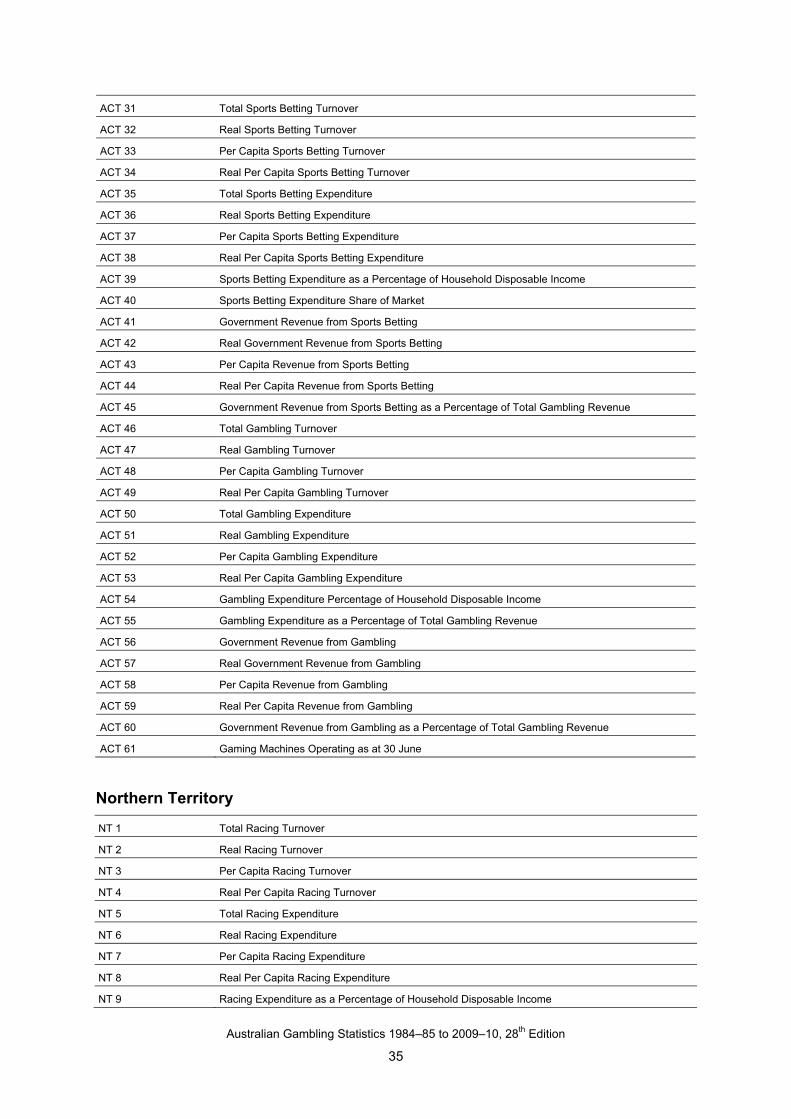
Australian Gambling Statistics 1984–85 to 2009–10, 28th Edition
35
ACT 31 Total Sports Betting Turnover
ACT 32 Real Sports Betting Turnover
ACT 33 Per Capita Sports Betting Turnover
ACT 34 Real Per Capita Sports Betting Turnover
ACT 35 Total Sports Betting Expenditure
ACT 36 Real Sports Betting Expenditure
ACT 37 Per Capita Sports Betting Expenditure
ACT 38 Real Per Capita Sports Betting Expenditure
ACT 39 Sports Betting Expenditure as a Percentage of Household Disposable Income
ACT 40 Sports Betting Expenditure Share of Market
ACT 41 Government Revenue from Sports Betting
ACT 42 Real Government Revenue from Sports Betting
ACT 43 Per Capita Revenue from Sports Betting
ACT 44 Real Per Capita Revenue from Sports Betting
ACT 45 Government Revenue from Sports Betting as a Percentage of Total Gambling Revenue
ACT 46 Total Gambling Turnover
ACT 47 Real Gambling Turnover
ACT 48 Per Capita Gambling Turnover
ACT 49 Real Per Capita Gambling Turnover
ACT 50 Total Gambling Expenditure
ACT 51 Real Gambling Expenditure
ACT 52 Per Capita Gambling Expenditure
ACT 53 Real Per Capita Gambling Expenditure
ACT 54 Gambling Expenditure Percentage of Household Disposable Income
ACT 55 Gambling Expenditure as a Percentage of Total Gambling Revenue
ACT 56 Government Revenue from Gambling
ACT 57 Real Government Revenue from Gambling
ACT 58 Per Capita Revenue from Gambling
ACT 59 Real Per Capita Revenue from Gambling
ACT 60 Government Revenue from Gambling as a Percentage of Total Gambling Revenue
ACT 61 Gaming Machines Operating as at 30 June
Northern Territory
NT 1 Total Racing Turnover
NT 2 Real Racing Turnover
NT 3 Per Capita Racing Turnover
NT 4 Real Per Capita Racing Turnover
NT 5 Total Racing Expenditure
NT 6 Real Racing Expenditure
NT 7 Per Capita Racing Expenditure
NT 8 Real Per Capita Racing Expenditure
NT 9 Racing Expenditure as a Percentage of Household Disposable Income
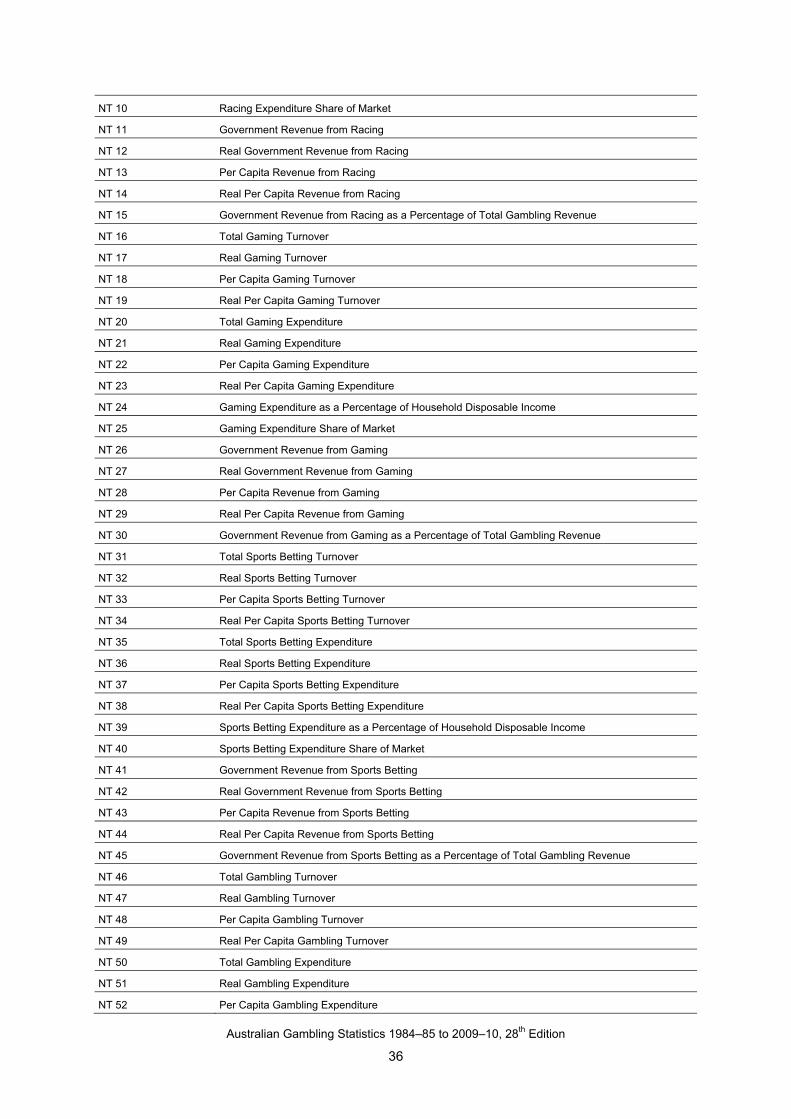
Australian Gambling Statistics 1984–85 to 2009–10, 28th Edition
36
NT 10 Racing Expenditure Share of Market
NT 11 Government Revenue from Racing
NT 12 Real Government Revenue from Racing
NT 13 Per Capita Revenue from Racing
NT 14 Real Per Capita Revenue from Racing
NT 15 Government Revenue from Racing as a Percentage of Total Gambling Revenue
NT 16 Total Gaming Turnover
NT 17 Real Gaming Turnover
NT 18 Per Capita Gaming Turnover
NT 19 Real Per Capita Gaming Turnover
NT 20 Total Gaming Expenditure
NT 21 Real Gaming Expenditure
NT 22 Per Capita Gaming Expenditure
NT 23 Real Per Capita Gaming Expenditure
NT 24 Gaming Expenditure as a Percentage of Household Disposable Income
NT 25 Gaming Expenditure Share of Market
NT 26 Government Revenue from Gaming
NT 27 Real Government Revenue from Gaming
NT 28 Per Capita Revenue from Gaming
NT 29 Real Per Capita Revenue from Gaming
NT 30 Government Revenue from Gaming as a Percentage of Total Gambling Revenue
NT 31 Total Sports Betting Turnover
NT 32 Real Sports Betting Turnover
NT 33 Per Capita Sports Betting Turnover
NT 34 Real Per Capita Sports Betting Turnover
NT 35 Total Sports Betting Expenditure
NT 36 Real Sports Betting Expenditure
NT 37 Per Capita Sports Betting Expenditure
NT 38 Real Per Capita Sports Betting Expenditure
NT 39 Sports Betting Expenditure as a Percentage of Household Disposable Income
NT 40 Sports Betting Expenditure Share of Market
NT 41 Government Revenue from Sports Betting
NT 42 Real Government Revenue from Sports Betting
NT 43 Per Capita Revenue from Sports Betting
NT 44 Real Per Capita Revenue from Sports Betting
NT 45 Government Revenue from Sports Betting as a Percentage of Total Gambling Revenue
NT 46 Total Gambling Turnover
NT 47 Real Gambling Turnover
NT 48 Per Capita Gambling Turnover
NT 49 Real Per Capita Gambling Turnover
NT 50 Total Gambling Expenditure
NT 51 Real Gambling Expenditure
NT 52 Per Capita Gambling Expenditure
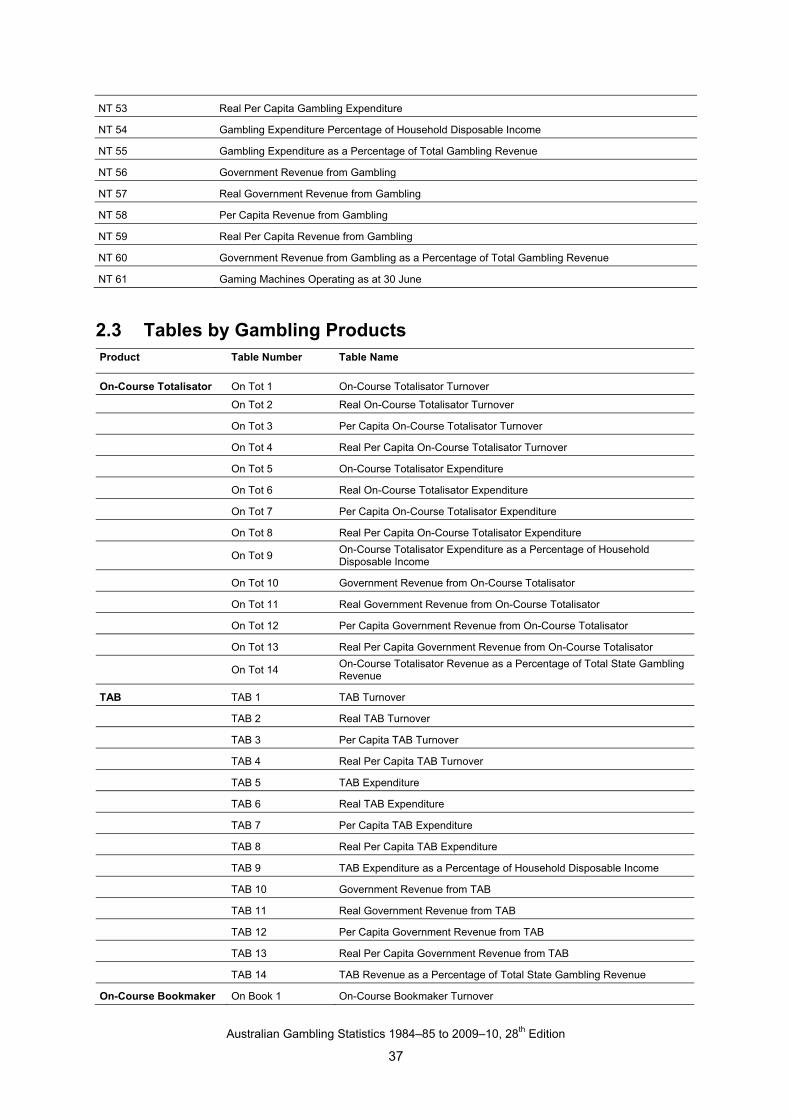
Australian Gambling Statistics 1984–85 to 2009–10, 28th Edition
37
NT 53 Real Per Capita Gambling Expenditure
NT 54 Gambling Expenditure Percentage of Household Disposable Income
NT 55 Gambling Expenditure as a Percentage of Total Gambling Revenue
NT 56 Government Revenue from Gambling
NT 57 Real Government Revenue from Gambling
NT 58 Per Capita Revenue from Gambling
NT 59 Real Per Capita Revenue from Gambling
NT 60 Government Revenue from Gambling as a Percentage of Total Gambling Revenue
NT 61 Gaming Machines Operating as at 30 June
2.3 Tables by Gambling Products
Product Table Number Table Name
On-Course Totalisator On Tot 1 On-Course Totalisator Turnover
On Tot 2 Real On-Course Totalisator Turnover
On Tot 3 Per Capita On-Course Totalisator Turnover
On Tot 4 Real Per Capita On-Course Totalisator Turnover
On Tot 5 On-Course Totalisator Expenditure
On Tot 6 Real On-Course Totalisator Expenditure
On Tot 7 Per Capita On-Course Totalisator Expenditure
On Tot 8 Real Per Capita On-Course Totalisator Expenditure
On Tot 9
On-Course Totalisator Expenditure as a Percentage of Household Disposable Income
On Tot 10 Government Revenue from On-Course Totalisator
On Tot 11 Real Government Revenue from On-Course Totalisator
On Tot 12 Per Capita Government Revenue from On-Course Totalisator
On Tot 13 Real Per Capita Government Revenue from On-Course Totalisator
On Tot 14
On-Course Totalisator Revenue as a Percentage of Total State Gambling Revenue
TAB TAB 1 TAB Turnover
TAB 2 Real TAB Turnover
TAB 3 Per Capita TAB Turnover
TAB 4 Real Per Capita TAB Turnover
TAB 5 TAB Expenditure
TAB 6 Real TAB Expenditure
TAB 7 Per Capita TAB Expenditure
TAB 8 Real Per Capita TAB Expenditure
TAB 9 TAB Expenditure as a Percentage of Household Disposable Income
TAB 10 Government Revenue from TAB
TAB 11 Real Government Revenue from TAB
TAB 12 Per Capita Government Revenue from TAB
TAB 13 Real Per Capita Government Revenue from TAB
TAB 14 TAB Revenue as a Percentage of Total State Gambling Revenue
On-Course Bookmaker On Book 1 On-Course Bookmaker Turnover
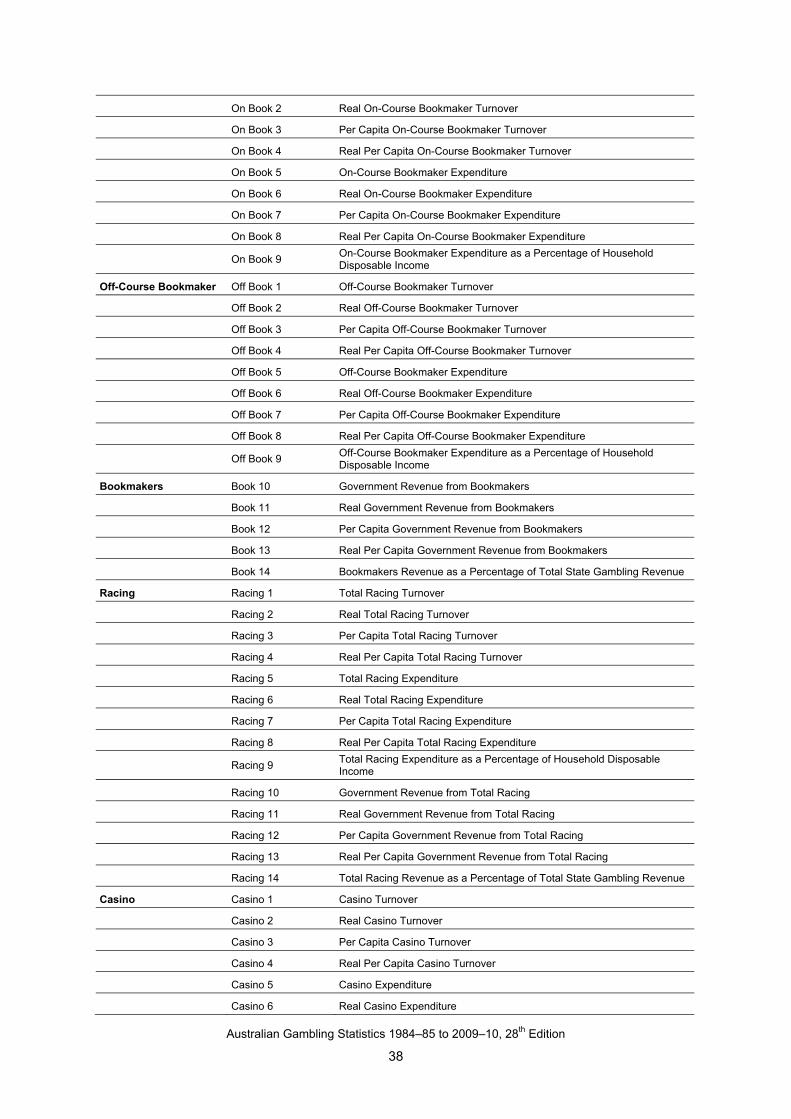
Australian Gambling Statistics 1984–85 to 2009–10, 28th Edition
38
On Book 2 Real On-Course Bookmaker Turnover
On Book 3 Per Capita On-Course Bookmaker Turnover
On Book 4 Real Per Capita On-Course Bookmaker Turnover
On Book 5 On-Course Bookmaker Expenditure
On Book 6 Real On-Course Bookmaker Expenditure
On Book 7 Per Capita On-Course Bookmaker Expenditure
On Book 8 Real Per Capita On-Course Bookmaker Expenditure
On Book 9
On-Course Bookmaker Expenditure as a Percentage of Household Disposable Income
Off-Course Bookmaker Off Book 1 Off-Course Bookmaker Turnover
Off Book 2 Real Off-Course Bookmaker Turnover
Off Book 3 Per Capita Off-Course Bookmaker Turnover
Off Book 4 Real Per Capita Off-Course Bookmaker Turnover
Off Book 5 Off-Course Bookmaker Expenditure
Off Book 6 Real Off-Course Bookmaker Expenditure
Off Book 7 Per Capita Off-Course Bookmaker Expenditure
Off Book 8 Real Per Capita Off-Course Bookmaker Expenditure
Off Book 9
Off-Course Bookmaker Expenditure as a Percentage of Household Disposable Income
Bookmakers Book 10 Government Revenue from Bookmakers
Book 11 Real Government Revenue from Bookmakers
Book 12 Per Capita Government Revenue from Bookmakers
Book 13 Real Per Capita Government Revenue from Bookmakers
Book 14 Bookmakers Revenue as a Percentage of Total State Gambling Revenue
Racing Racing 1 Total Racing Turnover
Racing 2 Real Total Racing Turnover
Racing 3 Per Capita Total Racing Turnover
Racing 4 Real Per Capita Total Racing Turnover
Racing 5 Total Racing Expenditure
Racing 6 Real Total Racing Expenditure
Racing 7 Per Capita Total Racing Expenditure
Racing 8 Real Per Capita Total Racing Expenditure
Racing 9
Total Racing Expenditure as a Percentage of Household Disposable Income
Racing 10 Government Revenue from Total Racing
Racing 11 Real Government Revenue from Total Racing
Racing 12 Per Capita Government Revenue from Total Racing
Racing 13 Real Per Capita Government Revenue from Total Racing
Racing 14 Total Racing Revenue as a Percentage of Total State Gambling Revenue
Casino Casino 1 Casino Turnover
Casino 2 Real Casino Turnover
Casino 3 Per Capita Casino Turnover
Casino 4 Real Per Capita Casino Turnover
Casino 5 Casino Expenditure
Casino 6 Real Casino Expenditure
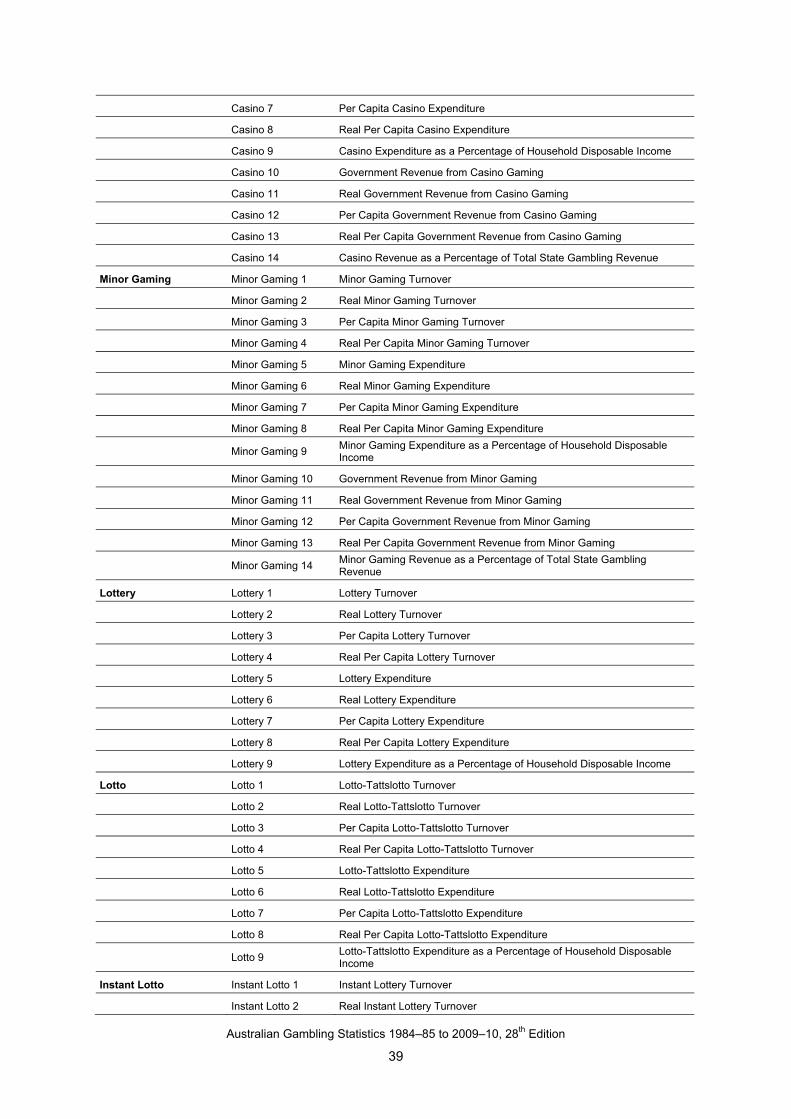
Australian Gambling Statistics 1984–85 to 2009–10, 28th Edition
39
Casino 7 Per Capita Casino Expenditure
Casino 8 Real Per Capita Casino Expenditure
Casino 9 Casino Expenditure as a Percentage of Household Disposable Income
Casino 10 Government Revenue from Casino Gaming
Casino 11 Real Government Revenue from Casino Gaming
Casino 12 Per Capita Government Revenue from Casino Gaming
Casino 13 Real Per Capita Government Revenue from Casino Gaming
Casino 14 Casino Revenue as a Percentage of Total State Gambling Revenue
Minor Gaming Minor Gaming 1 Minor Gaming Turnover
Minor Gaming 2 Real Minor Gaming Turnover
Minor Gaming 3 Per Capita Minor Gaming Turnover
Minor Gaming 4 Real Per Capita Minor Gaming Turnover
Minor Gaming 5 Minor Gaming Expenditure
Minor Gaming 6 Real Minor Gaming Expenditure
Minor Gaming 7 Per Capita Minor Gaming Expenditure
Minor Gaming 8 Real Per Capita Minor Gaming Expenditure
Minor Gaming 9
Minor Gaming Expenditure as a Percentage of Household Disposable Income
Minor Gaming 10 Government Revenue from Minor Gaming
Minor Gaming 11 Real Government Revenue from Minor Gaming
Minor Gaming 12 Per Capita Government Revenue from Minor Gaming
Minor Gaming 13 Real Per Capita Government Revenue from Minor Gaming
Minor Gaming 14
Minor Gaming Revenue as a Percentage of Total State Gambling Revenue
Lottery Lottery 1 Lottery Turnover
Lottery 2 Real Lottery Turnover
Lottery 3 Per Capita Lottery Turnover
Lottery 4 Real Per Capita Lottery Turnover
Lottery 5 Lottery Expenditure
Lottery 6 Real Lottery Expenditure
Lottery 7 Per Capita Lottery Expenditure
Lottery 8 Real Per Capita Lottery Expenditure
Lottery 9 Lottery Expenditure as a Percentage of Household Disposable Income
Lotto Lotto 1 Lotto-Tattslotto Turnover
Lotto 2 Real Lotto-Tattslotto Turnover
Lotto 3 Per Capita Lotto-Tattslotto Turnover
Lotto 4 Real Per Capita Lotto-Tattslotto Turnover
Lotto 5 Lotto-Tattslotto Expenditure
Lotto 6 Real Lotto-Tattslotto Expenditure
Lotto 7 Per Capita Lotto-Tattslotto Expenditure
Lotto 8 Real Per Capita Lotto-Tattslotto Expenditure
Lotto 9
Lotto-Tattslotto Expenditure as a Percentage of Household Disposable Income
Instant Lotto Instant Lotto 1 Instant Lottery Turnover
Instant Lotto 2 Real Instant Lottery Turnover
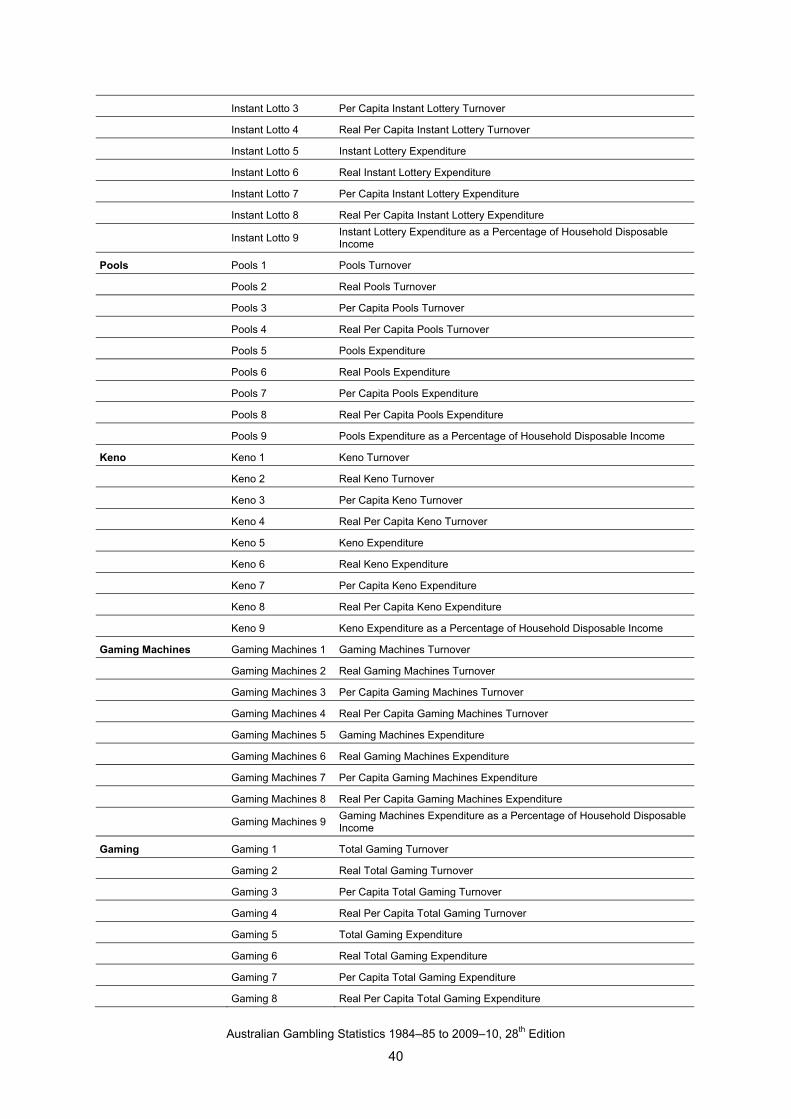
Australian Gambling Statistics 1984–85 to 2009–10, 28th Edition
40
Instant Lotto 3 Per Capita Instant Lottery Turnover
Instant Lotto 4 Real Per Capita Instant Lottery Turnover
Instant Lotto 5 Instant Lottery Expenditure
Instant Lotto 6 Real Instant Lottery Expenditure
Instant Lotto 7 Per Capita Instant Lottery Expenditure
Instant Lotto 8 Real Per Capita Instant Lottery Expenditure
Instant Lotto 9
Instant Lottery Expenditure as a Percentage of Household Disposable Income
Pools Pools 1 Pools Turnover
Pools 2 Real Pools Turnover
Pools 3 Per Capita Pools Turnover
Pools 4 Real Per Capita Pools Turnover
Pools 5 Pools Expenditure
Pools 6 Real Pools Expenditure
Pools 7 Per Capita Pools Expenditure
Pools 8 Real Per Capita Pools Expenditure
Pools 9 Pools Expenditure as a Percentage of Household Disposable Income
Keno Keno 1 Keno Turnover
Keno 2 Real Keno Turnover
Keno 3 Per Capita Keno Turnover
Keno 4 Real Per Capita Keno Turnover
Keno 5 Keno Expenditure
Keno 6 Real Keno Expenditure
Keno 7 Per Capita Keno Expenditure
Keno 8 Real Per Capita Keno Expenditure
Keno 9 Keno Expenditure as a Percentage of Household Disposable Income
Gaming Machines Gaming Machines 1 Gaming Machines Turnover
Gaming Machines 2 Real Gaming Machines Turnover
Gaming Machines 3 Per Capita Gaming Machines Turnover
Gaming Machines 4 Real Per Capita Gaming Machines Turnover
Gaming Machines 5 Gaming Machines Expenditure
Gaming Machines 6 Real Gaming Machines Expenditure
Gaming Machines 7 Per Capita Gaming Machines Expenditure
Gaming Machines 8 Real Per Capita Gaming Machines Expenditure
Gaming Machines 9
Gaming Machines Expenditure as a Percentage of Household Disposable Income
Gaming Gaming 1 Total Gaming Turnover
Gaming 2 Real Total Gaming Turnover
Gaming 3 Per Capita Total Gaming Turnover
Gaming 4 Real Per Capita Total Gaming Turnover
Gaming 5 Total Gaming Expenditure
Gaming 6 Real Total Gaming Expenditure
Gaming 7 Per Capita Total Gaming Expenditure
Gaming 8 Real Per Capita Total Gaming Expenditure
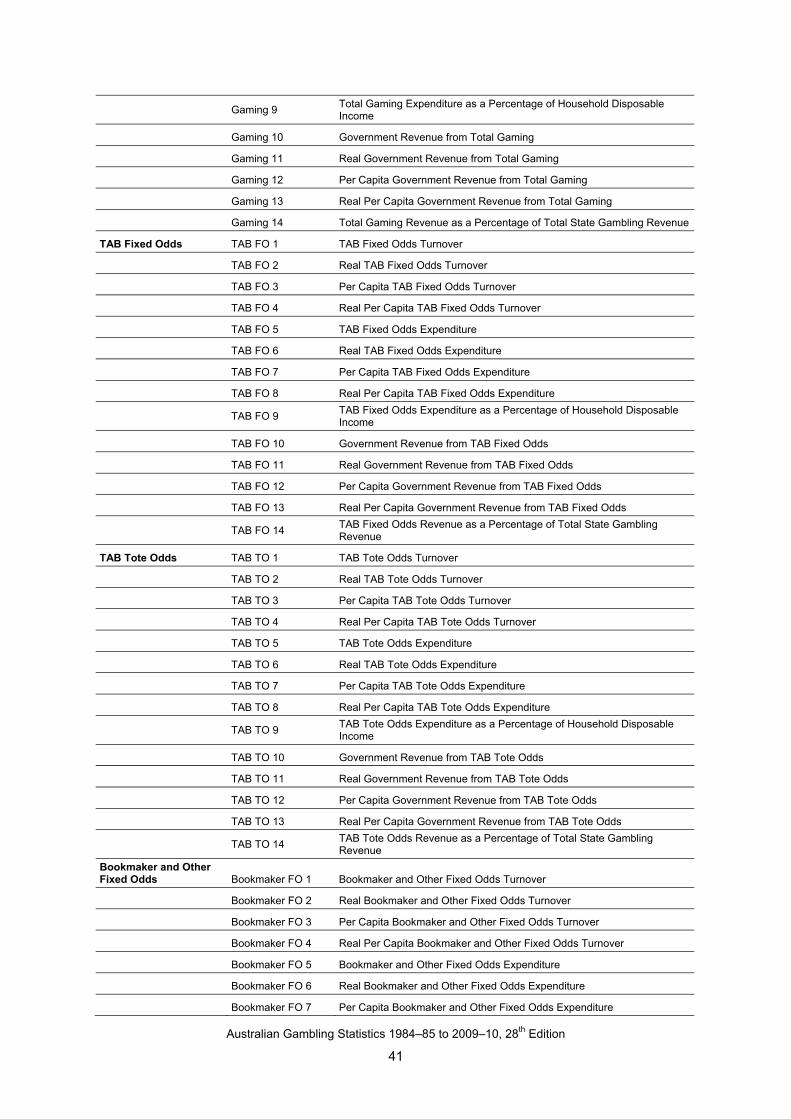
Australian Gambling Statistics 1984–85 to 2009–10, 28th Edition
41
Gaming 9
Total Gaming Expenditure as a Percentage of Household Disposable Income
Gaming 10 Government Revenue from Total Gaming
Gaming 11 Real Government Revenue from Total Gaming
Gaming 12 Per Capita Government Revenue from Total Gaming
Gaming 13 Real Per Capita Government Revenue from Total Gaming
Gaming 14 Total Gaming Revenue as a Percentage of Total State Gambling Revenue
TAB Fixed Odds TAB FO 1 TAB Fixed Odds Turnover
TAB FO 2 Real TAB Fixed Odds Turnover
TAB FO 3 Per Capita TAB Fixed Odds Turnover
TAB FO 4 Real Per Capita TAB Fixed Odds Turnover
TAB FO 5 TAB Fixed Odds Expenditure
TAB FO 6 Real TAB Fixed Odds Expenditure
TAB FO 7 Per Capita TAB Fixed Odds Expenditure
TAB FO 8 Real Per Capita TAB Fixed Odds Expenditure
TAB FO 9
TAB Fixed Odds Expenditure as a Percentage of Household Disposable Income
TAB FO 10 Government Revenue from TAB Fixed Odds
TAB FO 11 Real Government Revenue from TAB Fixed Odds
TAB FO 12 Per Capita Government Revenue from TAB Fixed Odds
TAB FO 13 Real Per Capita Government Revenue from TAB Fixed Odds
TAB FO 14
TAB Fixed Odds Revenue as a Percentage of Total State Gambling Revenue
TAB Tote Odds TAB TO 1 TAB Tote Odds Turnover
TAB TO 2 Real TAB Tote Odds Turnover
TAB TO 3 Per Capita TAB Tote Odds Turnover
TAB TO 4 Real Per Capita TAB Tote Odds Turnover
TAB TO 5 TAB Tote Odds Expenditure
TAB TO 6 Real TAB Tote Odds Expenditure
TAB TO 7 Per Capita TAB Tote Odds Expenditure
TAB TO 8 Real Per Capita TAB Tote Odds Expenditure
TAB TO 9
TAB Tote Odds Expenditure as a Percentage of Household Disposable Income
TAB TO 10 Government Revenue from TAB Tote Odds
TAB TO 11 Real Government Revenue from TAB Tote Odds
TAB TO 12 Per Capita Government Revenue from TAB Tote Odds
TAB TO 13 Real Per Capita Government Revenue from TAB Tote Odds
TAB TO 14
TAB Tote Odds Revenue as a Percentage of Total State Gambling Revenue
Bookmaker and Other Fixed Odds Bookmaker FO 1 Bookmaker and Other Fixed Odds Turnover
Bookmaker FO 2 Real Bookmaker and Other Fixed Odds Turnover
Bookmaker FO 3 Per Capita Bookmaker and Other Fixed Odds Turnover
Bookmaker FO 4 Real Per Capita Bookmaker and Other Fixed Odds Turnover
Bookmaker FO 5 Bookmaker and Other Fixed Odds Expenditure
Bookmaker FO 6 Real Bookmaker and Other Fixed Odds Expenditure
Bookmaker FO 7 Per Capita Bookmaker and Other Fixed Odds Expenditure
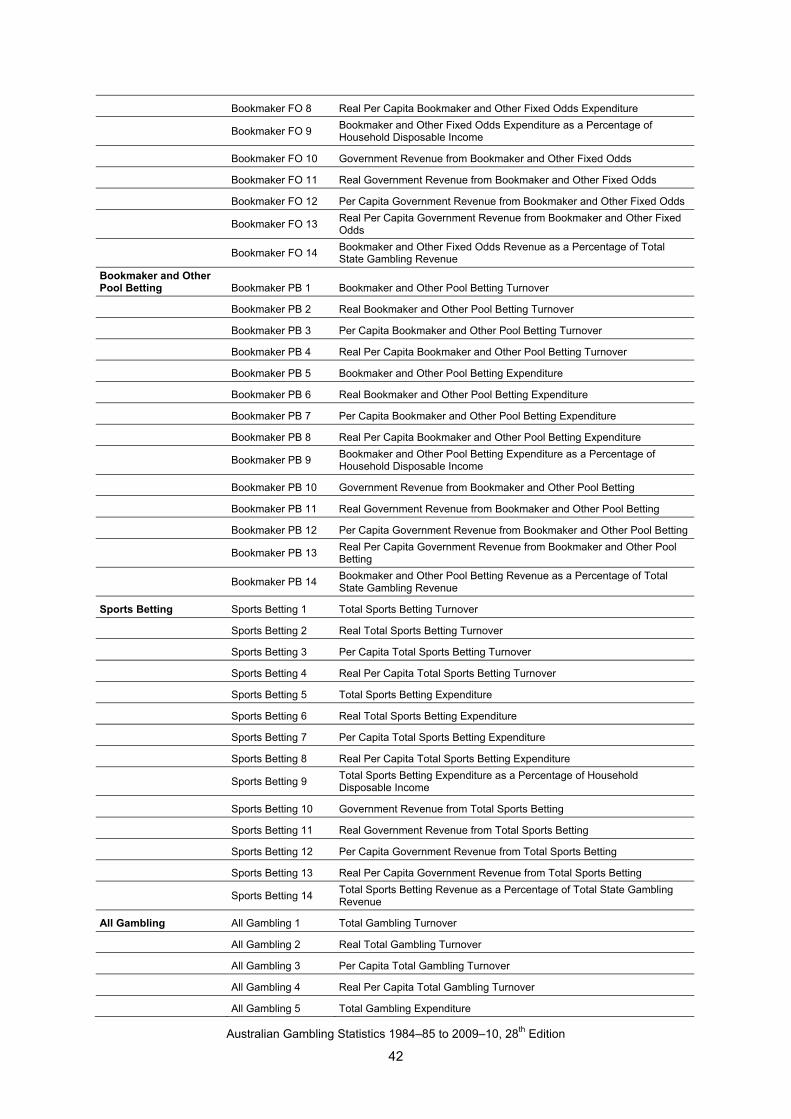
Australian Gambling Statistics 1984–85 to 2009–10, 28th Edition
42
Bookmaker FO 8 Real Per Capita Bookmaker and Other Fixed Odds Expenditure
Bookmaker FO 9
Bookmaker and Other Fixed Odds Expenditure as a Percentage of Household Disposable Income
Bookmaker FO 10 Government Revenue from Bookmaker and Other Fixed Odds
Bookmaker FO 11 Real Government Revenue from Bookmaker and Other Fixed Odds
Bookmaker FO 12 Per Capita Government Revenue from Bookmaker and Other Fixed Odds
Bookmaker FO 13
Real Per Capita Government Revenue from Bookmaker and Other Fixed Odds
Bookmaker FO 14
Bookmaker and Other Fixed Odds Revenue as a Percentage of Total State Gambling Revenue
Bookmaker and Other Pool Betting Bookmaker PB 1 Bookmaker and Other Pool Betting Turnover
Bookmaker PB 2 Real Bookmaker and Other Pool Betting Turnover
Bookmaker PB 3 Per Capita Bookmaker and Other Pool Betting Turnover
Bookmaker PB 4 Real Per Capita Bookmaker and Other Pool Betting Turnover
Bookmaker PB 5 Bookmaker and Other Pool Betting Expenditure
Bookmaker PB 6 Real Bookmaker and Other Pool Betting Expenditure
Bookmaker PB 7 Per Capita Bookmaker and Other Pool Betting Expenditure
Bookmaker PB 8 Real Per Capita Bookmaker and Other Pool Betting Expenditure
Bookmaker PB 9
Bookmaker and Other Pool Betting Expenditure as a Percentage of Household Disposable Income
Bookmaker PB 10 Government Revenue from Bookmaker and Other Pool Betting
Bookmaker PB 11 Real Government Revenue from Bookmaker and Other Pool Betting
Bookmaker PB 12 Per Capita Government Revenue from Bookmaker and Other Pool Betting
Bookmaker PB 13
Real Per Capita Government Revenue from Bookmaker and Other Pool Betting
Bookmaker PB 14
Bookmaker and Other Pool Betting Revenue as a Percentage of Total State Gambling Revenue
Sports Betting Sports Betting 1 Total Sports Betting Turnover
Sports Betting 2 Real Total Sports Betting Turnover
Sports Betting 3 Per Capita Total Sports Betting Turnover
Sports Betting 4 Real Per Capita Total Sports Betting Turnover
Sports Betting 5 Total Sports Betting Expenditure
Sports Betting 6 Real Total Sports Betting Expenditure
Sports Betting 7 Per Capita Total Sports Betting Expenditure
Sports Betting 8 Real Per Capita Total Sports Betting Expenditure
Sports Betting 9
Total Sports Betting Expenditure as a Percentage of Household Disposable Income
Sports Betting 10 Government Revenue from Total Sports Betting
Sports Betting 11 Real Government Revenue from Total Sports Betting
Sports Betting 12 Per Capita Government Revenue from Total Sports Betting
Sports Betting 13 Real Per Capita Government Revenue from Total Sports Betting
Sports Betting 14
Total Sports Betting Revenue as a Percentage of Total State Gambling Revenue
All Gambling All Gambling 1 Total Gambling Turnover
All Gambling 2 Real Total Gambling Turnover
All Gambling 3 Per Capita Total Gambling Turnover
All Gambling 4 Real Per Capita Total Gambling Turnover
All Gambling 5 Total Gambling Expenditure
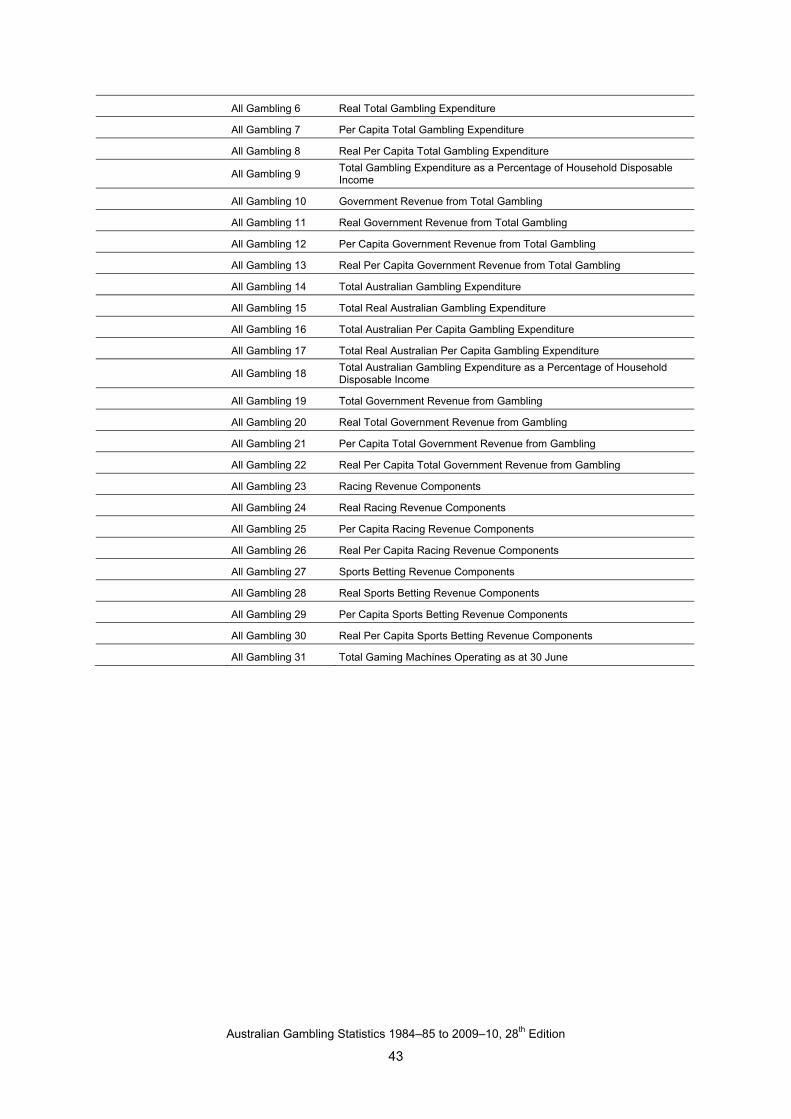
Australian Gambling Statistics 1984–85 to 2009–10, 28th Edition
43
All Gambling 6 Real Total Gambling Expenditure
All Gambling 7 Per Capita Total Gambling Expenditure
All Gambling 8 Real Per Capita Total Gambling Expenditure
All Gambling 9
Total Gambling Expenditure as a Percentage of Household Disposable Income
All Gambling 10 Government Revenue from Total Gambling
All Gambling 11 Real Government Revenue from Total Gambling
All Gambling 12 Per Capita Government Revenue from Total Gambling
All Gambling 13 Real Per Capita Government Revenue from Total Gambling
All Gambling 14 Total Australian Gambling Expenditure
All Gambling 15 Total Real Australian Gambling Expenditure
All Gambling 16 Total Australian Per Capita Gambling Expenditure
All Gambling 17 Total Real Australian Per Capita Gambling Expenditure
All Gambling 18
Total Australian Gambling Expenditure as a Percentage of Household Disposable Income
All Gambling 19 Total Government Revenue from Gambling
All Gambling 20 Real Total Government Revenue from Gambling
All Gambling 21 Per Capita Total Government Revenue from Gambling
All Gambling 22 Real Per Capita Total Government Revenue from Gambling
All Gambling 23 Racing Revenue Components
All Gambling 24 Real Racing Revenue Components
All Gambling 25 Per Capita Racing Revenue Components
All Gambling 26 Real Per Capita Racing Revenue Components
All Gambling 27 Sports Betting Revenue Components
All Gambling 28 Real Sports Betting Revenue Components
All Gambling 29 Per Capita Sports Betting Revenue Components
All Gambling 30 Real Per Capita Sports Betting Revenue Components
All Gambling 31 Total Gaming Machines Operating as at 30 June