Embed Size (px)
Citation preview

31 August 2018 The Manager ASX Market Announcements Australian Securities Exchange Exchange Centre Level 4 20 Bridge Street Sydney NSW 2000 Electronic Lodgement
Australian Foundation Investment Company Limited Statutory Annual Report, Annual Shareholder Review,
Notice of Meeting and Proxy Form Dear Sir / Madam Please find attached the 2018 Statutory Annual Report, Annual Shareholder Review, Notice of Meeting and Proxy Form being sent to shareholders. Yours faithfully
Matthew Rowe Company Secretary
For
per
sona
l use
onl
y

Annual Report 2018
90YEARS OF INVESTMENTEXPERIENCE
For
per
sona
l use
onl
y

2 Directors’ Report
2 5 Year Summary
3 About the Company
4 Review of Operations and Activities
10 Top 25 Investments
11 Board and Management
13 Remuneration Report
34 Non-audit Services
35 Auditor’s Independence Declaration
36 Financial Statements
37 Consolidated Income Statement
38 Consolidated Statement of Comprehensive Income
39 Consolidated Balance Sheet
40 Consolidated Statement of Changes in Equity
42 Consolidated Cash Flow Statement
43 Notes to the Financial Statements
43 A. Understanding AFIC’s Financial Performance
47 B. Costs, Tax and Risk
50 C. Unrecognised Items
51 Additional Information
51 D. Balance Sheet Reconciliations
53 E. Income Statement Reconciliations
54 F. Other Information
60 Directors’ Declaration
61 Independent Audit Report
66 Other Information
66 Information About Shareholders
67 Major Shareholders
68 Major Transactions in the Investment Portfolio
69 Sub-underwriting
69 Substantial Shareholders
70 Transactions in Securities
71 Holdings of Securities
74 Issues of Securities
76 Company Particulars
77 Shareholder Meetings
Contents
Australian Foundation Investment Company Limited ABN 56 004 147 120
For
per
sona
l use
onl
y

Australian Foundation Investment Company is a listed investment company investing in Australian and New Zealand equities.
This year marks the 90th anniversary of the establishment of AFIC in 1928.
Year in Summary
Profit for the Year
$279.0mUp 13.7% from 2017
Fully Franked Dividend
14¢ Final
Same as 2017
24¢Total
10.8%S&P/ASX 200 Accumulation Index +13.0%
Total Portfolio Return
Total Shareholder Return
10.3%Share price plus dividend
0.14%0.14% in 2017
Management Expense Ratio
Total Portfolio
$7.4bIncluding cash at 30 June$6.9 billion in 2017
1
Australian Foundation Investment Company Limited Annual Report 2018
For
per
sona
l use
onl
y

5 Year Summary
DIRECTORS’ REPORT
279.
020
18Net Profit After Tax ($ Million)
254.
320
14
293.
620
15
265.
820
16
245.
320
17
23.6
2018
Net Profit Per Share (Cents)
24.4
2014
27.2
2015
23.8
2016
21.3
2017
2420
18
Dividends Per Share (Cents)(b)
2220
14
2320
15
2420
16
2420
17
7,27
420
18
Investments at Market Value ($ Million)(a)
6,32
420
14
6,41
420
15
6,25
020
16
6,79
020
17
627.
020
18
Net Asset Backing Per Share(Cents)(c)
584.
520
14
585.
120
15
550.
420
16
589.
520
17
129,
948
2018
Number of Shareholders(30 June)
103,
188
2014
107,
622
2015
113,
482
2016
119,
463
2017
Notes
(a) Excludes cash.
(b) All dividends were fully franked. The LIC attributable gain attached to the dividend was: 2018: 2.86 cents, 2017: nil, 2016: 2.1 cents, 2015: 7.1 cents, 2014: nil.
(c) Net asset backing per share based on year-end data before the provision for the final dividend. The figures do not include a provision for capital gains tax that would apply if all securities held as non-current investments had been sold at balance date as Directors do not intend to dispose of the portfolio.
2
Australian Foundation Investment Company Limited Annual Report 2018
For
per
sona
l use
onl
y

About the Company
Australian Foundation Investment Company (AFIC) is a listed investment company investing in Australian and New Zealand equities.
Investment ObjectivesThe Company aims to provide shareholders with attractive investment returns through access to a growing stream of fully franked dividends and growth in capital invested.
The Company’s primary investment goals are:
• to pay dividends which, over time, grow faster than the rate of inflation; and
• to provide attractive total returns over the medium to long term.
Approach to InvestingThe investment philosophy is built on taking a medium to long-term view on companies in a diversified portfolio with an emphasis on identifying quality companies that are likely to sustainably grow their earnings and dividends over this time frame.
Quality in this context is an outcome of our assessment of the board and management as well as some key financial metrics such as the level of gearing in the balance sheet, product margins and free cash flow. The structure of the industry and a company’s competitive position in this industry is also an important indicator of quality. Linked to this assessment of quality is the ability of companies to grow earnings over time, which ultimately should produce good dividend growth.
Recognising value is also an important aspect of sound long-term investing. Short-term measures such as the price earnings ratio, price to book or price to sales may be of some value, but aren’t necessarily strong predictors of future performance. Our assessment of value tries to capture the opportunity a business has to prosper and thrive over the medium to long term.
In building the investment portfolio in this way, we believe we can offer investors a well-diversified portfolio of high-quality companies that is intended to deliver total returns ahead of the Australian equity market and with less volatility over the long term.
The Company also uses options written against a small proportion of its investments and a small trading portfolio to generate additional income.
From time to time, some borrowings may be used where potential investment returns justify the use of debt. This is managed within very conservative limits, as determined by the Board.
AFIC is managed for the benefit of its shareholders with fees based on the recovery of costs rather than as a fixed percentage of the portfolio. There are no performance fees. As a result, the benefit of scale over time results in a very low expense ratio for investors. For the 12 months to 30 June 2018 this was 0.14 per cent (annualised), or 14 cents for each $100 invested.
How AFIC Invests – What We Look For in Companies
Quality First
GrowthIncluding dividends
Value
A portfolio that is activelymanaged to achieve long-term
capital and dividend growth
3
Australian Foundation Investment Company Limited Annual Report 2018
For
per
sona
l use
onl
y

Profit and DividendProfit for the year to 30 June 2018 was $279.0 million, up 13.7 per cent from $245.3 million in the corresponding period last year. Investment income increased $31.5 million (up 11.6 per cent), due primarily to a lift in dividends across a range of companies, particularly resource companies, including participation in the Rio Tinto off-market buy-back. Finance costs were also down $8.1 million following the conversion or redemption of convertible notes in February 2017.
Earnings per share were 23.6 cents, up from 21.3 cents. The final dividend was maintained at 14 cents per share fully franked, bringing total dividends for the year to 24 cents per share fully franked, the same as last year. Two cents of the final dividend are sourced from taxable capital gains, on which the Company has paid or will pay tax. The amount of the pre tax attributable gain on this portion of the dividend, known as an ‘LIC capital gain’, is therefore 2.86 cents. This enables some shareholders to claim a tax deduction in their tax return.
Market and Portfolio PerformanceThe return of the market over the year was characterised by a pronounced divergence of performance across sectors and companies. Ongoing growth across global economies, in particular the United States and China, led to rising commodity prices, with the Australian Resources Index up 41 per cent over the 12-month period (represented by energy and materials in Figure 1). Within this growth, the small and mid cap resource sectors were up 49 per cent and 42 per cent respectively. However, during the same period the industrial sector was up only 8 per cent, whilst the banking sector fell just over 1 per cent.
Furthermore, in an environment where many large companies are facing subdued growth, there has been an increased flow of funds into the small and mid cap section of the market. This has pushed these sectors higher relative to the S&P/ASX 50, which represents larger companies in the market (Figure 2). This has also seen very strong share price performance in those small companies with the strongest growth expectations, primarily through a re-rating of valuations (Figure 3).
AFIC’s portfolio was up 10.8 per cent for the 12 months to 30 June 2018 compared with the S&P/ASX 200 Accumulation Index which increased 13.0 per cent. In the resources sector AFIC’s primary exposure is to companies with long-life assets and low-cost production such as BHP and Rio Tinto, rather than the more cyclical small and mid-sized companies.
The best performing companies in the AFIC portfolio outside the large resource companies were CSL, Wesfarmers, Macquarie Group, Oil Search and Woolworths.
The long-term performance of the portfolio, which is more in line with the Company’s investment timeframes, was 6.5 per cent per annum for the 10 years to 30 June 2018 versus the Index return of 6.4 per cent per annum. Including the full benefit of franking, these returns are 8.5 per cent per annum for AFIC and 8.0 per cent per annum for the Index. AFIC’s portfolio performance numbers (Figure 4 on page 6) are after costs and tax paid whereas the Index does not have expenses or tax.
Review of Operations and Activities
Figure 2: Performance of Different Sectors of the Market by Company Size
S&P/ASX 50total return
S&P/ASX Mid Cap 50total return
S&P/ASX 200 Small Ordinaries total return
Source: FactSet
130
125
120
115
110
105
100
95
90
Inde
x
May 18
Apr 18
Mar 18
Feb 18
Jan 1
8
Dec 17
Jun 1
8
Nov 17
Oct 17
Sep 17
Aug 17
Jul 1
7
Jun 1
7
Figure 1: Performance of S&P/ASX 200 Companies Relative to the Energy and Materials Sectors
S&P/ASX 200 total return index
S&P/ASX 200 materials total return index
S&P/ASX 200 energy total return index
Source: FactSet
150
140
130
120
110
100
90
Inde
x
May 18
Apr 18
Mar 18
Feb 18
Jan 1
8
Dec 17
Jun 1
8
Nov 17
Oct 17
Sep 17
Aug 17
Jul 1
7
Jun 1
7
4
Australian Foundation Investment Company Limited Annual Report 2018
For
per
sona
l use
onl
y

Australian Resources Index Up
41%
Figure 5 on page 6 illustrates the cumulative long term performance of the AFIC portfolio versus the S&P/ASX 200 Accumulation Index over the 10 years to 30 June 2018. It also includes the benefits of franking credits for both.
The share price return was trading at a slight discount to the net asset backing (before tax on unrealised gains) at the end of June (Figure 6 on page 7) and is the reason the Dividend Reinvestment Plan did not have any discount associated with it.
Nevertheless, the share price return, including reinvestment of dividends, over the 12 months to 30 June 2108 was 10.3 per cent. Whilst the share price can often fluctuate between a premium and discount, over the long term the share price return is often very close to the portfolio return (Figure 4).
Figure 3: Price Earnings Ratio of Small Industrial Sector of the Australian Market
Source: FactSet
19.5
19
18.5
18
17.5
17
16.5
16
Tim
es
May 18
Apr 18
Mar 18
Feb 18
Jan 1
8
Dec 17
Jun 1
8
Nov 17
Sep 17
Oct 17
Aug 17
Jul 1
7
5
Australian Foundation Investment Company Limited Annual Report 2018
For
per
sona
l use
onl
y

Review of Operations and Activities continued
Positioning the Portfolio for Long Term OpportunitiesA key restraint on the current Australian market is the prolonged, subdued growth outlook facing many large companies. This arises from their market positions with no further consolidation possible, increased competition and disruption, and greater regulatory intervention. AFIC has continued to adjust the portfolio to respond to this situation. Whilst larger companies continue to make up a significant proportion
of the portfolio, AFIC has been increasing its holdings in a number of mid-sized and small companies with good growth prospects. This has been done having regard to balancing the need to grow dividends as well as provide meaningful capital growth within the portfolio over the long term. Overall purchases in the investment portfolio for the year totalled $739.3 million with sales totalling $712.6 million, which is higher than last year.
Major purchases included adding to holdings in Macquarie Group, CSL, Sonic Healthcare, James Hardie Industries and Alumina, all of which have unique industry exposures in global markets, and Sydney Airport and Boral. Additions were also made to smaller companies, Reliance Worldwide and Reece, including participation in their respective capital raisings to fund offshore acquisitions, and Carsales.com. Unibail-Rodamco-Westfield (which acquired Westfield Corporation through a scrip bid), NEXTDC and Qantas were the more significant new additions to the portfolio.
NEXTDC, which is a data centre operator, is an example of the type of company that AFIC is looking to add to the portfolio. It has a unique position in an industry that is likely to grow in excess of nominal economic growth. It is leveraged to the growth in the demand for cloud computing services as many businesses seek to outsource these services to companies with carrier neutral data centres that have greater scale and efficiencies. Given the investment required and the competitive advantage afforded by ownership of key sites, barriers to entry for this industry are high. NEXTDC currently operates five data centres in Melbourne, Sydney, Perth, Canberra and Brisbane and is in the process of building some additional new data centres in Sydney, Melbourne and Brisbane.
Major sales included the complete disposal of Incitec Pivot, Coca-Cola Amatil and Japara Healthcare. Westfield Corporation and Tox Free Solutions were sold because of takeovers. Other major sales included a small reduction in the positions of QBE Insurance, AMP, Telstra and Treasury Wine Estates, all of which have been long term holdings in the portfolio, and Vicinity Centres.
AFIC had 91 holdings in the portfolio at 30 June 2018. Whilst the S&P/ASX 200 Index can provide a useful point of reference for investors, AFIC actively manages its investments. As a result, the portfolio will differ quite markedly from the Index. Figure 7 (page 8) highlights the profile of AFIC’s portfolio by the various sectors of the market at the end of the financial year and how it differs from the Index.
Net asset per share growth plus dividends
Share price growth plus dividends
3 year return 5 year return
6.5%
6.5%
6.4%
10 year return
S&P/ASX 200 Accumulation Index
9.0
%
6.8%
4.4%
1 year return
8.2%
6.7%
10.0
%
10.8
%
13.0
%
10.3
%
Figure 4: Relative Portfolio and Share Price Performance – Per Annum Returns to 30 June 2018
Note assumes an investor can take full advantage of the franking credits. This chart calculates the benefit of franking creditsat the time dividends are paid for both AFIC and the Index. In practice there is a timing difference between receipt of thedividend and the realisation of the franking benefit in the following tax year.
Jun 1
7
Jun 1
8
Jun 0
8
Jun 0
9
Jun 1
0
Jun 1
1
Jun 1
2
Jun 1
3
Jun 1
4
Jun 1
5
Jun 1
6
$2,500
$2,000
$1,500
$1,000
$500
$0
AFIC Portfolio S&P/ASX 200 Accumulation Index
Figure 5: Growth in Investment of $1,000 (Including Benefit of Franking) − 10 Years to 30 June 2018
6
Australian Foundation Investment Company Limited Annual Report 2018
For
per
sona
l use
onl
y

The most notable change is the position of banks in the portfolio, which has declined over recent years relative to the market weight. Whilst banks continue to supply a large part of the dividend income, the outlook for growth relative to recent years, in our view, has diminished as credit for housing slows and competitive and regulatory pressures become greater. In addition, AFIC traditionally has not been a large investor in Property Trusts given the observation that over the long term, industrial companies have tended to outperform Property Trusts and the distribution from these Trusts do not carry franking credits. The other major variation from the Index is in Consumer Discretionary, which includes gambling stocks.
A significant percentage of the AFIC portfolio, by value, remains exposed to the large companies in the Australian market. Nevertheless, there are a significant number of companies that sit outside of these, many of which we believe have the capacity to grow their business and dividends over time. This is outlined in Figure 8 (page 8), with 71 holdings outside of the S&P/ASX 20.
Going ForwardThe ongoing strength of the Australian market continues to create a challenging investment environment. In particular, the drive by investors towards companies
displaying good growth prospects is pushing share prices for these businesses very high. In this context, high valuation levels at a time when interest rates are starting to move from very low levels may create some uncertainty for markets and therefore could then provide appropriate investment opportunities.
In addition, the geo-political environment remains unpredictable, with issues such as trade, leading concerns. Markets at this point have largely overlooked any potential implications given economic fundamentals appear sound across most large developed markets. However, the key implication for Australia is the impact any significant change to global trade through imposition of trade tariffs and retaliatory measures has on China, and the influence this has on the ongoing demand for Australian exports, particularly resources.
For AFIC, it is a matter of being alert but patient, and when appropriate, making adjustments to the portfolio over time that make sense as a long-term investor in quality and growing companies.
Directorship Matters
As previously announced in September 2017 and detailed in the Company’s Half-Yearly Review, Ross Barker retired as Managing Director and Chief Executive
Officer (CEO) on 31 December 2017. Mark Freeman, who was previously the Chief Investment Officer of AFIC, became the Managing Director and CEO of AFIC on 1 January 2018.
The Board wishes to record its deep appreciation to Ross Barker for his 16 years of outstanding service as Managing Director and Chief Executive Officer and wish him well in his retirement. He has shown enduring leadership through this period and made a significant contribution to the growth in AFIC throughout his distinguished tenure at the Company. Mr Barker remains on the Board of AFIC as a Non-Executive Director.
Company PositionCapital Changes
The following changes occurred to the Company’ share capital during the year.
Under the Company’s Dividend Substitution Share Plan, 454,954 new shares were issued at nil cost in August 2017 and 342,843 new shares were issued at nil cost in February 2018.
Under the Company’s Dividend Reinvestment Plan, 5,447,400 new shares were issued at a price of $5.92 in August 2017 and 3,821,934 new shares were issued at a price of $6.11 in February 2018.
The Company’s buy-back facility remains open although no shares were bought back during the year.
The Company’s contributed equity, net of share issue costs, rose $55.5 million to $2.8 billion. At the close of the year the Company had 1,186 million shares on issue.
Dividends
Directors have declared a fully franked final dividend of 14 cents per share, the same as last year.
Figure 6: Share Price Premium/Discount to Net Asset Backing
Source: FactSet
Jun 1
8
Jun 0
8
Jun 1
0
Jun 1
2
Jun 1
4
Jun 1
6-10%
15%
0%
5%
10%
-5%
7
Australian Foundation Investment Company Limited Annual Report 2018
For
per
sona
l use
onl
y

Review of Operations and Activities continued
The dividends paid during the year ended 30 June 2018 were as follows:
$’000Final dividend for the year ended 30 June 2017 of 14 cents fully franked at 30 per cent paid 30 August 2017 161,955Interim dividend for the year ended 30 June 2018 of 10 cents per share fully franked at 30 per cent, paid 23 February 2018 116,099
278,054
Dividend Substitution Share Plan (DSSP)
The Company has in place a Dividend Substitution Share Plan.
This enables shareholders to elect to receive shares in the Company instead of dividends, forgoing any franking credit and LIC gains that would otherwise be attached to the dividend but deferring any tax due on the receipt of such shares (for Australian tax payers) until such time as the shareholding is sold. Shareholders will need to seek their own taxation advice in determining if this Plan is suitable for them.
Further details are available on the Company’s website or by request from the Company’s Share Registrar. Financial Condition
The Company’s primary source of funds consists of its shareholders’ funds. The Company also had agreements with Commonwealth Bank of Australia for loan facilities totalling $140 million (see Note D2). At various points during the year, some of these facilities were drawn down. The Board takes a prudent and conservative approach to the use of borrowed funds. Currently, when used, they are maintained within a limit of 10 per cent of total assets. As at 30 June 2018, the facilities are drawn by $100,000.
Listed Investment Company Capital Gains
Listed investment companies (LIC) which make capital gains on the sale of investments held for more than one year are able to attach to their dividends an LIC capital gains amount, which some shareholders are able to use to claim a tax deduction. This is called an ‘LIC capital
gain attributable part’. The purpose of this is to put shareholders in listed investment companies on a similar footing with holders of managed investment trusts with respect to capital gains tax on the sale of underlying investments.
Tax legislation sets out the definition of a ‘listed investment company’ which AFIC satisfies. Furthermore, from time to time the Company sells securities out of the investment portfolio held for more than one year which may result in capital gains being made and tax being paid. The Company
is therefore on occasion in a position to be able to make available to shareholders a LIC capital gain attributable part with our dividends.
In respect of this year’s final dividend of 14.0 cents per share for the year ended 30 June 2018, it carries with it a 2.86 cents per share LIC capital gain attributable part (2017: nil). The amount which shareholders may be able to claim as a tax deduction depends on their individual situation. Further details are provided in the dividend statements.
S&P/ASX 100 excluding 20 Leaders: 42 Holdings
Outside of S&P/ASX 200: 29 Holdings
S&P/ASX 20: 20 Holdings
61%28%
11%
Figure 8: AFIC Investment by Company Size – Percentage of the Portfolio by Value
AFIC portfolio weight S&P/ASX 200 Index weight
Banks
Materia
ls
Indus
trial
Health
care
Consum
er
Staples Ene
rgy
Other
Financ
ials
21.3% 18.6% 12.1% 10.9% 9.9% 9.0%
Cash
1.3%5.4%
Telec
om
Service
s
2.0%
Inform
ation
Tech
nology
3.9%
Propert
y
Trusts
1.7%
Utilitie
s
1.9%
Consu
mer
Discret
ionary
2.0%
25%
20%
15%
10%
5%
0%
Figure 7: AFIC Investment by Sector versus the S&P/ASX 200 Index as at 30 June 2018
8
Australian Foundation Investment Company Limited Annual Report 2018
For
per
sona
l use
onl
y

Likely Developments
The Company intends to continue its investment activities going forward as it has done since its inception in 1928. The results of these investment activities depend upon the performance of the companies and securities in which we invest. Their performance in turn depends on many economic factors. These include economic growth rates, inflation, interest rates, exchange rates and taxation levels. There are also industry and company-specific issues such as management competence, capital strength, industry economics and competitive behaviour. We do not believe it is possible or appropriate to make a prediction on the future course of markets or the performance of our investments. Accordingly, we do not provide a forecast of the likely results of our activities. However, the Company’s focus is on results over the medium to long term and its twin objectives are to grow dividends at a rate faster than inflation and to provide shareholders with attractive capital growth.
Significant Changes in the State of Affairs
Directors are not aware of any other significant changes in the operations of the Company, or the environment in which it operates, that will adversely affect the results in subsequent years.
Events Since Balance Date
The Directors are not aware of any matter or circumstance not otherwise disclosed in the financial statements or the Directors’ Report which has arisen since the end of the financial year that has affected or may affect the operations, or the results of those operations, or the state of affairs of the Company in subsequent financial years.
Environmental Regulations
The Company’s operations are such that they are not directly materially affected by environmental regulations.
Rounding of Amounts
The Company is of the kind referred to in the ASIC Corporations (Rounding in Financial/Directors’ Reports) Instrument 2016/191, relating to the ‘rounding off’ of amounts in the Financial Report. Amounts
in the Financial Report have been rounded off in accordance with that Instrument, to the nearest thousand dollars, or in certain cases, to the nearest dollar.
Corporate Governance Statement
The Company’s Corporate Governance Statement for the financial year ended 30 June 2018 will be found on the Company’s website at:
afi.com.au/Corporate-Governance.aspx
As an overseas listed issuer on the New Zealand Stock Exchange (NZX), the Company is generally deemed to comply with the NZX Listing Rules provided that the Company remains listed on the ASX, complies with the ASX Listing Rules and provides the NZX with all the information and notices that it provides to the ASX.
The ASX Governance Principles differ from the NZX’s corporate governance rules and the principles contained in the NZX Corporate Governance Code. More information about the corporate governance rules and principles of the ASX can be found at asx.com.au and, in respect of the NZX, at nzx.com
Industrial Sector Up
8%
AFIC has been increasing its holdings in a number of mid-sized and small companies with good growth prospects.“ “
9
Australian Foundation Investment Company Limited Annual Report 2018
For
per
sona
l use
onl
y

Top 25 InvestmentsAs at 30 June 2018
Includes investments held in both the investment and trading portfolios.
Valued at Closing Prices at 30 June 2018
Total Value $ Million
% of thePortfolio
1 Commonwealth Bank of Australia 575.7 7.92 BHP* 477.7 6.63 Westpac Banking Corporation 455.5 6.34 CSL* 372.6 5.15 Wesfarmers 331.8 4.66 Rio Tinto 288.4 4.07 National Australia Bank 256.1 3.58 Australia and New Zealand Banking Group 239.7 3.39 Transurban Group 237.3 3.310 Macquarie Group* 206.4 2.811 Amcor 180.5 2.512 Woolworths Group* 174.6 2.413 Oil Search 146.7 2.014 Woodside Petroleum 129.3 1.815 Telstra Corporation 115.3 1.616 Brambles 107.8 1.517 Sydney Airport* 107.3 1.518 AGL Energy 96.8 1.319 Treasury Wine Estates 94.9 1.320 James Hardie Industries 91.9 1.321 Computershare 85.9 1.222 Qube Holdings 84.3 1.223 Sonic Healthcare 82.0 1.124 Seek* 77.9 1.125 Ramsay Health Care 76.4 1.1Total 5,092.6
As a percentage of total portfolio value (excludes cash) 70.0%
* Indicates that options were outstanding against part of the holding.
10
Australian Foundation Investment Company Limited Annual Report 2018
For
per
sona
l use
onl
y

Directors Terrence A Campbell AO BCom (Melb). Chairman and Independent Non-Executive Director. Chairman of the Investment Committee and member of the Remuneration and Nomination Committees.
Mr Campbell has been a Director of the Company since September 1984, appointed Deputy Chairman in September 2008 and Chairman in October 2013. He is Chairman Emeritus Goldman Sachs Australia (formerly Goldman Sachs JBWere) and a former Advisory Director of Goldman Sachs. Mr Campbell was formerly Chairman and Chief Executive of Goldman Sachs JBWere. He is also Chairman of Mirrabooka Investments Limited and a former Director of Djerriwarrh Investments Limited and AMCIL Limited.
Mark Freeman BE, MBA, Grad Dip App Fin (Sec Inst), AMP (INSEAD). Managing Director. Member of the Investment Committee. Managing Director of the Company’s subsidiary, Australian Investment Company Services Limited (AICS).
Mr Freeman became Chief Executive Officer and Managing Director in January 2018 having been Chief Investment Officer since joining the Company in February 2007. Prior to this he was a Partner with Goldman Sachs JBWere where he spent 12 years advising the investment companies on their investment and dealing activities. He has a deep knowledge and experience of investments markets and the Company’s approaches, policies and processes. He is also Managing Director of Djerriwarrh Investments Limited, AMCIL Limited and Mirrabooka Investments Limited.
Ross E Barker BSc (Hons) (Melb), MBA (Melb), F Fin. Non-Executive Director. Member of the Investment Committee.
Mr Barker transitioned to a Non-Executive Director in January 2018 having been appointed Chief Executive Officer of the Company in February 2001 and Managing Director in October 2001 and prior to that an Alternate Director of the Company since April 1987. He is also Chairman of Melbourne Business School Ltd. He is a Non-Executive Director of AMCIL Limited and Mirrabooka Investments Limited.
Jacqueline C Hey B.Com (Melb), Grad Cert (Mgmt). GAICD. Independent Non-Executive Director. Member of the Investment Committee and Nomination Committee.
Ms Hey was appointed to the Board in July 2013. She is a Non-Executive Director of Qantas Limited, Bendigo and Adelaide Bank Limited, AGL, Melbourne Business School Ltd and Cricket Australia. She was formerly Managing Director of Ericsson United Kingdom and Ireland and Managing Director of Ericsson Australia and New Zealand.
Graeme R Liebelt B Ec (Hons), FAICD FTSE. Independent Non-Executive Director. Chairman of the Remuneration Committee. Mr Liebelt was appointed to the Board in June 2012. He is Chairman of Amcor Limited and DuluxGroup Limited, a Director of Australia and New Zealand Banking Group Limited, and a Director of Carey Baptist Grammar School. He is a Fellow of the Australian Academy of Technological Sciences and Engineering and a Fellow of the Australian Institute of Company Directors. He was formerly Managing Director and CEO of Orica Limited, Chairman and Director of the Global Foundation and Deputy Chairman of Melbourne Business School.
John Paterson BCom (Hons) (Melb), CPA, F Fin. Independent Non-Executive Director. Chairman of the Nomination Committee. Member of the Remuneration Committee, Investment Committee and Audit Committee. Chairman of the Company’s subsidiary, Australian Investment Company Services Limited.
Mr Paterson is a Company Director who was appointed to the Board in June 2005. He was a former Alternate Director of the Company for Mr Campbell from April 1987 to June 2005. He is Chairman of Djerriwarrh Investments Limited. He was formerly a Director of Goldman Sachs JBWere and is a former member of the Board of Guardians of Australia’s Future Fund.
David A Peever BEc MSC (Mineral Economics). Independent Non-Executive Director. Member of the Audit Committee.
Mr Peever was appointed to the Board in November 2013. He was Managing Director of Rio Tinto Australia from 2009 to 2014.
He is Chairman of Cricket Australia and Brisbane Airport Group Pty Ltd. Mr Peever is a member of the Foreign Investment Review Board. He chaired the Minister of Defence’s First Principles Review of Defence and following the acceptance of the review by Government now chairs the Oversight Board which helps guide implementation of the Review’s recommendations. David is also a Non-Executive Director of Naval Group Australia and Stars Foundation, a not for profit body which promotes education of Indigenous girls.
Catherine M Walter AM LLB (Hons), LLM, MBA (Melb), FAICD. Independent Non-Executive Director. Member of the Investment Committee, Remuneration Committee and the Audit Committee.
Mrs Walter is a solicitor and Company Director. She was appointed to the Board in August 2002. Mrs Walter is Chairman of Melbourne Genomics Health Alliance and the Financial Adviser Standards and Ethics Authority (FASEA). Mrs Walter is a Director of the RBA’s Payments System Board and a Trustee of the Helen Macpherson Smith Trust. She was formerly Chair of Federation Square Pty Ltd and Australian Synchrotron Company Ltd and a Director of ASX, National Australia Bank Ltd, Orica Ltd and Melbourne Business School.
Board and Management
11
Australian Foundation Investment Company Limited Annual Report 2018
For
per
sona
l use
onl
y
Board and Management continued
Peter J Williams Dip.All, MAICD, FAIM. Independent Non-Executive Director. Chairman of the Audit Committee. Member of the Investment Committee and Nomination Committee. Director of the Company’s subsidiary, Australian Investment Company Services Limited.
Mr Williams was appointed to the Board in February 2010. He is Chairman of Fiig Securities Limited – MIPS Advisory Committee. He is a Director of the NAB Trustees Services Limited (NAB Subsidiary), Cricket Victoria Ltd, Foundation for Young Australians Ltd, House with No Steps and an Advisory Board Member of TLC Aged Care Limited. Mr Williams was formerly Chairman of Olympic Park Sports Medical Centre Pty Ltd, Managing Director of Equity Trustees Limited, a Director of the Trustee Corporations Association of Australia, a Director of the Australian Baseball Federation Inc and a General Manager with AXA/National Mutual in Australia and Hong Kong.
Senior ExecutivesGeoffrey N Driver B Ec, Grad Dip Finance, MAICD. General Manager, Business Development and Investor Relations.
Mr Driver joined the Company in January 2003. Previously, he was with National Australia Bank Ltd for 18 years in various roles covering business strategy, marketing, distribution, investor relations and business operations. Mr Driver is Chairman of Trust for Nature (Victoria).
Andrew JB Porter MA (Hons) (St And), FCA, MAICD. Chief Financial Officer.
Mr Porter joined the Company in January 2005. He is a Chartered Accountant and has had over 20 years of experience in accounting and financial management both in the United Kingdom with Andersen Consulting and Credit Suisse First Boston and in Australia where he was Regional Chief Operating Officer for the Corporate and Investment Banking Division of CSFB. He is currently President of the G100, the peak body for CFOs and a Director of Melbourne Anglican Foundation and was formerly a Non-Executive Director of the Royal Victorian Eye and Ear Hospital.
Matthew Rowe BA (Hons), MSc Corp Gov, FGIA, FCIS. Company Secretary.
Mr Rowe joined the Company in July 2016. He is a Chartered Secretary with over 12 years of experience in corporate governance with a particular focus in listed investment companies. He was previously a corporate governance advisor at a professional services firm which included acting as Company Secretary for three ASX listed companies. Prior to that Matthew was the Company Secretarial Manager for a funds management company based in the United Kingdom.
Meetings of Directors The number of meetings of the Company’s Board of Directors and of each Board Committee held during the year ended 30 June 2018 and the numbers of meetings attended by each Director were:
Board InvestmentAudit
CommitteeRemuneration
CommitteeNomination Committee
Eligible to Attend Attended
Eligible to Attend Attended
Eligible to Attend Attended
Eligible to Attend Attended
Eligible to Attend Attended
TA Campbell 13 11 21 19 - 2* 2 2 1 1M Freeman̂ 6 6 10 9 - 2* - 2* - 1*RE Barker 13 12 21 18 - 2* - 2* - -JC Hey 13 13 21 19 - 1* - - 1 1GR Liebelt 13 13 - 15* - - 2 2 - -J Paterson 13 13 21 19 4 4 2 2 1 1DA Peever 13 13 - 16* 4 4 - - - -CM Walter 13 13 21 21 4 4 2 2 - -PJ Williams 13 13 21 21 4 4 - 1* 1 1
* Attended meetings by invitation.
^ M Freeman appointed Managing Director on 1 January 2018.
Insurance of Directors and Officers During the financial year, the Company paid insurance premiums to insure the Directors and Officers named in this report to the extent allowable by law. The terms of the insurance contract preclude disclosure of further details.
12
Australian Foundation Investment Company Limited Annual Report 2018
For
per
sona
l use
onl
y

ContentsThe Directors present AFIC’s 2018 Remuneration Report which outlines key aspects of our remuneration policy and remuneration awarded this year.
During the year our long-standing MD and CEO Ross Barker retired (he remains on the Board as a Non-Executive Director), to be replaced by Mark Freeman, the Chief Investment Officer. Mr Freeman remains as Chief Investment Officer. His remuneration for the year is 50 per cent as Chief Investment Officer, and 50 per cent as CEO, reflecting the fact that he started in this new role on 1 January 2018. Next year he will be remunerated purely as CEO, not as a member of the investment team.
Shareholders should be aware that AFIC does not bear the total cost of remuneration alone. Due to agreements that the Group’s subsidiary, Australian Investment Company Services Limited (AICS) also has with Djerriwarrh Investments Limited, Mirrabooka Investments Limited and AMCIL Limited, a substantial proportion of the total remuneration cost (usually 30 per cent to 40 per cent, depending on the individual), is borne by these other companies. AICS expenses the total amount and recovers the proportion borne by the investment companies through the fees that it charges. This report, therefore, shows the total expense that is borne by AICS and that an individual receives.
The report is structured as follows:
1. Remuneration Policy and Link to Performance
2. Structure of Remuneration
3. Executive Remuneration Expense
4. Contract Terms
5. Non-Executive Director Remuneration
AppendixA. Remuneration Governance
B. Annual Incentives: Details of Outcomes and Conditions
C. Long Term Incentives: Details of Outcomes and Conditions
D. Directors and Executives: Equity Holdings and Other Transactions
E. Detailed Performance Measures by Investment Company
1. Remuneration Policy and Link to Performance1.1 What is Our Remuneration Policy?
AFIC is an investor in securities listed primarily in Australia and New Zealand. Our primary objectives are to grow dividends at a faster rate than inflation and provide shareholders with capital growth over the medium to long term. To achieve this, we need to attract and retain professional, competent and highly motivated Executives and staff through offering attractive remuneration arrangements which:
• reflect market conditions;
• recognise the skills, experience, roles, and responsibilities of the individuals;
• align with shareholder interests; and
• align with the risk management strategies.
Generally, we seek to set total remuneration at the upper or second quartile of the sectors in which we operate.
Periodically, we review our remuneration policies and plans to ensure that they continue to meet these objectives, and such a review is currently underway.
Remuneration for the Group’s Executives has two main elements:
• fixed annual remuneration (FAR), and
• performance-related pay, being annual incentives and long term incentives (LTI).
FAR is determined with reference to levels necessary to recruit and retain staff with the relevant skills and experience in the industry in which the Group operates. We seek external input to ensure that the FAR meets these conditions. This includes industry data provided by the Financial Institutions Remuneration Group Inc. (FIRG) and McLagan for the financial services industry.
Remuneration Report
13
Australian Foundation Investment Company Limited Annual Report 2018
For
per
sona
l use
onl
y

Remuneration Report continued
Through performance-related pay, the remuneration is adjusted to reflect the risks that the Company and its shareholders face and how the Company has responded to those risks. In particular:
• the key performance indicators chosen to determine performance-related pay are those that the Company considers most relevant to its objectives of improving shareholder wealth over the medium to long term;
• the focus is on performance over the medium to long term with only a small proportion of both annual incentives and LTI being dependent on a single year’s performance; and
• Executives other than the Chief Investment Officer (CIO) agree to invest 50 per cent of the annual cash incentive (after tax) in AFIC shares and shares of the other investment companies (including AMCIL Limited, Djerriwarrh Investments Limited and Mirrabooka Investments Limited) and to hold these shares for a minimum of two years. The CIO and other members of the investment team are not required under any of the remuneration schemes to purchase shares in the investment companies, but are encouraged to do so.
The Remuneration Committee may, at its discretion, cancel any performance rights that are yet to vest or to be tested in the event of any negative issues that may arise, including material misstatement of the Company’s financial statements.
1.2 What is Our Target Remuneration Mix?
The target remuneration mix for Executives is as follows:
* Note: relevant for Ross Barker and for 50 per cent of Mark Freeman’s remuneration for the year ended 30 June 2018.
** Relevant for Mark Freeman for 2017 and for 50 per cent of his remuneration for the year ended 30 June 2018.
1.3 How is the Remuneration Paid in 2018 Linked to Performance?
Table 1 discloses the actual remuneration outcomes received by the Company’s Executives during the year and the LTI that may vest in future years. These amounts are different to the statutory remuneration expense disclosed in Table 7. The Board considers the information about remuneration outcomes in Table 1 relevant for users because the statutory remuneration expense includes accounting charges for long term incentives that may or may not be received in future years. See Table 1 on the following page for details of the differences.
Managing Director’s Target Remuneration Mix*
Annual incentive 29%
Long term incentive 14%
Fixed annual remuneration 57%
Other Executives’ Target Remuneration Mix
Annual incentive 21%
Long term incentive 10%
Fixed annual remuneration 69%
Investment Team’s Target Remuneration Mix**
Annual incentive 29%
Long term incentive 12%
Fixed annual remuneration 59%
14
Australian Foundation Investment Company Limited Annual Report 2018
For
per
sona
l use
onl
y

Table 1: Actual Executive Remuneration Outcomes
Total FAR
$Other
$
1Annual
Incentive $
Prior Years’ LTI
Received $
4
Dividends on Unvested
ELTIP Shares
$
Total Remuneration
$
5
Annual Incentive Forfeited
$
3LTI
Forfeited $
Possible Future LTI
(to Vest Over Next 4 Years)
$
6
Ross Barker – Managing Director (until 31 December 2017)2018 378,180 - 106,843 - - 485,023 (79,132) (227,181) 745,5432017 741,837 - 176,156 94,573 2,063 1,014,629 (195,794) (265,639) 806,039Mark Freeman – Chief Investment Officer until 31 December 2017, Managing Director from 1 January 20182018 841,000 - 225,765 12,320 - 1,079,085 (194,735) (147,680) 507,4562017 832,000 - 228,592 56,225 - 1,116,817 (187,408) (98,239) 501,920Andrew Porter – Chief Financial Officer2018 653,438 - 114,188 - - 767,626 (81,843) (114,839) 439,3622017 637,500 - 90,576 48,637 1,125 777,838 (100,674) (139,188) 412,578Geoff Driver – General Manager – Business Development and Investor Relations 2018 538,432 - 93,122 - - 631,554 (68,408) (91,746) 361,9642017 525,300 - 73,689 39,146 905 639,040 (83,901) (111,998) 337,019Matthew Rowe – Company Secretary2
2018 235,000 - 40,220 - - 275,220 (30,280) - 75,0532017 195,513 2,000 28,056 - - 225,569 (31,944) - 32,280
1. Other relates to a ‘sign-on’ charge in relation to incentives foregone by Matthew Rowe in joining AFIC.
2. Joined on 11 July 2016.
3. For Mark Freeman, the amount forfeited is the difference between the target amount that would have been paid if all targets were met and the amount paid, under the investment team LTI. The amount shown for the other Executives (excluding Mark Freeman and Matthew Rowe who was not eligible for an award under the 2012 and 2013 LTIP) is the amount that would have been paid to them with respect to the 2013 LTIP should all targets have been achieved (2017: 2012 LTIP). See Table 4.
The value of Annual Incentive forfeited is the difference between the target amount and the amount awarded. See Table 10.
The differences between the amounts disclosed in Table 1 and the amounts in Table 7 are as follows:
4. Prior year’s LTI received in Table 1 shows the value of performance shares that vested during the year, measured at the closing price on the day that they were received. In respect of the investment team, it shows the cash payment received during the year for the previous financial year. In contrast, Table 7 shows the accounting expense recognised in relation to the LTI plans during the year.
5. Total remuneration in Table 1 includes the amount of dividends paid to Executives in relation to unvested ELTIP shares during the 2017 year. There were none outstanding in 2018. For accounting purposes, the dividends are recognised as distributions in equity and not as an expense.
6. The future LTI in Table 1 reflects potential future remuneration that may be received by the Executives over the next four years if the performance conditions are satisfied. This includes the estimated amounts payable under the two LTIP plans assuming the performance conditions will be satisfied at the time of vesting. For accounting purposes, these amounts are recognised as expense over the vesting period.
Information about Non-Executive Director remuneration is provided in Section 5 Non-Executive Director Remuneration.
15
Australian Foundation Investment Company Limited Annual Report 2018
For
per
sona
l use
onl
y

Remuneration Report continued
1.3.1 Fixed Remuneration
Most Executives received modest inflationary increases in their fixed annual remuneration this year. AFIC continues to operate in a highly competitive market, and salary levels are reviewed at least annually with the aim of remunerating its Executives to the extent required to attract and retain Executives who are leaders in their field.
1.3.2 Performance-related Pay
This section shows:
• How Annual Incentive measurements are split between AFIC and the other investment companies:
Executives %
CIO% Result
AFIC investment performance 24.5 39.75 Table 3AFIC other metrics 28.5 - Table 2AFIC qualitative assessment - 13.25 n/aPercentage of annual incentive determined by AFIC performance 53 53Other LIC investment performance 12.5 16.67 Table 16Other LIC other metrics 14.5 - Table 16Other LIC qualitative assessment - 10.33 n/aPercentage of annual incentive determined by other LICs performance 27 27
Total percentage of annual incentive determined by AFIC/Other LIC performance 80 80Personal metrics 20 20 n/a
100 100
See Table 5 for more details on what the measures are.
• The outcomes for the two long term incentive awards (LTI) that were tested for vesting during the year (Table 4).
Refer to sections 2.2 and 2.3 for explanations of the measures used.
Share price performance underperformed the Index as the share price moved from a premium to a discount. However, the investment performance over the short to medium term was also below the benchmark. Only for the 10-year benchmark, which is the Company’s preferred timeline, were returns above the Index. It should be noted that AFIC’s returns are after taxes and expenses and represent the ‘net’ return to the shareholders, whereas Index returns do not include either. Furthermore, many returns quoted by managed funds exclude either tax or expenses, or both. The use of ‘gross returns’ mitigates the tax disparity to some extent, as it adds back franking credits to the nominal dividend that the Index pays, and also that AFIC pays.
The MER continues to be of importance to the Board, and this continues to be below the benchmark set. The increase in payouts by companies that AFIC invests in has also led to an increase in earnings per share, with that figure now almost completely covering the dividend.
With regard to the other investment companies, Djerriwarrh did not meet most of its shorter or medium-term benchmarks, although in the longer term (10 year) many, like AFIC, were exceeded. Mirrabooka’s short-term performance was affected by the strength in the small and mid-cap resources sector, a volatile market in which it does not materially invest, but the medium and longer term figures continue to out-perform. Some of AMCIL’s short-term metrics were above the Index as were most of its medium to short-term figures.
During the second half of the year two new senior portfolio managers have been employed by AICS.
The 2014 award under the Executive Long Term Incentive Plan was available for vesting as of 30 June 2018. However, the calculations needed to determine how much actually vests are not performed until after the date of the Annual Report. Therefore, the full amount that may vest is shown, and the actual settlement of the 2014 award will take place in the year ended 30 June 2019. The actual amount settled will be reported in the relevant year. The 2013 award was available for vesting but was forfeited in its entirety due to the hurdles not having been met. It is this forfeiture which is reflected in Table 1 above.
For the investment team whose LTIP encompasses all of the investment companies (unlike Executives, for which only the AFIC performance is counted) the recent short-term underperformance was reflected in the figures which are measured over four years for all of the investment companies. Consequently, all LTIP available under this metric as forfeited. Detailed information about the performance of each investment company is provided in Section E of the Appendix (Table 16).
16
Australian Foundation Investment Company Limited Annual Report 2018
For
per
sona
l use
onl
y

Table 2: Executive Team Performance (Excluding Investment Returns)
Performance MeasureBenchmark
ResultAFIC
ResultComparison to
BenchmarkTotal shareholder return (14.6 per cent)
Share price return – one year 13.0% 10.3% Unfavourable Share price return – three years 9.0% 4.4% Unfavourable Share price return – five years 10.0% 6.7% Unfavourable Share price return – eight years 9.4% 7.8% Unfavourable Share price return – ten years 6.4% 6.5% Favourable Growth in net operating result per share (8.3 per cent) 2.0% 9.6% Favourable Management expense ratio compared to base of 0.19 per cent (5.6 per cent) 0.19% 0.14% Favourable
Outcome
Achieved
Partially achieved
Not achieved
Table 3: Investment Team Performance (Including Investment Returns Used for Executives)
MeasureBenchmark
ResultAFIC
ResultComparison to
Benchmark
Investment return – one year 13.0% 11.3% Unfavourable Investment return – three years 9.0% 7.3% Unfavourable Investment return – five years 10.0% 8.7% Unfavourable Investment return – eight years 9.4% 9.2% Unfavourable Investment return – ten years 6.4% 7.0% Favourable Gross return – one year 14.6% 12.7% Unfavourable Gross return – three years 10.7% 8.7% Unfavourable Gross return – five years 11.6% 10.1% Unfavourable Gross return – eight years 11.1% 10.7% Unfavourable Gross return – ten years 8.0% 8.5% Favourable Reward to risk – three years 1st qtr 123rd/155 4th qtr Unfavourable Reward to risk – five years 1st qtr 115th/147 3rd qtr Unfavourable Reward to risk – eight years 1st qtr 76th/121 3rd qtr Unfavourable Reward to risk – ten years 1st qtr 43rd/104 2nd qtr Unfavourable
Outcome
Achieved
Partially achieved
Not achieved
17
Australian Foundation Investment Company Limited Annual Report 2018
For
per
sona
l use
onl
y

Remuneration Report continued
Table 4: Vesting and Forfeiture of Long Term Incentives During the Year*
Award DateAssessment
DatesMeasure
Tested 2017Benchmark
ResultAFIC
Result%
Vested %
ForfeitedELTIP – performance rights*1 July 2013 30 June 2017 Total gross shareholder return 10.6% 7.4% 0% 50%
Total portfolio return 9.2% 7.6% 0% 50%Investment team LTI1 July 2014 30 June 2018 Gross return 9.8% 7.9% 0% 100%
* Of the rights awarded on 1 July 2013, 100 per cent were forfeited as the targets were not achieved. Under the investment team LTI, all amounts are forfeited.
2. Structure of Remuneration2.1 Fixed Annual Remuneration (FAR)
The FAR component of an Executive’s remuneration comprises base salary, superannuation guarantee contributions and fringe benefits. Executives can elect to receive a portion of their FAR in form of additional superannuation contributions or fringe benefits. This will not affect the gross amount payable by the Group. Dividends received by the Executives in relation to unvested shares awarded under the old ELTIP are taken into account when setting remuneration levels.
2.2 Annual Incentive
There are two annual incentive plans, one for the Executives (excluding the CIO) and one for the investment team (including the CIO). As the roles and objectives of the Senior Executives and investment team are different, it is desirable to provide separate incentives to focus each team on the different business-critical measures they are able to impact. Table 5 below outlines the key terms and conditions.
Table 5: Annual Incentives – Key Terms and Conditions
Targeted % of FAR Managing Director50%
Other Executives30%
Investment Team50%
Objectives Align remuneration with the creation of shareholder wealth over the past year and over a longer period.
Measures reflect the management of the Group and the other investment companies, as well as the key investment returns that reflect the creation of shareholder wealth.
Align remuneration with the outcomes of the Group’s investment objectives over a period of between one and 10 years.
The key metrics are for portfolio performance, and also include dividends paid and franking credits, as well as actual portfolio return and the risk profile of the investments.
18
Australian Foundation Investment Company Limited Annual Report 2018
For
per
sona
l use
onl
y

Targeted % of FAR Managing Director50%
Other Executives30%
Investment Team50%
Performance measures • Company performance (43 per cent)
• Investment performance (37 per cent)
• Personal objectives (20 per cent)
• See Table 11 for details
See Table 12
Relative weightings of investment companies for investment related performance
AFIC: 53 per centDjerriwarrh Investments Limited: 16 per centAMCIL Limited: 4 per centMirrabooka Investments Limited: 7 per centPersonal objectives: 20 per cent
Delivery of award Incentive is paid in cash, but 50 per cent of the after-tax amount received is used by recipients to acquire shares in AFIC and the other investment companies, which they agree to hold for minimum of two years.
Paid in cash or shares or combination of both, at discretion of the Remuneration Committee.
Performance measured in 2018
Some longer-term measures achieved but shorter-term measures with the exception of the MER and profit per share were not (see Tables 2 and 3 above).
Some longer-term measures achieved but shorter-term measures were not (see Tables 2 and 3 above).
Outcomes for 2018 (see Table 10 for details)
57.5 per cent (Ross Barker)58.8 per cent (Mark Freeman)
Average 57.7 per cent 48.5 per cent (CIO)
The performance measures of each annual incentive plan are reviewed by the Remuneration Committee. The Committee may, from time to time, revise the performance conditions and weightings in order to better meet the objectives of the annual incentive policies. They may also change or suspend any part of the incentive payment arrangements. If relevant targets are not achieved but performance is close to the target, some of the incentive may be paid. This is noted as ‘partially achieved’ in Table 3. Where stretch levels of performance are achieved above target, then higher amounts may be paid. To date, total annual incentives paid to each Executive have never exceeded target.
For more detailed information about the Annual Incentive performance conditions and outcomes for 2018, please refer to Section B Annual Incentives: details of outcomes and conditions in the Appendix.
2.3 Long Term Incentive Plans (LTIP)
As for the annual incentives, there are also two LTI plans, one for the Executives (excluding the CIO) which is called the ELTIP, and one for the investment team (including the CIO). Table 6 outlines the purpose and the key terms and conditions of each plan.
Table 6: Long Term Incentives – Key Terms and Conditions
Executive ELTIP (Performance Rights) Investment Team LTI Plan
Target 50 per cent of targeted STI 20 per cent of FARObjectives Align remuneration with growth in shareholder wealth over a forward looking period of four years.
Reward outperformance. Performance measures See Table 15 in the Appendix for details. See Table 15 in the Appendix for details. Performance for awards tested in 2018 (Table 4)
July 2013: 0 per cent vested (see Table 4). July 2014: 0 per cent vested (see Table 4).
For more detailed information about the LTI plans and their performance conditions, including vesting schedules and outcomes for 2018, please refer to Section C Long Term Incentives: details of outcomes and conditions in the Appendix.
19
Australian Foundation Investment Company Limited Annual Report 2018
For
per
sona
l use
onl
y

Remuneration Report continued
3. Executive Remuneration Expense This section discloses the remuneration expense recognised under accounting standards for each Executive (Table 7). These amounts are different to the remuneration outcomes disclosed in Table 1 as noted in that table.
Table 7: Remuneration Expense
Short Term Short Term Short Term Post Employment Short Term Long-term Share-based PaymentsBase
Salary $
Non-cashBenefits1
$Other4
$Superannuation
$
Total Fixed Remuneration
$
Annual Incentives
$LTI Cash-settled
$
3Other Long-term
Payments $
3Total
Remuneration $
% Fixed/Performance
RelatedRoss Barker – Managing Director (until 31 December 2017)2018 359,450 6,230 - 12,500 378,180 106,843 (9,892) - 475,131 80%/20%2017 701,436 10,401 - 30,000 741,837 176,156 38,830 - 956,823 78%/22%Mark Freeman – Chief Investment Officer until 31 December 2017, Managing Director from 1 January 20182018 816,000 - - 25,000 841,000 225,765 21,025 (16,625) 1,071,165 79%/21%2017 807,000 - - 25,000 832,000 228,592 - 64,161 1,124,753 74%/26%Andrew Porter – Chief Financial Officer2018 628,438 - - 25,000 653,438 114,188 10,899 - 778,525 84%/16%2017 612,500 - - 25,000 637,500 90,576 19,386 - 747,462 85%/15%Geoff Driver – General Manager – Business Development and Investor Relations 2018 513,432 - - 25,000 538,432 93,122 11,839 - 643,393 84%/16%2017 495,300 - - 30,000 525,300 73,689 16,901 - 615,890 85%/15%Matthew Rowe – Company Secretary2
2018 214,612 - - 20,388 235,000 40,220 19,643 - 294,863 80%/20%2017 178,377 - 2,000 17,136 197,513 28,056 8,070 - 233,639 85%/15%
1. Non-cash benefits relate to the provision of a car parking space.
2. Joined effective 11 July 2016.
3. Includes amounts credited for non-vesting.
4. Other relates to ‘sign-on’ charge in relation to incentives foregone by Matthew Rowe in joining AFIC.
20
Australian Foundation Investment Company Limited Annual Report 2018
For
per
sona
l use
onl
y

3. Executive Remuneration Expense This section discloses the remuneration expense recognised under accounting standards for each Executive (Table 7). These amounts are different to the remuneration outcomes disclosed in Table 1 as noted in that table.
Table 7: Remuneration Expense
Short Term Short Term Short Term Post Employment Short Term Long-term Share-based PaymentsBase
Salary $
Non-cashBenefits1
$Other4
$Superannuation
$
Total Fixed Remuneration
$
Annual Incentives
$LTI Cash-settled
$
3Other Long-term
Payments $
3Total
Remuneration $
% Fixed/Performance
RelatedRoss Barker – Managing Director (until 31 December 2017)2018 359,450 6,230 - 12,500 378,180 106,843 (9,892) - 475,131 80%/20%2017 701,436 10,401 - 30,000 741,837 176,156 38,830 - 956,823 78%/22%Mark Freeman – Chief Investment Officer until 31 December 2017, Managing Director from 1 January 20182018 816,000 - - 25,000 841,000 225,765 21,025 (16,625) 1,071,165 79%/21%2017 807,000 - - 25,000 832,000 228,592 - 64,161 1,124,753 74%/26%Andrew Porter – Chief Financial Officer2018 628,438 - - 25,000 653,438 114,188 10,899 - 778,525 84%/16%2017 612,500 - - 25,000 637,500 90,576 19,386 - 747,462 85%/15%Geoff Driver – General Manager – Business Development and Investor Relations 2018 513,432 - - 25,000 538,432 93,122 11,839 - 643,393 84%/16%2017 495,300 - - 30,000 525,300 73,689 16,901 - 615,890 85%/15%Matthew Rowe – Company Secretary2
2018 214,612 - - 20,388 235,000 40,220 19,643 - 294,863 80%/20%2017 178,377 - 2,000 17,136 197,513 28,056 8,070 - 233,639 85%/15%
1. Non-cash benefits relate to the provision of a car parking space.
2. Joined effective 11 July 2016.
3. Includes amounts credited for non-vesting.
4. Other relates to ‘sign-on’ charge in relation to incentives foregone by Matthew Rowe in joining AFIC.
21
Australian Foundation Investment Company Limited Annual Report 2018
For
per
sona
l use
onl
y
Remuneration Report continued
4. Contract TermsEach Executive is employed under an open-ended contract, the terms of which can be varied by mutual agreement. There is no provision for cessation of employment. Either the Company or the Executive can give notice in accordance with statutory requirements (typically four weeks’ notice; this can be altered at the Board’s discretion but in no case to be more than 12 months). There are no specific payments to be made as a consequence of termination beyond those required by statute. Should there be any payments, these will be at the Board’s discretion.
Material breaches of the terms of employment will normally result in the termination of an Executive’s employment.
5. Non-Executive Director RemunerationShareholders approve the maximum aggregate amount of remuneration per year available to be allocated between Non-Executive Directors (NEDs) as they see fit. In proposing the amount for consideration by shareholders, the Remuneration Committee takes into account the time demands made on Directors together with such factors as the general level of fees paid to Australian corporate directors.
For NEDs charged with the responsibility of oversight of the Company’s activities, a fixed annual fee is paid with no element of performance-related pay.
The amount approved at the AGM in October 2007 was $1,000,000 per annum, which is the maximum amount that may be paid in total to all NEDs. Retirement allowances for Directors were frozen at 30 June 2004.
NEDs do not receive any performance-based remuneration. On appointment, the Company enters into a deed of access and indemnity with each NED. There are no termination payments due at the cessation of office, and any Director may retire or resign from the Board, or be removed by a resolution of shareholders.
The amounts paid to each NED, and the figures for the corresponding period, are set out in Table 8.
22
Australian Foundation Investment Company Limited Annual Report 2018
For
per
sona
l use
onl
y

Table 8: Non-Executive Director Remuneration
Primary (Fee/Base Salary)
$
Post Employment (Superannuation)
$
Total Remuneration
$TA Campbell AO – Chairman 2018 168,950 16,050 185,0002017 164,384 15,616 180,000RE Barker – Non-Executive Director (Non-Executive from 1 January 2018)2018 43,379 4,121 47,5002017 - - -JC Hey – Non-Executive Director 2018 84,475 8,025 92,5002017 82,192 7,808 90,000GR Liebelt – Non-Executive Director2018 84,475 8,025 92,5002017 82,192 7,808 90,000J Paterson – Non-Executive Director2018 84,475 8,025 92,5002017 82,192 7,808 90,000DA Peever – Non-Executive Director 2018 84,475 8,025 92,5002017 82,192 7,808 90,000CM Walter AM – Non-Executive Director2018 84,475 8,025 92,5002017 82,192 7,808 90,000PJ Williams – Non-Executive Director2018 84,475 8,025 92,5002017 82,192 7,808 90,000Total Remuneration of Non-Executive Directors2018 719,179 68,321 787,5002017 657,536 62,464 720,000
Amounts Payable on Retirement
The amounts payable to the current NEDs who were in office at 30 June 2004, which will be paid when they retire, are set out in Table 9. These amounts were expensed in prior years as the retirement allowances accrued.
Table 9: Non-Executive Director Retirement Allowance
Amount Payable on Retirement $
TA Campbell AO 114,500CM Walter AM 42,385Total 156,885
23
Australian Foundation Investment Company Limited Annual Report 2018
For
per
sona
l use
onl
y

Remuneration Report continued
AppendixA. Remuneration Governance Responsibilities of the Board and the Remuneration Committee
It is the Board’s responsibility to review and approve the recommendations of the Remuneration Committee.
For more information, the Charter of the Board is available on the Company’s website.
The Remuneration Committee’s primary responsibilities include:
• reviewing the level of fees for NEDs and the Chairman;
• reviewing the Managing Director’s remuneration arrangements;
• evaluating the Managing Director’s performance;
• reviewing the remuneration arrangements for other Senior Executives;
• monitoring legislative developments with regards to Executive remuneration; and
• monitoring the Group’s compliance with requirements in this area.
For more information, the Charter of the Remuneration Committee is available on the Company’s website.
The Remuneration Committee is composed of four NEDs (GR Liebelt (Chairman), TA Campbell AO, J Paterson and CM Walter AM) and meets at least twice per year.
Policy on Hedging
The Company provides no lending or leveraging arrangements to its Executives, who are prohibited by Company policy from entering into hedging arrangements that mitigate the possibility that ‘at risk’ incentive payments may not vest.
Use of Remuneration Consultants
The Remuneration Committee has appointed Ernst & Young to provide it with advice about Executive Remuneration. The Remuneration Committee uses Ernst & Young from time to time, as it sees fit, to independently test management’s recommendations.
Specifically, Ernst & Young would provide advice on:
(a) proposed remuneration levels and remuneration structure for the Managing Director;
(b) proposed remuneration levels and remuneration structure for the Managing Director’s direct reports; and
(c) proposed remuneration levels of NEDs.
During the year, the Remuneration Committee engaged Ernst & Young to provide advice on the remuneration levels of Non-Executive Directors. Ernst & Young received $13,030 (including GST) for this report.
The Board is satisfied that these arrangements seek to ensure that any remuneration recommendations made by remuneration consultants are free from influence by management.
24
Australian Foundation Investment Company Limited Annual Report 2018
For
per
sona
l use
onl
y

The use of the remuneration advisers by management is limited to specific areas to seek to ensure that the independent advice that the Remuneration Committee receives is not perceived as having been compromised by management.
Ernst & Young are separately engaged by management to report on the following:
(a) trends in remuneration for the sectors in which the Group operates (provision of market practice data);
(b) the relative positioning of the remuneration of the Group’s employees (including Executives) within those sectors;
(c) proposed remuneration levels for employees other than designated Senior Executives; and
(d) advice on the operation of the incentive plans (e.g., tax and accounting advice).
The Managing Director then makes recommendations to the Remuneration Committee with regards to the remuneration levels and structure of the KMP.
Ernst & Young also reviews the calculations used in determining the vesting of awards and certifies them as being correct and in accordance with the terms and conditions of the ELTIP.
Ernst & Young were paid $0 during the year ended 30 June 2018 for other general remuneration advice including confirmation of vesting calculations (2017: $3,965) and during the year the Group also paid $245,723 for other professional advice received, which included acting as the internal auditor for AICS and general taxation and accountancy advice (2017: $115,880)(all including GST).
Ernst & Young were remunerated on an invoiced basis, based on work performed.
The Company also participates in the annual McLagan and FIRG surveys of fund managers to understand current remuneration levels and practices.
B. Annual Incentives: Details of Outcomes and Conditions
Table 10 below shows the annual incentives paid to individual Executives as a result of AFIC’s and the other investment companies’ performance on financial metrics and the individual’s achievement of their own personal objectives. Tables 11 and 12 set out the detailed terms and conditions of the annual incentives. For a high-level summary see Section 2.2 and Table 5 of the main part of the Remuneration Report.
Table 10: Annual Incentive Outcomes
Executive Percentage of Target Paid $ Paid Percentage of Target Forfeited $ ForfeitedRoss Barker 57.4% $106,843 42.6% $79,132Mark Freeman 53.7% $225,765 46.3% $194,735Andrew Porter 58.2% $114,188 41.8% $81,843Geoff Driver 57.7% $93,122 42.3% $68,408Matthew Rowe 57.1% $40,220 42.9% $30,280
25
Australian Foundation Investment Company Limited Annual Report 2018
For
per
sona
l use
onl
y
Remuneration Report continued
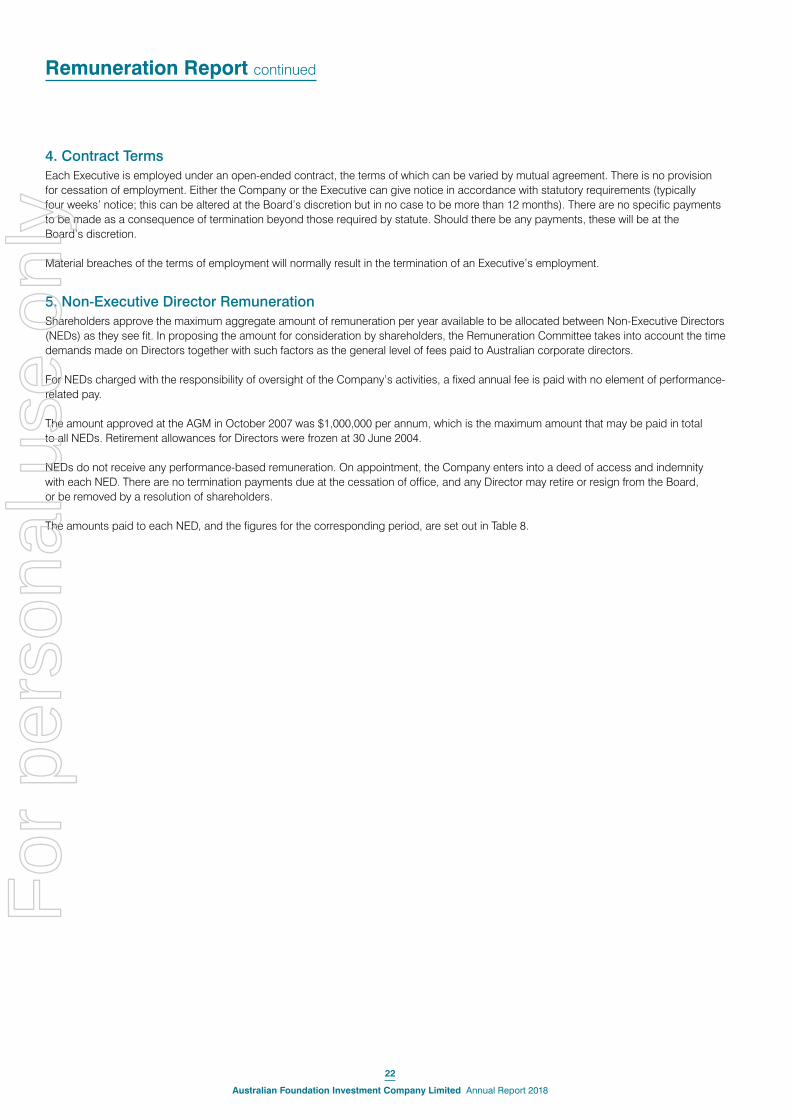
Table 11: Executive Annual Incentive Performance Conditions
Performance Areas and Relative Weighting Performance Measures Objectives These Measures Aim to Achieve
Company performance (43 per cent)The relevant weightings of the investment companies are:
• AFIC: 66.25 per cent
• Djerriwarrh Investments Limited: 20 per cent
• AMCIL Limited: 5 per cent
• Mirrabooka Investments Limited: 8.75 per cent
• Relative total shareholder return (TSR): TSR is the movement in share price plus the dividends paid by the Company assumed to be reinvested. TSR performance is measured against the S&P/ASX 200 Accumulation Index over 1, 3, 5, 8 and 10-year periods (Combined Mid Cap 50 and Small Ordinaries for Mirrabooka).
• TSR: This is a direct measure of the increase in shareholder’s wealth against the performance of the Index.
• Growth in net profit per share: measured against CPI.
• Growth in net profit per share reflects the ability of the Company to meet its stated aim of ‘paying out dividends which, over time, grow faster than the rate of inflation’.
• Management expense ratio (MER): measured against prior years’ results or, in the case of AFIC, measured against a base of 0.19 per cent.
• MER reflects the costs of running the Company.
Investment performance (37 per cent) The NEDs consider that the metrics used equate, over the medium to long term, with the stated objectives of the Company, namely ‘to provide attractive total returns and pay dividends, which, over time, grow faster than the rate of inflation’.
The relevant weightings of the investment companies are:
• AFIC: 66.25 per cent
• Djerriwarrh Investments Limited: 20 per cent
• AMCIL Limited: 5 per cent
• Mirrabooka Investments Limited: 8.75 per cent
• Relative investment return: measure of the return on the portfolio invested (including cash) over the previous 1, 3, 5, 8 and 10 years, relative to the S&P/ASX 200 Accumulation Index (Combined Mid Cap 50 and Small Ordinaries for Mirrabooka).
• Investment return: reflects the returns generated by the mix of the investments that the Company has invested in. These reflect the value added to shareholders wealth by the investment decisions of the Company.
• Gross return (GR): measure of the movement in the net asset backing of the Company (per share) plus the dividends assumed to be reinvested grossed up for franking credits over the previous 1, 3, 5, 8 and 10 years. This return is compared to the S&P/ASX 200 Accumulation Index grossed up for franking credits (Combined Mid Cap 50 and Small Ordinaries for Mirrabooka).
• Gross return (GR): reflects the movement in the value of the underlying portfolio over the period with the additional recognition of the importance of franking credits.
• Risk/reward return: This is a measure over 3, 5, 8 and 10 years of the past performance of the Company, compared to the performance of the Company’s peers (i.e. investment funds) as reported by Mercer. (Note: this measure is used for AFIC’s performance only, reflecting that Company’s focus on producing stable returns over the medium to long term).
• Risk/reward return: best reflects the return of the portfolio against the risks to shareholders of investing in the companies selected.
Note: The Remuneration Committee has discretion to determine, at the time of the review, what it considers to be the appropriate level of return to be used.
26
Australian Foundation Investment Company Limited Annual Report 2018
For
per
sona
l use
onl
y

Performance Areas and Relative Weighting Performance Measures Objectives These Measures Aim to Achieve
Personal objectives (20 per cent) Includes:
• advice to the Board;
• succession planning;
• management of staff;
• risk management;
• promotion of the corporate culture; and
• satisfaction of key internal stakeholders.
These measures all contribute to the efficient running of the Group, and the other investment companies, enhancing investment outcomes.
Personal objectives are included in incentive calculations to encourage outperformance on non-financial metrics. These metrics can be important determinants of business success in the medium term. The Managing Director reviews the performance of each Executive with the Remuneration Committee, and the Remuneration Committee alone determines how the Managing Director is performing against these objectives.
Table 12: Investment Team Annual Incentive Performance Conditions
Performance Areas and Relative Weighting Performance Measures Objectives These Measures Aim to AchieveInvestment returnThe relevant weightings of the investment companies are:
• AFIC: 66.25 per cent
• Djerriwarrh Investments Limited: 20 per cent
• AMCIL Limited: 5 per cent
• Mirrabooka Investments Limited: 8.75 per cent
• Measure of the return on the portfolio invested (including cash) over the previous 1, 3, 5, 8 and 10 years. Measured relative to the S&P/ASX 200 Accumulation Index (Combined Mid Cap 50 and Small Ordinaries for Mirrabooka).
• Investment return reflects the returns generated by the mix of the investments that the Company has invested in. These reflect the value added to shareholders’ wealth by the investment decisions of the Company.
Gross returnThe relevant weightings of the investment companies are:
• AFIC: 66.25 per cent
• Djerriwarrh Investments Limited: 20 per cent
• AMCIL Limited: 5 per cent
• Mirrabooka Investments Limited: 8.75 per cent
• Measure of the movement in the net asset backing of the Company (per share) plus the dividends assumed to be reinvested grossed up for franking credits over the previous 1, 3, 5, 8 and 10 years. This return is compared to the S&P/ASX 200 Accumulation Index grossed up for franking credits (Combined Mid Cap 50 and Small Ordinaries for Mirrabooka).
• Gross return reflects the movement in the value of the underlying portfolio over the period with the additional recognition of the importance of franking credits.
Risk/reward return
Note: this measure is used for AFIC’s performance only.
• This is a measure over the previous 3, 5, 8 and 10 years of Company performance. It is calculated by using the movement in the net asset backing of the Company (per share) plus the dividends reinvested divided by the standard deviation of the movement in the net asset backing of the Company (per share) plus the dividends reinvested over the same period.
This is compared to the performance of the Company’s peers (i.e. investment funds) as reported by Mercer.
• Risk/reward return best reflects the return of the portfolio against the risks to shareholders of investing in the companies selected, therefore aligning Executives to shareholders.
Reflects AFIC’s focus on producing stable returns over the medium to long term.
Note: The Remuneration Committee has discretion to determine, at the time of the review, what it considers to be the appropriate level of return to be used.
Income generation • This is relevant for measuring Djerriwarrh Investments Limited’s operating earnings as a percentage of the average investable assets. It is a one-year measure only, and measures the ability of the investment team to generate returns from the assets of Djerriwarrh Investments Limited. It is compared to the return generated in prior years.
• Reflects the objective for Djerriwarrh Investments Limited to create an enhanced income from its portfolio.
27
Australian Foundation Investment Company Limited Annual Report 2018
For
per
sona
l use
onl
y

Remuneration Report continued
Performance Areas and Relative Weighting Performance Measures Objectives These Measures Aim to Achieve
Qualitative measures • Investment process – including the identification of quality stocks.
• Diversifying the portfolio – for example, developing a ‘nursery’ of smaller, potential growth stocks.
• These qualitative processes provide the opportunities for the future growth of the Company’s investments.
Personal objectives • Includes research, stock ideas, portfolio management, meeting participation, interaction with staff and presentation skills.
Personal objectives are included in incentive calculations to encourage outperformance on non-financial metrics. These metrics can be important determinants of business success in the medium term. The Managing Director reviews the performance of each member of the investment team with the Remuneration Committee.
C. Long Term Incentives: Details of Outcomes and Conditions
This section shows the outstanding cash bonuses under the new ELTIP and the investment team LTI schemes (Table 13). It also explains the detailed terms and conditions of the two LTIs that are currently in operation (Table 14). For a high-level overview see Section 2.3 of the main body of the Remuneration Report.
Table 13: Vesting of ELTIP and Investment Team LTI
ELTIP Award Date
Vesting Date Subject to
Performance Hurdles
Value at Award Date
$
Number of Rights Awarded
Value Per Right
$
Award Vested for the Year Number of
Rights/%
Value Yet to Vest 30 June 2018
$Ross Barker – Managing Director (until 31 December 2017)1 July 2013 30 June 2017 $182,000 33,562 $5.423 0/0% -1 July 2014 30 June 2018 $178,750 29,707 $6.017 - $214,7991 July 2015 30 June 2019 $182,325 29,459 $6.189 - $205,2691 July 2016 30 June 2020 $185,975 33,205 $5.601 - $221,9241 July 2017 30 June 2021 $92,888 16,153 $5.757 - $103,551Mark Freeman – Managing Director (from 1 January 2018)1 January 2018 30 June 2021 $85,000 14,765 $5.757 - $94,656
28
Australian Foundation Investment Company Limited Annual Report 2018
For
per
sona
l use
onl
y

ELTIP Award Date
Vesting Date Subject to
Performance Hurdles
Value at Award Date
$
Number of Rights Awarded
Value Per Right
$
Award Vested for the Year Number of
Rights/%
Value Yet to Vest 30 June 2018
$Andrew Porter – Chief Financial Officer1 July 2013 30 June 2017 $92,000 16,965 $5.423 0/0% -1 July 2014 30 June 2018 $92,000 15,290 $6.017 - $110,5541 July 2015 30 June 2019 $93,750 15,148 $6.189 - $105,5481 July 2016 30 June 2020 $95,625 17,074 $5.601 - $114,1091 July 2017 30 June 2021 $98,016 17,026 $5.757 - $109,151Geoff Driver – General Manager – Business Development and Investor Relations 1 July 2013 30 June 2017 $73,500 13,554 $5.423 0/0% -1 July 2014 30 June 2018 $75,750 12,589 $6.017 - $91,0271 July 2015 30 June 2019 $77,250 12,482 $6.189 - $86,9711 July 2016 30 June 2020 $78,795 14,069 $5.601 - $94,0261 July 2017 30 June 2021 $80,765 14,030 $5.757 - $89,940Matthew Rowe – Company Secretary (joined 11 July 2016)11 July 2016 30 June 2020 $30,000 5,356 $5.601 - $35,7991 July 2017 30 June 2021 $35,250 6,123 $5.757 - $39,254
Investment Team LTI Award Date
Vesting Date Subject to
Performance Hurdles
Target Amount
$
Value Yet to Vest 30 June 2018
$$ %
Mark Freeman – Chief Investment Officer (investment team LTI) – Until 31 December 20171 July 2014 30 June 2018 $160,000 0 0% -1 July 2015 30 June 2019 $163,200 - - $163,2001 July 2016 30 June 2020 $166,400 - - $166,4001 July 2017 30 June 2021 $83,200 - - $83,200
See Table 1 for actual amounts vested and Table 4 for details of vesting calculations.
Award Vested for the Year
29
Australian Foundation Investment Company Limited Annual Report 2018
For
per
sona
l use
onl
y

Remuneration Report continued
The value of the outstanding ELTIP performance rights as in the table above was estimated at 30 June 2018 using the Total Share Return (TSR – which includes dividends reinvested) based on a closing price on 29 June 2018 of AFI shares of $6.16 (the TSR for AFI at 30 June 2018 was 4.0 per cent p.a. for four years, 4.4 per cent p.a. for three years, 9.1 per cent for two years and 10.3 per cent for one year). The value of the investment team LTI that is yet to vest is the target amount. Actual amounts awarded may exceed this amount, depending on performance over the four-year vesting period.
During the year ended 30 June 2018, Mark Freeman received $12,320 in respect of the four years ended 30 June 2017, which was 7.7 per cent of the target amount of $160,000. The benchmark annualised return for the period was 10.9 per cent whilst AFIC’s return was 9.4 per cent. As noted last year, Mirrabooka’s performance was such that although AFIC narrowly under-performed, a proportion of the award still vested. No vesting of LTIP will be made in the year ended 30 June 2019.
Table 14 – Long Term Incentive Plans
ELTIP (Performance Rights)
Nature of grant Rights to receive cash that must then be used by the Executives to acquire AFIC shares on market. Performance conditions 1. Total gross shareholder return (50 per cent): the movement in the AFIC share price and the Index
price, grossed up to reflect the value of franking credits. This is compared to that of the market such that only outperformance is rewarded. Outperformance of this Index over time should be an indicator of the value added by the Company to shareholders’ wealth. Both the Company’s return and the Index return are smoothed over 30 days to remove excess volatility.
2. Total portfolio return (50 per cent): the movement in the net asset backing of the Company (per share) plus the dividends paid by the Company reinvested. This compares AFIC’s investment performance against that of other fund managers (based on the Mercer Investment Consulting Survey of Australian Retail Fund Managers which provides the industry benchmark of funds management performance over the relevant period), so that only outperformance relative to its peers is rewarded.
Vesting schedule: total gross shareholder return
Company Performance Relative to Gross Accumulation Index
Percentage of rights vesting
Underperformance 0 per cent< or = 20 per cent outperformance Straight line between 25 per cent and 50 per cent> 20 per cent outperformance 50 per cent
Vesting schedule: total portfolio return
Company performance Percentage of rights vestingLess than median performance 0 per centMedian to < or = 75th percentile Straight line between 25 per cent and 50 per cent> 75 per cent percentile 50 per cent
Valuation of performance rights At 1 July each year, the 30-day volume weighted average price of AFIC shares up to, but not including 1 July will be calculated. The amount of ELTIP available will then be divided by this average price to determine the number of performance rights that may vest in four years’ time.
The value of the performance rights will be adjusted each year by the total shareholder return for the year, calculated based on the 30-day volume weighted average price of AFIC shares up to 1 July. At vesting time, the value of the performance rights that will vest is converted to cash, based on the value of the rights at that time.
Accounting treatment Under current accounting standards, the ELTIP scheme is classified as a cash-settled scheme. The expected amount payable upon vesting must therefore be estimated each year and adjusted not only for the likelihood of vesting, but also for changes in the value of the performance rights. In the first year, 25 per cent of the expected amount payable will be booked as an expense. At the end of the second year, 50 per cent of the new expected final value less the amount booked in the previous year will be booked. At the end of the third year, 75 per cent of the total, estimated final value less amounts previously expensed will be booked. At the end of the fourth year, the actual liability will be calculated and a balancing adjustment made.
30
Australian Foundation Investment Company Limited Annual Report 2018
For
per
sona
l use
onl
y

Investment Team LTI Plan
Nature of grant Cash or shares, at discretion of the Company. Performance condition Gross return which measures the movement in the net asset backing of the Company (per share)
plus the dividends assumed to be reinvested grossed up for franking credits. This return is compared to the relevant accumulating index as set out below.
Indices which investment portfolios are assessed against
Investment portfolio Relevant accumulation IndexAFIC (60 per cent) S&P/ASX 200 Accumulation Index, grossed
up for franking creditsDjerriwarrh Investments Limited (25 per cent) S&P/ASX 200 Accumulation Index, grossed
up for franking creditsMirrabooka Investments Limited (10 per cent) S&P/ASX Mid Cap 50 Accumulation Index
and the S&P/ASX Small Ordinaries Accumulation Index, grossed up for franking credits
AMCIL Limited (5 per cent) S&P/ASX 200 Accumulation Index, grossed up for franking credits
Vesting schedule: Company gross return
Company performance relative to the relevant accumulation index
Percentage of rights vesting
< 90 per cent performance 0 per cent90 – 99 per cent performance Board discretion> 100 per cent up to 110 per cent performance Straight line between 50 per cent and 100 per cent> 110 per cent up to 120 per cent performance Straight line between 100 per cent and 150 per cent 120 per cent + performance 150 per cent
D. Directors and Executives: Equity Holdings and Other Transactions
Tables 15 sets out reconciliations of shares and convertible notes issued by the Group and held directly, indirectly or beneficially by Non-Executive Directors and Executives of the Group, or by entities to which they were related.
Table 15: Shareholdings of Directors and Executives
Opening Balance Changes During Year Closing BalanceTA Campbell 409,262 12,469 421,731RM Freeman 139,222 2,961 142,183RE Barker 897,254 1,287 898,541JC Hey 19,189 775 19,964GR Liebelt 236,893 81,570 318,463J Paterson 557,237 13,200 570,437DA Peever 23,814 2,995 26,809CM Walter 311,169 12,572 323,741PJ Williams 67,431 - 67,431GN Driver 129,952 3,076 133,028MJ Rowe 197 820 1,017AJB Porter 175,570 2,875 178,445
31
Australian Foundation Investment Company Limited Annual Report 2018
For
per
sona
l use
onl
y

Remuneration Report continued
Other Arrangements with Non-Executive Directors
Non-Executive Directors Ross Barker, John Paterson and Catherine Walter have rented office space and, for Ross Barker and John Paterson, a parking space from the Group at commercial rates during the year. Sub-lease rental income (included in revenue) received or receivable, excluding GST, by the Group during the year was:
Rental Income Received/Receivable $
RE Barker 10,098J Paterson 26,047CM Walter 14,169
E. Detailed Performance Measures by Investment Company
Table 16 below shows the performance of AFIC and the other investment companies over the past five years, including details of total shareholder return (TSR), total portfolio return (TPR) and gross return (GR). These measures, which represent growth in shareholder wealth, determine the vesting of AFIC’s LTI plans to Executives and the investment team. Table 16: Detailed Performance Measures for AFIC and the Other Investment Companies
Year Ending 30 June10-year Return
8-year Return
5-year Return
4-year Return
3-year Return 2018 2017 2016 2015 2014
Comparative returnsS&P/ASX 200 Accumulation Return 6.4% 9.4% 10.0% 8.2% 9.0% 13.0% 14.1% 0.6% 5.7% 17.4%Gross S&P/ASX 200 Accumulation Return 8.0% 11.1% 11.6% 9.8% 10.7% 14.6% 15.7% 2.2% 6.8% 19.2%Combined Midcap 50 and Small Ordinaries Accumulation Return (used for Mirrabooka Investments Limited) 4.9% 9.1% 14.0% 13.3% 16.0% 19.3% 12.7% 16.1% 5.6% 16.9%Gross Combined Midcap 50 and Small Ordinaries Accumulation Return (used for Mirrabooka Investments Limited) 5.9% 10.2% 15.1% 14.4% 17.1% 20.4% 13.8% 17.2% 6.3% 18.0%
AFICTotal shareholder return 6.5% 7.8% 6.7% 4.0% 4.4% 10.3% 8.0% -4.4% 2.8% 17.9%Total portfolio return 6.5% 8.8% 8.2% 6.0% 6.8% 10.8% 11.7% -1.6% 3.9% 17.3%Growth in net operating result per share 1.1% 3.3% 0.8% -0.8% -4.9% 9.6% -9.6% -12.4% 11.8% 7.5%Management expense ratio n/a n/a n/a n/a n/a 0.14% 0.14% 0.16% 0.16% 0.17%Risk/reward return1 43rd/104 76th/121 115th/147 123rd/152 123rd/155 105th/156 119th/169 n/a2 139th/176 36th/177Gross return 8.5% 10.7% 10.1% 7.9% 8.7% 12.7% 13.7% 0.2% 5.6% 19.2%Investment return 7.0% 9.2% 8.7% 6.6% 7.3% 11.3% 12.3% -1.0% 4.6% 17.0%
1. This represents the Company’s ranking in the Mercer IDPS Australian Share Universe – i.e. 10th out of 71 funds. The period used is Year to May.
2. n/a as cannot be calculated when return is negative.
32
Australian Foundation Investment Company Limited Annual Report 2018
For
per
sona
l use
onl
y

Year Ending 30 June10-year Return
8-year Return
5-year Return
4-year Return
3-year Return 2018 2017 2016 2015 2014
Djerriwarrh Investments LimitedTotal shareholder return 4.0% 4.4% 1.3% -2.4% -4.8% -2.8% -3.8% -7.7% 5.2% 17.4%Total portfolio return 4.9% 7.0% 6.3% 4.2% 5.5% 8.8% 13.0% -4.5% 0.2% 15.6%Growth in net operating profit per share -3.1% -2.9% 0.4% -4.2% -9.5% 5.7% -19.9% -10.0% 10.8% 20.7%Management expense ratio n/a n/a n/a n/a n/a 0.44% 0.46% 0.46% 0.41% 0.39%Gross return 8.2% 10.3% 9.6% 7.4% 8.8% 11.7% 16.6% -1.1% 3.2% 19.1%Investment return 6.7% 8.8% 7.9% 5.6% 6.6% 9.7% 13.0% -2.7% 2.8% 16.3%Operating earnings as a percentage of available investable assets n/a n/a n/a n/a n/a 7.1% 7.1% 8.7% 7.9% 7.6%
Mirrabooka Investments LimitedTotal shareholder return 10.0% 12.3% 9.1% 6.3% 6.9% 4.9% 3.0% 13.1% 4.3% 21.2%Total portfolio return 9.4% 12.0% 11.7% 9.1% 11.2% 14.7% 7.1% 12.0% 3.1% 22.8%Growth in net operating result per share -0.5% 2.9% 1.7% 4.0% 8.4% 35.7% -17.8% 16.6% -10.0% -7.0%Management expense ratio n/a n/a n/a n/a n/a 0.60% 0.62% 0.65% 0.67% 0.64%Gross return 12.3% 15.0% 15.0% 12.3% 14.2% 17.3% 9.9% 15.4% 6.8% 26.4%Investment return 11.8% 14.6% 14.6% 11.7% 13.4% 16.0% 9.3% 14.8% 6.5% 26.5%
AMCIL LimitedTotal shareholder return 8.7% 10.9% 8.0% 4.6% 6.4% 9.1% -1.2% 11.8% -0.9% 22.7%Total portfolio return 8.8% 10.0% 8.4% 6.8% 8.4% 12.3% 5.3% 7.6% 2.2% 14.7%Growth in net operating result per share 2.6% -1.1% -5.1% -4.0% -7.0% 14.4% -32.6% 4.8% 4.3% -9.6%Management expense ratio n/a n/a n/a n/a n/a 0.69% 0.68% 0.65% 0.67% 0.65%Gross return 10.8% 12.1% 10.8% 8.9% 10.2% 13.9% 7.0% 9.7% 5.1% 18.8%Investment return 10.5% 11.8% 10.2% 8.4% 10.0% 14.0% 7.1% 9.3% 3.9% 17.9%
33
Australian Foundation Investment Company Limited Annual Report 2018
For
per
sona
l use
onl
y

Details of non-audit services performed by the auditors may be found in Note F2 of the Financial Report.
The Board of Directors has considered the position and, in accordance with the advice received from the Audit Committee, is satisfied that the provision of the non-audit services is compatible with the general standard of independence for auditors imposed by the Corporations Act 2001. The Directors are satisfied that the provision of non-audit services by the auditor, as set out below, did not compromise the auditor independence requirements of the Corporations Act 2001 for the following reasons:
• all non-audit services have been reviewed by the Audit Committee to ensure they do not impact the impartiality and objectivity of the auditor; and
• none of the services undermine the general principles relating to auditor independence as set out in the Corporations Act 2001 including reviewing or auditing the auditor’s own work, acting in a management or a decision-making capacity for the Company, acting as advocate for the Company, or jointly sharing economic risk and rewards.
A copy of the Auditor’s Independence Declaration is set out on page 35.
This report is made in accordance with a resolution of the Directors.
Terrence Campbell AOChairman
Melbourne 23 July 2018
Non-audit Services
34
Australian Foundation Investment Company Limited Annual Report 2018
For
per
sona
l use
onl
y

Auditor’s Independence Declaration
35
Australian Foundation Investment Company Limited Annual Report 2018
For
per
sona
l use
onl
y

36 Financial Statements
37 Consolidated Income Statement
38 Consolidated Statement of Comprehensive Income
39 Consolidated Balance Sheet
40 Consolidated Statement of Changes in Equity
42 Consolidated Cash Flow Statement
43 Notes to the Financial Statements
43 A. Understanding AFIC’s Financial Performance
43 A1. How AFIC Manages its Capital
43 A2. Investments Held and How They are Measured
44 A3. Operating Income
45 A4. Dividends Paid
46 A5. Earnings Per Share
47 B. Costs, Tax and Risk
47 B1. Management Costs
47 B2. Tax
48 B3. Risk
50 C. Unrecognised Items
50 C1. Contingencies
51 Additional Information
51 D. Balance Sheet Reconciliations
51 D1. Current Assets – Cash
51 D2. Credit Facilities
51 D3. Revaluation Reserve
52 D4. Realised Capital Gains Reserve
52 D5. Retained Profits
52 D6. Shared Capital
53 E. Income Statement Reconciliations
53 E1. Reconciliation of Net Cash Flows from Operating Activities to Profit
53 E2. Tax Reconciliations
54 F. Other Information
54 F1. Related Parties
54 F2. Remuneration of Auditors
54 F3. Segment Reporting
55 F4. Summary of Other Accounting Policies
57 F5. Performance Bond
57 F6. Share-based Payments
58 F7. Lease Commitments
58 F8. Principles of Consolidation
59 F9. Subsidiaries
59 F10. Parent Entity Financial Information
FINANCIAL STATEMENTS
36
Australian Foundation Investment Company Limited Annual Report 2018
For
per
sona
l use
onl
y

Note2018 $’000
2017 $’000
Dividends and distributions A3 302,389 270,887Revenue from deposits and bank bills A3 1,409 1,659Other revenue A3 4,703 5,105Total revenue 308,501 277,651
Net gains on trading portfolio and non-equity investments A3 264 3,065Income from operating activities 308,765 280,716
Finance costs (848) (8,969)Administration expenses B1 (14,533) (14,483)Profit before income tax expense 293,384 257,264
Income tax expense B2, E2 (14,377) (11,964)
Profit for the year 279,007 245,300
Profit is attributable to:Equity holders of Australian Foundation Investment Company Ltd 278,709 245,029Minority interest 298 271
279,007 245,300
Cents CentsBasic earnings per share A5 23.57 21.32 This Consolidated Income Statement should be read in conjunction with the accompanying notes.
Consolidated Income StatementFor the Year Ended 30 June 2018
37
Australian Foundation Investment Company Limited Annual Report 2018
For
per
sona
l use
onl
y

Year to 30 June 2018 Year to 30 June 2017Revenue1 Capital1 Total Revenue Capital Total
$’000 $’000 $’000 $’000 $’000 $’000Profit for the year 279,007 - 279,007 245,300 - 245,300
Other comprehensive income
Items that will not be recycled through the Income StatementGains for the period - 454,180 454,180 - 500,389 500,389Tax on above - (136,841) (136,841) - (154,791) (154,791)Total other comprehensive income - 317,339 317,339 - 345,598 345,598
Total comprehensive income 279,007 317,339 596,346 245,300 345,598 590,898
1. ‘Capital’ includes realised or unrealised gains or losses (and the tax on those) on securities in the investment portfolio, including non-equity investments held in the investment portfolio. Income in the form of distributions and dividends is recorded as ‘revenue’. All other items, including expenses, are included in profit for the year, which is categorised under ‘revenue’.
Year to 30 June 2018 Year to 30 June 2017Revenue
$’000Capital
$’000Total
$’000Revenue
$’000Capital
$’000Total
$’000Total comprehensive income is attributable to:
Equity holders of Australian Foundation Investment Company Ltd 278,709 317,339 596,048 245,029 345,598 590,627Minority Interests 298 - 298 271 - 271
279,007 317,339 596,346 245,300 345,598 590,898
This Consolidated Statement of Comprehensive Income should be read in conjunction with the accompanying notes.
Consolidated Statement of Comprehensive Income For the Year Ended 30 June 2018
38
Australian Foundation Investment Company Limited Annual Report 2018
For
per
sona
l use
onl
y

Note2018$’000
2017$’000
Current assetsCash D1 99,183 105,125Receivables 77,234 52,011Total current assets 176,417 157,136
Non-current assetsInvestment portfolio A2 7,280,706 6,790,368Deferred tax assets 1,257 349Total non-current assets 7,281,963 6,790,717
Total assets 7,458,380 6,947,853
Current liabilitiesPayables 712 6,953Tax payable 8,245 1,980Borrowings – bank debt D2 100 -Trading portfolio 6,757 546Provisions 4,385 4,448Total current liabilities 20,199 13,927
Non-current liabilitiesProvisions 1,394 1,332Deferred tax liabilities – investment portfolio B2 1,097,527 967,091Total non-current liabilities 1,098,921 968,423
Total liabilities 1,119,120 982,350
Net assets 6,339,260 5,965,503
Shareholders’ equityShare capital A1, D6 2,811,721 2,756,256Revaluation reserve A1, D3 2,422,568 2,123,209Realised capital gains reserve A1, D4 448,892 430,912General reserve A1 23,637 23,637Retained profits A1, D5 631,725 631,070Parent entity interest 6,338,543 5,965,084Minority interest 717 419Total equity 6,339,260 5,965,503
This Consolidated Balance Sheet should be read in conjunction with the accompanying notes.
Consolidated Balance Sheet As at 30 June 2018
39
Australian Foundation Investment Company Limited Annual Report 2018
For
per
sona
l use
onl
y

Year Ended 30 June 2018 Note
Share Capital
$’000
Revaluation Reserve
$’000
Realised Capital Gains
$’000
General Reserve
$’000
Retained Profits
$’000
Total Parent Entity
$’000
Minority Interest
$’000Total
$’000Total equity at the beginning of the year 2,756,256 2,123,209 430,912 23,637 631,070 5,965,084 419 5,965,503Dividends paid to shareholders A4 - - - - (278,054) (278,054) - (278,054)– Dividend Reinvestment Plan D6 55,601 - - - - 55,601 - 55,601Other share capital adjustments (136) - - - - (136) - (136)Total transactions with shareholders 55,465 - - - (278,054) (222,589) - (222,589)
Profit for the year - - - - 278,709 278,709 298 279,007
Other comprehensive income (net of tax)Net gains for the period - 317,339 - - - 317,339 - 317,339Other comprehensive income for the year - 317,339 - - - 317,339 - 317,339
Transfer to realised capital gains of cumulative gains on investments sold - (17,980) 17,980 - - - -
Total equity at the end of the year 2,811,721 2,422,568 448,892 23,637 631,725 6,338,543 717 6,339,260
Year Ended 30 June 2017 Note
Share Capital
$’000
Revaluation Reserve
$’000
Realised Capital Gains
$’000
General Reserve
$’000
Retained Profits$’000
Total Parent Entity
$’000
Minority Interest
$’000Total
$’000Total equity at the beginning of the year 2,521,441 1,767,628 457,593 23,637 637,094 5,407,393 1,148 5,408,541Dividends paid to shareholders A4 - - (16,698) - (251,053) (267,751) - (267,751)– Dividend Reinvestment Plan D6 55,242 - - - - 55,242 - 55,242– Conversion of notes D6 179,755 - - - - 179,755 - 179,755Other share capital adjustments (182) - - - - (182) - (182)Total transactions with shareholders 234,815 - (16,698) - (251,053) (32,936) - (32,936)
Profit for the year - - - - 245,029 245,029 271 245,300
Other comprehensive income (net of tax)Net gains for the period - 345,598 - - - 345,598 - 345,598Other comprehensive income for the year - 345,598 - - - 345,598 - 345,598
Transfer to realised capital gains of cumulative losses on investments sold - 9,983 (9,983) - - - - -
Dividend paid to minority interests by AICS - - - - - - (1,000) (1,000)
Total equity at the end of the year 2,756,256 2,123,209 430,912 23,637 631,070 5,965,084 419 5,965,503
This Consolidated Statement of Changes in Equity should be read in conjunction with the accompanying notes.
Consolidated Statement of Changes in Equity For the Year Ended 30 June 2018
40
Australian Foundation Investment Company Limited Annual Report 2018
For
per
sona
l use
onl
y

Year Ended 30 June 2018 Note
Share Capital
$’000
Revaluation Reserve
$’000
Realised Capital Gains
$’000
General Reserve
$’000
Retained Profits
$’000
Total Parent Entity
$’000
Minority Interest
$’000Total
$’000Total equity at the beginning of the year 2,756,256 2,123,209 430,912 23,637 631,070 5,965,084 419 5,965,503Dividends paid to shareholders A4 - - - - (278,054) (278,054) - (278,054)– Dividend Reinvestment Plan D6 55,601 - - - - 55,601 - 55,601Other share capital adjustments (136) - - - - (136) - (136)Total transactions with shareholders 55,465 - - - (278,054) (222,589) - (222,589)
Profit for the year - - - - 278,709 278,709 298 279,007
Other comprehensive income (net of tax)Net gains for the period - 317,339 - - - 317,339 - 317,339Other comprehensive income for the year - 317,339 - - - 317,339 - 317,339
Transfer to realised capital gains of cumulative gains on investments sold - (17,980) 17,980 - - - -
Total equity at the end of the year 2,811,721 2,422,568 448,892 23,637 631,725 6,338,543 717 6,339,260
Year Ended 30 June 2017 Note
Share Capital
$’000
Revaluation Reserve
$’000
Realised Capital Gains
$’000
General Reserve
$’000
Retained Profits$’000
Total Parent Entity
$’000
Minority Interest
$’000Total
$’000Total equity at the beginning of the year 2,521,441 1,767,628 457,593 23,637 637,094 5,407,393 1,148 5,408,541Dividends paid to shareholders A4 - - (16,698) - (251,053) (267,751) - (267,751)– Dividend Reinvestment Plan D6 55,242 - - - - 55,242 - 55,242– Conversion of notes D6 179,755 - - - - 179,755 - 179,755Other share capital adjustments (182) - - - - (182) - (182)Total transactions with shareholders 234,815 - (16,698) - (251,053) (32,936) - (32,936)
Profit for the year - - - - 245,029 245,029 271 245,300
Other comprehensive income (net of tax)Net gains for the period - 345,598 - - - 345,598 - 345,598Other comprehensive income for the year - 345,598 - - - 345,598 - 345,598
Transfer to realised capital gains of cumulative losses on investments sold - 9,983 (9,983) - - - - -
Dividend paid to minority interests by AICS - - - - - - (1,000) (1,000)
Total equity at the end of the year 2,756,256 2,123,209 430,912 23,637 631,070 5,965,084 419 5,965,503
This Consolidated Statement of Changes in Equity should be read in conjunction with the accompanying notes.
41
Australian Foundation Investment Company Limited Annual Report 2018
For
per
sona
l use
onl
y

Note
2018 $’000
Inflows/ (Outflows)
2017 $’000
Inflows/(Outflow)
Cash flows from operating activitiesSales from trading portfolio 66,478 29,002Purchases for trading portfolio (4,770) (18,305)Interest received 1,347 1,668Dividends and distributions received 243,605 259,553
306,660 271,918
Other receipts 4,957 5,111Administration expenses (14,803) (14,173)Finance costs paid (848) (12,550)Taxes paid (14,808) (23,645)Net cash inflow/(outflow) from operating activities E1 281,158 226,661
Cash flows from investing activitiesSales from investment portfolio 689,030 216,497Purchases for investment portfolio (753,667) (269,443)Net cash inflow/(outflow) from investing activities (64,637) (52,946)
Cash flows from financing activitiesRedeeming of convertible notes - (10,722)Net bank borrowings 100 -Share issue transaction costs (136) (59)Dividends paid (222,427) (213,712)Net cash inflow/(outflow) from financing activities (222,463) (224,493)
Net increase/(decrease) in cash held (5,942) (50,778)Cash at the beginning of the year 105,125 155,903Cash at the end of the year D1 99,183 105,125
For the purpose of the Cash Flow Statement, ‘cash’ includes cash and deposits held at call.
This Consolidated Cash Flow Statement should be read in conjunction with the accompanying notes.
Consolidated Cash Flow Statement For the Year Ended 30 June 2018
42
Australian Foundation Investment Company Limited Annual Report 2018
For
per
sona
l use
onl
y

A. Understanding AFIC’s Financial PerformanceA1. How AFIC Manages its Capital
AFIC’s objective is to provide shareholders with attractive investment returns through access to a growing stream of fully franked dividends and enhancement of capital invested.
AFIC recognises that its capital will fluctuate with market conditions. In order to manage those fluctuations, the Board may adjust the amount of dividends paid, issue new shares, buy back the Company’s shares or sell assets.
AFIC’s capital consists of its shareholders’ equity plus any net borrowings. A summary of the balances in equity is provided below:
2018 $’000
2017 $’000
Share capital 2,811,721 2,756,256Revaluation reserve 2,422,568 2,123,209Realised capital gains reserve 448,892 430,912General reserve 23,637 23,637Retained profits 631,725 631,070
6,338,543 5,965,084
Refer to notes D3–D6 for a reconciliation of movement from period to period for each equity account (except the general reserve, which is historical, relates to past profits which can be distributed and has had no movement).
A2. Investments Held and How They Are Measured
AFIC has two portfolios of securities: the investment portfolio and the trading portfolio.
The investment portfolio holds securities which the Company intends to retain on a long-term basis, and includes a small sub-component over which options may be written. The trading portfolio consist of securities that are held for short-term trading only, including call option contracts written over securities that are held in the specific sub-component of the investment portfolio and on occasion put options and is relatively small in size. The Board has therefore focused the information in this section on the investment portfolio. Details of all holdings (except for the specific option holdings) as at the end of the reporting period can be found at the end of the Annual Report.
The balance and composition of the investment portfolio was:
2018 $’000
2017 $’000
Equity instruments (excluding below) at market value 6,940,638 6,495,320
Equity instruments (over which options may be written) 327,764 282,754Hybrids 12,304 12,294
7,280,706 6,790,368
How Investments Are Shown in the Financial Statements
The accounting standards set out the following hierarchy for fair value measurement:
Level 1: Quoted prices in active markets for identical assets or liabilities.
Level 2: Inputs other than quoted prices, which can be observed either directly (as prices) or indirectly (derived from prices).
Level 3: Inputs for the asset or liabilities that are not based on observable market data.
All financial instruments held by AFIC are classified as Level 1 (other than the options sold by the Company which are Level 2). Their fair values are initially measured at the costs of acquisition and then remeasured based on quoted market prices at the end of the reporting period.
NOTES TO THE FINANCIAL STATEMENTS
43
Australian Foundation Investment Company Limited Annual Report 2018
For
per
sona
l use
onl
y

Notes to the Financial Statements continued
Net Tangible Asset Backing Per Share
The Board regularly reviews the net asset backing per share both before and after provision for deferred tax on the unrealised gains in AFIC’s long-term investment portfolio. Deferred tax is calculated as set out in Note B2. The relevant amounts as at 30 June 2018 and 30 June 2017 were as follows:
30 June 2018 $
30 June 2017 $
Net tangible asset backing per shareBefore tax 6.27 5.89After tax 5.34 5.07
Equity Investments
The shares in the investment portfolio are designated under the accounting standards as financial assets measured at fair value through ‘other comprehensive income’ (OCI), because they are equity instruments held for long-term capital growth and dividend income, rather than to make a profit from their sale. This means that changes in the value of these shares during the reporting period are included in OCI in the Consolidated Statement of Comprehensive Income. The cumulative change in value of the shares over time is then recorded in the revaluation reserve. On disposal, the amounts recorded in the revaluation reserve are transferred to the realisation reserve.
Puttable Instruments and Convertible Notes
Puttable instruments and convertible notes are classified as financial assets at fair value through profit and loss under the accounting standards and therefore need to be treated differently in the financial statements, even though they are managed in the same way as the rest of the investment portfolio. Changes in the value of these investments are reflected in the Consolidated Income Statement and not in the Consolidated Statement of Comprehensive Income with the other investments. Any gains or losses on these securities are transferred from retained profits to the revaluation reserve. On disposal, the amounts recorded in the revaluation reserve are transferred to the realisation reserve.
Securities Sold and How They Are Measured
Where securities are sold, any difference between the sale price and the cost is transferred from the revaluation reserve to the realisation reserve and the amounts noted in the Consolidated Statement of Changes in Equity. This means the Company is able to identify the realised gains out of which it can pay a ‘Listed Investment Company’ (LIC) gain as part of the dividend, which conveys certain taxation benefits to many of AFIC’s shareholders.
During the period $712.6 million (2017: $217.2 million) of equity securities were sold. The cumulative gain on the sale of securities was $18.0 million for the period after tax (2017: $10.0 million loss). This has been transferred from the revaluation reserve to the realisation reserve (see Consolidated Statement of Changes in Equity). These sales were accounted for at the date of trade.
A3. Operating Income
The total income received from AFIC’s investments in 2018 is set out below.
Dividends and Distributions2018 $’000
2017 $’000
Income from securities held in investment portfolio at 30 June 272,362 264,658Income from investment securities sold during the year 29,918 6,120Income from securities held in trading portfolio at 30 June - 109Income from trading securities sold during the year 109 -
302,389 270,887
Interest incomeIncome from cash investments 1,409 1,659
Other incomeAdministration fees 4,681 5,022Other income 22 83
4,703 5,105
44
Australian Foundation Investment Company Limited Annual Report 2018
For
per
sona
l use
onl
y

Dividend Income
Distributions from listed securities are recognised as income when those securities are quoted in the market on an ex-distribution basis. Capital returns on ordinary shares are treated as an adjustment to the carrying value of the shares.
Trading Income
Net gains on the trading and options portfolio are set out below.
Net Gains2018$’000
2017$’000
Net realised gains from trading portfolio – shares 672 470 – options 3,559 1,912Unrealised gains/(losses) from trading portfolio – shares - 496 – options (3,967) 187
264 3,065
$115.7 million of shares are lodged with the ASX Clear Pty Ltd as collateral for sold option positions written by the Group (2017: $112.9 million). These shares are lodged with ASX Clear under the terms of ASX Clear Pty Ltd which require participants in the Exchange Traded Option market to lodge collateral, and are recorded as part of the Group’s investment portfolio. If all call options were exercised, this would lead to the sale of $61.7 million worth of securities at an agreed price – the ‘exposure’ (2017: $82.4 million). If all put options were exercised, this would lead to the purchase of $19.7 million of securities at an agreed price (2017: $18.4 million). A4. Dividends Paid
The dividends paid and payable for the year ended 30 June 2018 are shown below:
(a) Dividends Paid During the Year2018$’000
2017$’000
Final dividend for the year ended 30 June 2017 of 14 cents fully franked at 30 per cent paid 30 August 2017 (2017: 14 cents fully franked at 30 per cent paid on 30 August 2016). 161,955 155,852
Interim dividend for the year ended 30 June 2018 of 10 cents per share fully franked at 30 per cent, paid 23 February 2018 (2017: 10 cents fully franked at 30 per cent paid 24 February 2017). 116,099 111,899
278,054 267,751
Dividends paid in cash 222,453 212,509Dividends reinvested in shares 55,601 55,242
278,054 267,751Dividends forgone via DSSP 4,788 4,241
(b) Franking CreditsOpening balance of franking account at 1 July 158,730 159,869Franking credits on dividends received 104,609 92,267Tax paid during the year 14,069 23,164Franking credits paid on ordinary dividends paid (119,166) (114,750)Franking credits deducted on DSSP shares issued (2,055) (1,820)Closing balance of franking account 156,187 158,730Adjustments for tax payable in respect of the current year’s profits and the receipt of dividends recognised as receivables 22,534 16,008Adjusted closing balance 178,721 174,738Impact on the franking account of dividends declared but not recognised as a liability at the end of the financial year: (71,169) (70,565)Net available 107,552 104,173
These franking account balances would allow AFIC to frank additional dividend payments up to an amount of: 250,955 243,070
AFIC’s ability to continue to pay franked dividends is dependent upon the receipt of franked dividends from the trading and investment portfolios and on AFIC paying tax.
45
Australian Foundation Investment Company Limited Annual Report 2018
For
per
sona
l use
onl
y

Notes to the Financial Statements continued
(c) New Zealand Imputation Account
2018$’000
2017$’000
(Figures in A$ at year-end exchange rate: 2018: $NZ1.093: $A1; 2017: $NZ1.047: $A1)Opening balance 13,357 7,660Imputation credits on dividends received 5,987 6,284Imputation credits on dividends paid (12,348) -Closing balance 6,996 13,944
(d) Dividends Declared After Balance Date
Since the end of the year Directors have declared a final dividend of 14 cents per share fully franked at 30 per cent. The aggregate amount of the final dividend for the year to 30 June 2018 to be paid on 31 August 2018, but not recognised as a liability at the end of the financial year is: 166,061
(e) Listed Investment Company Capital Gain Account
2018 $’000
2017 $’000
Balance of the listed investment company (LIC) capital gain account: 32,686 9,883This equates to an attributable amount of: 46,694 14,118
Distributed LIC capital gains may entitle certain shareholders to a deduction in their tax return, as set out in the dividend statement. LIC capital gains available for distribution are dependent on the disposal of investment portfolio holdings that qualify for LIC capital gains, or the receipt of LIC distributions from LIC securities held in the portfolios. $33.9 million attributable gain is attached to the final dividend to be paid on 31 August 2018.
A5. Earnings Per Share
The table below shows the earnings per share based on the profit for the year: 2018 2017Basic earnings per share Number NumberWeighted average number of ordinary shares used as the denominator 1,182,444,510 1,149,255,591
$’000 $’000Profit for the year 278,709 245,029
Cents CentsBasic earnings per share 23.57 21.32
46
Australian Foundation Investment Company Limited Annual Report 2018
For
per
sona
l use
onl
y

B. Costs, Tax and RiskB1. Management Costs
The total management expenses for the period are as follows:
2018$’000
2017$’000
Rental expense relating to non-cancellable leases (621) (636)Employee benefit expenses (8,911) (9,138)Depreciation charge - -Other administration expenses (5,001) (4,709)
(14,533) (14,483)
Employee Benefit Expenses
A major component of employee benefit expenses is Directors’ and Executives’ remuneration. This has been summarised below:
Short-term Benefit
$
Other Long-term
Benefits $
Post-employment
Benefits $
Share Based
Payments $
Total $
2018Non-Executive Directors 719,179 - 68,321 - 787,500Executives 3,118,300 (16,625) 107,888 53,514 3,263,077Total 3,837,479 (16,625) 176,209 53,514 4,050,577
2017Non-Executive Directors 657,536 - 62,464 - 720,000Executives 3,404,083 64,161 127,136 83,187 3,678,567Total 4,061,619 64,161 189,600 83,187 4,398,567
Detailed remuneration disclosures are provided in the Remuneration Report.
The Group (i.e. AFIC and its subsidiary, Australian Investment Company Services (AICS) – see Note F8) does not make loans to Directors or Executives.
B2. Tax
AFIC’s tax position, and how it accounts for tax, is explained here. Detailed reconciliations of tax accounting to the financial statements can be found in Note E2.
The income tax expense for the period is the tax payable on this financial year’s taxable income, adjusted for any changes in deferred tax assets and liabilities attributable to temporary differences and for any unused tax losses. Deferred tax assets and liabilities (except for those related to the unrealised gains or losses in the investment portfolio) are offset, as all current and deferred taxes relate to the Australian Taxation Office and can legally be settled on a net basis.
A provision has been made for taxes on any unrealised gains or losses on securities valued at fair value through the Income Statement – i.e. the trading portfolio, puttable instruments and convertible notes that are classified as debt.
A provision also has to be made for any taxes that could arise on sale of securities in the investment portfolio, even though there is no intention to dispose of them. Where AFIC disposes of such securities, tax is calculated according to the particular parcels allocated to the sale for tax purposes, offset against any capital losses carried forward.
47
Australian Foundation Investment Company Limited Annual Report 2018
For
per
sona
l use
onl
y

Notes to the Financial Statements continued
Tax Expense
The income tax expense for the period is shown below:
(a) Reconciliation of Income Tax Expense to Prima Facie Tax Payable
2018 $’000
2017 $’000
Profit before income tax expense 293,384 257,264Tax at the Australian tax rate of 30 per cent (2017: 30 per cent) 88,015 77,179Tax offset for franked dividends received (70,989) (63,495)Tax effect of sundry items taxable in current year but not included in income (15) 322
17,011 14,006Over provision in prior years (2,634) (2,042)
Total tax expense 14,377 11,964 Deferred Tax Liabilities – Investment Portfolio
The accounting standards require us to recognise a deferred tax liability for the potential capital gains tax on the unrealised gain in the investment portfolio. This amount is shown in the Balance Sheet. However, the Board does not intend to sell the investment portfolio, so this tax liability is unlikely to arise at this amount. Any sale of securities would also be affected by any changes in capital gains tax legislation or tax rate applicable to such gains when they are sold.
2018$’000
2017$’000
Deferred tax liabilities on unrealised gains in the investment portfolio 1,097,527 967,091
Opening balance at 1 July 967,091 812,947Tax on realised gains (6,405) (647)Charged to OCI for ordinary securities on gains or losses for the period 136,841 154,791
1,097,527 967,091
B3. RiskMarket Risk
Market risk is the risk that the fair value or future cash flows of a financial instrument will fluctuate because of changes in market prices.
As a LIC that invests in tradeable securities, AFIC can never be free of market risk as it invests its capital in securities which are not risk free – the market price of these securities will fluctuate.
A general fall in market prices of 5 per cent and 10 per cent, if spread equally over all assets in the investment portfolio, would have led to a reduction in AFIC’s comprehensive income of $254.8 million and $509.6 million respectively, at a tax rate of 30 per cent (2017: $237.7 million and $475.3 million).
AFIC seeks to reduce market risk at the investment portfolio level by ensuring that it is not, in the opinion of the Investment Committee, overly exposed to one company or one particular sector of the market. The relative weightings of the individual securities and the relevant market sectors are reviewed by the Investment Committee and risk can be managed by reducing exposure where necessary. AFIC does not have a minimum or maximum amount of the portfolio that can be invested in a single company or sector.
48
Australian Foundation Investment Company Limited Annual Report 2018
For
per
sona
l use
onl
y

AFIC’s total investment exposure by sector is as below:
2018%
2017%
Energy 5.44 4.37Materials 18.61 16.73Industrials 12.08 10.96Consumer discretionary 2.01 1.80Consumer staples 8.99 8.64Banks 21.31 24.52Other financials 10.86 10.69Property trusts 1.72 2.18Telecommunications 2.02 3.79Health care 9.90 9.80Information technology 3.86 2.67Utilities 1.85 2.33Cash 1.35 1.52
Securities representing over 5 per cent of the investment portfolio at 30 June were:Commonwealth Bank 7.9 9.6BHP 6.6 4.8Westpac 6.3 7.0CSL 5.1 3.5
AFIC is also not directly exposed to material currency risk as most of its investments are quoted in Australian dollars.
The writing of call options provides some protection against a fall in market prices as it generates income to partially compensate for a fall in capital values. Options are only written against securities that are held in the trading or the specific sub-section of the investment portfolio.
Interest Rate Risk
The Group is not currently materially exposed to interest rate risk as all its cash investments and borrowings are short term for a fixed interest rate.
Credit Risk
Credit risk is the risk that one party to a financial instrument will cause a financial loss for the other party by failing to discharge an obligation. AFIC is exposed to credit risk from cash, receivables, securities in the trading portfolio and securities in the investment portfolio respectively. None of these assets are overdue. The risk in relation to each of these items is set out below.
Cash
All cash investments not held in a transactional account are invested in short-term deposits with Australia’s ‘big four’ commercial banks or in cash management trusts which invest predominantly in securities with an A1+ rating. In the unlikely event of a bank default or default on the underlying securities in the cash trust, there is a risk of losing the cash deposits and any accrued unpaid interest.
Receivables
Outstanding settlements are on the terms operating in the securities industry, which usually require settlement within two days of the date of a transaction. Receivables are non-interest bearing and unsecured. In the event of a payment default, there is a risk of losing any difference between the price of the securities sold and the price of the recovered securities from the discontinued sale.
49
Australian Foundation Investment Company Limited Annual Report 2018
For
per
sona
l use
onl
y

Notes to the Financial Statements continued
Trading and Investment Portfolios
Converting and convertible notes or other interest-bearing securities that are not equity securities carry credit risk to the extent of their carrying value. This risk will be realised in the event of a shortfall on winding-up of the issuing companies.
Liquidity Risk
Liquidity risk is the risk that an entity will not be able to meet its financial liabilities.
AFIC monitors its cash-flow requirements daily. The Investment Committee also monitors the level of contingent payments on a regular basis by reference to known sales and purchases of securities, dividends and distributions to be paid or received, put options that may require AFIC to purchase securities, and facilities that need to be repaid. AFIC ensures that it has either cash or access to short-term borrowing facilities sufficient to meet these contingent payments.
AFIC’s inward cash flows depend upon the dividends received. Should these drop by a material amount, AFIC would amend its outward cash flows accordingly. AFIC’s major cash outflows are the purchase of securities and dividends paid to shareholders, and both of these can be adjusted by the Board and management. Furthermore, the assets of AFIC are largely in the form of readily tradeable securities which can be sold on-market if necessary.
The table below analyses AFIC’s financial liabilities into relevant maturity groupings. The amounts disclosed in the table are the contractual undiscounted cash flows. Balances due within 12 months equal their carrying amounts as the impact of discounting is not significant.
30 June 2018
Less than 6 Months
$’000
6–12 Months
$’000
Greater than 1 Year
$’000
Total Contractual Cash Flows
$’000
Carrying Amount
$’000Non-derivativesPayables 712 - - 712 712Borrowings – bank debt 100 - - 100 100
812 - - 812 812DerivativesOptions in trading portfolio* 19,726 - - 19,726 6,757
19,726 - - 19,726 6,757
30 June 2017
Less than 6 Months
$’000
6–12 Months
$’000
Greater than 1 Year
$’000
Total Contractual Cash Flows
$’000
Carrying Amount
$’000Non-derivativesPayables 6,953 - - 6,953 6,953
6,953 - - 6,953 6,953DerivativesOptions in trading portfolio* 18,352 - - 18,352 3,839
18,352 - - 18,352 3,839
* In the case of call options, there are no contractual cash flows as if the option is exercised the contract will be settled in the securities over which the option is written. The contractual cash flows for put options written are the cash sums the Company will pay to acquire securities over which the options have been written, and it is assumed for purpose of the above disclosure that all options will be exercised (i.e. maximum cash outflow).
C. Unrecognised ItemsUnrecognised items, such as contingencies, do not appear in the financial statements, usually because they don’t meet the requirements for recognition. However, they have the potential to have a significant impact on the Group’s financial position and performance.
C1. Contingencies
Directors are not aware of any material contingent liabilities or contingent assets other than those already disclosed elsewhere in the Financial Report.
50
Australian Foundation Investment Company Limited Annual Report 2018
For
per
sona
l use
onl
y

ADDITIONAL INFORMATION
Additional information that shareholders may find useful is included here. It is grouped into three sections:
D. Balance Sheet Reconciliations
E. Income Statement Reconciliations
F. Other Information
D. Balance Sheet ReconciliationsThis section provides further information about the basis of calculation of line items in the financial statements.
D1. Current Assets – Cash
2018$’000
2017$’000
Cash at bank and in hand (including on-call) 95,183 103,125Fixed term deposits 4,000 2,000
99,183 105,125
Cash holdings yielded an average floating interest rate of 1.80 per cent (2017: 1.93 per cent). All cash investments are held in a transactional account or an over-night ‘at call’ account invested in cash management trusts which invest predominantly in securities with an A1+ rating.
D2. Credit Facilities
2018$’000
2017$’000
Commonwealth Bank of Australia – cash advance facilities 140,000 140,000Amount drawn down 100 0Undrawn facilities 139,900 140,000
Westpac Bank – cash advance facilities - 10,000Amount drawn down - 0Undrawn facilities - 10,000
Total short-term loan facilities 140,000 150,000Amount drawn down 100 0Undrawn facilities 139,900 150,000
The above borrowings are unsecured. Repayment of facilities is done either through the use of cash received from distributions or the sale of securities, or by rolling existing facilities into new ones. Facilities are usually drawn down for no more than three months.
D3. Revaluation Reserve
2018$’000
2017$’000
Opening balance at 1 July 2,123,209 1,767,628Gains on investment portfolio– Equity instruments 454,180 500,389Provision for tax on above (136,841) (154,791)Cumulative taxable realised (gains)/losses (net of tax) (17,980) 9,983
2,422,568 2,123,209
This reserve is used to record increments and decrements on the revaluation of the investment portfolio as described in accounting policy Note A2.
51
Australian Foundation Investment Company Limited Annual Report 2018
For
per
sona
l use
onl
y

Additional Information continued
D4. Realised Capital Gains Reserve
2018$’000
2017$’000
Opening balance at 1 July 430,912 457,593Dividends paid - (16,698)Cumulative taxable realised gains/(losses) for period through OCI (net of tax) 17,980 (9,983)
448,892 430,912
This reserve records gains or losses after applicable taxation arising from disposal of securities in the investment portfolio as described in A2.
D5. Retained Profits
2018$’000
2017$’000
Opening balance at 1 July 631,070 637,094Dividends paid (278,054) (251,053)Profit for the year 278,709 245,029
631,725 631,070
This reserve relates to past profits.
D6. Share CapitalMovements in Share Capital
Date Details Notes
Number of Shares
’000
Issue Price
$
Paid-upCapital
$’0001/07/2016 Balance 1,130,305 2,521,44130/08/2016 Dividend Reinvestment Plan (i) 5,823 5.58 32,49330/08/2016 Dividend Substitution Share Plan (ii) 428 5.58 n/a31/08/2016 Convertible note conversion (iv) 1,009 5.09 5,13324/02/2017 Dividend Reinvestment Plan (i) 3,895 5.84 22,74924/02/2017 Dividend Substitution Share Plan (ii) 317 5.84 n/a28/02/2017 Convertible note conversion (iv) 34,331 5.09 174,622Various Cancellation of ELTIP shares not vested (29) n/a (123)Various Costs of issue - - (59)30/06/2017 Balance 1,176,079 2,756,25630/08/2017 Dividend Reinvestment Plan (i) 5,448 5.92 32,24930/08/2017 Dividend Substitution Share Plan (ii) 455 5.92 n/a23/02/2018 Dividend Reinvestment Plan (i) 3,822 6.11 23,35223/02/2018 Dividend Substitution Share Plan (ii) 343 6.11 n/aVarious Costs of issue - - (136)30/06/2018 Balance 1,186,147 2,811,721
(i) Shareholders elect to have all or part of their dividend payment reinvested in new ordinary shares under the Dividend Reinvestment Plan (DRP). The price of the new DRP shares is based on the average selling price of shares traded on the Australian Securities Exchange and Chi-X in the five days after the shares begin trading on an ex-dividend basis.
(ii) The Group has a Dividend Substitution Share Plan (DSSP) whereby shareholders may elect to forgo a dividend and receive shares instead. Pricing for the DSSP shares is done as per the DRP shares.
(iii) The Group has an on-market share buy-back program. During the financial year, no shares were bought back (2017: nil).
(iv) 1,797,547 Feb 2017 convertible notes were converted into shares during the year ending 30 June 2017. All remaining convertible notes were redeemed at their face value.
All shares have been fully paid, rank pari passu and have no par value.
52
Australian Foundation Investment Company Limited Annual Report 2018
For
per
sona
l use
onl
y

E. Income Statement ReconciliationsE1. Reconciliation of Net Cash Flows from Operating Activities to Profit
2018$’000
2017$’000
Profit for the year 279,007 245,300Net decrease/(increase) in trading portfolio 6,211 320Dividends received as securities under DRP investments - (1,870)Decrease/(increase) in current receivables (25,223) (6,653)– Less increase/(decrease) in receivables for investment portfolio 22,366 5,129Increase in deferred tax liabilities 129,528 154,829– Less (increase)/decrease in deferred tax liability on investment portfolio (130,436) (154,144)Increase/(decrease) in current payables (6,241) (13,979)– Less decrease/(increase) in payables for investment portfolio 6,113 9,943– Less increase/(decrease) in dividends payable (27) 80Increase/(decrease) in provision for tax payable 6,265 (12,413)Capital gains tax charge taken through equity (6,405) (647)Increase/(decrease) in other provisions/non-cash items (including convertible note expenses) - 766Net cash flows from operating activities 281,158 226,661
E2. Tax ReconciliationsTax Expense Composition
2018$’000
2017$’000
Charge for tax payable relating to the current year 17,919 13,321Over provision in prior years (2,634) (2,042)(Increase)/decrease in deferred tax assets (908) 685
14,377 11,964
Amounts Recognised Directly Through Other Comprehensive Income
Net increase in deferred tax liabilities relating to capital gains tax on the movement in gains in the investment portfolio 136,841 154,791
136,841 154,791
Deferred Tax Assets and Liabilities
The deferred tax balances are attributable to:
2018$’000
2017$’000
(a) Tax on unrealised gains or losses in the trading portfolio 1,190 (100)(b) Provisions and expenses charged to the accounting profit which are not yet tax deductible 1,738 1,740(c) Interest and dividend income receivable which is not assessable for tax until receipt (1,671) (1,291)
1,257 349
Movements:Opening asset balance at 1 July 349 1,034Credited/(charged) to Income Statement 908 (685)
1,257 349
Deferred tax assets arise when provisions and expenses have been charged but are not yet tax deductible. These assets are realised when the relevant items become tax deductible, as long as enough taxable income has been generated to claim the assets against, and as long as there are no changes to the tax legislation that affect AFIC’s ability to claim the deduction.
53
Australian Foundation Investment Company Limited Annual Report 2018
For
per
sona
l use
onl
y

Additional Information continued
F. Other InformationThis section covers other information that is not directly related to specific line items in the financial statements, including information about related party transactions, share-based payments, assets pledged as security and other statutory information.
F1. Related Parties
All transactions with deemed related parties were made on normal commercial terms and conditions and approved by independent Directors.
(a) Arrangements with Non-Executive Directors
Non-Executive Directors R Barker, J Paterson and C Walter have rented office space and, for R Barker and J Paterson, a parking space from the Group at commercial rates during the year. Sub-lease rental income (included in revenue) received or receivable by the Group, excluding GST, during the year was $50,314 (2017: $39,945).
(b) AICS Transactions with Minority Interests
The below transactions were with Djerriwarrh Investments Ltd as a minority interest holder in the Company’s subsidiary.
2018 $’000
2017 $’000
Administration expenses charged for the year 2,450 2,437
(c) AICS Transactions with Other Listed Investment Companies
AICS had the following transactions with other listed investment companies to which it provides services:
2018 $’000
2017 $’000
Administration expenses charged for the year to Mirrabooka Investments Ltd 1,400 1,481Administration expenses charged for the year to AMCIL Ltd 899 918
F2. Remuneration of Auditors
For the year the auditor earned or will earn the following remuneration:
2018$
2017$
PricewaterhouseCoopersAudit or review of Financial Reports 190,820 248,256AFSL compliance audit and review 7,796 9,925Non-audit servicesTaxation compliance services 38,819 81,444Total remuneration 237,435 339,625
F3. Segment Reporting
Operating segments are reported in a manner consistent with the internal reporting used by the chief operating decision-maker. The Board, through its sub-committees, has been identified as the chief operating decision-maker, as it is responsible for allocating resources and assessing performance of the operating segments.
Description of Segments
The Board makes the strategic resource allocations for AFIC. AFIC has therefore determined the operating segments based on the reports reviewed by the Board, which are used to make strategic decisions.
The Board is responsible for AFIC’s entire portfolio of investments and considers the business to have a single operating segment. The Board’s asset allocation decisions are based on a single, integrated investment strategy, and AFIC’s performance is evaluated on an overall basis.
Segment Information Provided to the Board
The internal reporting provided to the Board for AFIC’s assets, liabilities and performance is prepared on a consistent basis with the measurement and recognition principles of Australian Accounting Standards, except that net assets are reviewed both before and after the effects of capital gains tax on investments (as reported in AFIC’s Net Tangible Asset announcements to the ASX).
54
Australian Foundation Investment Company Limited Annual Report 2018
For
per
sona
l use
onl
y

Other Segment Information
Revenues from external parties are derived from the receipt of dividend, distribution and interest income, and income arising on the trading portfolio and realised income from the options portfolio.
AFIC is domiciled in Australia and most of AFIC’s income is derived from Australian entities or entities that maintain a listing in Australia. AFIC has a diversified portfolio of investments, with only one investment comprising more than 10 per cent of AFIC’s income, including realised income from the trading and options written portfolios – Commonwealth Bank (11.0 per cent)((2017: two investments: Commonwealth Bank (11.8 per cent) and Westpac Bank (10.4 per cent)).
F4. Summary of Other Accounting Policies
This general purpose Financial Report has been prepared in accordance with Australian Accounting Standards, Interpretations issued by the Australian Accounting Standards Board and the Corporations Act 2001. This Financial Report has been authorised for issue and is presented in the Australian currency. AFIC has the power to amend and reissue the Financial Report.
AFIC has attempted to improve the transparency of its reporting by adopting ‘plain English’ where possible. Key ‘plain English’ phrases and their equivalent AASB terminology are as follows:
Phrase AASB TerminologyMarket value Fair value for actively traded securitiesCash Cash and cash equivalentsShare capital Contributed equityOptions Derivatives written over equity instruments that are valued at fair value through profit or lossHybrids Equity instruments that have some of the characteristics of debt
AFIC complies with International Financial Reporting Standards (IFRS). AFIC is a ‘for profit’ entity.
AFIC has not applied any Australian Accounting Standards or AASB Interpretations that have been issued as at balance date but are not yet operative for the year ended 30 June 2018 (‘the inoperative standards’) except for AASB 9 (2009), which was adopted on 7 December 2009. The impact of the inoperative standards has been assessed and the impact has been identified as not being material. AFIC only intends to adopt other inoperative standards at the date at which their adoption becomes mandatory.
Basis of Accounting
The financial statements are prepared using the valuation methods described in A2. All other items have been treated in accordance with the historical cost convention.
Fair Value of Financial Assets and Liabilities
The fair value of cash and cash equivalents, and non-interest bearing monetary financial assets and liabilities of AFIC approximates their carrying value.
Convertible Notes
On the issue of convertible notes, the Group estimates the fair value of the liability component of the convertible notes, being the obligation to make future payments of principal and interest to holders, using a market interest rate for a non-convertible note of similar terms and conditions. The residual amount is included in equity as other equity securities with no recognition of any change in the value of the option in subsequent periods. The liability component is then included in borrowings. Expenses incurred in connection with the issue of the notes are deducted from the total face value and the expense is then incurred over the life of the notes.
The total liability is subsequently carried on an amortised cost basis with interest on the notes recognised as finance costs on an effective yield basis until the liability is extinguished on conversion or maturity of the notes.
55
Australian Foundation Investment Company Limited Annual Report 2018
For
per
sona
l use
onl
y

Additional Information continued
Employee Benefits
(i) Wages, Salaries and Annual Leave
Liabilities for wages and salaries, including annual leave, expected to be settled within 12 months of balance date are recognised as current provisions in respect of employees’ services up to balance date and are measured at the amounts expected to be paid when the liabilities are settled.
(ii) Long Service Leave
In calculating the value of long service leave, consideration is given to expected future wage and salary levels, experience of employee departures and periods of service. Expected future payments are discounted using market yields at balance date on national government bonds with terms to maturity and currency that match, as closely as possible, the estimated future cash outflows.
(iii) Cash Incentives
Cash incentives are provided under the Senior Executive Annual Incentive Plan and are dependent upon the performance of the Group. A provision is made for the cost of unsettled cash incentives at balance date. The Investment Team Annual Incentive Plans are also settled on a cash basis.
(iv) Share Incentives
Share incentives are provided under the Senior Executive Annual Incentive Plan, Senior Executive Long Term Incentive Plan, Investment Team Long Term Incentive Plan and the Employee Share Acquisition Scheme.
For the Employee Share Acquisition Scheme and the Senior Executive Annual Incentive Plan, the incentives are based on the performance of the individual, the Group and investment companies to which the Group provides administration services, for the financial year. For the Employee Share Acquisition Scheme and a portion of the Senior Executive Annual Incentive, the recipient agrees to purchase (or have purchased for them) shares on-market, but receives a cash amount. A provision for the amount payable under the Annual Incentive Plans is recognised on the Balance Sheet.
For the Investment Team Long Term Incentive Plan, the incentives are based on the performance of the Group and investment companies to which the Group provides administration services over a four-year period. The incentives may be settled in shares (but based on a cash amount) or cash. Historically, all awards have been cash. Expenses are recognised over the four-year assessment period based on the amount expected to be payable under this plan, resulting in a provision for incentive payable being built up on the Balance Sheet over the assessment period.
Under the Senior Executive Long Term Incentive Plan which was introduced for the year ended 30 June 2013, the amount awarded is represented by performance shares. The 30-day Volume Weighted Average Price (VWAP) of AFIC shares up to but not including 1 July is calculated. The amount of ELTIP available is then divided by this 30-day VWAP price to determine the number of performance shares that may vest at the vesting point in four years’ time. The value of each performance shares will be adjusted by the accumulation return on the AFI share price (being the movement in the share price assuming the reinvestment of any dividends) up to vesting date, based on a final share price calculated on the 30-day VWAP price up to 30 June. No shares vested during the year ended 30 June 2018.
The expense will be charged directly through the Income Statement in the following manner – 25 per cent of the total estimated cost in Year 1, 50 per cent of the total estimated cost in Year 2 less the expense charged in Year 1, 75 per cent of the total estimated cost in Year 3 less the expense charged in Years 1 and 2 and 100 per cent of the total estimated cost in Year 4 less the expense charged in Years 1, 2 and 3.
Directors’ Retirement Allowances
The Group recognises as ‘amounts payable’ Directors’ retirement allowances that have been crystallised. No further amounts will be expensed as retirement allowances.
Administration Fees
The Group currently provides administrative services to other listed investment companies. The associated fees are recognised on an accruals basis as income throughout the year. Any amounts outstanding at balance date are recognised as receivable, subject to the assessment of recoverability by the Directors.
56
Australian Foundation Investment Company Limited Annual Report 2018
For
per
sona
l use
onl
y

Operating Leases
The Group currently has an operating lease in respect of its premises. Payments made under operating leases are charged to the Income Statement on a straight-line basis over the period of the lease.
Rounding of Amounts
AFIC is a company of the kind referred to in the ASIC Corporations (Rounding in Financial/Directors’ Reports) Instrument 2016/191, relating to the ‘rounding off’ of amounts in the Financial Report. Amounts in the Financial Report have been rounded off in accordance with that Instrument, to the nearest thousand dollars, or in certain cases, to the nearest dollar.
F5. Performance Bond
The Group’s subsidiary, AICS, has under the terms of its Australian Financial Services Licence in place a performance bond to the sum of $20,000 underwritten by the Commonwealth Bank of Australia in favour of the Australian Securities and Investments Commission (ASIC), payable on demand to ASIC. F6. Share Based PaymentsShare Based Payments
The Group has a number of share incentive arrangements. These are accounted for in accordance with Note F4. Where shares are issued to employees of AICS, AICS compensates AFIC for the fair value of the shares.
(a) Executive Incentive Plans
The Executives’ remuneration arrangements incorporate an ‘at risk’ component as set out in the Remuneration Report. Part of this ‘at risk’ component is paid in shares in the Group.
(i) Senior Executive Annual Incentive Plan
Each financial year, the Remuneration Committee sets the target (cash) amount of remuneration that could be paid should all performance targets and measures be achieved. If all are achieved, 100 per cent of the remuneration will be awarded. If stretch levels of performance are achieved above target, then higher amounts may be paid. On the other hand there is no set minimum that will be paid regardless of performance.
The performance measures are a combination of the performance of the Group, the investment companies to which the Group provides administration services, and personal objectives.
All of the incentive remuneration awarded is paid in cash, with 50 per cent of the after-tax amount being used by the Executive to purchase shares. All remuneration under the plan, is paid in the financial year following the year of assessment.
The Executive agrees to the shares being subject to being held for two years (holding term), during which they cannot be sold. Dividends are paid to Executives on these shares prior to the expiry of the holding term. Should an Executive leave the Group before the holding term expires, the restriction will be lifted.
10,706 shares (2017: 14,331 shares) were purchased by Executives in the year (in relation to the prior year) with a fair value (being the acquisition price) of $64,277 (2017: $80,048).
(ii) Senior Executive Long Term Incentive Plan
Under the Senior Executive Long Term Incentive Plan, the amount awarded will be represented by Performance Rights. The 30-day Volume Weighted Average Price (VWAP) of AFIC shares up to but not including 1 July will be calculated. The amount of ELTIP available will then be divided by this 30-day VWAP price to determine the number of Performance Rights that may vest at the vesting point in four years’ time. The value of each Performance Right will be adjusted by the accumulation return on the AFI share price (being the movement in the share price assuming the reinvestment of any dividends) up to vesting date, based on a final share price calculated on the 30-day VWAP price up to 30 June.
The estimated fair value of the award will be calculated in accordance with AASB 2 – Share Based Payments at the end of each year until the final year of vesting. The liability shown after the final year of vesting will represent the actual amount being paid to eligible employees as a cash-settled share-based payment.
68,098 rights were awarded under the plan during the year ended 30 June 2018 (2017: 69,704). An expense of $481,768 (2017: $437,634) was incurred for the 2014/15, 2015/16, 2016/17 and 2017/18 plans. 64,081 rights under the 2013/14 plan were forfeited during the year.
57
Australian Foundation Investment Company Limited Annual Report 2018
For
per
sona
l use
onl
y

Additional Information continued
(iii) Investment Team Long Term Incentive Plan
Similar to the Annual Incentive Plans, a target cash amount of long term incentive is set each year in respect of that year, which will vest in four years’ time. The percentage of this target that ultimately vests four years after the award depends on the gross return of the Group and the investment companies it provides administration services to.
The amount that vests will be paid in cash or shares (purchased on-market at that time, based on the cash amount that vests) at the discretion of the Group.
$52,563 vested in the period (2017: $140,114) and was paid in cash.
(b) Employee Share Acquisition Scheme
Under the current Employee Share Acquisition Scheme, each employee who is not a participant in the Senior Executive or Investment Team Incentive Plans is awarded $5,000 per annum. After PAYG is deducted, $2,500 is used to buy shares in the Company which need to be held for three years. After three years, or the departure of the employee from employment with the Group, the shares come out of the holding lock. In addition, each employee is eligible for an additional award of up to $5,000. 50 per cent of the amount awarded is used to buy shares in one of the other LICs that AICS provides services to. The amount that is awarded is dependent on the metrics used for the vesting of the Investment Team’s Short Term Incentive (excluding personal measures). During the year, 48.4 per cent of the possible maximum was awarded, and 50 per cent of this was used to buy shares in AMCIL Limited.
(c) Expenses Arising From Share Based Payment Transactions
Total expenses arising from share based payment transactions recognised during the period as part of the employee benefit expense (excluding any reversals and the Investment Team Long Term Incentive Plan) were as follows:
2018$’000
2017$’000
Share-based payment expense 534 498
(d) Liability
The total liability arising from share based payment transactions is included in the current and non-current liabilities for ‘provisions’.
F7. Lease Commitments
The Group has entered into a non-cancellable operating lease for the use of its premises for seven years. Current commitment relating to leases at balance date, for the current lease (including GST), is:
2018$’000
2017$’000
Due within one year 667 667Later than one year but less than five 2,001 2,669Greater than five years - -
2,668 3,336
F8. Principles of Consolidation
AFIC’s consolidated financial statements consist of the financial statements of AFIC, the parent, and its subsidiary, Australian Investment Company Services Ltd (AICS). 25 per cent of AICS is owned by Djerriwarrh Investments Ltd, another investment company for which AICS performs operational and investment administration services, and for which it is paid monthly.
No subsidiaries were acquired or disposed of during the year. Intercompany transactions and balances between AFIC and AICS are eliminated on consolidation.
The financial information for the parent entity, disclosed in F10 below, has been prepared on the same basis as the consolidated financial statements. All notes are for the consolidated group unless specifically noted otherwise.
58
Australian Foundation Investment Company Limited Annual Report 2018
For
per
sona
l use
onl
y

F9. Subsidiaries
The consolidated financial statements incorporate the assets, liabilities and results of the following subsidiaries:
Equity Holding
Name of Entity Country of Incorporation Class of Shares 2018 2017Australian Investment Company Services Ltd Australia Ordinary 75% 75%
The investment in AICS is accounted for at cost in the individual financial statements of AFIC.
F10. Parent Entity Financial InformationSummary Financial Information
The individual financial statements for the parent entity show the following aggregate amounts:
2018$’000
2017 $’000
Balance sheetCurrent assets 162,696 150,696Total assets 7,450,206 6,941,111
Current liabilities 15,607 8,612Total liabilities 1,113,655 977,124
Shareholders’ equityIssued capital 2,811,721 2,756,256
ReservesRevaluation reserve 2,422,568 2,123,209Realised capital gains reserve 448,892 430,912General reserve 23,637 23,637Retained earnings 629,733 629,973
3,524,830 3,207,731
Total shareholders’ equity 6,336,551 5,963,987
Profit or loss for the year 277,815 247,216
Total comprehensive income 595,154 592,814
59
Australian Foundation Investment Company Limited Annual Report 2018
For
per
sona
l use
onl
y

In the Directors’ opinion:
(1) the financial statements and notes set out on pages 37 to 59 are in accordance with the Corporations Act 2001 including:
(a) complying with the Accounting Standards, the Corporations Regulations 2001 and other mandatory professional reporting requirements; and
(b) giving a true and fair view of the entity’s financial position as at 30 June 2018 and of its performance for the financial year ended on that date; and
(2) there are reasonable grounds to believe that the Company will be able to pay its debts as and when they become due and payable.
Note F4 to the financial statements confirms that the financial statements also comply with International Financial Reporting Standards as issued by the International Accounting Standards Board.
This declaration is made in accordance with a resolution of the Directors.
This declaration has been made after receiving the declarations required to be made to the Directors by the Managing Director and the Chief Financial Officer regarding the financial statements in accordance with Section 295A of the Corporations Act 2001 for the financial year ended 30 June 2018. The declarations received were that, in the opinion of the Managing Director and the Chief Financial Officer to the best of their knowledge, the financial records of the Company have been properly maintained, that the financial statements comply with accounting standards and that they give a true and fair view.
Terrence Campbell AOChairman
Melbourne23 July 2018
DIRECTORS’ DECLARATION
60
Australian Foundation Investment Company Limited Annual Report 2018
For
per
sona
l use
onl
y

INDEPENDENT AUDIT REPORT
61
Australian Foundation Investment Company Limited Annual Report 2018
For
per
sona
l use
onl
y

Independent Audit Report continued
62
Australian Foundation Investment Company Limited Annual Report 2018
For
per
sona
l use
onl
y

63
Australian Foundation Investment Company Limited Annual Report 2018
For
per
sona
l use
onl
y

Independent Audit Report continued
64
Australian Foundation Investment Company Limited Annual Report 2018
For
per
sona
l use
onl
y

65
Australian Foundation Investment Company Limited Annual Report 2018
For
per
sona
l use
onl
y

At 31 July 2018 there were 130,615 holdings of ordinary shares. These holdings were distributed in the following categories:
Size of Holding Shareholdings1 to 1,000 40,1191,001 to 5,000 43,7125,001 to 10,000 20,11810,001 to 100,000 25,628100,000 and over 1,038Total 130,615
Percentage held by the 20 largest holders 5.49%Average shareholding 9,081
There were 2,640 shareholdings of less than a marketable parcel of $500 (79 shares).
Voting Rights of Ordinary SharesThe Constitution provides for votes to be cast:
(i) on a show of hands, one vote for each shareholder; and
(ii) on a poll, one vote for each fully paid ordinary share.
OTHER INFORMATION
Information About Shareholders
66
Australian Foundation Investment Company Limited Annual Report 2018
For
per
sona
l use
onl
y

Major ShareholdersThe 20 largest registered holdings of ordinary shares as at 31 July 2018 are listed below:
Ordinary SharesShareholder Name Shares Held % Held HSBC Custody Nominees (Australia) Limited 9,463,194 0.80IOOF Investment Management Limited <IPS Super A/C> 6,001,471 0.51Nulis Nominees (Australia) Limited <Navigator Mast Plan Sett A/C> 5,890,051 0.50Citicorp Nominees Pty Limited 5,083,717 0.43Bougainville Copper Limited 5,027,734 0.42Navigator Australia Ltd <MLC Investment Sett A/C> 4,544,893 0.38Custodial Services Limited <Beneficiaries Holding A/C> 3,100,552 0.26Trustees of The Redemptorist Fathers 2,878,000 0.24Netwealth Investments Limited <Wrap Services A/C> 2,678,348 0.23Bushways Pty Ltd 2,570,592 0.22Investment Custodial Services Limited <C A/C> 2,540,164 0.21Investment Custodial Services Limited <C A/C> 2,210,561 0.19J P Morgan Nominees Australia Limited 2,160,945 0.18Kalymna Pty Ltd 1,852,186 0.16IOOF Investment Management Limited <IPS IDPS A/C> 1,803,449 0.15Peter & Lyndy White Foundation Pty Ltd <P & L White Foundation A/C> 1,725,072 0.15Twibill Pty Ltd 1,443,216 0.12Netwealth Investments Limited <Super Services A/C> 1,396,842 0.12Australian Executor Trustees Limited <No 1 Account> 1,382,518 0.12The Winston Churchill Memorial Trust 1,369,720 0.12
67
Australian Foundation Investment Company Limited Annual Report 2018
For
per
sona
l use
onl
y

Acquisitions Cost
$’000Macquarie Group 105,902CSL 48,838Sydney Airport 47,044Boral 41,944Unibail-Rodamco* (takeover of Westfield Corporation) 36,078Sonic Healthcare 35,347James Hardie Industries 29,605NEXTDC* 28,558Reliance Worldwide (includes $10.91 million in 1 for 1.98 issue at $4.15 per share) 27,188Alumina 24,308Carsales.com 22,962Reece (includes $10.56 million in 1 for 11 issue and placement at $9.30 per share) 20,903Qantas Airways* 20,637
Disposals Proceeds
$’000Incitec Pivot# 79,970Westfield Corporation# (taken over by Unibail-Rodamco) 70,902Healthscope 57,338Coca-Cola Amatil# 43,656QBE Insurance 34,096Tox Free Solutions# (taken over by Cleanaway Waste Management) 30,592Vicinity Centres 29,826AMP 28,171Japara Healthcare# 26,928Telstra 24,288Treasury Wine Estates 23,782
* New holding in the portfolio.
# Complete disposal from the portfolio.
New Companies Added to the Investment Portfolio
Unibail-Rodamco-Westfield NEXTDC Qantas Airways Cleanaway Waste Management Adelaide BrightonAUB GroupGoodman Group
Major Transactions in the Investment Portfolio
68
Australian Foundation Investment Company Limited Annual Report 2018
For
per
sona
l use
onl
y

The Company participated as a sub-underwriter in the following transaction during the year:
Company Underwritten By Description Amount UnderwrittenCleanaway Waste Management Limited
Macquarie Capital (Australia) Limited
$590 million 1 for 3.65 pro rata accelerated non-renounceable entitlement offer
$4,494,082
The Company has not been notified of any substantial shareholders.
Sub-underwriting
Substantial Shareholders
69
Australian Foundation Investment Company Limited Annual Report 2018
For
per
sona
l use
onl
y

During the year ended 30 June 2018, the Company recorded 1,332 transactions in securities. $3,692,889 in brokerage (including GST) was paid or accrued for the year.
Transactions in Securities
70
Australian Foundation Investment Company Limited Annual Report 2018
For
per
sona
l use
onl
y

Individual investments for the combined investment and trading portfolios as at 30 June 2018 are listed below. The list should not, however, be used to evaluate portfolio performance or to determine the net asset backing per share at other dates. Net asset backing is advised to the Australian Securities Exchange each month and is recorded on the toll free telephone service at 1800 780 784 and posted to AFIC’s website site afi.com.au
Individual holdings in the portfolios may change during the course of the year. In addition, holdings which are part of the trading portfolio may be subject to call options or sale commitments by which they may be sold at a price significantly different from the market price prevailing at the time of the exercise or sale.
Code Ordinary Shares, Trust Units or Stapled Securities
Number Held 2017 ’000
Number Held 2018’000
Market Value 2018$’000
ABC Adelaide Brighton 0 1,720 11,954AGL AGL Energy 4,465 4,305 96,776AIA Auckland International Airport 1,770 1,770 11,027ALQ ALS 9,205 8,500 64,090ALU Altium 625 625 14,069AMC Amcor 12,300 12,527 180,517AMP AMP 20,100 12,910 45,961ANN Ansell 1,284 1,284 34,908ANZ Australia and New Zealand Banking Group 8,488 8,488 239,693APA APA Group 5,075 4,040 39,794APE AP Eagers 1,404 1,404 11,976ARB ARB Corporation 1,198 1,198 27,352ASX ASX 709 709 45,632AUB AUB Group 0 729 9,904AWC* Alumina 5,513 15,048 40,433BGA Bega Cheese 2,873 2,873 21,287BHP* BHP 14,118 14,091 477,690BKW Brickworks 1,503 1,503 23,506BLD Boral 4,008 9,660 63,080BXB Brambles 13,442 12,139 107,791CAR Carsales.com 1,520 3,177 48,034CBA Commonwealth Bank of Australia 7,900 7,900 575,673CGF Challenger 4,265 5,548 65,631COH Cochlear 124 137 27,423CPU Computershare 4,660 4,660 85,884CSL* CSL 1,739 1,943 372,576CTX Caltex Australia 669 769 25,026CVW ClearView Wealth 6,179 6,179 7,168CWY Cleanaway Waste Management 0 7,736 13,074CYB* CYBG PLC 5,124 7,818 43,550DJW Djerriwarrh Investments 7,505 7,505 25,368DLX DuluxGroup 2,556 3,029 23,171DUI Diversified United Investment 12,030 12,030 49,324EQT EQT Holdings 1,303 1,303 27,107
Holdings of Securities At 30 June 2018
71
Australian Foundation Investment Company Limited Annual Report 2018
For
per
sona
l use
onl
y

Holdings of Securities continued
At 30 June 2018
Code Ordinary Shares, Trust Units or Stapled Securities
Number Held 2017 ’000
Number Held 2018’000
Market Value 2018$’000
EVT Event Hospitality and Entertainment 1,030 1,030 13,795FLT Flight Centre Travel Group 241 193 12,313FNP Freedom Foods Group 4,507 6,011 40,455FPH Fisher and Paykel Healthcare Corporation 5,008 4,400 60,192GMG Goodman Group 0 1,000 9,620HSO Healthscope 26,700 4,000 8,840IAG Insurance Australia Group 6,066 4,976 42,447ICQ iCar Asia 22,030 20,156 4,737IEL IDP Education 880 880 9,246ILU Iluka Resources 3,642 2,367 26,463IRE IRESS 3,737 4,024 48,455IVC InvoCare 1,150 1,325 18,206JHX James Hardie Industries 3,111 4,050 91,854LIC Lifestyle Communities 5,470 5,470 32,002LNK Link Administration Holdings 3,396 3,200 23,456MFT Mainfreight 2,840 2,990 76,155MIR Mirrabooka Investments 8,728 8,728 23,478MLT Milton Corporation 10,841 10,841 49,979MPL Medibank Private 2,000 2,000 5,840MQG* Macquarie Group 700 1,680 206,396NAB National Australia Bank 9,969 9,342 256,066NVT Navitas 3,678 3,678 16,328NXT NEXTDC 0 4,180 31,601ORA Orora 12,864 11,670 41,663ORG* Origin Energy 6,000 6,500 64,833ORI Orica 2,712 2,712 48,131OSH Oil Search 16,483 16,483 146,694PPT Perpetual 1,061 1,061 44,142QAN Qantas Airways 0 3,250 20,020QBE QBE Insurance Group 7,874 4,355 42,418QUB Qube Holdings 34,962 34,962 84,258REA REA Group 384 384 34,891REH Reece 318 3,621 45,803RHC Ramsay Health Care 1,415 1,415 76,382RIO Rio Tinto 3,652 3,457 288,441RMD ResMed 3,935 3,935 55,484RWC Reliance Worldwide Corporation 2,400 8,600 46,096S32 South32 15,241 15,241 55,020SCG Scentre Group 12,950 15,650 68,704
72
Australian Foundation Investment Company Limited Annual Report 2018
For
per
sona
l use
onl
y

Code Ordinary Shares, Trust Units or Stapled Securities
Number Held 2017 ’000
Number Held 2018’000
Market Value 2018$’000
SEK* Seek 3,315 3,595 77,889SHL Sonic Healthcare 1,841 3,342 81,982SOL Washington H Soul Pattinson 1,709 1,709 35,350SUN* Suncorp Group 3,770 4,390 63,954SYD* Sydney Airport 8,500 15,000 107,262TCL Transurban Group 18,335 19,822 237,268TGG Templeton Global Growth Fund 12,106 9,685 13,752TLS Telstra Corporation 52,445 44,000 115,280TPM TPG Telecom 6,228 6,500 33,605TWE Treasury Wine Estates 6,882 5,459 94,932URW Unibail-Rodamco-Westfield 0 2,472 36,263VCX Vicinity Centres 16,378 4,700 12,173WBC Westpac Banking Corporation 15,545 15,545 455,469WES Wesfarmers 6,723 6,723 331,823WOW* Woolworths Group 5,065 5,732 174,616WPL Woodside Petroleum 3,283 3,648 129,346XRO Xero 437 741 33,330Total 7,261,645
* Part of the security was subject to call options written by the Company.
Code Convertible Notes, Preference Shares and Other Interest-bearing Securities
Number Held 2017 ’000
Number Held 2018 ’000
Market Value 2018 $’000
RHCPA Ramsay Health Care Convertible Adjustable Rate Equity Securities 115 115 12,304Total 12,304
73
Australian Foundation Investment Company Limited Annual Report 2018
For
per
sona
l use
onl
y

Date of Issue Type Price Remarks23 February 2018 DRP/DSSP* $6.1130 August 2017 DRP/DSSP* $5.9224 February 2017 DRP/DSSP* $5.8430 August 2016 DRP/DSSP* $5.58 2.5 per cent discount19 February 2016 DRP/DSSP* $5.43 2.5 per cent discount25 November 2015 SPP $5.51 5.0 per cent discount28 August 2016 DRP/DSSP* $6.03 2.5 per cent discount20 February 2015 DRP/DSSP* $5.97 2.5 per cent discount6 October 2014 SPP $5.88 2.5 per cent discount29 August 2014 DRP/DSSP* $5.93 2.5 per cent discount21 February 2014 DRP/DSSP* $5.86 2.5 per cent discount30 August 2013 DRP/DSSP* $5.64 2.5 per cent discount.
DSSP = Dividend Substitution Share Plan 22 February 2013 DRP $5.3731 August 2012 DRP $4.3624 February 2012 DRP $4.2619 December 2011 Convertible notes $100 face value Mature 28 February 2017. Interest rate 6.25 per cent
per annum. Conversion price: $5.086431 August 2011 DRP $4.1825 February 2011 DRP $4.72 2.5 per cent discount1 September 2010 DRP $4.65 2.5 per cent discount2 June 2010 SPP $4.62 2.5 per cent discount. SPP = Share Purchase Plan26 February 2010 DRP $4.82 5.0 per cent discount1 September 2009 DRP $4.69 5.0 per cent discount2 March 2009 DRP $3.72 5.0 per cent discount25 August 2008 DRP $4.9811 April 2008 SAP $5.2627 February 2008 DRP $5.26 5.0 per cent discount 22 August 2007 DRP $5.788 March 2007 DRP $5.60
Issues of Securities
74
Australian Foundation Investment Company Limited Annual Report 2018
For
per
sona
l use
onl
y

Date of Issue Type Price Remarks
22 December 2006 SAP $4.9023 August 2006 DRP $4.707 March 2006 DRP $4.554 November 2005 SAP $3.9623 August 2005 DRP $3.9018 March 2005 DRP $3.6819 August 2004 DRP $3.29 12 March 2004 DRP $3.29 22 October 2003 1 for 8 rights issue $3.00 15 August 2003 DRP $3.47 16 April 2003 SAP $3.04 7 March 2003 DRP $3.11 14 August 2002 DRP $3.11 5 April 2002 SAP $3.167 March 2002 DRP $3.24 15 August 2001 DRP $3.08 29 June 2001 DRP $2.87 7 March 2001 DRP $2.56 16 August 2000 DRP $2.47 7 March 2000 DRP $2.64 11 August 1999 DRP $2.95 12 April 1999 SAP $2.54 SAP = Share Acquisition Plan15 March 1998 DRP $2.79 4 September 1998 DRP $2.43 DRP = Dividend Reinvestment Plan
Note for issues of securities in earlier years please consult the Company’s website, afi.com.au or via telephone (03) 9650 9911.
* Note that for the shares issued under the DSSP, the price shown is the indicative price used to determine the number of shares issued to participants. Shares issued under the DSSP are issued at nil cost. Shareholders who sell shares issued under the DSSP should consult their tax adviser as to the correct treatment of such sales for taxation purposes.
75
Australian Foundation Investment Company Limited Annual Report 2018
For
per
sona
l use
onl
y
Australian Foundation Investment Company Limited (AFIC)ABN 56 004 147 120
DirectorsTerrence A Campbell AO, ChairmanRobert M Freeman, Managing DirectorRoss E BarkerJacqueline C HeyGraeme R LiebeltJohn PatersonDavid A PeeverCatherine M Walter AMPeter J Williams
Company SecretariesMatthew J RoweAndrew JB Porter
AuditorPricewaterhouseCoopersChartered Accountants
Country of IncorporationAustralia
Registered Office and Mailing AddressLevel 21, 101 Collins StreetMelbourne Victoria 3000
Contact Details Telephone (03) 9650 9911Facsimile (03) 9650 9100Website afi.com.auEmail [email protected]
For enquiries regarding net asset backing (as advised each month to the Australian Securities Exchange):
Telephone 1800 780 784 (toll free)
Share Registrar AustraliaComputershare Investor Services Pty LtdYarra Falls, 452 Johnston StreetAbbotsford Victoria 3067
New ZealandComputershare Investor Services Limited159 Hurstmere RoadTakapuna Auckland 0622
Shareholder Enquiry Line 1300 662 270 0800 333 501 (within New Zealand) +61 3 9415 4373 (from overseas)Facsimile (03) 9473 2500Website investorcentre.com/au/contact
For all enquiries relating to shareholdings, noteholdings, dividends and related matters, please contact the share registrar as above.
Australian and New Zealand Securities Exchange CodesAFI Ordinary shares (ASX and NZX)
Company Particulars
76
Australian Foundation Investment Company Limited Annual Report 2018
For
per
sona
l use
onl
y

Shareholder Meetings
Australia
Annual General Meeting Time 10.00amDate Tuesday 9 October 2018Venue ZINC Function CentreLocation Corner of Swanston Street and Flinders Street Melbourne
Sydney Shareholder MeetingTime 10.00amDate Monday 15 October 2018Venue Four Seasons HotelLocation 199 George Street Sydney
Adelaide Shareholder MeetingTime 10.00am Date Friday 19 October 2018Venue Adelaide Convention CentreLocation Panorama Rooms, North Terrace Adelaide
Brisbane Shareholder MeetingTime 10.00am Date Monday 22 October 2018Venue Brisbane Hilton HotelLocation 190 Elizabeth Street Brisbane
New Zealand
Auckland Shareholder MeetingTime 10.00amDate Monday 3 December 2018Venue Hilton HotelLocation 147 Quay Street Auckland
77
Australian Foundation Investment Company Limited Annual Report 2018
For
per
sona
l use
onl
y

Design: MDM Investorcom Printed on environmentally friendly paper
For
per
sona
l use
onl
y

Annual Review 2018
90YEARS OF INVESTMENTEXPERIENCE
For
per
sona
l use
onl
y

Contents
2 5 Year Summary
4 About the Company
6 Review of Operations and Activities
16 Top 25 Investments
17 Income Statement
18 Balance Sheet
19 Summarised Statement of Changes in Equity
20 Holdings of Securities
26 Major Transactions in the Investment Portfolio
28 Company Particulars
29 Shareholder Meetings
Australian Foundation Investment Company is a listed investment company investing in Australian and New Zealand equities.
This year marks the 90th anniversary of the establishment of AFIC in 1928.
1
Australian Foundation Investment Company Limited Annual Review 2018Australian Foundation Investment Company Limited ABN 56 004 147 120
For
per
sona
l use
onl
y

Year in Summary
Profit for the Year
$279.0mUp 13.7% from 2017
Fully Franked Dividend
14¢ Final
Same as 2017
24¢Total
10.8%S&P/ASX 200 Accumulation Index +13.0%
Total Portfolio Return
Total Shareholder Return
10.3%Share price plus dividend
0.14%0.14% in 2017
Management Expense Ratio
Total Portfolio
$7.4bIncluding cash at 30 June$6.9 billion in 2017
1
Australian Foundation Investment Company Limited Annual Review 2018Australian Foundation Investment Company Limited ABN 56 004 147 120
For
per
sona
l use
onl
y

279.
020
18
Net Profit After Tax ($ Million)
254.
320
14
293.
620
15
265.
820
16
245.
320
17
23.6
2018
Net Profit Per Share (Cents)
24.4
2014
27.2
2015
23.8
2016
21.3
2017
2420
18
Dividends Per Share (Cents)(b)
2220
14
2320
15
2420
16
2420
17
7,27
420
18
Investments at Market Value ($ Million)(a)
6,32
420
14
6,41
420
15
6,25
020
16
6,79
020
17
627.
020
18
Net Asset Backing Per Share(Cents)(c)
584.
520
14
585.
120
15
550.
420
16
589.
520
17
129,
948
2018
Number of Shareholders(30 June)
103,
188
2014
107,
622
2015
113,
482
2016
119,
463
2017
5 Year Summary
3
Australian Foundation Investment Company Limited Annual Review 2018
2
Australian Foundation Investment Company Limited Annual Review 2018
For
per
sona
l use
onl
y

279.
020
18
Net Profit After Tax ($ Million)
254.
320
14
293.
620
15
265.
820
16
245.
320
17
23.6
2018
Net Profit Per Share (Cents)
24.4
2014
27.2
2015
23.8
2016
21.3
2017
2420
18
Dividends Per Share (Cents)(b)
2220
14
2320
15
2420
16
2420
17
7,27
420
18
Investments at Market Value ($ Million)(a)
6,32
420
14
6,41
420
15
6,25
020
16
6,79
020
17
627.
020
18
Net Asset Backing Per Share(Cents)(c)
584.
520
14
585.
120
15
550.
420
16
589.
520
17
129,
948
2018
Number of Shareholders(30 June)
103,
188
2014
107,
622
2015
113,
482
2016
119,
463
2017
Notes
(a) Excludes cash.
(b) All dividends were fully franked. The LIC attributable gain attached to the dividend was: 2018: 2.86 cents, 2017: nil, 2016: 2.1 cents, 2015: 7.1 cents, 2014: nil.
(c) Net asset backing per share based on year-end data before the provision for the final dividend. The figures do not include a provision for capital gains tax that would apply if all securities held as non-current investments had been sold at balance date as Directors do not intend to dispose of the portfolio.
3
Australian Foundation Investment Company Limited Annual Review 2018
2
Australian Foundation Investment Company Limited Annual Review 2018
For
per
sona
l use
onl
y

Australian Foundation Investment Company (AFIC) is a listed investment company investing in Australian and New Zealand equities.
Investment ObjectivesThe Company aims to provide shareholders with attractive investment returns through access to a growing stream of fully franked dividends and growth in capital invested.
The Company’s primary investment goals are:
• to pay dividends which, over time, grow faster than the rate of inflation; and
• to provide attractive total returns over the medium to long term.
Approach to InvestingThe investment philosophy is built on taking a medium to long-term view on companies in a diversified portfolio with an emphasis on identifying quality companies that are likely to sustainably grow their earnings and dividends over this time frame.
Quality in this context is an outcome of our assessment of the board and management as well as some key financial metrics such as the level of gearing in the balance sheet, product margins and free cash flow. The structure of the industry and a company’s competitive position in this industry is also an important indicator of quality. Linked to this assessment of quality is the ability of companies to grow earnings over time, which ultimately should produce good dividend growth.
Recognising value is also an important aspect of sound long-term investing. Short-term measures such as the price earnings ratio, price to book or price to sales may be of some value, but aren’t necessarily strong predictors of future performance. Our assessment of value tries to capture the opportunity a business has to prosper and thrive over the medium to long term.
In building the investment portfolio in this way, we believe we can offer investors a well-diversified portfolio of high-quality companies that is intended to deliver total returns ahead of the Australian equity market and with less volatility over the long term.
About the Company
How AFIC Invests – What We Look For in Companies
Quality First
GrowthIncluding dividends
Value
A portfolio that is activelymanaged to achieve long-term
capital and dividend growth
5
Australian Foundation Investment Company Limited Annual Review 2018
4
Australian Foundation Investment Company Limited Annual Review 2018
For
per
sona
l use
onl
y

The Company also uses options written against a small proportion of its investments and a small trading portfolio to generate additional income.
From time to time, some borrowings may be used where potential investment returns justify the use of debt. This is managed within very conservative limits, as determined by the Board.
AFIC is managed for the benefit of its shareholders with fees based on the recovery of costs rather than as a fixed percentage of the portfolio. There are no performance fees. As a result, the benefit of scale over time results in a very low expense ratio for investors. For the 12 months to 30 June 2018 this was 0.14 per cent (annualised), or 14 cents for each $100 invested.
5
Australian Foundation Investment Company Limited Annual Review 2018
4
Australian Foundation Investment Company Limited Annual Review 2018
For
per
sona
l use
onl
y

Profit and DividendFull year profit of $279.0 million was up 13.7 per cent from $245.3 million in the corresponding period last year. Investment income increased $31.5 million (up 11.6 per cent), due primarily to a lift in dividends across a range of companies, particularly resource companies, including participation in the Rio Tinto off-market buy-back. Finance costs were also down $8.1 million following the conversion or redemption of convertible notes in February 2017.
Earnings per share were 23.6 cents, up from 21.3 cents. The final dividend was maintained at 14 cents per share fully franked, bringing total dividends for the year to 24 cents per share fully franked, the same as last year. Two cents of the final dividend are sourced from taxable capital gains, on which the Company has paid or will pay tax. The amount of the pre tax attributable gain on this portion of the dividend, known as an ‘LIC capital gain’, is therefore 2.86 cents. This enables some shareholders to claim a tax deduction in their tax return.
Market and Portfolio PerformanceThe return of the market over the year was characterised by a pronounced divergence of performance across sectors and companies. Ongoing growth across global economies, in particular the United States and China, led to rising commodity prices, with the Australian resources index
up 41 per cent over the 12-month period (represented by energy and materials in Figure 1). Within this growth, the small and mid cap resource sectors were up 49 per cent and 42 per cent respectively. However, during the same period the industrial sector was up only 8 per cent, whilst the banking sector fell just over 1 per cent.
Furthermore, in an environment where many large companies are facing subdued growth, there has been an increased flow of funds into the small and mid cap section of the market. This has pushed these sectors higher relative to the S&P/ASX 50, which represents larger companies in the market (Figure 2). This has also seen very strong share price performance in those small companies with the strongest growth expectations, primarily through a re-rating of valuations (Figure 3 on page 8).
AFIC’s portfolio was up 10.8 per cent for the 12 months to 30 June 2018 compared with the S&P/ASX 200 Accumulation Index which increased 13.0 per cent (Figure 4 on page 9). In the resources sector AFIC’s primary exposure is to companies with long-life assets and low-cost production such as BHP and Rio Tinto, rather than the more cyclical small and mid-sized companies.
The best performing companies in the AFIC portfolio outside the large resource companies were CSL, Wesfarmers, Macquarie Group, Oil Search and Woolworths.
Review of Operations and Activities
7
Australian Foundation Investment Company Limited Annual Review 2018
6
Australian Foundation Investment Company Limited Annual Review 2018
For
per
sona
l use
onl
y

Figure 2: Performance of Different Sectors of the Market by Company Size
S&P/ASX 50total return
S&P/ASX Mid Cap 50total return
S&P/ASX 200 Small Ordinaries total return
Source: FactSet
130
125
120
115
110
105
100
95
90
Inde
x
May 18
Apr 18
Mar 18
Feb 18
Jan 1
8
Dec 17
Jun 1
8
Nov 17
Oct 17
Sep 17
Aug 17
Jul 1
7
Jun 1
7
Figure 1: Performance of S&P/ASX 200 Companies Relative to the Energy and Materials Sectors
S&P/ASX 200 total return index
S&P/ASX 200 materials total return index
S&P/ASX 200 energy total return index
Source: FactSet
150
140
130
120
110
100
90
Inde
x
May 18
Apr 18
Mar 18
Feb 18
Jan 1
8
Dec 17
Jun 1
8
Nov 17
Oct 17
Sep 17
Aug 17
Jul 1
7
Jun 1
7
7
Australian Foundation Investment Company Limited Annual Review 2018
6
Australian Foundation Investment Company Limited Annual Review 2018
For
per
sona
l use
onl
y

Review of Operations and Activities continued
The long-term performance of the portfolio, which is more in line with the Company’s investment timeframes, was 6.5 per cent per annum for the 10 years to 30 June 2018 versus the Index return of 6.4 per cent per annum. Including the full benefit of franking, these returns are 8.5 per cent per annum for AFIC and 8.0 per cent per annum for the Index. AFIC’s portfolio performance numbers (Figure 4) are after costs and tax paid whereas the Index does not have expenses or tax.
Figure 5 illustrates the cumulative long term performance of the AFIC portfolio versus the S&P/ASX 200 Accumulation Index over the 10 years to 30 June 2018. It also includes the benefits of franking credits for both.
The share price was trading at a slight discount to the net asset backing (before tax on unrealised gains) at the end of June (Figure 6 on page 10) and is the reason the Dividend Reinvestment Plan did not have any discount associated with it.
Nevertheless, the share price return, including reinvestment of dividends, over the 12 months to 30 June 2108 was 10.3 per cent. Whilst the share price can often fluctuate between a premium and discount, over the long term the share price return is often very close to the portfolio return (Figure 4).
Figure 3: Price Earnings Ratio of Small Industrial Sector of the Australian Market
Source: FactSet
19.5
19
18.5
18
17.5
17
16.5
16
Tim
es
May 18
Apr 18
Mar 18
Feb 18
Jan 1
8
Dec 17
Jun 1
8
Nov 17
Sep 17
Oct 17
Aug 17
Jul 1
7
9
Australian Foundation Investment Company Limited Annual Review 2018
8
Australian Foundation Investment Company Limited Annual Review 2018
For
per
sona
l use
onl
y

Net asset per share growth plus dividends
Share price growth plus dividends
3 year return 5 year return
6.5%
6.5%
6.4%
10 year return
S&P/ASX 200 Accumulation Index
9.0
%
6.8%
4.4%
1 year return
8.2%
6.7%
10.0
%
10.8
%
13.0
%
10.3
%
Figure 4: Relative Portfolio and Share Price Performance – Per Annum Returns to 30 June 2018
Note assumes an investor can take full advantage of the franking credits. This chart calculates the benefit of franking creditsat the time dividends are paid for both AFIC and the Index. In practice there is a timing difference between receipt of thedividend and the realisation of the franking benefit in the following tax year.
Jun 1
7
Jun 1
8
Jun 0
8
Jun 0
9
Jun 1
0
Jun 1
1
Jun 1
2
Jun 1
3
Jun 1
4
Jun 1
5
Jun 1
6
$2,500
$2,000
$1,500
$1,000
$500
$0
AFIC Portfolio S&P/ASX 200 Accumulation Index
Figure 5: Growth in Investment of $1,000 (Including Benefit of Franking) − 10 Years to 30 June 2018
9
Australian Foundation Investment Company Limited Annual Review 2018
8
Australian Foundation Investment Company Limited Annual Review 2018
For
per
sona
l use
onl
y

Positioning the Portfolio for Long Term OpportunitiesA key restraint on the current Australian market is the prolonged, subdued growth outlook facing many large companies. This arises from their market positions with no further consolidation possible, increased competition and disruption, and greater regulatory intervention. AFIC has continued to adjust the portfolio to respond to this situation. Whilst larger companies continue to make up a significant proportion of the portfolio, AFIC has been increasing its holdings in a number of mid-sized and small companies with good growth prospects. This has been done having regard to balancing the need to grow
dividends as well as provide meaningful capital growth within the portfolio over the long term. Overall purchases in the investment portfolio for the year totalled $739.3 million with sales totalling $712.6 million, which is higher than last year.
Major purchases included adding to holdings in Macquarie Group, CSL, Sonic Healthcare, James Hardie Industries and Alumina, all of which have unique industry exposures in global markets, and Sydney Airport and Boral. Additions were also made to smaller companies, Reliance Worldwide and Reece, including participation in their respective capital raisings to fund offshore acquisitions, and Carsales.com.
Review of Operations and Activities continued
Figure 6: Share Price Premium/Discount to Net Asset Backing
Source: FactSet
Jun 1
8
Jun 0
8
Jun 1
0
Jun 1
2
Jun 1
4
Jun 1
6-10%
15%
0%
5%
10%
-5%
11
Australian Foundation Investment Company Limited Annual Review 2018
10
Australian Foundation Investment Company Limited Annual Review 2018
For
per
sona
l use
onl
y

Unibail-Rodamco-Westfield (which acquired Westfield Corporation through a scrip bid), NEXTDC and Qantas were the more significant new additions to the portfolio.
NEXTDC, which is a data centre operator, is an example of the type of company that AFIC is looking to add to the portfolio. It has a unique position in an industry that is likely to grow in excess of nominal economic growth. It is leveraged to the growth in the demand for cloud computing services as many businesses seek to outsource these services to companies with carrier neutral data centres that have greater scale and efficiencies. Given the investment required and the competitive advantage afforded by ownership of key sites, barriers to entry for this industry are high. NEXTDC currently operates five data centres in Melbourne, Sydney, Perth, Canberra and Brisbane and is in the process of building some additional new data centres in Sydney, Melbourne and Brisbane.
Major sales included the complete disposal of Incitec Pivot, Coca-Cola Amatil and Japara Healthcare. Westfield Corporation and Tox Free Solutions were sold because of takeovers. Other major sales included a small reduction in the positions of QBE Insurance, AMP, Telstra and Treasury Wine Estates, all of which have been long term holdings in the portfolio, and Vicinity Centres.
AFIC had 91 holdings in the portfolio at 30 June 2018. Whilst the S&P/ASX 200 Index can provide a useful point of
reference for investors, AFIC actively manages its investments. As a result, the portfolio will differ quite markedly from the Index. The following chart (Figure 7 on page 12) highlights the profile of AFIC’s portfolio by the various sectors of the market at the end of the financial year and how it differs from the Index.
The most notable change is the position of banks in the portfolio, which has declined over recent years relative to the market weight. Whilst banks continue to supply a large part of the dividend income, the outlook for growth relative to recent years, in our view, has diminished as credit for housing slows and competitive and regulatory pressures become greater. In addition, AFIC traditionally has not been a large investor in Property Trusts given the observation that over the long term industrial companies have tended to outperform Property Trusts and the distribution from these Trusts do not carry franking credits. The other major variation from the Index is in Consumer Discretionary, which includes gambling stocks.
A significant percentage of the AFIC portfolio, by value, remains exposed to the large companies in the Australian market. Nevertheless, there are a significant number of companies that sit outside of these, many of which we believe have the capacity to grow their business and dividends over time. This is outlined in Figure 8 on page 12, with 71 holdings outside of the S&P/ASX 20.
11
Australian Foundation Investment Company Limited Annual Review 2018
10
Australian Foundation Investment Company Limited Annual Review 2018
For
per
sona
l use
onl
y

Review of Operations and Activities continued
AFIC portfolio weight S&P/ASX 200 Index weight
Banks
Materia
ls
Indus
trial
Health
care
Consum
er
Staples Ene
rgy
Other
Financ
ials
21.3% 18.6% 12.1% 10.9% 9.9% 9.0%
Cash
1.3%5.4%
Telec
om
Service
s
2.0%
Inform
ation
Tech
nology
3.9%
Propert
y
Trusts
1.7%
Utilitie
s
1.9%
Consu
mer
Discret
ionary
2.0%
25%
20%
15%
10%
5%
0%
Figure 7: AFIC Investment by Sector versus the S&P/ASX 200 Index as at 30 June 2018
S&P/ASX 100 excluding 20 Leaders: 42 Holdings
Outside of S&P/ASX 200: 29 Holdings
S&P/ASX 20: 20 Holdings
61%28%
11%
Figure 8: AFIC Investment by Company Size – Percentage of the Portfolio by Value
13
Australian Foundation Investment Company Limited Annual Review 2018
12
Australian Foundation Investment Company Limited Annual Review 2018
For
per
sona
l use
onl
y

AFIC has been increasing its holdings in a number of mid-sized and small companies with good growth prospects.“ “
Australian Resources Index Up
41%
13
Australian Foundation Investment Company Limited Annual Review 2018
12
Australian Foundation Investment Company Limited Annual Review 2018
For
per
sona
l use
onl
y

Review of Operations and Activities continued
Going Forward The ongoing strength of the Australian market continues to create a challenging investment environment. In particular, the drive by investors towards companies displaying good growth prospects is pushing share prices for these businesses very high. In this context, high valuation levels at a time when interest rates are starting to move from very low levels may create some uncertainty for markets and therefore could then provide appropriate investment opportunities.
In addition, the geo-political environment remains unpredictable, with issues such as trade, leading concerns. Markets at this point have largely overlooked any potential implications given economic fundamentals appear sound across most large developed markets. However, the key implication for Australia is the impact any significant change to global trade through imposition of trade tariffs and retaliatory measures has on China, and the influence this has on the ongoing demand for Australian exports, particularly resources.
For AFIC, it is a matter of being alert but patient, and when appropriate, making adjustments to the portfolio over time that make sense as a long-term investor in quality and growing companies.
Directorship MattersAs previously announced in September 2017 and detailed in the Company’s Half-Yearly Review, Ross Barker retired as Managing Director and Chief Executive Officer (CEO) on 31 December 2017. Mark Freeman, who was previously the Chief Investment Officer of AFIC, became the Managing Director and CEO of AFIC on 1 January 2018.
The Board wishes to record its deep appreciation to Ross Barker for his 16 years of outstanding service as Managing Director and Chief Executive Officer and wish him well in his retirement. He has shown enduring leadership through this period and made a significant contribution to the growth in AFIC throughout his distinguished tenure at the Company. Mr Barker remains on the Board of AFIC as a Non-Executive Director.
15
Australian Foundation Investment Company Limited Annual Review 2018
14
Australian Foundation Investment Company Limited Annual Review 2018
For
per
sona
l use
onl
y

For AFIC, it is a matter of being alert but patient, and when appropriate, making adjustments to the portfolio over time that make sense as a long-term investor in quality and growing companies.
“”
Industrial Sector Up
8%
15
Australian Foundation Investment Company Limited Annual Review 2018
14
Australian Foundation Investment Company Limited Annual Review 2018
For
per
sona
l use
onl
y

Top 25 InvestmentsAs at 30 June 2018
Includes investments held in both the investment and trading portfolios.
Valued at Closing Prices at 30 June 2018
Total Value $ Million
% of thePortfolio
1 Commonwealth Bank of Australia 575.7 7.92 BHP* 477.7 6.63 Westpac Banking Corporation 455.5 6.34 CSL* 372.6 5.15 Wesfarmers 331.8 4.66 Rio Tinto 288.4 4.07 National Australia Bank 256.1 3.58 Australia and New Zealand Banking Group 239.7 3.39 Transurban Group 237.3 3.310 Macquarie Group* 206.4 2.811 Amcor 180.5 2.512 Woolworths Group* 174.6 2.413 Oil Search 146.7 2.014 Woodside Petroleum 129.3 1.815 Telstra Corporation 115.3 1.616 Brambles 107.8 1.517 Sydney Airport* 107.3 1.518 AGL Energy 96.8 1.319 Treasury Wine Estates 94.9 1.320 James Hardie Industries 91.9 1.321 Computershare 85.9 1.222 Qube Holdings 84.3 1.223 Sonic Healthcare 82.0 1.124 Seek* 77.9 1.125 Ramsay Health Care 76.4 1.1Total 5,092.6
As a percentage of total portfolio value (excludes cash) 70.0%
* Indicates that options were outstanding against part of the holding.
17
Australian Foundation Investment Company Limited Annual Review 2018
16
Australian Foundation Investment Company Limited Annual Review 2018
For
per
sona
l use
onl
y

2018$’000
2017 $’000
Dividends and distributions 302,389 270,887Revenue from deposits and bank bills 1,409 1,659Other revenue 22 83Net gains on trading portfolio (including unrealised gains or losses) 264 3,065Total income 304,084 275,694
Finance costs (848) (8,969)Administration expenses (net of recoveries) (9,852) (9,461)Profit before income tax 293,384 257,264
Income tax (14,377) (11,964)Net profit 279,007 245,300
Cents CentsNet profit per share 23.57 21.32
Income Statement For the Year Ended 30 June 2018
17
Australian Foundation Investment Company Limited Annual Review 2018
16
Australian Foundation Investment Company Limited Annual Review 2018
For
per
sona
l use
onl
y

2018$’000
2017$’000
Current assetsCash 99,183 105,125Receivables 77,234 52,011Total current assets 176,417 157,136
Non-current assetsInvestment portfolio 7,280,706 6,790,368Deferred tax assets 1,257 349Total non-current assets 7,281,963 6,790,717
Total assets 7,458,380 6,947,853
Current liabilitiesPayables 712 6,953Tax payable 8,245 1,980Borrowings – bank debt 100 -Trading portfolio 6,757 546Provisions 4,385 4,448Total current liabilities 20,199 13,927
Non-current liabilitiesProvisions 1,394 1,332Deferred tax liabilities – investment portfolio 1,097,527 967,091Total non-current liabilities 1,098,921 968,423
Total liabilities 1,119,120 982,350
Net assets 6,339,260 5,965,503
Shareholders’ equityShare capital 2,811,771 2,756,306Revaluation reserve 2,422,568 2,123,209Realised capital gains reserve 448,892 430,912General reserve 23,637 23,637Retained profits 632,392 631,439Total shareholders’ equity (including minority interests) 6,339,260 5,965,503
Balance SheetAs at 30 June 2018
19
Australian Foundation Investment Company Limited Annual Review 2018
18
Australian Foundation Investment Company Limited Annual Review 2018
For
per
sona
l use
onl
y

Summarised Statement of Changes in EquityFor the Year Ended 30 June 2018
2018 $’000
2017 $’000
Total equity at the beginning of the year 5,965,503 5,408,541
Dividends paid (278,054) (267,751)Shares – Dividend Reinvestment Plan issued 55,601 55,242 – Conversion of Convertible Notes - 179,755Other Share Capital Adjustments (136) (182)
Total transactions with shareholders (222,589) (32,936)
Profit for the year 279,007 245,300
Revaluation of investment portfolio 454,180 500,389
Provision for tax on revaluation (136,841) (154,791)Revaluation of investment portfolio (after tax) 317,339 345,598
Total comprehensive income for the year 596,346 590,898
Realised gains/(losses) on securities sold 24,385 (9,336)
Tax expense on realised gains on securities sold (6,405) (647)Net realised gains/(losses) on securities sold 17,980 (9,983)
Transfer from revaluation reserve to realised gains reserve (17,980) 9,983
Dividends paid to minority interests by AICS - (1,000)
Total equity at the end of the year 6,339,260 5,965,503
A full set of AFIC’s final accounts are available on the Company’s website.
19
Australian Foundation Investment Company Limited Annual Review 2018
18
Australian Foundation Investment Company Limited Annual Review 2018
For
per
sona
l use
onl
y
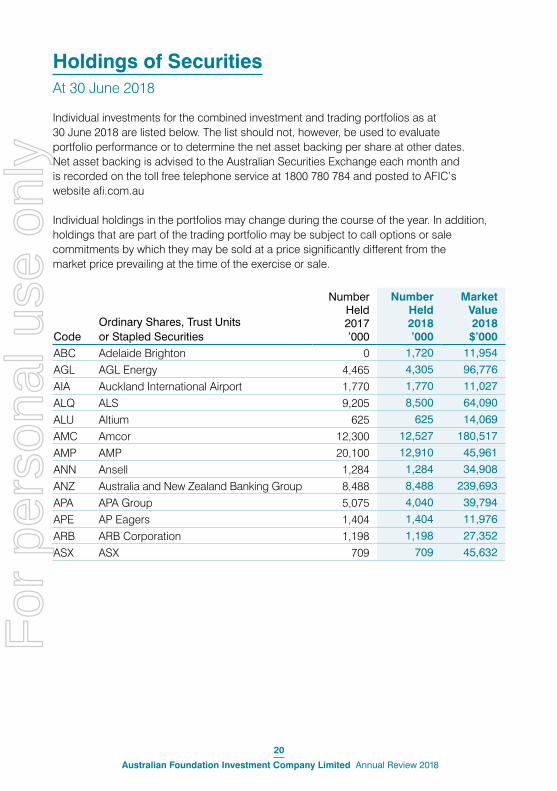
Individual investments for the combined investment and trading portfolios as at 30 June 2018 are listed below. The list should not, however, be used to evaluate portfolio performance or to determine the net asset backing per share at other dates. Net asset backing is advised to the Australian Securities Exchange each month and is recorded on the toll free telephone service at 1800 780 784 and posted to AFIC’s website afi.com.au
Individual holdings in the portfolios may change during the course of the year. In addition, holdings that are part of the trading portfolio may be subject to call options or sale commitments by which they may be sold at a price significantly different from the market price prevailing at the time of the exercise or sale.
CodeOrdinary Shares, Trust Units or Stapled Securities
Number Held 2017 ’000
Number Held 2018 ’000
Market Value 2018 $’000
ABC Adelaide Brighton 0 1,720 11,954
AGL AGL Energy 4,465 4,305 96,776
AIA Auckland International Airport 1,770 1,770 11,027
ALQ ALS 9,205 8,500 64,090
ALU Altium 625 625 14,069
AMC Amcor 12,300 12,527 180,517
AMP AMP 20,100 12,910 45,961
ANN Ansell 1,284 1,284 34,908
ANZ Australia and New Zealand Banking Group 8,488 8,488 239,693
APA APA Group 5,075 4,040 39,794
APE AP Eagers 1,404 1,404 11,976
ARB ARB Corporation 1,198 1,198 27,352
ASX ASX 709 709 45,632
Holdings of Securities At 30 June 2018
21
Australian Foundation Investment Company Limited Annual Review 2018
20
Australian Foundation Investment Company Limited Annual Review 2018
For
per
sona
l use
onl
y
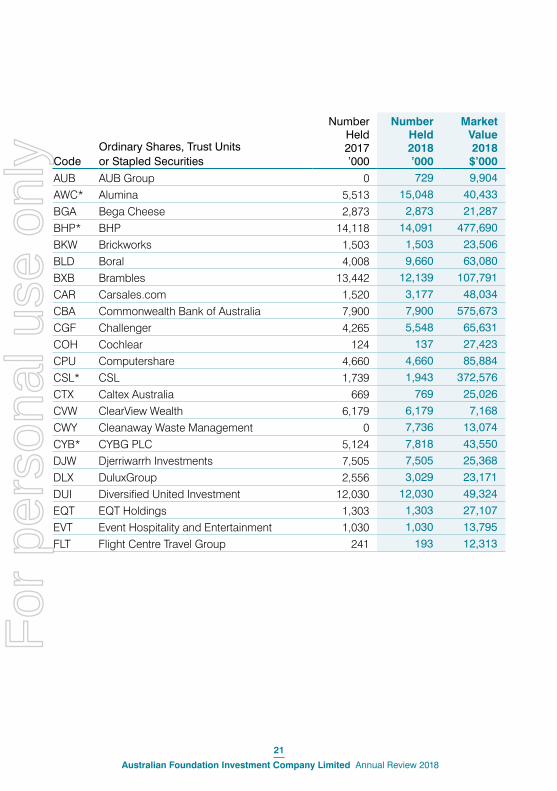
CodeOrdinary Shares, Trust Units or Stapled Securities
Number Held 2017 ’000
Number Held 2018 ’000
Market Value 2018 $’000
AUB AUB Group 0 729 9,904
AWC* Alumina 5,513 15,048 40,433
BGA Bega Cheese 2,873 2,873 21,287
BHP* BHP 14,118 14,091 477,690
BKW Brickworks 1,503 1,503 23,506
BLD Boral 4,008 9,660 63,080
BXB Brambles 13,442 12,139 107,791
CAR Carsales.com 1,520 3,177 48,034
CBA Commonwealth Bank of Australia 7,900 7,900 575,673
CGF Challenger 4,265 5,548 65,631
COH Cochlear 124 137 27,423
CPU Computershare 4,660 4,660 85,884
CSL* CSL 1,739 1,943 372,576
CTX Caltex Australia 669 769 25,026
CVW ClearView Wealth 6,179 6,179 7,168
CWY Cleanaway Waste Management 0 7,736 13,074
CYB* CYBG PLC 5,124 7,818 43,550
DJW Djerriwarrh Investments 7,505 7,505 25,368
DLX DuluxGroup 2,556 3,029 23,171
DUI Diversified United Investment 12,030 12,030 49,324
EQT EQT Holdings 1,303 1,303 27,107
EVT Event Hospitality and Entertainment 1,030 1,030 13,795
FLT Flight Centre Travel Group 241 193 12,313
21
Australian Foundation Investment Company Limited Annual Review 2018
20
Australian Foundation Investment Company Limited Annual Review 2018
For
per
sona
l use
onl
y

Holdings of Securities continued
At 30 June 2018
CodeOrdinary Shares, Trust Units or Stapled Securities
Number Held 2017 ’000
Number Held 2018 ’000
Market Value 2018 $’000
FNP Freedom Foods Group 4,507 6,011 40,455
FPH Fisher & Paykel Healthcare Corporation 5,008 4,400 60,192
GMG Goodman Group 0 1,000 9,620
HSO Healthscope 26,700 4,000 8,840
IAG Insurance Australia Group 6,066 4,976 42,447
ICQ iCar Asia 22,030 20,156 4,737
IEL IDP Education 880 880 9,246
ILU Iluka Resources 3,642 2,367 26,463
IRE IRESS 3,737 4,024 48,455
IVC InvoCare 1,150 1,325 18,206
JHX James Hardie Industries 3,111 4,050 91,854
LIC Lifestyle Communities 5,470 5,470 32,002
LNK Link Administration Holdings 3,396 3,200 23,456
MFT Mainfreight 2,840 2,990 76,155
MIR Mirrabooka Investments 8,728 8,728 23,478
MLT Milton Corporation 10,841 10,841 49,979
MPL Medibank Private 2,000 2,000 5,840
MQG* Macquarie Group 700 1,680 206,396
NAB National Australia Bank 9,969 9,342 256,066
23
Australian Foundation Investment Company Limited Annual Review 2018
22
Australian Foundation Investment Company Limited Annual Review 2018
For
per
sona
l use
onl
y

CodeOrdinary Shares, Trust Units or Stapled Securities
Number Held 2017 ’000
Number Held 2018 ’000
Market Value 2018 $’000
NVT Navitas 3,678 3,678 16,328
NXT NEXTDC 0 4,180 31,601
ORA Orora 12,864 11,670 41,663
ORG* Origin Energy 6,000 6,500 64,833
ORI Orica 2,712 2,712 48,131
OSH Oil Search 16,483 16,483 146,694
PPT Perpetual 1,061 1,061 44,142
QAN Qantas Airways 0 3,250 20,020
QBE QBE Insurance Group 7,874 4,355 42,418
QUB Qube Holdings 34,962 34,962 84,258
REA REA Group 384 384 34,891
REH Reece 318 3,621 45,803
RHC Ramsay Health Care 1,415 1,415 76,382
RIO Rio Tinto 3,652 3,457 288,441
RMD ResMed 3,935 3,935 55,484
RWC Reliance Worldwide Corporation 2,400 8,600 46,096
S32 South32 15,241 15,241 55,020
SCG Scentre Group 12,950 15,650 68,704
23
Australian Foundation Investment Company Limited Annual Review 2018
22
Australian Foundation Investment Company Limited Annual Review 2018
For
per
sona
l use
onl
y
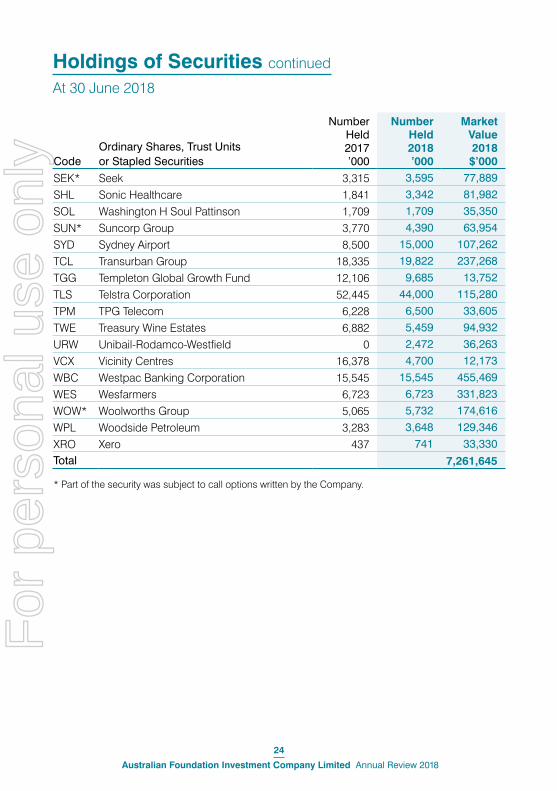
Holdings of Securities continued
At 30 June 2018
CodeOrdinary Shares, Trust Units or Stapled Securities
Number Held 2017 ’000
Number Held 2018 ’000
Market Value 2018 $’000
SEK* Seek 3,315 3,595 77,889
SHL Sonic Healthcare 1,841 3,342 81,982
SOL Washington H Soul Pattinson 1,709 1,709 35,350
SUN* Suncorp Group 3,770 4,390 63,954
SYD Sydney Airport 8,500 15,000 107,262
TCL Transurban Group 18,335 19,822 237,268
TGG Templeton Global Growth Fund 12,106 9,685 13,752
TLS Telstra Corporation 52,445 44,000 115,280
TPM TPG Telecom 6,228 6,500 33,605
TWE Treasury Wine Estates 6,882 5,459 94,932
URW Unibail-Rodamco-Westfield 0 2,472 36,263
VCX Vicinity Centres 16,378 4,700 12,173
WBC Westpac Banking Corporation 15,545 15,545 455,469
WES Wesfarmers 6,723 6,723 331,823
WOW* Woolworths Group 5,065 5,732 174,616
WPL Woodside Petroleum 3,283 3,648 129,346
XRO Xero 437 741 33,330Total 7,261,645
* Part of the security was subject to call options written by the Company.
25
Australian Foundation Investment Company Limited Annual Review 2018
24
Australian Foundation Investment Company Limited Annual Review 2018
For
per
sona
l use
onl
y

CodeConvertible Notes, Preference Shares and Other Interest-bearing Securities
Number Held 2017’000
Number Held 2018’000
Market Value 2018$’000
RHCPA Ramsay Health Care Convertible Adjustable Rate Equity Securities
115 115 12,304
Total 12,304
25
Australian Foundation Investment Company Limited Annual Review 2018
24
Australian Foundation Investment Company Limited Annual Review 2018
For
per
sona
l use
onl
y

Acquisitions Cost
$’000Macquarie Group 105,902CSL 48,838Sydney Airport 47,044Boral 41,944Unibail-Rodamco-Westfield* (as a result of the takeover of Westfield Corporation) 36,078Sonic Healthcare 35,347James Hardie Industries 29,605NEXTDC* 28,558Reliance Worldwide (includes $10.91 million in 1 for 1.98 issue at $4.15 per share) 27,188Alumina 24,308Carsales.com 22,962Reece (includes $10.56 million in 1 for 11 issue and placement at $9.30 per share) 20,903Qantas Airways* 20,637
* New holding in the portfolio.
Major Transactions in the Investment Portfolio
27
Australian Foundation Investment Company Limited Annual Review 2018
26
Australian Foundation Investment Company Limited Annual Review 2018
For
per
sona
l use
onl
y

Disposals Proceeds
$’000Incitec Pivot# 79,970Westfield Corporation# (taken over by Unibail-Rodamco) 70,902Healthscope 57,338Coca-Cola Amatil# 43,656QBE Insurance 34,096Tox Free Solutions# (taken over by Cleanaway Waste Management) 30,592Vicinity Centres 29,826AMP 28,171Japara Healthcare# 26,928Telstra 24,288Treasury Wine Estates 23,782
# Complete disposal from the portfolio.
New Companies Added to the Investment Portfolio
Unibail-Rodamco-Westfield NEXTDC Qantas Airways Cleanaway Waste Management Adelaide Brighton AUB GroupGoodman Group
27
Australian Foundation Investment Company Limited Annual Review 2018
26
Australian Foundation Investment Company Limited Annual Review 2018
For
per
sona
l use
onl
y

Australian Foundation Investment Company Limited (AFIC)ABN 56 004 147 120
DirectorsTerrence A Campbell AO, ChairmanRobert M Freeman, Managing DirectorRoss E BarkerJacqueline C HeyGraeme R LiebeltJohn PatersonDavid A PeeverCatherine M Walter AMPeter J Williams
Company SecretariesMatthew J RoweAndrew JB Porter
AuditorPricewaterhouseCoopersChartered Accountants
Country of IncorporationAustralia
Registered Office and Mailing AddressLevel 21, 101 Collins StreetMelbourne Victoria 3000
Contact Details Telephone (03) 9650 9911Facsimile (03) 9650 9100Website afi.com.auEmail [email protected]
For enquiries regarding net asset backing (as advised each month to the Australian Securities Exchange):
Telephone 1800 780 784 (toll free)
Share Registrar AustraliaComputershare Investor Services Pty LtdYarra Falls, 452 Johnston StreetAbbotsford Victoria 3067
New ZealandComputershare Investor Services Limited159 Hurstmere RoadTakapuna Auckland 0622
Shareholder Enquiry Line 1300 662 270 0800 333 501 (within New Zealand) +61 3 9415 4373 (from overseas)Facsimile (03) 9473 2500Website investorcentre.com/au/contact
For all enquiries relating to shareholdings, noteholdings, dividends and related matters, please contact the share registrar as above.
Australian and New Zealand Securities Exchange CodesAFI Ordinary shares (ASX and NZX)
Company Particulars
29
Australian Foundation Investment Company Limited Annual Review 2018
28
Australian Foundation Investment Company Limited Annual Review 2018
For
per
sona
l use
onl
y

The Annual Report for 2018 is available on AFIC’s website afi.com.au or by contacting the Company on (03) 9650 9911.
Shareholder Meetings
Australia
Annual General Meeting Time 10.00amDate Tuesday 9 October 2018Venue ZINC Function CentreLocation Corner of Swanston Street
and Flinders Street Melbourne
Sydney Shareholder MeetingTime 10.00amDate Monday 15 October 2018Venue Four Seasons HotelLocation 199 George Street Sydney
Adelaide Shareholder MeetingTime 10.00am Date Friday 19 October 2018Venue Adelaide Convention CentreLocation Panorama Rooms, North Terrace Adelaide
Brisbane Shareholder MeetingTime 10.00am Date Monday 22 October 2018Venue Brisbane Hilton HotelLocation 190 Elizabeth Street Brisbane
New Zealand
Auckland Shareholder MeetingTime 10.00amDate Monday 3 December 2018Venue Hilton HotelLocation 147 Quay Street Auckland
29
Australian Foundation Investment Company Limited Annual Review 2018
28
Australian Foundation Investment Company Limited Annual Review 2018
For
per
sona
l use
onl
y
Design: MDM Investorcom Printed on environmentally friendly paper
For
per
sona
l use
onl
y
Notice of Annual General Meeting 2018
90YEARS OF INVESTMENTEXPERIENCE
The Annual General Meeting of Australian Foundation Investment Company Limited, ABN: 56 004 147 120 (the ‘Company’) will be held at:
ZINC at Federation Square, Corner of Swanston Street and Flinders Street, Melbourne, Victoria 3000 at 10.00am (AEDT) on Tuesday 9 October 2018.
The Company has determined that, for the purpose of voting at the meeting, shares will be taken to be held by those persons recorded on the Company’s register at 7.00pm (AEDT) on Sunday 7 October 2018.
For
per
sona
l use
onl
y

1. Financial Statements and ReportsTo consider the Directors’ Report, Financial Statements and Independent Audit Report for the financial year ended 30 June 2018.
(Please note that no resolution will be required to be passed on this matter.)
2. Adoption of Remuneration ReportTo consider and, if thought fit, to pass the following resolution (as an ordinary resolution):
“That the Remuneration Report for the financial year ended 30 June 2018 be adopted.”
(Please note that the vote on this item is advisory only.)
3 and 4 Re-election of DirectorsTo consider and, if thought fit, to pass the following resolutions (as ordinary resolutions):
3. “That Graeme Liebelt, a Director retiring from office in accordance with Rule 46 of the Constitution, being eligible is re-elected as a Director of the Company.”
4. “That Ross Barker, a Director retiring from office in accordance with Rule 53(f) of the Constitution, being eligible is re-elected as a Director of the Company.”
5. Renewal of Proportional Takeover Provisions in the ConstitutionTo consider and, if thought fit, pass the following resolution (as a special resolution):
“That, pursuant to sections 136(2) and 648G of the Corporations Act 2001 (Cth), the proportional takeover provisions in Rules 79 and 80 of the Company’s Constitution are renewed for a period of three years from the date of this meeting.”
By Order of the Board
Matthew Rowe Company Secretary 30 August 2018
BUSINESS OF THE MEETING
2
Australian Foundation Investment Company Limited Notice of Annual General Meeting 2018
For
per
sona
l use
onl
y

Explanatory NotesThe Explanatory Notes below provide additional information regarding the items of business proposed for the Annual General Meeting.
IMPORTANT: Shareholders are urged to direct their proxy how to vote by clearly marking the relevant box for each item on the proxy form.
Please ensure that your properly completed proxy form reaches the Share Registry by the deadline of 10.00am (AEDT) on Sunday 7 October 2018.
1. Financial Statements and ReportsDuring this item there will be a reasonable opportunity for shareholders to ask questions and comment on the Directors’ Report, Financial Statements and Independent Audit Report for the financial year ended 30 June 2018. No resolution will be required to be passed on this matter.
Shareholders who have not elected to receive a hard copy of the Company’s 2018 Annual Report can view or download it from the Company’s website at:
afi.com.au/Reports-by-year.aspx
2. Adoption of Remuneration Report Board recommendation and undirected proxies: The Board recommends that shareholders vote in FAVOUR of Item 2. The Chairman of the meeting intends to vote undirected proxies in FAVOUR of Item 2.
During this item there will be a reasonable opportunity for shareholders at the meeting to comment on and ask questions about the Remuneration Report which can be found in the Company’s 2018 Annual Report. As prescribed by the Corporations Act, the vote on the proposed resolution is an advisory one.
Voting Exclusions on Item 2
Pursuant to sections 250BD and 250R of the Corporations Act 2001 (Cth), votes many not be cast, and the Company will disregard any votes cast, on the resolution proposed in Item 2 (‘Resolution 2’):
• by or on behalf of any member of the key management personnel of the Company’s consolidated group (a ‘KMP member’) whose remuneration details are included in the Remuneration Report, or any of their closely related parties, regardless of the capacity in which the votes are cast; or
• by any person who is a KMP member as at the time Resolution 2 is voted on at the Annual General Meeting, or any of their closely related parties, as a proxy,
unless the votes are cast as a proxy for a person who is entitled to vote on Resolution 2:
• in accordance with a direction in the proxy appointment; or
• by the Chairman of the meeting in accordance with an express authorisation in the proxy appointment to cast the votes even if Resolution 2 is connected directly or indirectly with the remuneration of a KMP member.
If the Chairman of the meeting is appointed, or taken to be appointed, as a proxy, the shareholder can direct the Chairman to vote for or against, or to abstain from voting on, Resolution 2 by marking the appropriate box opposite Item 2 on the proxy form.
Pursuant to sections 250BD(2) and 250R(5) of the Corporations Act 2001, if the Chairman of the meeting is a proxy and the relevant shareholder does not mark any of the boxes opposite Item 2, the relevant shareholder will be expressly authorising the Chairman to exercise the proxy in relation to Item 2.
For the purposes of these voting exclusions:
• A ‘closely related party’ of a KMP member means (1) a spouse or child of the KMP member, (2) a child of the KMP member’s spouse, (3) a dependant of the KMP member or of the KMP member’s spouse, (4) anyone else who is one of the KMP member’s family and may be expected to influence the KMP member, or be influenced by the KMP member, in the KMP member’s dealings with the Company, or (5) a company the KMP member controls.
• The Company will also apply these voting exclusions to persons appointed as attorney by a shareholder to attend and vote at the Annual General Meeting under a power of attorney, as if they were appointed as a proxy.
Items 3 and 4 Re-election of Directors
Board recommendation and undirected proxies: The Board recommends (with the exception of each Director in relation to their own re-election) that shareholders vote in FAVOUR of items 3 and 4. The Chairman of the meeting intends to vote undirected proxies in FAVOUR of items 3 and 4.
Graeme Liebelt was re-elected as a Director by shareholders at the 2015 AGM. As such he is required to seek re-election by shareholders at this AGM. Ross Barker retired as Chief Executive Officer of the Company on 31 December 2017 and the Board resolved that Mr Barker should remain as a Non-Executive Director of the Company. Pursuant to Rule 53(f) of the Company’s Constitution Mr Barker is also required to seek re-election at this AGM.
3
Australian Foundation Investment Company Limited Notice of Annual General Meeting 2018
For
per
sona
l use
onl
y

BUSINESS OF THE MEETING continued
Their biographical details are set out below:
Graeme R Liebelt B Ec (Hons), FAICD. Independent Non-Executive Director. Chairman of the Remuneration Committee.
Mr Liebelt was appointed to the Board in June 2012. He is Chairman of Amcor Limited and DuluxGroup Limited, a Director of Australia and New Zealand Banking Group Limited and a Director of Carey Baptist Grammar School. He is a Fellow of the Australian Academy of Technological Sciences and Engineering and a Fellow of the Australian Institute of Company Directors. He was formerly Managing Director and CEO of Orica Limited, Chairman and Director of the Global Foundation and Deputy Chairman of Melbourne Business School.
Ross E BarkerBSc (Hons) (Melb), MBA (Melb), F Fin. Non-Executive Director. Member of the Investment Committee.
Mr Barker transitioned to a Non-Executive Director in January 2018 after retiring as Chief Executive Officer and Managing Director of the Company in December 2017. Mr Barker was appointed Chief Executive Officer of the Company in February 2001 and Managing Director in October 2001 and prior to that an Alternate Director of the Company since April 1987. He is also Chairman of Melbourne Business School Ltd. He is a Non-Executive Director of AMCIL Limited and Mirrabooka Investments Limited.
Further information regarding the Company’s Corporate Governance arrangements and the Board’s role can be found on the Company’s website at:
afi.com.au/Corporate-Governance.aspx
5. Renewal of Proportional Takeover Provisions in the ConstitutionBoard recommendation and undirected proxies: The Board recommends that shareholders vote in FAVOUR of Item 5. The Chairman of the meeting intends to vote undirected proxies in FAVOUR of Item 5.
Background
The Corporations Act 2001 (Cth) permits a company to include rules in its constitution which enable the company to refuse to register a transfer of shares resulting from a proportional takeover bid unless shareholders in the bid class in a meeting approve the takeover bid.
It is a requirement of the Corporations Act that such proportional takeover approval provisions in a company’s constitution apply for a maximum period of three years, unless earlier renewed. In the case of the Company, such proportional takeover approval provisions (existing Rules 79 and 80 of the Company’s Constitution) were approved by shareholders at the 2015 AGM and will expire on 7 October 2018.
The Directors consider that it is in the best interests of shareholders to renew these provisions in their existing form. Accordingly, a special resolution is being put to shareholders under Section 648G of the Corporations Act to renew Rules 79 and 80 of the Company’s Constitution.
If approved by shareholders at the meeting, Rules 79 and 80 will operate for three years from the date of the meeting (that is, until 9 October 2021) unless renewed earlier.
Proportional Takeover Bids
A proportional takeover bid involves the bidder offering to buy a proportion only of each shareholder’s shares in the target company.
This means that control of the target company may pass without members having the chance to sell all their shares to the bidder. It also means the bidder may acquire control of the target company without paying an adequate premium for gaining control.
To address this possibility, a company may provide in its constitution that, in the event of a proportional takeover bid being made for shares in the company, the directors must convene a meeting of shareholders to vote on a resolution to approve that bid.
A meeting convened under the proportional takeover approval provisions is treated as a general meeting of the company and the majority decision of the company’s members will be binding on all individual members.
Effect of Proposed Proportional Takeover Approval Provisions
Where a proportional takeover bid is made, the Directors must convene a meeting of shareholders to vote on a resolution to approve the proportional bid before the 14th day prior to the closing of the bid period.
The vote is decided on a simple majority. Each person who, as at the end of the day on which the first offer under the takeover bid was made, held bid class shares is entitled to vote. Neither the bidder nor its associates are entitled to vote on the resolution.
If a meeting is not held, Section 648E of the Corporations Act deems a resolution approving the proportional bid to have been passed thereby allowing the proportional bid to proceed. Further, the Directors will contravene the Act if they fail to ensure a resolution to approve the bid is voted on.
If the resolution is rejected, the registration of any transfer of shares resulting from that proportional takeover bid will be prohibited and the bid will be deemed to be withdrawn. If the resolution is passed or deemed to have been passed, the transfer of shares resulting from acceptance of an offer under that bid will be permitted and the transfer of shares will be registered provided they comply with the other provisions of the Constitution.
Rules 79 and 80 will not apply to full takeover bids.
4
Australian Foundation Investment Company Limited Notice of Annual General Meeting 2018
For
per
sona
l use
onl
y
Reason for Proposing the Resolution
The Directors consider that the renewal of Rules 79 and 80 is in the best interests of all shareholders of the Company. In the Directors’ view, shareholders should have the opportunity to vote on a proposed proportional takeover bid.
In the absence of Rules 79 and 80 (as renewed), a proportional takeover bid for the Company may enable effective control of the Company to be acquired by a party who has not offered to acquire 100 per cent of the Company’s shares (and, therefore, has not offered to pay a ‘control premium’ that reflects 100 per cent ownership).
As a result, if a proportional takeover bid for the Company is made:
• shareholders may not have the opportunity to dispose of all their shares; and
• shareholders risk being locked into a minority position in the Company or suffering loss following such a change of control if the bid causes a decrease in the market value of shares.
If Rules 79 and 80 are renewed, the Board considers that this risk will be minimised by enabling shareholders to decide whether or not a proportional takeover bid should be allowed to proceed.
Present Acquisition Proposals
As at the date of this notice, the Directors are not aware of any proposal by any person to acquire, or increase the extent of, a substantial interest in the Company.
Review of Proportional Takeover Approval Provisions
The Corporations Act requires these Explanatory Notes to discuss retrospectively the potential advantages and disadvantages of the proportional takeover approval provisions for both Directors and shareholders.
While the proportional takeover approval provisions have been in effect, there have been no takeover bids for the Company – either proportional or otherwise. So there are no actual examples against which to review the advantages and disadvantages of the existing proportional takeover approval provisions for the Directors and shareholders of the Company. The Directors are not aware of any potential takeover bid which was discouraged by Rules 79 and 80.
Advantages and Disadvantages
In addition to looking at the provisions retrospectively, the Corporations Act also requires these Explanatory Notes to discuss the potential future advantages and disadvantages of the proposed proportional takeover approval provisions for both Directors and shareholders.
The Directors consider that there are no advantages or disadvantages for the Directors in renewing the proposed proportional takeover approval provisions. In particular, there is no restriction on their ability to make a recommendation on whether a proportional takeover bid should be accepted.
For shareholders, the potential advantage of renewing the proportional takeover approval provisions is that they provide shareholders with the opportunity to consider, discuss in a meeting called specifically for the purpose, and vote on whether a proportional takeover bid should be approved. This ensures that shareholders have an opportunity to have a say in the future ownership and control of the Company. The Directors believe that this would encourage any future proportional bids to be structured so as to be attractive to a majority of shareholders. It may also discourage the making of a proportional takeover bid that might be considered opportunistic. Finally, knowing the view of a majority of the shareholders may help each individual shareholder to assess the likely outcome of the proportional takeover bid and decide whether or not to accept an offer under the bid.
A potential disadvantage for shareholders arising from renewing the proportional takeover approval provisions is that they may discourage proportional takeover bids being made and may reduce any speculative element in the market price of the Company’s shares arising from the possibility of a proportional bid being made. As a result, shareholders may not have the opportunity to dispose of a portion of their shares at an attractive price where the majority rejects an offer from a party seeking control of the Company.
The Directors consider that the potential advantages for shareholders of the proposed proportional takeover approval provisions outweigh the potential disadvantages.
5
Australian Foundation Investment Company Limited Notice of Annual General Meeting 2018
For
per
sona
l use
onl
y

BUSINESS OF THE MEETING continued
Shareholder Approval
To pass as a special resolution, this item of business requires the support of 75 per cent or more of the votes cast on the resolution.
Shareholder InformationProxies
1. A shareholder entitled to attend and vote at this meeting is entitled to appoint not more than two proxies (who need not be members of the Company) to attend, vote and speak in the shareholder’s place and to join in any demand for a poll.
2. Where a shareholder appoints more than one representative, proxy or attorney, those appointees are entitled to vote on a poll but not on a show of hands.
3. A shareholder who appoints two proxies may specify a proportion or number of the shareholder’s votes each proxy is appointed to exercise. Where no such specification is made, each proxy may exercise half of the votes (any fractions of votes resulting from this are disregarded).
4. Proxy forms may be lodged online by visiting investorvote.com.au or by scanning the QR Code on the proxy form with a mobile device.
5. Relevant custodians may lodge their proxy forms online by visiting intermediaryonline.com
6. Proxy forms and any authorities (or certified copies of those authorities) under which they are signed may be delivered in person, by mail or by fax to the Company’s Share Registry (see details below) no later than 48 hours before the meeting, being 10.00am (AEDT) on Sunday 7 October 2018. Further details are on the proxy form.
7. A proxy need not vote in that capacity on a show of hands on any resolution nor (unless the proxy is the Chairman of the meeting) on a poll. However, if the proxy’s appointment specifies the way to vote on a resolution, and the proxy decides to vote in that capacity on that resolution, the proxy must vote the way specified (subject to the other provisions of this Notice, including the voting exclusions noted above).
8. In certain circumstances the Chairman of the meeting will be taken to have been appointed as the proxy of the relevant shareholder in respect of the meeting or the poll on that resolution even if the shareholder has not expressly appointed the Chairman of the meeting as their proxy. This will occur where:
• an appointment of a proxy specifies the way the proxy is to vote on a particular resolution; and
• the appointed proxy is not the Chairman of the meeting; and
• at the meeting, a poll is called on the resolution; and
• either of the following apply:
– if a record of attendance is made for the AGM and the proxy is not recorded as attending; and
– the proxy does not vote on the resolution.
Corporate Representatives
A body corporate which is a shareholder, or which has been appointed as a proxy, may appoint an individual to act as its representative at the meeting. Unless it has previously been given to the Company, the representative should bring evidence of their appointment to the meeting, together with any authority under which it is signed. The appointment must comply with Section 250D of the Corporations Act 2001.
Attorneys
A shareholder may appoint an attorney to vote on their behalf. To be effective for the meeting, the instrument effecting the appointment (or a certified copy of it) must be received by the deadline for the receipt of proxy forms (see above), being no later than 48 hours before the meeting.
Share Registry
The Company’s Share Registry details are as follows:
Computershare Investor Services Pty Limited
Street AddressYarra Falls452 Johnston StreetAbbotsford Victoria 3067
Postal AddressGPO Box 242Melbourne Victoria 3001
Telephone1300 662 270 (within Australia) 0800 333 501 (within New Zealand) +61 3 9415 4373 (outside Australia)
Facsimile1800 783 447 (within Australia) +61 3 9473 2555 (outside Australia)
Internetinvestorcentre.com/au/contact
6
Australian Foundation Investment Company Limited Notice of Annual General Meeting 2018
For
per
sona
l use
onl
y

Annual General Meeting Venue
The Annual General Meeting of Australian Foundation Investment Company Limited, ABN: 56 004 147 120 (the ‘Company’) will be held at:
ZINC at Federation Square, Corner of Swanston Street and Flinders Street, Melbourne, Victoria 3000 at 10.00am (AEDT) on Tuesday 9 October 2018.
Flinders St
Sw
anst
on S
tP
rince
s B
ridge
Flin
ders
St S
tatio
n
Visitor Info Centre
ACMI
YarraBuilding
The Ian Potter Centre
Dea
kin
Edg
e
Carpark
Lift/stairs
Atr
ium
Entrance
Rus
sell
St E
xten
sion
Plaza
FEDERATION SQUARECross
Bar
River Terrace
Yarra River
St Pauls Cathedral
ZINC
TransportBar
Flinders Gate Carpark
Birrarung Marr
By foot
By car
By tram
Lift
7
Australian Foundation Investment Company Limited Notice of Annual General Meeting 2018
For
per
sona
l use
onl
y

For
per
sona
l use
onl
y

2373
18_0
22X
RB
Lodge your proxy:
Online:
www.investorvote.com.au
By Mail:
Computershare Investor Services Pty Limited GPO Box 242 Melbourne Victoria 3001 Australia
In Person:
Computershare Investor Services Pty Limited Yarra Falls, 452 Johnston Street Abbotsford, Victoria
Alternatively you can fax your form to (within Australia) 1800 783 447(outside Australia) +61 3 9473 2555
For Intermediary Online users only (Custodians)www.intermediaryonline.com
For all enquiries call:(within Australia) 1300 662 270(within New Zealand) 0800 333 501(outside Australia) +61 3 9415 4373
Proxy Form
How to direct your proxy to voteVoting 100% of your holding: Direct your proxy how to vote by marking one of the boxes opposite each item of business. If you do not mark a box your proxy may vote or abstain as they choose (to the extent permitted by law). If you mark more than one box on an item your vote will be invalid on that item.Voting a portion of your holding: Indicate a portion of your voting rights by inserting the percentage or number of shares you wish to vote in the For, Against or Abstain box or boxes. The sum of the votes cast must not exceed your voting entitlement or 100%.Appointing a second proxy: You are entitled to appoint up to two proxies to attend the meeting and vote on a poll. If you appoint two proxies you must specify the percentage of votes or number of shares for each proxy, otherwise each proxy may exercise half of the votes. When appointing a second proxy write both names and the percentage of votes or number of shares for each in Step 1 overleaf.
A proxy need not be a shareholder of the Company.
Lodgement of proxy formThis proxy form (and any authority under which it is signed or a certifi ed copy of it) must be received at an address given above by 10.00am (AEDT) on Sunday 7 October 2018, being not later than 48 hours before the commencement of the meeting. Any proxy form received after that time will not be valid for the scheduled meeting.
Signing instructions for postal formsIndividual: Where the holding is in one name, the shareholder or attorney must sign.Joint Holding: Where the holding is in more than one name, all of the shareholders or attorneys should sign.Power of Attorney: If you have not already lodged the Power of Attorney with the registry, please attach a certifi ed photocopy of the Power of Attorney to this form when you return it.Companies: Where the company has a Sole Director who is also the Sole Company Secretary, this form must be signed by that person. If the company (pursuant to section 204A of the Corporations Act 2001) does not have a Company Secretary, a Sole Director can also sign alone. Otherwise this form must be signed by a Director jointly with either another Director or a Company Secretary. Please sign in the appropriate place to indicate the offi ce held.
Attending the meetingIf a representative of a corporate shareholder or proxy is to attend the meeting you will need to provide the appropriate “Certifi cate of Appointment of Corporate Representative” prior to admission. A form of the certifi cate may be obtained from Computershare or online at www.investorcentre.com under the help tab, “Printable Forms”.
Comments & Questions: If you have any comments or questions for the Company, please write them on a separate sheet of paper and return with this form.
GO ONLINE TO APPOINT YOUR PROXY, or turn over to complete the form
For your proxy form to be effective it must be received by 10.00am (AEDT) on Sunday 7 October 2018
ABN 56 004 147 120
Appoint your proxy and view the Annual Report online
Go to www.investorvote.com.au or scan the QR Code with your mobile device.Follow the instructions on the secure website to appoint your proxy.
Your access information that you will need to appoint your proxy online:
Control Number:
SRN/HIN:
PLEASE NOTE: For security reasons it is important that you keep your SRN/HIN confi dential. Please dispose of this form carefully if you appoint your proxy online.
MR JOHN SAMPLEFLAT 123123 SAMPLE STREETTHE SAMPLE HILLSAMPLE ESTATESAMPLEVILLE VIC 3030
I9999999999
999999
XX
For
per
sona
l use
onl
y

2373
18_0
22X
RB
I/We being a shareholder/s of AUSTRALIAN FOUNDATION INVESTMENT COMPANY LIMITED hereby appoint
the Chairman
of the meeting OR
or failing the individual or body corporate named in relation to the meeting generally or in relation to a poll on a given resolution, or if no individual or body corporate is named, the Chairman of the meeting, as my/our proxy to act generally at the meeting or in relation to a poll on the given resolution (as applicable) on my/our behalf, including to vote in accordance with the following directions (or if no directions have been given, and to the extent permitted by law, as the proxy sees fi t), at the Annual General Meeting of Australian Foundation Investment Company Limited to be held at ZINC Federation Square, Corner of Flinders and Swanston Street, Melbourne, Victoria at 10.00am (AEDT) on Tuesday9 October 2018 and at any adjournment or postponement of that meeting.
Chairman to vote undirected proxies as follows: I/We acknowledge that the Chairman of the meeting intends to vote undirected proxies
in favour of each item of business, to the extent permitted by law.
Chairman authorised to exercise proxies on remuneration related matters: If I/we have appointed the Chairman of the meeting as my/our proxy (or the Chairman of the meeting becomes my/our proxy by default), I/we expressly authorise the Chairman of the meeting, to the extent permitted by law, to exercise my/our proxy in respect of item 2 even though the item is connected directly or indirectly with the remuneration of a member of key management personnel of Australian Foundation Investment Company Limited and its consolidated group, which includes the Chairman of the meeting.
Items of BusinessSTEP 2PLEASE NOTE: If you mark the Abstain box for an item, you are directing your proxy not to vote on your
behalf on a show of hands or a poll and your votes will not be counted in computing the required majority
Appoint a proxy to vote on your behalf
Signature of Shareholder(s) This section must be completed.SIGN
STEP 1
PLEASE NOTE: Leave this box blank if you have selected the Chairman of the meeting. Do not insert your own name(s).
Individual or Shareholder 1
Sole Director and Sole Company Secretary
Shareholder 2
Director
Shareholder 3
Director/Company Secretary
Contact
Name
Contact
Daytime
Telephone Date/ /
Please mark to indicate your directionsProxy Form
Change of address. If incorrect, mark this box and make the correction in the space to the left. Shareholders sponsored by a broker (reference number commences with ’X’) should advise their broker of any changes.
A F I 2 3 7 3 1 8 A
Item 2 Adoption of Remuneration Report
Item 3 Re-election of Director – Mr Graeme Liebelt
Item 4 Re-election of Director – Mr Ross Barker
Item 5 Renewal of proportional takeover provisions in the constitution
Board recommendations and undirected proxies: The board recommends shareholders vote in favour of each item of business. The Chairman of the meeting intends to vote undirected proxies in favour of each item of business, to the extent permitted by law.
ForA
gainst
Absta
in
I 9999999999 I N D
XX
MR JOHN SAMPLEFLAT 123123 SAMPLE STREETTHE SAMPLE HILLSAMPLE ESTATESAMPLEVILLE VIC 3030
*I1234567890*F
or p
erso
nal u
se o
nly