Embed Size (px)
Citation preview
Australian fisheries economic indicators report 2013
Financial and economic performance of the Torres Strait Prawn Fishery Maggie Skirtun, Mary Stephan, Robert Curtotti and Kasia Mazur
Research by the Australian Bureau of Agricultural
and Resource Economics and Sciences
April 2015
Australian fisheries economic indicators report 2013: Torres Strait Prawn Fishery
ii
© Commonwealth of Australia 2015 Ownership of intellectual property rights
Unless otherwise noted, copyright (and any other intellectual property rights, if any) in this publication is owned by the Commonwealth of Australia (referred to as the Commonwealth).
Creative Commons licence
All material in this publication is licensed under a Creative Commons Attribution 3.0 Australia Licence, save for content supplied by third parties, logos and the Commonwealth Coat of Arms.
Creative Commons Attribution 3.0 Australia Licence is a standard form licence agreement that allows you to copy, distribute, transmit and adapt this publication provided you attribute the work. A summary of the licence terms is available from creativecommons.org/licenses/by/3.0/au/deed.en. The full licence terms are available from creativecommons.org/licenses/by/3.0/au/legalcode.
This publication (and any material sourced from it) should be attributed as: Skirtun, M, Stephan, M, Curtotti, R, & Mazur, K 2015, Australian fisheries economic indicators report 2013: financial and economic performance of the Torres Strait Prawn Fishery, Australian Bureau of Agricultural and Resource Economics and Sciences, Canberra. CC BY 3.0.
Cataloguing data
Skirtun, M, Stephan, M, Curtotti, R, & Mazur, K 2015, Australian fisheries economic indicators report 2013: financial and economic performance of the Torres Strait Prawn Fishery, Australian Bureau of Agricultural and Resource Economics and Sciences, Canberra, April.
ISSN: 2204-9444 ISBN: 978-1-74323-234-7 ABARES project: 43351
Internet
Australian fisheries economic indicators report 2013: financial and economic performance of the Torres Strait Prawn Fishery is available at: agriculture.gov.au/abares/publications.
Department of Agriculture Australian Bureau of Agricultural and Resource Economics and Sciences
Postal address GPO Box 1563 Canberra ACT 2601 Switchboard +61 2 6272 2000 Email [email protected] Web agriculture.gov.au/abares
Inquiries regarding the licence and any use of this document should be sent to: [email protected].
The Australian Government acting through the Department of Agriculture has exercised due care and skill in the preparation and compilation of the information and data in this publication. Notwithstanding, the Department of Agriculture, its employees and its advisers disclaim all liability, including liability for negligence and for any loss, damage, injury, expense or cost incurred by any person as a result of accessing, using or relying on any of the information or data in this publication to the maximum extent permitted by law.
Acknowledgements
The ABARES fisheries survey program involves the cooperative effort of industry, fisheries management, agencies and ABARES staff.
Industry—ABARES surveys are voluntary, so the cooperation of fishing operators and their accountants in providing data is essential for the success of the fisheries surveys. Without this assistance the surveys would not be possible. Report comments were provided by Ron Earle and Marshall Betzel.
Management agencies—the Australian Fisheries Management Authority provided logbook and address data, as well as fishery management costs and general information about the surveyed fisheries. Their comments on earlier drafts are also gratefully acknowledged.
ABARES staff—Daniel George and Robert New assisted with data collection for this project. Rupert Summerson created the maps. Programming and computer systems support was provided by Justin Allen. Ilona Stobutzki provided comments on the report. This report was undertaken using funding from the Fisheries Resources Research Fund.
Australian fisheries economic indicators report 2013: Torres Strait Prawn Fishery
iii
Contents
Summary ................................................................................................................................................................ 1
Key results ................................................................................................................................................. 2
Financial performance ..................................................................................................................................... 2
Economic performance ................................................................................................................................... 3
Other indicators .................................................................................................................................................. 3
1 Introduction .............................................................................................................................................. 5
2 Background ............................................................................................................................................... 8
Description of the fishery ................................................................................................................... 8
Key economic trends............................................................................................................................. 9
Demographic profile of fishers operating in the Torres Strait Prawn Fishery ......... 13
Current management arrangements .......................................................................................... 13
3 Financial and economic performance ........................................................................................ 15
Financial performance ...................................................................................................................... 15
Economic performance ..................................................................................................................... 17
4 Other key indicators ........................................................................................................................... 18
Productivity ........................................................................................................................................... 18
Input costs and output prices ........................................................................................................ 19
Management costs .............................................................................................................................. 20
Entitlement values .............................................................................................................................. 21
Quota latency......................................................................................................................................... 22
5 Performance against management objectives ........................................................................ 23
Appendix A: Survey definitions ................................................................................................................ 25
Financial performance ...................................................................................................................... 25
Net economic return .......................................................................................................................... 26
Survey-based estimation of net economic return ................................................................. 27
Fish sale receipts ............................................................................................................................................. 27
Operating costs ................................................................................................................................................ 27
Capital costs ...................................................................................................................................................... 28
Management costs .......................................................................................................................................... 28
Net economic return and economic performance ................................................................ 28
Appendix B: Survey methods ..................................................................................................................... 29
Collecting economic survey data .............................................................................................................. 29
Sample design ................................................................................................................................................... 29
Sample weighting ............................................................................................................................................ 30
Reliability of estimates ................................................................................................................................. 30
Use of relative standard errors ................................................................................................................. 30
Comparing estimates ..................................................................................................................................... 30
Non-sampling errors ..................................................................................................................................... 31
Appendix C: Non-survey based estimation of net economic return ......................................... 32
Australian fisheries economic indicators report 2013: Torres Strait Prawn Fishery
iv
Method ................................................................................................................................................................. 32
Reliability of estimates ................................................................................................................................. 32
Cash receipts ..................................................................................................................................................... 32
Operating costs ................................................................................................................................................ 33
Interest, leasing and management fees ................................................................................................. 33
Opportunity cost of capital and depreciation ..................................................................................... 33
Management costs .......................................................................................................................................... 33
Appendix D: Productivity methodology ................................................................................................ 34
Productivity measurement ............................................................................................................. 34
Data............................................................................................................................................................ 34
Total factor productivity inputs and outputs ..................................................................................... 36
References .......................................................................................................................................................... 37
Tables
Table 1 Key financial performance results, Torres Strait Prawn Fishery ................................. 2
Table 2 Key economic performance results, Torres Strait Prawn Fishery ............................... 3
Table 3 Financial performance of vessels operating in the Torres Strait Prawn Fishery 16
Table 4 Fishery cash profit and net economic returns, Torres Strait Prawn Fishery ....... 17
Table C1 Regression model for average cash receipts, Torres Strait Prawn Fishery ....... 32
Table C2 Regression model for average operating costs, Torres Strait Prawn Fishery ... 33
Figures
Figure 1 Landed catch of key species, Torres Strait Prawn Fishery ......................................... 10
Figure 2 Exchange rate and average real unit price, Torres Strait Prawn Fishery ............ 10
Figure 3 Real gross value of production, Torres Strait Prawn Fishery ................................... 11
Figure 4 Real net economic returns, Torres Strait Prawn Fishery ............................................ 12
Figure 5 Number of vessels operating, Torres Strait Prawn Fishery ....................................... 13
Figure 6 Key management changes, Torres Strait Prawn Fishery ............................................ 14
Figure 7 Productivity indexes, Torres Strait Prawn Fishery ....................................................... 19
Figure 8 Input cost and output price indexes, Torres Strait Prawn Fishery ......................... 20
Figure 9 Average management cost per active vessel and as share of GVP .......................... 21
Figure 10 Used and unused allowable fishing days, Torres Strait Prawn Fishery ............. 22

Australian fisheries economic indicators report 2013: Torres Strait Prawn Fishery
v
Maps
Map 1 Relative fishing intensity, Torres Strait Prawn Fishery, 2012 ......................................... 8
Boxes
Box 1 Economic indicators for fisheries management ...................................................................... 7
Box D1 Fisher index ....................................................................................................................................... 35
Australian fisheries economic indicators report 2013: Torres Strait Prawn Fishery
1
Summary ABARES has undertaken economic surveys of key Commonwealth fisheries since the early
1990s. This report presents the most recent results from the ABARES financial and economic
survey of the Commonwealth Torres Strait Prawn Fishery (TSPF). Owing to a low level of fishing
effort in recent years, it has become more difficult to collect a large sample of data from the
fishery. In this survey, financial and economic data were collected from a small number of
vessels, five vessels operating in the fishery in 2010‒11 and 2011‒12, representing 20 per cent
of the population of vessels. Given the small sample size in this survey, care should be taken
when drawing conclusions from the results.
The TSPF is located adjacent to the Commonwealth Northern Prawn Fishery (NPF) and
Queensland’s East Coast Otter Trawl Fishery (ECOTF). Trawlers that operate in the TSPF
typically also operate in these adjacent fisheries to balance income from their fishing operations
throughout the year. Most operators in the fishery are based in far north Queensland, with
Cairns being the main home port of the fleet. Management of the fishery is closely aligned to that
used for the ECOTF, where vessel length and gear configurations are similar. Most vessels
operating in the Commonwealth NPF are unsuited to the TSPF because of controls on the
maximum vessel length and restrictions on gear size. However, a small proportion of TSPF
vessels fish in the NPF because their vessel characteristics meet requirements.
The TSPF is a key Torres Strait fishery and the second largest in value. The fishery generated a
gross value of production (GVP) of $6.0 million in 2012‒13, accounting for 22 per cent of the
total GVP ($26.9 million) of Torres Strait fisheries in that year. This production value is
substantially lower than that in 1998‒99, when real GVP peaked at $42 million. Since 1998‒99
GVP from the fishery has steadily declined, reflecting the lower effort expended in the fishery.
Market factors have made fishing in the Torres Strait less profitable. These factors include a high
Australian dollar and greater competition from aquaculture produced prawns, which has led to
reduced output prices. Operating costs have increased significantly as a result of higher fuel
prices and labour costs. In addition to reducing effort, the fleet has responded to adverse market
conditions with autonomous exit from the fishery and increased emphasis on targeting the high
unit value brown tiger prawn rather than Endeavour prawns.
The remoteness of the fishery poses additional challenges. All inputs must be transported by a
mothership from Cairns to the Torres Strait, and catch is shipped back to Cairns for distribution
to more southern markets. This adds considerably to operating costs of the fishery, particularly
in years when fuel prices are high.
The net economic return (NER) from the TSPF has generally declined in line with falls in fishery
GVP. Since 2000‒01 NER has declined and remained negative in all years surveyed by ABARES
since 2004‒05. Negative NER between 2004‒05 and 2007‒08 was largely driven by the decline
in fishing income, when catch in the fishery decreased by an annual average of 12.5 per cent.
Economic returns in 2008‒09 and 2009‒10 have not been estimated because the fishery was
not surveyed in those years. The most recent survey results show NER in 2010‒11 and 2011‒12
remained negative but improved compared with 2007‒08, mainly resulting from increases in
catch and prices for the main species caught over the survey period.
Australian fisheries economic indicators report 2013: Torres Strait Prawn Fishery
2
The lack of positive NER from the fishery since 2004‒05 remains an issue of concern to
managers. Given the fishery’s geographical isolation, lack of supporting infrastructure and low
participation, it is likely that returns will not rise significantly without a change in the operating
environment. High input costs and low prices made it difficult to operate profitably in the fishery
in 2010‒11 and 2011‒12. Lower prices for diesel fuel and a lower Australian dollar exchange
rate are likely to improve economic returns and participation in the fishery in 2013‒14 and
2014‒15.
The fishery is formally managed by the Torres Strait Protected Zone Joint Authority. Before it
can make changes to input settings in response to adverse market conditions, the authority
generally conducts complex consultative processes with stakeholders. These include the local
Indigenous community, which relies on the sea for its livelihood. The authority must also
consider any changes against its broader social and economic objectives in managing Torres
Strait fisheries.
Key results
Financial performance
Financial performance estimates are calculated for the average vessel in a fishery and include all cash receipts and cash costs that have been earned and incurred from all business activities within the survey period, including from operating in other fisheries (such as the Commonwealth NPF and Queensland ECOTF).
The 2013 TSPF survey collected data for 2010‒11 and 2011‒12.
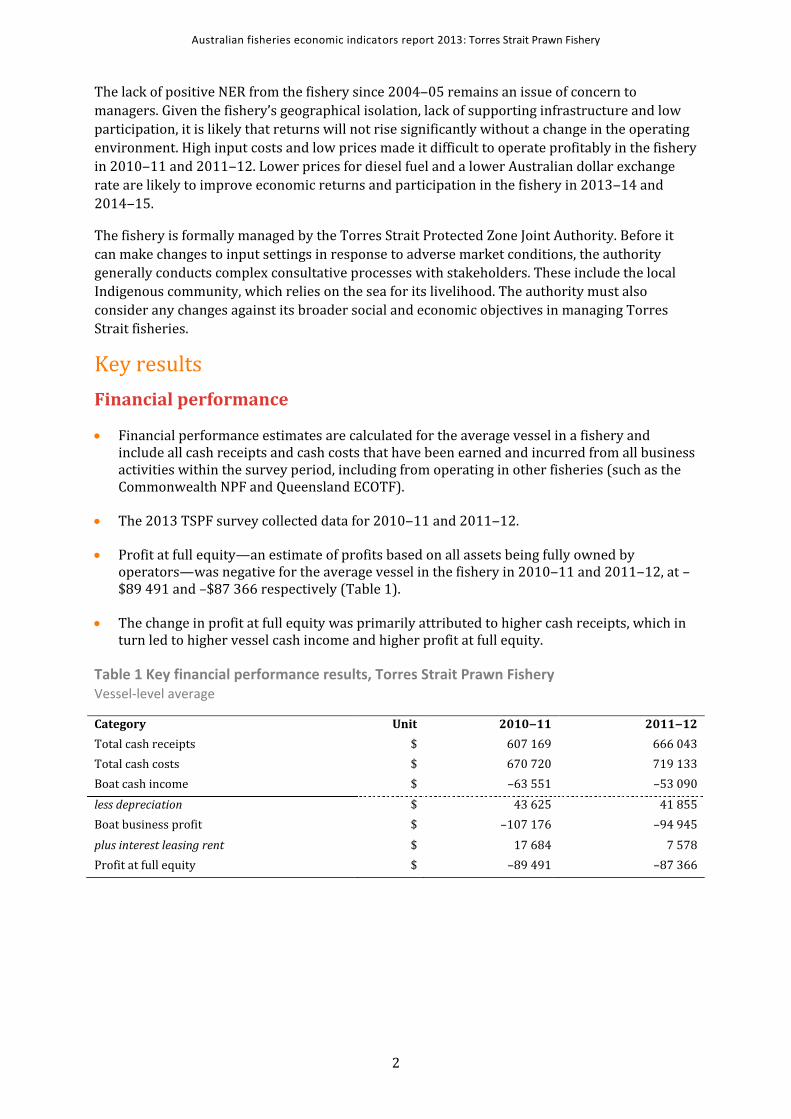
Profit at full equity—an estimate of profits based on all assets being fully owned by operators—was negative for the average vessel in the fishery in 2010‒11 and 2011‒12, at –$89 491 and –$87 366 respectively (Table 1).
The change in profit at full equity was primarily attributed to higher cash receipts, which in turn led to higher vessel cash income and higher profit at full equity.
Table 1 Key financial performance results, Torres Strait Prawn Fishery Vessel-level average
Category Unit 2010‒11 2011‒12
Total cash receipts $ 607 169 666 043
Total cash costs $ 670 720 719 133
Boat cash income $ –63 551 –53 090
less depreciation $ 43 625 41 855
Boat business profit $ –107 176 –94 945
plus interest leasing rent $ 17 684 7 578
Profit at full equity $ –89 491 –87 366
Australian fisheries economic indicators report 2013: Torres Strait Prawn Fishery
3
Economic performance
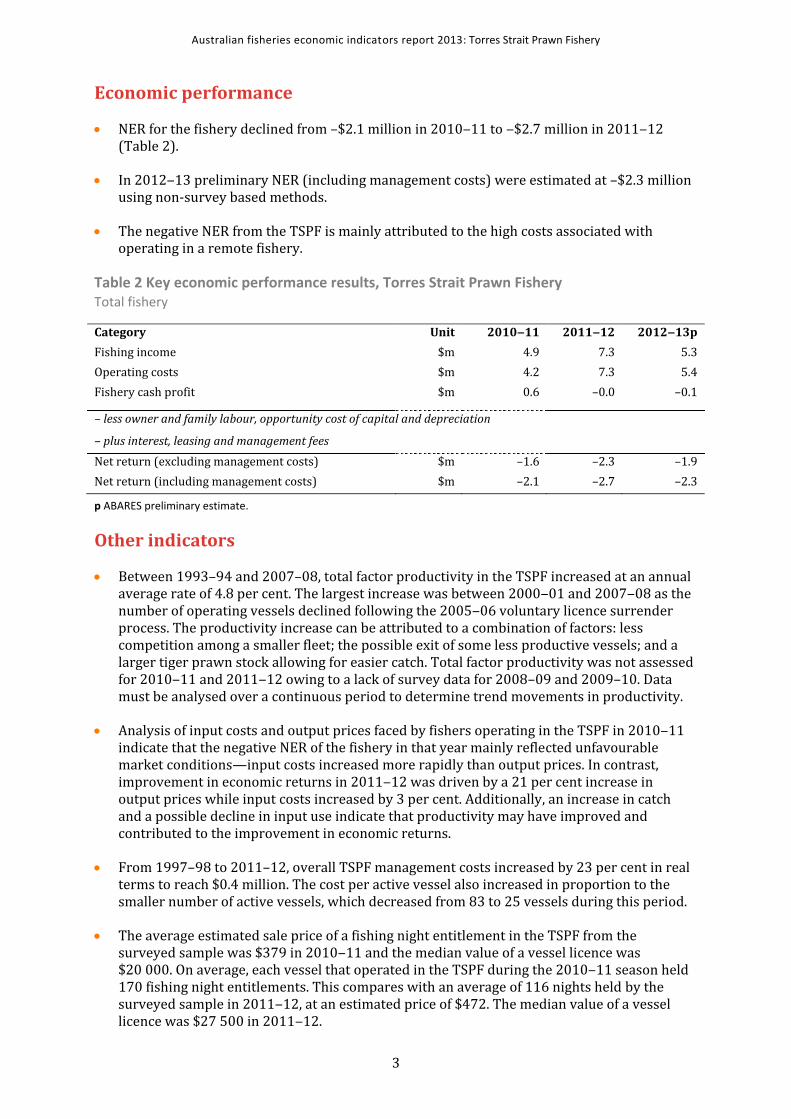
NER for the fishery declined from –$2.1 million in 2010‒11 to ‒$2.7 million in 2011‒12 (Table 2).
In 2012‒13 preliminary NER (including management costs) were estimated at –$2.3 million using non-survey based methods.
The negative NER from the TSPF is mainly attributed to the high costs associated with operating in a remote fishery.
Table 2 Key economic performance results, Torres Strait Prawn Fishery Total fishery
Category Unit 2010‒11 2011‒12 2012‒13p
Fishing income $m 4.9 7.3 5.3
Operating costs $m 4.2 7.3 5.4
Fishery cash profit $m 0.6 –0.0 –0.1
– less owner and family labour, opportunity cost of capital and depreciation
– plus interest, leasing and management fees
Net return (excluding management costs) $m –1.6 –2.3 –1.9
Net return (including management costs) $m –2.1 –2.7 –2.3
p ABARES preliminary estimate.
Other indicators
Between 1993–94 and 2007–08, total factor productivity in the TSPF increased at an annual average rate of 4.8 per cent. The largest increase was between 2000‒01 and 2007‒08 as the number of operating vessels declined following the 2005‒06 voluntary licence surrender process. The productivity increase can be attributed to a combination of factors: less competition among a smaller fleet; the possible exit of some less productive vessels; and a larger tiger prawn stock allowing for easier catch. Total factor productivity was not assessed for 2010‒11 and 2011‒12 owing to a lack of survey data for 2008–09 and 2009–10. Data must be analysed over a continuous period to determine trend movements in productivity.
Analysis of input costs and output prices faced by fishers operating in the TSPF in 2010‒11 indicate that the negative NER of the fishery in that year mainly reflected unfavourable market conditions—input costs increased more rapidly than output prices. In contrast, improvement in economic returns in 2011‒12 was driven by a 21 per cent increase in output prices while input costs increased by 3 per cent. Additionally, an increase in catch and a possible decline in input use indicate that productivity may have improved and contributed to the improvement in economic returns.
From 1997–98 to 2011–12, overall TSPF management costs increased by 23 per cent in real terms to reach $0.4 million. The cost per active vessel also increased in proportion to the smaller number of active vessels, which decreased from 83 to 25 vessels during this period.
The average estimated sale price of a fishing night entitlement in the TSPF from the surveyed sample was $379 in 2010‒11 and the median value of a vessel licence was $20 000. On average, each vessel that operated in the TSPF during the 2010‒11 season held 170 fishing night entitlements. This compares with an average of 116 nights held by the surveyed sample in 2011‒12, at an estimated price of $472. The median value of a vessel licence was $27 500 in 2011‒12.

Australian fisheries economic indicators report 2013: Torres Strait Prawn Fishery
4
Introduction of the total allowable effort cap of 9 200 days in 2006 significantly reduced latency in unused fishing nights. However, latency levels quickly reinstated, especially post 2009. Between the 2009 and 2013 fishing seasons, effort levels in the TSPF were on average 74 per cent below the 6 867 days available to Australian operators.
Australian fisheries economic indicators report 2013: Torres Strait Prawn Fishery
5
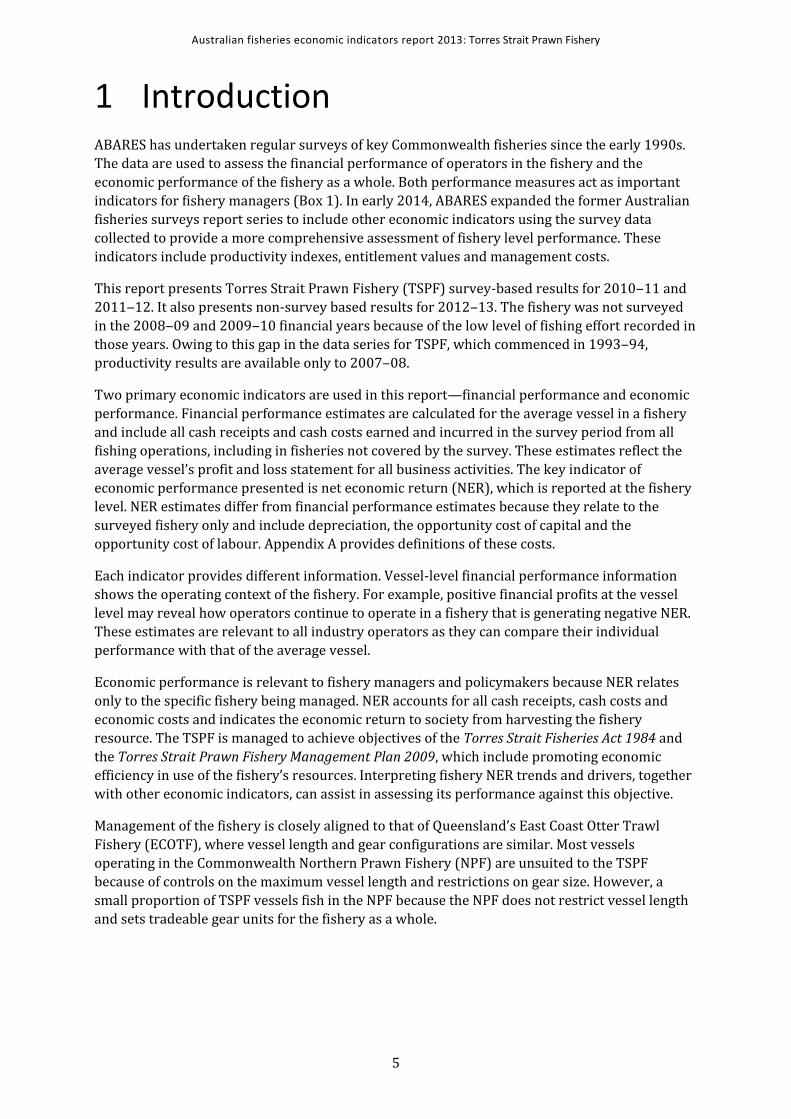
1 Introduction ABARES has undertaken regular surveys of key Commonwealth fisheries since the early 1990s.
The data are used to assess the financial performance of operators in the fishery and the
economic performance of the fishery as a whole. Both performance measures act as important
indicators for fishery managers (Box 1). In early 2014, ABARES expanded the former Australian
fisheries surveys report series to include other economic indicators using the survey data
collected to provide a more comprehensive assessment of fishery level performance. These
indicators include productivity indexes, entitlement values and management costs.
This report presents Torres Strait Prawn Fishery (TSPF) survey-based results for 2010‒11 and
2011‒12. It also presents non-survey based results for 2012‒13. The fishery was not surveyed
in the 2008‒09 and 2009‒10 financial years because of the low level of fishing effort recorded in
those years. Owing to this gap in the data series for TSPF, which commenced in 1993‒94,
productivity results are available only to 2007‒08.
Two primary economic indicators are used in this report—financial performance and economic
performance. Financial performance estimates are calculated for the average vessel in a fishery
and include all cash receipts and cash costs earned and incurred in the survey period from all
fishing operations, including in fisheries not covered by the survey. These estimates reflect the
average vessel’s profit and loss statement for all business activities. The key indicator of
economic performance presented is net economic return (NER), which is reported at the fishery
level. NER estimates differ from financial performance estimates because they relate to the
surveyed fishery only and include depreciation, the opportunity cost of capital and the
opportunity cost of labour. Appendix A provides definitions of these costs.
Each indicator provides different information. Vessel-level financial performance information
shows the operating context of the fishery. For example, positive financial profits at the vessel
level may reveal how operators continue to operate in a fishery that is generating negative NER.
These estimates are relevant to all industry operators as they can compare their individual
performance with that of the average vessel.
Economic performance is relevant to fishery managers and policymakers because NER relates
only to the specific fishery being managed. NER accounts for all cash receipts, cash costs and
economic costs and indicates the economic return to society from harvesting the fishery
resource. The TSPF is managed to achieve objectives of the Torres Strait Fisheries Act 1984 and
the Torres Strait Prawn Fishery Management Plan 2009, which include promoting economic
efficiency in use of the fishery’s resources. Interpreting fishery NER trends and drivers, together
with other economic indicators, can assist in assessing its performance against this objective.
Management of the fishery is closely aligned to that of Queensland’s East Coast Otter Trawl
Fishery (ECOTF), where vessel length and gear configurations are similar. Most vessels
operating in the Commonwealth Northern Prawn Fishery (NPF) are unsuited to the TSPF
because of controls on the maximum vessel length and restrictions on gear size. However, a
small proportion of TSPF vessels fish in the NPF because the NPF does not restrict vessel length
and sets tradeable gear units for the fishery as a whole.

Australian fisheries economic indicators report 2013: Torres Strait Prawn Fishery
6
The TSPF is formally managed by the Torres Strait Protected Zone Joint Authority. Its primary
objective is to ensure optimum use of its resources consistent with the principles of ecologically
sustainable development and the exercise of the precautionary principle in the Torres Strait
Prawn Fishery Management Plan 2009. This includes preserving ecologically sustainable
traditional fishing opportunities for traditional inhabitants of Australia and Papua New Guinea.
Before it can make changes to input settings in response to adverse market conditions, the
authority usually conducts complex consultative processes with stakeholders. Stakeholders
include the local Indigenous community, which relies on the sea for its livelihood.
Twenty-five vessels were active in the fishery in 2010‒11 and 2011‒12. The survey sample was
small, at five vessels in both years, representing 20 per cent of the population in both years.
Given the small sample size, care should be taken when drawing conclusions from these results.
Relative standard errors are provided with the survey results to guide interpretation.
Australian fisheries economic indicators report 2013: Torres Strait Prawn Fishery
7
Box 1 Economic indicators for fisheries management
In September 2007 the Australian Government released the Commonwealth Fisheries Harvest Strategy Policy to provide increased guidance for managing Australia’s Commonwealth fisheries sustainably and profitably. The policy’s objective is to maintain key commercial stocks at ecologically sustainable levels and to maximise the economic returns to the Australian community by targeting maximum economic yield (MEY) (DAFF 2007). Although the policy does not prescribe management arrangements for fisheries jointly managed by the Australian Government and other management agencies, such as the Torres Strait Prawn Fishery, the Protected Zone Joint Authority (PZJA) has asked its management forums to advise on whether the policy should be applied to Torres Strait fisheries. The TSPF is managed according to the economic objective of promoting economic development and ensuring optimal use of the fishery resource. The recently implemented harvest strategy for the fishery does not have a target biomass level associated with an MEY estimate . This is because the fishery has a low economic value and the cost of estimating a target is expected to be high (AFMA 2011). As such, a target, a target biomass level associated with achieving maximum sustainable yield (MSY), will be used until fishing activity increases to a point where a target is to be determined and implemented (AFMA 2011). Assessment of net economic returns in the TSPF gives fisheries managers and policymakers useful information about economic performance and activities. In fishery management, several economic indicators generally serve two main purposes: informing management decisions against the economic objective and monitoring management performance against the economic objective.
Informing management decisions against the economic objective
Some economic indicators are forward-looking and can advise fishery managers on policy settings necessary to achieve MEY. These may be required for the TSPF in the future. Bio-economic models provide indicators that serve this purpose; models have been developed for the Commonwealth Northern Prawn Fishery (Kompas & Che 2004) and the Commonwealth Southern and Eastern Scalefish and Shark Fishery (Kompas & Che 2008). Management strategy evaluation based approaches that include an economic component can also serve this purpose and may be an area for future research on general fishery management.
Monitoring management performance against the economic objective
Other economic indicators are backward-looking and can assist in assessing the impact of previous management decisions on economic performance. Most indicators examined in this report fall into this category. This includes the survey-based estimation of net economic return (NER), productivity indexes, entitlement values, management costs and profitability indexes.
Total factor productivity analysis is an economic tool used to assess how well fishers use inputs such as fuel and labour to produce outputs (catch) and how their ability to convert inputs to outputs has changed over time, with changes in the fishery’s operating environment. Productivity indexes inform fishery managers about the effect of management arrangements on average productivity levels in the fishery.
Analysis of management costs helps fishery managers understand the overall burden of these costs on a fishery. Management costs become more burdensome to a fishery when the number of concession holders reduces significantly. This is because a large portion of management costs are set to recover the fixed costs of managing the fishery, which does not tend to reduce when fishers exit. Measures of management costs, as a proportion of gross value of fishery production (GVP) and per active vessel, provide general information about the cost-effectiveness of fishery management.
Entitlement values signal the current value of resources in the fishery. If entitlement values increase over time, it suggests that resources are being managed effectively because operating in the fishery is deemed to have become more profitable.
Australian fisheries economic indicators report 2013: Torres Strait Prawn Fishery
8
2 Background
Description of the fishery
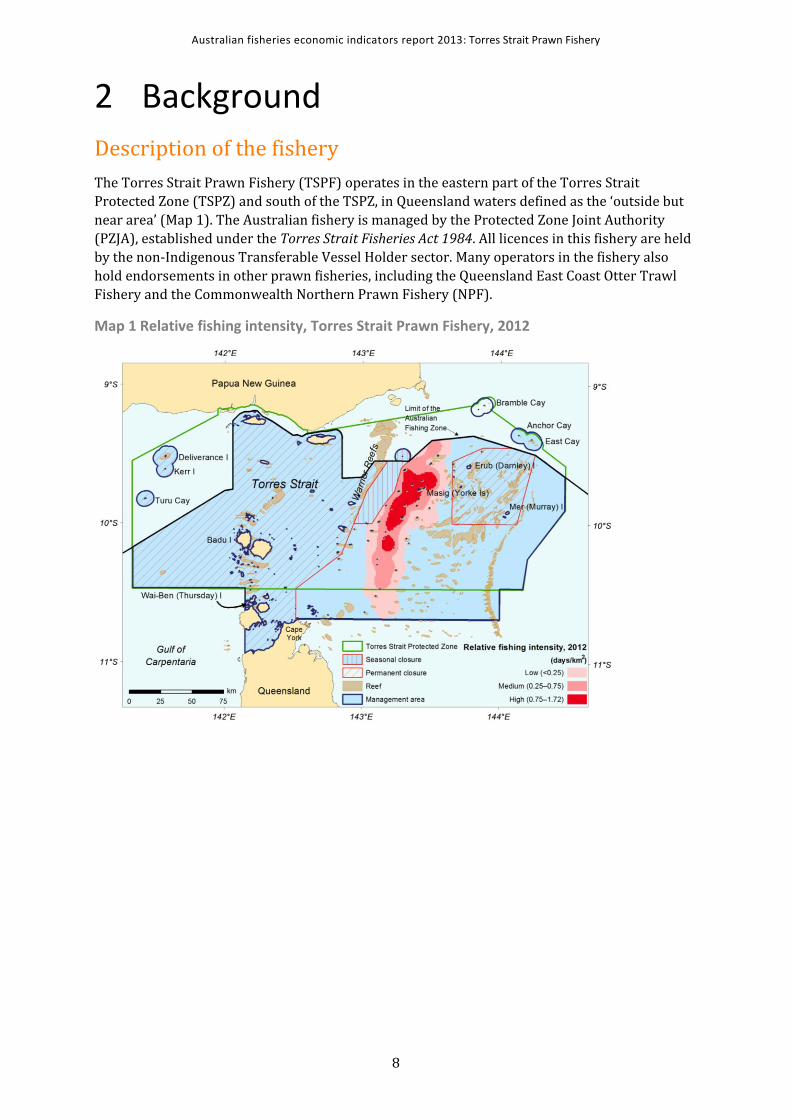
The Torres Strait Prawn Fishery (TSPF) operates in the eastern part of the Torres Strait
Protected Zone (TSPZ) and south of the TSPZ, in Queensland waters defined as the ‘outside but
near area’ (Map 1). The Australian fishery is managed by the Protected Zone Joint Authority
(PZJA), established under the Torres Strait Fisheries Act 1984. All licences in this fishery are held
by the non-Indigenous Transferable Vessel Holder sector. Many operators in the fishery also
hold endorsements in other prawn fisheries, including the Queensland East Coast Otter Trawl
Fishery and the Commonwealth Northern Prawn Fishery (NPF).
Map 1 Relative fishing intensity, Torres Strait Prawn Fishery, 2012
Australian fisheries economic indicators report 2013: Torres Strait Prawn Fishery
9
Under the Torres Strait Treaty, ratified in 1985, Papua New Guinea is entitled to 25 per cent of
the TSPF resource in the Australian Fishing Zone and Australia is entitled to 25 per cent of the
TSPF resource in the Papua New Guinea area of fisheries jurisdiction. In the past some
Australian vessels fished in Papua New Guinea waters, but this ceased soon after ratification of
the Torres Strait Treaty. There is no official record of Papua New Guinea vessels fishing in
Australian waters, and Papua New Guinea operators have only sporadically activated their
entitlements to fish in their own waters of the TSPZ. Up to and including the 2011 fishing season,
fishing effort was decreasing, largely as a result of economic conditions in the fishery
(Georgeson, Stobutzki & Curtotti 2014). In the 2012 fishing season total catch in the TSPF
increased by approximately 82 per cent. Georgeson, Stobutzki and Curtotti (2014) note that the
stocks fished in the TSPF are not overfished or subject to over fishing, with the two main target
species, brown tiger prawns and blue endeavour prawns both having an estimated biomass level
in excess of the level associated with maximum sustainable yield. The fishery is subject to
several spatial and temporal closures, initiated for various reasons—including to protect
undersized tiger prawns, pearl shell beds and breeding populations of marine turtles (Cocking &
Turnbull 2014).
The Harvest strategy for the Torres Strait Prawn Fishery 2011 (AFMA 2011) defines a set of
triggers, targets and limit reference points and decision rules for the fishery as a whole and for
tiger prawns. The harvest strategy also defines a catch trigger for Endeavour prawns. The
current triggers are set to reflect the reduced effort in the fishery in recent years and can be
revised and updated if activity in the fishery increases.
Given the current low level of effort in the fishery, the harvest strategy sets a total allowable
effort (TAE) consistent with achieving a biomass at maximum sustainable yield . The
strategy also defines a long-term economic target based on setting a TAE consistent with
achieving a biomass at maximum economic yield , which will be pursued once fishery
catch-and-effort triggers are reached. The PZJA is not pursuing this long-term economic target
because the fishery does not have the resources to calculate and catch-and-effort triggers
have not been reached. Additionally, because a target would reduce fishing effort
compared with , there is concern that introducing an economic target would put additional
pressure on operators when the fishery is already under economic pressure. Setting a
target could cause some licence holders to surrender their entitlements, which would result in
fewer operators sharing management costs (AFMA 2011).
Key economic trends
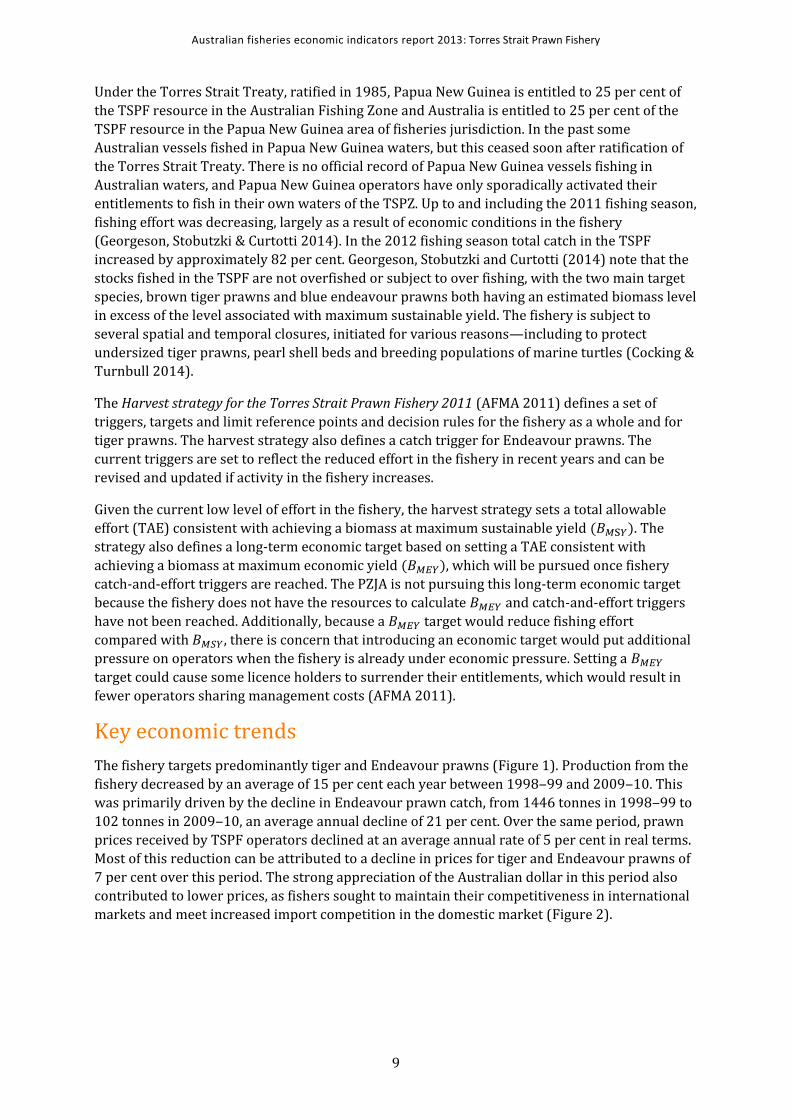
The fishery targets predominantly tiger and Endeavour prawns (Figure 1). Production from the
fishery decreased by an average of 15 per cent each year between 1998‒99 and 2009‒10. This
was primarily driven by the decline in Endeavour prawn catch, from 1446 tonnes in 1998‒99 to
102 tonnes in 2009‒10, an average annual decline of 21 per cent. Over the same period, prawn
prices received by TSPF operators declined at an average annual rate of 5 per cent in real terms.
Most of this reduction can be attributed to a decline in prices for tiger and Endeavour prawns of
7 per cent over this period. The strong appreciation of the Australian dollar in this period also
contributed to lower prices, as fishers sought to maintain their competitiveness in international
markets and meet increased import competition in the domestic market (Figure 2).
Australian fisheries economic indicators report 2013: Torres Strait Prawn Fishery
10
Figure 1 Landed catch of key species, Torres Strait Prawn Fishery
p ABARES preliminary estimate.
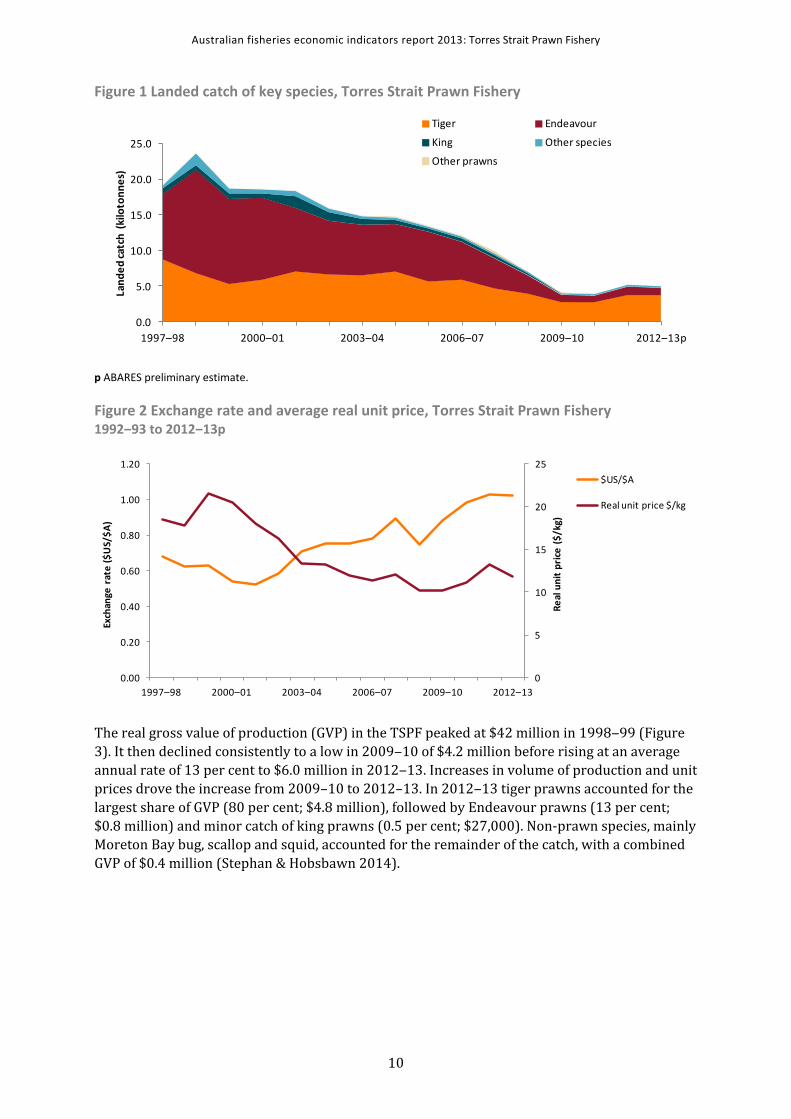
Figure 2 Exchange rate and average real unit price, Torres Strait Prawn Fishery 1992‒93 to 2012‒13p
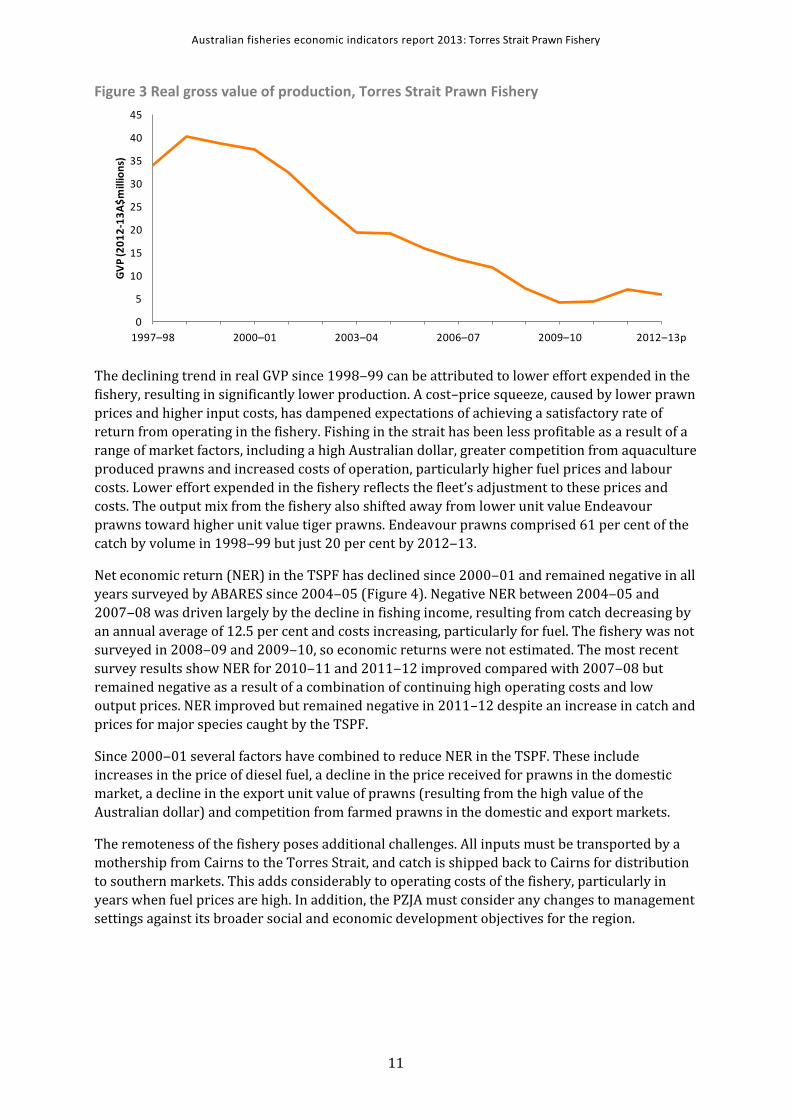
The real gross value of production (GVP) in the TSPF peaked at $42 million in 1998‒99 (Figure
3). It then declined consistently to a low in 2009‒10 of $4.2 million before rising at an average
annual rate of 13 per cent to $6.0 million in 2012‒13. Increases in volume of production and unit
prices drove the increase from 2009–10 to 2012–13. In 2012‒13 tiger prawns accounted for the
largest share of GVP (80 per cent; $4.8 million), followed by Endeavour prawns (13 per cent;
$0.8 million) and minor catch of king prawns (0.5 per cent; $27,000). Non-prawn species, mainly
Moreton Bay bug, scallop and squid, accounted for the remainder of the catch, with a combined
GVP of $0.4 million (Stephan & Hobsbawn 2014).
0.0
5.0
10.0
15.0
20.0
25.0
1997–98 2000–01 2003–04 2006–07 2009–10 2012–13p
Lan
de
d c
atch
(ki
loto
nn
es)
Tiger Endeavour
King Other species
Other prawns
0
5
10
15
20
25
0.00
0.20
0.40
0.60
0.80
1.00
1.20
1997–98 2000–01 2003–04 2006–07 2009–10 2012–13
Re
al u
nit
pri
ce (
$/k
g)
Exch
ange
rat
e (
$U
S/$
A)
$US/$A
Real unit price $/kg
Australian fisheries economic indicators report 2013: Torres Strait Prawn Fishery
11
Figure 3 Real gross value of production, Torres Strait Prawn Fishery
The declining trend in real GVP since 1998‒99 can be attributed to lower effort expended in the
fishery, resulting in significantly lower production. A cost–price squeeze, caused by lower prawn
prices and higher input costs, has dampened expectations of achieving a satisfactory rate of
return from operating in the fishery. Fishing in the strait has been less profitable as a result of a
range of market factors, including a high Australian dollar, greater competition from aquaculture
produced prawns and increased costs of operation, particularly higher fuel prices and labour
costs. Lower effort expended in the fishery reflects the fleet’s adjustment to these prices and
costs. The output mix from the fishery also shifted away from lower unit value Endeavour
prawns toward higher unit value tiger prawns. Endeavour prawns comprised 61 per cent of the
catch by volume in 1998‒99 but just 20 per cent by 2012‒13.
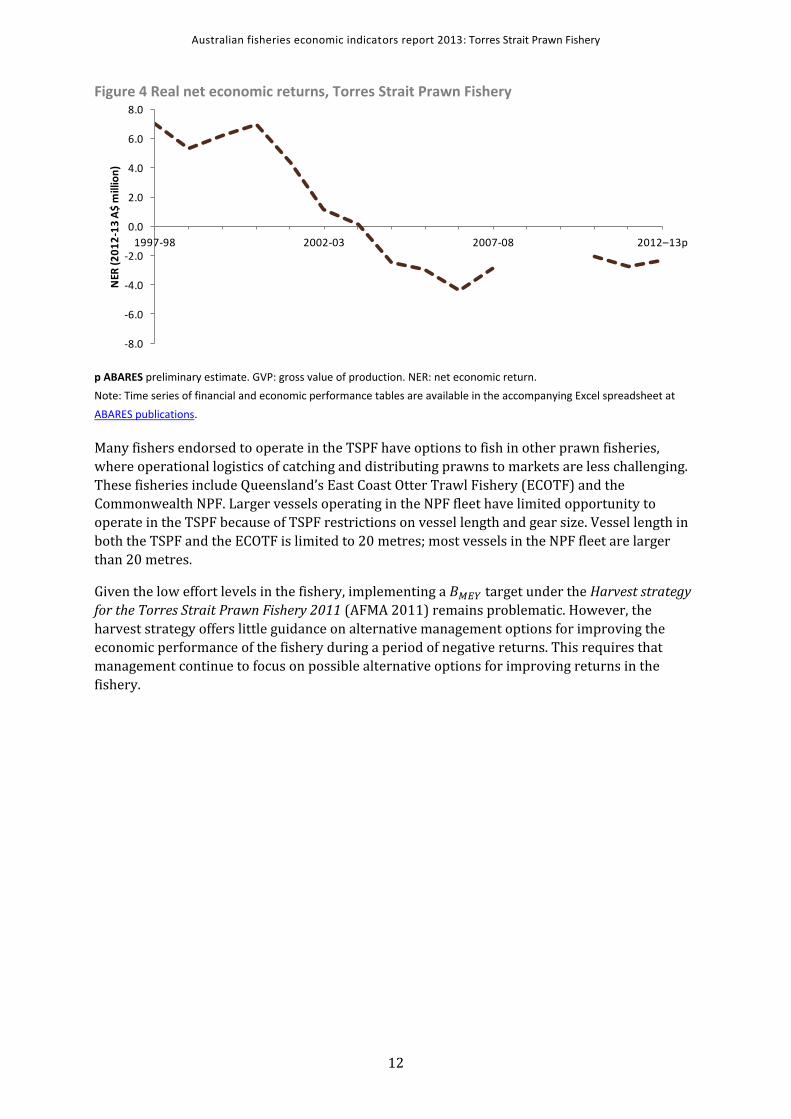
Net economic return (NER) in the TSPF has declined since 2000‒01 and remained negative in all
years surveyed by ABARES since 2004‒05 (Figure 4). Negative NER between 2004‒05 and
2007‒08 was driven largely by the decline in fishing income, resulting from catch decreasing by
an annual average of 12.5 per cent and costs increasing, particularly for fuel. The fishery was not
surveyed in 2008‒09 and 2009‒10, so economic returns were not estimated. The most recent
survey results show NER for 2010‒11 and 2011‒12 improved compared with 2007‒08 but
remained negative as a result of a combination of continuing high operating costs and low
output prices. NER improved but remained negative in 2011–12 despite an increase in catch and
prices for major species caught by the TSPF.
Since 2000‒01 several factors have combined to reduce NER in the TSPF. These include
increases in the price of diesel fuel, a decline in the price received for prawns in the domestic
market, a decline in the export unit value of prawns (resulting from the high value of the
Australian dollar) and competition from farmed prawns in the domestic and export markets.
The remoteness of the fishery poses additional challenges. All inputs must be transported by a
mothership from Cairns to the Torres Strait, and catch is shipped back to Cairns for distribution
to southern markets. This adds considerably to operating costs of the fishery, particularly in
years when fuel prices are high. In addition, the PZJA must consider any changes to management
settings against its broader social and economic development objectives for the region.
0
5
10
15
20
25
30
35
40
45
1997–98 2000–01 2003–04 2006–07 2009–10 2012–13p
GV
P (2
01
2-1
3A
$m
illio
ns)
Australian fisheries economic indicators report 2013: Torres Strait Prawn Fishery
12
Figure 4 Real net economic returns, Torres Strait Prawn Fishery
p ABARES preliminary estimate. GVP: gross value of production. NER: net economic return.
Note: Time series of financial and economic performance tables are available in the accompanying Excel spreadsheet at
ABARES publications.
Many fishers endorsed to operate in the TSPF have options to fish in other prawn fisheries,
where operational logistics of catching and distributing prawns to markets are less challenging.
These fisheries include Queensland’s East Coast Otter Trawl Fishery (ECOTF) and the
Commonwealth NPF. Larger vessels operating in the NPF fleet have limited opportunity to
operate in the TSPF because of TSPF restrictions on vessel length and gear size. Vessel length in
both the TSPF and the ECOTF is limited to 20 metres; most vessels in the NPF fleet are larger
than 20 metres.
Given the low effort levels in the fishery, implementing a target under the Harvest strategy
for the Torres Strait Prawn Fishery 2011 (AFMA 2011) remains problematic. However, the
harvest strategy offers little guidance on alternative management options for improving the
economic performance of the fishery during a period of negative returns. This requires that
management continue to focus on possible alternative options for improving returns in the
fishery.
-8.0
-6.0
-4.0
-2.0
0.0
2.0
4.0
6.0
8.0
1997-98 2002-03 2007-08 2012–13p
NER
(2
01
2-1
3 A
$ m
illio
n)
Australian fisheries economic indicators report 2013: Torres Strait Prawn Fishery
13
Demographic profile of fishers operating in the Torres Strait Prawn Fishery
The median age of skippers was 38 years in 2010‒11 and 44 years in 2011‒12. On average,
skippers had around seven years experience operating in the TSPF and 23 years fishing
experience in total. Year 10 completion was the highest education level attained for 60 per cent
of skippers in 2010–11 and 100 per cent in 2011–12. In 2010–11 the highest qualification
obtained by skippers was a trade/technical apprenticeship.
Current management arrangements
The harvest strategy’s limit reference point is set at 20 per cent of unfished biomass (0.2B0),
consistent with the default provided in the Commonwealth Fisheries Harvest Strategy Policy
(DAFF 2007). The target reference point (BTARG) is based on maximum sustainable yield (MSY)—
that is, BTARG = BMSY. This target is not based on achieving a maximum economic yield (MEY) from
the fishery, but the triggers in this fishery are aligned with the concept of MEY. This is consistent
with the fishery’s goal to move to MEY-based targets when fishing activity increases
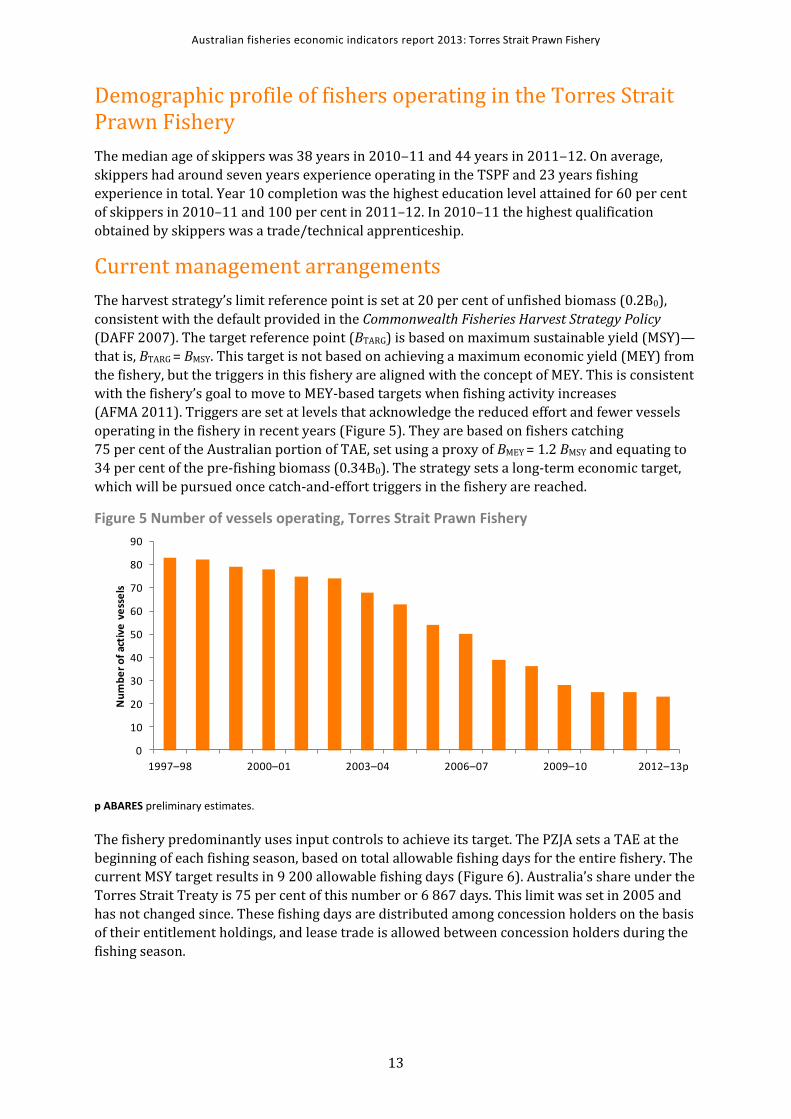
(AFMA 2011). Triggers are set at levels that acknowledge the reduced effort and fewer vessels
operating in the fishery in recent years (Figure 5). They are based on fishers catching
75 per cent of the Australian portion of TAE, set using a proxy of BMEY = 1.2 BMSY and equating to
34 per cent of the pre-fishing biomass (0.34B0). The strategy sets a long-term economic target,
which will be pursued once catch-and-effort triggers in the fishery are reached.
Figure 5 Number of vessels operating, Torres Strait Prawn Fishery
p ABARES preliminary estimates.
The fishery predominantly uses input controls to achieve its target. The PZJA sets a TAE at the
beginning of each fishing season, based on total allowable fishing days for the entire fishery. The
current MSY target results in 9 200 allowable fishing days (Figure 6). Australia’s share under the
Torres Strait Treaty is 75 per cent of this number or 6 867 days. This limit was set in 2005 and
has not changed since. These fishing days are distributed among concession holders on the basis
of their entitlement holdings, and lease trade is allowed between concession holders during the
fishing season.
0
10
20
30
40
50
60
70
80
90
1997–98 2000–01 2003–04 2006–07 2009–10 2012–13p
Nu
mb
er
of
acti
ve v
ess
els
Australian fisheries economic indicators report 2013: Torres Strait Prawn Fishery
14
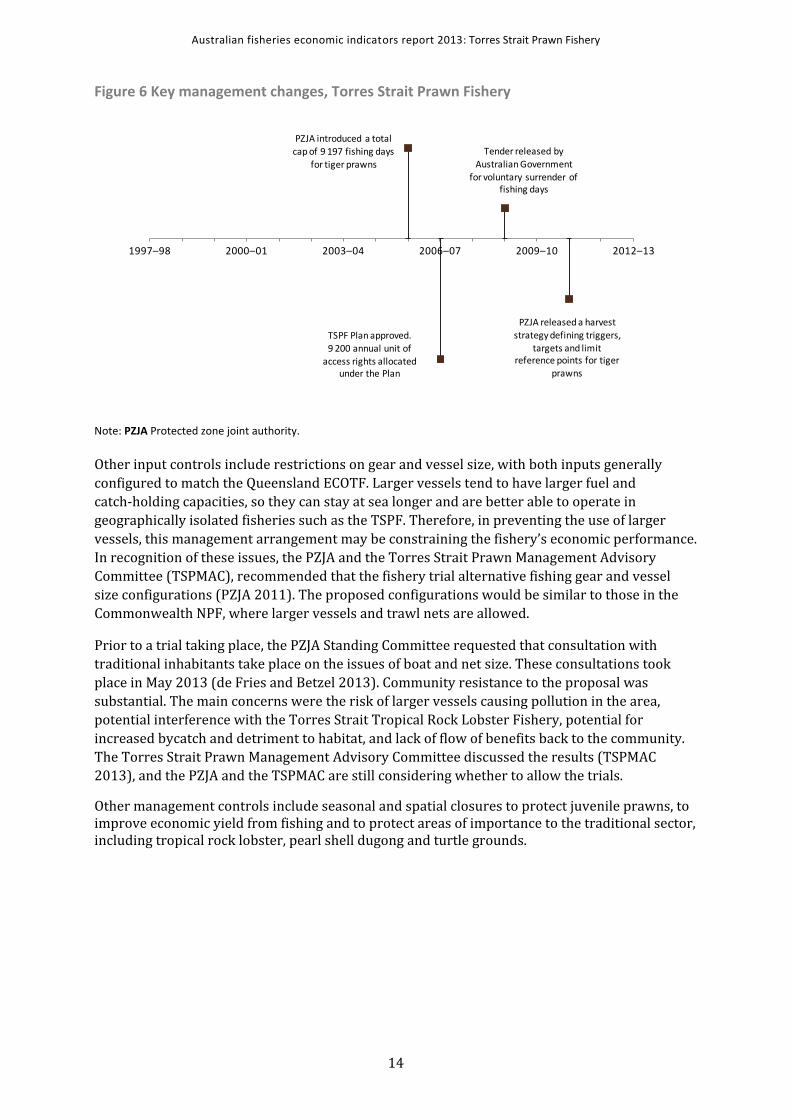
Figure 6 Key management changes, Torres Strait Prawn Fishery
Note: PZJA Protected zone joint authority.
Other input controls include restrictions on gear and vessel size, with both inputs generally
configured to match the Queensland ECOTF. Larger vessels tend to have larger fuel and
catch-holding capacities, so they can stay at sea longer and are better able to operate in
geographically isolated fisheries such as the TSPF. Therefore, in preventing the use of larger
vessels, this management arrangement may be constraining the fishery’s economic performance.
In recognition of these issues, the PZJA and the Torres Strait Prawn Management Advisory
Committee (TSPMAC), recommended that the fishery trial alternative fishing gear and vessel
size configurations (PZJA 2011). The proposed configurations would be similar to those in the
Commonwealth NPF, where larger vessels and trawl nets are allowed.
Prior to a trial taking place, the PZJA Standing Committee requested that consultation with
traditional inhabitants take place on the issues of boat and net size. These consultations took
place in May 2013 (de Fries and Betzel 2013). Community resistance to the proposal was
substantial. The main concerns were the risk of larger vessels causing pollution in the area,
potential interference with the Torres Strait Tropical Rock Lobster Fishery, potential for
increased bycatch and detriment to habitat, and lack of flow of benefits back to the community.
The Torres Strait Prawn Management Advisory Committee discussed the results (TSPMAC
2013), and the PZJA and the TSPMAC are still considering whether to allow the trials.
Other management controls include seasonal and spatial closures to protect juvenile prawns, to improve economic yield from fishing and to protect areas of importance to the traditional sector, including tropical rock lobster, pearl shell dugong and turtle grounds.
PZJA introduced a total cap of 9 197 fishing days
for tiger prawns
TSPF Plan approved.
9 200 annual unit of access rights allocated
under the Plan
Tender released by Australian Government
for voluntary surrender of fishing days
PZJA released a harvest
strategy defining triggers, targets and limit
reference points for tiger prawns
1997–98 2000–01 2003–04 2006–07 2009–10 2012–13
Australian fisheries economic indicators report 2013: Torres Strait Prawn Fishery
15
3 Financial and economic performance
Financial performance
The survey population for a given year consists of vessels that recorded more than 1 tonne of
catch in the Torres Strait Prawn Fishery (TSPF). The population was 25 vessels in both 2010‒11
and 2011‒12. The survey sample was five vessels in both years, representing 20 per cent of the
population in both 2010‒11 and 2011‒12. Given the small sample size, care should be taken
when drawing conclusions from these results. Survey method details are in Appendix B.
Some operators surveyed indicated that they operated in other fisheries during the survey
period. Time spent operating in other fisheries varied between operators. Receipts and costs
associated with operating in these fisheries have been included in the average vessel financial
performance results to reflect the average vessel’s profit and loss statement for all business
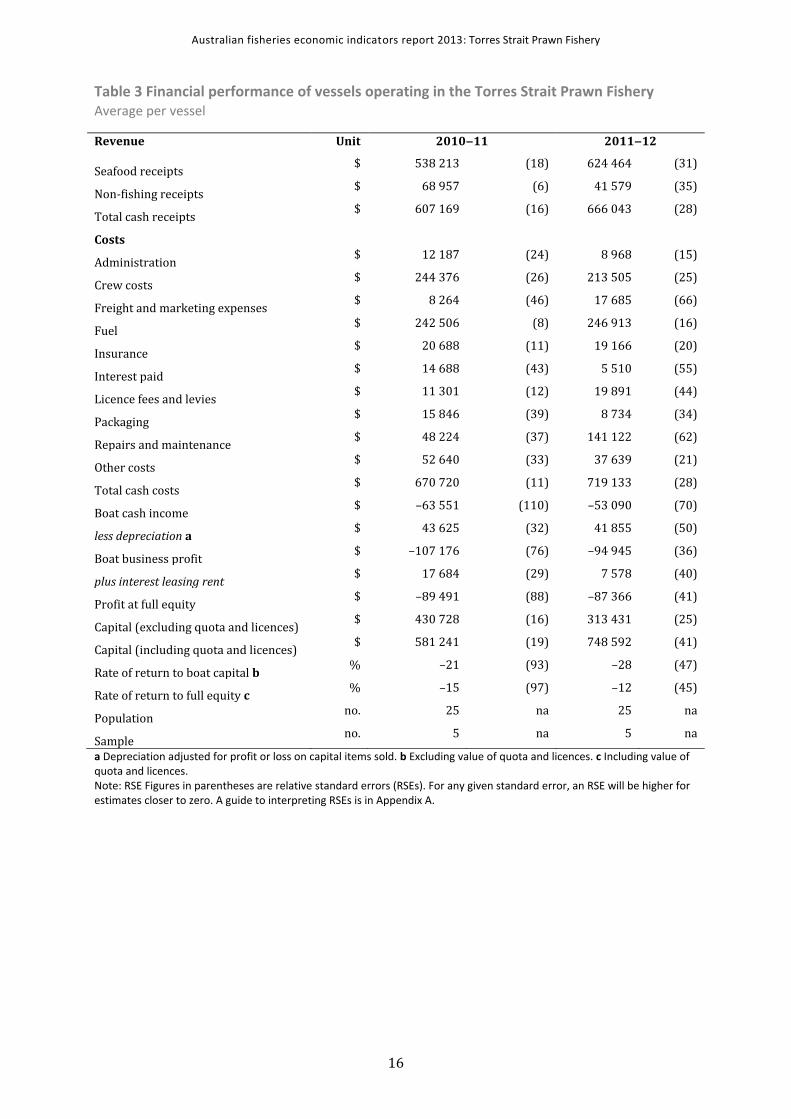
activities. The financial performance of the average vessel operating in the TSPF improved
slightly between 2010‒11 and 2011‒12 (Table 3). The average vessel’s boat cash income
increased by around $10 461 as result of a higher increase in total cash receipts (10 per cent or
$58 874) compared with that of total cash costs (7 per cent or $48 413).
The large increase in average total cash receipts in 2011‒12 (to $666 043 per vessel) was
supported by strong growth in seafood receipts, which increased by 16 per cent to reach
$624 464. Contributing to the increase in seafood receipts was an increase in tiger and
Endeavour prawn catch from 2010‒11 to 2011‒12. Tiger prawn catch in the TSPF increased by
36 per cent (99 tonnes) between 2010‒11 and 2011‒12 and Endeavour prawn catch increased
by 29 per cent (26 tonnes) (Skirtun, Sahlqvist & Viera 2013).
In 2011‒12 the average vessel total cash costs increased by $48 413 (or 7 per cent) to $719 133.
Fuel costs accounted for the largest share of cash costs, at $246 913 (34 per cent) in 2011‒12.
Compared with 2010‒11, fuel costs increased by 2 per cent ($4 407). Labour costs were the
second-largest cost, accounting for 30 per cent (or $213 505) of total cash costs. Profit at full
equity for the average TSPF vessel was estimated at –$87 366 in 2011‒12, only a slight
improvement from 2010‒11.
Australian fisheries economic indicators report 2013: Torres Strait Prawn Fishery
16
Table 3 Financial performance of vessels operating in the Torres Strait Prawn Fishery Average per vessel
Revenue Unit 2010‒11 2011‒12
Seafood receipts $ 538 213 (18) 624 464 (31)
Non-fishing receipts $ 68 957 (6) 41 579 (35)
Total cash receipts $ 607 169 (16) 666 043 (28)
Costs
Administration $ 12 187 (24) 8 968 (15)
Crew costs $ 244 376 (26) 213 505 (25)
Freight and marketing expenses $ 8 264 (46) 17 685 (66)
Fuel $ 242 506 (8) 246 913 (16)
Insurance $ 20 688 (11) 19 166 (20)
Interest paid $ 14 688 (43) 5 510 (55)
Licence fees and levies $ 11 301 (12) 19 891 (44)
Packaging $ 15 846 (39) 8 734 (34)
Repairs and maintenance $ 48 224 (37) 141 122 (62)
Other costs $ 52 640 (33) 37 639 (21)
Total cash costs $ 670 720 (11) 719 133 (28)
Boat cash income $ –63 551 (110) –53 090 (70)
less depreciation a $ 43 625 (32) 41 855 (50)
Boat business profit $ –107 176 (76) –94 945 (36)
plus interest leasing rent $ 17 684 (29) 7 578 (40)
Profit at full equity $ –89 491 (88) –87 366 (41)
Capital (excluding quota and licences) $ 430 728 (16) 313 431 (25)
Capital (including quota and licences) $ 581 241 (19) 748 592 (41)
Rate of return to boat capital b % –21 (93) –28 (47)
Rate of return to full equity c % –15 (97) –12 (45)
Population no. 25 na 25 na
Sample no. 5 na 5 na
a Depreciation adjusted for profit or loss on capital items sold. b Excluding value of quota and licences. c Including value of quota and licences. Note: RSE Figures in parentheses are relative standard errors (RSEs). For any given standard error, an RSE will be higher for estimates closer to zero. A guide to interpreting RSEs is in Appendix A.
Australian fisheries economic indicators report 2013: Torres Strait Prawn Fishery
17
Economic performance
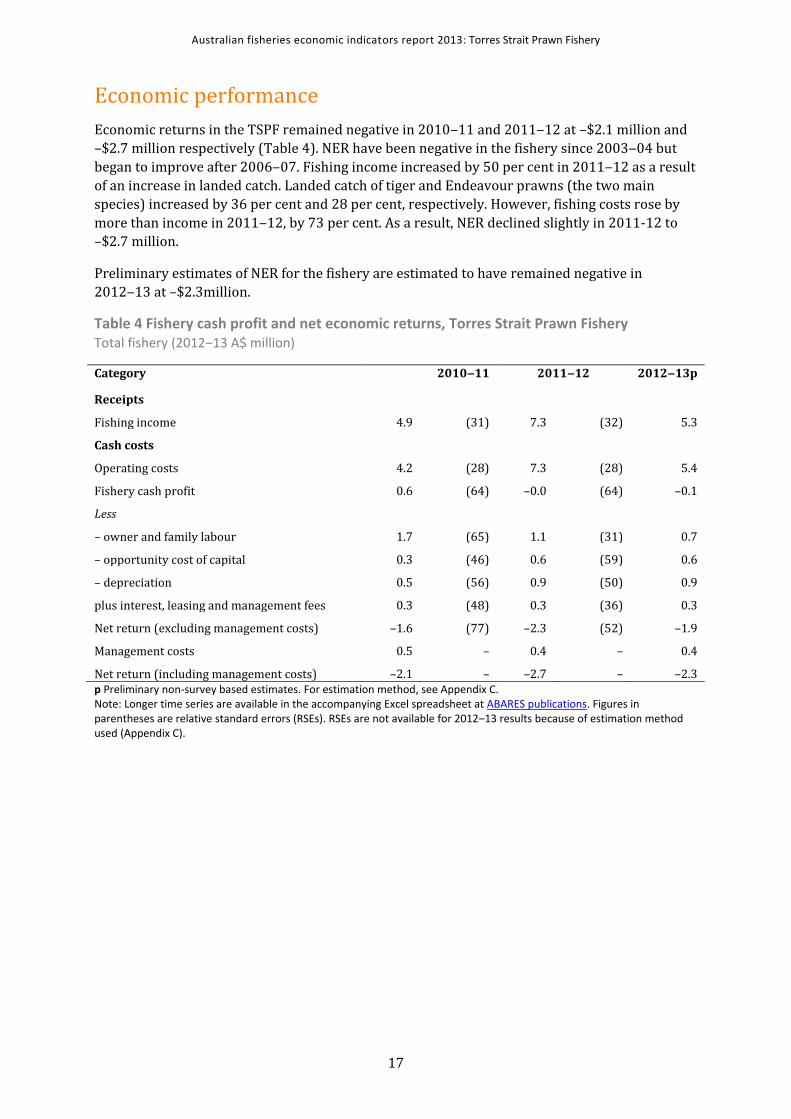
Economic returns in the TSPF remained negative in 2010‒11 and 2011‒12 at –$2.1 million and
–$2.7 million respectively (Table 4). NER have been negative in the fishery since 2003‒04 but
began to improve after 2006‒07. Fishing income increased by 50 per cent in 2011‒12 as a result
of an increase in landed catch. Landed catch of tiger and Endeavour prawns (the two main
species) increased by 36 per cent and 28 per cent, respectively. However, fishing costs rose by
more than income in 2011‒12, by 73 per cent. As a result, NER declined slightly in 2011-12 to
–$2.7 million.
Preliminary estimates of NER for the fishery are estimated to have remained negative in
2012‒13 at –$2.3million.
Table 4 Fishery cash profit and net economic returns, Torres Strait Prawn Fishery Total fishery (2012‒13 A$ million)
Category 2010‒11 2011‒12 2012‒13p
Receipts
Fishing income 4.9 (31) 7.3 (32) 5.3
Cash costs
Operating costs 4.2 (28) 7.3 (28) 5.4
Fishery cash profit 0.6 (64) –0.0 (64) –0.1
Less
– owner and family labour 1.7 (65) 1.1 (31) 0.7
– opportunity cost of capital 0.3 (46) 0.6 (59) 0.6
– depreciation 0.5 (56) 0.9 (50) 0.9
plus interest, leasing and management fees 0.3 (48) 0.3 (36) 0.3
Net return (excluding management costs) –1.6 (77) –2.3 (52) –1.9
Management costs 0.5 – 0.4 – 0.4
Net return (including management costs) –2.1 – –2.7 – –2.3 p Preliminary non-survey based estimates. For estimation method, see Appendix C. Note: Longer time series are available in the accompanying Excel spreadsheet at ABARES publications. Figures in parentheses are relative standard errors (RSEs). RSEs are not available for 2012‒13 results because of estimation method used (Appendix C).
Australian fisheries economic indicators report 2013: Torres Strait Prawn Fishery
18
4 Other key indicators Several other economic indicators are used to assess economic performance of a fishery. These
indicators include the trend in economic productivity, changes in input costs and output prices,
trend change in management costs and changes in entitlement values.
Productivity
Total factor productivity (TFP) analysis of a fishery presents the fishers’ ability to convert inputs
into outputs over time. Results from this analysis can assist in evaluating changes in net
economic return (NER) over time and provide an understanding of the factors driving changes in
productivity. Changes in productivity generally reflect changes in a fishery’s operating
environment, such as management settings that regulate fishers’ technology choices, changing
market conditions and changes in the mix of outputs produced. Market conditions include
variations in input costs and import competition and changes in the value of the Australian
dollar.
Changes in a fishery’s operating environment and/or market conditions can provide fishers with
incentives to pursue vessel-level productivity improvements. Increasing productivity may be
necessary to keep the business financially viable—for example, to offset any negative effects on
profitability from adverse market conditions such as increasing input costs or competition.
Adverse market conditions can also help drive autonomous structural adjustment within the
industry. Autonomous structural adjustment can result in fishing rights moving to more
profitable fishers and less efficient or less profitable vessels exiting the industry, resulting in a
more productive residual fleet.
TFP analysis was undertaken for the Torres Strait Prawn Fishery (TSPF) between 1993‒94 and
2007‒08, the period for which survey data are available. Survey data are available for 2010‒11
and 2011‒12 but if these years are added to the analysis it creates a gap in the data series.
Further, a time series greater than two years is required for a meaningful analysis. The output
index incorporates tiger, Endeavour and king prawns and other species caught. Productivity of
this fishery was not adjusted for stock changes because relevant stock biomass data are not
available.
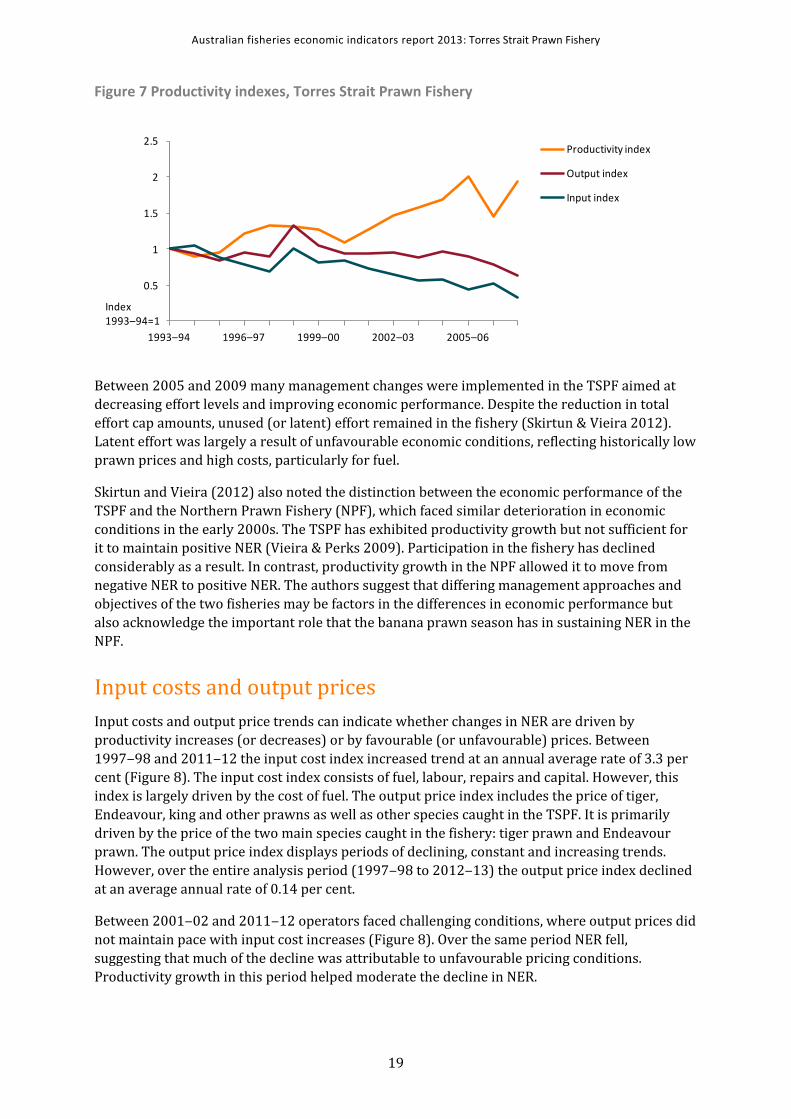
Average annual productivity growth for the TSPF was 4.8 per cent between 1993‒94 and
2007‒08, with most of the growth in productivity occurring after 2001‒02 (Figure 7). From
2001‒02 to 2007‒08, productivity increased as the input index decreased faster than the output
index. The productivity increase in this period was influenced by changes in the fleet size and
stock biomass. The number of operating vessels decreased from 75 in 2001‒02 to 28 in
2009‒10 (61 per cent). The decline in vessel numbers over this period was accelerated by the
2005‒06 voluntary licence surrender process. Stock biomass data were not available for the
analysis, but assessments indicate that tiger prawn biomass has steadily increased since 2000
(Cocking & Turnbull 2014). This is likely to have contributed to the change in output mix of the
fishery, which has moved from Endeavour prawns to tiger prawns since then. Therefore, the
productivity increase can be attributed to a combination of factors: less competition among the
smaller fleet, the possible exit of less productive vessels, a larger stock of tiger prawns allowing
for easier catch and a consequent switch from Endeavour prawns in the output mix (Stephan &
Vieira 2013).
Australian fisheries economic indicators report 2013: Torres Strait Prawn Fishery
19
Figure 7 Productivity indexes, Torres Strait Prawn Fishery
Between 2005 and 2009 many management changes were implemented in the TSPF aimed at
decreasing effort levels and improving economic performance. Despite the reduction in total
effort cap amounts, unused (or latent) effort remained in the fishery (Skirtun & Vieira 2012).
Latent effort was largely a result of unfavourable economic conditions, reflecting historically low
prawn prices and high costs, particularly for fuel.
Skirtun and Vieira (2012) also noted the distinction between the economic performance of the
TSPF and the Northern Prawn Fishery (NPF), which faced similar deterioration in economic
conditions in the early 2000s. The TSPF has exhibited productivity growth but not sufficient for
it to maintain positive NER (Vieira & Perks 2009). Participation in the fishery has declined
considerably as a result. In contrast, productivity growth in the NPF allowed it to move from
negative NER to positive NER. The authors suggest that differing management approaches and
objectives of the two fisheries may be factors in the differences in economic performance but
also acknowledge the important role that the banana prawn season has in sustaining NER in the
NPF.
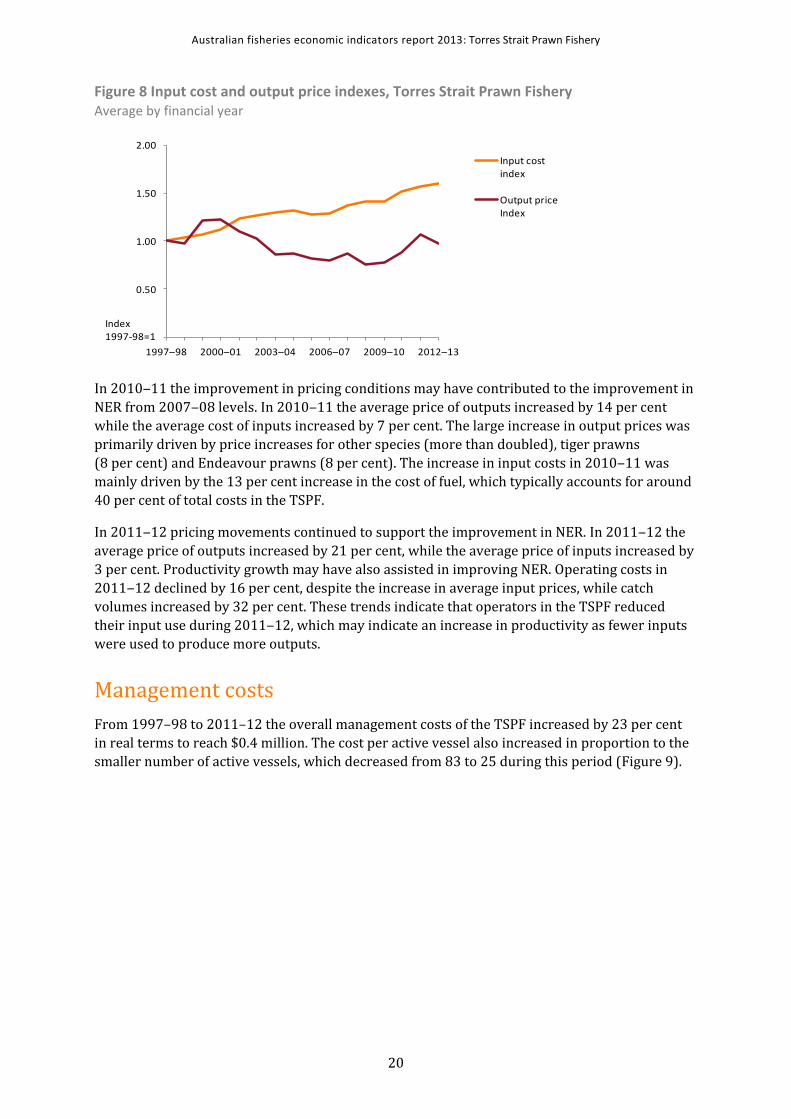
Input costs and output prices
Input costs and output price trends can indicate whether changes in NER are driven by
productivity increases (or decreases) or by favourable (or unfavourable) prices. Between
1997‒98 and 2011‒12 the input cost index increased trend at an annual average rate of 3.3 per
cent (Figure 8). The input cost index consists of fuel, labour, repairs and capital. However, this
index is largely driven by the cost of fuel. The output price index includes the price of tiger,
Endeavour, king and other prawns as well as other species caught in the TSPF. It is primarily
driven by the price of the two main species caught in the fishery: tiger prawn and Endeavour
prawn. The output price index displays periods of declining, constant and increasing trends.
However, over the entire analysis period (1997‒98 to 2012‒13) the output price index declined
at an average annual rate of 0.14 per cent.
Between 2001‒02 and 2011‒12 operators faced challenging conditions, where output prices did
not maintain pace with input cost increases (Figure 8). Over the same period NER fell,
suggesting that much of the decline was attributable to unfavourable pricing conditions.
Productivity growth in this period helped moderate the decline in NER.
0
0.5
1
1.5
2
2.5
1993–94 1996–97 1999–00 2002–03 2005–06
Index1993–94=1
Productivity index
Output index
Input index
Australian fisheries economic indicators report 2013: Torres Strait Prawn Fishery
20
Figure 8 Input cost and output price indexes, Torres Strait Prawn Fishery Average by financial year
In 2010‒11 the improvement in pricing conditions may have contributed to the improvement in
NER from 2007‒08 levels. In 2010‒11 the average price of outputs increased by 14 per cent
while the average cost of inputs increased by 7 per cent. The large increase in output prices was
primarily driven by price increases for other species (more than doubled), tiger prawns
(8 per cent) and Endeavour prawns (8 per cent). The increase in input costs in 2010‒11 was
mainly driven by the 13 per cent increase in the cost of fuel, which typically accounts for around
40 per cent of total costs in the TSPF.
In 2011‒12 pricing movements continued to support the improvement in NER. In 2011‒12 the
average price of outputs increased by 21 per cent, while the average price of inputs increased by
3 per cent. Productivity growth may have also assisted in improving NER. Operating costs in
2011‒12 declined by 16 per cent, despite the increase in average input prices, while catch
volumes increased by 32 per cent. These trends indicate that operators in the TSPF reduced
their input use during 2011‒12, which may indicate an increase in productivity as fewer inputs
were used to produce more outputs.
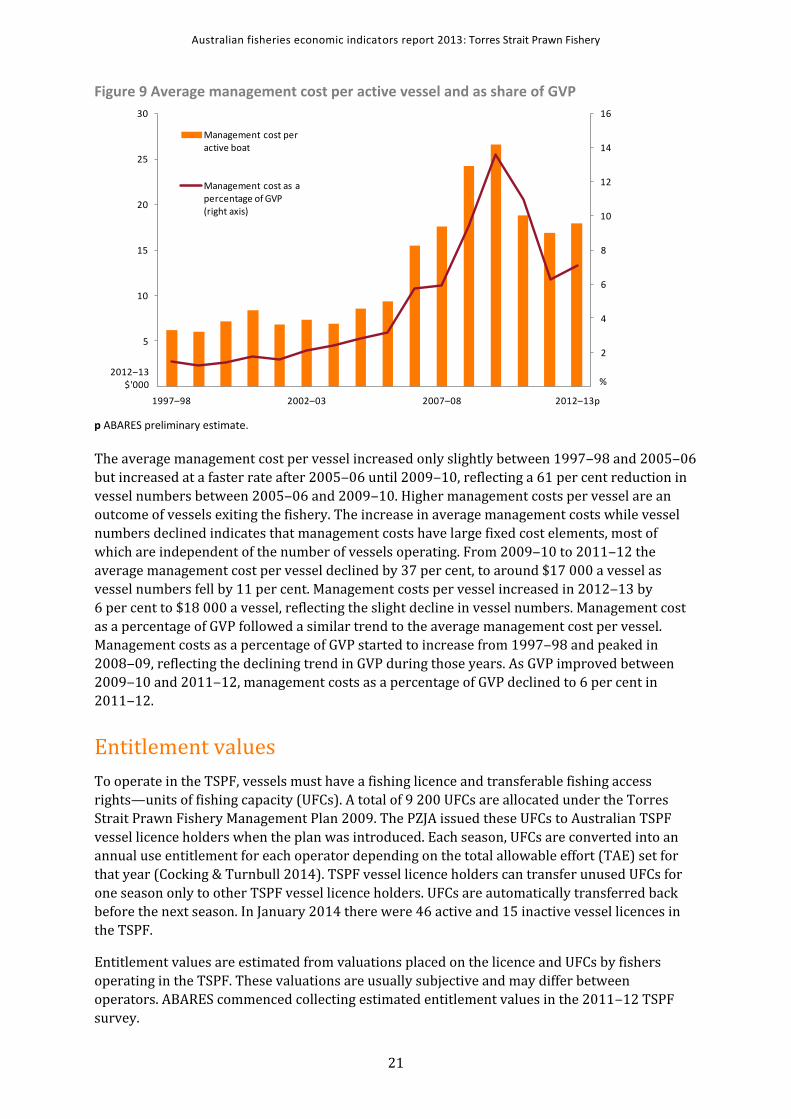
Management costs
From 1997–98 to 2011–12 the overall management costs of the TSPF increased by 23 per cent
in real terms to reach $0.4 million. The cost per active vessel also increased in proportion to the
smaller number of active vessels, which decreased from 83 to 25 during this period (Figure 9).
0.00
0.50
1.00
1.50
2.00
1997–98 2000–01 2003–04 2006–07 2009–10 2012–13
Input cost index
Output price Index
Index1997-98=1
Australian fisheries economic indicators report 2013: Torres Strait Prawn Fishery
21
Figure 9 Average management cost per active vessel and as share of GVP
p ABARES preliminary estimate.
The average management cost per vessel increased only slightly between 1997‒98 and 2005‒06
but increased at a faster rate after 2005‒06 until 2009‒10, reflecting a 61 per cent reduction in
vessel numbers between 2005‒06 and 2009‒10. Higher management costs per vessel are an
outcome of vessels exiting the fishery. The increase in average management costs while vessel
numbers declined indicates that management costs have large fixed cost elements, most of
which are independent of the number of vessels operating. From 2009‒10 to 2011‒12 the
average management cost per vessel declined by 37 per cent, to around $17 000 a vessel as
vessel numbers fell by 11 per cent. Management costs per vessel increased in 2012‒13 by
6 per cent to $18 000 a vessel, reflecting the slight decline in vessel numbers. Management cost
as a percentage of GVP followed a similar trend to the average management cost per vessel.
Management costs as a percentage of GVP started to increase from 1997‒98 and peaked in
2008‒09, reflecting the declining trend in GVP during those years. As GVP improved between
2009‒10 and 2011‒12, management costs as a percentage of GVP declined to 6 per cent in
2011‒12.
Entitlement values
To operate in the TSPF, vessels must have a fishing licence and transferable fishing access
rights—units of fishing capacity (UFCs). A total of 9 200 UFCs are allocated under the Torres
Strait Prawn Fishery Management Plan 2009. The PZJA issued these UFCs to Australian TSPF
vessel licence holders when the plan was introduced. Each season, UFCs are converted into an
annual use entitlement for each operator depending on the total allowable effort (TAE) set for
that year (Cocking & Turnbull 2014). TSPF vessel licence holders can transfer unused UFCs for
one season only to other TSPF vessel licence holders. UFCs are automatically transferred back
before the next season. In January 2014 there were 46 active and 15 inactive vessel licences in
the TSPF.
Entitlement values are estimated from valuations placed on the licence and UFCs by fishers
operating in the TSPF. These valuations are usually subjective and may differ between
operators. ABARES commenced collecting estimated entitlement values in the 2011‒12 TSPF
survey.
0
2
4
6
8
10
12
14
16
0
5
10
15
20
25
30
1997–98 2002–03 2007–08 2012–13p
Management cost per active boat
Management cost as a percentage of GVP (right axis)
%2012‒13
$'000
Australian fisheries economic indicators report 2013: Torres Strait Prawn Fishery
22
Entitlement values reflect the fishery’s prawn stock and price expectations. In general,
entitlement values reflect expected vessel profitability in the fishery. Over time, changes in
entitlement values can indicate economic performance in the fishery. The average estimated sale
price of a fishing night entitlement in the TSPF from the surveyed sample was $379 in 2010‒11,
while the median value of a vessel licence was $20 000. On average, each vessel that operated in
the TSPF during the 2010‒11 fishing season held 170 fishing night entitlements. This compares
with an average of 116 fishing night entitlements held by the surveyed sample in 2011‒12, at an
estimated price of $472 per night. The median vessel licence value was estimated at $27 500 in
2011‒12. These estimates provide limited information from the current survey. However, a time
series of entitlement values will offer insights into an average fisher’s perspective on the
underlying performance of their fishery.
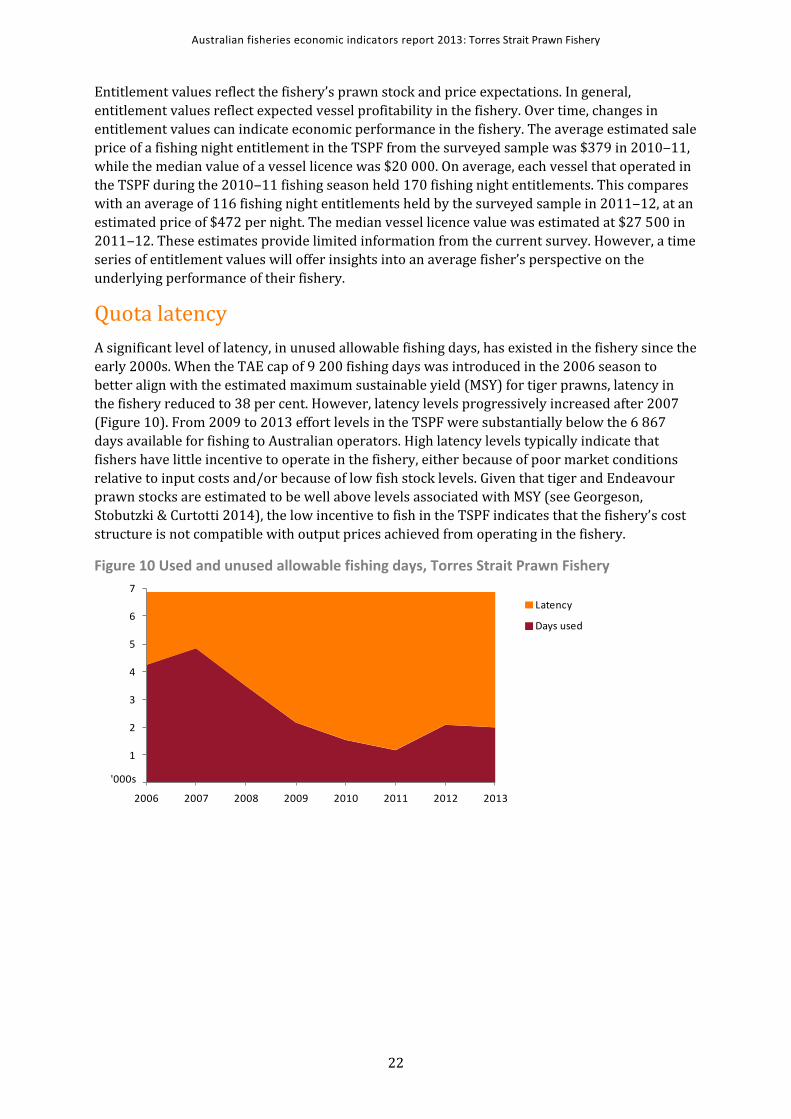
Quota latency
A significant level of latency, in unused allowable fishing days, has existed in the fishery since the
early 2000s. When the TAE cap of 9 200 fishing days was introduced in the 2006 season to
better align with the estimated maximum sustainable yield (MSY) for tiger prawns, latency in
the fishery reduced to 38 per cent. However, latency levels progressively increased after 2007
(Figure 10). From 2009 to 2013 effort levels in the TSPF were substantially below the 6 867
days available for fishing to Australian operators. High latency levels typically indicate that
fishers have little incentive to operate in the fishery, either because of poor market conditions
relative to input costs and/or because of low fish stock levels. Given that tiger and Endeavour
prawn stocks are estimated to be well above levels associated with MSY (see Georgeson,
Stobutzki & Curtotti 2014), the low incentive to fish in the TSPF indicates that the fishery’s cost
structure is not compatible with output prices achieved from operating in the fishery.
Figure 10 Used and unused allowable fishing days, Torres Strait Prawn Fishery
0
1
2
3
4
5
6
7
2006 2007 2008 2009 2010 2011 2012 2013
Latency
Days used
'000s
Australian fisheries economic indicators report 2013: Torres Strait Prawn Fishery
23
5 Performance against management objectives
The Torres Strait Prawn Fishery (TSPF) is managed according to the objective of promoting
economic efficiency and ensuring optimal use of fishery resources. The fishery harvest strategy
does not yet have a target biomass level associated with an estimate of maximum economic yield
BMEY . This has been attributed to the low economic value of the fishery and the high cost of
estimating a BMEY target (AFMA 2011). Under the harvest strategy, the BMSY target will remain
until effort and/or catch triggers are reached. When these triggers are reached for two
consecutive years the fishery will be required to undertake research with the aim of
implementing a BMEY target (AFMA 2011).
Estimated net economic return (NER) in this fishery was negative from 2003–04 to 2011–12 and
forecast to remain negative in 2012–13. Negative NER is generally driven by low fishing receipts,
which may be the result of poor catch and prawn prices or high input costs. General
management changes that promote positive NER involve reducing allowable effort to levels
associated with positive profits or reducing latency. Such management changes may not be
appropriate in the TSPF due to the small and declining number of vessels operating in the
fishery. As such, negative NER in this fishery is associated with unfavourable market conditions,
which are beyond management control.
This report presents several indicators other than NER that the authors used to assess economic
performance of the TSPF. Productivity analysis was undertaken for the period 1993‒94 to
2007‒08. It showed that fishery productivity increased as a result of less competition among a
smaller fleet, the possible exit of less productive vessels and a larger stock of tiger prawns,
which allowed for easier catch. More recent analysis of input costs and output prices,
undertaken from 1997‒98 to 2012‒13, showed that the negative NER in 2010–11 and 2011–12
was influenced by unfavourable market conditions (which affected the price of outputs and the
cost of inputs) rather than low productivity.
In 2011‒12 the average management cost per vessel declined. However, on a per vessel basis
costs were higher than those in the 1990s and early 2000s, because fishery management costs in
2011–12 were shared among fewer vessels. The increase in management costs per vessel
between 2005‒06 and 2009‒10 reflects the exit of vessels from the fishery. Similarly, the
increase in management costs as a share of gross value of production (GVP) declined during
these years as catch, vessel numbers and NER declined.
The lack of positive NER from the fishery since 2004‒05 remains an issue of concern to
managers. Given the characteristics of this fishery (including geographical isolation, lack of
supporting infrastructure and low participation), it is unlikely that returns will rise significantly
without a change in the operating environment. High input costs and low prices during the
survey years made it difficult to operate in the fishery profitably. Given the fishery’s high latency
level, management must remain vigilant to changes in the operating environment and move to
the long-term maximum economic yield target when participation in the fishery improves.

Australian fisheries economic indicators report 2013: Torres Strait Prawn Fishery
24
Management must also have options for dealing with periods of low economic returns and
participation in the fishery, particularly when status of stocks targeted is above levels associated
with achieving maximum sustainable yield. The harvest strategy offers little guidance on this.
Lower diesel fuel prices and a lower exchange rate for the Australian dollar are likely to improve
economic returns and participation in the fishery in 2013‒14 and 2014‒15. However,
restrictions on vessel length and gear size, and difficulties to date in changing these, mean that
management should continue to focus on alternatives for improving returns and participation in
the fishery.

Australian fisheries economic indicators report 2013: Torres Strait Prawn Fishery
25
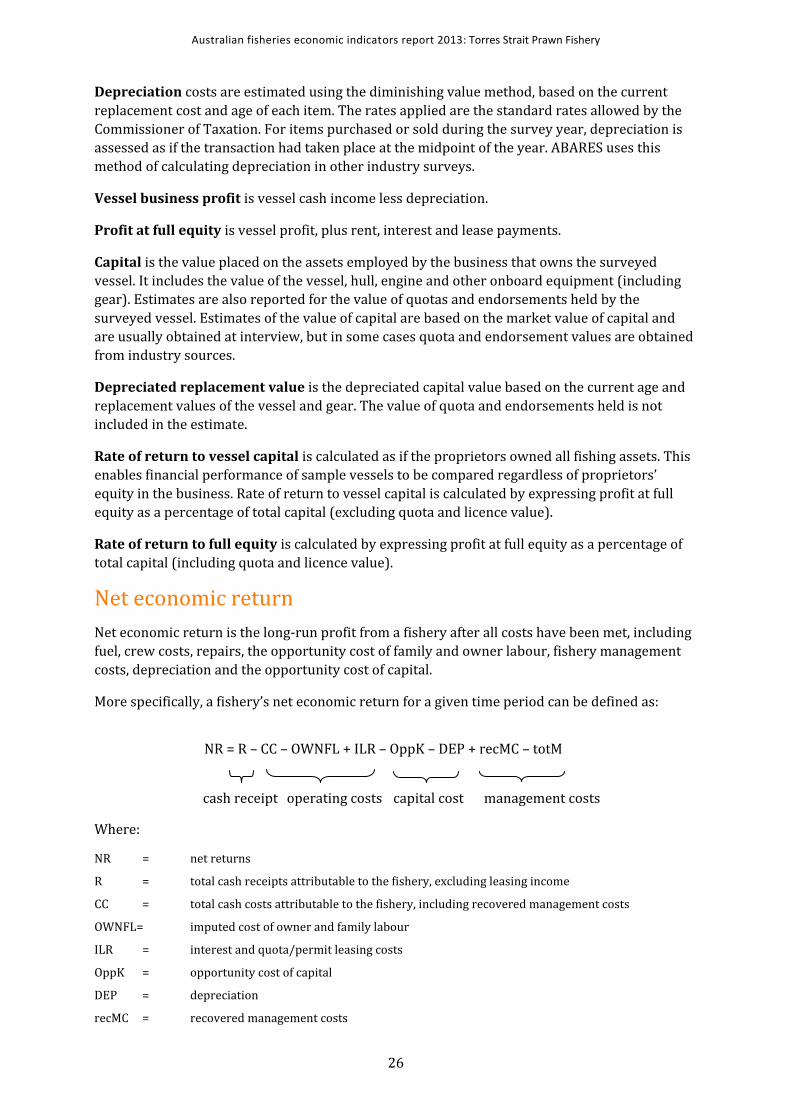
Appendix A: Survey definitions This appendix provides definitions of key financial performance variables, net economic return
(NER) and the ABARES method of calculating NER. Use of NER as an indicator of economic
performance is discussed briefly after definitions.
Financial performance
ABARES used these definitions of key variables in the analysis of vessel-level financial
performance.
Total cash receipts represent returns from sale of fish, from non-fishing activities (including
charter operations) and from other sources (insurance claims and compensation, quota and/or
endorsements leased out, government assistance and any other revenue) in the financial year.
For most operators, this information is readily available from their own records. However,
different operators record their fishing income in different ways. Where fish are sold through a
cooperative, some operators may only record payments received from the cooperative. These
payments may be net of commissions, freight and other purchases made through the
cooperative.
In other cases, the cooperative or agency pays the crew directly for the catch; the owner’s
financial records might include only the revenues received after the crew’s share has been
deducted.
For these reasons, operators are asked to provide a breakdown of the total catch of their vessel
and an estimate of the total value of that catch. For consistency, marketing charges may need to
be added back into fishing receipts for some vessels to give a gross value. Where this is
necessary, these selling costs are also added into the cost estimates to offset the new revenue
figure. Receipts also include amounts received in the survey year for fish sold in previous years.
Total cash costs include payments made for both permanent and casual hired labour and
payments for materials and services (including payments on capital items subject to leasing,
rent, interest, licence fees and repairs and maintenance). Capital and household expenditures
are excluded.
Labour costs are often the highest cash cost in the fishing operation. Labour costs include
wages and an estimated value for owner/partner, family and unpaid labour. Labour costs cover
the cost of labour involved in vessel-related aspects of the fishing business, such as crew or
onshore administration costs, but do not cover the cost of onshore labour to process fisheries
products.
On many vessels, the costs of labour are reflected in the wages paid by vessel owners and/or in
the share of the catch they earn. However, in some cases, such as where owner–skippers are
involved or where family members work in the fishing operation, the payments made can be low
or even nil. This will not always reflect the market value of the labour provided. To allow for this
possible underestimation, all owner/partner and family labour costs are based on estimates
collected at the interview of what it would cost to employ someone else to do the work.
Vessel cash income is the difference between total cash receipts and total cash costs.
Australian fisheries economic indicators report 2013: Torres Strait Prawn Fishery
26
Depreciation costs are estimated using the diminishing value method, based on the current
replacement cost and age of each item. The rates applied are the standard rates allowed by the
Commissioner of Taxation. For items purchased or sold during the survey year, depreciation is
assessed as if the transaction had taken place at the midpoint of the year. ABARES uses this
method of calculating depreciation in other industry surveys.
Vessel business profit is vessel cash income less depreciation.
Profit at full equity is vessel profit, plus rent, interest and lease payments.
Capital is the value placed on the assets employed by the business that owns the surveyed
vessel. It includes the value of the vessel, hull, engine and other onboard equipment (including
gear). Estimates are also reported for the value of quotas and endorsements held by the
surveyed vessel. Estimates of the value of capital are based on the market value of capital and
are usually obtained at interview, but in some cases quota and endorsement values are obtained
from industry sources.
Depreciated replacement value is the depreciated capital value based on the current age and
replacement values of the vessel and gear. The value of quota and endorsements held is not
included in the estimate.
Rate of return to vessel capital is calculated as if the proprietors owned all fishing assets. This
enables financial performance of sample vessels to be compared regardless of proprietors’
equity in the business. Rate of return to vessel capital is calculated by expressing profit at full
equity as a percentage of total capital (excluding quota and licence value).
Rate of return to full equity is calculated by expressing profit at full equity as a percentage of
total capital (including quota and licence value).
Net economic return
Net economic return is the long-run profit from a fishery after all costs have been met, including
fuel, crew costs, repairs, the opportunity cost of family and owner labour, fishery management
costs, depreciation and the opportunity cost of capital.
More specifically, a fishery’s net economic return for a given time period can be defined as:
Where:
NR = net returns
R = total cash receipts attributable to the fishery, excluding leasing income
CC = total cash costs attributable to the fishery, including recovered management costs
OWNFL= imputed cost of owner and family labour
ILR = interest and quota/permit leasing costs
OppK = opportunity cost of capital
DEP = depreciation
recMC = recovered management costs
NR = R – CC – OWNFL + ILR – OppK – DEP + recMC – totM
operating costs capital cost management costs cash receipt
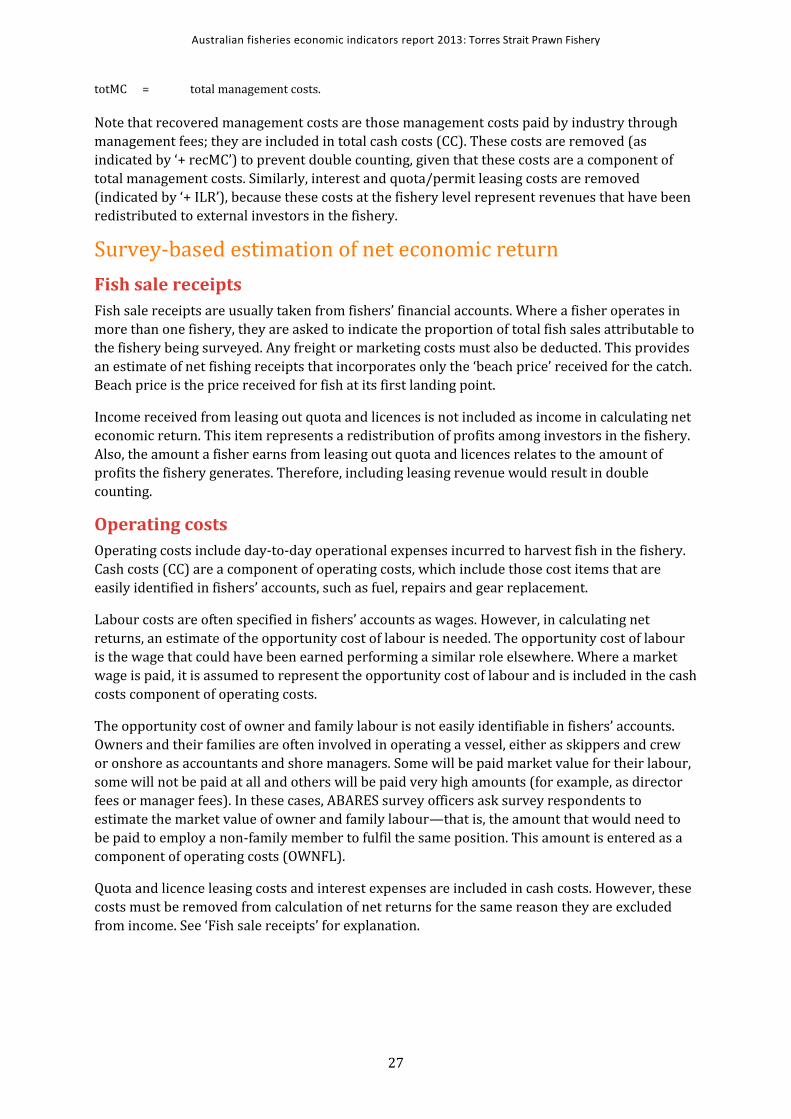
Australian fisheries economic indicators report 2013: Torres Strait Prawn Fishery
27
totMC = total management costs.
Note that recovered management costs are those management costs paid by industry through
management fees; they are included in total cash costs (CC). These costs are removed (as
indicated by ‘+ recMC’) to prevent double counting, given that these costs are a component of
total management costs. Similarly, interest and quota/permit leasing costs are removed
(indicated by ‘+ ILR’), because these costs at the fishery level represent revenues that have been
redistributed to external investors in the fishery.
Survey-based estimation of net economic return
Fish sale receipts
Fish sale receipts are usually taken from fishers’ financial accounts. Where a fisher operates in
more than one fishery, they are asked to indicate the proportion of total fish sales attributable to
the fishery being surveyed. Any freight or marketing costs must also be deducted. This provides
an estimate of net fishing receipts that incorporates only the ‘beach price’ received for the catch.
Beach price is the price received for fish at its first landing point.
Income received from leasing out quota and licences is not included as income in calculating net
economic return. This item represents a redistribution of profits among investors in the fishery.
Also, the amount a fisher earns from leasing out quota and licences relates to the amount of
profits the fishery generates. Therefore, including leasing revenue would result in double
counting.
Operating costs
Operating costs include day-to-day operational expenses incurred to harvest fish in the fishery.
Cash costs (CC) are a component of operating costs, which include those cost items that are
easily identified in fishers’ accounts, such as fuel, repairs and gear replacement.
Labour costs are often specified in fishers’ accounts as wages. However, in calculating net
returns, an estimate of the opportunity cost of labour is needed. The opportunity cost of labour
is the wage that could have been earned performing a similar role elsewhere. Where a market
wage is paid, it is assumed to represent the opportunity cost of labour and is included in the cash
costs component of operating costs.
The opportunity cost of owner and family labour is not easily identifiable in fishers’ accounts.
Owners and their families are often involved in operating a vessel, either as skippers and crew
or onshore as accountants and shore managers. Some will be paid market value for their labour,
some will not be paid at all and others will be paid very high amounts (for example, as director
fees or manager fees). In these cases, ABARES survey officers ask survey respondents to
estimate the market value of owner and family labour—that is, the amount that would need to
be paid to employ a non-family member to fulfil the same position. This amount is entered as a
component of operating costs (OWNFL).
Quota and licence leasing costs and interest expenses are included in cash costs. However, these
costs must be removed from calculation of net returns for the same reason they are excluded
from income. See ‘Fish sale receipts’ for explanation.
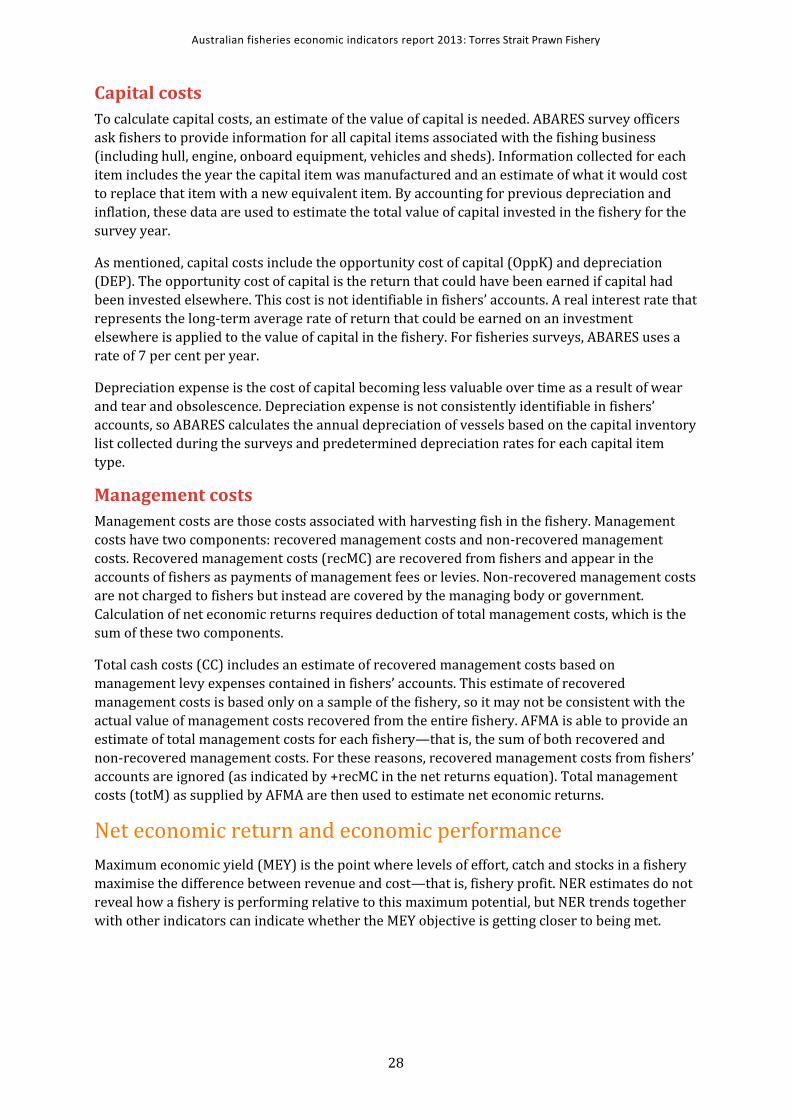
Australian fisheries economic indicators report 2013: Torres Strait Prawn Fishery
28
Capital costs
To calculate capital costs, an estimate of the value of capital is needed. ABARES survey officers
ask fishers to provide information for all capital items associated with the fishing business
(including hull, engine, onboard equipment, vehicles and sheds). Information collected for each
item includes the year the capital item was manufactured and an estimate of what it would cost
to replace that item with a new equivalent item. By accounting for previous depreciation and
inflation, these data are used to estimate the total value of capital invested in the fishery for the
survey year.
As mentioned, capital costs include the opportunity cost of capital (OppK) and depreciation
(DEP). The opportunity cost of capital is the return that could have been earned if capital had
been invested elsewhere. This cost is not identifiable in fishers’ accounts. A real interest rate that
represents the long-term average rate of return that could be earned on an investment
elsewhere is applied to the value of capital in the fishery. For fisheries surveys, ABARES uses a
rate of 7 per cent per year.
Depreciation expense is the cost of capital becoming less valuable over time as a result of wear
and tear and obsolescence. Depreciation expense is not consistently identifiable in fishers’
accounts, so ABARES calculates the annual depreciation of vessels based on the capital inventory
list collected during the surveys and predetermined depreciation rates for each capital item
type.
Management costs
Management costs are those costs associated with harvesting fish in the fishery. Management
costs have two components: recovered management costs and non-recovered management
costs. Recovered management costs (recMC) are recovered from fishers and appear in the
accounts of fishers as payments of management fees or levies. Non-recovered management costs
are not charged to fishers but instead are covered by the managing body or government.
Calculation of net economic returns requires deduction of total management costs, which is the
sum of these two components.
Total cash costs (CC) includes an estimate of recovered management costs based on
management levy expenses contained in fishers’ accounts. This estimate of recovered
management costs is based only on a sample of the fishery, so it may not be consistent with the
actual value of management costs recovered from the entire fishery. AFMA is able to provide an
estimate of total management costs for each fishery—that is, the sum of both recovered and
non-recovered management costs. For these reasons, recovered management costs from fishers’
accounts are ignored (as indicated by +recMC in the net returns equation). Total management
costs (totM) as supplied by AFMA are then used to estimate net economic returns.
Net economic return and economic performance
Maximum economic yield (MEY) is the point where levels of effort, catch and stocks in a fishery
maximise the difference between revenue and cost—that is, fishery profit. NER estimates do not
reveal how a fishery is performing relative to this maximum potential, but NER trends together
with other indicators can indicate whether the MEY objective is getting closer to being met.
Australian fisheries economic indicators report 2013: Torres Strait Prawn Fishery
29
Appendix B: Survey methods Collecting economic survey data
ABARES has undertaken economic surveys of selected Commonwealth fisheries since the early
1980s and regularly surveyed particular fisheries since 1992. Under the current program
ABARES surveys major Commonwealth fisheries every two years. It aims to develop a consistent
time series of economic information for each fishery. Such information, in conjunction with
scientific assessments of each fishery, is vital for assessing fisheries’ economic performance.
Survey information is made publicly available so the performance of fisheries and the impact of
management policies can be assessed independently.
Sample design
ABARES surveys are designed and samples selected on the basis of information provided by
AFMA. This information includes data on the volume of catch, fishing effort and vessel
characteristics.
It is not possible to survey all vessels in a fishery, so a representative sample of vessels is
selected. Where possible, vessels are classified into subgroups based either on the fishing
method used (longline, purse seine or trawl) or on the size of operations (small, medium and
large producers). A minimum number of representative vessels from each subgroup are then
targeted for the survey.
In practice, this sample is seldom fully realised. Non-response is relatively high across fishery
surveys, reflecting difficulty in contacting some operators and reluctance of others to
participate. This may bias the results—for example, if profitability of respondents and
non-respondents differs significantly. Sample design and weighting systems have been
developed that reduce the non-response effect, but care must still be taken when interpreting
survey information.
Between February and August, an ABARES officer visits the owner of each vessel selected in the
sample. The officer interviews the vessel owner to obtain physical and financial details of the
fishing business for the survey years. When necessary, the skipper of the vessel is also
interviewed. ABARES subsequently obtains further information from accountants, selling agents
and marketing organisations on the signed authority of the survey respondents.
ABARES reconciles the information obtained from various sources to produce the most accurate
description possible of the financial characteristics of each sample vessel in the survey.
Australian fisheries economic indicators report 2013: Torres Strait Prawn Fishery
30
Sample weighting
All population estimates presented in this report were calculated from the weighted survey data
of sample vessels. ABARES calculates a weight for each vessel in the sample based on how
representative that vessel is in the population. Sample weights are constructed such that
individual weights sum to the number of vessels in the fishery fleet and the weighted sum of
sample vessel catch approximates the total catch for the fishery, as recorded in AFMA logbooks.
That is,
Σwi = P and Σwixi = X
where:
wi is the weight for the ith vessel
P is the number of vessels in the population
xi is the catch for the ith vessel
X is the total catch for the target population.
Technical details of the method of weighting used are given in Bardsley and Chambers (1984).
Reliability of estimates
ABARES generally surveys a relatively small number of vessels out of the total number of vessels
in a particular fishery. Estimates derived from these vessels are likely to be different from those
that would have been obtained if information had been collected from a census of all vessels. The
number of vessels in the sample, the variability of vessels in the population and, most
importantly, the design of the survey and the estimation procedures used influence how closely
the survey results represent the population.
Measures of sampling variation have been calculated as a guide to reliability of survey estimates.
These measures, expressed as percentages of the survey estimates and termed relative standard
errors, are given next to each estimate in parentheses. In general, the smaller the relative
standard error, the more reliable the estimate.
Use of relative standard errors
Relative standard errors can be used to calculate confidence intervals for the survey estimate.
First, the standard error is calculated by multiplying the relative standard error by the survey
estimate and dividing by 100. For example, if average total cash receipts are estimated to be
$100 000 with a relative standard error of 6 per cent, the standard error for this estimate is
$6 000.
The chance that the census value (the value that would have been obtained if all vessels in the
target population had been surveyed) is within one standard error of the survey estimate is
roughly two in three. The chance that the census value is within two standard errors of the
survey estimates is roughly 19 in 20. Therefore, in this example, the chance that the census value
is between $94 000 and $106 000 is two in three and the chance that the census value is
between $88 000 and $112 000 is 19 in 20.
Comparing estimates
When comparing estimates across groups or years, it is important to recognise that the
differences are also subject to sampling error. As a rule of thumb, a conservative estimate of the
standard error of the difference can be constructed by adding the squares of the estimated
standard errors of the component estimates and then taking the square root of the result.

Australian fisheries economic indicators report 2013: Torres Strait Prawn Fishery
31
For example, suppose estimates of total cash receipts were $100 000 for one year and $125 000
for the previous year—a difference of $25 000—and the relative standard error is given as 6 per
cent for each estimate. The standard error of the difference can be estimated as:
The relative standard error of the difference is:
The population of a fishery may change from one year to the next. If these population changes
are substantial, differences in estimates may be caused more by the changes in population than
by changes in the variables themselves.
Non-sampling errors
The values obtained in a survey may be affected by errors other than those directly related to
the sampling procedure. For example, it may not be possible to obtain information from certain
respondents, respondents may provide inaccurate information or respondents may differ from
non-respondents on a particular variable being surveyed.
ABARES survey staff are generally very experienced and undergo rigorous pre-survey training,
aimed at minimising non-sampling errors. However, when drawing inferences from estimates
derived from sample surveys, users should be aware that both sampling and non-sampling
errors occur.
0.06 ∗ $100 000 2 + 0.06 ∗ $125 000 2 = $9 605
$9 605 $25 000 ∗ 100 = 38%
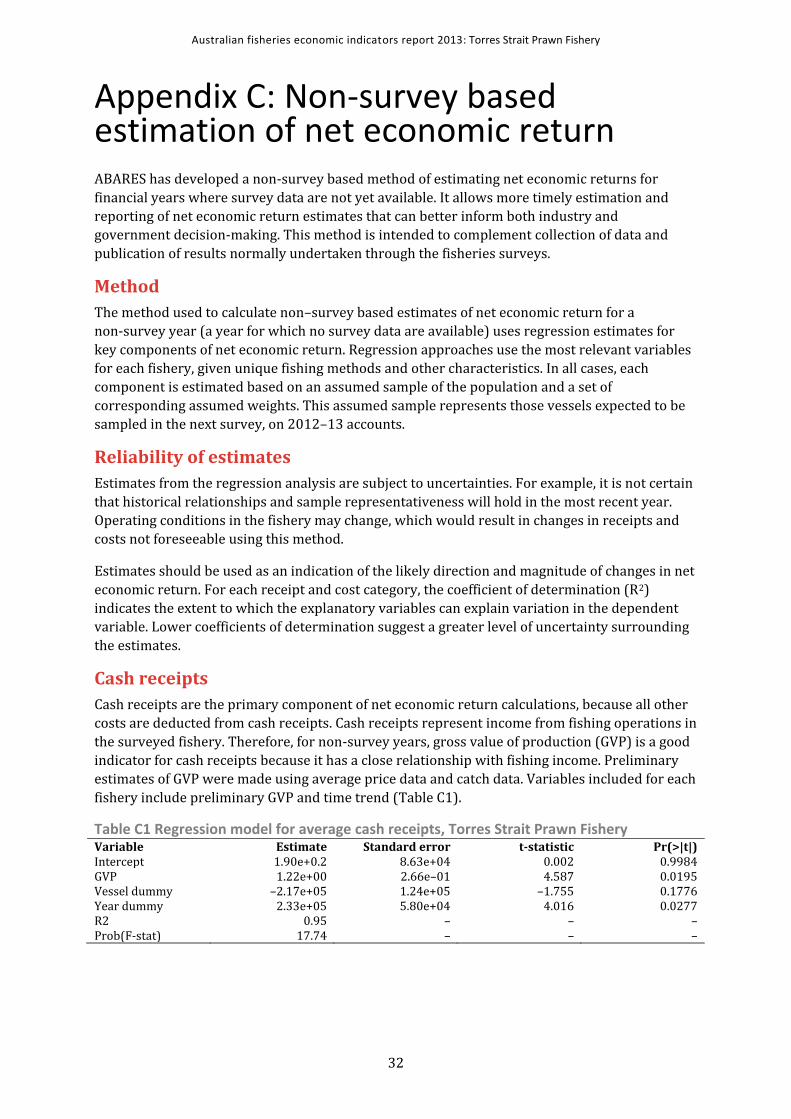
Australian fisheries economic indicators report 2013: Torres Strait Prawn Fishery
32
Appendix C: Non-survey based estimation of net economic return ABARES has developed a non-survey based method of estimating net economic returns for
financial years where survey data are not yet available. It allows more timely estimation and
reporting of net economic return estimates that can better inform both industry and
government decision-making. This method is intended to complement collection of data and
publication of results normally undertaken through the fisheries surveys.
Method
The method used to calculate non–survey based estimates of net economic return for a
non-survey year (a year for which no survey data are available) uses regression estimates for
key components of net economic return. Regression approaches use the most relevant variables
for each fishery, given unique fishing methods and other characteristics. In all cases, each
component is estimated based on an assumed sample of the population and a set of
corresponding assumed weights. This assumed sample represents those vessels expected to be
sampled in the next survey, on 2012–13 accounts.
Reliability of estimates
Estimates from the regression analysis are subject to uncertainties. For example, it is not certain
that historical relationships and sample representativeness will hold in the most recent year.
Operating conditions in the fishery may change, which would result in changes in receipts and
costs not foreseeable using this method.
Estimates should be used as an indication of the likely direction and magnitude of changes in net
economic return. For each receipt and cost category, the coefficient of determination (R2)
indicates the extent to which the explanatory variables can explain variation in the dependent
variable. Lower coefficients of determination suggest a greater level of uncertainty surrounding
the estimates.
Cash receipts
Cash receipts are the primary component of net economic return calculations, because all other
costs are deducted from cash receipts. Cash receipts represent income from fishing operations in
the surveyed fishery. Therefore, for non-survey years, gross value of production (GVP) is a good
indicator for cash receipts because it has a close relationship with fishing income. Preliminary
estimates of GVP were made using average price data and catch data. Variables included for each
fishery include preliminary GVP and time trend (Table C1).
Table C1 Regression model for average cash receipts, Torres Strait Prawn Fishery Variable Estimate Standard error t-statistic Pr(>|t|) Intercept 1.90e+0.2 8.63e+04 0.002 0.9984 GVP 1.22e+00 2.66e–01 4.587 0.0195 Vessel dummy –2.17e+05 1.24e+05 –1.755 0.1776 Year dummy 2.33e+05 5.80e+04 4.016 0.0277 R2 0.95 – – – Prob(F-stat) 17.74 – – –
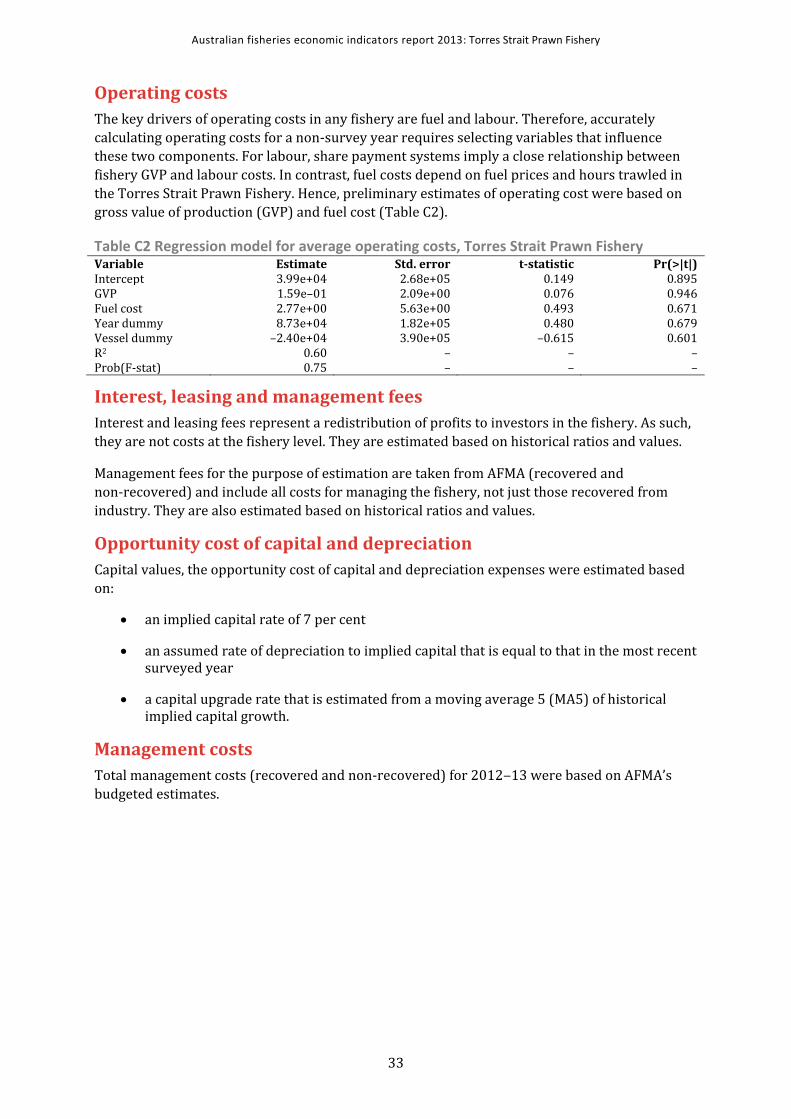
Australian fisheries economic indicators report 2013: Torres Strait Prawn Fishery
33
Operating costs
The key drivers of operating costs in any fishery are fuel and labour. Therefore, accurately
calculating operating costs for a non-survey year requires selecting variables that influence
these two components. For labour, share payment systems imply a close relationship between
fishery GVP and labour costs. In contrast, fuel costs depend on fuel prices and hours trawled in
the Torres Strait Prawn Fishery. Hence, preliminary estimates of operating cost were based on
gross value of production (GVP) and fuel cost (Table C2).
Table C2 Regression model for average operating costs, Torres Strait Prawn Fishery Variable Estimate Std. error t-statistic Pr(>|t|) Intercept 3.99e+04 2.68e+05 0.149 0.895 GVP 1.59e–01 2.09e+00 0.076 0.946 Fuel cost 2.77e+00 5.63e+00 0.493 0.671 Year dummy 8.73e+04 1.82e+05 0.480 0.679 Vessel dummy –2.40e+04 3.90e+05 –0.615 0.601 R2 0.60 – – – Prob(F-stat) 0.75 – – –
Interest, leasing and management fees
Interest and leasing fees represent a redistribution of profits to investors in the fishery. As such,
they are not costs at the fishery level. They are estimated based on historical ratios and values.
Management fees for the purpose of estimation are taken from AFMA (recovered and
non-recovered) and include all costs for managing the fishery, not just those recovered from
industry. They are also estimated based on historical ratios and values.
Opportunity cost of capital and depreciation
Capital values, the opportunity cost of capital and depreciation expenses were estimated based
on:
an implied capital rate of 7 per cent
an assumed rate of depreciation to implied capital that is equal to that in the most recent surveyed year
a capital upgrade rate that is estimated from a moving average 5 (MA5) of historical implied capital growth.
Management costs
Total management costs (recovered and non-recovered) for 2012‒13 were based on AFMA’s
budgeted estimates.
Australian fisheries economic indicators report 2013: Torres Strait Prawn Fishery
34
Appendix D: Productivity methodology
Productivity measurement
Productivity is defined as the quantity of output produced with a given quantity of inputs. For
example, a partial measure of productivity for a fishing vessel would be kilos of a particular
species of fish produced per hook used. A more complete measure of productivity would be the
total catch per unit of all the inputs used. This approach is preferred as a measure of
productivity and is usually referred to as total factor productivity.
Various methods have been developed to quantitatively assess total factor productivity trends
for industries and individual enterprises within industries (see Coelli et al. 2005 for discussion).
A frequent approach to measuring productivity trends uses index number theory. In this report
a Fisher quantity index is used to measure total factor productivity trends for key
Commonwealth fisheries (Box D1). Fishery-level input, output and total factor productivity
indexes were estimated for each of the Commonwealth fisheries analysed and for each year
where data were available. The Fisher quantity index is well suited to handling the range of
inputs and outputs recorded in ABARES fisheries economic survey data. For example, ABARES
fisheries economic survey data contain many zero entries, which are well handled by the Fisher
quantity index approach.
As with other index number approaches that measure productivity, the Fisher quantity index
enables measurement of productivity trends with multiple inputs and outputs. The prices paid
for inputs and received for outputs are used as weights to derive aggregations of outputs and
inputs, which are expressed in index form. Output and input indexes are estimated using both a
Laspeyres and a Paasche index approach. A geometric mean of these indexes is derived to
determine the Fisher output and input indexes. Total factor productivity is measured as the ratio
of the Fisher output and Fisher input indexes.
Data
Data used for this total factor productivity analysis are sourced from the ABARES Australian
fisheries surveys dataset. The surveys dataset comprises physical and financial survey data for a
sample of vessels operating in key Commonwealth fisheries. Inputs incorporated in the input
indexes for each fishery are labour, fuel, repairs and capital. Output indexes for each fishery are
described in the results section for each individual fishery. Population estimates are derived
using sample vessel data from this database and calculated for each of the fisheries analysed in
this report. A weight is calculated for each vessel in the sample, to represent its importance in
the total unobserved population. The weight is generally based on the vessel’s catch
representation. Weighted vessel-level information is used to derive fishery level input and
output indexes.
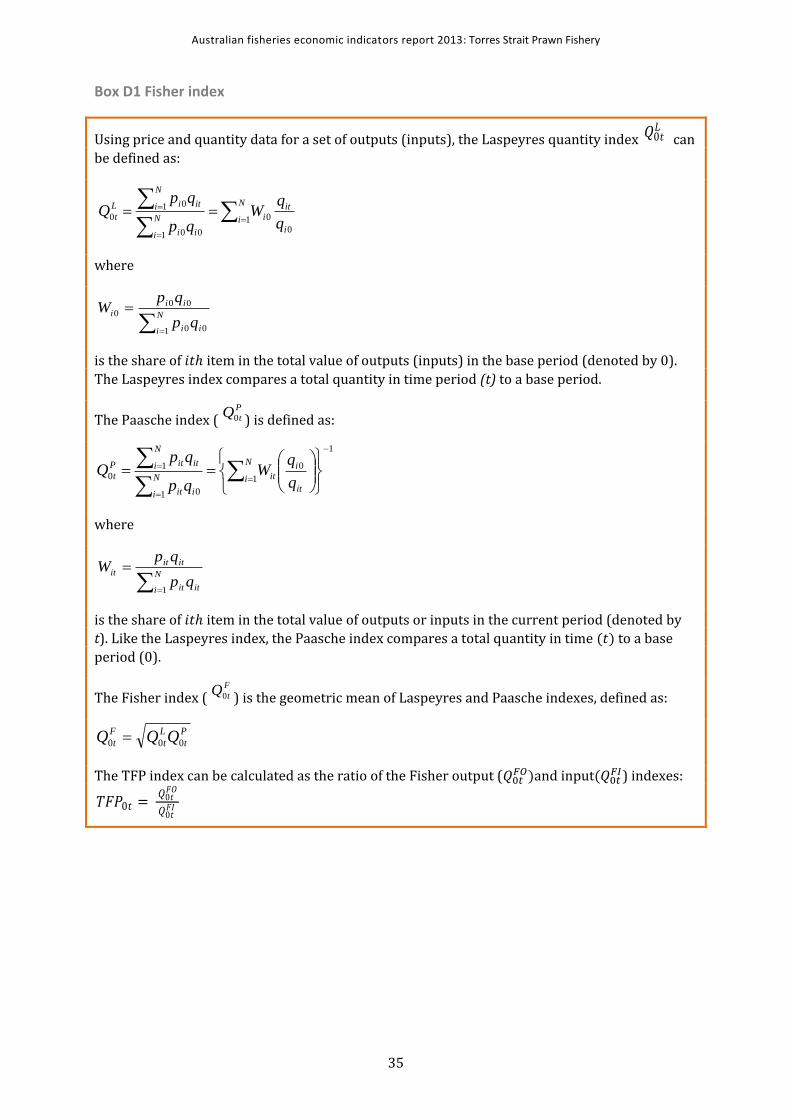
Australian fisheries economic indicators report 2013: Torres Strait Prawn Fishery
35
Box D1 Fisher index
Using price and quantity data for a set of outputs (inputs), the Laspeyres quantity index can
be defined as:
where
is the share of item in the total value of outputs (inputs) in the base period (denoted by 0).
The Laspeyres index compares a total quantity in time period (t) to a base period.
The Paasche index ( ) is defined as:
where
is the share of item in the total value of outputs or inputs in the current period (denoted by
t). Like the Laspeyres index, the Paasche index compares a total quantity in time to a base
period (0).
The Fisher index ( ) is the geometric mean of Laspeyres and Paasche indexes, defined as:
The TFP index can be calculated as the ratio of the Fisher output ( and input
) indexes:
0 𝐿
N
ii
itiN
i ii
N
i itiL
tq
qW
qp
qpQ
10
0
1 00
1 0
0
N
i ii
ii
i
qp
qpW
1 00
00
0
P
tQ0
1
0
1
1 0
10
it
iN
i itN
i iit
N
i ititP
tq
qW
qp
qpQ
N
i itit
itit
it
qp
qpW
1
F
tQ0
P
t
L
t
F
t QQQ 000
𝑇𝐹𝑃0 = 0
𝐹𝑂
0 𝐹𝐼
Australian fisheries economic indicators report 2013: Torres Strait Prawn Fishery
36
Total factor productivity inputs and outputs
Total inputs consist of 13 items, which can be split into four major groups:
Capital—capital costs account for all capital items associated with the fishing business. These
include the vessel, hull, engine, onboard equipment, vehicles and sheds. The estimate of capital
is based on the depreciated replacement value. The quantity variable used for all capital is the
average value of capital stock deflated by the respective prices indexes for each.
Fuel—Fuel costs include the costs of all fuel, oil and grease. The quantity variable used for all
fuel is the average of fuel use deflated by the fuel price paid.
Labour—Labour includes the number of crew employed in vessel-related aspects of the fishing
business, such as crew or onshore administration costs, but does not cover the cost of onshore
labour involved in processing fisheries products. It covers owner/partner, family and unpaid
labour.
Repairs—Repairs costs include vessel and motor vehicle repairs, gear costs and other repairs
expenditure. The quantity variable is the value of all repairs deflated by the price of repairs.
Outputs are the species caught by vessels in each fishery. For the Torres Strait Prawn Fishery,
outputs are tiger, king, Endeavour and other prawns as well as other species caught. The price
variable is the price received for the species caught. The quantity variable is the number of
kilograms of each species caught by individual vessels.
Australian fisheries economic indicators report 2013: Torres Strait Prawn Fishery
37
References AFMA 2011, Harvest strategy for the Torres Strait Prawn Fishery, Australian Fisheries
Management Authority, Canberra, available at pzja.gov.au/the-fisheries/torres-strait-prawn-
fishery/harvest-strategy-for-the-torres-strait-prawn-fishery.
Bardsley, P & Chambers, RL 1984, ‘Multipurpose estimation from unbalanced samples’, Journal
of the Royal Statistical Society. Series C (Applied Statistics), vol. 33, no. 3, pp. 290–9.
Cocking, L & Turnbull, C 2014, Torres Strait Prawn Fishery handbook 2014, Australian Fisheries
Management Authority, Canberra.
Coelli, TJ, Rao, DSP, O’Donnell, CJ & Battese, GE 2005, An introduction to efficiency and
productivity analysis, 2nd edn, Springer, New York.
DAFF 2007, Commonwealth Fisheries Harvest Strategy: policy and guidelines, Department of
Agriculture, Fisheries and Forestry, Canberra.
de Fries, A & Betzel, M 2013, Targeted Indigenous community consultation in the Torres Strait;
gaining an understanding of Indigenous communities’ perceptions regarding vessel and gear
length in the Torres Strait Prawn Fishery, prepared for the Torres Strait Scientific Advisory
Committee, available at pzja.gov.au/resources/publications.
Georgeson, L, Stobutzki, I & Curtotti, R (eds) 2014, Fishery status reports 2013‒14, Australian
Bureau of Agricultural and Resource Economics and Sciences, Canberra.
Kompas, T & Che, TN 2008, Maximum economic yield in the Southern and Eastern Scalefish and
Shark Fishery, ABARE report to the Fisheries Resources Research Fund, Canberra.
Kompas, T & Che, TN 2004, A bioeconomic model of the Australian Northern Prawn Fishery:
management options under uncertainty, Australian Bureau of Agricultural and Resource
Economics, Canberra.
PZJA 2011, ‘20m boat rule and gear restriction trials in the Torres Strait Prawn Fishery’,
Protected Zone Joint Authority, Canberra, available at pzja.gov.au/notices-and-announcements/
notices-and-announcements/20m-boat-rule-and-gear-restriction-trials-in-the-torres-strait-
prawn-fishery.
Skirtun, M, Sahlqvist, P & Vieira, S 2013, Australian fisheries statistics 2012, FRDC project
2010/208, Australian Bureau of Agricultural and Resource Economics and Sciences, Canberra,
November.
Skirtun, M & Vieira, S 2012, Understanding the drivers of profitability in Commonwealth fisheries,
ABARES technical report 12.4 Canberra, November.
Stephan, M & Hobsbawn, P 2014, Australian fisheries and aquaculture statistics 2013, Fisheries
Research and Development Corporation project 2010/208, Australian Bureau of Agricultural
and Resource Economics and Sciences, Canberra, November.
Stephan, M & Vieira, S 2013, Productivity analysis of key Commonwealth fisheries, Technical
report 13.09, Australian Bureau of Agricultural and Resource Economics and Sciences, Canberra,
December.

Australian fisheries economic indicators report 2013: Torres Strait Prawn Fishery
38
TSPMAC 2013, ‘Torres Strait Prawn Management Advisory Committee (TSPMAC)
meeting 14’,Cairns, 16‒17 July, available at pzja.gov.au/pzja-and-committees/torres-strait-
prawn-management-advisory-committee-tspmac/torres-strait-prawn-management-advisory-
committee-tspmac-meeting-14.
Vieira, S & Perks, C 2009, Australian fisheries surveys report 2009: survey results for selected
fisheries, 2006–07 and 2007–08, preliminary estimates for 2008–09, Australian Bureau of
Agricultural and Resource Economics, Canberra, October.