Embed Size (px)
Citation preview
PROCEEDINGS, Thirty-Ninth Workshop on Geothermal Reservoir Engineering
Stanford University, Stanford, California, February 24-26, 2014
SGP-TR-202
1
Australian Experiences in EGS Permeability Enhancement – A Review of 3 Case Studies.
Betina Bendall1, Robert Hogarth, Heinz Holl, Andrew McMahon, Adrian Larking and Peter Reid
1GPO Box 1264, Adelaide, South Australia, Australia, 5000.
Keywords: Australia, Habanero, Paralana, Olympic Dam, granite, enhanced, geothermal, hydraulic stimulation, in situ stress.
ABSTRACT
Geothermal Energy exploration activities commenced in Australia in the year 2000, with all of the projects undertaken since then
focussing on developing Engineered Geothermal System (EGS) or Hot Sedimentary Aquifer (HSA) resources. To date, ten wells
have been drilled to, or close to, EGS reservoir depths and of those, seven have had hydraulic stimulation operations performed in
order to characterise and enhance permeability of the reservoir zone. Although all these wells are located within South Australia,
they test conditions at three geographically disparate areas with markedly different geology.
This paper briefly reviews the activities and results of drilling and stimulation at these three locations, namely; Green Rock Energy
Limited's Olympic Dam Project on the Gawler Craton, Petratherm Limited's Paralana Project in the northern Flinders Ranges and
Geodynamics Limited's Habanero Project in the Cooper Basin.
1. INTRODUCTION
As Australia has no currently active volcanic terrains, exploration strategies employed by the Australian geothermal industry have
targeting either Engineered Geothermal Systems (EGS) or Hot Sedimentary Aquifer (HSA) resources. In the 13 years since
geothermal exploration activities commenced, 10 ‘deep’ wells have been drilled to reservoir depths in order to test the local
geothermal resource, and of these, 6 have had hydraulic stimulation operations carried out to enhance permeability within the target
reservoir zone. All of the stimulated wells are either located at Geodynamics’ Cooper Basin sites or at Petratherm’s Paralana
Project in the eastern Arrowie Basin. In addition Green Rock Energy conducted a mini-hydraulic operation in its intermediate
depth well, Blanche 1, at the Olympic Dam Prospect (Figure 1).
Figure 1. All three of the projects discussed are located in South Australia but test EGS resources in largely unrelated
geological terrains separated by hundreds of kilometres.
Bendall et al.
2
Each of these project areas has a distinctly different geological and structural style, and hence tests different concepts and
approaches to exploration, drilling and stimulation of the wells. There are however commonalities between the projects which
derive from some unique features of the South Australian crust and the overall general requirements of an EGS resource.
One commonality lies in understanding and exploiting the in situ stress regime; identifying if existing natural fractures are present,
their distribution, and if they are amenably oriented for enhancement through hydraulic stimulation operations. Although the
Australian continent is still sparsely populated with stress data compared to some other areas of the World Stress Map (Heidbach et
al, 2009) an interesting phenomenon observed in the data is the complex variability in the orientation of maximum horizontal stress
(SHmax) compared to the current plate boundary forces, in particular the apparent rotation of the maximum horizontal stress
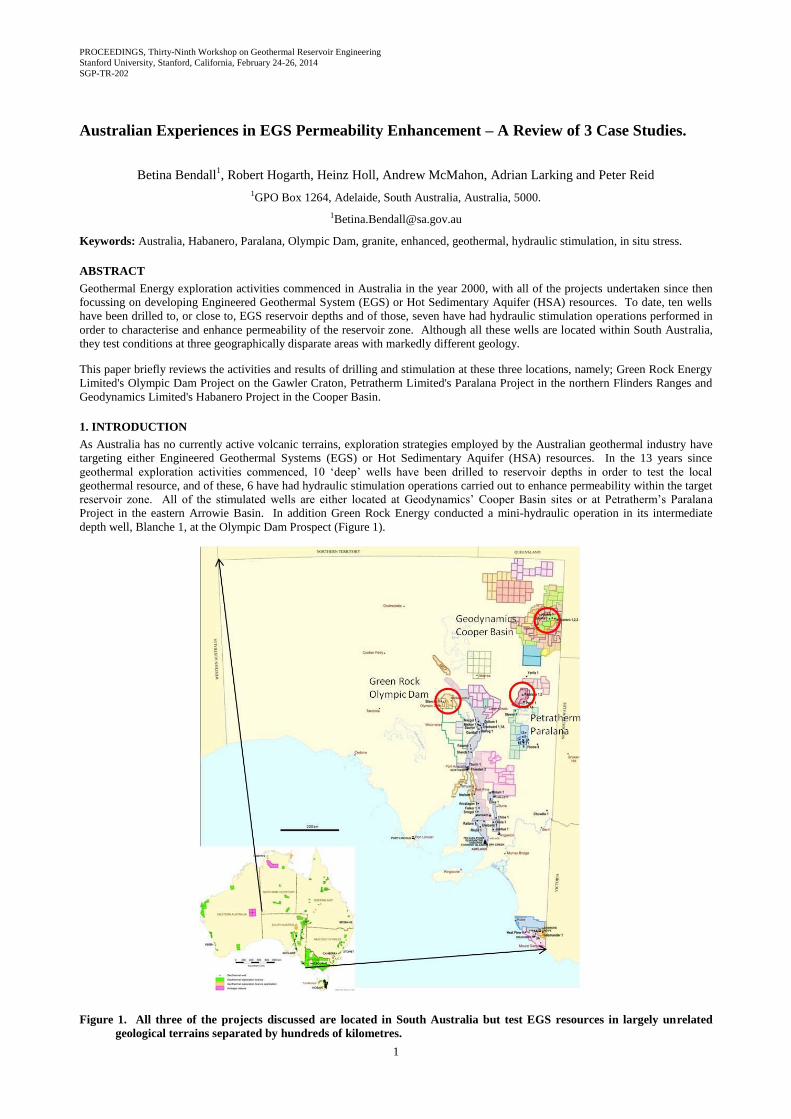
direction through central (intraplate) Australia (Hillis and Reynolds, 2003). Modeling of the intraplate stress field suggests that all
of the 12 identified stress provinces within Australia are characterised by a compressional (reverse faulting) stress state regime
(Reynolds et al, 2002; Reynolds et al, 2003) while focal mechanism solutions from limited earthquake data predominantly indicate
compressional or strike-slip stress regimes (Reynolds et al, 2002; Reynolds et al, 2003) (Figure 2).
As the propagation of fractures induced via hydraulic stimulation is generally expected to occur in the direction of the maximum
principal stress (1) and open against the minimum principal stress (3), a compressional in situ stress regime is favoured as
fractures would be expected to extend horizontally to sub-horizontally. This could lead in principle to the development of a
fracture network which would potentially extend deeper laterally into the reservoir from the stimulated well.
Figure 2. Maximum horizontal stress orientations based on Australian stress map data (after Hillis and Reynolds, 2003).
2. GREEN ROCK ENERGY’S OLYMPIC DAM PROJECT
Green Rock Energy’s (GRK) Olympic Dam project is located adjacent to the giant Olympic Dam Iron Oxide copper gold uranium
mine in the Gawler Craton of South Australia (Figure 1). The Olympic Dam mine is the largest single producing uranium mine in
the world, with the ore body hosted within the Roxby Downs granite, part of the larger Burgoyne Batholith. Granitoids comprising
the batholith are generally of Mesoproterozoic age and can contain elevated concentrations of the radiogenic elements K, U and Th,
potentially contributing to the area’s recorded high surface heat flow of 125mWm-2 calculated at the mine site (Houseman et al,
1989). Green Rock’s strategy was to demonstrate the presence of a significant heat resource in the batholith and to characterise the
drilling conditions and in situ stress regime using slim-hole intermediate depth exploration wells, prior to drilling a deeper
production well into the reservoir zone. Information gathered from the intermediate well would assist in the design of both the
‘deep’ well and the future hydraulic stimulation of that well.
In 2005 Green Rock diamond drilled Blanche 1 about 8 km from the Olympic Dam mine as a fully cored vertical borehole,
reaching a total depth of 1934 metres within variably altered syenogranite and monzogranite, after drilling through 718 m of
sedimentary overburden. Data from Blanche 1 confirmed the presence of thermally anomalous granites with an average heat
generation potential of 8.7W/m3 and a measured average surface heat flow of 94+/- 4mWm-2, with a measured maximum
downhole temperature of 85.3oC at 1934.2 m, (Green Rock Energy, 2006). This granite body is known to cover an area of about
Bendall et al.
3
1180 km2 at an estimated average thickness of about 6000 m as shown by deep 2D reflection seismic surveys. The overlying cover
sequence consists of platform sediments of the Stuart Shelf which are of Mesoproterozoic, Neoproterozoic and Cambrian age and
include a number of insulating shales such as the Yarloo Shale, Tregolana Shale and Tapley Hill Formation.
Although the granite is generally massive, Blanche 1 intersected several zones of fractures with vein filling minerals including
sericite, chlorite, quartz and carbonate above 1034 m. Below 1034 m however the core pervasively broke into multiple horizontal
discs as a result of stress unloading, which prevented easy identification of microfractures in the core, particularly if low angled.
Evidence from acoustic scanner logs confirmed the presence of numerous steeply dipping breccia zones and altered fracture zones
from 1034 m to total depth, suggesting that more pervasive pre-existing fractures may be present throughout the granite mass
(Meyer et al, 2010). In situ stress analysis from borehole breakout indicated that the maximum horizontal principal stress (SHmax)
is consistently oriented in an east-west direction (N 97° ± 3°), with stress ratios of SHmax/Shmin /Sv = (2.5 - 2.75)/(1.2 -1.5)/1 1 at
depths below approximately 1700 m (Klee et al, 2011). Thus the overall stress regime in the tested zone at the bottom of the
borehole is compressional and as a result, fractures induced through hydraulic stimulation operations are expected to propagate
horizontally, while existing active faults amenable to reactivation are expected to be sub-horizontal. Concomitant rock strength
tests were also performed on the core to gather petrophysical data including density, Unconfined Compressive Strength (UCS),
Poisson’s ratio and Young’s Modulus (Meyer et al, 2010).
A series of hydraulic fracturing tests (aka hydrofrac) were subsequently performed in Blanche 1 in 2008 within an open hole
section of the borehole. A total of 12 tests were conducted between 881 m and 1739 m targeting both visibly fractured and
unfractured zones selected from acoustic televiewer borehole logs. The objectives of the hydraulic fracture testing were to: induce
new fractures; reactivate and extend existing fractures; determine the fracture opening pressures; and measure the magnitude and
orientation of the in situ stress field (Meyer et al, 2010; Klee et al, 2011).
The hydraulic fracturing tests were conducted using a trailer mounted winch and 71 mm wireline deployed inflatable straddle
packer since the open hole section of the borehole was only 76 mm in diameter (i.e. NQ2 cored). Details of the wireline hydrofrac
system are discussed in Rummel, (2002). Water was injected using 10 mm coil tubing with a maximum differential pressure of 40
MPa, and at a maximum rate of 10 L/min. The test interval between the packers was 0.7 m. After deployment of the packer
apparatus at each of the test zones, a standard injection cycle was initiated whereby the packer was inflated to seal the test interval
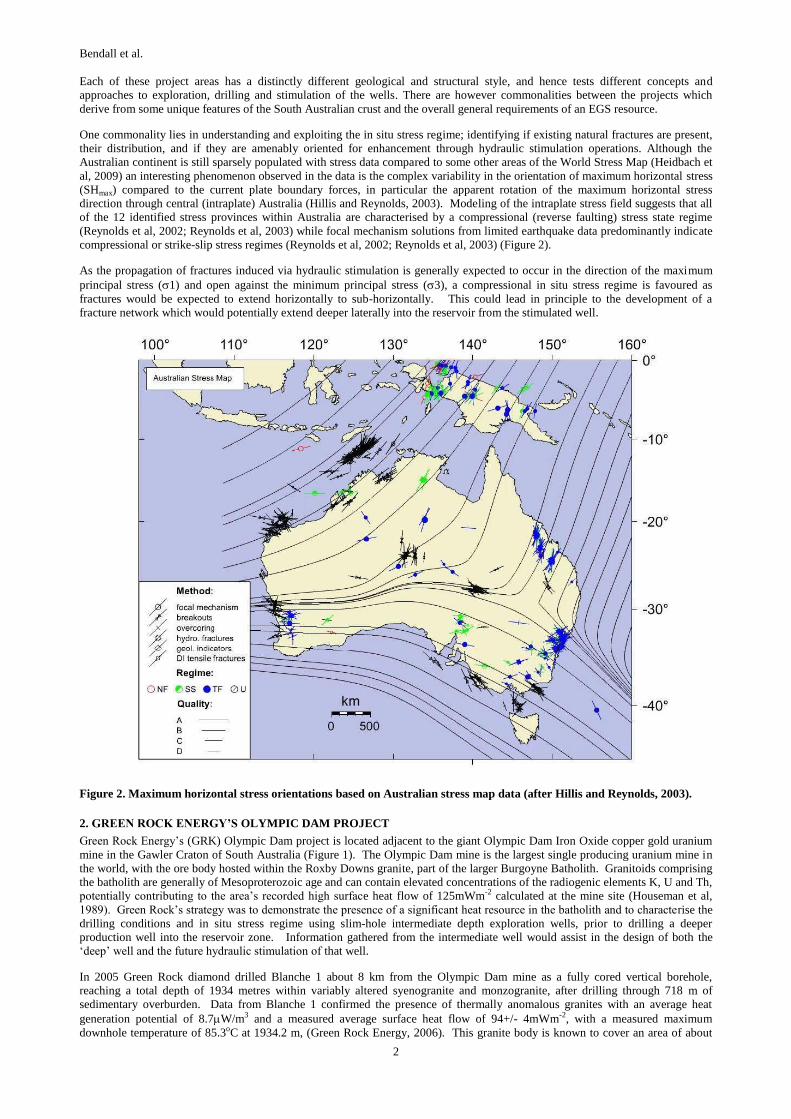
and then the break down, re-opening and shut in pressures were measured (Figure 3). A series of pressure cycles were repeated at
every test interval to validate measurements, and each test interval was pumped with a total volume of 20-50 L of water (Meyer et
al, 2010).
Figure 3. Hydrofrac testing results from Blanche 1 (red=Shmin; blue =SHmax) (after Meyer et al, 2010).
Bendall et al.
4
Within the tested intervals breakdown pressures for initiated fractures were between 22.8 and 49.1 MPa however no fractures were
initiated below 1599 m due to inherent limitations of the packer equipment. Re-opening pressures increased from 19.2 to 47.6 MPa
and shut in pressures were between 17.5 and 50.4 MPa (Klee et al, 2011). On completion of the tests, an acoustic televiewer log
was again run to determine the orientation of induced and/or stimulated fractures, and it was found that either steeply inclined or
sub-horizontal fractures striking E-W were initiated or stimulated by the tests. Stress magnitude determinations from the hydrofrac
data were largely consistent with the findings from the borehole breakout analysis, confirming that horizontal stresses increase with
depth in Blanche 1, with SHmax increasing from ~34 to ~96 MPa and the minimum horizontal stress (Shmin) increasing from ~12 to
~48 MPa (Figure 3). Above approximately 1700 m the hydrofrac data suggests the minimum horizontal stress is less than the
vertical stress (Sv), a result which differs from the borehole breakout analysis, however below this depth both methodologies
indicate that the vertical stress is the minimum principal stress (Klee et al, 2011). It is in this deeper reverse fault compressional
stress regime that the temperatures needed to power geothermal energy projects would be obtained.
3. PETRATHERM’S PARALANA PROJECT
The Paralana Geothermal Project is located about 600 km north of the city of Adelaide in South Australia in the Lake Frome
Embayment east of the Mt Painter Inlier (Figure 1). Mesoproterozoic granitoids and gneisses of the Mt Painter Inlier can contain
anomalously elevated U and Th contents resulting in high to very high heat production rates by global standards. Average heat
production in the Mt Painter Inlier is 10Wm-3, which is around 4 times the rate of average granite (McLaren et al, 2003) and
individual granites such as the Yerila Granite yield up to 62 Wm-3 (Neumann et al, 2000). The Paralana project is exploring for
viable EGS resources within the adjacent Poontana Graben where the Mt Painter basement rocks are overlain by a thick sequence
of flat-lying Neoproterozoic, Cambrian and Tertiary sediments.
Petratherm (PTR) also adopted a strategy of employing intermediate depth slimline drilling to gather data about the project area
before committing to drilling a well to reservoir depths. Initial results from the data well Paralana 1BDW1 were very encouraging
and in 2009 Paralana 2 was drilled to 4003 m where temperatures were expected to be about 180 – 200°C. The well was designed
as a potential injector well, however rather than repeat the strategies employed at previous EGS projects of undertaking hydraulic
stimulation in a very long open hole completion, Paralana 2 was to be fully cased and selectively perforated to enable multi-stage
stimulation of the well. The well is subvertical to about 3400 m and below this deviates systematically to 17°. During drilling
between 3670 and 3864 m depth, several zones of instability and overpressured fluid filled fractures were intersected suggesting the
presence of pervasive fracturing in the deeper rock mass. Shut in pressures indicated ~ 3300 psi overpressure and mud was
weighted to 13.2 ppg to control the flow. As a result the well was able to be cased to 3725 m only (Reid et al, 2012; Beach Energy
Limited, 2010). An extrapolated equilibrium bottom hole temperature of 190°C has been calculated at this depth.
Due to well instability during drilling, a full logging suite was not able to be run in Paralana 2 however a LWD (Logging While
Drilling) suite including an Azimuthal Density log were run and subsequently used to constrain in situ stress tensor and generate
fracture susceptibility models for the area (Beach Energy Limited, 2010). The vertical stress magnitude was calculated by
integrating the bulk density log to provide a relatively linear vertical stress with a gradient of ~26.3 MPa/km. A leak off test
performed at 2250 m to 2600 psi failed to break down the formation, but was considered equivalent to a FIT (Formation Integrity
Test) and its lower bound was used to constrain Sv. The maximum horizontal stress magnitude (SHmax) is also poorly constrained
from vertical stress and formation pressure data. Steady pore pressure of about 10.49 MPa/km was recorded to 3750 m but below
this depth the increased mud weight needed for well control, implies an increase in pore pressure to about 16 MPa/km. Modeling
of circumferential stress magnitude using frictional limits and borehole breakout data indicates that SHmax is practically at frictional
limit with a gradient of 35.22 MPa/km (Mildren et al, 2010).
Two fracture clusters were identified from borehole breakout at between 2595-2670 m and 3610 – 3730 m striking predominantly
northeast. SHmax has mean orientation of N 97° based on borehole breakout data from the Azimuthal Density image log, however
this is relatively uncertain due to the low resolution of the data acquired. Calculations based on the available log data predicted a
strike slip stress regime however circumferential stress modeling suggests the use of higher horizontal stress magnitudes in
calculations would also be internally consistent with the data but predict a compressional stress regime – hence both regimes are
considered possible (Mildren et al, 2010).
The likelihood of stress related permeability enhancement of pre-existing fracture sets in the well vicinity was then modeled using
the strike slip stress regime parameters. Under this model, between the modeled depths of 2980 and 3600m fractures susceptible to
reactivation are consistently predicted to be oriented striking parallel to SHmax +/- 50° and dipping steeply (i.e. >60°) north or south.
Fractures in other orientations or of lower angle are likely to be less susceptible to reactivation. Correlation between the interpreted
fracture data, borehole breakout analysis, and the fracture susceptibility model indicate that a large proportion of interpreted
existing fractures in Paralana 2 are critically oriented to respond to reactivation and potentially act as a permeability network,
particularly observed fracture clusters at 2650 m and below 3600 m depth (Mildren et al, 2010).
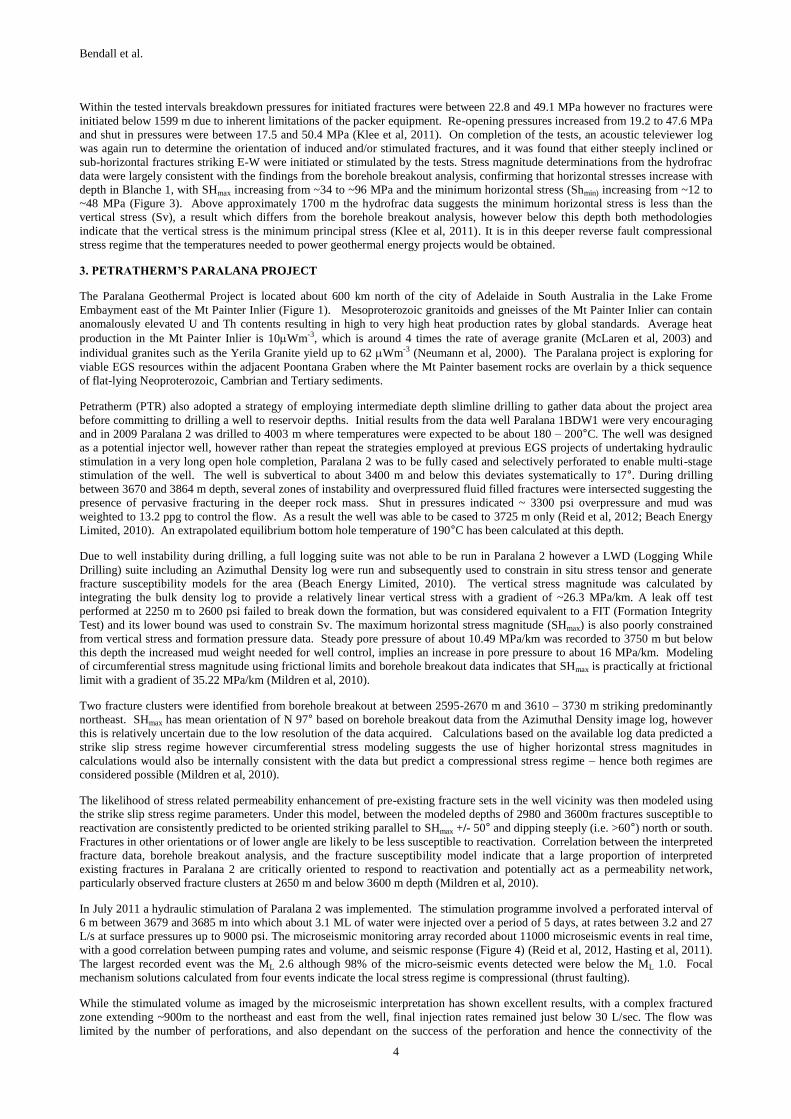
In July 2011 a hydraulic stimulation of Paralana 2 was implemented. The stimulation programme involved a perforated interval of
6 m between 3679 and 3685 m into which about 3.1 ML of water were injected over a period of 5 days, at rates between 3.2 and 27
L/s at surface pressures up to 9000 psi. The microseismic monitoring array recorded about 11000 microseismic events in real time,
with a good correlation between pumping rates and volume, and seismic response (Figure 4) (Reid et al, 2012, Hasting et al, 2011).
The largest recorded event was the ML 2.6 although 98% of the micro-seismic events detected were below the ML 1.0. Focal
mechanism solutions calculated from four events indicate the local stress regime is compressional (thrust faulting).
While the stimulated volume as imaged by the microseismic interpretation has shown excellent results, with a complex fractured
zone extending ~900m to the northeast and east from the well, final injection rates remained just below 30 L/sec. The flow was
limited by the number of perforations, and also dependant on the success of the perforation and hence the connectivity of the
Bendall et al.
5
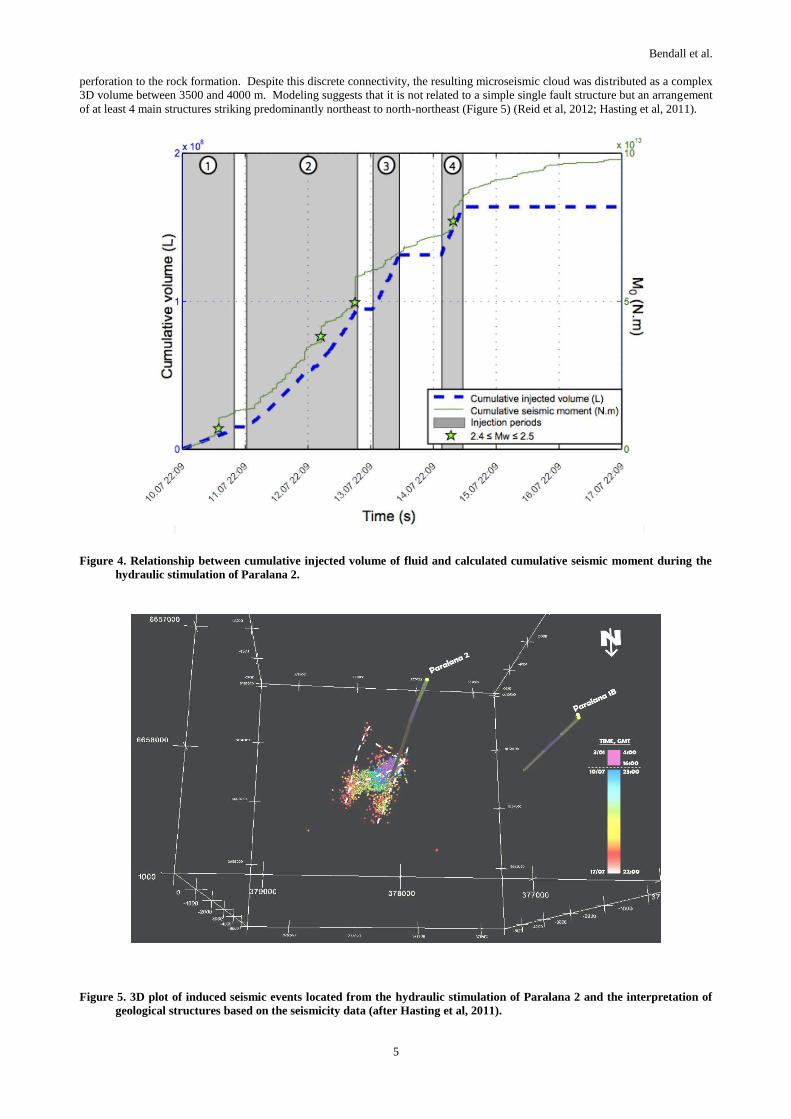
perforation to the rock formation. Despite this discrete connectivity, the resulting microseismic cloud was distributed as a complex
3D volume between 3500 and 4000 m. Modeling suggests that it is not related to a simple single fault structure but an arrangement
of at least 4 main structures striking predominantly northeast to north-northeast (Figure 5) (Reid et al, 2012; Hasting et al, 2011).
Figure 4. Relationship between cumulative injected volume of fluid and calculated cumulative seismic moment during the
hydraulic stimulation of Paralana 2.
Figure 5. 3D plot of induced seismic events located from the hydraulic stimulation of Paralana 2 and the interpretation of
geological structures based on the seismicity data (after Hasting et al, 2011).
Bendall et al.
6
4. GEODYNAMICS’ COOPER BASIN PROJECT
4.1 Location and Temperature
The presence of hot granite beneath the Cooper Basin in central Australia was first established in 1983 when a petroleum
exploration well, McLeod 1, penetrated granite and recorded a bottom hole temperature of 199°C. Geodynamics Limited (GDY)
has been developing Enhanced Geothermal Systems (EGS) in these hot granites since 2002.
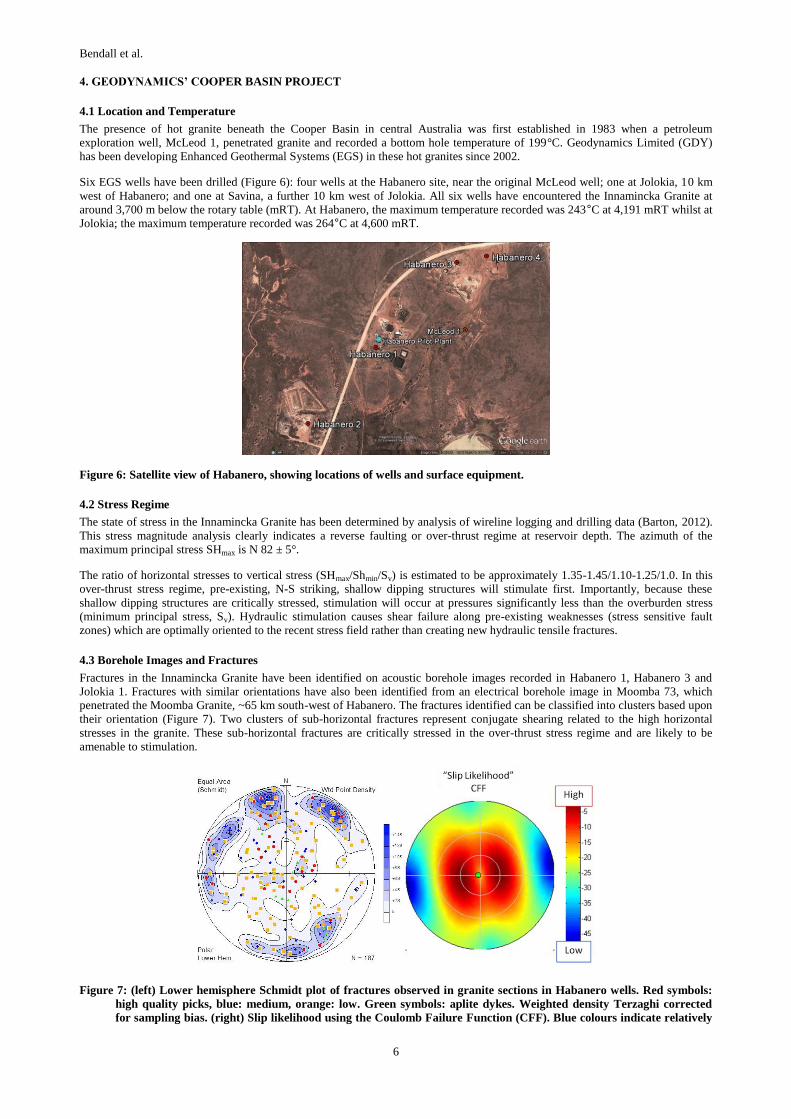
Six EGS wells have been drilled (Figure 6): four wells at the Habanero site, near the original McLeod well; one at Jolokia, 10 km
west of Habanero; and one at Savina, a further 10 km west of Jolokia. All six wells have encountered the Innamincka Granite at
around 3,700 m below the rotary table (mRT). At Habanero, the maximum temperature recorded was 243°C at 4,191 mRT whilst at
Jolokia; the maximum temperature recorded was 264°C at 4,600 mRT.
Figure 6: Satellite view of Habanero, showing locations of wells and surface equipment.
4.2 Stress Regime
The state of stress in the Innamincka Granite has been determined by analysis of wireline logging and drilling data (Barton, 2012).
This stress magnitude analysis clearly indicates a reverse faulting or over-thrust regime at reservoir depth. The azimuth of the
maximum principal stress SHmax is N 82 ± 5°.
The ratio of horizontal stresses to vertical stress (SHmax/Shmin/Sv) is estimated to be approximately 1.35-1.45/1.10-1.25/1.0. In this
over-thrust stress regime, pre-existing, N-S striking, shallow dipping structures will stimulate first. Importantly, because these
shallow dipping structures are critically stressed, stimulation will occur at pressures significantly less than the overburden stress
(minimum principal stress, Sv). Hydraulic stimulation causes shear failure along pre-existing weaknesses (stress sensitive fault
zones) which are optimally oriented to the recent stress field rather than creating new hydraulic tensile fractures.
4.3 Borehole Images and Fractures
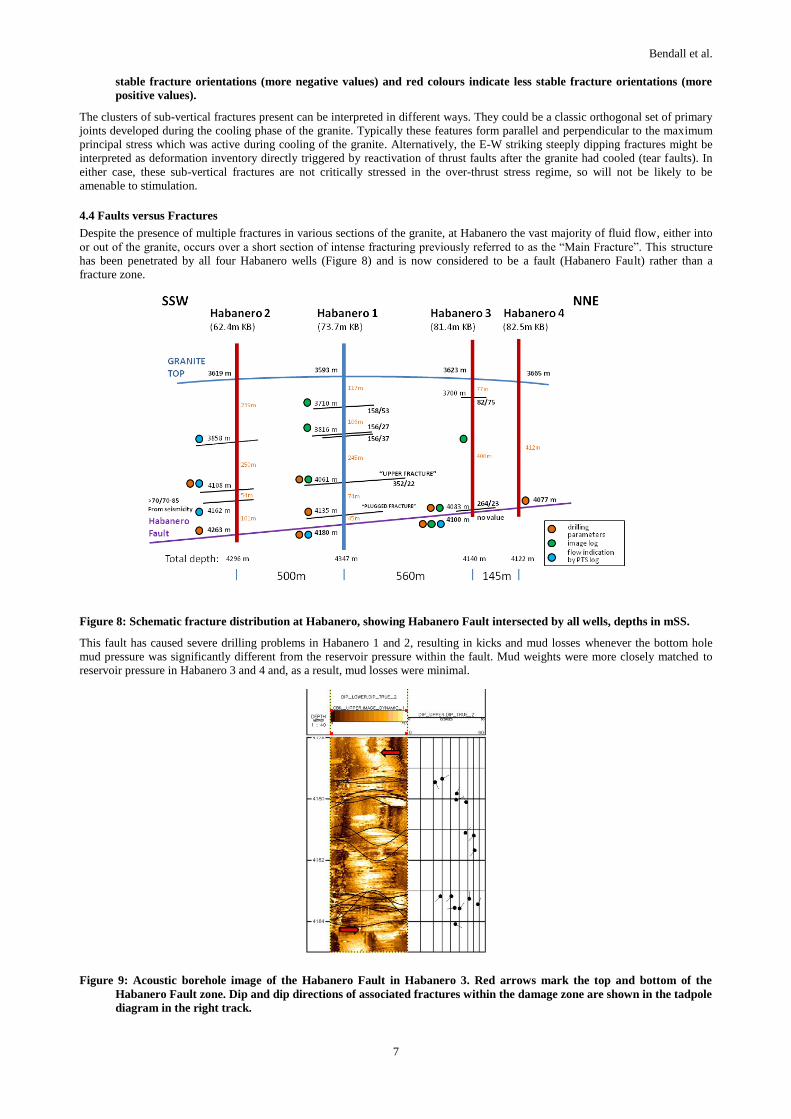
Fractures in the Innamincka Granite have been identified on acoustic borehole images recorded in Habanero 1, Habanero 3 and
Jolokia 1. Fractures with similar orientations have also been identified from an electrical borehole image in Moomba 73, which
penetrated the Moomba Granite, ~65 km south-west of Habanero. The fractures identified can be classified into clusters based upon
their orientation (Figure 7). Two clusters of sub-horizontal fractures represent conjugate shearing related to the high horizontal
stresses in the granite. These sub-horizontal fractures are critically stressed in the over-thrust stress regime and are likely to be
amenable to stimulation.
Figure 7: (left) Lower hemisphere Schmidt plot of fractures observed in granite sections in Habanero wells. Red symbols:
high quality picks, blue: medium, orange: low. Green symbols: aplite dykes. Weighted density Terzaghi corrected
for sampling bias. (right) Slip likelihood using the Coulomb Failure Function (CFF). Blue colours indicate relatively
Bendall et al.
7
stable fracture orientations (more negative values) and red colours indicate less stable fracture orientations (more
positive values).
The clusters of sub-vertical fractures present can be interpreted in different ways. They could be a classic orthogonal set of primary
joints developed during the cooling phase of the granite. Typically these features form parallel and perpendicular to the maximum
principal stress which was active during cooling of the granite. Alternatively, the E-W striking steeply dipping fractures might be
interpreted as deformation inventory directly triggered by reactivation of thrust faults after the granite had cooled (tear faults). In
either case, these sub-vertical fractures are not critically stressed in the over-thrust stress regime, so will not be likely to be
amenable to stimulation.
4.4 Faults versus Fractures
Despite the presence of multiple fractures in various sections of the granite, at Habanero the vast majority of fluid flow, either into
or out of the granite, occurs over a short section of intense fracturing previously referred to as the “Main Fracture”. This structure
has been penetrated by all four Habanero wells (Figure 8) and is now considered to be a fault (Habanero Fault) rather than a
fracture zone.
Figure 8: Schematic fracture distribution at Habanero, showing Habanero Fault intersected by all wells, depths in mSS.
This fault has caused severe drilling problems in Habanero 1 and 2, resulting in kicks and mud losses whenever the bottom hole
mud pressure was significantly different from the reservoir pressure within the fault. Mud weights were more closely matched to
reservoir pressure in Habanero 3 and 4 and, as a result, mud losses were minimal.
Figure 9: Acoustic borehole image of the Habanero Fault in Habanero 3. Red arrows mark the top and bottom of the
Habanero Fault zone. Dip and dip directions of associated fractures within the damage zone are shown in the tadpole
diagram in the right track.
Bendall et al.
8
The only existing image of the Habanero Fault zone was logged in Habanero 3 with an acoustic borehole imaging tool (Figure 9).
The fault is most likely visible because the well had brine influx from the reservoir, thinning the mud to a level where acoustic
imaging was possible. The image quality above and below the reservoir decreased rapidly because the barite mud used does not
allow proper acoustic imaging.
The image shows a 5-6 m thick fault zone which can be identified by the lack of breakout between the red arrows. Breakout is
clearly developed above and below the fault zone but is absent within the fault zone due to stress release caused by slip. The major
active fault plane is characterized by a one metre thick cavern of broken out granite (4,180-4,181 mRT). Fractures above and below
the active fault plane indicate the damaged zone associated with the active shear zone.
4.5 Induced Seismicity
Mapping of the induced seismicity associated with the stimulation of wells is the primary tool used to determine the extent of the
Habanero reservoir. After stimulations at Habanero 1, 2, 3 and 4, the cloud of seismic events now covers over 4 km2.
In November 2012, a large hydraulic stimulation was carried out in Habanero 4. The intent of this stimulation was to expand the
existing EGS geothermal reservoir and to gain a better understanding of the geothermal system through the seismic response caused
by the stimulation. Over 36 ML of water were injected into the existing Habanero Fault over three weeks.
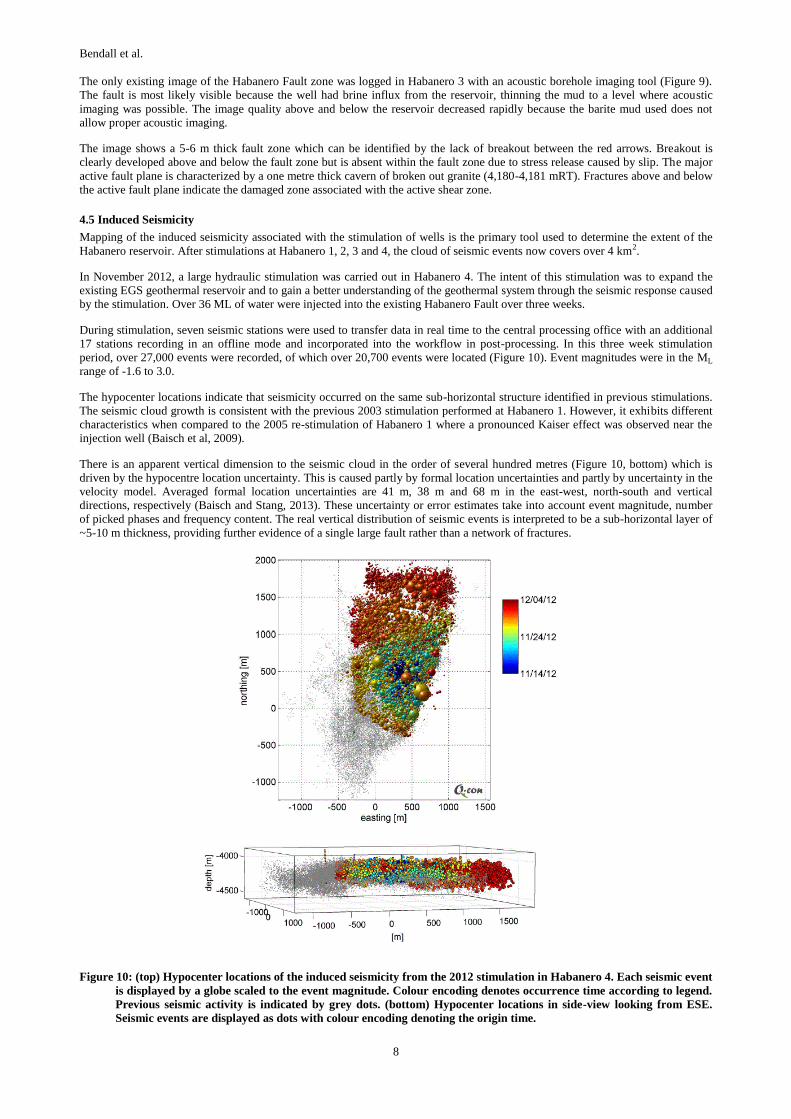
During stimulation, seven seismic stations were used to transfer data in real time to the central processing office with an additional
17 stations recording in an offline mode and incorporated into the workflow in post-processing. In this three week stimulation
period, over 27,000 events were recorded, of which over 20,700 events were located (Figure 10). Event magnitudes were in the ML
range of -1.6 to 3.0.
The hypocenter locations indicate that seismicity occurred on the same sub-horizontal structure identified in previous stimulations.
The seismic cloud growth is consistent with the previous 2003 stimulation performed at Habanero 1. However, it exhibits different
characteristics when compared to the 2005 re-stimulation of Habanero 1 where a pronounced Kaiser effect was observed near the
injection well (Baisch et al, 2009).
There is an apparent vertical dimension to the seismic cloud in the order of several hundred metres (Figure 10, bottom) which is
driven by the hypocentre location uncertainty. This is caused partly by formal location uncertainties and partly by uncertainty in the
velocity model. Averaged formal location uncertainties are 41 m, 38 m and 68 m in the east-west, north-south and vertical
directions, respectively (Baisch and Stang, 2013). These uncertainty or error estimates take into account event magnitude, number
of picked phases and frequency content. The real vertical distribution of seismic events is interpreted to be a sub-horizontal layer of
~5-10 m thickness, providing further evidence of a single large fault rather than a network of fractures.
Figure 10: (top) Hypocenter locations of the induced seismicity from the 2012 stimulation in Habanero 4. Each seismic event
is displayed by a globe scaled to the event magnitude. Colour encoding denotes occurrence time according to legend.
Previous seismic activity is indicated by grey dots. (bottom) Hypocenter locations in side-view looking from ESE.
Seismic events are displayed as dots with colour encoding denoting the origin time.
Bendall et al.
9
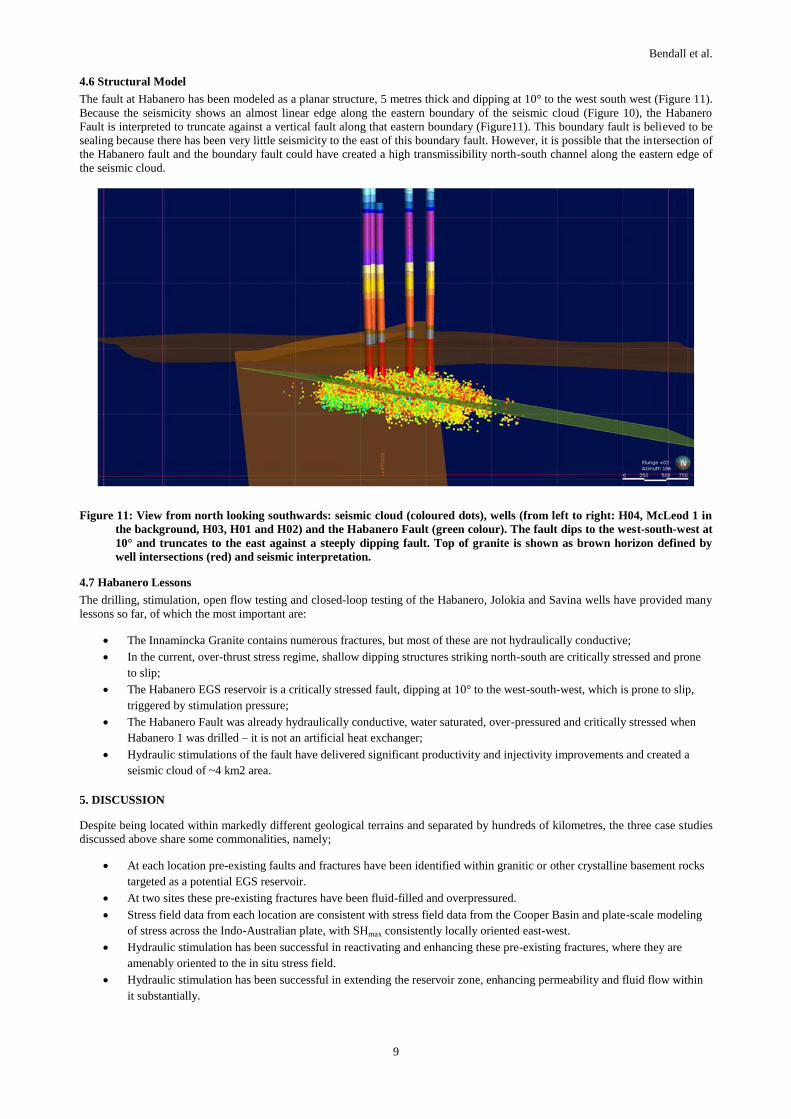
4.6 Structural Model
The fault at Habanero has been modeled as a planar structure, 5 metres thick and dipping at 10° to the west south west (Figure 11).
Because the seismicity shows an almost linear edge along the eastern boundary of the seismic cloud (Figure 10), the Habanero
Fault is interpreted to truncate against a vertical fault along that eastern boundary (Figure11). This boundary fault is believed to be
sealing because there has been very little seismicity to the east of this boundary fault. However, it is possible that the intersection of
the Habanero fault and the boundary fault could have created a high transmissibility north-south channel along the eastern edge of
the seismic cloud.
Figure 11: View from north looking southwards: seismic cloud (coloured dots), wells (from left to right: H04, McLeod 1 in
the background, H03, H01 and H02) and the Habanero Fault (green colour). The fault dips to the west-south-west at
10° and truncates to the east against a steeply dipping fault. Top of granite is shown as brown horizon defined by
well intersections (red) and seismic interpretation.
4.7 Habanero Lessons
The drilling, stimulation, open flow testing and closed-loop testing of the Habanero, Jolokia and Savina wells have provided many
lessons so far, of which the most important are:
The Innamincka Granite contains numerous fractures, but most of these are not hydraulically conductive;
In the current, over-thrust stress regime, shallow dipping structures striking north-south are critically stressed and prone
to slip;
The Habanero EGS reservoir is a critically stressed fault, dipping at 10° to the west-south-west, which is prone to slip,
triggered by stimulation pressure;
The Habanero Fault was already hydraulically conductive, water saturated, over-pressured and critically stressed when
Habanero 1 was drilled – it is not an artificial heat exchanger;
Hydraulic stimulations of the fault have delivered significant productivity and injectivity improvements and created a
seismic cloud of ~4 km2 area.
5. DISCUSSION
Despite being located within markedly different geological terrains and separated by hundreds of kilometres, the three case studies
discussed above share some commonalities, namely;
At each location pre-existing faults and fractures have been identified within granitic or other crystalline basement rocks
targeted as a potential EGS reservoir.
At two sites these pre-existing fractures have been fluid-filled and overpressured.
Stress field data from each location are consistent with stress field data from the Cooper Basin and plate-scale modeling
of stress across the Indo-Australian plate, with SHmax consistently locally oriented east-west.
Hydraulic stimulation has been successful in reactivating and enhancing these pre-existing fractures, where they are
amenably oriented to the in situ stress field.
Hydraulic stimulation has been successful in extending the reservoir zone, enhancing permeability and fluid flow within
it substantially.
Bendall et al.
10
REFERENCES
Baisch, S., and Stang, H.: Seismic Real-Time Monitoring of the Habanero#4 Stimulation – Q-con Technical Report, June 2013,
unpublished.
Baisch, S., Voros, R., Weidler, R. and Wyborn, D.: Investigation of Fault Mechanisms during Geothermal Reservoir Stimulation
Experiments in the Cooper Basin, Australia. Bulletin Seismological Society America, 99, (2009), 148-158.
Barton, C.: Geomechanical Model Update for the Innamincka Licence Area. - GMI report, February 2012, unpublished.
Beach Energy Limited: Paralana 2 Well Completion Report. Beach Energy Limited company report, June 2010, unpublished.
Green Rock Energy: Blanche 1 Geothermal Exploration Hole Completion Report. Green Rock Energy company report, March
2006, unpublished.
Hasting M., Albaric, J., Oye, V., Reid, P., Messeiller, M., Llanos E., Malin, P., Shalev, E., Hogg, M., Alvarez, M., Miller, A.,
Wlater, C., Boese, C. and Voss, N.: Real-time induced seismicity monitoring during wellbore stimulation at Paralana 2 South
Australia. In Budd, A.R. (ed) 2011. Proceedings of the 2011 Australian Geothermal Energy Conference, 16-18 November,
Melbourne, Geoscience Australia Record 2011/43, 85-102.
Hillis, R.R. and Reynolds, S.D.: In situ stress field of Australia. Geol. Soc. Australia Spec. Publ., 22, (2003), 49-58.
Heidbach, O., Tingay, M., Barth, A., Reinecker, J., Kurfeß, D., Müller, B.: The World Stress Map based on the database release
2008, equatorial scale 1:46,000,000, Commission for the Geological Map of the World, Paris, doi:10.1594/GFZ.WSM.Map2009.
Houseman, G.A., Cull, J.P., Muir, P.M. and Paterson, H.L.: Geothermal signatures and uranium ore deposits on the Stuart Shelf of
South Australia. Geophysics, 54(2), (1989), 158-170.
Klee, G., Bunger, A., Meyer, F., Rummel, F. And Shen, B.: In situ stresses in borehole Blanche-1/South Australia derived from
breakouts, core discing and hydraulic fracturing to 2 km depth. Rock Mech. Rock Eng., 44, (2011), 531-540 DOI 10.1007/s00603-
011-0157-2.
McLaren S., Sandiford M., Hand M., Neumann N., Wyborn L. and Bastrakova I.: The hot southern continent: heat flow and heat
production in Australian Proterozoic terranes. Geological Society of America Special Paper, 372, (2003), 157-167.
Meyer, G., Larking, A., Jeffrey, R. and Bunger, A.: Olympic Dam EGS Project. Proceedings World Geothermal Congress 2010
Bali, Indonesia, 25-29 April 2010.
Mildren, S.D., Ditty, N.J. and Brooke-Barnett, S.: Paralana 2 azimuthal density image log and fracture susceptibility assessment.
Unpublished company report, (2010).
Neumann, N., Sandiford, M. and Foden, J.: Regional geochemistry and continental heat flow: implications for the origin of the
South Australian heat flow anomaly. Earth and Planetary Science Letters, 183, (2000), 107-120.
Reid, P., Messeiller, M. and Hasting, M.: The Paralana Engineered Geothermal Project – case history and results of the hydraulic
fracture stimulation. In Huddlestone-Holmes, C and Gerner, E. (eds). Proceedings of the 2012 Australian Geothermal Energy
Conference, Geoscience Australia Record 2012/73, 161-164.
Reynolds, S.D., Coblentz, D.D. and Hillis R.R.: Tectonic forces controlling the regional intraplate stress field in continental
Australia: Results from new finite element modeling. Journal of Geophysical Research, 17,(2003), B7 10.1029/2001JB000408.
Reynolds, S.D., Coblentz, D.D. and Hillis R.R.: Influences of plate-boundary forces on the regional intraplate stress field of
continental Australia. Geol. Soc. Australia Spec. Publ., 22, (2003), 53-64.
Rummel, F.: Fracture mechanics approach to hydraulic fracturing stress measurements In “Fracture Mechanics of Rocks” (ed.
Atkinson), Acad. Press London, (2002), 217-239.