Embed Size (px)
Citation preview

Australian Economic Outlook
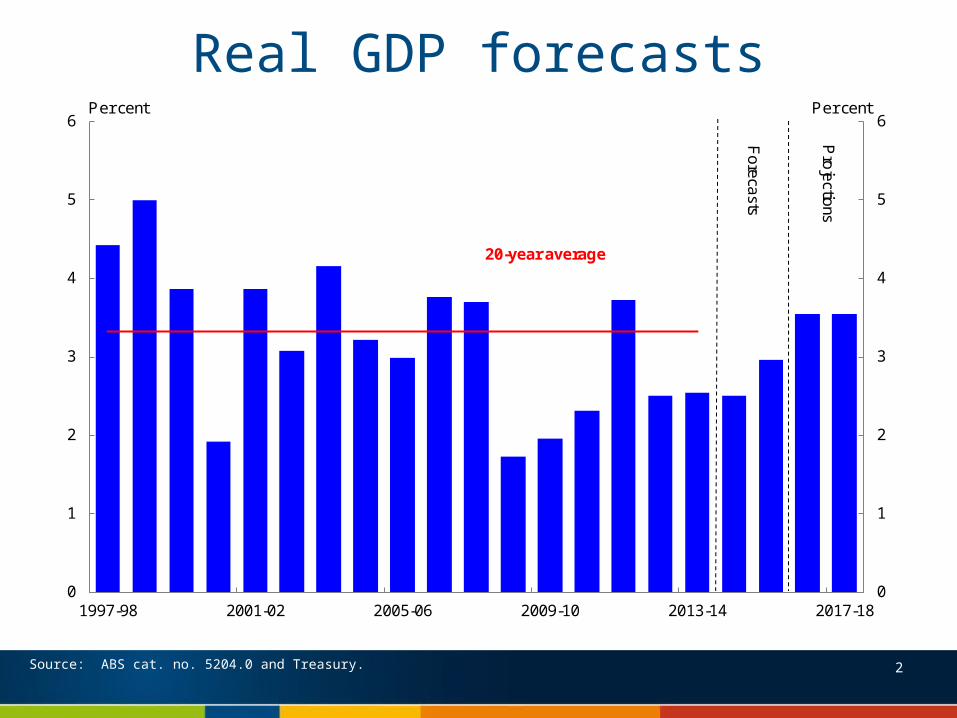
Real GDP forecasts
Source: ABS cat. no. 5204.0 and Treasury.
0
1
2
3
4
5
6
0
1
2
3
4
5
6
1997-98 2001-02 2005-06 2009-10 2013-14 2017-18
Per cent
Fo
reca
sts
Pro
jectio
ns
20-year average
Per cent
2
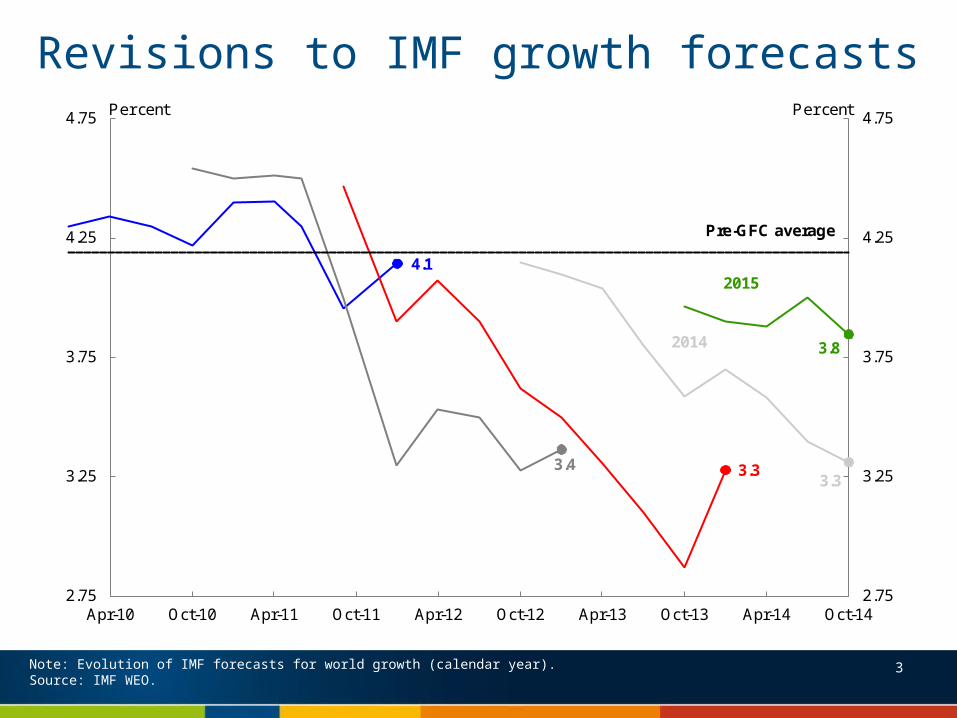
Revisions to IMF growth forecasts
Note: Evolution of IMF forecasts for world growth (calendar year). Source: IMF WEO.
4.1
3.4 3.33.3
3.8
2.75
3.25
3.75
4.25
4.75
2.75
3.25
3.75
4.25
4.75
Apr-10 Oct-10 Apr-11 Oct-11 Apr-12 Oct-12 Apr-13 Oct-13 Apr-14 Oct-14
Per centPer cent
Pre-GFC average
2014
2015
3
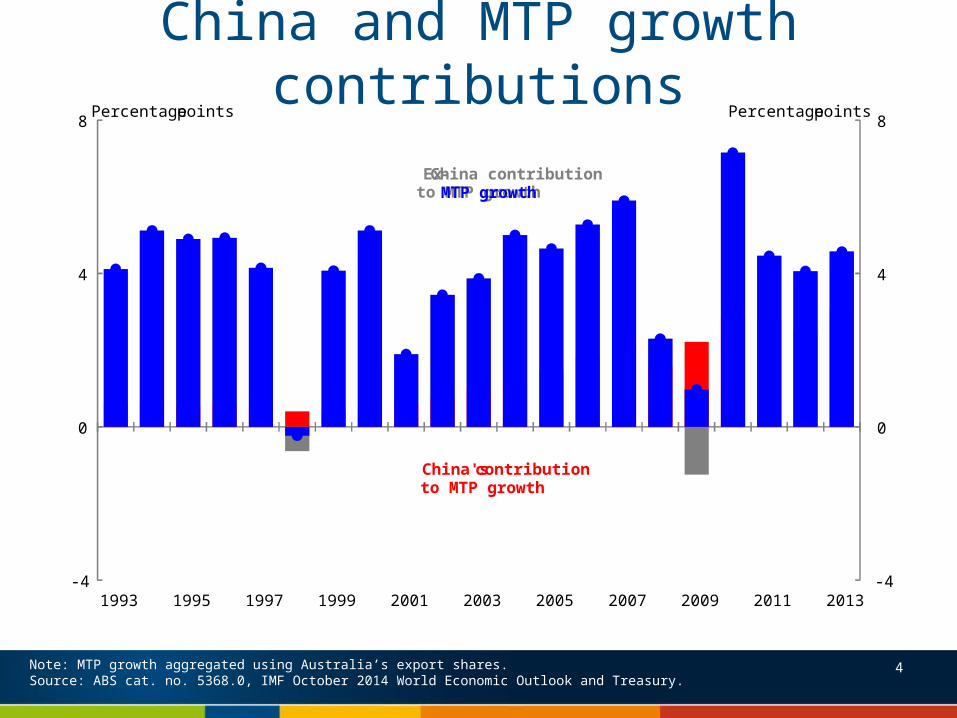
China and MTP growth contributions
Note: MTP growth aggregated using Australia’s export shares.Source: ABS cat. no. 5368.0, IMF October 2014 World Economic Outlook and Treasury.
4
-4
0
4
8
-4
0
4
8
1993 1995 1997 1999 2001 2003 2005 2007 2009 2011 2013
Percentage points
China's contribution to MTP growth
Ex-China contribution to MTP growth
Percentage points
MTP growth
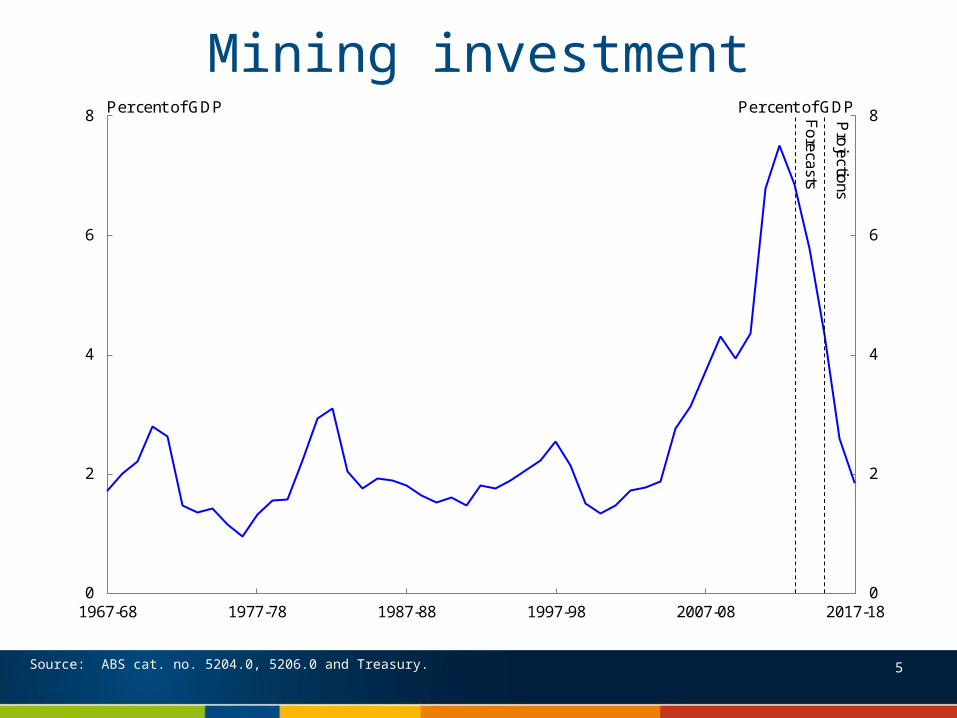
Mining investment
Source: ABS cat. no. 5204.0, 5206.0 and Treasury.
0
2
4
6
8
0
2
4
6
8
1967-68 1977-78 1987-88 1997-98 2007-08 2017-18
Per cent of GDPPer cent of GDP Fo
reca
sts
Pro
jectio
ns
5
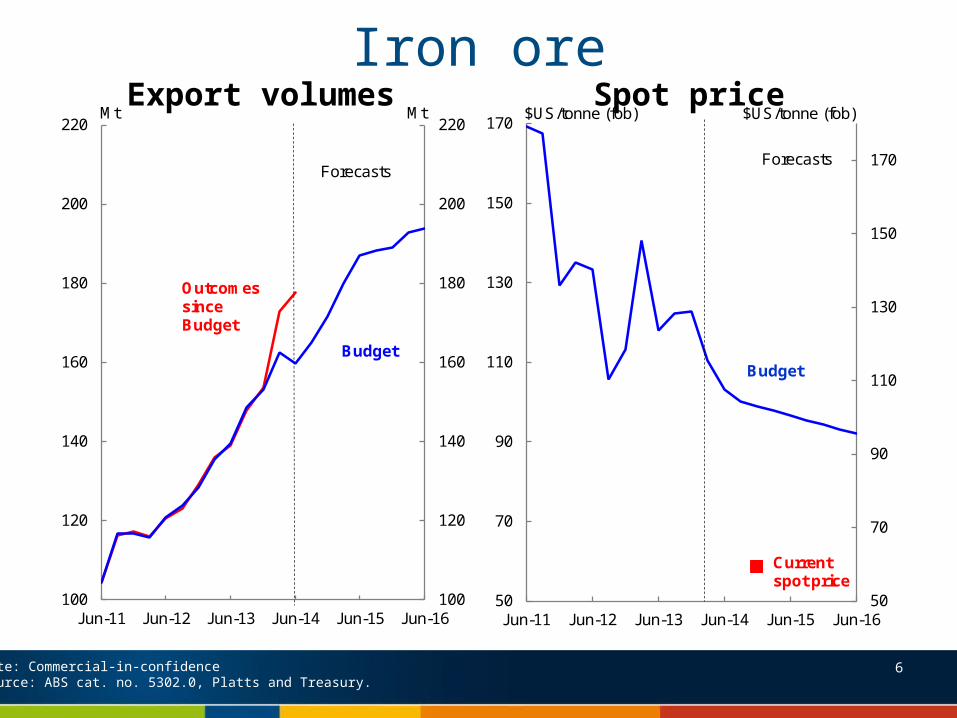
Iron oreExport volumes Spot price
6Note: Commercial-in-confidence Source: ABS cat. no. 5302.0, Platts and Treasury.
100
120
140
160
180
200
220
100
120
140
160
180
200
220
Jun-11 Jun-12 Jun-13 Jun-14 Jun-15 Jun-16
MtMt
OutcomessinceBudget
Budget
Forecasts
50
70
90
110
130
150
170
50
70
90
110
130
150
170
Jun-11 Jun-12 Jun-13 Jun-14 Jun-15 Jun-16
$US/tonne (fob) $US/tonne (fob)
Current spot price
Forecasts
Budget
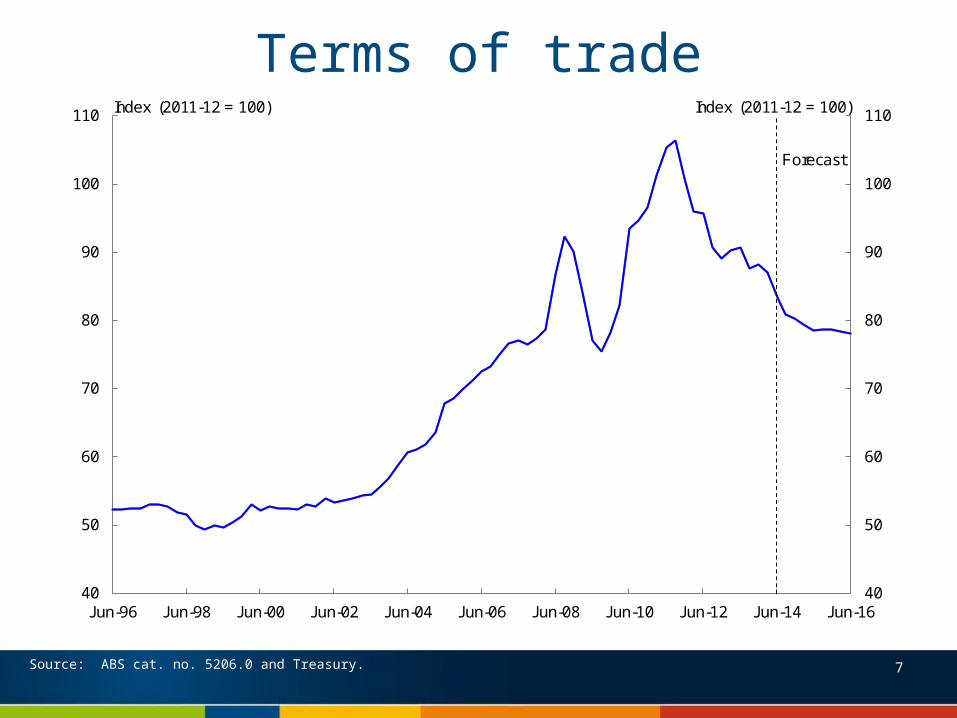
Terms of trade
40
50
60
70
80
90
100
110
40
50
60
70
80
90
100
110
Jun-96 Jun-98 Jun-00 Jun-02 Jun-04 Jun-06 Jun-08 Jun-10 Jun-12 Jun-14 Jun-16
Index (2011-12 = 100)Index (2011-12 = 100)
Forecast
7Source: ABS cat. no. 5206.0 and Treasury.
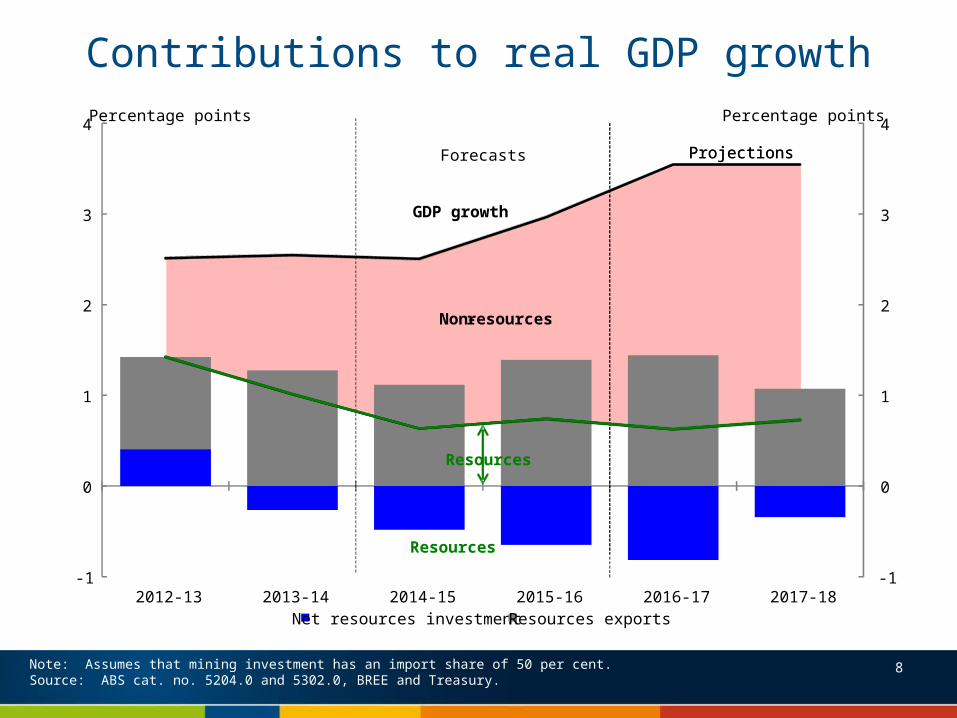
Non-resources
GDP growth
Contributions to real GDP growth
Note: Assumes that mining investment has an import share of 50 per cent.Source: ABS cat. no. 5204.0 and 5302.0, BREE and Treasury.
8
-1
0
1
2
3
4
-1
0
1
2
3
4
2012-13 2013-14 2014-15 2015-16 2016-17 2017-18
Percentage pointsPercentage points
Net resources investment Resources exports
ProjectionsForecasts Projections
Resources
Resources
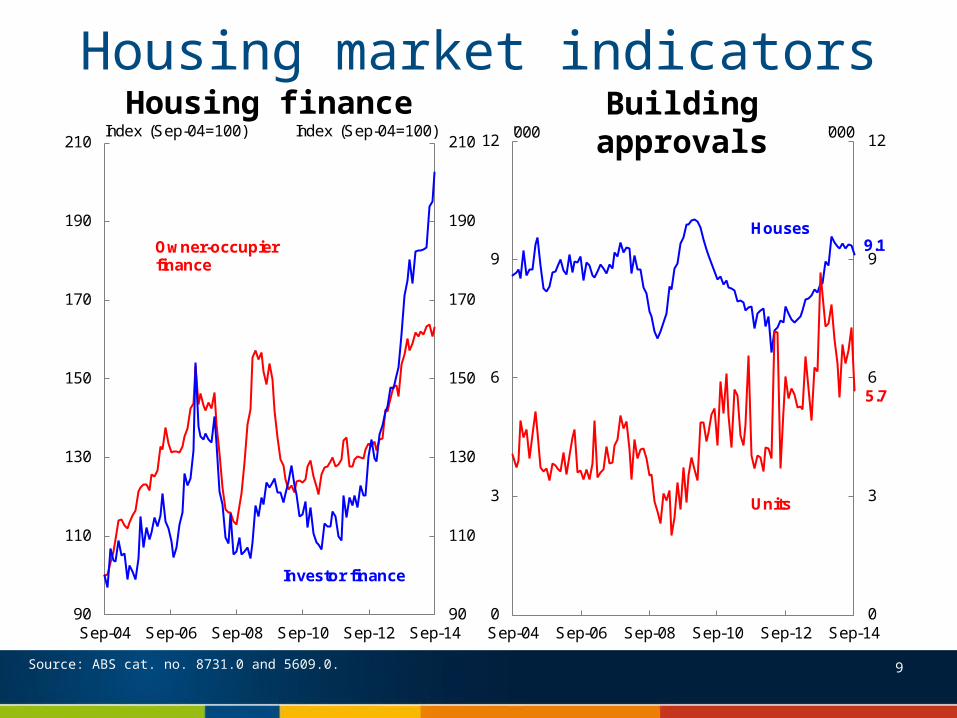
Housing market indicatorsBuilding approvals
Source: ABS cat. no. 8731.0 and 5609.0.
Housing finance
9.1
5.7
0
3
6
9
12
0
3
6
9
12
Sep-04 Sep-06 Sep-08 Sep-10 Sep-12 Sep-14
'000 '000
Houses
Units
90
110
130
150
170
190
210
90
110
130
150
170
190
210
Sep-04 Sep-06 Sep-08 Sep-10 Sep-12 Sep-14
Index (Sep-04=100) Index (Sep-04=100)
Owner-occupier finance
Investor finance
9
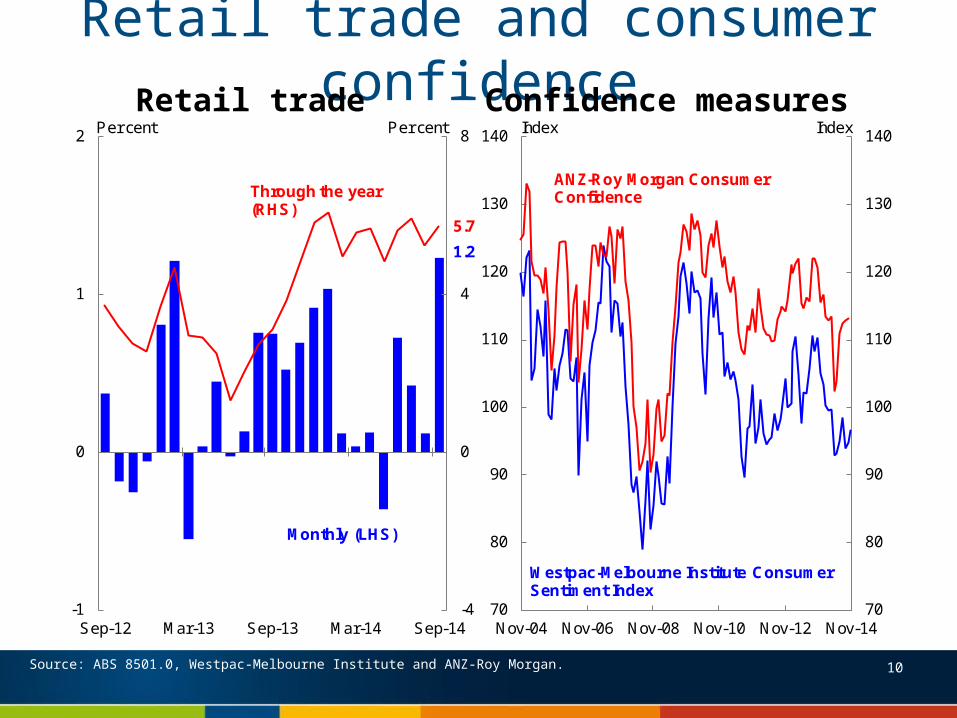
Source: ABS 8501.0, Westpac-Melbourne Institute and ANZ-Roy Morgan.
Retail trade and consumer confidenceRetail trade Confidence measures
70
80
90
100
110
120
130
140
70
80
90
100
110
120
130
140
Nov-04 Nov-06 Nov-08 Nov-10 Nov-12 Nov-14
Index Index
ANZ-Roy Morgan Consumer Confidence
Westpac-Melbourne Institute ConsumerSentiment Index
10
1.2
5.7
-4
0
4
8
-1
0
1
2
Sep-12 Mar-13 Sep-13 Mar-14 Sep-14
Per cent Per cent
Monthly (LHS)
Through the year (RHS)
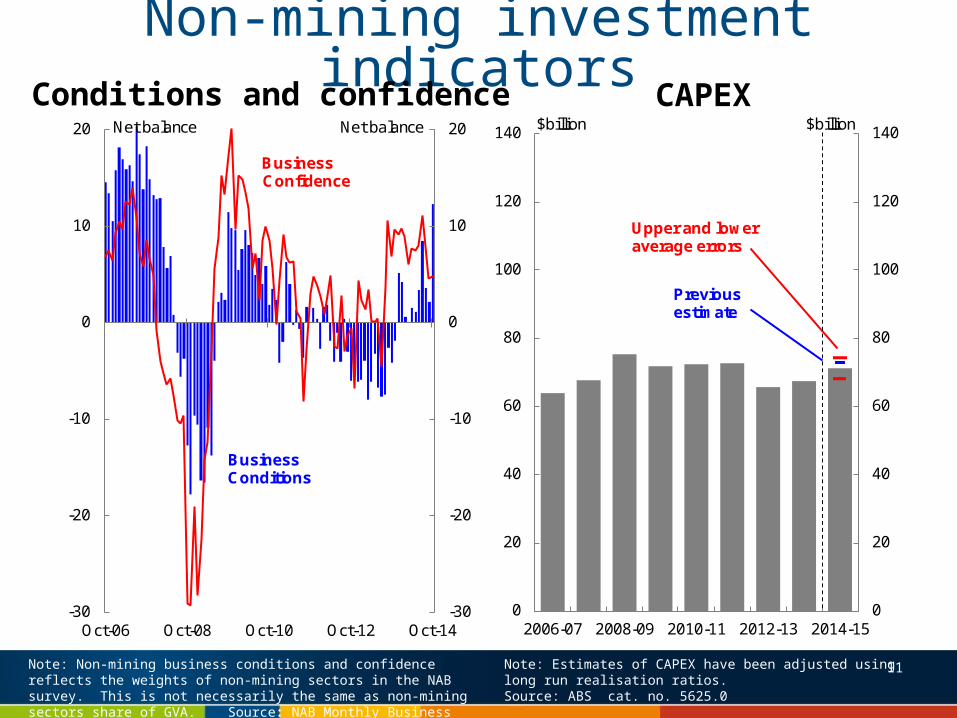
Non-mining investment indicators
Note: Non-mining business conditions and confidence reflects the weights of non-mining sectors in the NAB survey. This is not necessarily the same as non-mining sectors share of GVA. Source: NAB Monthly Business Survey.
Note: Estimates of CAPEX have been adjusted using long run realisation ratios. Source: ABS cat. no. 5625.0
-30
-20
-10
0
10
20
-30
-20
-10
0
10
20
Oct-06 Oct-08 Oct-10 Oct-12 Oct-14
Business Confidence
Business Conditions
Net balance Net balance
Conditions and confidence CAPEX
11
0
20
40
60
80
100
120
140
0
20
40
60
80
100
120
140
2006-07 2008-09 2010-11 2012-13 2014-15
$billion$billion
Upper and lower average errors
Previous estimate
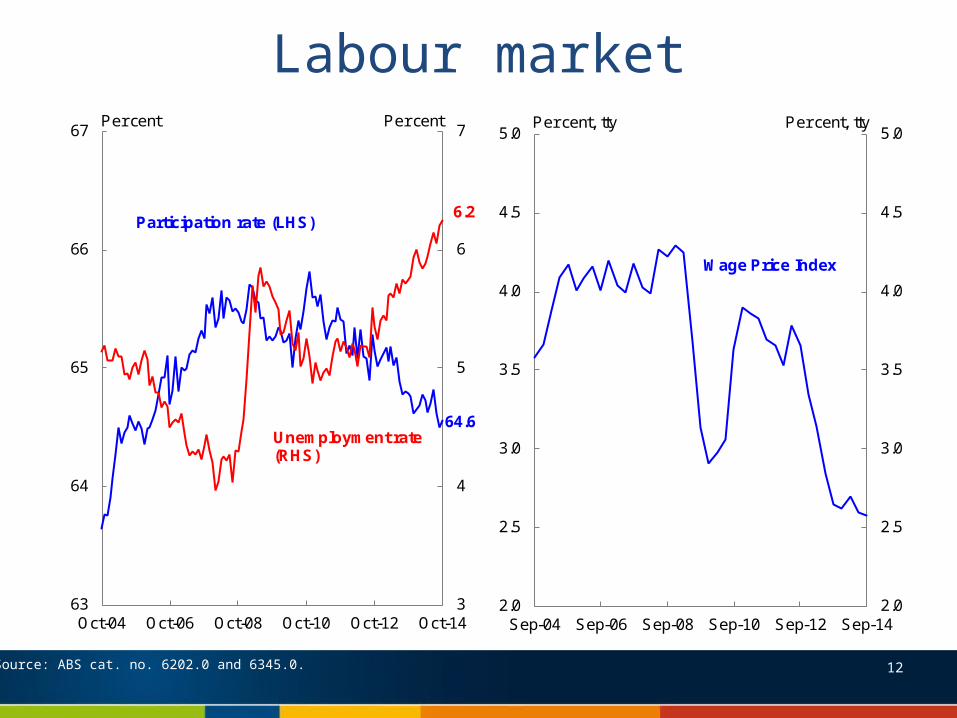
Labour market
Source: ABS cat. no. 6202.0 and 6345.0.
64.6
6.2
3
4
5
6
7
63
64
65
66
67
Oct-04 Oct-06 Oct-08 Oct-10 Oct-12 Oct-14
Per cent Per cent
Unemployment rate(RHS)
Participation rate (LHS)
2.0
2.5
3.0
3.5
4.0
4.5
5.0
2.0
2.5
3.0
3.5
4.0
4.5
5.0
Sep-04 Sep-06 Sep-08 Sep-10 Sep-12 Sep-14
Per cent, tty Per cent, tty
Wage Price Index
12
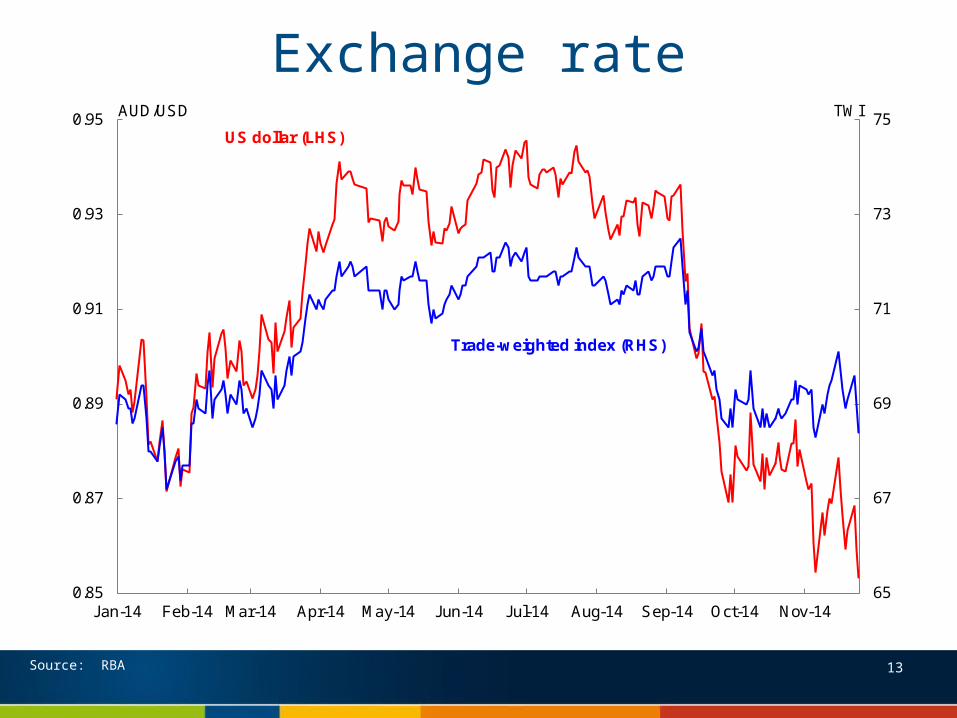
Exchange rate
Source: RBA 13
65
67
69
71
73
75
0.85
0.87
0.89
0.91
0.93
0.95
Jan-14 Feb-14 Mar-14 Apr-14 May-14 Jun-14 Jul-14 Aug-14 Sep-14 Oct-14 Nov-14
TWIAUD/USD
US dollar (LHS)
Trade-weighted index (RHS)
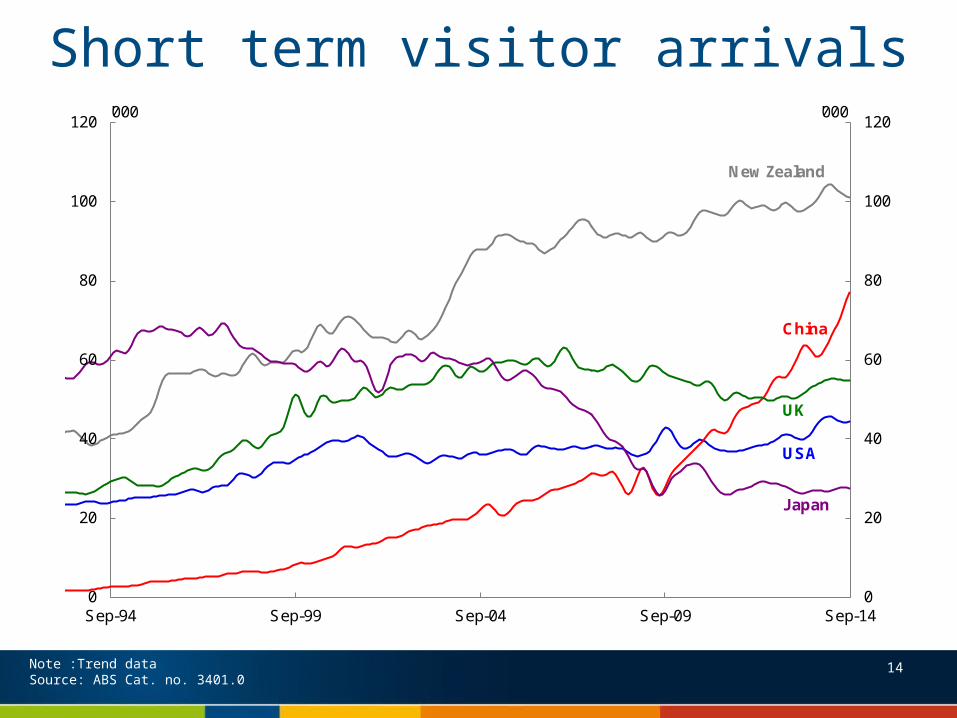
Short term visitor arrivals
Note :Trend dataSource: ABS Cat. no. 3401.0
14
0
20
40
60
80
100
120
0
20
40
60
80
100
120
Sep-94 Sep-99 Sep-04 Sep-09 Sep-14
'000'000
China
New Zealand
UK
Japan
USA
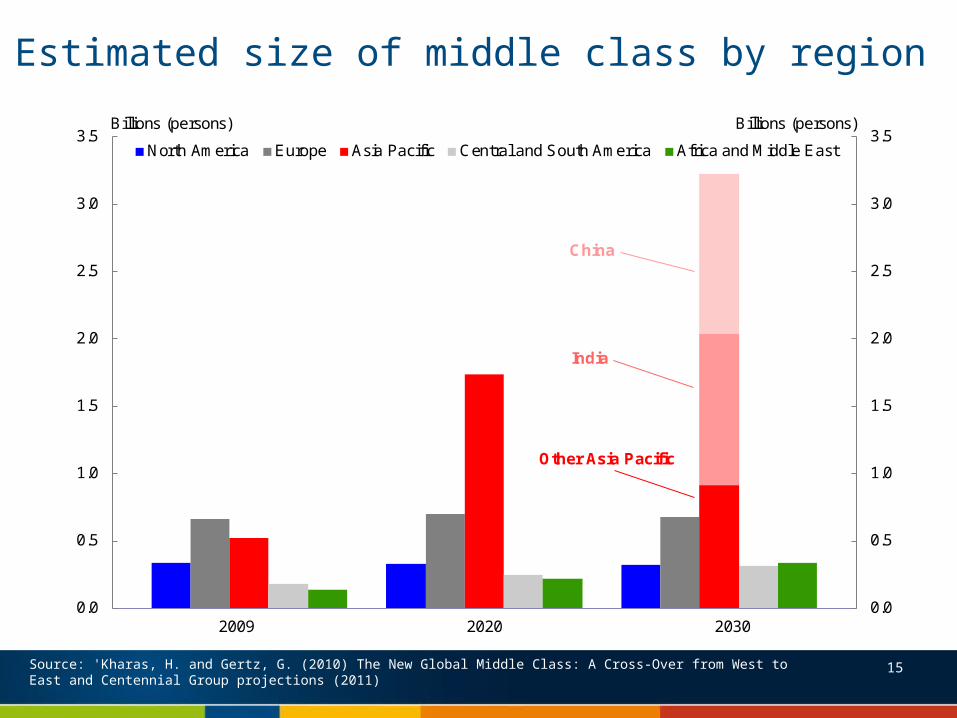
Estimated size of middle class by region
Source: 'Kharas, H. and Gertz, G. (2010) The New Global Middle Class: A Cross-Over from West to East and Centennial Group projections (2011)
2009 2020 20300.0
0.5
1.0
1.5
2.0
2.5
3.0
3.5
0.0
0.5
1.0
1.5
2.0
2.5
3.0
3.5Billions (persons)Billions (persons)
North America Europe Asia Pacific Central and South America Africa and Middle East
India
China
Other Asia Pacific
15

Other slides
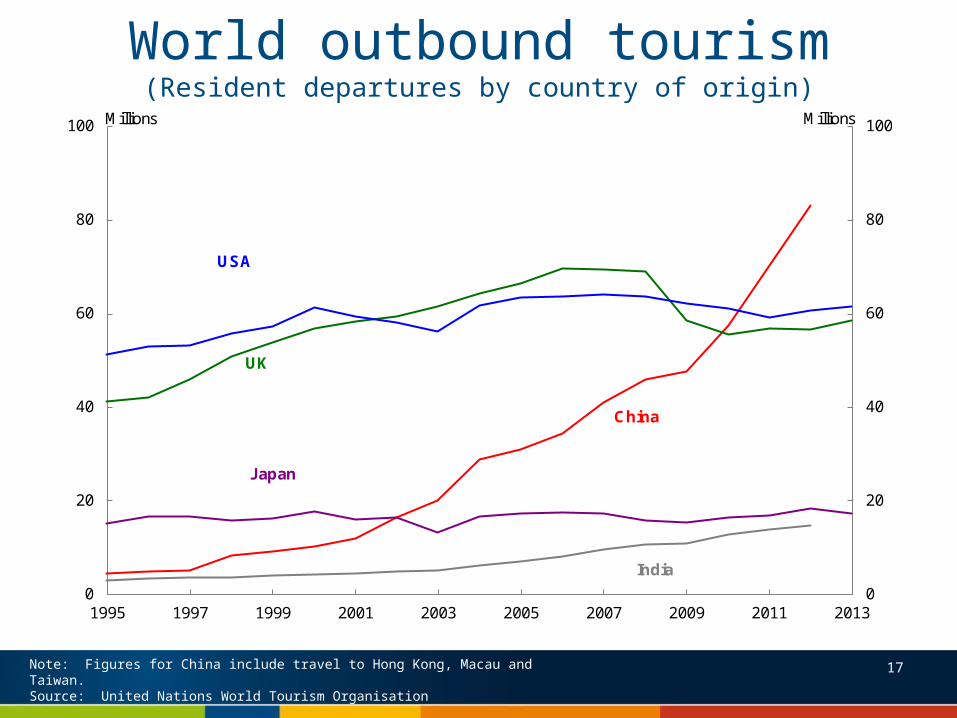
World outbound tourism(Resident departures by country of origin)
Note: Figures for China include travel to Hong Kong, Macau and Taiwan.Source: United Nations World Tourism Organisation
0
20
40
60
80
100
0
20
40
60
80
100
1995 1997 1999 2001 2003 2005 2007 2009 2011 2013
China
UK
USA
India
Japan
Millions Millions
17
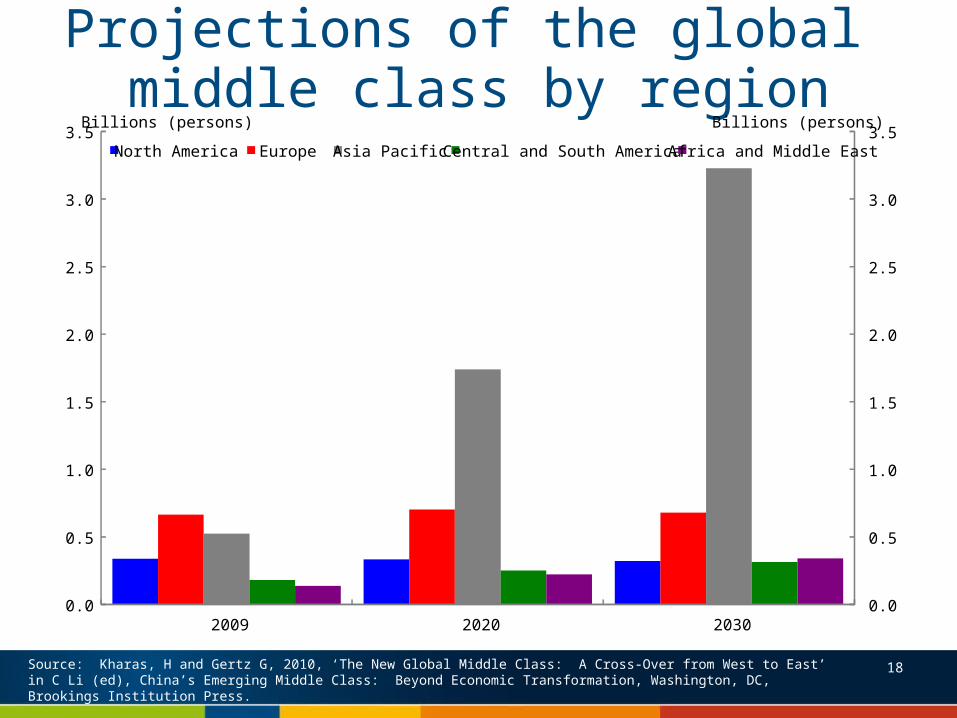
Projections of the global middle class by region
Source: Kharas, H and Gertz G, 2010, ‘The New Global Middle Class: A Cross-Over from West to East’ in C Li (ed), China’s Emerging Middle Class: Beyond Economic Transformation, Washington, DC, Brookings Institution Press.
0.0
0.5
1.0
1.5
2.0
2.5
3.0
3.5
0.0
0.5
1.0
1.5
2.0
2.5
3.0
3.5
2009 2020 2030
North America Europe Asia Pacific Central and South America Africa and Middle East
Billions (persons) Billions (persons)
18
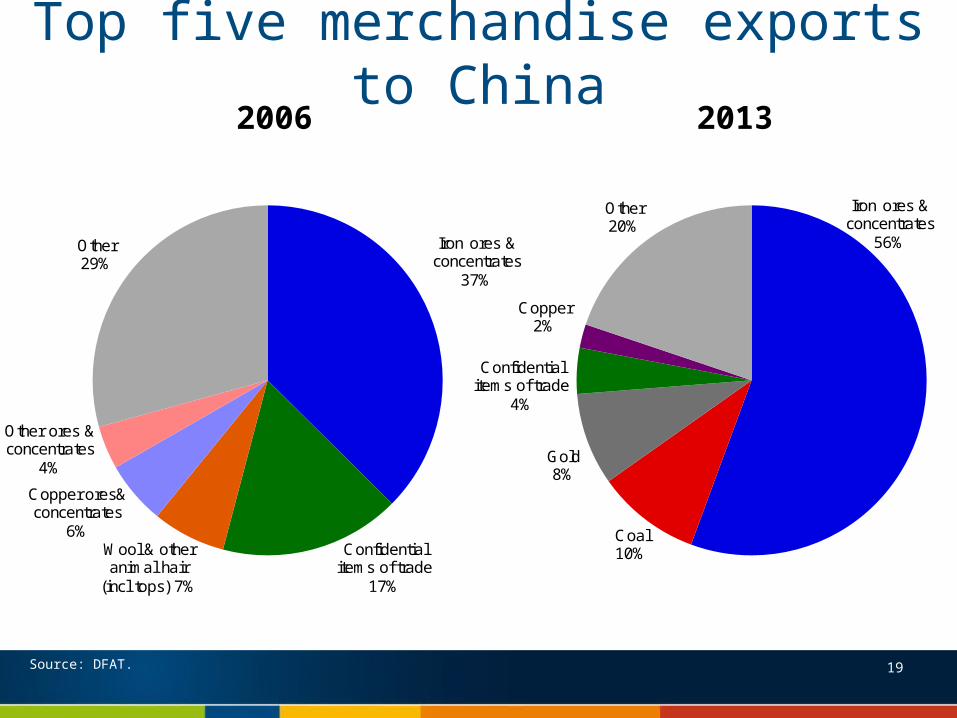
Top five merchandise exports to China2006 2013
Source: DFAT. 19
Iron ores & concentrates
37%
Confidential items of trade
17%
Wool & other animal hair
(incl tops) 7%
Copper ores& concentrates
6%
Other ores & concentrates
4%
Other29%
Iron ores & concentrates
56%
Coal10%
Gold8%
Confidential items of trade
4%
Copper2%
Other20%
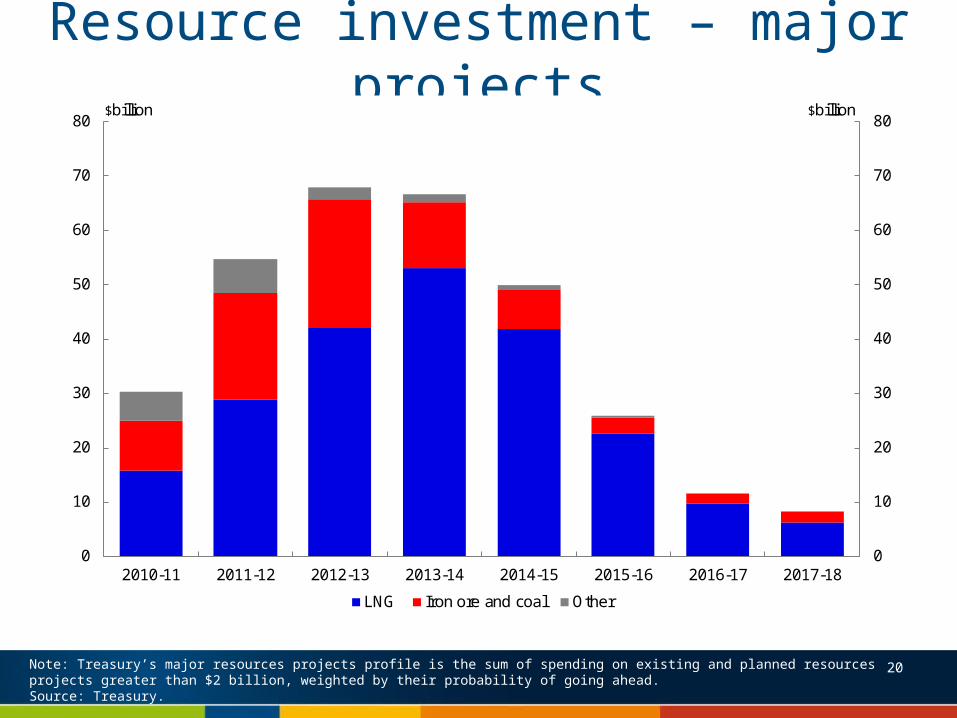
Resource investment – major projects
Note: Treasury’s major resources projects profile is the sum of spending on existing and planned resources projects greater than $2 billion, weighted by their probability of going ahead.Source: Treasury.
0
10
20
30
40
50
60
70
80
0
10
20
30
40
50
60
70
80
2010-11 2011-12 2012-13 2013-14 2014-15 2015-16 2016-17 2017-18
LNG Iron ore and coal Other
$billion $billion
20
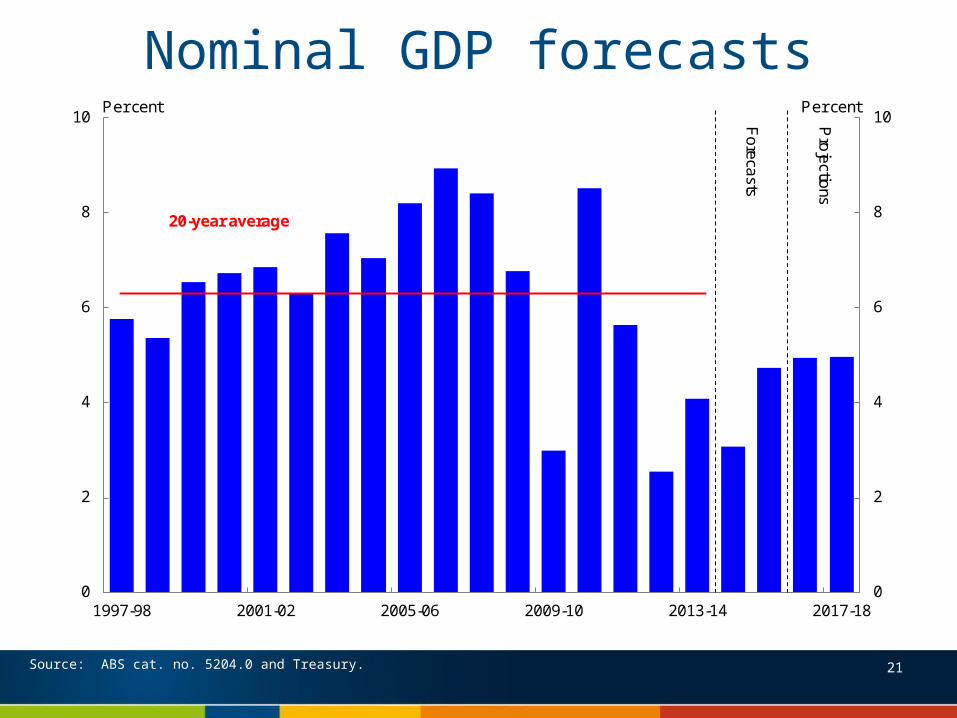
Nominal GDP forecasts
Source: ABS cat. no. 5204.0 and Treasury.
0
2
4
6
8
10
0
2
4
6
8
10
1997-98 2001-02 2005-06 2009-10 2013-14 2017-18
Per cent
Fo
reca
sts
Pro
jectio
ns
20-year average
Per cent
21
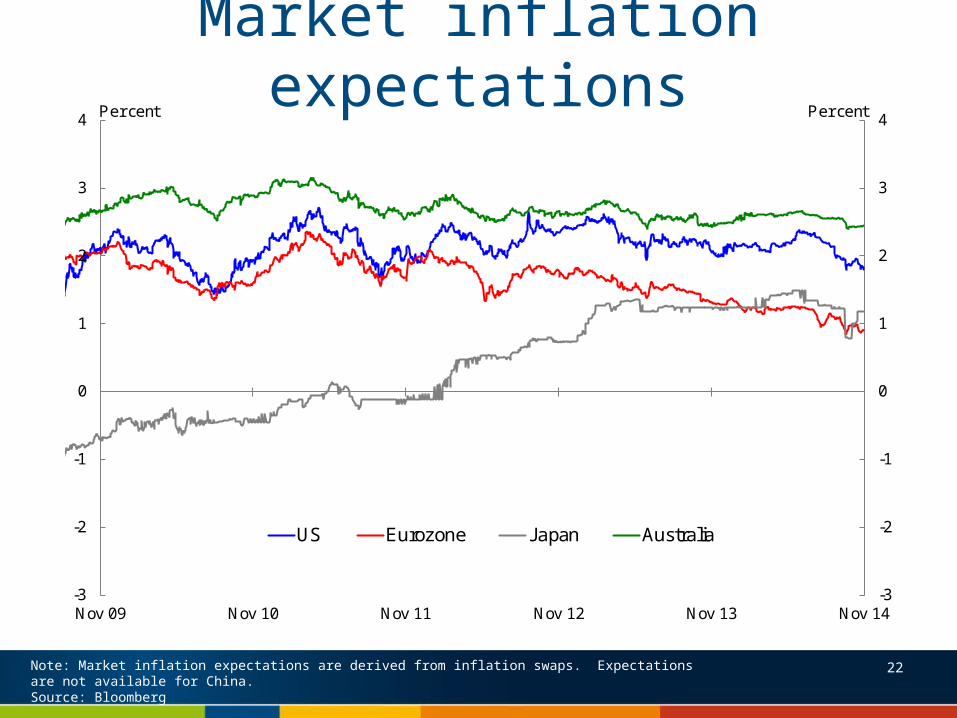
Market inflation expectations
22Note: Market inflation expectations are derived from inflation swaps. Expectations are not available for China.Source: Bloomberg
-3
-2
-1
0
1
2
3
4
-3
-2
-1
0
1
2
3
4
Nov 09 Nov 10 Nov 11 Nov 12 Nov 13 Nov 14
Per centPer cent
US Eurozone Japan Australia
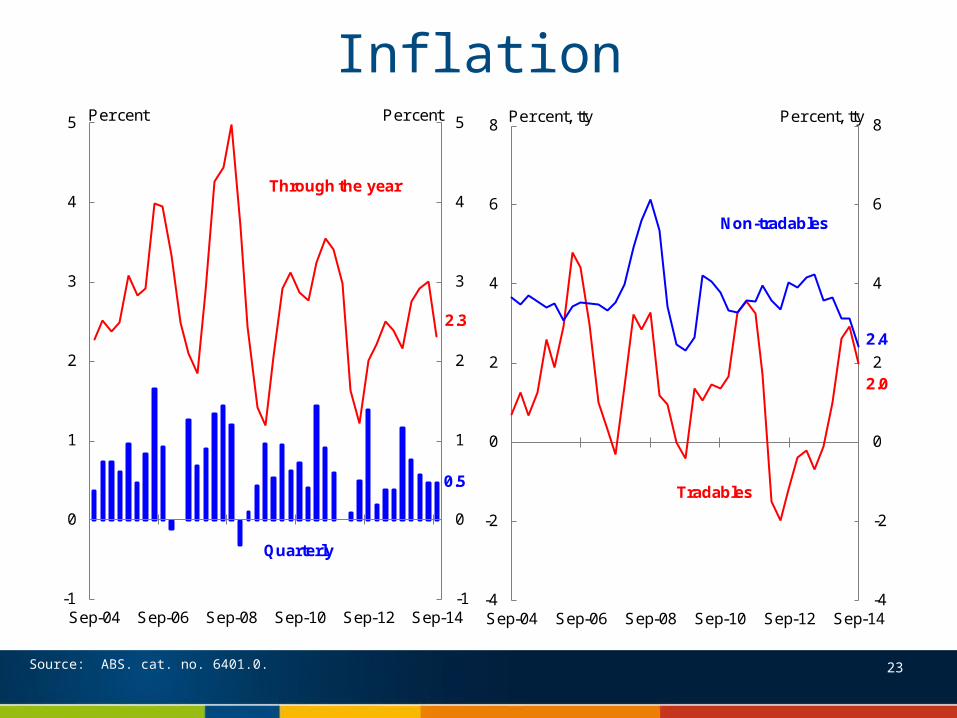
Inflation
Source: ABS. cat. no. 6401.0.
0.5
2.3
-1
0
1
2
3
4
5
-1
0
1
2
3
4
5
Sep-04 Sep-06 Sep-08 Sep-10 Sep-12 Sep-14
Quarterly
Through the year
Per cent Per cent
2.0
2.4
-4
-2
0
2
4
6
8
-4
-2
0
2
4
6
8
Sep-04 Sep-06 Sep-08 Sep-10 Sep-12 Sep-14
Non-tradables
Tradables
Per cent, tty Per cent, tty
23
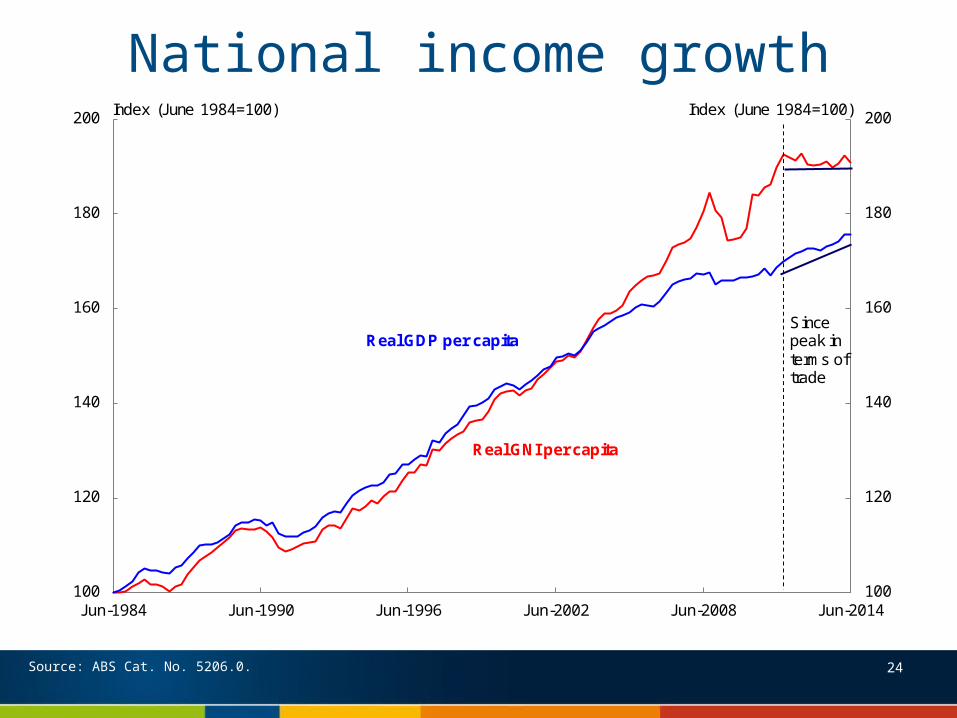
National income growth
100
120
140
160
180
200
100
120
140
160
180
200
Jun-1984 Jun-1990 Jun-1996 Jun-2002 Jun-2008 Jun-2014
Real GDP per capita
Real GNI per capita
Index (June 1984=100) Index (June 1984=100)
Sincepeak in terms of trade
24Source: ABS Cat. No. 5206.0.
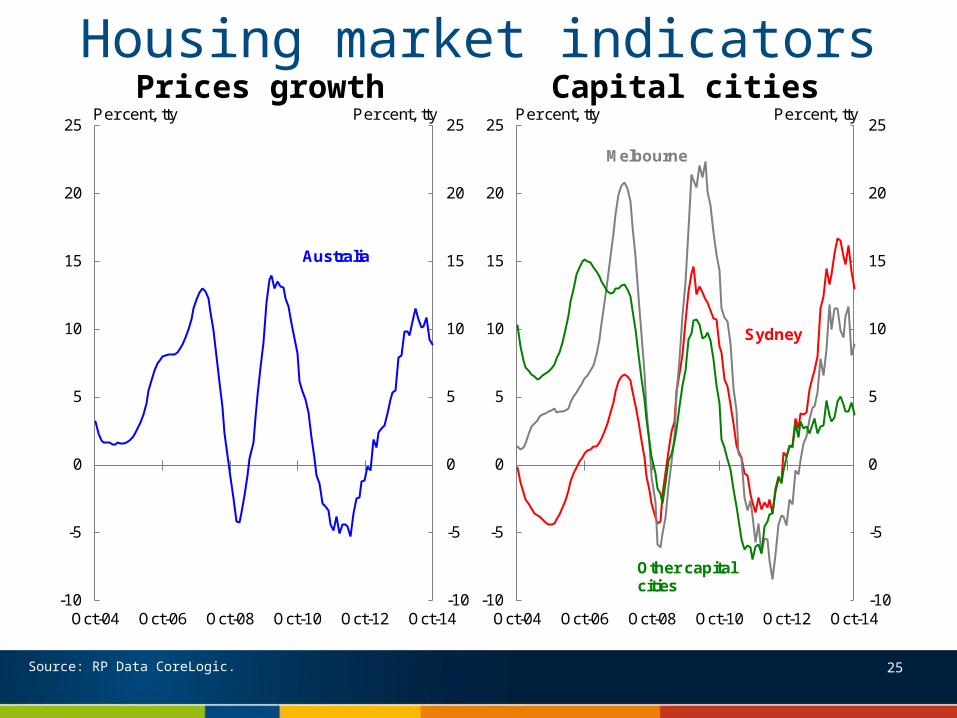
Housing market indicators
Source: RP Data CoreLogic.
-10
-5
0
5
10
15
20
25
-10
-5
0
5
10
15
20
25
Oct-04 Oct-06 Oct-08 Oct-10 Oct-12 Oct-14
Melbourne
Sydney
Other capital cities
Per cent, tty Per cent, tty
-10
-5
0
5
10
15
20
25
-10
-5
0
5
10
15
20
25
Oct-04 Oct-06 Oct-08 Oct-10 Oct-12 Oct-14
Australia
Per cent, tty Per cent, ttyPrices growth Capital cities
25
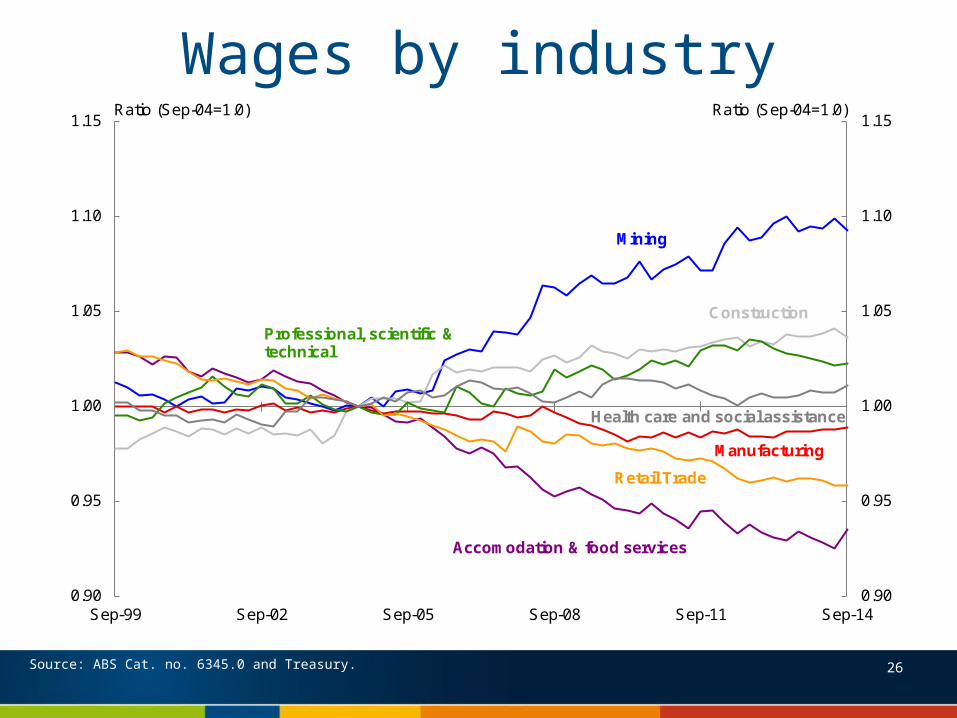
Wages by industry
0.90
0.95
1.00
1.05
1.10
1.15
0.90
0.95
1.00
1.05
1.10
1.15
Sep-99 Sep-02 Sep-05 Sep-08 Sep-11 Sep-14
Mining
ConstructionProfessional, scientific & technical
Health care and social assistance
Manufacturing
Retail Trade
Accomodation & food services
Ratio (Sep-04=1.0) Ratio (Sep-04=1.0)
Source: ABS Cat. no. 6345.0 and Treasury. 26
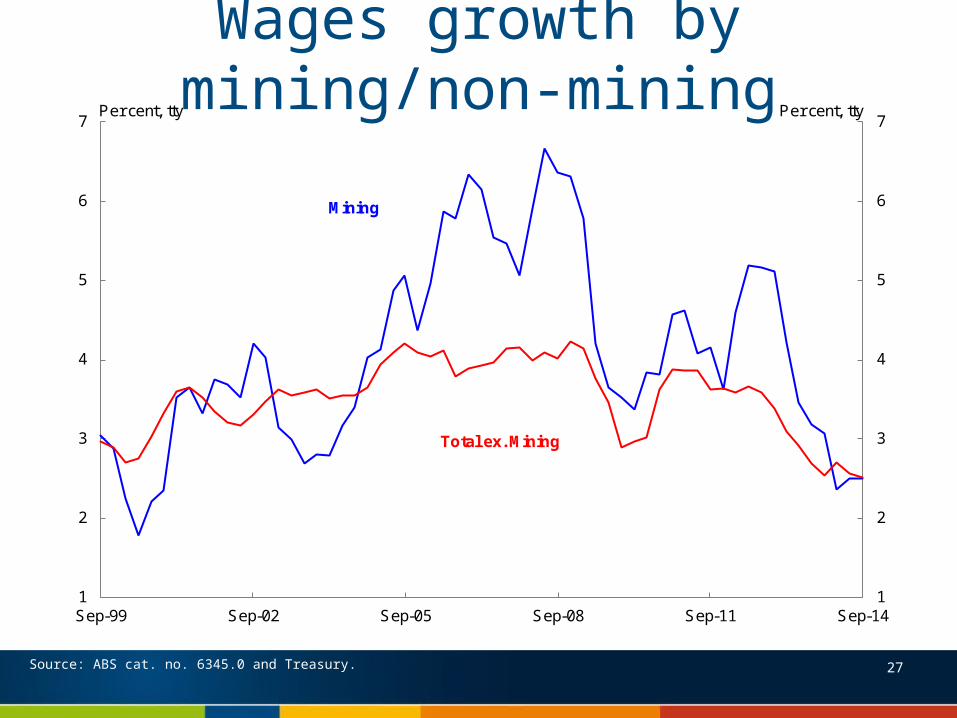
1
2
3
4
5
6
7
1
2
3
4
5
6
7
Sep-99 Sep-02 Sep-05 Sep-08 Sep-11 Sep-14
Per cent, ttyPer cent, tty
Mining
Total ex. Mining
Source: ABS cat. no. 6345.0 and Treasury.
Wages growth by mining/non-mining
27