Embed Size (px)
Citation preview

Australian Communications and Media Authority
Entity Additional Estimates
Statements
41

AUSTRALIAN COMMUNICATIONS AND MEDIA AUTHORITY
Section 1: Entity Overview and Resources .............................................................. 45 1.1 Strategic Direction Statement ........................................................................................ 45
1.2 Entity Resource Statement ............................................................................................. 46
1.3 Entity Measures Table .................................................................................................... 48
1.4 Additional Estimates and Variations............................................................................ 49
1.5 Breakdown of additional estimates by appropriation bill ......................................... 51 Section 2: Revisions to Entity Resources and Planned Performance .................. 53 2.1 Resources and Performance Information..................................................................... 53 Section 3: Explanatory Tables and Budgeted Financial Statements ..................... 59 3.1 Explanatory Tables .......................................................................................................... 59
3.2 Budgeted Financial Statements ..................................................................................... 60
43


ACMA Additional Estimates Statements
AUSTRALIAN COMMUNICATIONS AND MEDIA AUTHORITY
Section 1: Entity Overview and Resources
1.1 STRATEGIC DIRECTION STATEMENT
The Australian Communications and Media Authority’s (the ACMA) mandate is to deliver a communications and media environment that balances the needs of industry and the Australian community through regulation, education and advice. Our purpose is to ensure communications and media work is in Australia’s public interest and we achieve this with a judicious blend of communication, facilitation and ultimately regulation.
The ACMA is responsible for the regulation of broadcasting, radiocommunications, telecommunications and online content in accordance with: the Australian Communications and Media Authority Act 2005 the Broadcasting Services Act 1992 the Radiocommunications Act 1992 the Telecommunications Act 1997 other related legislation, including the:
– Do Not Call Register Act 2006 – Spam Act 2003 – Interactive Gambling Act 2001 – Telecommunications (Consumer Protection and Service Standards) Act 1999 – Telecommunications (Industry Levy) Act 2012 – Telecommunications Universal Service Management Agency Act 2012.
The ACMA has an extensive research and reporting programme aimed at understanding and identifying the current and potential uses of communications and media services and technologies. This programme provides an evidence base about changes in the communications and media markets to support regulatory development, decision-making and policy advice. The ACMA supports and encourages a dynamic communications sector. The agency works closely with stakeholders in the context of the legislated regulatory framework to safeguard the public interest, address the broad concerns of the community and meet the needs of industry. Where regulatory action is necessary, our response is proportionate to the seriousness of the breach, taking account of relevant factors.
45
ACMA Additional Estimates Statements
The ACMA has its sights set firmly on achieving public interest outcomes – in words and actions as it pursues the goal of being, and being recognised as, the world’s best converged communications regulator.
1.2 ENTITY RESOURCE STATEMENT
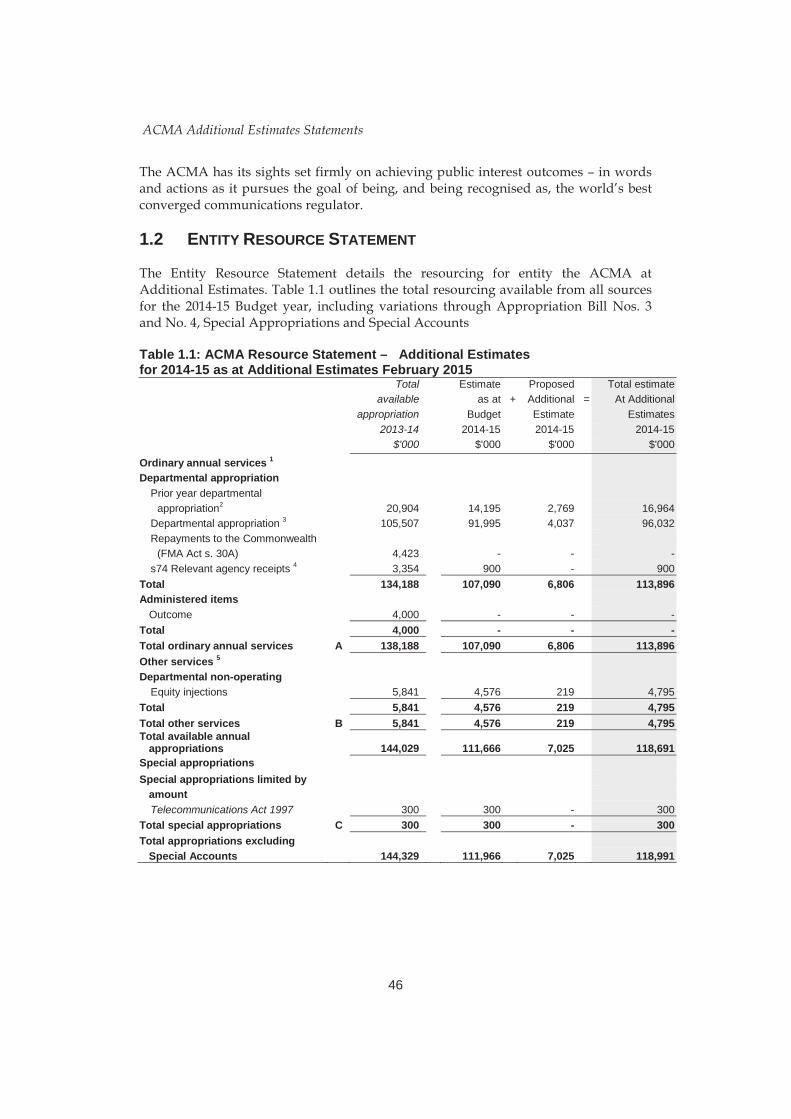
The Entity Resource Statement details the resourcing for entity the ACMA at Additional Estimates. Table 1.1 outlines the total resourcing available from all sources for the 2014-15 Budget year, including variations through Appropriation Bill Nos. 3 and No. 4, Special Appropriations and Special Accounts
Table 1.1: ACMA Resource Statement – Additional Estimates for 2014-15 as at Additional Estimates February 2015 Total Estimate Proposed Total estimate available as at + Additional = At Additional appropriation Budget Estimate Estimates 2013-14 2014-15 2014-15 2014-15 $'000 $'000 $'000 $'000
Ordinary annual services 1 Departmental appropriation
Prior year departmental appropriation2 20,904 14,195 2,769 16,964 Departmental appropriation 3 105,507 91,995 4,037 96,032 Repayments to the Commonwealth (FMA Act s. 30A) 4,423 - - - s74 Relevant agency receipts 4 3,354 900 - 900 Total 134,188 107,090 6,806 113,896 Administered items
Outcome 4,000 - - - Total 4,000 - - - Total ordinary annual services A 138,188 107,090 6,806 113,896 Other services 5 Departmental non-operating Equity injections 5,841 4,576 219 4,795 Total 5,841 4,576 219 4,795 Total other services B 5,841 4,576 219 4,795 Total available annual appropriations 144,029
111,666 7,025 118,691
Special appropriations Special appropriations limited by amount
Telecommunications Act 1997 300 300 - 300 Total special appropriations C 300 300 - 300 Total appropriations excluding Special Accounts 144,329 111,966 7,025 118,991
46
ACMA Additional Estimates Statements
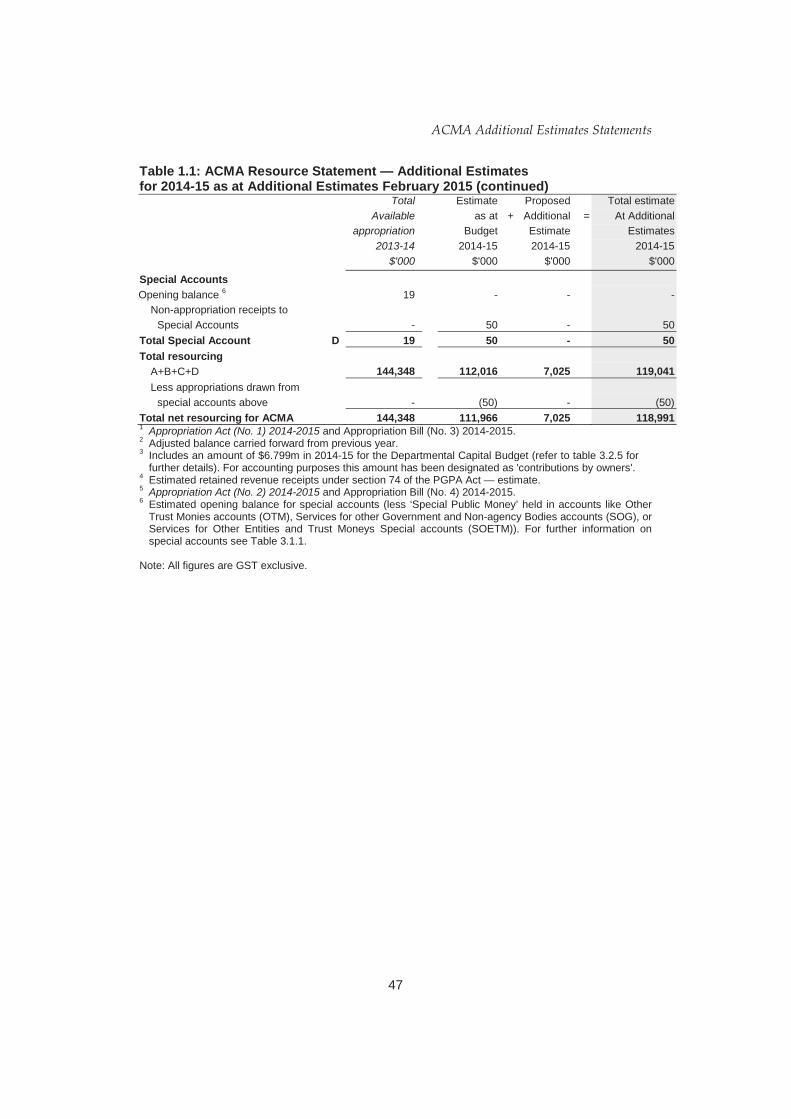
Table 1.1: ACMA Resource Statement — Additional Estimates for 2014-15 as at Additional Estimates February 2015 (continued) Total Estimate Proposed Total estimate Available as at + Additional = At Additional appropriation Budget Estimate Estimates 2013-14 2014-15 2014-15 2014-15 $'000 $'000 $'000 $'000
Special Accounts
Opening balance 6 19 - - - Non-appropriation receipts to Special Accounts - 50 - 50 Total Special Account D 19 50 - 50 Total resourcing
A+B+C+D 144,348 112,016 7,025 119,041 Less appropriations drawn from special accounts above - (50) - (50) Total net resourcing for ACMA 144,348 111,966 7,025 118,991 1 Appropriation Act (No. 1) 2014-2015 and Appropriation Bill (No. 3) 2014-2015. 2 Adjusted balance carried forward from previous year. 3 Includes an amount of $6.799m in 2014-15 for the Departmental Capital Budget (refer to table 3.2.5 for
further details). For accounting purposes this amount has been designated as 'contributions by owners'. 4 Estimated retained revenue receipts under section 74 of the PGPA Act — estimate. 5 Appropriation Act (No. 2) 2014-2015 and Appropriation Bill (No. 4) 2014-2015. 6 Estimated opening balance for special accounts (less ‘Special Public Money’ held in accounts like Other
Trust Monies accounts (OTM), Services for other Government and Non-agency Bodies accounts (SOG), or Services for Other Entities and Trust Moneys Special accounts (SOETM)). For further information on special accounts see Table 3.1.1.
Note: All figures are GST exclusive.
47

ACMA Additional Estimates Statements
1.3 ENTITY MEASURES TABLE
Table 1.2 summarises new Government measures taken since the 2014-15 Budget. The table is split into expense and capital measures, with the affected program identified.
Table 1.2: ACMA 2014-15 Measures since Budget Programme 2014-15 2015-16 2016-17 2017-18 $'000 $'000 $'000 $'000
Revenue measures Administered Programme Indexation
Pause Administered revenue 1.2 (48) (90) (139) (142)
Total (48) (90) (139) (142) Total revenue measures
Administered (48) (90) (139) (142) Total (48) (90) (139) (142)
Expense measures Communications and Public Affairs
Functions – targeted savings All Departmental expense (61) (121) (121) (122)
Total (61) (121) (121) (122) Enhancing Online Safety for Children –
Support 1.2 Departmental expense 1,602 2,185 2,181 2,200
Total 1,602 2,185 2,181 2,200 Funding for pre-existing measures
affecting the public sector All Departmental expense 1,982 - - -
Total 1,982 - - - Smaller Government –
Communications Portfolio 1.1 Departmental expense - - - -
Total - - - - Telecommunications services –
whole-of government coordinated procurement All Departmental expense (145) (145) - -
Total (145) (145) - - Total expense measures
Departmental 3,378 1,919 2,060 2,078 Total 3,378 1,919 2,060 2,078 Prepared on a Government Finance Statistics (fiscal) basis.
48
ACMA Additional Estimates Statements
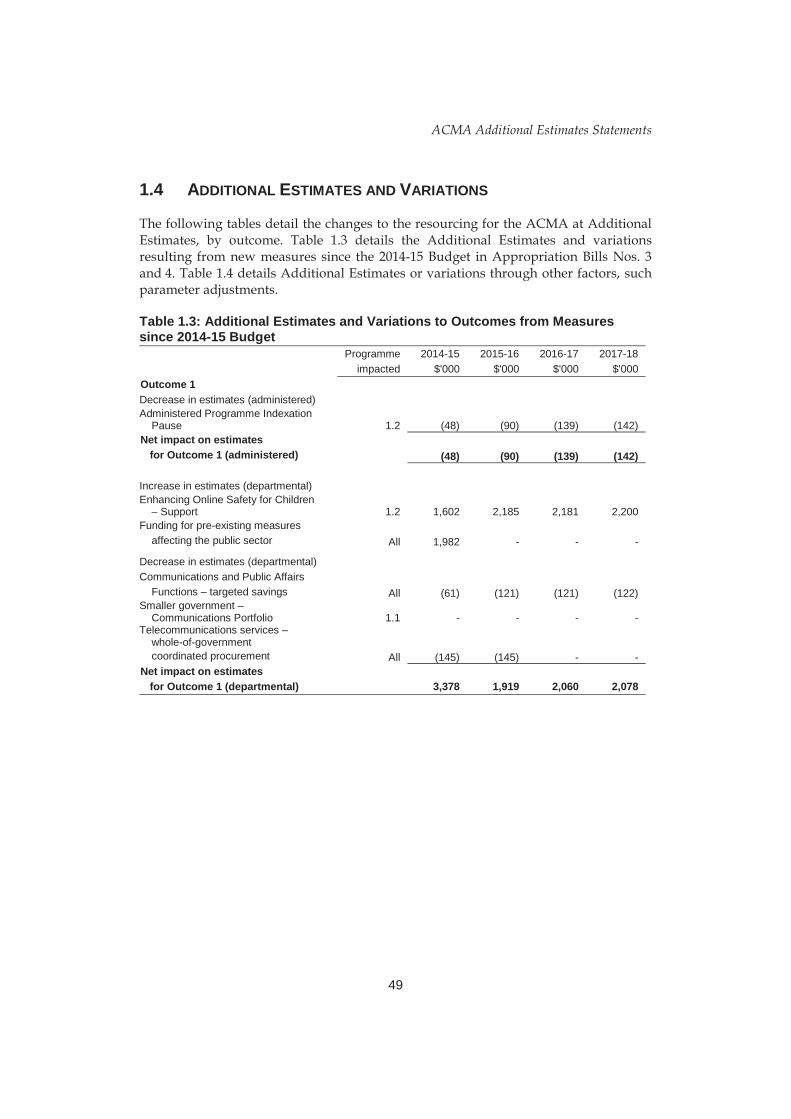
1.4 ADDITIONAL ESTIMATES AND VARIATIONS
The following tables detail the changes to the resourcing for the ACMA at Additional Estimates, by outcome. Table 1.3 details the Additional Estimates and variations resulting from new measures since the 2014-15 Budget in Appropriation Bills Nos. 3 and 4. Table 1.4 details Additional Estimates or variations through other factors, such parameter adjustments.
Table 1.3: Additional Estimates and Variations to Outcomes from Measures since 2014-15 Budget
Programme 2014-15 2015-16 2016-17 2017-18 impacted $'000 $'000 $'000 $'000
Outcome 1 Decrease in estimates (administered) Administered Programme Indexation Pause 1.2 (48) (90) (139) (142) Net impact on estimates for Outcome 1 (administered) (48) (90) (139) (142)
Increase in estimates (departmental) Enhancing Online Safety for Children – Support 1.2 1,602 2,185 2,181 2,200 Funding for pre-existing measures affecting the public sector All 1,982 - - -
Decrease in estimates (departmental) Communications and Public Affairs Functions – targeted savings All (61) (121) (121) (122) Smaller government – Communications Portfolio 1.1 - - - - Telecommunications services – whole-of-government coordinated procurement All (145) (145) - - Net impact on estimates for Outcome 1 (departmental) 3,378 1,919 2,060 2,078
49
ACMA Additional Estimates Statements
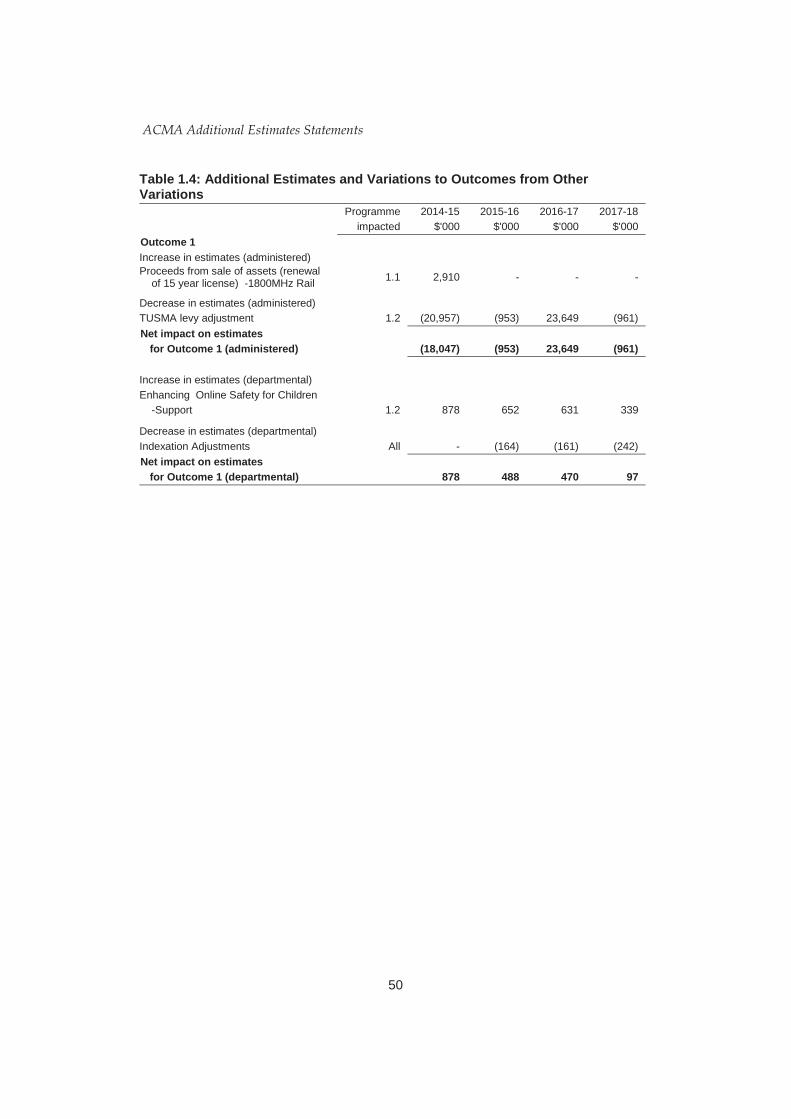
Table 1.4: Additional Estimates and Variations to Outcomes from Other Variations
Programme 2014-15 2015-16 2016-17 2017-18 impacted $'000 $'000 $'000 $'000
Outcome 1 Increase in estimates (administered) Proceeds from sale of assets (renewal of 15 year license) -1800MHz Rail 1.1 2,910 - - -
Decrease in estimates (administered) TUSMA levy adjustment 1.2 (20,957) (953) 23,649 (961) Net impact on estimates for Outcome 1 (administered) (18,047) (953) 23,649 (961)
Increase in estimates (departmental) Enhancing Online Safety for Children -Support 1.2 878 652 631 339
Decrease in estimates (departmental) Indexation Adjustments All - (164) (161) (242) Net impact on estimates for Outcome 1 (departmental) 878 488 470 97
50
ACMA Additional Estimates Statements
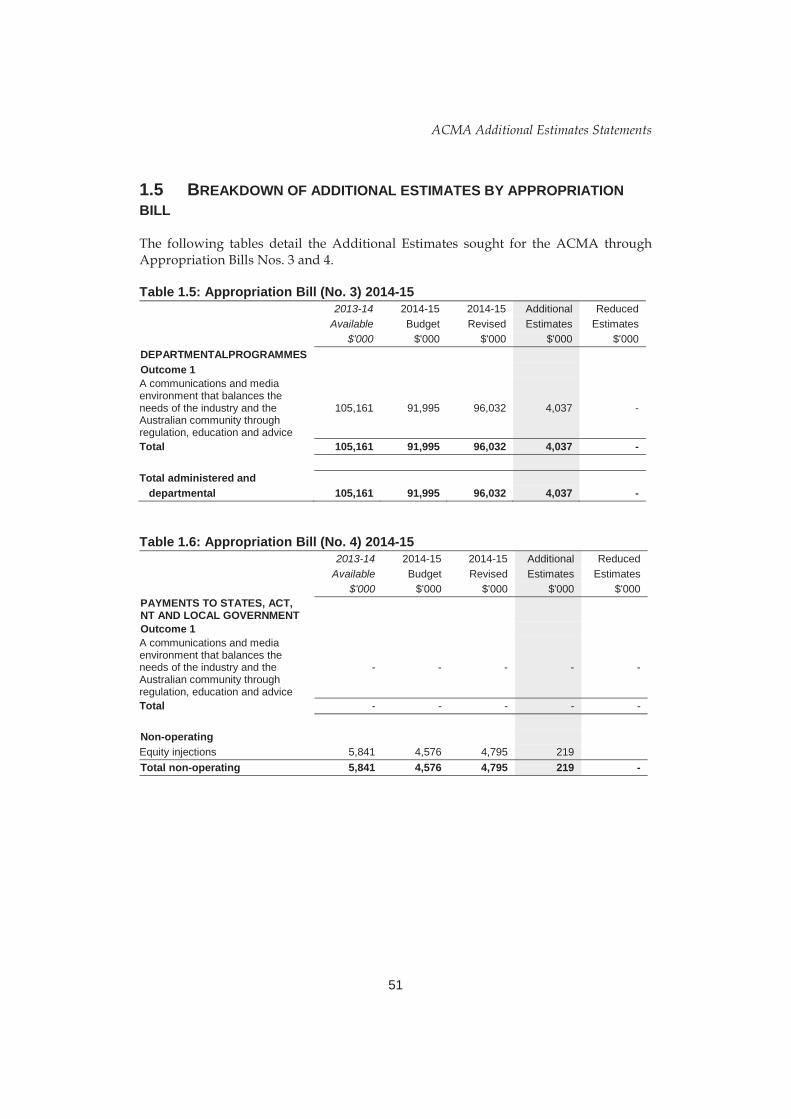
1.5 BREAKDOWN OF ADDITIONAL ESTIMATES BY APPROPRIATION BILL
The following tables detail the Additional Estimates sought for the ACMA through Appropriation Bills Nos. 3 and 4.
Table 1.5: Appropriation Bill (No. 3) 2014-15 2013-14 2014-15 2014-15 Additional Reduced
Available Budget Revised Estimates Estimates $'000 $'000 $'000 $'000 $'000
DEPARTMENTALPROGRAMMES Outcome 1 A communications and media environment that balances the needs of the industry and the Australian community through regulation, education and advice
105,161 91,995 96,032 4,037 -
Total 105,161 91,995 96,032 4,037 -
Total administered and departmental 105,161 91,995 96,032 4,037 -
Table 1.6: Appropriation Bill (No. 4) 2014-15 2013-14 2014-15 2014-15 Additional Reduced
Available Budget Revised Estimates Estimates $'000 $'000 $'000 $'000 $'000
PAYMENTS TO STATES, ACT, NT AND LOCAL GOVERNMENT
Outcome 1 A communications and media environment that balances the needs of the industry and the Australian community through regulation, education and advice
- - - - -
Total - - - - -
Non-operating Equity injections 5,841 4,576 4,795 219 Total non-operating 5,841 4,576 4,795 219 -
51


ACMA Additional Estimates Statements
Section 2: Revisions to Entity Resources and Planned Performance
2.1 RESOURCES AND PERFORMANCE INFORMATION
There have been no revisions to ACMA’s outcomes and programmes structure, strategy or performance information as a result of Additional Estimates.
Outcome 1: A communications and media environment that balances the needs of the industry and the Australian community through regulation, education and advice
Outcome 1 Strategy
There have been no changes since the 2014-15 Budget Estimates.
53
ACMA Additional Estimates Statements
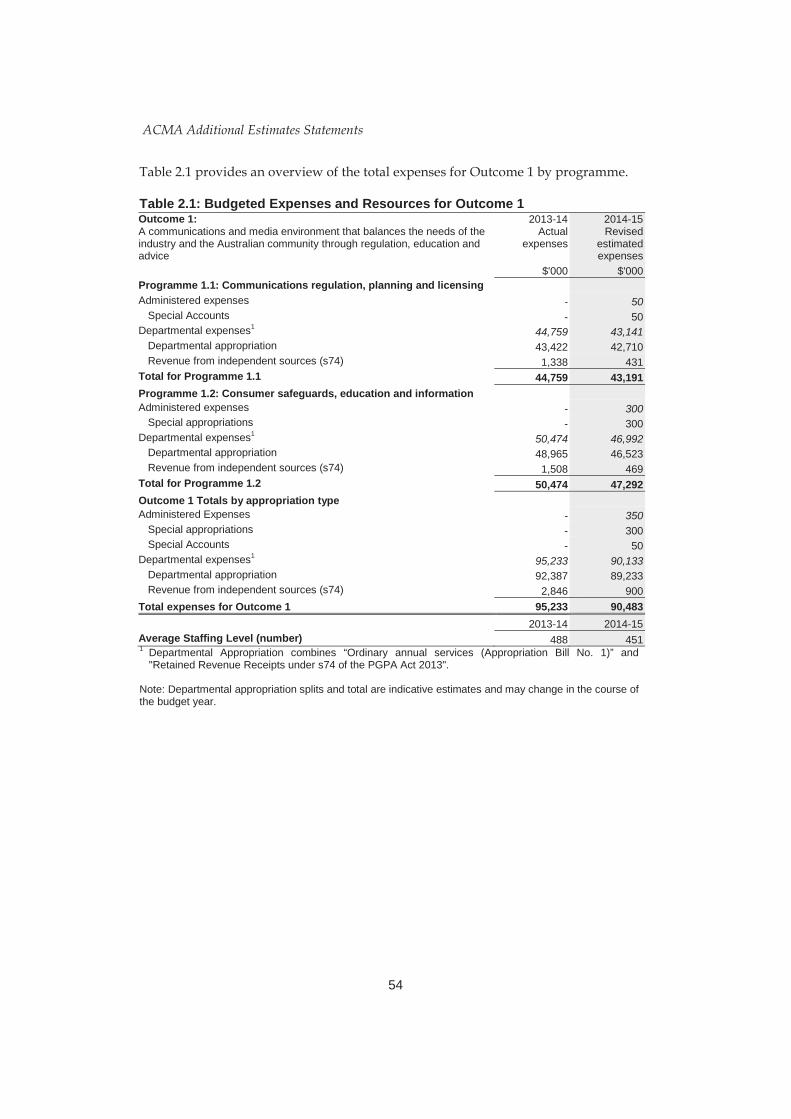
Table 2.1 provides an overview of the total expenses for Outcome 1 by programme.
Table 2.1: Budgeted Expenses and Resources for Outcome 1 Outcome 1: A communications and media environment that balances the needs of the industry and the Australian community through regulation, education and advice
2013-14 Actual
expenses
2014-15 Revised
estimated expenses
$'000 $'000 Programme 1.1: Communications regulation, planning and licensing Administered expenses - 50 Special Accounts - 50 Departmental expenses1 44,759 43,141 Departmental appropriation 43,422 42,710 Revenue from independent sources (s74) 1,338 431 Total for Programme 1.1 44,759 43,191 Programme 1.2: Consumer safeguards, education and information Administered expenses - 300 Special appropriations - 300 Departmental expenses1 50,474 46,992 Departmental appropriation 48,965 46,523 Revenue from independent sources (s74) 1,508 469 Total for Programme 1.2 50,474 47,292 Outcome 1 Totals by appropriation type Administered Expenses - 350 Special appropriations - 300 Special Accounts - 50 Departmental expenses1 95,233 90,133 Departmental appropriation 92,387 89,233 Revenue from independent sources (s74) 2,846 900 Total expenses for Outcome 1 95,233 90,483
2013-14 2014-15 Average Staffing Level (number) 488 451 1 Departmental Appropriation combines “Ordinary annual services (Appropriation Bill No. 1)” and
"Retained Revenue Receipts under s74 of the PGPA Act 2013". Note: Departmental appropriation splits and total are indicative estimates and may change in the course of the budget year.
54

ACMA Additional Estimates Statements
Contributions to Outcome 1
Programme 1.1: Communications regulation, planning and licensing
Programme objective That the allocation and use of public resources maximises their value to the Australian community; and that national safety and security interests are appropriately supported in the planning and delivery of communication infrastructure and services.
2013-14
Actual
$'000
2014-15 Revised budget
$'000
2015-16 Forward
year 1 $'000
2016-17 Forward
year 2 $'000
2017-18 Forward
year 3 $'000
Special Account Expenses: Other Trust Monies - 50 50 50 50 Annual departmental expenses: Programme expenses 33,121 31,061 29,108 28,463 28,608
Programme support 11,638 12,080 11,320 11,069 11,126
Total programme expenses 44,759 43,191 40,478 39,582 39,784
Programme 1.1 Deliverables There has been no change to the programme deliverables.
2013-14
Actual
2014-15 Revised budget
2015-16 Forward
year 1
2016-17 Forward
year 2
2017-18 Forward
year 3 Deliverables $'000 $'000 $'000 $'000 $'000 Communications regulation, planning and licensing 44,759 43,191 40,478 39,582 39,784
Programme 1.1 Key Performance Indicators There has been no change to key performance indicators.
2013-14
Actual
2014-15 Revised budget
2015-16 Forward
year 1
2016-17 Forward
year 2
2017-18 Forward
year 3 Key performance indicators $'000 $'000 $'000 $'000 $'000 Communications regulation, planning and licensing 44,759 43,191 40,478 39,582 39,784
55
ACMA Additional Estimates Statements
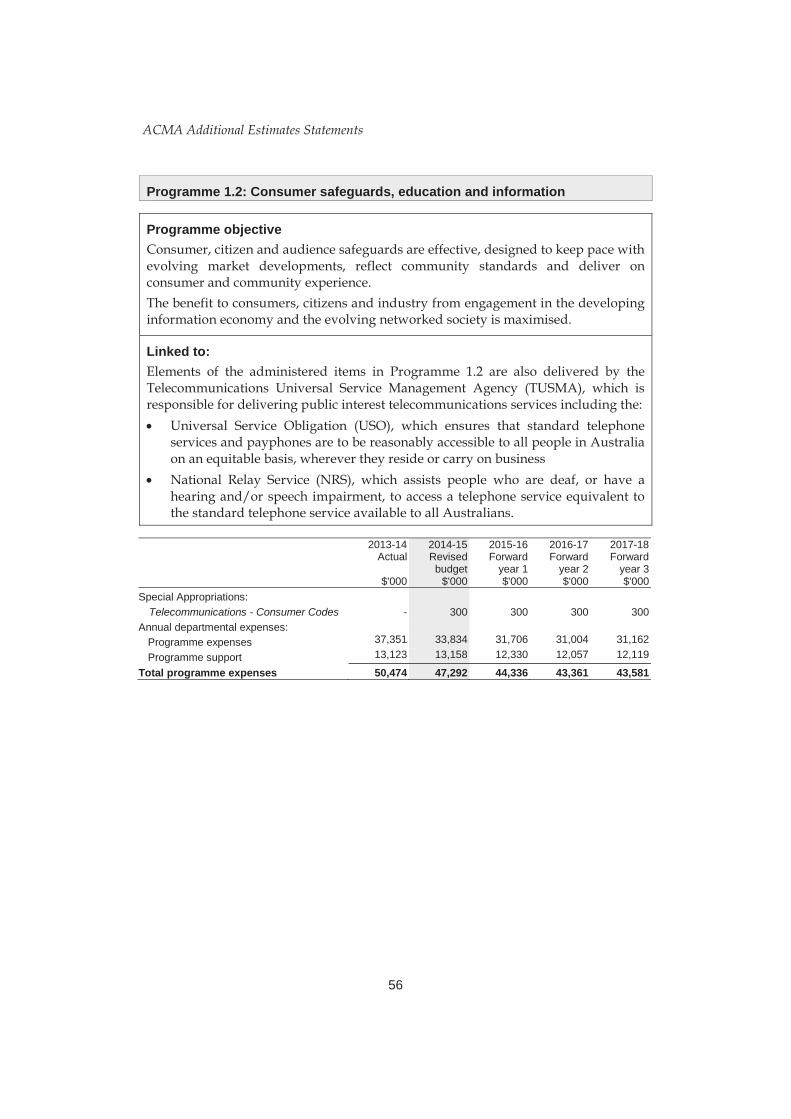
Programme 1.2: Consumer safeguards, education and information
Programme objective Consumer, citizen and audience safeguards are effective, designed to keep pace with evolving market developments, reflect community standards and deliver on consumer and community experience. The benefit to consumers, citizens and industry from engagement in the developing information economy and the evolving networked society is maximised.
Linked to: Elements of the administered items in Programme 1.2 are also delivered by the Telecommunications Universal Service Management Agency (TUSMA), which is responsible for delivering public interest telecommunications services including the: Universal Service Obligation (USO), which ensures that standard telephone
services and payphones are to be reasonably accessible to all people in Australia on an equitable basis, wherever they reside or carry on business
National Relay Service (NRS), which assists people who are deaf, or have a hearing and/or speech impairment, to access a telephone service equivalent to the standard telephone service available to all Australians.
2013-14
Actual
$'000
2014-15 Revised budget
$'000
2015-16 Forward
year 1 $'000
2016-17 Forward
year 2 $'000
2017-18 Forward
year 3 $'000
Special Appropriations: Telecommunications - Consumer Codes - 300 300 300 300
Annual departmental expenses: Programme expenses 37,351 33,834 31,706 31,004 31,162
Programme support 13,123 13,158 12,330 12,057 12,119
Total programme expenses 50,474 47,292 44,336 43,361 43,581
56

ACMA Additional Estimates Statements
Programme 1.2 Deliverables There has been no change to the programme deliverables.
Deliverables
2013-14 Actual
$'000
2014-15 Revised budget
$'000
2015-16 Forward
year 1 $'000
2016-17 Forward
year 2 $'000
2017-18 Forward
year 3 $'000
Consumer safeguards, education and information 50,474 47,292 44,336 43,361 43,581
Programme 1.2 Key Performance Indicators There has been no change to key performance indicators.
2013-14
Actual 2014-15 Revised budget
2015-16 Forward
year 1
2016-17 Forward
year 2
2017-18 Forward
year 3 Key performance indicators $'000 $'000 $'000 $'000 $'000 Consumer safeguards, education and information 50,474 47,292 44,336 43,361 43,581
57


ACMA Additional Estimates Statements
Section 3: Explanatory Tables and Budgeted Financial Statements
Section 3 presents explanatory tables and budgeted financial statements which provide a comprehensive snapshot of agency finances for the 2014-15 budget year. It explains how budget plans are incorporated into the financial statements and provides further details of the reconciliation between appropriations and programme expenses.
3.1 EXPLANATORY TABLES
3.1.1 Special Accounts Special Accounts provide a means to set aside and record amounts used for specified purposes. Table 3.1.1 shows the expected additions (receipts) and reductions (payments) for each account used by the ACMA. The corresponding table in the 2014-15 PB Statements is Table 3.1.2.
Table 3.1.1: Estimates of Special Account Flows and Balances
Outcome
Opening balance 2014-15 2013-14
$'000
Receipts
2014-15 2013-14
$'000
Payments
2014-15 2013-14
$'000
Closing balance 2014-15 2013-14
$'000 Universal Service Account (A) 1 - - - -
PGPA Act1 s80 and TCPSS Act2 s21(2) 19 - 19 - Services for Other Entities and Trust Moneys (A) 1 - 50 50 - PGPA Act s78 70 - 70 - Total Special Accounts 2014-15 Budget estimate - 50 50 - Total Special Accounts 2013-14
Actual 89 - 89 - (A) = Administered 1 Public Governance, Performance and Accountability Act 2013. 2 Telecommunications (Consumer Protection and Service Standards) Act 1999.
59

ACMA Additional Estimates Statements
3.2 BUDGETED FINANCIAL STATEMENTS
3.2.1 Differences in agency resourcing and financial statements There are no significant differences between the resource information presented in the Budget Papers and Portfolio Budget Statements as a result of differences between Australian Accounting Standards (AAS) and Government Finance Statistics (GFS).
3.2.2 Analysis of budgeted financial statements Departmental Comprehensive Income Statement
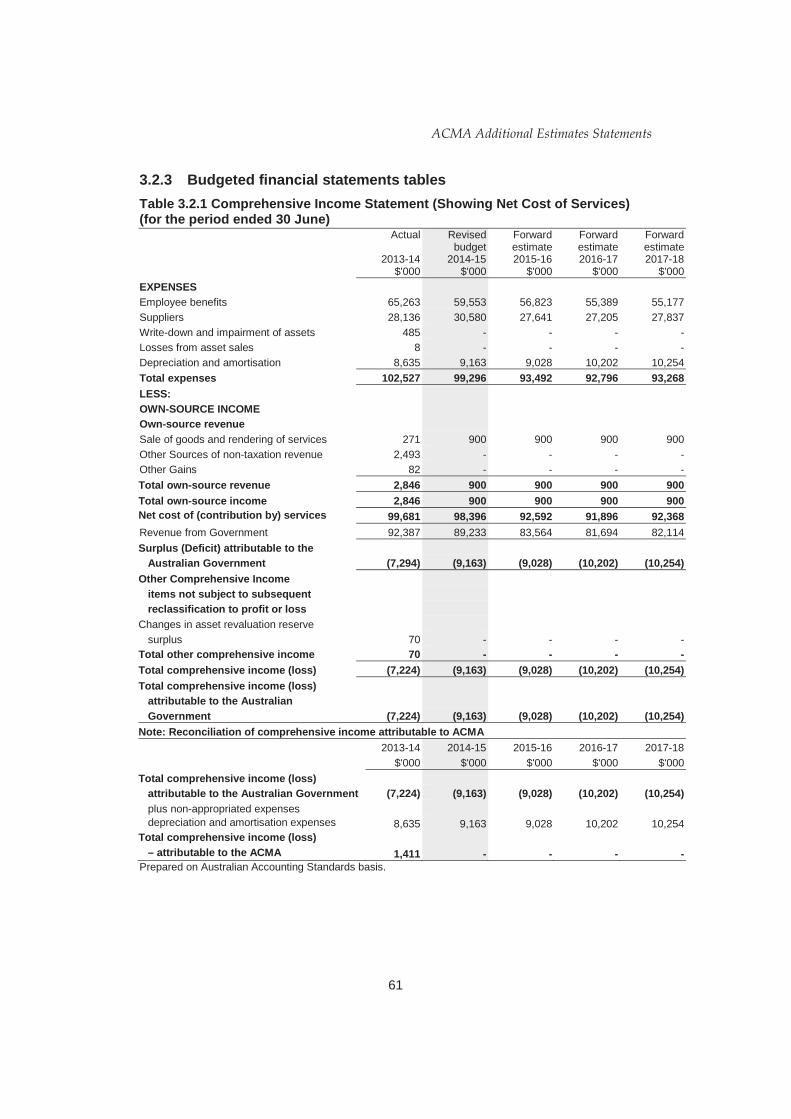
The ACMA is budgeting in 2014-15 for total expenditure of $99.3 million. This represents an increase of $4.1 million from the 2014-15 Portfolio Budget Statements position due to the transfer of funding for enhancing online safety for children from Department of Communications and additional funding for pre-existing measures affecting the public sector.
60
ACMA Additional Estimates Statements
3.2.3 Budgeted financial statements tables Table 3.2.1 Comprehensive Income Statement (Showing Net Cost of Services) (for the period ended 30 June)
Actual
2013-14 $'000
Revised budget
2014-15 $'000
Forward estimate 2015-16
$'000
Forward estimate 2016-17
$'000
Forward estimate 2017-18
$'000 EXPENSES Employee benefits 65,263 59,553 56,823 55,389 55,177 Suppliers 28,136 30,580 27,641 27,205 27,837 Write-down and impairment of assets 485 - - - - Losses from asset sales 8 - - - - Depreciation and amortisation 8,635 9,163 9,028 10,202 10,254 Total expenses 102,527 99,296 93,492 92,796 93,268 LESS: OWN-SOURCE INCOME Own-source revenue Sale of goods and rendering of services 271 900 900 900 900 Other Sources of non-taxation revenue 2,493 - - - - Other Gains 82 - - - - Total own-source revenue 2,846 900 900 900 900 Total own-source income 2,846 900 900 900 900 Net cost of (contribution by) services 99,681 98,396 92,592 91,896 92,368 Revenue from Government 92,387 89,233 83,564 81,694 82,114 Surplus (Deficit) attributable to the Australian Government (7,294) (9,163) (9,028) (10,202) (10,254) Other Comprehensive Income items not subject to subsequent reclassification to profit or loss Changes in asset revaluation reserve surplus 70 - - - - Total other comprehensive income 70 - - - - Total comprehensive income (loss) (7,224) (9,163) (9,028) (10,202) (10,254) Total comprehensive income (loss) attributable to the Australian Government (7,224) (9,163) (9,028) (10,202) (10,254) Note: Reconciliation of comprehensive income attributable to ACMA 2013-14 2014-15 2015-16 2016-17 2017-18
$'000 $'000 $'000 $'000 $'000 Total comprehensive income (loss) attributable to the Australian Government (7,224) (9,163) (9,028) (10,202) (10,254) plus non-appropriated expenses depreciation and amortisation expenses 8,635 9,163 9,028 10,202 10,254 Total comprehensive income (loss) – attributable to the ACMA 1,411 - - - - Prepared on Australian Accounting Standards basis.
61
ACMA Additional Estimates Statements
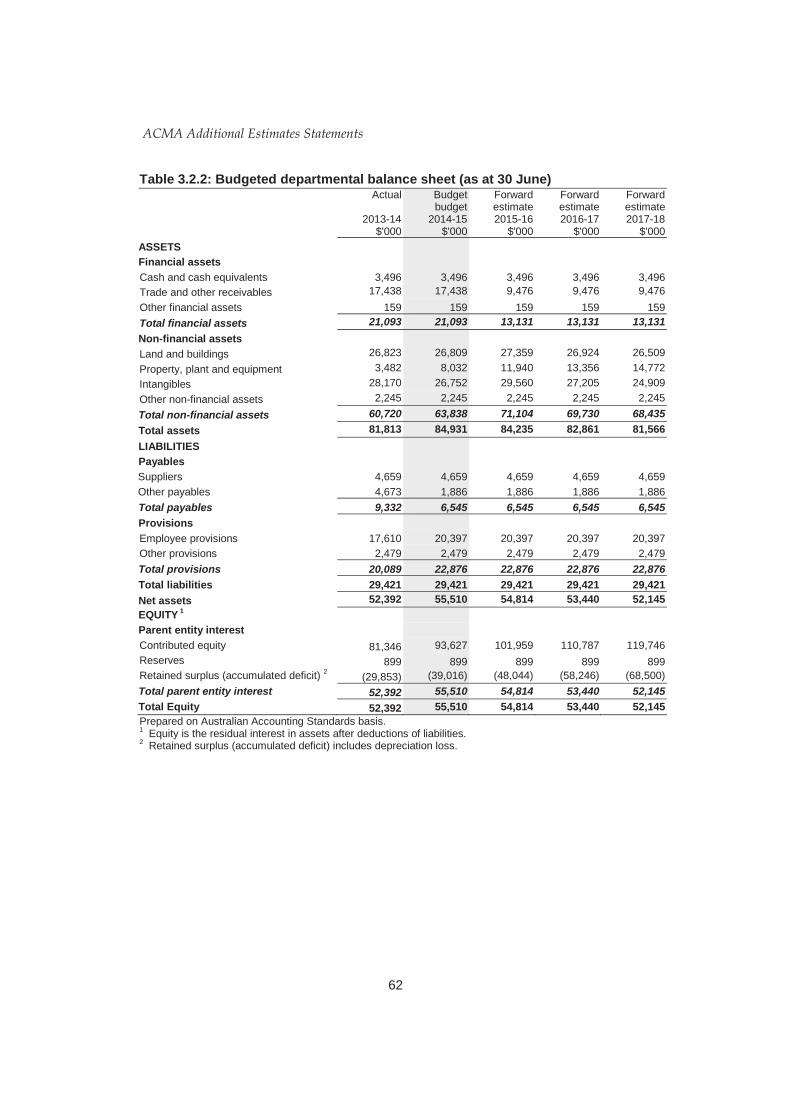
Table 3.2.2: Budgeted departmental balance sheet (as at 30 June) Actual
2013-14
$'000
Budget budget
2014-15 $'000
Forward estimate 2015-16
$'000
Forward estimate 2016-17
$'000
Forward estimate 2017-18
$'000 ASSETS Financial assets Cash and cash equivalents 3,496 3,496 3,496 3,496 3,496 Trade and other receivables 17,438 17,438 9,476 9,476 9,476 Other financial assets 159 159 159 159 159 Total financial assets 21,093 21,093 13,131 13,131 13,131 Non-financial assets Land and buildings 26,823 26,809 27,359 26,924 26,509 Property, plant and equipment 3,482 8,032 11,940 13,356 14,772 Intangibles 28,170 26,752 29,560 27,205 24,909 Other non-financial assets 2,245 2,245 2,245 2,245 2,245 Total non-financial assets 60,720 63,838 71,104 69,730 68,435 Total assets 81,813 84,931 84,235 82,861 81,566 LIABILITIES Payables Suppliers 4,659 4,659 4,659 4,659 4,659 Other payables 4,673 1,886 1,886 1,886 1,886 Total payables 9,332 6,545 6,545 6,545 6,545 Provisions Employee provisions 17,610 20,397 20,397 20,397 20,397 Other provisions 2,479 2,479 2,479 2,479 2,479 Total provisions 20,089 22,876 22,876 22,876 22,876 Total liabilities 29,421 29,421 29,421 29,421 29,421 Net assets 52,392 55,510 54,814 53,440 52,145 EQUITY 1 Parent entity interest Contributed equity 81,346 93,627 101,959 110,787 119,746 Reserves 899 899 899 899 899 Retained surplus (accumulated deficit) 2 (29,853) (39,016) (48,044) (58,246) (68,500) Total parent entity interest 52,392 55,510 54,814 53,440 52,145 Total Equity 52,392 55,510 54,814 53,440 52,145 Prepared on Australian Accounting Standards basis. 1 Equity is the residual interest in assets after deductions of liabilities. 2 Retained surplus (accumulated deficit) includes depreciation loss.
62
ACMA Additional Estimates Statements
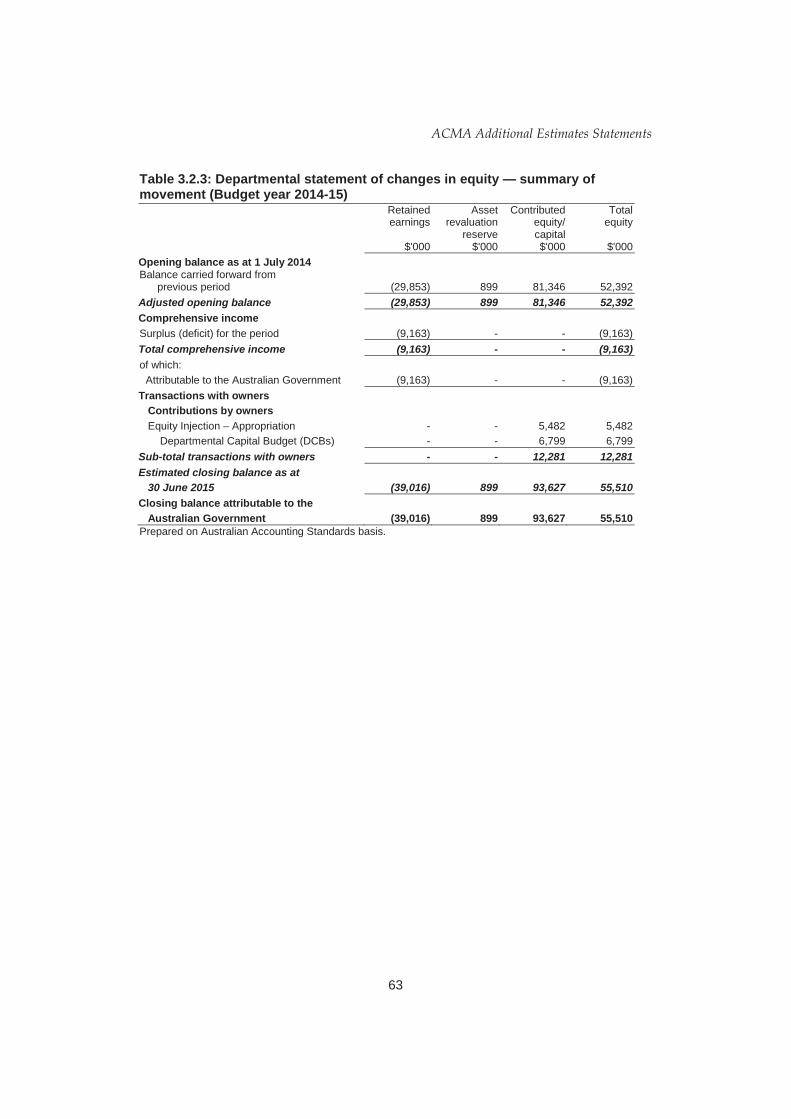
Table 3.2.3: Departmental statement of changes in equity — summary of movement (Budget year 2014-15) Retained
earnings
$'000
Asset revaluation
reserve $'000
Contributed equity/ capital $'000
Total equity
$'000
Opening balance as at 1 July 2014 Balance carried forward from previous period (29,853) 899 81,346 52,392 Adjusted opening balance (29,853) 899 81,346 52,392 Comprehensive income Surplus (deficit) for the period (9,163) - - (9,163) Total comprehensive income (9,163) - - (9,163) of which: Attributable to the Australian Government (9,163) - - (9,163) Transactions with owners Contributions by owners Equity Injection – Appropriation - - 5,482 5,482
Departmental Capital Budget (DCBs) - - 6,799 6,799 Sub-total transactions with owners - - 12,281 12,281 Estimated closing balance as at 30 June 2015 (39,016) 899 93,627 55,510 Closing balance attributable to the Australian Government (39,016) 899 93,627 55,510 Prepared on Australian Accounting Standards basis.
63

ACMA Additional Estimates Statements
Table 3.2.4: Budgeted departmental statement of cash flows (for the period ended 30 June)
Actual
2013-14 $'000
Revised budget
2014-15 $'000
Forward estimate 2015-16
$'000
Forward estimate 2016-17
$'000
Forward estimate 2017-18
$'000 OPERATING ACTIVITIES Cash received Appropriations 94,230 91,183 88,577 87,833 88,255 Sale of goods and rendering of services 351 900 900 900 900 Net GST received 4,423 2,380 2,380 2,380 2,380 Other 2,547 - - - - Total cash received 101,551 94,463 91,857 91,113 91,535 Cash used Employees 66,853 60,493 58,897 58,261 58,049 Suppliers 32,236 31,590 30,580 30,472 31,106 Net GST paid - 2,380 2,380 2,380 2,380 Total cash used 99,089 94,463 91,857 91,113 91,535 Net cash from (used by) operating Activities 2,462 - - - - INVESTING ACTIVITIES Purchase of property, plant, equipment and intangibles 22,193 12,281 8,332 8,828 8,959 Total cash used 22,193 12,281 8,332 8,828 8,959 Net cash from (used by) investing activities (22,193) (12,281) (8,332) (8,828) (8,959) FINANCING ACTIVITIES Cash received Contributed equity 22,193 12,281 8,332 8,828 8,959 Total cash received 22,193 12,281 8,332 8,828 8,959 Net cash from (used by) financing activities (22,193) (12,281) (8,332) (8,828) (8,959) Net increase (decrease) in cash held 2,462 - - - - Cash and cash equivalents at the beginning of the reporting period 1,034 3,496 3,496 3,496 3,496 Cash and cash equivalents at the end of the reporting period 3,496 3,496 3,496 3,496 3,496 Prepared on Australian Accounting Standards basis.
64
ACMA Additional Estimates Statements
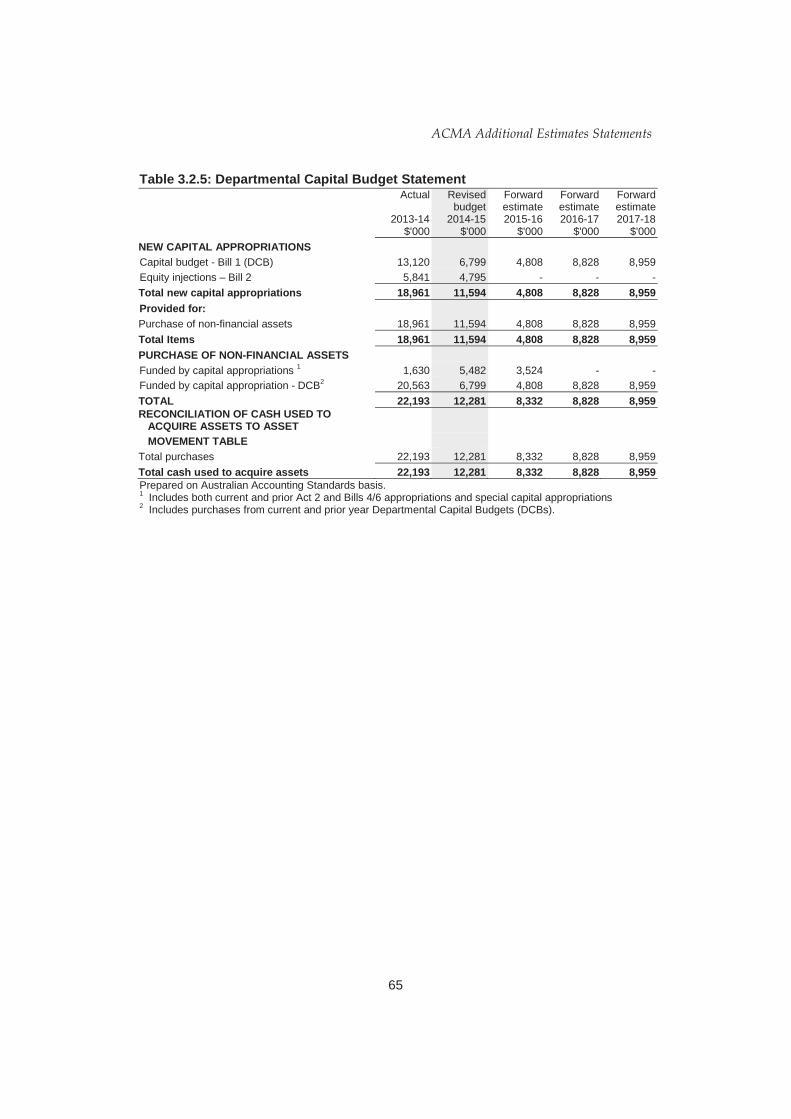
Table 3.2.5: Departmental Capital Budget Statement Actual
2013-14
$'000
Revised budget
2014-15 $'000
Forward estimate 2015-16
$'000
Forward estimate 2016-17
$'000
Forward estimate 2017-18
$'000 NEW CAPITAL APPROPRIATIONS Capital budget - Bill 1 (DCB) 13,120 6,799 4,808 8,828 8,959 Equity injections – Bill 2 5,841 4,795 - - - Total new capital appropriations 18,961 11,594 4,808 8,828 8,959 Provided for: Purchase of non-financial assets 18,961 11,594 4,808 8,828 8,959 Total Items 18,961 11,594 4,808 8,828 8,959 PURCHASE OF NON-FINANCIAL ASSETS Funded by capital appropriations 1 1,630 5,482 3,524 - - Funded by capital appropriation - DCB2 20,563 6,799 4,808 8,828 8,959 TOTAL 22,193 12,281 8,332 8,828 8,959 RECONCILIATION OF CASH USED TO ACQUIRE ASSETS TO ASSET MOVEMENT TABLE Total purchases 22,193 12,281 8,332 8,828 8,959 Total cash used to acquire assets 22,193 12,281 8,332 8,828 8,959 Prepared on Australian Accounting Standards basis. 1 Includes both current and prior Act 2 and Bills 4/6 appropriations and special capital appropriations 2 Includes purchases from current and prior year Departmental Capital Budgets (DCBs).
65

ACMA Additional Estimates Statements
Table 3.2.6: Statement of Asset Movements (2014-15) Land
Buildings
Other property, plant and
equipment
Computer software
and intangibles
Total
$'000 $'000 $'000 $'000 $'000 As at 1 July 2014 Gross book value 6,920 20,920 5,575 56,356 89,771 Accumulated depreciation/amortisation and impairment - (1,017) (2,093) (28,186) (31,296) Opening net book balance 6,920 19,903 3,482 28,170 58,475 CAPITAL ASSET ADDITIONS Estimated expenditure on new or replacement assets By purchase - appropriation equity1 - - 4,576 906 5,482 By purchase - appropriation ordinary annual services2 - 1,470 2,000 3,329 6,799 Total additions - 1,470 6,576 4,235 12,281 Other movements Depreciation/amortisation expense - (1,484) (2,026) (5,653) (9,163) Total other movements - (1,484) (2,026) (5,653) (9,163) As at 30 June 2015 Gross book value 6,920 22,390 12,151 60,591 102,052 Accumulated depreciation/amortisation and impairment - (2,501) (4,119) (33,839) (40,459) Closing net book balance 6,920 19,889 8,032 26,752 61,593 Prepared on Australian Accounting Standards basis. 1 ‘Appropriation equity’ refers to equity injections or Administered Assets and Liabilities appropriations
provided through Appropriation Acts No. 2 and Bill No. 4 2014-15, including CDABs. 2 ‘Appropriation ordinary annual services’ refers to funding provided through Appropriation Act No. 1 and
Bill No. 3 2014-15 for depreciation / amortisation expenses, DCBs or other operational expenses.
66
ACMA Additional Estimates Statements
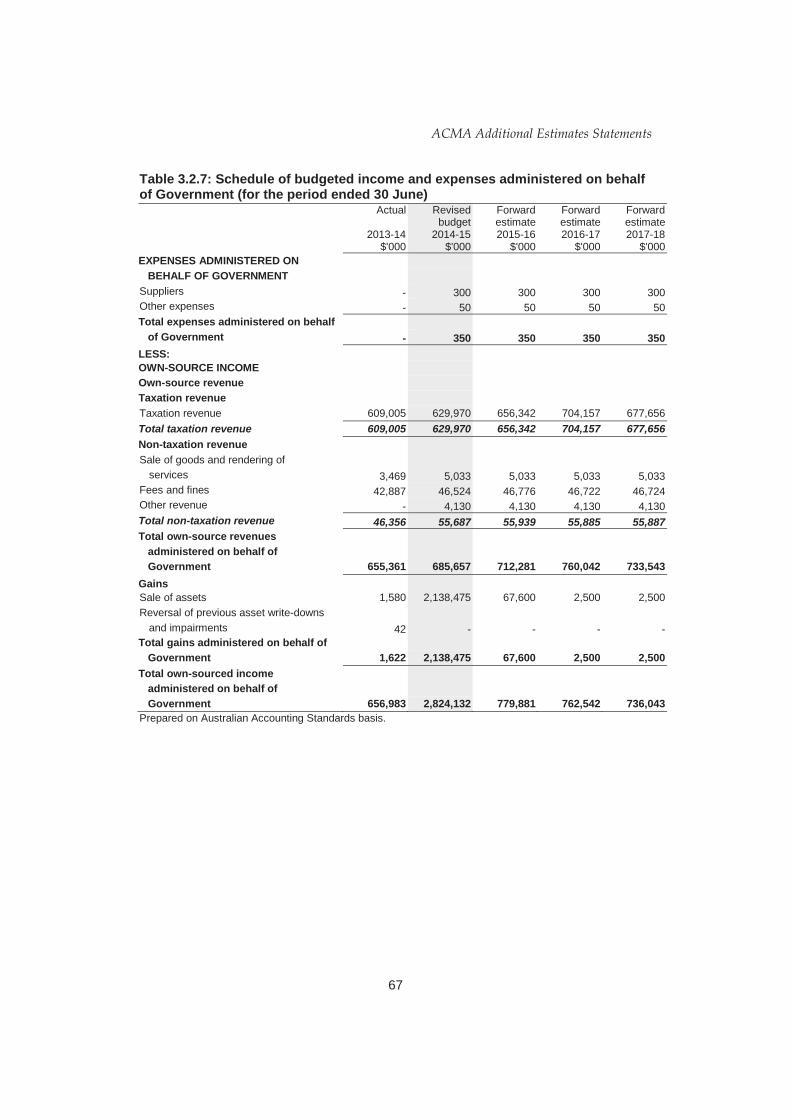
Table 3.2.7: Schedule of budgeted income and expenses administered on behalf of Government (for the period ended 30 June)
Actual
2013-14 $'000
Revised budget
2014-15 $'000
Forward estimate 2015-16
$'000
Forward estimate 2016-17
$'000
Forward estimate 2017-18
$'000 EXPENSES ADMINISTERED ON BEHALF OF GOVERNMENT Suppliers - 300 300 300 300 Other expenses - 50 50 50 50 Total expenses administered on behalf of Government - 350 350 350 350 LESS: OWN-SOURCE INCOME Own-source revenue Taxation revenue Taxation revenue 609,005 629,970 656,342 704,157 677,656 Total taxation revenue 609,005 629,970 656,342 704,157 677,656 Non-taxation revenue Sale of goods and rendering of
services 3,469 5,033 5,033 5,033 5,033 Fees and fines 42,887 46,524 46,776 46,722 46,724 Other revenue - 4,130 4,130 4,130 4,130 Total non-taxation revenue 46,356 55,687 55,939 55,885 55,887 Total own-source revenues administered on behalf of Government 655,361 685,657 712,281 760,042 733,543 Gains Sale of assets 1,580 2,138,475 67,600 2,500 2,500 Reversal of previous asset write-downs and impairments 42 - - - - Total gains administered on behalf of Government 1,622 2,138,475 67,600 2,500 2,500 Total own-sourced income administered on behalf of Government 656,983 2,824,132 779,881 762,542 736,043 Prepared on Australian Accounting Standards basis.
67
ACMA Additional Estimates Statements
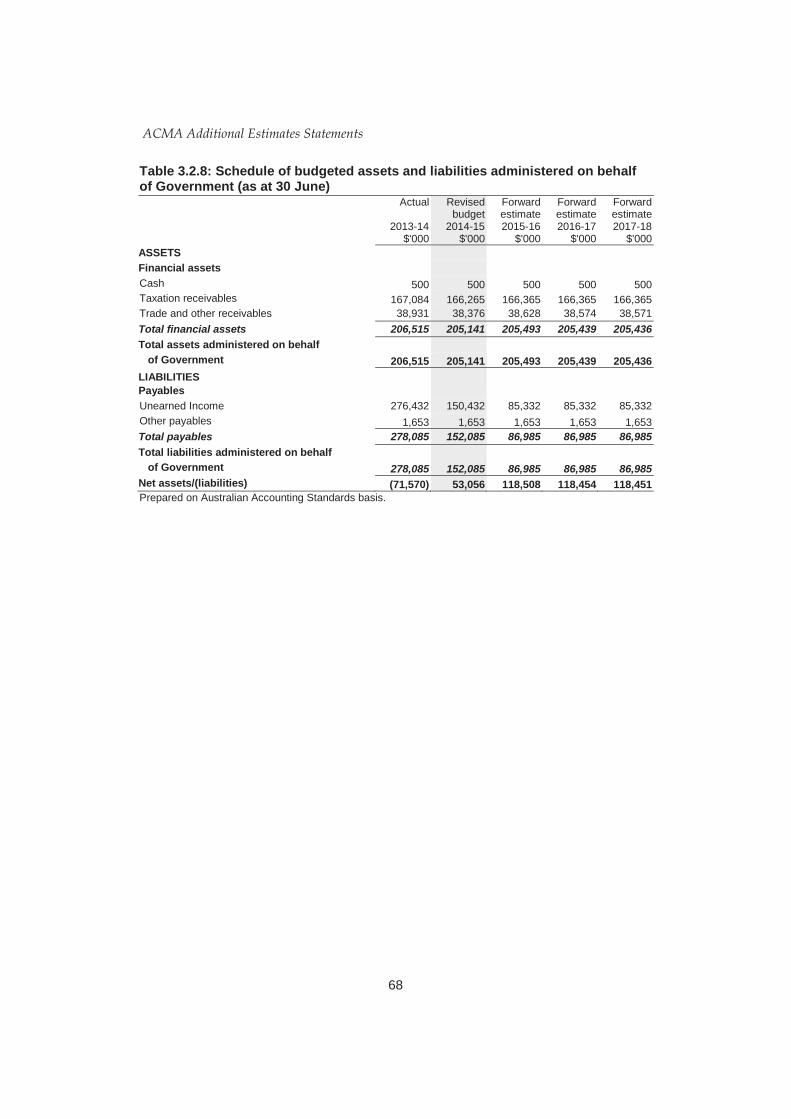
Table 3.2.8: Schedule of budgeted assets and liabilities administered on behalf of Government (as at 30 June)
Actual
2013-14 $'000
Revised budget
2014-15 $'000
Forward estimate 2015-16
$'000
Forward estimate 2016-17
$'000
Forward estimate 2017-18
$'000 ASSETS Financial assets Cash 500 500 500 500 500 Taxation receivables 167,084 166,265 166,365 166,365 166,365 Trade and other receivables 38,931 38,376 38,628 38,574 38,571 Total financial assets 206,515 205,141 205,493 205,439 205,436 Total assets administered on behalf of Government 206,515 205,141 205,493 205,439 205,436 LIABILITIES Payables Unearned Income 276,432 150,432 85,332 85,332 85,332 Other payables 1,653 1,653 1,653 1,653 1,653 Total payables 278,085 152,085 86,985 86,985 86,985 Total liabilities administered on behalf of Government 278,085 152,085 86,985 86,985 86,985 Net assets/(liabilities) (71,570) 53,056 118,508 118,454 118,451 Prepared on Australian Accounting Standards basis.
68
ACMA Additional Estimates Statements
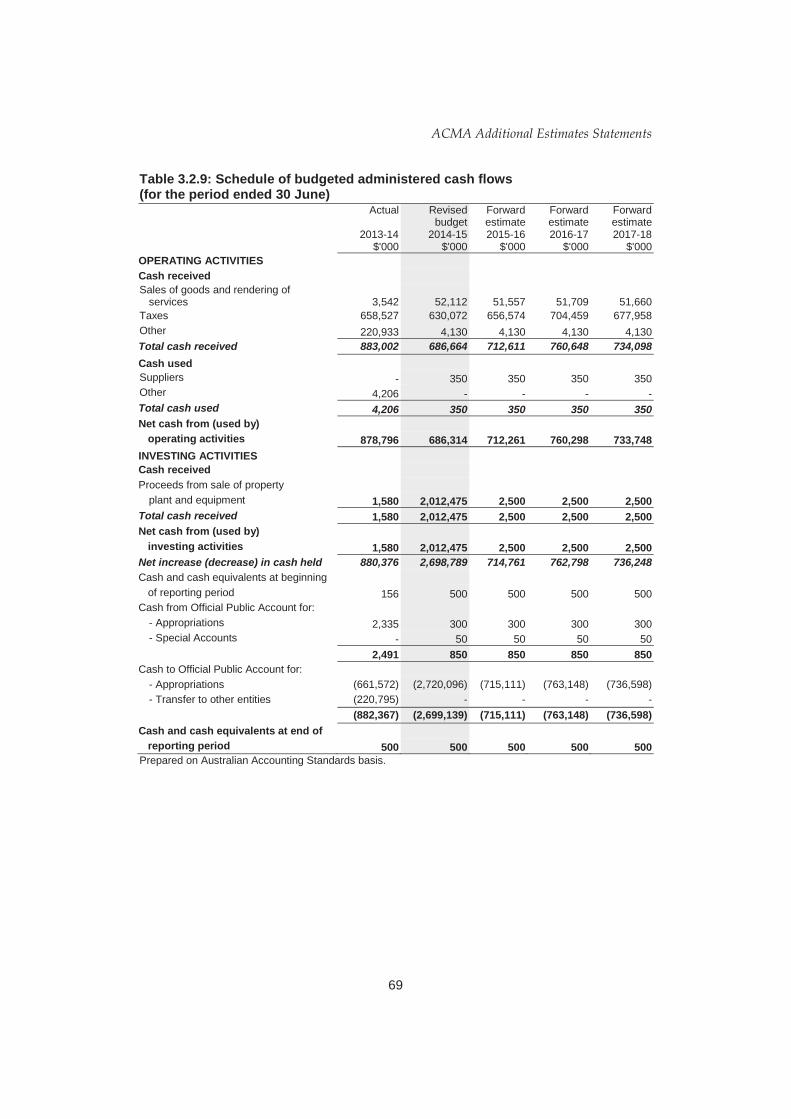
Table 3.2.9: Schedule of budgeted administered cash flows (for the period ended 30 June)
Actual
2013-14 $'000
Revised budget
2014-15 $'000
Forward estimate 2015-16
$'000
Forward estimate 2016-17
$'000
Forward estimate 2017-18
$'000 OPERATING ACTIVITIES Cash received Sales of goods and rendering of
services 3,542 52,112 51,557 51,709 51,660 Taxes 658,527 630,072 656,574 704,459 677,958 Other 220,933 4,130 4,130 4,130 4,130 Total cash received 883,002 686,664 712,611 760,648 734,098 Cash used Suppliers - 350 350 350 350 Other 4,206 - - - - Total cash used 4,206 350 350 350 350 Net cash from (used by) operating activities 878,796 686,314 712,261 760,298 733,748 INVESTING ACTIVITIES Cash received Proceeds from sale of property plant and equipment 1,580 2,012,475 2,500 2,500 2,500 Total cash received 1,580 2,012,475 2,500 2,500 2,500 Net cash from (used by) investing activities 1,580 2,012,475 2,500 2,500 2,500 Net increase (decrease) in cash held 880,376 2,698,789 714,761 762,798 736,248 Cash and cash equivalents at beginning of reporting period 156 500 500 500 500 Cash from Official Public Account for:
- Appropriations 2,335 300 300 300 300 - Special Accounts - 50 50 50 50
2,491 850 850 850 850 Cash to Official Public Account for:
- Appropriations (661,572) (2,720,096) (715,111) (763,148) (736,598) - Transfer to other entities (220,795) - - - -
(882,367) (2,699,139) (715,111) (763,148) (736,598) Cash and cash equivalents at end of reporting period 500 500 500 500 500 Prepared on Australian Accounting Standards basis.
69
ACMA Additional Estimates Statements
3.2.4 Notes to the financial statements Budgeted Financial Statements
The ACMA’s financial statements have been prepared in accordance with the Australian Equivalents to the International Financial Reporting Standards (AEIFRS).
Administered Financial Statements
Taxation Revenue
Represents revenue collected from Broadcasting Licence Fees, Radiocommunications Taxes, TUSMA levies and the Annual Numbering Charge.
Non-taxation Revenue
Represents revenue collected from activities including the Telecommunication Licence Charges, non-taxation radiocommunications charges and the Do Not Call Register access fees.
Sale of Assets Revenue
Represents revenue from telephone numbering auctions, the renewal of the 15 year spectrum licence and the sale of the digital dividend spectrum auction relating to 700MHz and 2.5GHz bands.
70