Embed Size (px)
Citation preview

Australian Commercial Property Investment Market :
Styles, Performance and Funding
23 September 2013
Australian Centre for Financial Studies (ACFS)
The Australian Centre for Financial Studies (ACFS) is a not-for-profit consortium of Monash
University, RMIT University and Finsia (Financial Services Institute of Australasia) which was
established in 2005 with seed funding from the Victorian Government. Funding for ACFS is
also derived from corporate sponsorship and through research partnerships.
The mission of the ACFS is to build links between academics, practitioners and government
in the finance community to enhance research, practice, education and the reputation of
Australia’s financial institutions and universities, and of Australia as a financial centre.
Report Author: Dr David M. Higgins, RMIT University
Dr David Higgins is the Associate Professor: Property Investment, School of Property,
Construction and Project Management, RMIT University and Visiting Professor, Shanghai
University of Finance and Economics and Xiamen University, China (2009-2011). He has
strong professional links and is a Fellow of the Royal Institution of Chartered Surveyors. Prior
to academia, David worked in the property industry including Colliers International, Bayleys
Real Estate and Jones Lang LaSalle. He has a PHD on the challenges of forecasting
commercial property market performance.
His academic research is industry focused and in the past he has undertaken research for
leading Australian property institutions, for example: Commonwealth Bank, Mirvac Group,
Westpac Bank and AXISS Australia (Australian Government initiative). The research covers a
broad spectrum of innovative areas, for example: Corporate Real Estate, Property Investment
Strategies, Private Finance Initiatives, Four Quadrants Property Portfolio Allocation, Property
Forecast Modelling and Property Risk Management Tools.
Main Report Data Sources
- ABS, 2013, Australian National Accounts: Cat 5232.0, Australian Bureau of Statistics, Canberra.
- IPD, 2013, Australian Property Investment Digest: Quarter Ending Dec 2012, Investment Property Databank, Sydney.
- PCA, 2013a, Office Market Report: January 2013, Property Council of Australia, Sydney.
- PCA, 2013b, Shopping Centres Online, Property Council of Australia, Sydney.
- PIR, 2012, Australian Property Funds Industry Survey 2012: A Complete Landscape of the Property Fund Sector, Eleventh Edition, Property Investment Research, Sydney.
- Rainmaker, 2013, Superannuation Asset Allocation: Industry Funds, Rainmaker Group, Sydney.
- RBA, 2013, Indicative Housing Lending Rate: Statistical Table F5, Reserve Bank of Australia, Sydney.
Australian Commercial Property Investment Market :
Styles, Performance and Funding
September 2013
Contacts
Australian Centre for Financial Studies
Professor Deborah Ralston Professor Kevin Davis
Executive Director Research Director
T: +61 3 9666 1050 T: +61 3 9666 1050
www.australiancentre.com.au
Report Author
Dr. David M. Higgins
RMIT University
T: +61 3 9925 2214
Australian Commercial Property Investment Market: Styles, Performance and Funding
Abstract
Australian commercial property is a physical asset class that forms an important part of the
capital market universe. On available data, the extent and composition of investment grade
commercial property and associated property investment products can be measured and
compared to the wider Australian investment market. As at December 2012, the estimated
Australian institutional grade commercial property stock was AU$681 billion. The size of the
core property investment market (office, retail and industrial) is AU$280 billion of which
approximately AU$195 billion (70%) is owned by Australian Institutions.
Due to illiquidity and high value thresholds, a range of securitised property investment
products exist which offer investors exposure to local and overseas commercial property. The
largest is public equity with Real Estate Investment Trusts capitalised at AU$89 billion
representing close to 4% of the Australian Stockmarket. Next is private equity, comprising
wholesale property trusts and property syndicates at a combined value of AU$84 billion. Debt
securities offer an alternative return stream linked to property in the form of the AU$165 billion
whole commercial property mortgage sector and the AU$16 billion traded debt securities
sector.
Typically, data about the performance of investment asset classes is sourced from transaction
based indices. With no central trading place and low transactions, commercial property
investment performance data are based on valuation indices which exhibit artificially low
volatility. Using accepted statistical techniques, the valuation based PCA/IPD composite
property data can be desmoothed, which increases volatility by 31%. Over the 1985-2012
period, with inflation removed, desmoothed property is shown to have one of the best risk
adjusted performance profiles (joint second) of the eight leading investment asset classes.
However, future performance depends on economic conditions and how levels of new supply
affect rentals and prices.
A high value threshold means that direct property investment requires considerable capital. This
can be achieved by increased equity leading to higher specific property risk or debt financing
part of the property investment. Whilst debt funding can improve property investment returns, it
substantially increases the risk levels. Using the same 28 year desmoothed property data
series, a 80% gearing level can lead to a 30% improvement to the property total returns,
although the risk (volatility) is increased five-fold.
Contents
1. Introduction 1
2. Styles of Property Investment 4
3. Property Investment Market Performance 11
4. Debt and Property Investment Markets 18
5. Summary and Conclusions 21
6. References 22
1
1. Introduction
For investors, Australian commercial property is a physical asset class that forms an
important part of the capital market universe. Property assets offer diversification potential
with returns based on regular income from long lease contracts and prospects for capital
growth. Typically, commercial property prices are highly inelastic with the supply of new
assets subject to long development periods and planning regulations (Baum 2009).
The role of commercial property in the capital market is not always appreciated or
understood. Compared to the competing asset classes, most commercial properties are
traded in private and require limited disclosure. These and other differences call for specific
oriented research to better integrate commercial property into the capital markets.
The aim of this research is to address three specific issues, i) defining the size of Australian
commercial investment property market, ii) compare investment performance with competing
asset classes after adjusting for the reported low volatility from commercial property valuation
based performance indices, and iii) study the impact of debt financing on commercial property
fund performance. The research provides an important knowledge base for investors less
familiar with the potential role of commercial property1 in an asset portfolio and reference
point for those involved in the commercial property investment market.
In detailing the scope of the research, it is important to understand for decision making that
investors place considerable value on the level of accessible information. Compared to
competing asset classes, commercial property as an asset class has distinct features:
no central trading place to generate observable market prices
limited transactions restricting directly comparable evidence
illiquid assets requiring a large capital outlay
high value threshold of direct property can lead to highly concentrated portfolio risk
unique characteristics of individual buildings create substantial idiosyncratic risk
low property related disclosure/reporting requirements
issues of obsolescence and depreciation – implying capital expenditure requirements
management intensive asset class with potential risks of rental income volatility
Reflecting these characteristics compared to other asset classes, investors have a unique
opportunity to add value. Astute management offers opportunities to increase property returns
with new leases, refurbishments, and the possibility of repositioning the property in a
changing marketplace.
1 Commercial property is an investment asset class and is separate from property development
(construction) investment which is recognised as a high-risk activity (Baum 2009).
2
Involvement in management of the underlying (direct) property asset is not a necessary
requirement for the investor due to the existence of a range of creative capital market
property instruments. These enable investors to have an exposure to property in different
shapes and forms, without the management and liquidity issues of direct ownership. These
types of investments generally involve intermediaries holding the properties and issuing
financial claims related to the property returns to investors. In most instances, the investors
are not actively involved in the property decision making (selection or management) process.
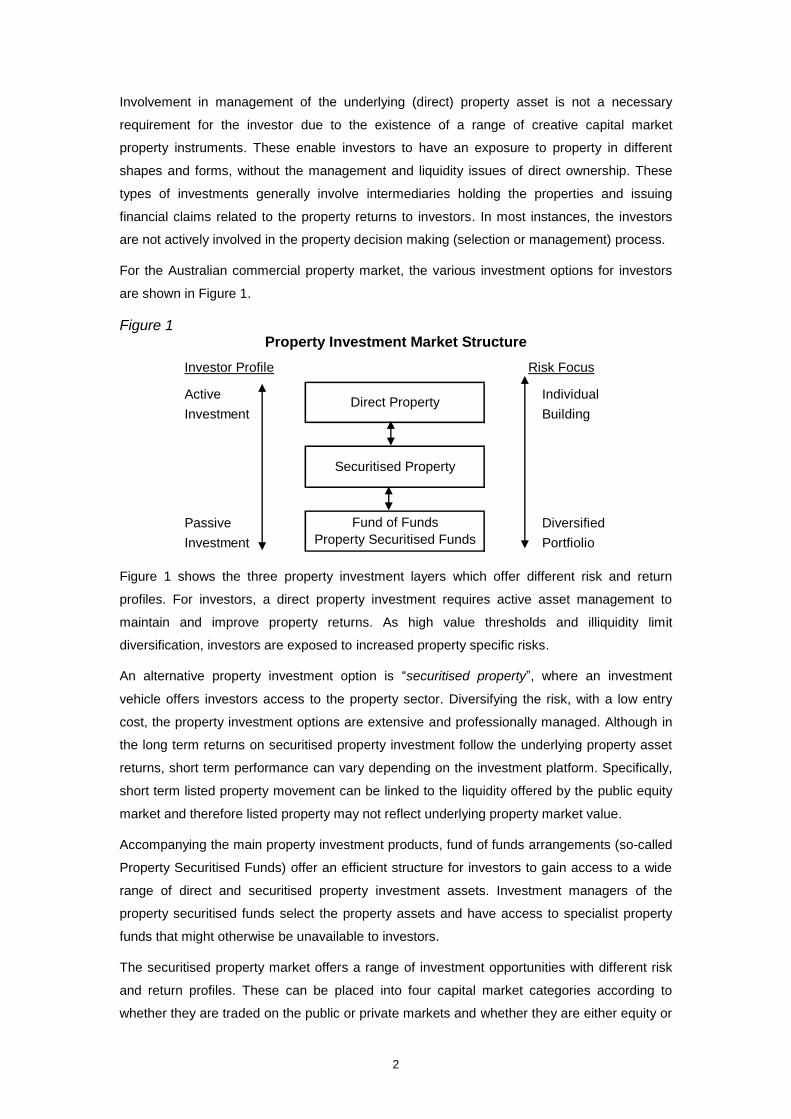
For the Australian commercial property market, the various investment options for investors
are shown in Figure 1.
Figure 1 Property Investment Market Structure
Investor Profile
Active Individual
Investment Building
Passive Diversified
Investment Portfiolio
Risk Focus
Direct Property
Securitised Property
Fund of Funds
Property Securitised Funds
Figure 1 shows the three property investment layers which offer different risk and return
profiles. For investors, a direct property investment requires active asset management to
maintain and improve property returns. As high value thresholds and illiquidity limit
diversification, investors are exposed to increased property specific risks.
An alternative property investment option is “securitised property”, where an investment
vehicle offers investors access to the property sector. Diversifying the risk, with a low entry
cost, the property investment options are extensive and professionally managed. Although in
the long term returns on securitised property investment follow the underlying property asset
returns, short term performance can vary depending on the investment platform. Specifically,
short term listed property movement can be linked to the liquidity offered by the public equity
market and therefore listed property may not reflect underlying property market value.
Accompanying the main property investment products, fund of funds arrangements (so-called
Property Securitised Funds) offer an efficient structure for investors to gain access to a wide
range of direct and securitised property investment assets. Investment managers of the
property securitised funds select the property assets and have access to specialist property
funds that might otherwise be unavailable to investors.
The securitised property market offers a range of investment opportunities with different risk
and return profiles. These can be placed into four capital market categories according to
whether they are traded on the public or private markets and whether they are either equity or
3
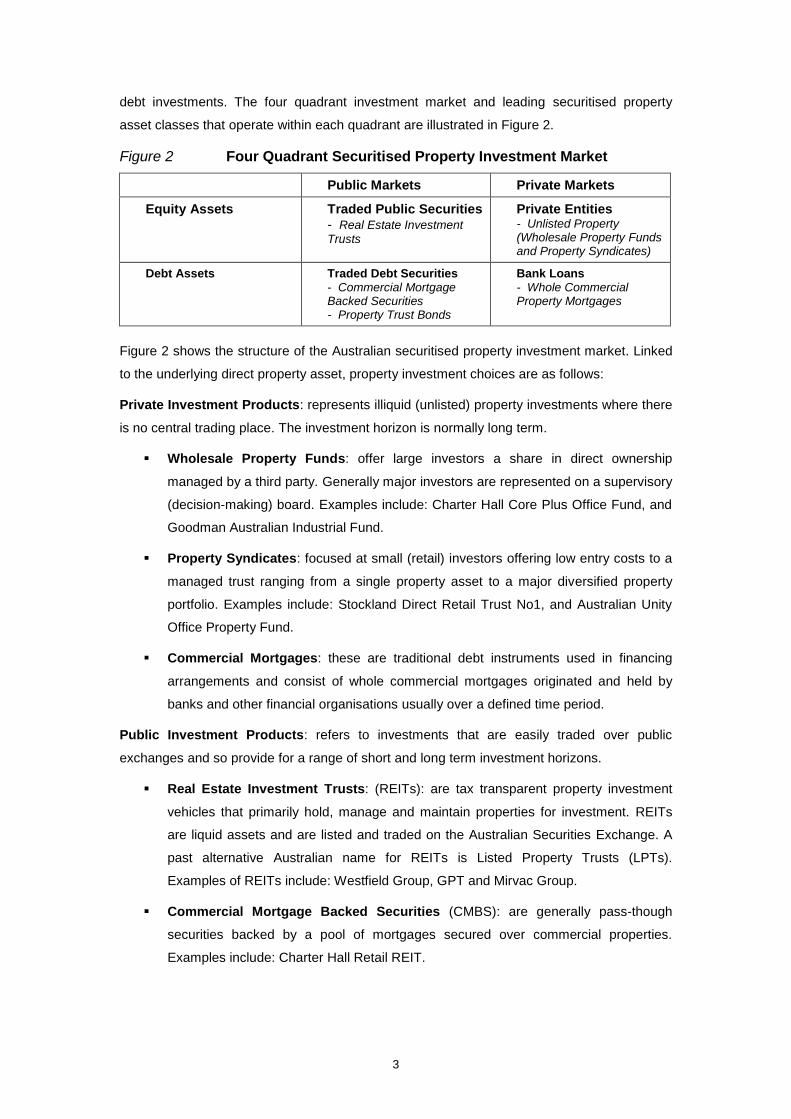
debt investments. The four quadrant investment market and leading securitised property
asset classes that operate within each quadrant are illustrated in Figure 2.
Figure 2 Four Quadrant Securitised Property Investment Market
Public Markets Private Markets
Equity Assets Traded Public Securities - Real Estate Investment
Trusts
Private Entities - Unlisted Property (Wholesale Property Funds and Property Syndicates)
Debt Assets Traded Debt Securities - Commercial Mortgage Backed Securities - Property Trust Bonds
Bank Loans - Whole Commercial Property Mortgages
Figure 2 shows the structure of the Australian securitised property investment market. Linked
to the underlying direct property asset, property investment choices are as follows:
Private Investment Products: represents illiquid (unlisted) property investments where there
is no central trading place. The investment horizon is normally long term.
Wholesale Property Funds: offer large investors a share in direct ownership
managed by a third party. Generally major investors are represented on a supervisory
(decision-making) board. Examples include: Charter Hall Core Plus Office Fund, and
Goodman Australian Industrial Fund.
Property Syndicates: focused at small (retail) investors offering low entry costs to a
managed trust ranging from a single property asset to a major diversified property
portfolio. Examples include: Stockland Direct Retail Trust No1, and Australian Unity
Office Property Fund.
Commercial Mortgages: these are traditional debt instruments used in financing
arrangements and consist of whole commercial mortgages originated and held by
banks and other financial organisations usually over a defined time period.
Public Investment Products: refers to investments that are easily traded over public
exchanges and so provide for a range of short and long term investment horizons.
Real Estate Investment Trusts: (REITs): are tax transparent property investment
vehicles that primarily hold, manage and maintain properties for investment. REITs
are liquid assets and are listed and traded on the Australian Securities Exchange. A
past alternative Australian name for REITs is Listed Property Trusts (LPTs).
Examples of REITs include: Westfield Group, GPT and Mirvac Group.
Commercial Mortgage Backed Securities (CMBS): are generally pass-though
securities backed by a pool of mortgages secured over commercial properties.
Examples include: Charter Hall Retail REIT.
4
Property Trust Bonds: represent an unsecured claim against the property
investment vehicle, rather than a claim against the underlying properties. The
issuance of Property Trust Bonds generally obliges the property investment vehicle to
adhere to specified covenants. These like CMBS are thinly traded on a secondary
market. Examples include: CFS Retail Property Group, and Dexus Property Group.
In detailing the property opportunities available to investors, the sourcing of property and
capital market information, definitions and coverage do vary between data providers and in
some instances their samples are representative of the total population. Acknowledging these
data limitations, commercial property can be compared with other major components of the
domestic investment market. For the purpose of this research, the focus is on the Australian
commercial property investment market as at December 2012.
As the research focus is on the Australian investment market, household residential property,
has been omitted as there are limited opportunities for institutional investors to invest in
residential properties in the public equity market.
This research is structured in the following manner. Section 2, “Styles of Property Investment”
provides detail on the size of the Australian commercial property investment market,
investment types and ownership. The relative importance of the property investment products
that form the four quadrants shown in Figure 2 are calculated. Section 3, “Property
Investment Market Performance” initially covers desmoothing of the appraisal based property
data. This then allows for inflation adjusted long term performance comparisons with
alternative asset classes. Section 4, “Debt and Property Investment Markets” covers the types
and impact of leverage on investment returns. A final section provides concluding comments.
2. Styles of Property Investment
Good investment decision making is important for the allocation of resources (land, labour
and capital) and requires access to quality information. For many asset classes, there is a
contrast as to the type and level of information; specifically well documented is risk, return
and liquidity information to commonly less known market size.
Comparing the size of the commercial property investment markets relative to alternative
asset classes in the Australian capital market is difficult due to the following:
limited disclosure of corporate property asset values and private investment products.
investment products can overlap and invest in more than one investment product (for
example: Fund of Funds, raising potential problems of double counting).
investment products can comprise different combinations of equity and debt (so
called, hybrid products).

5
To overcome these issues, market size and opportunities for investors can be examined at
three distinct levels. For example, measures of the Australian investment grade commercial
property market can be considered as follows:
Total stock: represents all institutional grade property, whether owned by investors
or owner occupiers and in the public or private sectors. This includes corporate
owned property which forms part of an organisation’s manufacturing operation.
Investment market: consists of all investment vehicles/assets that are available to
investors in the public or private sector that have property as the core underlying
constituent 2.
Investable universe: is the total value of all institutional grade assets with all
overlaps removed. Double counting can occur when assets are included in more than
one investment asset class. For example: Real Estate Investment Trusts are part of
the publicly traded equity market, however the underlying properties are counted as
part of the total commercial property stock.
The three distinct measures can provide contrasting outcomes. For the purpose of this
research, the focus is on the total stock and the investment market.
In examining the Australian property investment market structure, the total value of the public
portion is relatively straightforward. As in most public traded markets, the value of each
security is known, as public trading provides constant pricing information and the number of
shares (units) is a matter of public record.
Conversely, estimating the aggregated value of non-securitised or private market investment
is more difficult. This results from the fragmented, non-standardised and complex nature of
trading in these instruments. In addition, there is not much incentive to publicise transaction
details.
Consequently, the available estimates of the total value of many private market asset classes
come from market surveys carried out by service data providers where classification and
market coverage may vary.
2 For the purposes of this research, managed funds, fund of funds (property securitised funds) and
derivatives, are omitted as their value simply captures the value of the equities or debt obligations already included in this category, which they own or have the right to own in the future.
6
Australian Property Investment Market
Various private markets form the domestic investment market. The structure of these private
markets is considerably more complex than the publicly traded markets. ABS (2013) values
unlisted shares3 at AU$1,873 billion which includes equity investments in private non-
residential property.
Apart from the ABS (2013) unlisted share value, individual classes of assets are estimated
using methodology and data sources appropriate for that particular asset class. The standard
approach to estimate the size of a country’s investment grade commercial property market is
a top-down GDP based approach. In estimating the investment grade commercial property
market size, different adjustments are used for developed markets and developing markets,
as well as adjustments for different population densities. For methodology, see Liang and
McIntosh (1999) for the global commercial property market and Higgins (2005) for the
Australian commercial property market.
The top-down GDP based approach is utilised by Pramerica (2012) to assess the size of 55
global commercial property markets. The Asia Pacific Region accounts for over US$7 trillion
(27%) of the US$26.6 trillion global investment grade commercial property market. Pramerica
(2012) estimated the Australian commercial property market (covering all investment grade
commercial property - offices, retail, hospitals, hotels etc) at US$656 billion (AU$681 billion),
which represents approximately 2.5% of the global commercial property universe.
A bottom-up approach to the size of the Australian core commercial property markets can be
assessed based on PCA (2013a,b) estimates of office stock and individual shopping centre
data. The industrial property market utilises ABS employment data, specifically the industrial
sector (transport and storage, wholesale and manufacturing categories) and applies a
workspace ratio with adjustment for institutional grade floor space, see Higgins (2005) for the
methodology. IPD (2013) capital values are then applied to the estimated floor areas.
To arrive at a value of Australian institutionally owned property, the research itemised and
omitted both the overseas owned properties (AU$71 billion) and development/residential
properties (AU$14 billion) recorded in the PIR (2012) Australian Property Fund Industry Survey.
While acknowledging data limitations, the findings in Figure 3 illustrate the Australian property
ownership structure and allow comparisons between Australian investment grade core property
markets4.
3 ABS 5232, Australian National Accounts sourced the unlisted shares data from a quarterly survey of
public unit trusts. As this is a survey of investment value, ABS advises that the information should be viewed with caution. 4 For the purpose of this research, core property covers office, retail (shopping centres) and industrial
buildings. Non-core property includes entertainment and community (hospital) facilities etc.

7
Figure 3 Summary of the Australian Property Investment Market
Property Investment
Market Size
Institutionally
Owned Property
Total Value AU$B Total Value AU$B
Core Property Sector
Office Investment Market 111 63 56%
Retail Investment Market 112 106 94%
Industrial Investment Market 56 27 47%
Total 280 195 70%
Market Coverage by
Institutional Investors
Figure 3 also outlines the size and the degree of institutional ownership of the Australian core
property investment market. Australian institutions have AU$195 billion exposure to the core
property sector, apportioned: office 32%, retail 54% and industrial 14%. The proportion of the
retail market owned by Australian institutions is a high 94% and would suggest with limited
new supply that growth opportunities may centre more on redevelopment opportunities or
retail transactions between institutions. Alternatively, as institutional investors own 47% of the
industrial property market, a major source of future industrial property investment would be
from corporate owned property as they move to a leasing ownership option to adjust to the
changing Australian manufacturing and retailing logistic landscape.
A recent feature of the Australian commercial property market is the significance of long term
overseas institutional investors. They have increasingly entered the market, attracted by a
developed economy and a mature property market offering quality returns. Their investment
strategies cover joint ventures most noticeably with key local property fund managers:
Westfield Group – retail and Goodman Group – industrial. These joint ventures are recorded
in the institutionally owned property figures, whilst there is limited data on direct overseas
property ownership in Australia. Major overseas investors in direct property do include leading
Asian pension funds, for example: Government of Singapore Investment Corporation (GIC)
and South Korea's National Pension Service (NPS).
Those Australian properties owned by Australian institutions are typically spread across
property investment vehicles in the public and private markets. This offers investors a
different risk/return profile, as prices of publicly listed property trusts are affected more by
movement in the stockmarket than the private market property vehicles, which are driven
more by underlying property fundamentals (Rowland 2009). Figure 4 shows the different
property investment vehicles and the associated value of the underlying Australian properties.
8
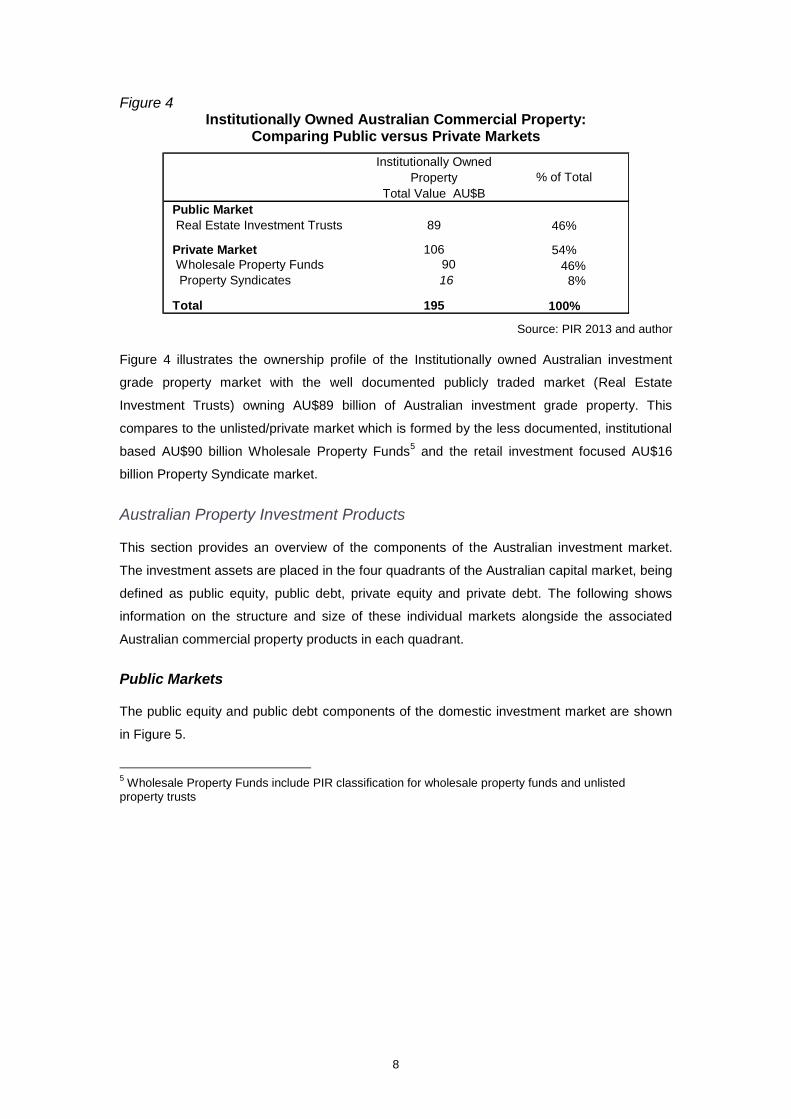
Figure 4 Institutionally Owned Australian Commercial Property:
Comparing Public versus Private Markets
Institutionally Owned
Property
Total Value AU$B
Public Market
Real Estate Investment Trusts 89 46%
Private Market 106 54%
Wholesale Property Funds 90 46% Property Syndicates 16 8%
Total 195 100%
% of Total
Source: PIR 2013 and author
Figure 4 illustrates the ownership profile of the Institutionally owned Australian investment
grade property market with the well documented publicly traded market (Real Estate
Investment Trusts) owning AU$89 billion of Australian investment grade property. This
compares to the unlisted/private market which is formed by the less documented, institutional
based AU$90 billion Wholesale Property Funds5 and the retail investment focused AU$16
billion Property Syndicate market.
Australian Property Investment Products
This section provides an overview of the components of the Australian investment market.
The investment assets are placed in the four quadrants of the Australian capital market, being
defined as public equity, public debt, private equity and private debt. The following shows
information on the structure and size of these individual markets alongside the associated
Australian commercial property products in each quadrant.
Public Markets
The public equity and public debt components of the domestic investment market are shown
in Figure 5.
5 Wholesale Property Funds include PIR classification for wholesale property funds and unlisted
property trusts
9
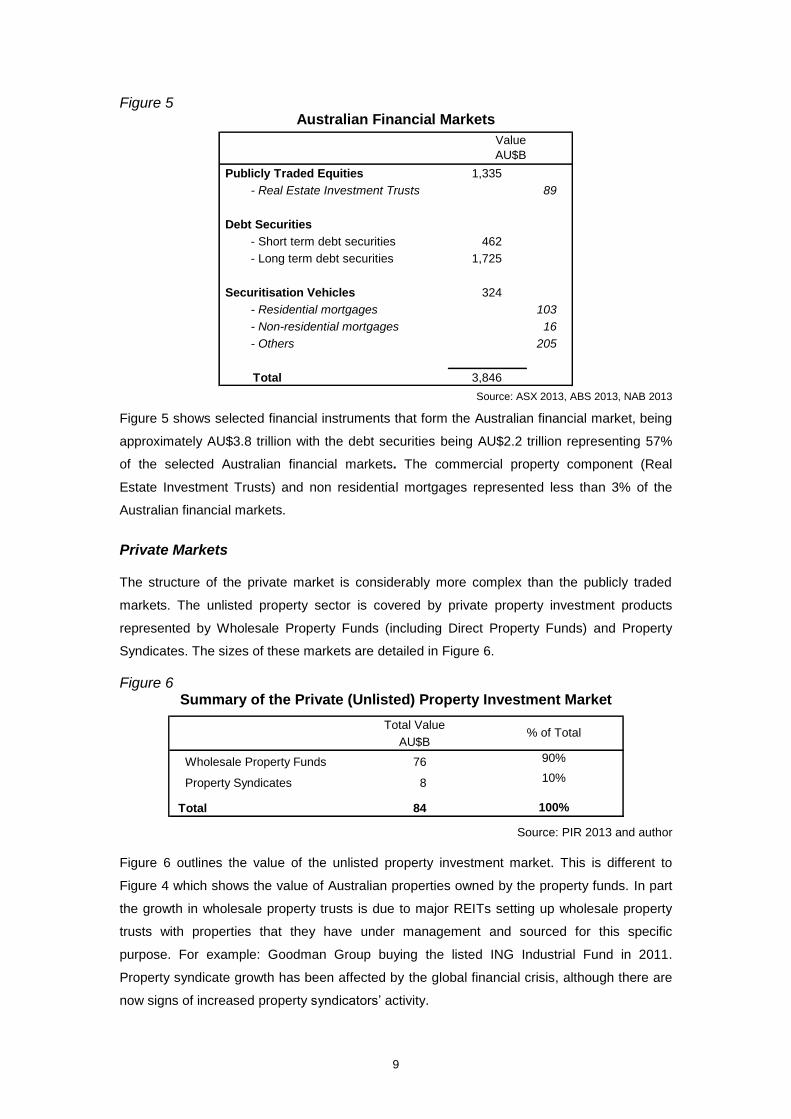
Figure 5 Australian Financial Markets
Publicly Traded Equities 1,335
- Real Estate Investment Trusts 89
Debt Securities
- Short term debt securities 462
- Long term debt securities 1,725
Securitisation Vehicles 324
- Residential mortgages 103
- Non-residential mortgages 16
- Others 205
Total 3,846
Value
AU$B
Source: ASX 2013, ABS 2013, NAB 2013
Figure 5 shows selected financial instruments that form the Australian financial market, being
approximately AU$3.8 trillion with the debt securities being AU$2.2 trillion representing 57%
of the selected Australian financial markets. The commercial property component (Real
Estate Investment Trusts) and non residential mortgages represented less than 3% of the
Australian financial markets.
Private Markets
The structure of the private market is considerably more complex than the publicly traded
markets. The unlisted property sector is covered by private property investment products
represented by Wholesale Property Funds (including Direct Property Funds) and Property
Syndicates. The sizes of these markets are detailed in Figure 6.
Figure 6 Summary of the Private (Unlisted) Property Investment Market
Total Value
AU$B
Wholesale Property Funds 76 90%
Property Syndicates 8 10%
Total 84 100%
% of Total
Source: PIR 2013 and author
Figure 6 outlines the value of the unlisted property investment market. This is different to
Figure 4 which shows the value of Australian properties owned by the property funds. In part
the growth in wholesale property trusts is due to major REITs setting up wholesale property
trusts with properties that they have under management and sourced for this specific
purpose. For example: Goodman Group buying the listed ING Industrial Fund in 2011.
Property syndicate growth has been affected by the global financial crisis, although there are
now signs of increased property syndicators’ activity.
10
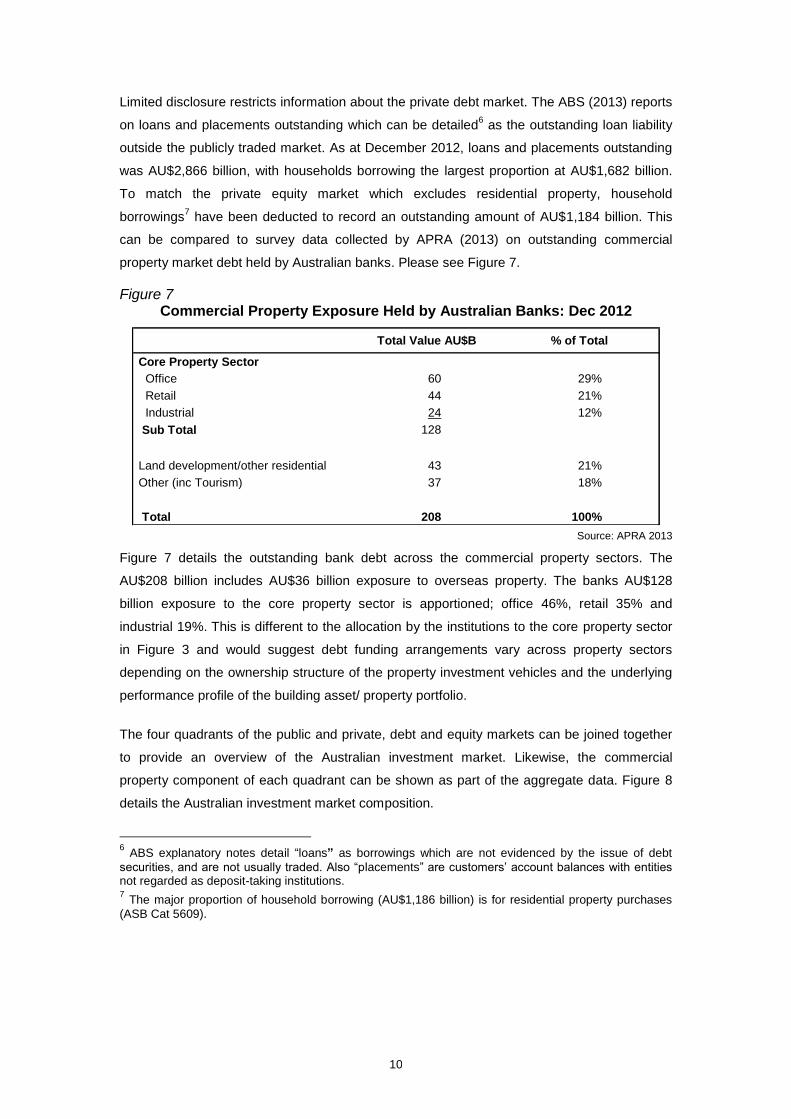
Limited disclosure restricts information about the private debt market. The ABS (2013) reports
on loans and placements outstanding which can be detailed6 as the outstanding loan liability
outside the publicly traded market. As at December 2012, loans and placements outstanding
was AU$2,866 billion, with households borrowing the largest proportion at AU$1,682 billion.
To match the private equity market which excludes residential property, household
borrowings7 have been deducted to record an outstanding amount of AU$1,184 billion. This
can be compared to survey data collected by APRA (2013) on outstanding commercial
property market debt held by Australian banks. Please see Figure 7.
Figure 7 Commercial Property Exposure Held by Australian Banks: Dec 2012
Total Value AU$B % of Total
Core Property Sector
Office 60 29%
Retail 44 21%
Industrial 24 12%
Sub Total 128
Land development/other residential 43 21%
Other (inc Tourism) 37 18%
Total 208 100% Source: APRA 2013
Figure 7 details the outstanding bank debt across the commercial property sectors. The
AU$208 billion includes AU$36 billion exposure to overseas property. The banks AU$128
billion exposure to the core property sector is apportioned; office 46%, retail 35% and
industrial 19%. This is different to the allocation by the institutions to the core property sector
in Figure 3 and would suggest debt funding arrangements vary across property sectors
depending on the ownership structure of the property investment vehicles and the underlying
performance profile of the building asset/ property portfolio.
The four quadrants of the public and private, debt and equity markets can be joined together
to provide an overview of the Australian investment market. Likewise, the commercial
property component of each quadrant can be shown as part of the aggregate data. Figure 8
details the Australian investment market composition.
6 ABS explanatory notes detail “loans” as borrowings which are not evidenced by the issue of debt
securities, and are not usually traded. Also “placements” are customers’ account balances with entities not regarded as deposit-taking institutions. 7 The major proportion of household borrowing (AU$1,186 billion) is for residential property purchases
(ASB Cat 5609).
11
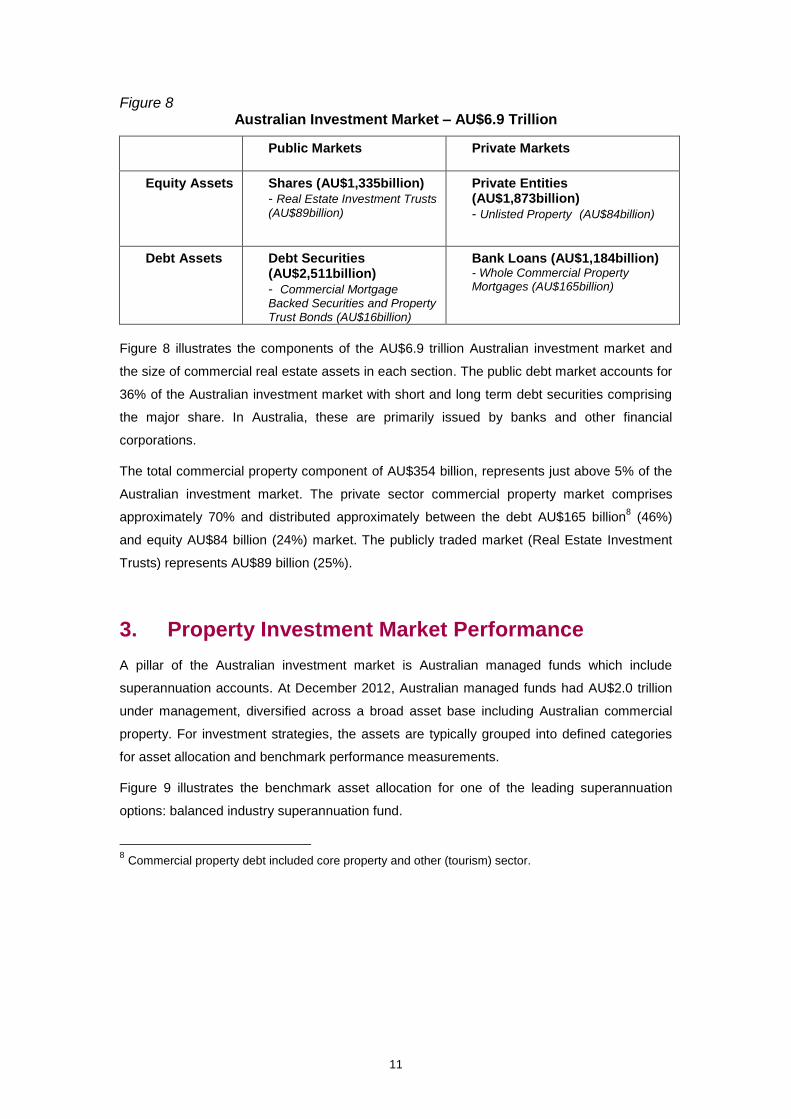
Figure 8 Australian Investment Market – AU$6.9 Trillion
Public Markets Private Markets
Equity Assets Shares (AU$1,335billion) - Real Estate Investment Trusts
(AU$89billion)
Private Entities (AU$1,873billion) - Unlisted Property (AU$84billion)
Debt Assets Debt Securities (AU$2,511billion) - Commercial Mortgage Backed Securities and Property Trust Bonds (AU$16billion)
Bank Loans (AU$1,184billion) - Whole Commercial Property Mortgages (AU$165billion)
Figure 8 illustrates the components of the AU$6.9 trillion Australian investment market and
the size of commercial real estate assets in each section. The public debt market accounts for
36% of the Australian investment market with short and long term debt securities comprising
the major share. In Australia, these are primarily issued by banks and other financial
corporations.
The total commercial property component of AU$354 billion, represents just above 5% of the
Australian investment market. The private sector commercial property market comprises
approximately 70% and distributed approximately between the debt AU$165 billion8 (46%)
and equity AU$84 billion (24%) market. The publicly traded market (Real Estate Investment
Trusts) represents AU$89 billion (25%).
3. Property Investment Market Performance
A pillar of the Australian investment market is Australian managed funds which include
superannuation accounts. At December 2012, Australian managed funds had AU$2.0 trillion
under management, diversified across a broad asset base including Australian commercial
property. For investment strategies, the assets are typically grouped into defined categories
for asset allocation and benchmark performance measurements.
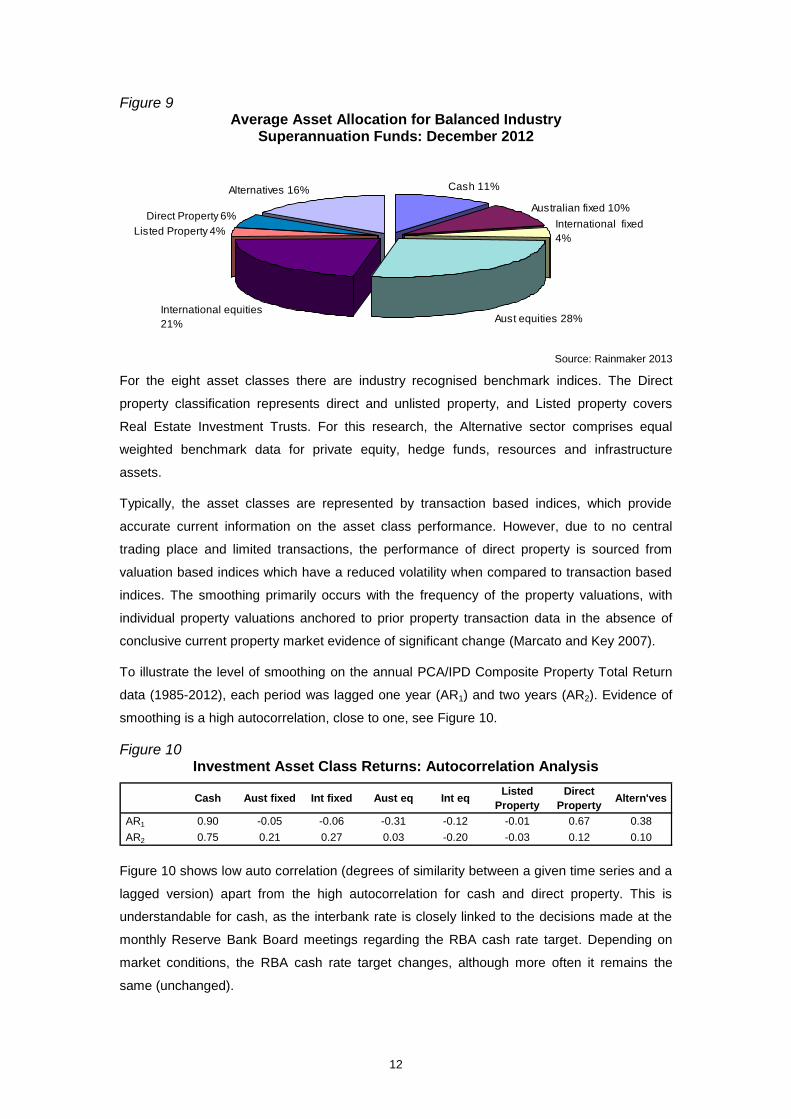
Figure 9 illustrates the benchmark asset allocation for one of the leading superannuation
options: balanced industry superannuation fund.
8 Commercial property debt included core property and other (tourism) sector.
12
Figure 9 Average Asset Allocation for Balanced Industry
Superannuation Funds: December 2012
Cash 11%
Australian fixed 10%
International fixed
4%
Aust equities 28%International equities
21%
Direct Property 6%
Alternatives 16%
Listed Property 4%
Source: Rainmaker 2013
For the eight asset classes there are industry recognised benchmark indices. The Direct
property classification represents direct and unlisted property, and Listed property covers
Real Estate Investment Trusts. For this research, the Alternative sector comprises equal
weighted benchmark data for private equity, hedge funds, resources and infrastructure
assets.
Typically, the asset classes are represented by transaction based indices, which provide
accurate current information on the asset class performance. However, due to no central
trading place and limited transactions, the performance of direct property is sourced from
valuation based indices which have a reduced volatility when compared to transaction based
indices. The smoothing primarily occurs with the frequency of the property valuations, with
individual property valuations anchored to prior property transaction data in the absence of
conclusive current property market evidence of significant change (Marcato and Key 2007).
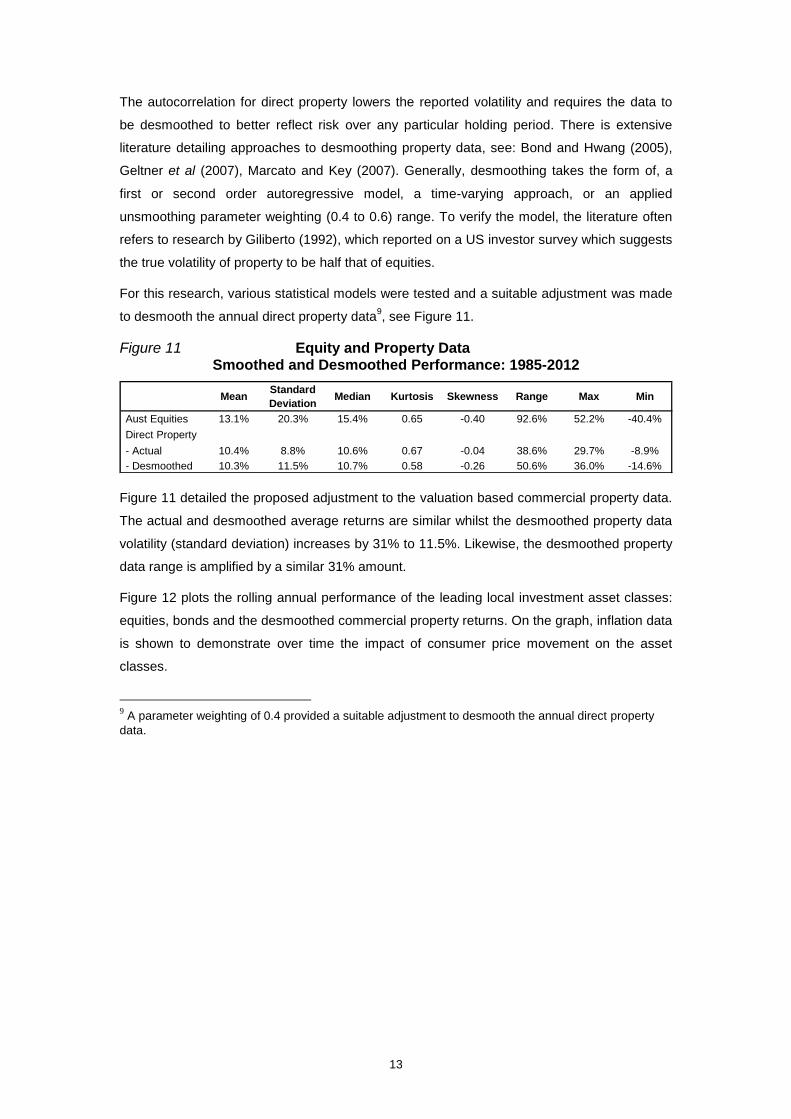
To illustrate the level of smoothing on the annual PCA/IPD Composite Property Total Return
data (1985-2012), each period was lagged one year (AR1) and two years (AR2). Evidence of
smoothing is a high autocorrelation, close to one, see Figure 10.
Figure 10 Investment Asset Class Returns: Autocorrelation Analysis
Cash Aust fixed Int fixed Aust eq Int eqListed
Property
Direct
PropertyAltern'ves
AR1 0.90 -0.05 -0.06 -0.31 -0.12 -0.01 0.67 0.38
AR2 0.75 0.21 0.27 0.03 -0.20 -0.03 0.12 0.10 Figure 10 shows low auto correlation (degrees of similarity between a given time series and a
lagged version) apart from the high autocorrelation for cash and direct property. This is
understandable for cash, as the interbank rate is closely linked to the decisions made at the
monthly Reserve Bank Board meetings regarding the RBA cash rate target. Depending on
market conditions, the RBA cash rate target changes, although more often it remains the
same (unchanged).
13
The autocorrelation for direct property lowers the reported volatility and requires the data to
be desmoothed to better reflect risk over any particular holding period. There is extensive
literature detailing approaches to desmoothing property data, see: Bond and Hwang (2005),
Geltner et al (2007), Marcato and Key (2007). Generally, desmoothing takes the form of, a
first or second order autoregressive model, a time-varying approach, or an applied
unsmoothing parameter weighting (0.4 to 0.6) range. To verify the model, the literature often
refers to research by Giliberto (1992), which reported on a US investor survey which suggests
the true volatility of property to be half that of equities.
For this research, various statistical models were tested and a suitable adjustment was made
to desmooth the annual direct property data9, see Figure 11.
Figure 11 Equity and Property Data Smoothed and Desmoothed Performance: 1985-2012
MeanStandard
DeviationMedian Kurtosis Skewness Range Max Min
Aust Equities 13.1% 20.3% 15.4% 0.65 -0.40 92.6% 52.2% -40.4%
Direct Property
- Actual 10.4% 8.8% 10.6% 0.67 -0.04 38.6% 29.7% -8.9%
- Desmoothed 10.3% 11.5% 10.7% 0.58 -0.26 50.6% 36.0% -14.6%
Figure 11 detailed the proposed adjustment to the valuation based commercial property data.
The actual and desmoothed average returns are similar whilst the desmoothed property data
volatility (standard deviation) increases by 31% to 11.5%. Likewise, the desmoothed property
data range is amplified by a similar 31% amount.
Figure 12 plots the rolling annual performance of the leading local investment asset classes:
equities, bonds and the desmoothed commercial property returns. On the graph, inflation data
is shown to demonstrate over time the impact of consumer price movement on the asset
classes.
9 A parameter weighting of 0.4 provided a suitable adjustment to desmooth the annual direct property
data.
14
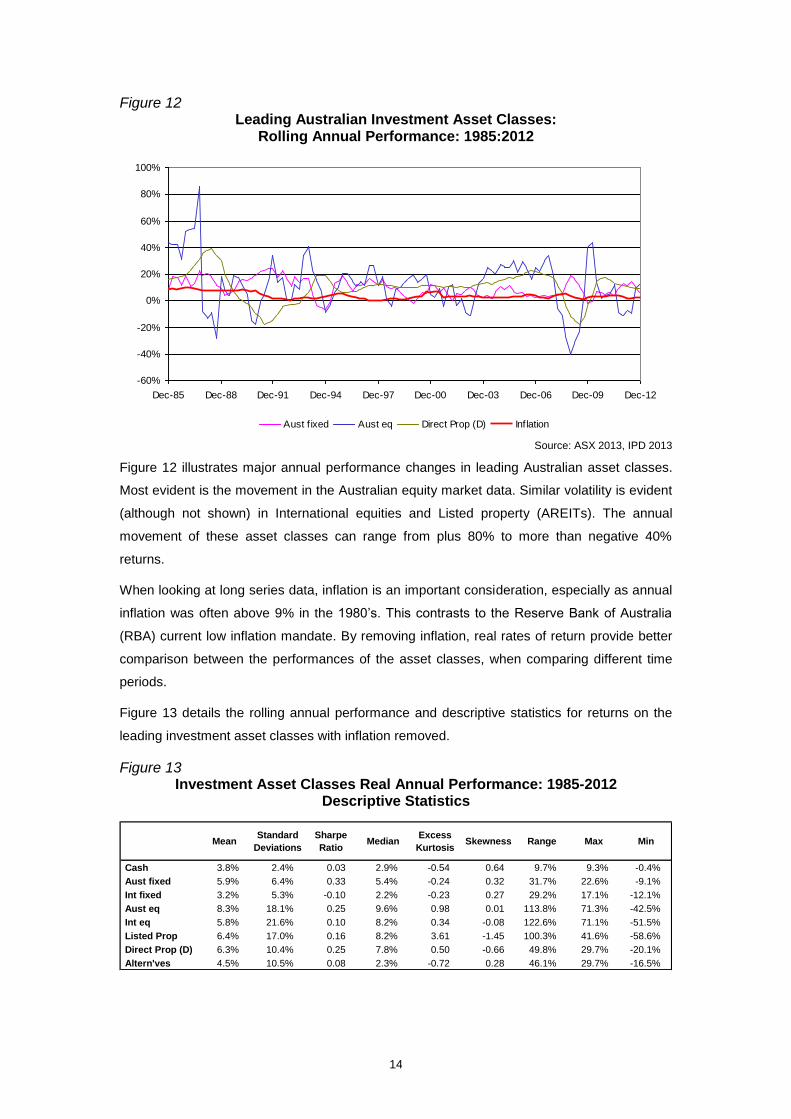
Figure 12 Leading Australian Investment Asset Classes:
Rolling Annual Performance: 1985:2012
-60%
-40%
-20%
0%
20%
40%
60%
80%
100%
Dec-85 Dec-88 Dec-91 Dec-94 Dec-97 Dec-00 Dec-03 Dec-06 Dec-09 Dec-12
Aust f ixed Aust eq Direct Prop (D) Inflation
Source: ASX 2013, IPD 2013
Figure 12 illustrates major annual performance changes in leading Australian asset classes.
Most evident is the movement in the Australian equity market data. Similar volatility is evident
(although not shown) in International equities and Listed property (AREITs). The annual
movement of these asset classes can range from plus 80% to more than negative 40%
returns.
When looking at long series data, inflation is an important consideration, especially as annual
inflation was often above 9% in the 1980’s. This contrasts to the Reserve Bank of Australia
(RBA) current low inflation mandate. By removing inflation, real rates of return provide better
comparison between the performances of the asset classes, when comparing different time
periods.
Figure 13 details the rolling annual performance and descriptive statistics for returns on the
leading investment asset classes with inflation removed.
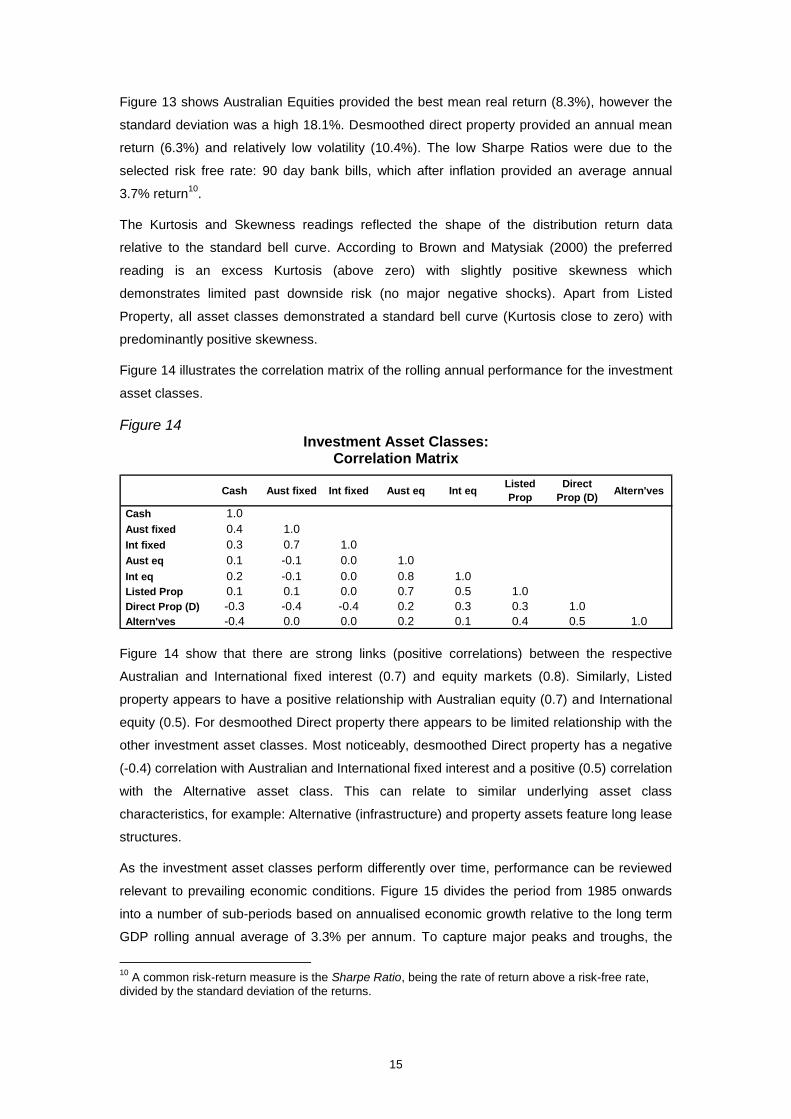
Figure 13 Investment Asset Classes Real Annual Performance: 1985-2012
Descriptive Statistics
MeanStandard
Deviations
Sharpe
RatioMedian
Excess
KurtosisSkewness Range Max Min
Cash 3.8% 2.4% 0.03 2.9% -0.54 0.64 9.7% 9.3% -0.4%
Aust fixed 5.9% 6.4% 0.33 5.4% -0.24 0.32 31.7% 22.6% -9.1%
Int fixed 3.2% 5.3% -0.10 2.2% -0.23 0.27 29.2% 17.1% -12.1%
Aust eq 8.3% 18.1% 0.25 9.6% 0.98 0.01 113.8% 71.3% -42.5%
Int eq 5.8% 21.6% 0.10 8.2% 0.34 -0.08 122.6% 71.1% -51.5%
Listed Prop 6.4% 17.0% 0.16 8.2% 3.61 -1.45 100.3% 41.6% -58.6%
Direct Prop (D) 6.3% 10.4% 0.25 7.8% 0.50 -0.66 49.8% 29.7% -20.1%
Altern'ves 4.5% 10.5% 0.08 2.3% -0.72 0.28 46.1% 29.7% -16.5%
15
Figure 13 shows Australian Equities provided the best mean real return (8.3%), however the
standard deviation was a high 18.1%. Desmoothed direct property provided an annual mean
return (6.3%) and relatively low volatility (10.4%). The low Sharpe Ratios were due to the
selected risk free rate: 90 day bank bills, which after inflation provided an average annual
3.7% return10
.
The Kurtosis and Skewness readings reflected the shape of the distribution return data
relative to the standard bell curve. According to Brown and Matysiak (2000) the preferred
reading is an excess Kurtosis (above zero) with slightly positive skewness which
demonstrates limited past downside risk (no major negative shocks). Apart from Listed
Property, all asset classes demonstrated a standard bell curve (Kurtosis close to zero) with
predominantly positive skewness.
Figure 14 illustrates the correlation matrix of the rolling annual performance for the investment
asset classes.
Figure 14 Investment Asset Classes:
Correlation Matrix
Cash Aust fixed Int fixed Aust eq Int eqListed
Prop
Direct
Prop (D)Altern'ves
Cash 1.0
Aust fixed 0.4 1.0
Int fixed 0.3 0.7 1.0
Aust eq 0.1 -0.1 0.0 1.0
Int eq 0.2 -0.1 0.0 0.8 1.0
Listed Prop 0.1 0.1 0.0 0.7 0.5 1.0
Direct Prop (D) -0.3 -0.4 -0.4 0.2 0.3 0.3 1.0
Altern'ves -0.4 0.0 0.0 0.2 0.1 0.4 0.5 1.0
Figure 14 show that there are strong links (positive correlations) between the respective
Australian and International fixed interest (0.7) and equity markets (0.8). Similarly, Listed
property appears to have a positive relationship with Australian equity (0.7) and International
equity (0.5). For desmoothed Direct property there appears to be limited relationship with the
other investment asset classes. Most noticeably, desmoothed Direct property has a negative
(-0.4) correlation with Australian and International fixed interest and a positive (0.5) correlation
with the Alternative asset class. This can relate to similar underlying asset class
characteristics, for example: Alternative (infrastructure) and property assets feature long lease
structures.
As the investment asset classes perform differently over time, performance can be reviewed
relevant to prevailing economic conditions. Figure 15 divides the period from 1985 onwards
into a number of sub-periods based on annualised economic growth relative to the long term
GDP rolling annual average of 3.3% per annum. To capture major peaks and troughs, the
10
A common risk-return measure is the Sharpe Ratio, being the rate of return above a risk-free rate, divided by the standard deviation of the returns.
16
selected periods shows defined periods of growth and recession in the Australian economy.
For literature business cycle theory and measurement, see Pagan (1997).
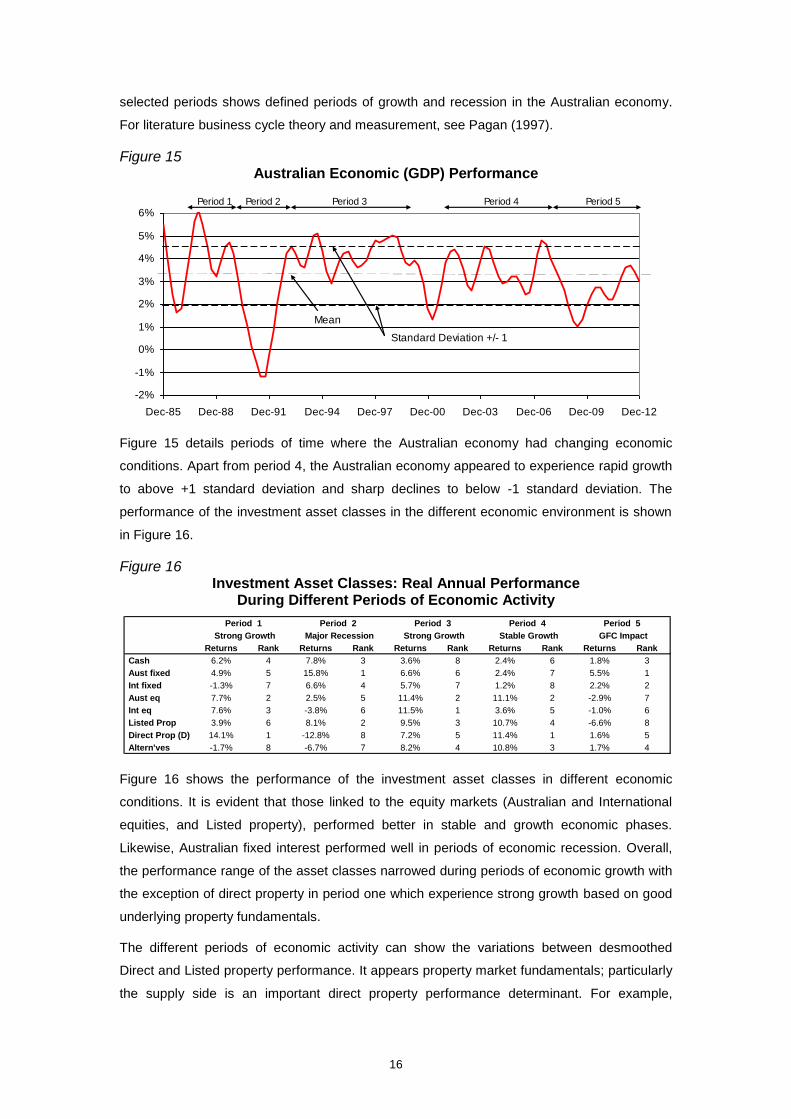
Figure 15 Australian Economic (GDP) Performance
-2%
-1%
0%
1%
2%
3%
4%
5%
6%
Dec-85 Dec-88 Dec-91 Dec-94 Dec-97 Dec-00 Dec-03 Dec-06 Dec-09 Dec-12
Mean
Period 1 Period 2 Period 3 Period 4 Period 5
Standard Deviation +/- 1
Figure 15 details periods of time where the Australian economy had changing economic
conditions. Apart from period 4, the Australian economy appeared to experience rapid growth
to above +1 standard deviation and sharp declines to below -1 standard deviation. The
performance of the investment asset classes in the different economic environment is shown
in Figure 16.
Figure 16 Investment Asset Classes: Real Annual Performance
During Different Periods of Economic Activity
Returns Rank Returns Rank Returns Rank Returns Rank Returns Rank
Cash 6.2% 4 7.8% 3 3.6% 8 2.4% 6 1.8% 3
Aust fixed 4.9% 5 15.8% 1 6.6% 6 2.4% 7 5.5% 1
Int fixed -1.3% 7 6.6% 4 5.7% 7 1.2% 8 2.2% 2
Aust eq 7.7% 2 2.5% 5 11.4% 2 11.1% 2 -2.9% 7
Int eq 7.6% 3 -3.8% 6 11.5% 1 3.6% 5 -1.0% 6
Listed Prop 3.9% 6 8.1% 2 9.5% 3 10.7% 4 -6.6% 8
Direct Prop (D) 14.1% 1 -12.8% 8 7.2% 5 11.4% 1 1.6% 5
Altern'ves -1.7% 8 -6.7% 7 8.2% 4 10.8% 3 1.7% 4
Period 5
Strong Growth Major Recession Strong Growth Stable Growth GFC Impact
Period 1 Period 2 Period 3 Period 4
Figure 16 shows the performance of the investment asset classes in different economic
conditions. It is evident that those linked to the equity markets (Australian and International
equities, and Listed property), performed better in stable and growth economic phases.
Likewise, Australian fixed interest performed well in periods of economic recession. Overall,
the performance range of the asset classes narrowed during periods of economic growth with
the exception of direct property in period one which experience strong growth based on good
underlying property fundamentals.
The different periods of economic activity can show the variations between desmoothed
Direct and Listed property performance. It appears property market fundamentals; particularly
the supply side is an important direct property performance determinant. For example,
17
Australian office supply is slow to adjust during periods of economic recession; period 2 and
the GFC impact period 5. According to PCA (2013a), Australian office stock increased by an
estimated 6.3% per annum in period 2 and 2.7% in period 5 compared to the long term 2.3%
annual average. The increased office supply is partly responsible for the poor Direct property
performance in period 2 (-12.8% per annum) and to a lesser extent in period 5 (1.6% per
annum). This highlights how underlying property characteristics (new supply), separate from
economic conditions, can impact direct property performance.
During the cyclical phases covering periods two, three and four, Listed property performance
remained relatively stable (8.1% – 10.7%) compared to the changing economic environment.
This may relate to the changing AREIT market structure, for example: during these periods,
AREITs embraced offshore property exposure, increased debt and pursued development and
fund management opportunities. The low returns in period five highlight the move back to
relatively low geared, Australian property focused AREITs.
Standard return and risk performance measures can overlook outlier risk. One approach to
dealing with this is to measure individual asset performance relative to that of the overall
investment universe (all data) returns. Figure 17 details the standard deviation measure for
the rolling annual investment returns, where +/- 2 standard deviations can be considered an
outlier.
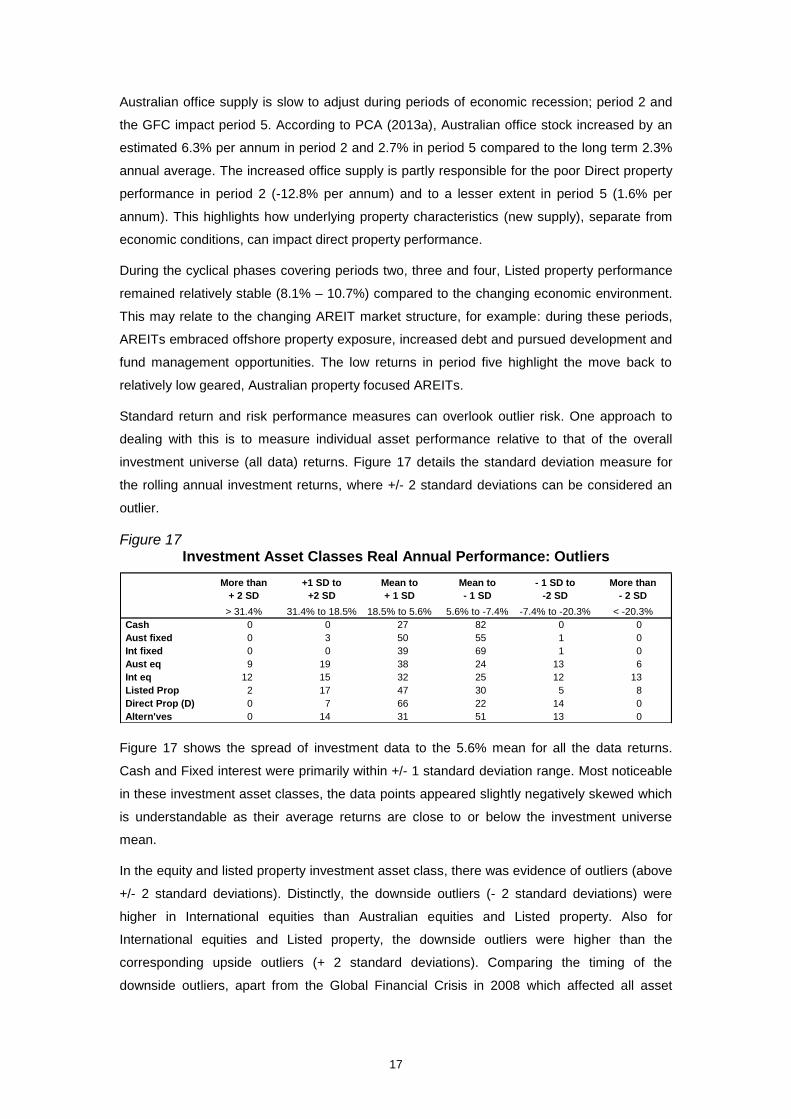
Figure 17 Investment Asset Classes Real Annual Performance: Outliers
More than
+ 2 SD
+1 SD to
+2 SD
Mean to
+ 1 SD
Mean to
- 1 SD
- 1 SD to
-2 SD
More than
- 2 SD
> 31.4% 31.4% to 18.5% 18.5% to 5.6% 5.6% to -7.4% -7.4% to -20.3% < -20.3%
Cash 0 0 27 82 0 0
Aust fixed 0 3 50 55 1 0
Int fixed 0 0 39 69 1 0
Aust eq 9 19 38 24 13 6
Int eq 12 15 32 25 12 13
Listed Prop 2 17 47 30 5 8
Direct Prop (D) 0 7 66 22 14 0
Altern'ves 0 14 31 51 13 0
Figure 17 shows the spread of investment data to the 5.6% mean for all the data returns.
Cash and Fixed interest were primarily within +/- 1 standard deviation range. Most noticeable
in these investment asset classes, the data points appeared slightly negatively skewed which
is understandable as their average returns are close to or below the investment universe
mean.
In the equity and listed property investment asset class, there was evidence of outliers (above
+/- 2 standard deviations). Distinctly, the downside outliers (- 2 standard deviations) were
higher in International equities than Australian equities and Listed property. Also for
International equities and Listed property, the downside outliers were higher than the
corresponding upside outliers (+ 2 standard deviations). Comparing the timing of the
downside outliers, apart from the Global Financial Crisis in 2008 which affected all asset
18
classes, individual asset class outliers appears random, with International equities performing
poorly in 2001-02, as an aftermath of the global technological bubble.
Desmoothed Direct property and the Alternative asset class demonstrated solid returns within
the +/- 2 standard deviation range. Property appears to have a narrower range with a high
number of readings between the mean and +1 standard deviation. This compares to the
Alternative asset class data which seems to be unevenly spread with higher negative returns
to the universal mean.
4. Debt and Property Investment Markets
Investment grade property assets are generally large in terms of capital price. This high value
threshold means that direct property investment requires considerably higher levels of capital
investment. Using only equity finance can limit investor opportunities for a diversified portfolio
and lead to high specific property risk. Drawing upon debt finance enables available equity
funds to be used across a range of investments and achieve diversification benefits. Such
leverage can enhance expected returns as long as the return on investment exceeds cost of
debt, although overall portfolio risk is amplified along with the volatility of equity returns on the
specific property asset. Debt finance conditions placed on the property asset must be met to
avoid default and its consequences.
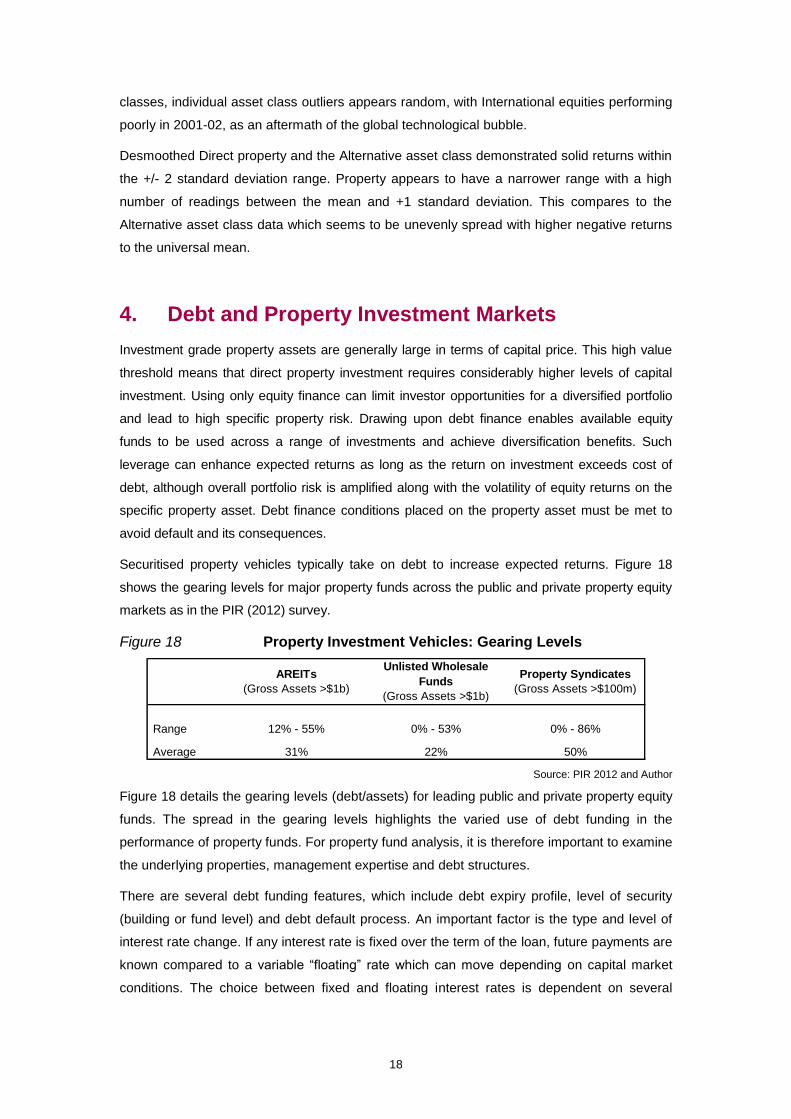
Securitised property vehicles typically take on debt to increase expected returns. Figure 18
shows the gearing levels for major property funds across the public and private property equity
markets as in the PIR (2012) survey.
Figure 18 Property Investment Vehicles: Gearing Levels
Range
Average
0% - 86%
50%
12% - 55%
31% 22%
0% - 53%
AREITs
(Gross Assets >$1b)
Unlisted Wholesale
Funds
(Gross Assets >$1b)
Property Syndicates
(Gross Assets >$100m)
Source: PIR 2012 and Author
Figure 18 details the gearing levels (debt/assets) for leading public and private property equity
funds. The spread in the gearing levels highlights the varied use of debt funding in the
performance of property funds. For property fund analysis, it is therefore important to examine
the underlying properties, management expertise and debt structures.
There are several debt funding features, which include debt expiry profile, level of security
(building or fund level) and debt default process. An important factor is the type and level of
interest rate change. If any interest rate is fixed over the term of the loan, future payments are
known compared to a variable “floating” rate which can move depending on capital market
conditions. The choice between fixed and floating interest rates is dependent on several
19
factors, including the economic and financial environment and debt pricing mechanism
adopted by the financier.
Generally, debt pricing for commercial property loans are set at a margin above a published
benchmark interest rate. The most common referenced interest rate is the short term bank bill
rate and the 6 month Bank Bill Swap (BBSW) rate. The margin above is the compensation
required by the lender for default risk. This can vary considerably across loans and depends
on capital market conditions, debt level, mortgage covenants, type of security etc.
In the competitive banking environment, information on commercial property interest rates is
sensitive data and difficult to source. The RBA (2013) publish a long series for the indicative
house lending rate which for this research can be a proxy for movement over time in the
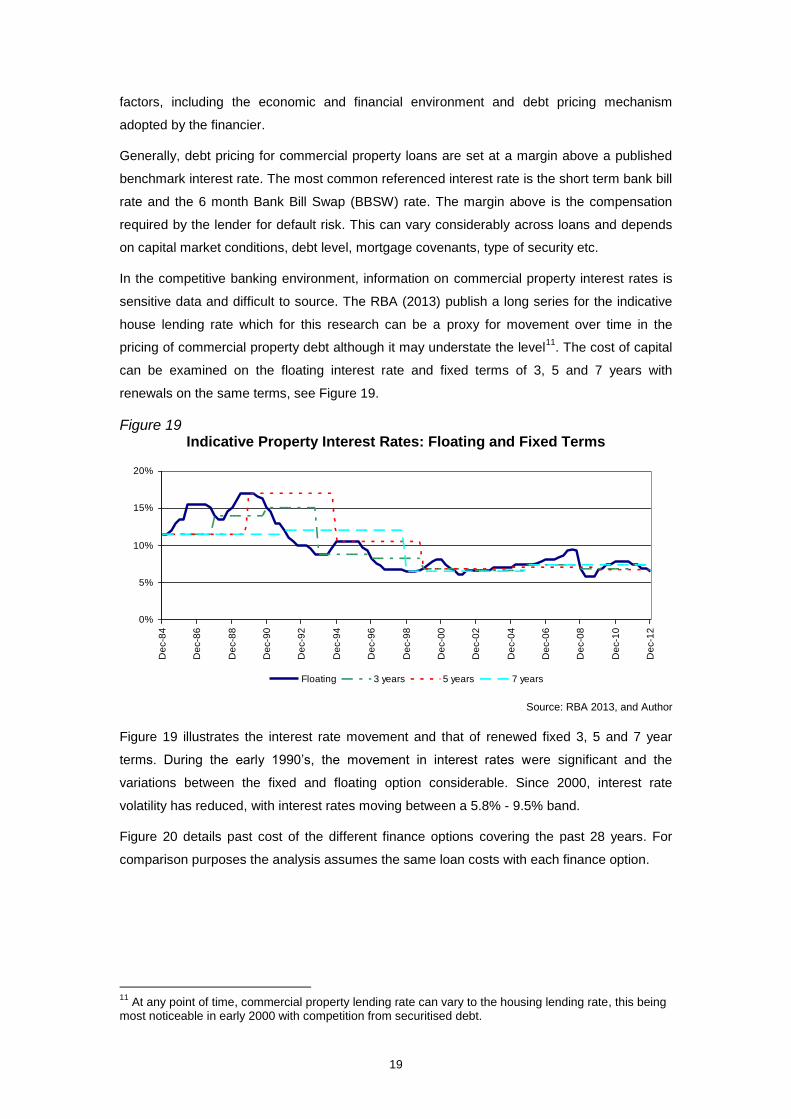
pricing of commercial property debt although it may understate the level11
. The cost of capital
can be examined on the floating interest rate and fixed terms of 3, 5 and 7 years with
renewals on the same terms, see Figure 19.
Figure 19 Indicative Property Interest Rates: Floating and Fixed Terms
0%
5%
10%
15%
20%
De
c-8
4
De
c-8
6
De
c-8
8
De
c-9
0
De
c-9
2
De
c-9
4
De
c-9
6
De
c-9
8
De
c-0
0
De
c-0
2
De
c-0
4
De
c-0
6
De
c-0
8
De
c-1
0
De
c-1
2
Floating 3 years 5 years 7 years
Source: RBA 2013, and Author
Figure 19 illustrates the interest rate movement and that of renewed fixed 3, 5 and 7 year
terms. During the early 1990’s, the movement in interest rates were significant and the
variations between the fixed and floating option considerable. Since 2000, interest rate
volatility has reduced, with interest rates moving between a 5.8% - 9.5% band.
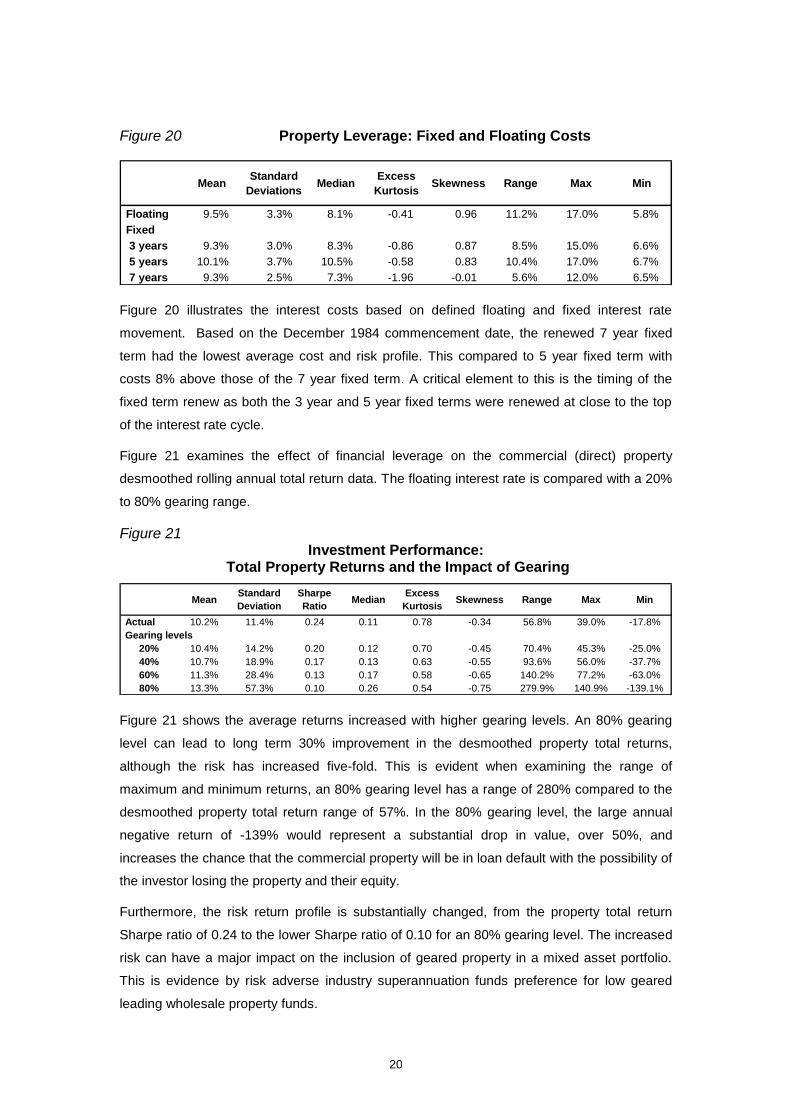
Figure 20 details past cost of the different finance options covering the past 28 years. For
comparison purposes the analysis assumes the same loan costs with each finance option.
11
At any point of time, commercial property lending rate can vary to the housing lending rate, this being most noticeable in early 2000 with competition from securitised debt.
20
Figure 20 Property Leverage: Fixed and Floating Costs
MeanStandard
DeviationsMedian
Excess
KurtosisSkewness Range Max Min
Floating 9.5% 3.3% 8.1% -0.41 0.96 11.2% 17.0% 5.8%
Fixed
3 years 9.3% 3.0% 8.3% -0.86 0.87 8.5% 15.0% 6.6%
5 years 10.1% 3.7% 10.5% -0.58 0.83 10.4% 17.0% 6.7%
7 years 9.3% 2.5% 7.3% -1.96 -0.01 5.6% 12.0% 6.5% Figure 20 illustrates the interest costs based on defined floating and fixed interest rate
movement. Based on the December 1984 commencement date, the renewed 7 year fixed
term had the lowest average cost and risk profile. This compared to 5 year fixed term with
costs 8% above those of the 7 year fixed term. A critical element to this is the timing of the
fixed term renew as both the 3 year and 5 year fixed terms were renewed at close to the top
of the interest rate cycle.
Figure 21 examines the effect of financial leverage on the commercial (direct) property
desmoothed rolling annual total return data. The floating interest rate is compared with a 20%
to 80% gearing range.
Figure 21 Investment Performance:
Total Property Returns and the Impact of Gearing
MeanStandard
Deviation
Sharpe
RatioMedian
Excess
KurtosisSkewness Range Max Min
Actual 10.2% 11.4% 0.24 0.11 0.78 -0.34 56.8% 39.0% -17.8%
Gearing levels
20% 10.4% 14.2% 0.20 0.12 0.70 -0.45 70.4% 45.3% -25.0%
40% 10.7% 18.9% 0.17 0.13 0.63 -0.55 93.6% 56.0% -37.7%
60% 11.3% 28.4% 0.13 0.17 0.58 -0.65 140.2% 77.2% -63.0%
80% 13.3% 57.3% 0.10 0.26 0.54 -0.75 279.9% 140.9% -139.1%
Figure 21 shows the average returns increased with higher gearing levels. An 80% gearing
level can lead to long term 30% improvement in the desmoothed property total returns,
although the risk has increased five-fold. This is evident when examining the range of
maximum and minimum returns, an 80% gearing level has a range of 280% compared to the
desmoothed property total return range of 57%. In the 80% gearing level, the large annual
negative return of -139% would represent a substantial drop in value, over 50%, and
increases the chance that the commercial property will be in loan default with the possibility of
the investor losing the property and their equity.
Furthermore, the risk return profile is substantially changed, from the property total return
Sharpe ratio of 0.24 to the lower Sharpe ratio of 0.10 for an 80% gearing level. The increased
risk can have a major impact on the inclusion of geared property in a mixed asset portfolio.
This is evidence by risk adverse industry superannuation funds preference for low geared
leading wholesale property funds.
21
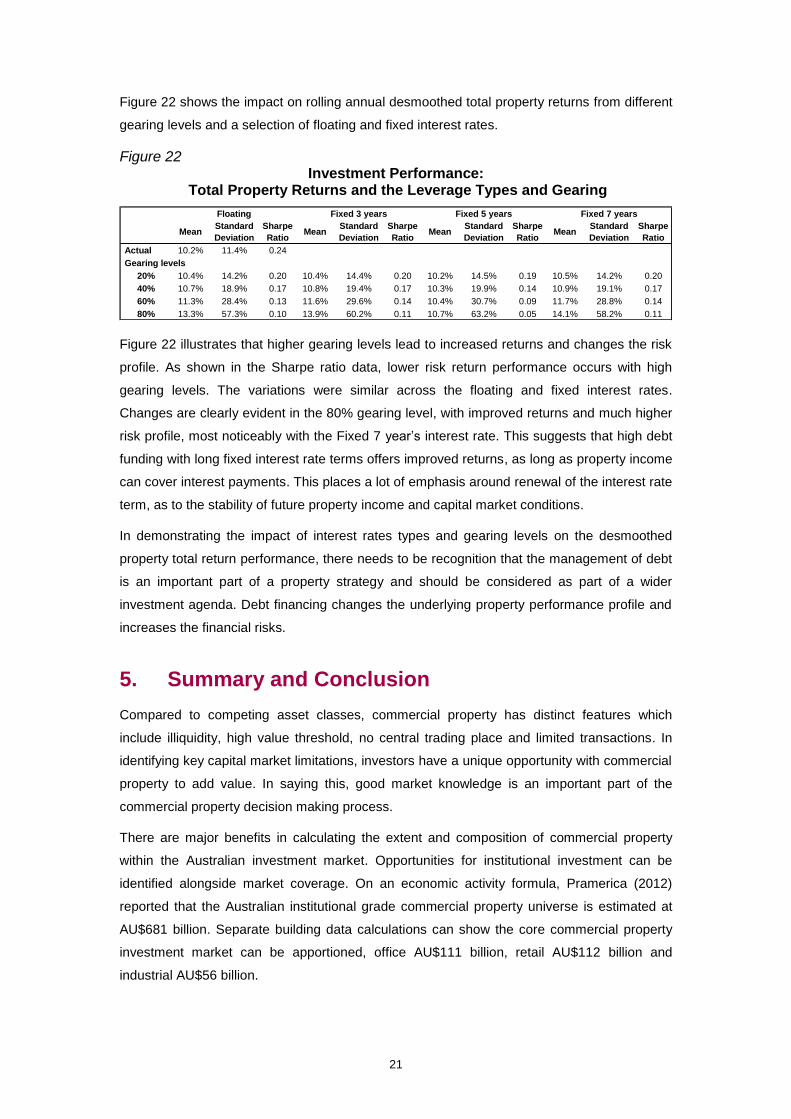
Figure 22 shows the impact on rolling annual desmoothed total property returns from different
gearing levels and a selection of floating and fixed interest rates.
Figure 22 Investment Performance:
Total Property Returns and the Leverage Types and Gearing
MeanStandard
Deviation
Sharpe
RatioMean
Standard
Deviation
Sharpe
RatioMean
Standard
Deviation
Sharpe
RatioMean
Standard
Deviation
Sharpe
Ratio
Actual 10.2% 11.4% 0.24
Gearing levels
20% 10.4% 14.2% 0.20 10.4% 14.4% 0.20 10.2% 14.5% 0.19 10.5% 14.2% 0.20
40% 10.7% 18.9% 0.17 10.8% 19.4% 0.17 10.3% 19.9% 0.14 10.9% 19.1% 0.17
60% 11.3% 28.4% 0.13 11.6% 29.6% 0.14 10.4% 30.7% 0.09 11.7% 28.8% 0.14
80% 13.3% 57.3% 0.10 13.9% 60.2% 0.11 10.7% 63.2% 0.05 14.1% 58.2% 0.11
Floating Fixed 3 years Fixed 5 years Fixed 7 years
Figure 22 illustrates that higher gearing levels lead to increased returns and changes the risk
profile. As shown in the Sharpe ratio data, lower risk return performance occurs with high
gearing levels. The variations were similar across the floating and fixed interest rates.
Changes are clearly evident in the 80% gearing level, with improved returns and much higher
risk profile, most noticeably with the Fixed 7 year’s interest rate. This suggests that high debt
funding with long fixed interest rate terms offers improved returns, as long as property income
can cover interest payments. This places a lot of emphasis around renewal of the interest rate
term, as to the stability of future property income and capital market conditions.
In demonstrating the impact of interest rates types and gearing levels on the desmoothed
property total return performance, there needs to be recognition that the management of debt
is an important part of a property strategy and should be considered as part of a wider
investment agenda. Debt financing changes the underlying property performance profile and
increases the financial risks.
5. Summary and Conclusion
Compared to competing asset classes, commercial property has distinct features which
include illiquidity, high value threshold, no central trading place and limited transactions. In
identifying key capital market limitations, investors have a unique opportunity with commercial
property to add value. In saying this, good market knowledge is an important part of the
commercial property decision making process.
There are major benefits in calculating the extent and composition of commercial property
within the Australian investment market. Opportunities for institutional investment can be
identified alongside market coverage. On an economic activity formula, Pramerica (2012)
reported that the Australian institutional grade commercial property universe is estimated at
AU$681 billion. Separate building data calculations can show the core commercial property
investment market can be apportioned, office AU$111 billion, retail AU$112 billion and
industrial AU$56 billion.

22
As illiquidity and high entry costs limits direct property investment opportunities, securitisation
offers extensive diversification benefits. Securitised property vehicles can be placed into four
capital market categories, according to whether they are traded on the public or private
markets and if they are either equity or debt assets. As at December 2012, the estimated size
of the Australian investment market is AU$6.9 trillion of which the Australian commercial
property component represents AU$354 billion (approximately 5%). The property debt market
is dominated by private debt (AU$165 billion) with the publicly equity market (Real Estate
Investment Trusts) share at AU$89 billion.
Whilst the performance of asset classes are generally based on transaction measured
indices, direct property performance is sourced from valuation based indices which have an
artificially reduced volatility when compared to transaction based indices. Based on statistical
analysis, the appraisal calculated PCA/IPD composite property index can be desmoothed,
increasing volatility by 31%. Over a long 28 years data series (1985-2012), with inflation
removed, desmoothing property is shown to be one of the best risk-adjusted performers (joint
second) of the eight leading investment asset classes, although this can vary depending on
economic conditions and levels of new supply.
A high value threshold means that direct property investment requires significant levels of
capital investment. This can be achieved by increased equity leading to high specific property
risk or debt financing part of the property investment. Whilst debt funding can improve property
investment returns, it substantially increases the risk levels. Over the 1985-2012 period, an
80% gearing level can lead to a 30% improvement in the property total returns, although the
risk is increased five-fold and can lead to a wide 280% performance range.
In demonstrating the impact of gearing levels on desmoothed total property return
performance, there needs to be recognition that the management of debt is an important part
of a property strategy and considered as part of a wider investment agenda. Debt financing
changes the underlying property performance profile and increases the financial risks.
6. References
APRA, 2013, APRA Statistics: Quarterly Authorised Deposit-taking Institution Property Exposures, Australian Prudential Regulation Authority, Sydney.
ASX, 2013, Media Release: 2012 ASX year-end Statistics, Australian Stock Exchange, Sydney.
Baum A, 2009, Commercial Real Estate Investment: A Strategic Approach, 2nd
edition, EG Books, Oxford.
Bond S and Hwang S, 2005, A Measure of Fundamental Volatility in the Commercial Property Market, Real Estate Economics, Vol.31, p577-600.
Brounen D and Eichholtz P, 2003, Property, Common Stock and Property Shares: Increased Potential for Diversification, Journal of Portfolio Management, Special Real Estate Issue, p129-137.
23
Brown G and Matysiak G, 2000, Real Estate Investment: A Capital Market Approach, Financial Times, London.
Geltner D, Millar N, Clayton J and Eichholtz P, 2007, Commercial Real Estate: Analysis and Investments, Prentice Hall, New Jersey.
Giliberto M, 1992, Real Estate Risk and Returns: 1991 Survey Results, Real Estate Research papers, Salomon Brothers Inc, New York.
Higgins D, 2005, Modelling the Australian Property Investment Universe: A Preliminary Study. Pacific Rim Property Research Journal, Vol. 11, p268-281.
Higgins D, 2008, Placing Commercial Property in the Australian Capital Markets, Australian and New Zealand Property Journal, Vol.1, p9-13.
Liang Y and McIntosh W, 1999, Global Commercial Real Estate, Prudential Real Estate Investors, New Jersey.
Marcato G and Key T, 2007, Smoothing and Implications for Asset Allocation Choices, Journal of Portfolio Management, Vol.33, p85-99.
Pagan A, (1997), Towards an Understanding of Some Business Cycle Characteristics, The Australian Economic Review, Vol. 30, No 1, p 1-15.
Pramerica, 2012, A Bird’s Eye View of Global Real Estate Markets: 2012 edition, Prudential Real Estate Investors, New Jersey.
PIR, 2012, Australian Property Fund Industry Survey: 2012, Property Investment Research, Sydney.
Rowland P, 2009, Australian Property Investment and Financing, Lawbook Co, Sydney.
Acknowledgments
The Author would like to thank Professor Kevin Davis and Martin Jenkinson (ACFS) for helpful manuscript reviews.