Embed Size (px)
Citation preview

Australia’s leading total waste management company
Macquarie Australia Conference Presentation - 3 May 2018
Vik Bansal – CEO and Managing DirectorASX: CWY
For
per
sona
l use
onl
y

Dynamics of a successful player in the waste management industry
High marginal contribution
Recurring revenue Momentum business with multi-year contracts – price escalation related to cost inflation
Network economics are ‘king’
Footprint & Multiple Waste
Streams
Revenue, costs and competitive dynamics vary market by market, multiple waste streams
Regulatory change which provides barrier to entry
Mix of ‘2 worlds’ – Utility
like front end
Large enterprise-level selling contrasted against mass market, consumer-like selling
SME Customers Low share of mind share
Infrastructure back end
Highly Valued Infrastructure back end – long term prized assets
Strategic Moat
2
Sustainability 360 view of performance – sustainability for Customers, Shareholders, Employees
and Society/Environment
For
per
sona
l use
onl
y

3
As Australia’s leading waste management company Cleanaway has built a complete asset base and services portfolio
4,000+Employees
3,000+Vehicles
~200 Sites Australia wide
90+ Municipal Councils
~120,000Commercial & Industrial
Customers
~550 million litresWaste Liquids collected
and processed
~130 million litresWaste Mineral Oil collected
for processing
90m+ kWhRenewable energy generated
~230,000 tonnesPaper and cardboard recycled
~10,000 tonnesPlastic packaging recycled
~13,000 tonnesSteel recycled
Note: Excludes Toxfree acquisition
90+Licensed infrastructure assets
For
per
sona
l use
onl
y

Currently, our reporting segments comprise
Solids Collections Solids Post Collections Liquids and Industrial Services
Largest solid waste services fleet and widest network across Australia
Over 120,000 customers ranging from local small business to large national corporates across all industries
Servicing over 90 Councils and 2 million residences per week
Landfill assets located in every mainland state of Australia
Growing network of transfer stations across Australia
Gas generated from landfills used to produce over 90 million kWh of renewable energy
Growing base of resource recovery assets across Australia
Largest collector and processor of waste liquids in Australia
Largest hydrocarbon recycler in Australia
Largest provider of a wide range of environmentally focussed industrial services in Australia
4
For
per
sona
l use
onl
y

Three years ago we started our journey from a good to great company
5
For
per
sona
l use
onl
y
6
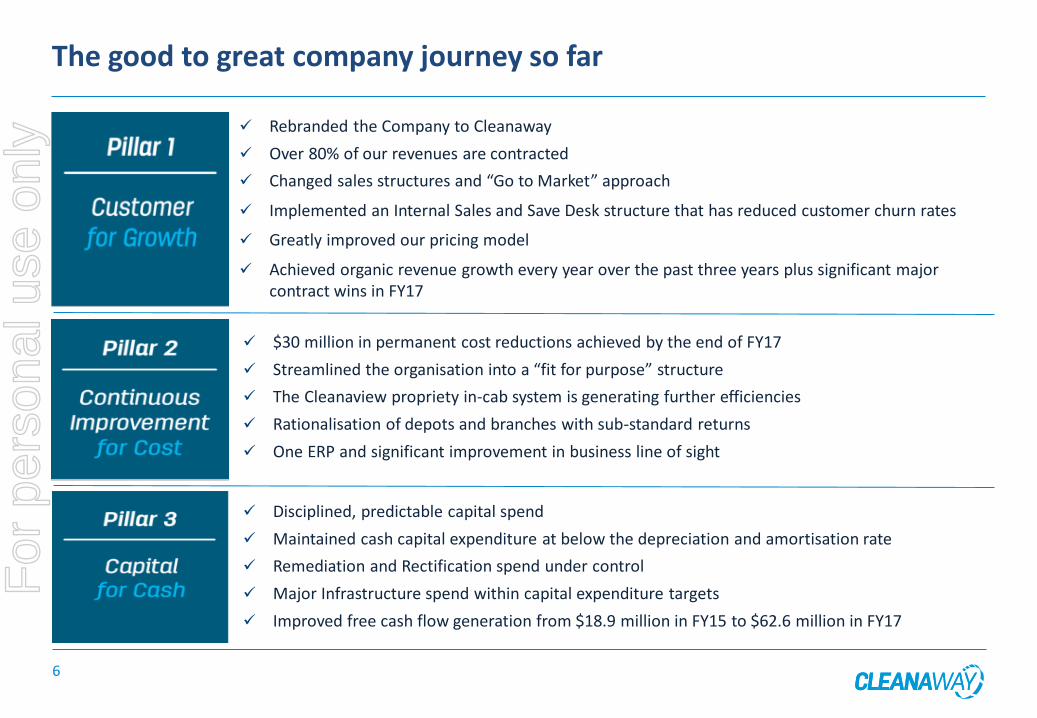
✓ Rebranded the Company to Cleanaway
✓ Over 80% of our revenues are contracted
✓ Changed sales structures and “Go to Market” approach
✓ Implemented an Internal Sales and Save Desk structure that has reduced customer churn rates
✓ Greatly improved our pricing model
✓ Achieved organic revenue growth every year over the past three years plus significant major contract wins in FY17
✓ $30 million in permanent cost reductions achieved by the end of FY17
✓ Streamlined the organisation into a “fit for purpose” structure
✓ The Cleanaview propriety in-cab system is generating further efficiencies
✓ Rationalisation of depots and branches with sub-standard returns
✓ One ERP and significant improvement in business line of sight
✓ Disciplined, predictable capital spend
✓ Maintained cash capital expenditure at below the depreciation and amortisation rate
✓ Remediation and Rectification spend under control
✓ Major Infrastructure spend within capital expenditure targets
✓ Improved free cash flow generation from $18.9 million in FY15 to $62.6 million in FY17
The good to great company journey so farF
or p
erso
nal u
se o
nly
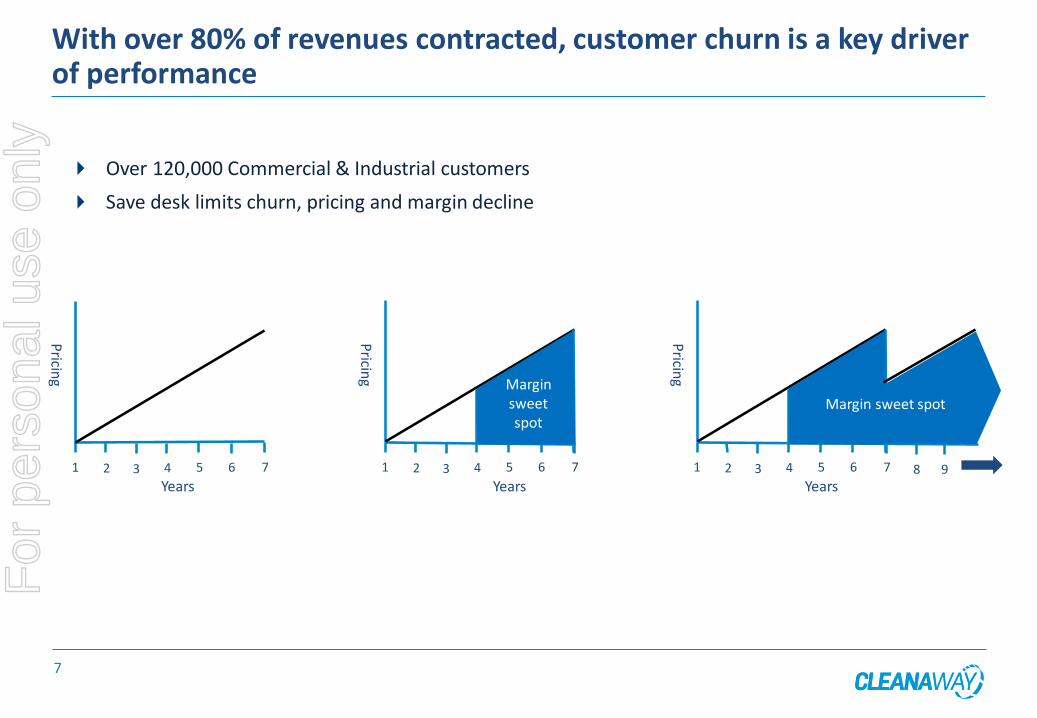
With over 80% of revenues contracted, customer churn is a key driver of performance
Over 120,000 Commercial & Industrial customers
Save desk limits churn, pricing and margin decline
1 2 3 4 5 6 7
Years
Pricin
g
Years1 2 3 4 5 6 7
Pricin
g
Margin sweet spot
Years1 2 3 4 5 6 7
Pricin
g
8 9
Margin sweet spot
7
For
per
sona
l use
onl
y

Financial performance improving
$1,301.1$1,320.7
$1,350.6
FY15 FY16 FY17
Net Revenue1 ($million)
1.5
1.7
2.1
FY15 FY16 FY17
Dividends (cents)
Notes 1: Gross revenues less landfill levies. 2. Underlying results. 3. Free cash flow defined as cash from operating activities excluding interest and tax less capital expenditure
$231.3
$281.3
$301.3
17.8%
21.3%22.3%
FY15 FY16 FY17
EBITDA2 ($million) and EBITDA margin (%)
$97.5
$122.6
$142.9
7.5%
9.3%
10.6%
FY15 FY16 FY17
EBIT2 ($million) and EBIT margin (%)
$45.7
$63.3
$77.5
3.5%
4.8%5.7%
FY15 FY16 FY17
NPAT2 ($million) and NPAT margin (%)
$18.9
$50.7
$62.6
FY15 FY16 FY17
Free Cash Flow3 ($million)
8
For
per
sona
l use
onl
y

Leading to improved shareholder returns
ASX Code: CWYShare price: $1.59
Market Capitalisation: $3.2 billionIndex: S&P/ASX100
(1 May 2018)
9
Relative share price performanceCleanaway v ASX100 Industrials
1 July 2015 to 1 May 2018
75%
95%
115%
135%
155%
175%
195%
215%
01 Jul 15 01 Oct 15 01 Jan 16 01 Apr 16 01 Jul 16 01 Oct 16 01 Jan 17 01 Apr 17 01 Jul 17 01 Oct 17 01 Jan 18 01 Apr 18
Cleanaway S&P/ASX100 Industrials
+113.0%
+1.6%
For
per
sona
l use
onl
y

Collections Resource recoveryLandfill/alternative
waste disposal
Operational efficiency
Strong market share position by region leading to route density
Pricing
Customer churn management
Access to strategic resource recovery facilities
Scale of collections
Agile optimisation of materials flow
Ability to adapt to a changing regulatory outlook
Well located prized assets
Long term planning and reinvestment based on supply/demand
Optimisation of flows between landfill/alternative waste disposal and resource recovery
Investing in the right ‘package’ of assets for us to compete effectively and extract maximum returns across the value chain
We will extract maximum value through the value chain
Optimising the waste value chain - Cleanaway Footprint 2025
10
The Toxfree acquisition accelerates the implementation of the Footprint 2025 strategy
For
per
sona
l use
onl
y

Prized infrastructure assets completed during the last 24 months or in construction stage
New paper recycling facility and transfer station acquired
Brisbane
Sydney
Melbourne
AdelaidePerth
New transfer station and material recycling facility.Scheduled completion 2H18
3 transfer stations and resource recovery facilities following acquisition of SA Waste in July 2017
Engineering upgrade to oil recycling facility improving product quality
Ownership of 100% of base oil recycling facility in Rutherford and engineering upgrade at Wetherill Park refinery to now produce Category 1 base oil
New material recycling facility constructed and transfer station acquired
New transfer station in South East Melbourne
Double electricity generating capacity at MRL
Planning permit for MRL to 2046
11
For
per
sona
l use
onl
y
12
Recycling and the China Sword ProgramF
or p
erso
nal u
se o
nly

13
Cleanaway has limited exposure to the change in the recycling markets
Commercial & Industrial (C&I) and waste oil collections remain the major source of commodities
Cleanaway contracts with Municipals are a mix of collection only (50%)1, collection and on sell the comingled waste to third party sorters or take the material through our own recycling facility
Only 7% of commodity revenues relate to Municipal
Pricing increases to a number of Municipals have commenced
Note 1: Municipals retain risk on commodity end markets
For
per
sona
l use
onl
y

14
Acquisition of Toxfree
The acquisition of Toxfree Solutions was approved by the ACCC on 26 April 2018. The transaction is still subject to customary closing conditions including Toxfree shareholder approval and court approval. We are confidant that all approvals will be received with the scheme expected to become effective on 11 May 2018 and implemented on 25 May 2018.
For
per
sona
l use
onl
y

15
Acquisition of Toxfree
Note: 1. Based on NPAT excluding transaction costs, one-off integration costs and amortisation of acquired identifiable intangibles. The impact of purchase price accounting has not been completed, which will impact future depreciation and amortisation charges. In accordance with AASB 133, Cleanaway standalone EPS has been restated based on an adjustment factor to take into account the bonus element of the entitlement offer launched on 11 December 2017. 2. Free Cash Flow per share defined as operating cash flow excluding interest, tax and one-off transaction and integration costs less capital expenditure, divided by the weighted average number of shares on issue. Cleanaway standalone free cash flow per share has been restated based on an adjustment factor to take into account the bonus element of the Offer 3. Defined as EBIT excluding one-off transaction and integration costs before amortisation of acquired identifiable intangibles divided by the total consideration.
A strategically compelling acquisition
Affirms Cleanaway’s leadership in each of our operating segments by enhancing our existing capabilities
Accelerates the implementation of our Footprint 2025 strategy
Significant capital spend avoided in our Liquids & Industrial Services segment
Provides a leading position in the attractive medical waste sector
Financial impact
Pro forma historical FY17 EPS accretive pre synergies (before amortisation of intangibles and one-off transaction and integration costs)
Assuming full-year annual synergies:
– More than 25% EPS accretive1
– More than 80% Free Cash Flow per share accretive2
– Approximately 10% Pre-tax Return on Invested Capital on the Acquisition3
Synergies
The integration of the Cleanaway and Toxfree businesses is expected to deliver ~$35 million in annual synergies to be realised over 2 years with total synergy benefits fully reflected in FY21
Cleanaway has undertaken due diligence to quantify expected synergy benefits
Estimated one-off integration costs of ~$35 million to be incurred during the 2 year integration process
For
per
sona
l use
onl
y
16
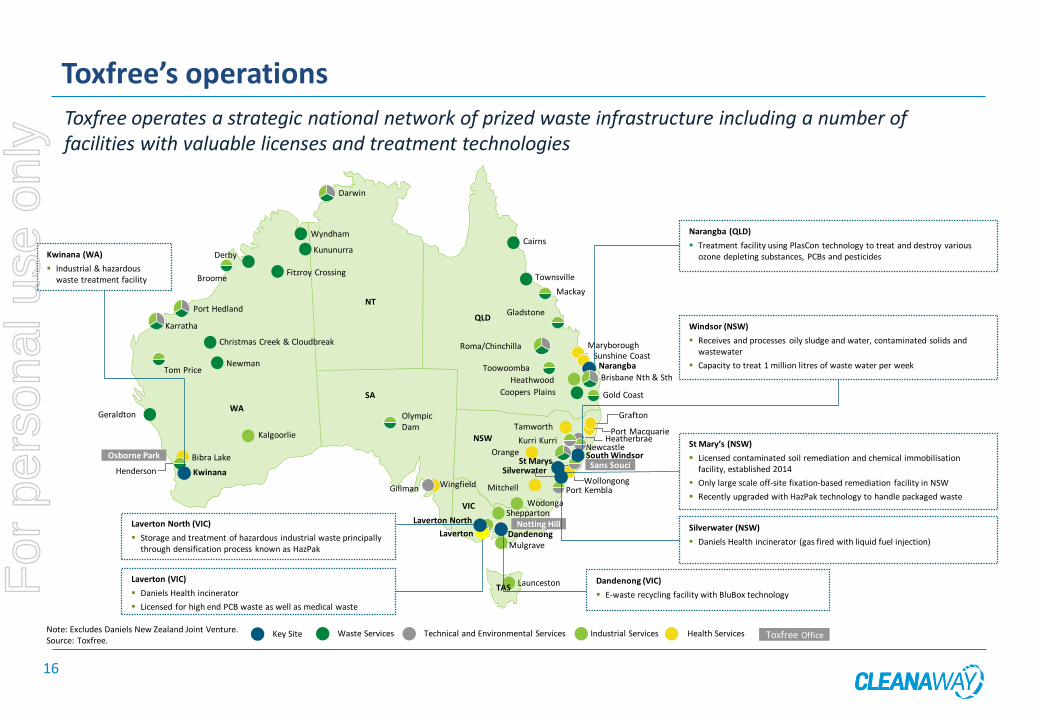
Toxfree’s operations
Toxfree operates a strategic national network of prized waste infrastructure including a number of facilities with valuable licenses and treatment technologies
Note: Excludes Daniels New Zealand Joint Venture.Source: Toxfree.
Narangba (QLD)
▪ Treatment facility using PlasCon technology to treat and destroy various ozone depleting substances, PCBs and pesticides
Windsor (NSW)
▪ Receives and processes oily sludge and water, contaminated solids and wastewater
▪ Capacity to treat 1 million litres of waste water per week
Darwin
NT
SA
WA
QLD
NSW
VIC
Wyndham
Kununurra
Fitzroy Crossing
Derby
Broome
Port Hedland
Karratha
Christmas Creek & Cloudbreak
Newman
Kalgoorlie
Kwinana
Bibra LakeOsborne Park
Geraldton
Tom Price
OlympicDam
WingfieldGillman
Cairns
Townsville
Mackay
Gladstone
Laverton North
Mulgrave
Notting HillDandenong
SheppartonWodonga
Mitchell Port Kembla
Silverwater
South WindsorOrange
Sans Souci
MaryboroughSunshine Coast
Narangba
Heathwood
Gold Coast
Port MacquarieKurri Kurri Heatherbrae
Newcastle
TamworthGrafton
Coopers Plains
Brisbane Nth & SthToowoomba
Roma/Chinchilla
WollongongHenderson
St Marys
LauncestonTAS
Waste Services Technical and Environmental Services Industrial Services Health Services Toxfree OfficeKey Site
St Mary’s (NSW)
▪ Licensed contaminated soil remediation and chemical immobilisation facility, established 2014
▪ Only large scale off‐site fixation‐based remediation facility in NSW
▪ Recently upgraded with HazPak technology to handle packaged waste
Silverwater (NSW)
▪ Daniels Health incinerator (gas fired with liquid fuel injection)
Dandenong (VIC)
▪ E-waste recycling facility with BluBox technology
Laverton (VIC)
▪ Daniels Health incinerator
▪ Licensed for high end PCB waste as well as medical waste
Laverton North (VIC)
▪ Storage and treatment of hazardous industrial waste principally through densification process known as HazPak
Kwinana (WA)
▪ Industrial & hazardous waste treatment facility
Laverton
For
per
sona
l use
onl
y

17
Acquisition is “in country, in sector and in our operating space” enhancing most core parts of the Company
5,550+Employees
3,900+Vehicles
~252 Sites Australia wide
90+ Municipal Councils
~140,000Commercial & Industrial
Customers
~680 million litresWaste Liquids collected
and processed
~140 million litresWaste Mineral Oil collected
for processing
90m+ kWhRenewable energy generated
~245,000 tonnesPaper and cardboard recycled
~11,000 tonnesPlastic packaging recycled
~14,000 tonnesSteel recycled
119+Licensed infrastructure assets
+39%
+32%+30%
+24%+8%
+17%
+7% +10% +8%
For
per
sona
l use
onl
y

18
Reducing risk via multiple sector exposures
Consolidates and balances:
Increase in QLD footprint where Cleanaway is relatively underweight
Strengthens Cleanaway’s position in regional areas of WA – resources exposed
Internalisation and waste diversion
Consolidates, re-weights and adds new high growth medical waste services
Broader, enhanced footprint
Leader in medical waste
Internalisation and waste diversion
Exposure to infrastructure & regional resources sectors
Cleanaway Net Revenue by reporting segment and markets FY171
SolidsLiquids
Industrial Services
• Residential• Commercial• Industrial• Construction
• Resources• Infrastructure
• Regulated waste• Industrial • Manufacturing• Energy
Pro forma consolidated Net Revenue by possible reporting segment and
markets FY171,2
SolidsLiquids & Health Services
Industrial Services
• Residential• Commercial• Industrial• Resources• Construction
• Regulated waste• Industrial • Manufacturing• Energy• Healthcare
• Resources• Infrastructure
Note: 1. Cleanaway net revenue is net of levies and before intersegment and intercompany eliminations. Toxfree net revenue includes intercompany eliminations. 2. Medical Waste Services revenue based on 7 months contribution post completion of acquisition of Daniels Health by Toxfree in December 2016.
Liquids, Health & Industrial Services
Solids
For
per
sona
l use
onl
y
19
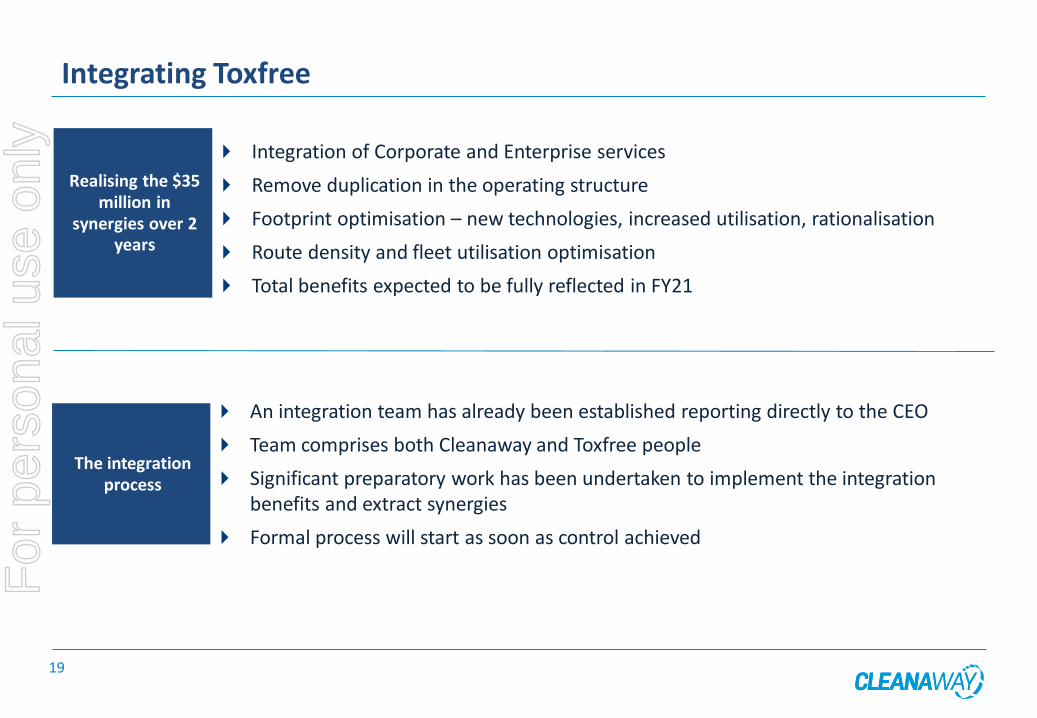
Integrating Toxfree
Realising the $35 million in
synergies over 2 years
Integration of Corporate and Enterprise services
Remove duplication in the operating structure
Footprint optimisation – new technologies, increased utilisation, rationalisation
Route density and fleet utilisation optimisation
Total benefits expected to be fully reflected in FY21
The integration process
An integration team has already been established reporting directly to the CEO
Team comprises both Cleanaway and Toxfree people
Significant preparatory work has been undertaken to implement the integration benefits and extract synergies
Formal process will start as soon as control achieved
For
per
sona
l use
onl
y

20 | NOT FOR DISTRIBUTION OR RELEASE IN THE UNITED STATESNote: Cleanaway: Cleanaway gross revenue (incl. levies shown). Cleanaway and Tox based on FY17 figures. Other companies: Excludes revenue for segments other than waste management and related services where available. Based on last reported results. Source: Company filings and reports, industry reports, FactSet and estimates.
Cleanaway (incl. Tox) will rank amongst the top 20 waste management companies globally and largest in the Asia Pacific region - based on 2017 revenue
19,1
39
14,4
54
13,2
67
12,1
81
9,8
25
9,4
49
5,0
00
4,3
75
4,0
67
3,1
70
3,1
38
2,8
78
2,6
69
2,5
61
2,2
38
1,9
92
1,9
51
1,9
19
1,8
05
1,7
59
1,7
46
1,7
33
1,4
46
1,3
21
1,2
26
1,1
88
1,1
39
1,0
78
1,0
47
855
851
846
793
792
790
715
698
696
667
666
574
547
517
455
253
240
225
Waste
Managem
ent
Veolia
Republic
Serv
ices
Suez
Rem
ondis
A2A
SP
A
Waste
Connections
FC
C E
nvironm
enta
l
Euro
pean M
eta
l…
Cle
an H
arb
ors
Ste
ricycle
Alb
a
Renew
i
Urb
aser
Papre
c
Advanced D
isposal
Cle
anaw
ay (
incl. T
ox)
Ecore
Biffa
Cespa
GF
L E
nvironm
enta
l
Hera
Gro
up
Pennon
Recolo
gy
Japan W
aste
Ste
na R
ecyclin
g
Lassila
& T
ikanoja
Kuusakoski
Nord
-Schro
tt
Indaver
Ragn-S
ells
fore
tagen
Waste
Industr
ies
Waste
pro
Casella
Waste
Ecoem
bala
jes E
spana
Gallo
o
JJ R
ichard
s
Rum
pke
Nors
k G
jenvin
nin
g
US
Ecolo
gy
Seche E
nvironnem
ent
Eksa
DS
Sm
ith R
ecyclin
g…
Sauberm
acher
New
alta
Cory
Environm
enta
l
Marius P
eders
en
Revenue (
A$ m
illio
ns)
Americas Asia Europe
20
For
per
sona
l use
onl
y
21
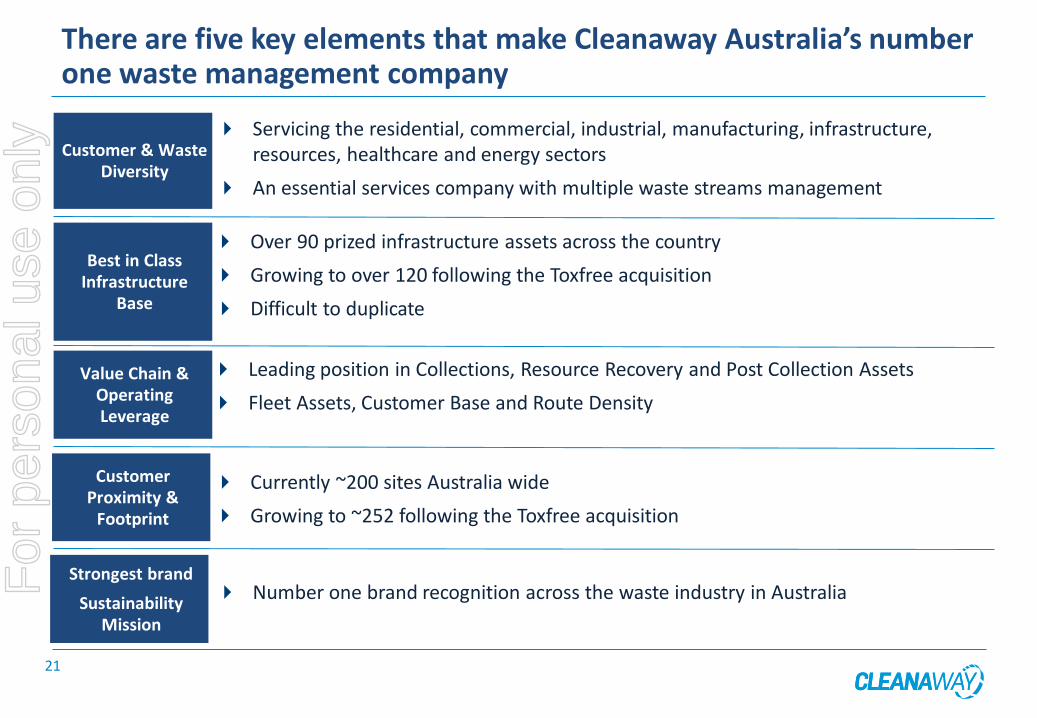
There are five key elements that make Cleanaway Australia’s number one waste management company
Customer & Waste Diversity
Servicing the residential, commercial, industrial, manufacturing, infrastructure, resources, healthcare and energy sectors
An essential services company with multiple waste streams management
Best in Class Infrastructure
Base
Over 90 prized infrastructure assets across the country
Growing to over 120 following the Toxfree acquisition
Difficult to duplicate
Value Chain & Operating Leverage
Leading position in Collections, Resource Recovery and Post Collection Assets
Fleet Assets, Customer Base and Route Density
Customer Proximity &
Footprint
Currently ~200 sites Australia wide
Growing to ~252 following the Toxfree acquisition
Strongest brand
Sustainability Mission
Number one brand recognition across the waste industry in AustraliaFor
per
sona
l use
onl
y
22
Outlook for FY18 – Excluding the Toxfree acquisition, no change
The major contract wins in FY17 have established a firm base for revenue growth in our Solids businesses and we continue to remain optimistic of continuing improvement in the Liquids & Industrial Services business
Cost disciplines remain in place and along with further initiatives being implemented across the Company should result in both the Solids and Liquids & Industrial Services segments further increasing operational earnings in FY18
FY18 earnings are expected to be in line with current market expectations, excluding the impact of the acquisition of Toxfree
For
per
sona
l use
onl
y

23
Questions
For
per
sona
l use
onl
y