Embed Size (px)
Citation preview
Government at a Glance 2015
Country Fact Sheetwww.oecd.org/gov/govataglance.htm
Australian Public finances are deteriorating
In 2013, Australia reported a deficit of 2.6% as a share of GDP and a structurally adjusted deficit of 1.4 as a share of po-tential GDP. Since 2007, debt levels (according to the System of National Accounts definition) have consistently increased (21 percentage points), reaching 41.4% as a share of GDP in 2014. Compared to other OECD countries, Australia was not as severely affected by the global economic crisis. Nonetheless, the budget is highly volatile as revenues rely heavily on natural mining resources that have recently experienced diminishing prices.
Chapter 2: Public finance and economicsGeneral government fiscal balance as a percentage of GDPGeneral government gross debt as a percentage of GDPBreakdown of tax revenue as a percentage of total taxationGeneral government structural balance as a percentage of potential GDP
The size of government has moderately increased, but remains below the OECD average
Australia was one of the few OECD countries where employment levels in the public administration experienced a moder-ate increase between 2008 and 2014. The share of public employment as a percentage of total employment reached 18.4% in 2013, still below the OECD average of 21.3%; similarly, government expenditures were below OECD average (36.6% as a share of GDP in Australia vs 41.9% in the OECD). However, during the same period, a remuneration reform occurred with the intention of attaining cost control and limiting wage growth.
Chapter 2: Public finance and economicsGeneral government expenditures as a percentage of GDPChapter 3: Public employment and compensationPublic sector employment as a percentage of total employmentChapter 6: Human Resources ManagementCompensation reforms implemented since 2008Employment reforms in select OECD countries’ central public administration
Australian society is becoming more equal
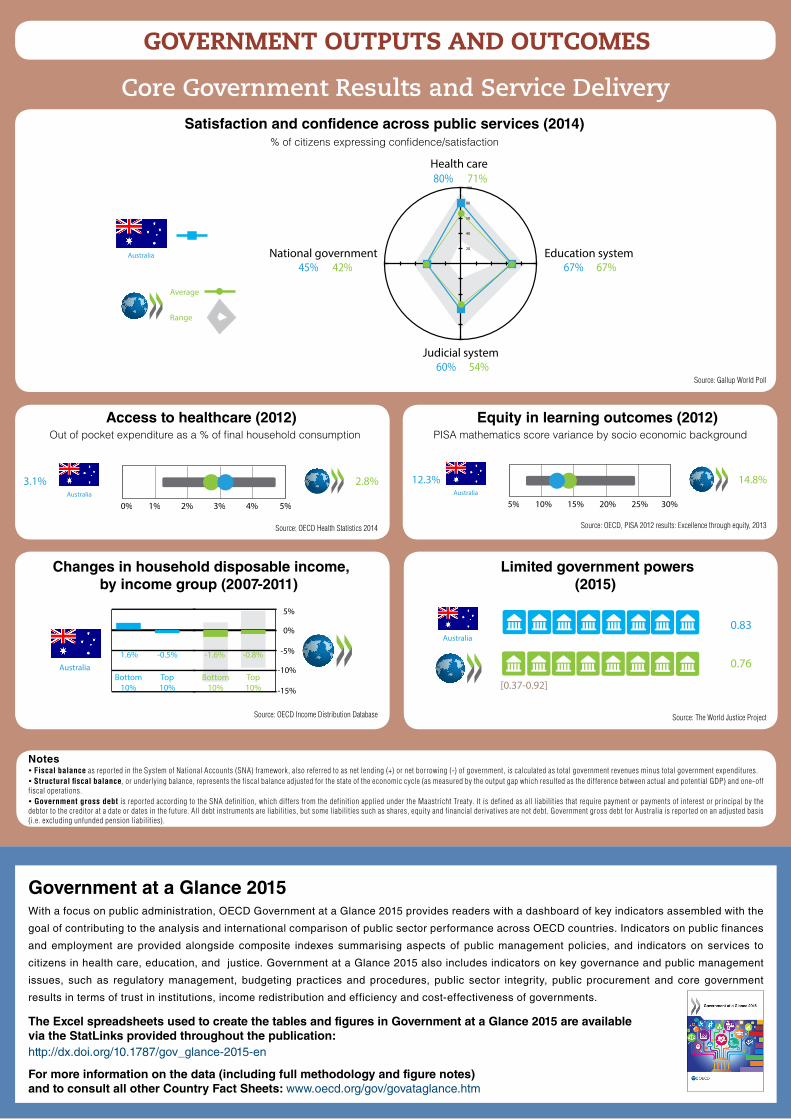
The tax system in Australia plays an important role in income redistribution. Australia’s Gini coefficient changes from 0.46 before taxes and transfers, to 0.32 after taxes and transfers. Moreover between 2011 and 2007, the disposable income of the bottom 10% of the population increased annually by 1.6%, while it decreased by 0.8% for the top 10%. In contrast, on average, for OECD member countries disposable income decreased at a higher annual pace for the bottom 10% (1.6%) than for the top 10% (0.8%).
Chapter 11: Core Government resultsAnnual percentage changes in household disposable income
Australia combines higher household expenditure on tertiary education with high entry rates
The share of private expenditure on tertiary education institutions reached 54.3% and is significantly above OECD average (30.8%). However, in 2012, the entry rate to tertiary type A education amounted to 102% in Australia (76% when excluding international students). This figure has increased by 43 percentage points since 2000, the highest increase across OECD countries. Overall the satisfaction with the general education system is 67%, a similar figure to the OECD average.
Chapter 12: Serving citizensShare of private expenditure on educational institutionsEntry rates into tertiary-type A education (university)
Australia
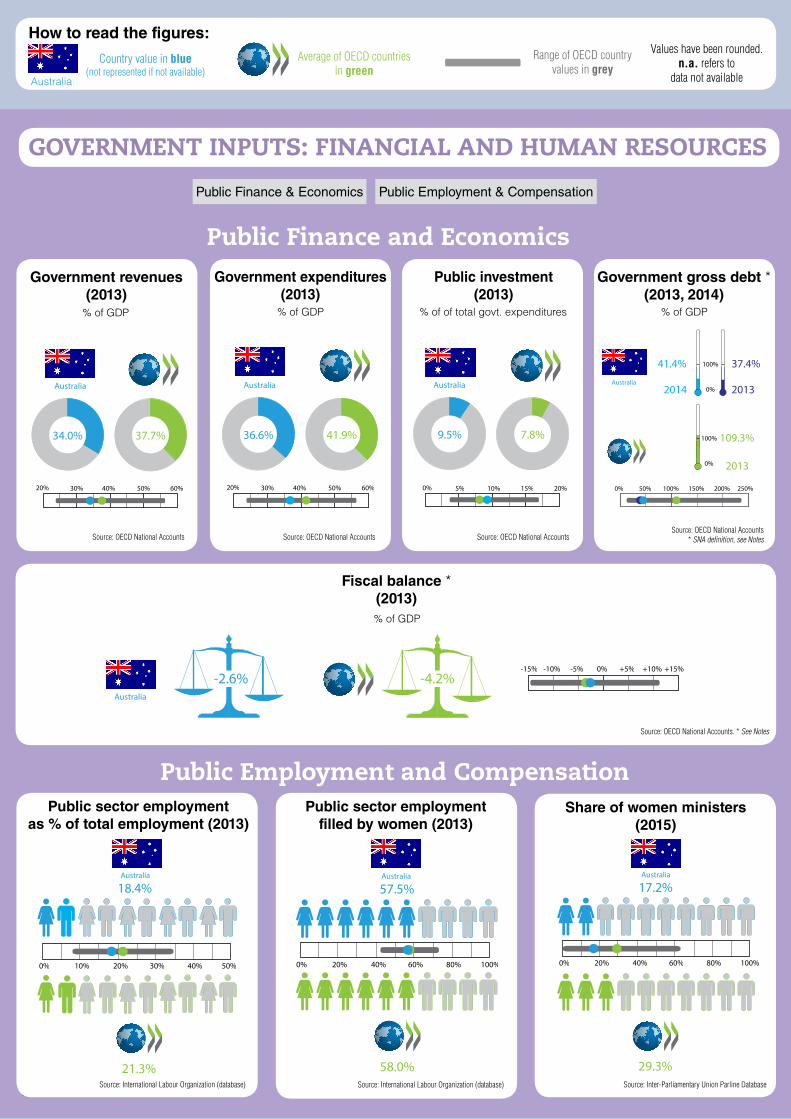
Government revenues(2013)
Government expenditures(2013)
Government gross debt *(2013, 2014)
% of GDP % of GDP % of GDP
Source: OECD National Accounts Source: OECD National Accounts Source: OECD National Accounts
G@G /dataG@G /data
-15% -10% 0%-5% +5% +10% +15%-2.6%
Australia
-4.2%
Fiscal balance *(2013)% of GDP
Public investment(2013)
% of of total govt. expenditures
How to read the figures:
Australia
Country value in blue (not represented if not available)
Average of OECD countries in green
Range of OECD country values in grey
Values have been rounded. n.a. refers to
data not available
Public Finance & Economics Public Employment & Compensation
Public Finance and Economics
GOVERNMENT INPUTS: FINANCIAL AND HUMAN RESOURCES
29.3%
0% 20% 40% 60% 80% 100%
17.2%Australia
20% 30% 40% 50% 60%
41.9%36.6%
Australia
7.8%
0% 5% 10% 15% 20%
9.5%
Australia
37.4%
2013
41.4% 100%
0%2014
109.3%100%
0% 2013
0% 50% 100% 150% 200% 250%
Australia
Source: OECD National Accounts* SNA definition, see Notes
Source: OECD National Accounts. * See Notes
Public Employment and Compensation
G@G /data
58.0%
57.5%Australia
0% 20% 40% 60% 80% 100%
Public sector employment filled by women (2013)
Source: International Labour Organization (database)
Share of women ministers(2015)
Source: Inter-Parliamentary Union Parline Database
Public sector employmentas % of total employment (2013)
Source: International Labour Organization (database)
21.3%
18.4%Australia
0% 10% 20% 30% 40% 50%
20% 30% 40% 50% 60%
37.7%34.0%
Australia
GOVERNMENT PROCESSES
Institutions Regulatory Governance Public Procurement Public Sector Integrity Digital Government
Digital Gov.
High Moderate Low
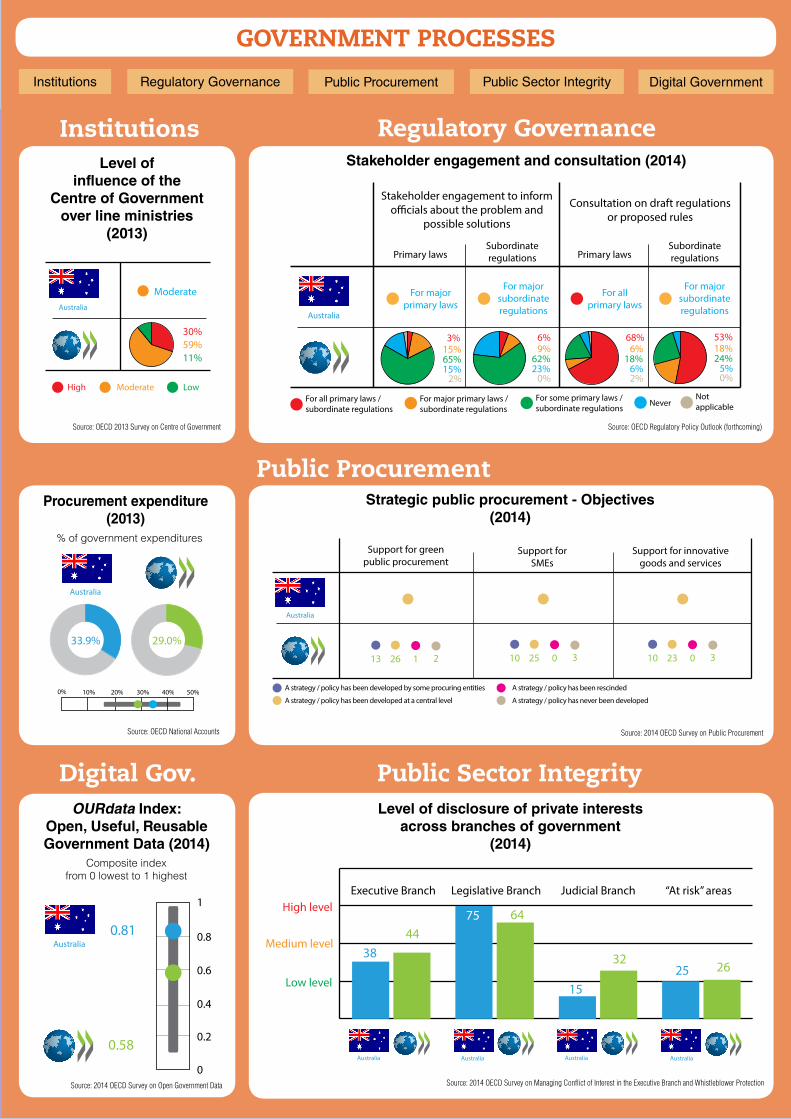
30%59%11%
ModerateAustralia
G@G /data
Level ofinfluence of the
Centre of Governmentover line ministries
(2013)
Institutions
Source: OECD 2013 Survey on Centre of Government
Women in Government
Primary lawsSubordinateregulations
Stakeholder engagement to inform o�cials about the problem and
possible solutions
Primary lawsSubordinateregulations
Consultation on draft regulations or proposed rules
For major primary laws
For major subordinate regulations
For allprimary laws
For all primary laws /subordinate regulations
For major primary laws /subordinate regulations
For some primary laws /subordinate regulations
NeverNotapplicable
For major subordinate regulations
3%15%65%15%2%
6%9%
62%23%0%
68%6%
18%6%2%
53%18%24%5%0%
Australia
G@G /data
Source: OECD Regulatory Policy Outlook (forthcoming)
Stakeholder engagement and consultation (2014)
Regulatory Governance
Strategic public procurement - Objectives(2014)
G@G /data
Public Procurement
0% 10% 20% 30% 40%
29.0%
50%
33.9%
Australia
Source: OECD National Accounts
Procurement expenditure(2013)
% of government expenditures
Source: 2014 OECD Survey on Public Procurement
Public Sector Integrity
2632
6444
Judicial Branch “At risk” areasLegislative BranchExecutive Branch
Low level
Medium level
High level
38
AustraliaAustraliaAustraliaAustralia
75
1525
Level of disclosure of private interestsacross branches of government
(2014)
Source: 2014 OECD Survey on Managing Conflict of Interest in the Executive Branch and Whistleblower Protection
0.58
0
0.2
0.4
0.6
0.8
1
0.81Australia
OURdata Index:Open, Useful, ReusableGovernment Data (2014)
Composite indexfrom 0 lowest to 1 highest
Source: 2014 OECD Survey on Open Government Data
Support for greenpublic procurement
A strategy / policy has been developed by some procuring entities
A strategy / policy has been developed at a central level
Support forSMEs
Support for innovativegoods and services
13 26 1
A strategy / policy has been rescinded
A strategy / policy has never been developed
2 10 25 0 3 10 23 0 3
Australia
GOVERNMENT OUTPUTS AND OUTCOMES
Notes Fiscal balance as reported in the System of National Accounts (SNA) framework, also referred to as net lending (+) or net borrowing (-) of government, is calculated as total government revenues minus total government expenditures. Structural fiscal balance, or underlying balance, represents the fiscal balance adjusted for the state of the economic cycle (as measured by the output gap which resulted as the dif ference between actual and potential GDP) and one-off fiscal operations. Government gross debt is reported according to the SNA definition, which dif fers from the definition applied under the Maastricht Treaty. It is defined as all liabilities that require payment or payments of interest or principal by the debtor to the creditor at a date or dates in the future. All debt instruments are liabilities, but some liabilities such as shares, equity and financial derivatives are not debt. Government gross debt for Australia is reported on an adjusted basis (i.e. excluding unfunded pension liabilities).
Core Government Results and Service Delivery
Out of pocket expenditure as a % of final household consumption Access to healthcare (2012)
Source: OECD Health Statistics 2014
Satisfaction and confidence across public services (2014)
71%
Judicial system
Education system
80%
20
40
60
80
100
Health care
67%67%
54%60%
National government42%45%
Australia
Average
Range
Source: Gallup World Poll
-15%
-10%
-5%
0%
5%
AustraliaTop10%
1.6%
Bottom10%
-0.5%
Top10%
Bottom10%
-1.6% -0.8%
Changes in household disposable income,by income group (2007-2011)
Source: OECD Income Distribution Database
Limited government powers(2015)
Australia0.83
0.76
[0.37-0.92]
Source: The World Justice Project
Equity in learning outcomes (2012)PISA mathematics score variance by socio economic background
14.8%
5% 10% 15% 20% 25% 30%
12.3%Australia
Source: OECD, PISA 2012 results: Excellence through equity, 2013
% of citizens expressing confidence/satisfaction
Government at a Glance 2015With a focus on public administration, OECD Government at a Glance 2015 provides readers with a dashboard of key indicators assembled with the
goal of contributing to the analysis and international comparison of public sector performance across OECD countries. Indicators on public finances
and employment are provided alongside composite indexes summarising aspects of public management policies, and indicators on services to
citizens in health care, education, and justice. Government at a Glance 2015 also includes indicators on key governance and public management
issues, such as regulatory management, budgeting practices and procedures, public sector integrity, public procurement and core government
results in terms of trust in institutions, income redistribution and efficiency and cost-effectiveness of governments.
http://dx.doi.org/10.1787/gov_glance-2015-en
The Excel spreadsheets used to create the tables and figures in Government at a Glance 2015 are available via the StatLinks provided throughout the publication:
For more information on the data (including full methodology and figure notes)and to consult all other Country Fact Sheets: www.oecd.org/gov/govataglance.htm
2.8%
0% 1% 2% 3% 4% 5%
3.1%Australia