Embed Size (px)
Citation preview
TrendsInfrastructure and Transport to 2030
© Commonwealth of Australia 2014ISBN: 978-1-922205-65-0February 2014/INFRA1996
Ownership of intellectual property rights in this publication: Unless otherwise noted, copyright (and other intellectual property rights, if any) in this publication is owned by the Commonwealth of Australia (referred to below as the Commonwealth).Disclaimer: The material contained in this publication is made available on the understanding that the Commonwealth is not providing professional advice, and that users exercise their own skill and care with respect to its use, and seek independent advice if necessary.The Commonwealth makes no representations or warranties as to the contents or accuracy of the information contained in this publication.To the extent permitted by law, the Commonwealth disclaims liability to any person or organisation in respect of anything done, or omitted to be done, in reliance upon information contained in this publication.Creative Commons licence: With the exception of (a) the Coat of Arms; and (b) all photos and graphics, copyright in this publication is licensed under a Creative Commons Attribution 3.0 Australia Licence.Creative Commons Attribution 3.0 Australia Licence is a standard form licence agreement that allows you to copy, communicate and adapt this publication provided that you attribute the work to the Commonwealth and abide by the other licence terms.A summary of the licence terms is available from http://creativecommons.org/licenses/by/3.0/au/deed.en. The full licence terms are available from http://creativecommons.org/licenses/by/3.0/au/legalcode.This publication should be attributed in the following way: Trends: Infrastructure and Transport to 2030 ©Commonwealth of Australia 2014.Use of the Coat of Arms: The Department of the Prime Minister and Cabinet sets the terms under which the Coat of Arms is used.Please refer to the Department’s Commonwealth Coat of Arms and Government Branding web page http://www.dpmc.gov.au/guidelines/index.cfm#brand and in particular, the Guidelines on the use of the Commonwealth Coat of Arms publication.Contact us: This publication is available in hard copy or PDF format. All other rights are reserved, including in relation to any Departmental logos or trade marks which may exist.For enquiries regarding the licence and any use of this publication, please contact:Director – Publishing and Communications, Communications Branch Department of Infrastructure and Regional Development GPO Box 594, Canberra ACT 2601, Australia. Email: [email protected] Website: www.infrastructure.gov.au
Page 1
Trends
CONTENTS
PURPOSE 3
ECONOMIC CONDITIONS 4
INFRASTRUCTURE INVESTMENT TRENDS 7
AUSTRALIA IN TRANSITION 8
MODAL TRENDS 10
REGULATORY TRENDS 14
OTHER CHALLENGES AND OPPORTUNITIES 18
CONCLUSION 23
Trends
Page 3
Trends
Despite strong economic growth, the Australian economy faces challenges and opportunities.
PURPOSE
Drawing on research by the Bureau of Infrastructure, Transport and Regional Economics (BITRE) and other government and industry sources, this report distils analysis and forecasting to outline the most significant impacts on the infrastructure and transport sector through to 2030 including:
• economic conditions, trends in the global economy and the outlook for the Australian economy;
• infrastructure investment trends; • Australia’s transition, including industry,
demographic, and spatial changes; • modal trends in the movement of goods
and people; • regulatory trends for the portfolio; and • other significant challenges and opportunities
including energy efficiency, climate change and technological innovation.
The Australian infrastructure and transport sector has been through a period of transition with infrastructure investments and regulatory reforms, but the sector will face significant challenges in the future. The role that governments play in the long-term responses to these challenges will have a clear impact on national prosperity.
(This report does not set out policy issues, priorities or Government commitments.)
Page 4
Trends
ECONOMIC CONDITIONS
Global EconomyInternational economies are slowly recovering from the Global Financial Crisis (GFC), although moderated by regional uncertainties. International financial conditions have stabilised and equity prices have risen globally. Capital flows to emerging markets have also remained strong. However, the International Monetary Fund (IMF) considers that this upturn will be more gradual than those following past downturns.
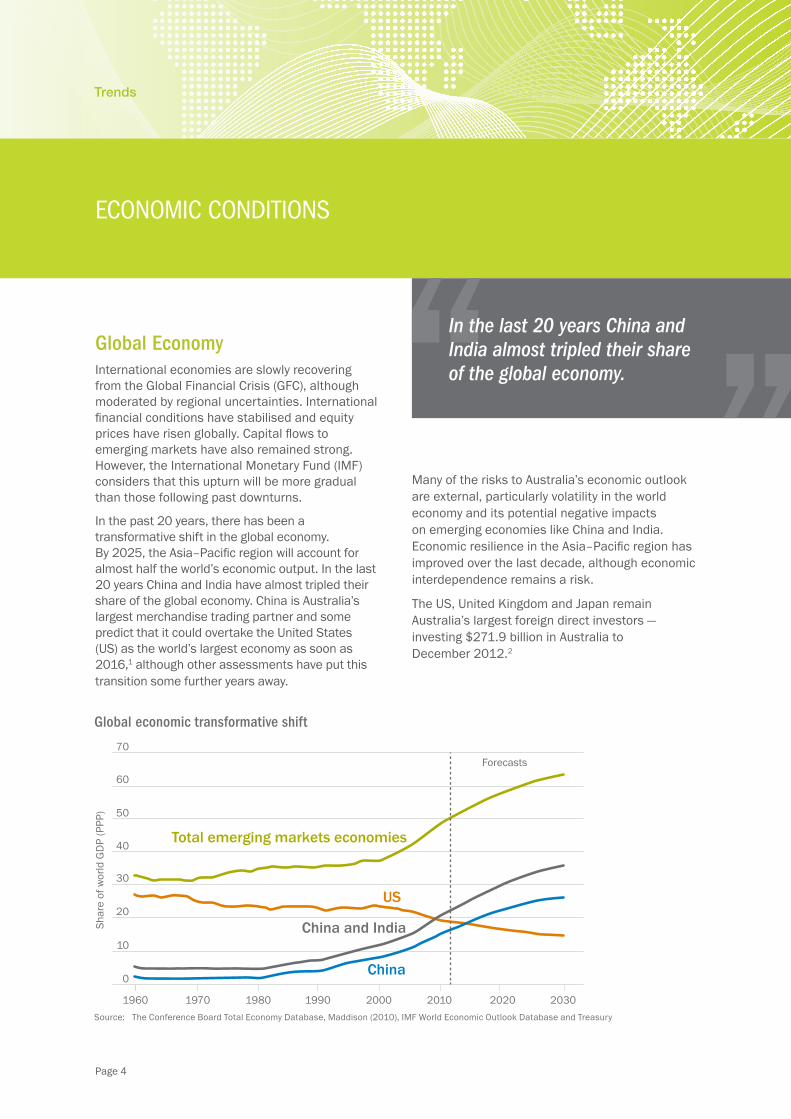
In the past 20 years, there has been a transformative shift in the global economy. By 2025, the Asia–Pacific region will account for almost half the world’s economic output. In the last 20 years China and India have almost tripled their share of the global economy. China is Australia’s largest merchandise trading partner and some predict that it could overtake the United States (US) as the world’s largest economy as soon as 2016,1 although other assessments have put this transition some further years away.
Many of the risks to Australia’s economic outlook are external, particularly volatility in the world economy and its potential negative impacts on emerging economies like China and India. Economic resilience in the Asia–Pacific region has improved over the last decade, although economic interdependence remains a risk.
The US, United Kingdom and Japan remain Australia’s largest foreign direct investors — investing $271.9 billion in Australia to December 2012.2
In the last 20 years China and India almost tripled their share of the global economy.
Global economic transformative shift
0
10
20
30
40
50
60
70
Shar
e of
wor
ld G
DP
(PPP
)
Forecasts
Total emerging markets economies
US
China
China and India
1960 1970 1980 1990 2000 2010 2020 2030Source: The Conference Board Total Economy Database, Maddison (2010), IMF World Economic Outlook Database and Treasury
Page 5
Trends
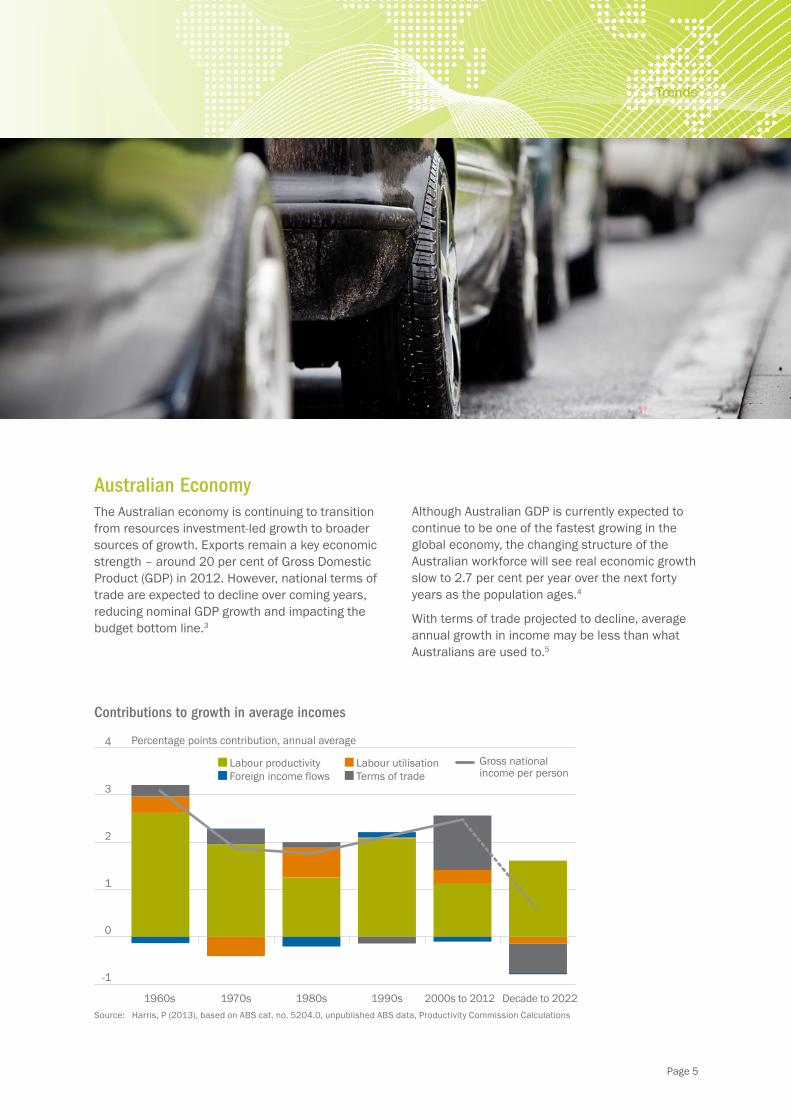
Australian EconomyThe Australian economy is continuing to transition from resources investment-led growth to broader sources of growth. Exports remain a key economic strength – around 20 per cent of Gross Domestic Product (GDP) in 2012. However, national terms of trade are expected to decline over coming years, reducing nominal GDP growth and impacting the budget bottom line.3
Although Australian GDP is currently expected to continue to be one of the fastest growing in the global economy, the changing structure of the Australian workforce will see real economic growth slow to 2.7 per cent per year over the next forty years as the population ages.4
With terms of trade projected to decline, average annual growth in income may be less than what Australians are used to.5
Contributions to growth in average incomes
4
3
2
1
-1
1960s 1970s 1980s 1990s 2000s to 2012 Decade to 2022
Percentage points contribution, annual average
Labour productivity Labour utilisationTerms of tradeForeign income flows
Gross national income per person
4
0
Source: Harris, P (2013), based on ABS cat. no. 5204.0, unpublished ABS data, Productivity Commission Calculations
Page 6
Trends
Over the past decade, multifactor productivity growth has slowed to an annual average of 1.4 per cent, compared with 2.1 per cent in the 1990s. Productivity growth has historically been the primary driver of income growth. Domestic investments in infrastructure can help enable productivity benefits within the sector and more broadly, but these investments will have minimal impact as stand-alone policies.6
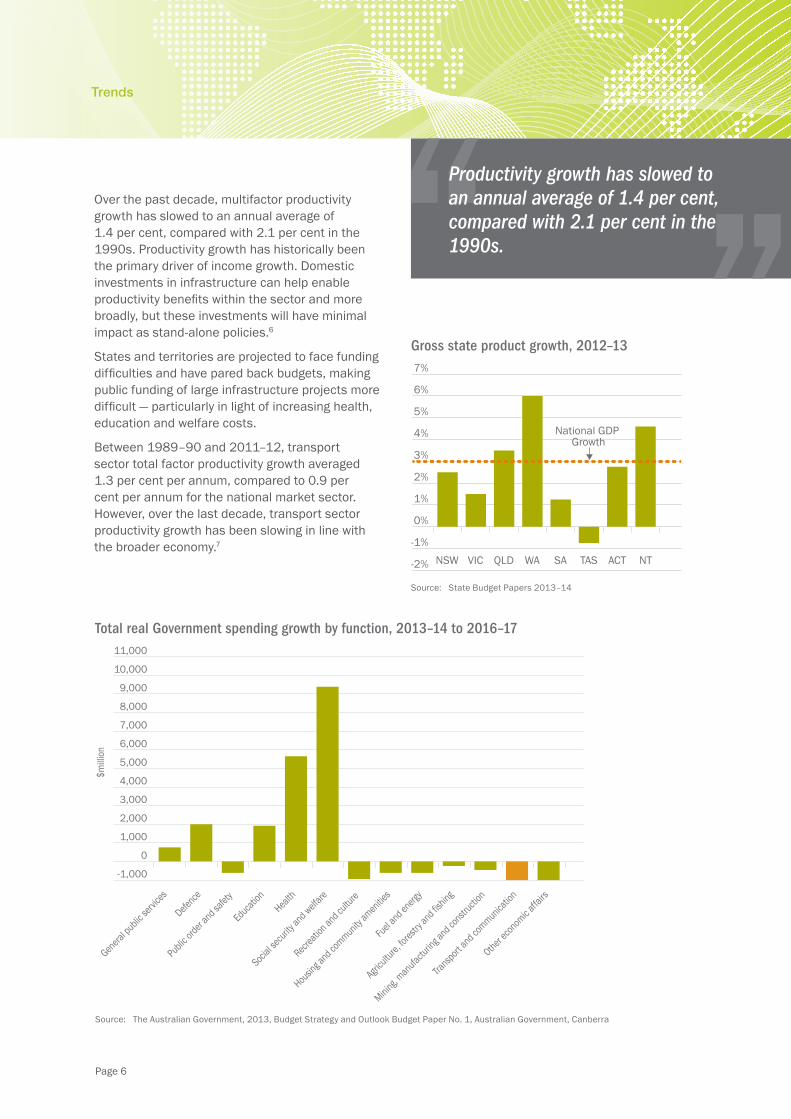
States and territories are projected to face funding difficulties and have pared back budgets, making public funding of large infrastructure projects more difficult — particularly in light of increasing health, education and welfare costs.
Between 1989–90 and 2011–12, transport sector total factor productivity growth averaged 1.3 per cent per annum, compared to 0.9 per cent per annum for the national market sector. However, over the last decade, transport sector productivity growth has been slowing in line with the broader economy.7
Productivity growth has slowed to an annual average of 1.4 per cent, compared with 2.1 per cent in the 1990s.
Gross state product growth, 2012–13
-2%
-1%
0%
1%
2%
3%
4%
5%
6%
7%
NSW VIC QLD WA SA TAS ACT NT
National GDP Growth
Source: State Budget Papers 2013–14
Total real Government spending growth by function, 2013–14 to 2016–17
-1,000
0
1,000
2,000
3,000
4,000
5,000
6,000
7,000
8,000
9,000
10,000
11,000
Other eco
nomic a
ffairs
Transport
and co
mmunication
Mining, man
ufacturin
g and co
nstructio
n
Agricultu
re, for
estry a
nd fishing
Fuel and en
ergy
Recreat
ion an
d cultu
re
Housing a
nd community
amenitie
s
Social s
ecurity
and welfa
reHeal
th
Education
Public ord
er an
d safet
y
Defence
General public
servic
es
$milli
on
Source: The Australian Government, 2013, Budget Strategy and Outlook Budget Paper No. 1, Australian Government, Canberra
Page 7
Trends
INFRASTRUCTURE INVESTMENT TRENDS
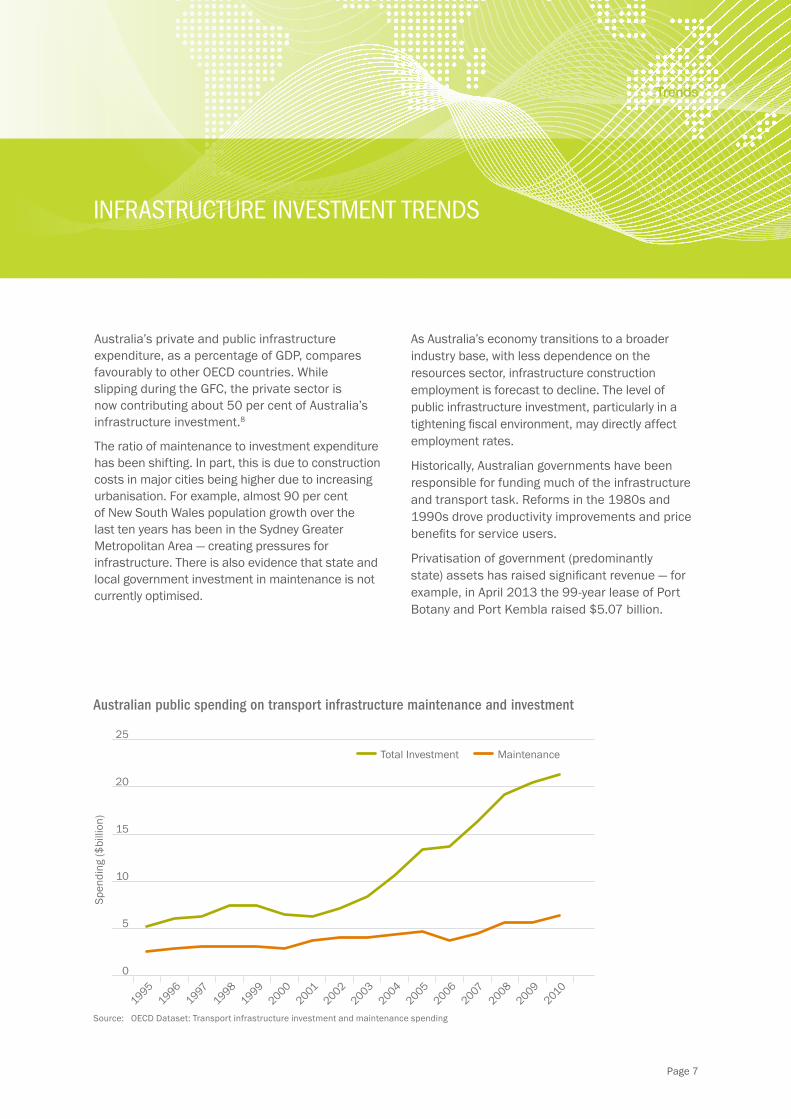
Australia’s private and public infrastructure expenditure, as a percentage of GDP, compares favourably to other OECD countries. While slipping during the GFC, the private sector is now contributing about 50 per cent of Australia’s infrastructure investment.8
The ratio of maintenance to investment expenditure has been shifting. In part, this is due to construction costs in major cities being higher due to increasing urbanisation. For example, almost 90 per cent of New South Wales population growth over the last ten years has been in the Sydney Greater Metropolitan Area — creating pressures for infrastructure. There is also evidence that state and local government investment in maintenance is not currently optimised.
As Australia’s economy transitions to a broader industry base, with less dependence on the resources sector, infrastructure construction employment is forecast to decline. The level of public infrastructure investment, particularly in a tightening fiscal environment, may directly affect employment rates.
Historically, Australian governments have been responsible for funding much of the infrastructure and transport task. Reforms in the 1980s and 1990s drove productivity improvements and price benefits for service users.
Privatisation of government (predominantly state) assets has raised significant revenue — for example, in April 2013 the 99-year lease of Port Botany and Port Kembla raised $5.07 billion.
Australian public spending on transport infrastructure maintenance and investment
0
5
10
15
20
25
19951997
19962003
19981999
20002006
20022004
20052001
20072008
20092010
Total Investment Maintenance
Spen
ding
($bi
llion
)
Source: OECD Dataset: Transport infrastructure investment and maintenance spending
Page 8
Trends
AUSTRALIA IN TRANSITION
With the Australian economy in a period of transition, there has been considerable structural adjustment across the economy.
Commodities continue to be important to the economy, generating export earnings of around $38 billion9 from agricultural sector exports, and $176 billion10 for minerals and energy in 2012–13. Primary industries, concentrated in regional Australia, make up almost two-thirds of our merchandise exports. Global food demand is expected to rise by around 77 per cent to 2050 from 2007 levels, with most demand coming from Asia. Such growth will place Australia’s freight network under increasing pressure to meet demand.11
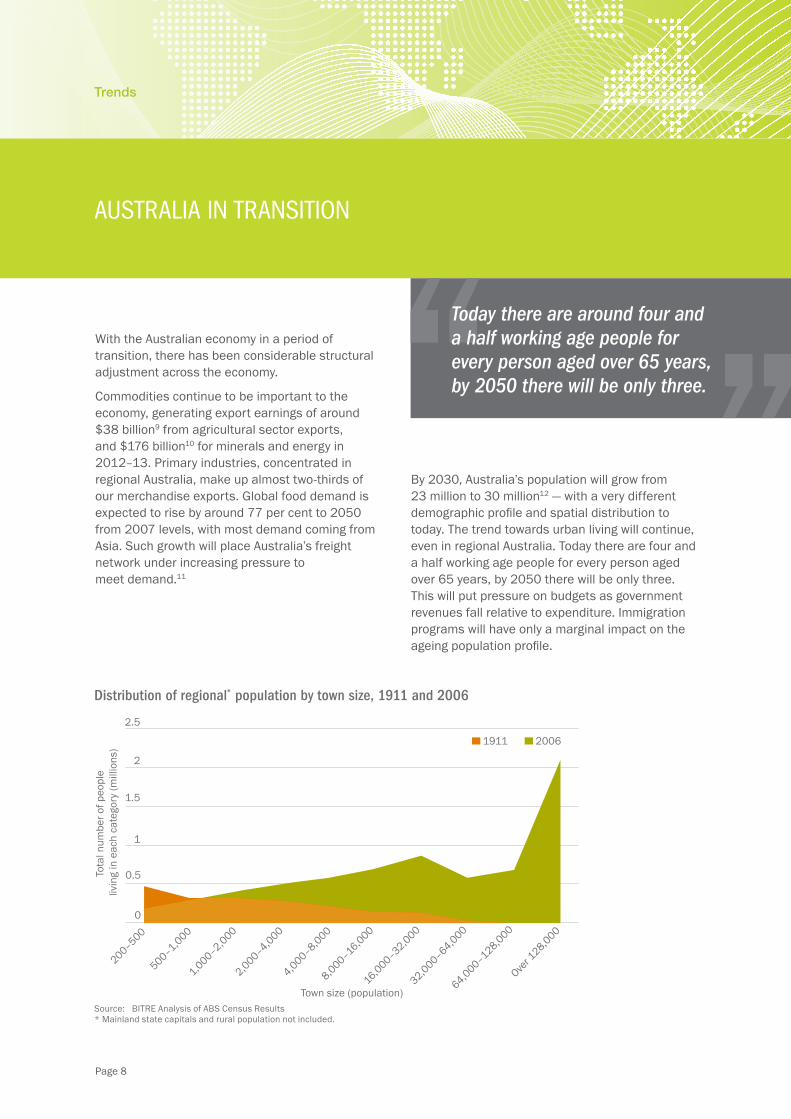
By 2030, Australia’s population will grow from 23 million to 30 million12 — with a very different demographic profile and spatial distribution to today. The trend towards urban living will continue, even in regional Australia. Today there are four and a half working age people for every person aged over 65 years, by 2050 there will be only three. This will put pressure on budgets as government revenues fall relative to expenditure. Immigration programs will have only a marginal impact on the ageing population profile.
Today there are around four and a half working age people for every person aged over 65 years, by 2050 there will be only three.
Distribution of regional* population by town size, 1911 and 2006
200–500
500–1,000
1,000–2,000
2,000–4,000
4,000–8,000
8,000–16,000
16,000–32,000
32,000–64,000
64,000–128,0000
0.5
1
1.5
2
2.5
Over 1
28,000
Tota
l num
ber o
f peo
ple
livin
g in
eac
h ca
tego
ry (m
illio
ns)
20061911
Town size (population)Source: BITRE Analysis of ABS Census Results* Mainland state capitals and rural population not included.
Page 9
Trends
Spending on health, age-related pensions and aged care will rise from a quarter to almost half of government spending by 2049–50, further constraining governments’ capacity to fund other more discretionary areas, including infrastructure.13
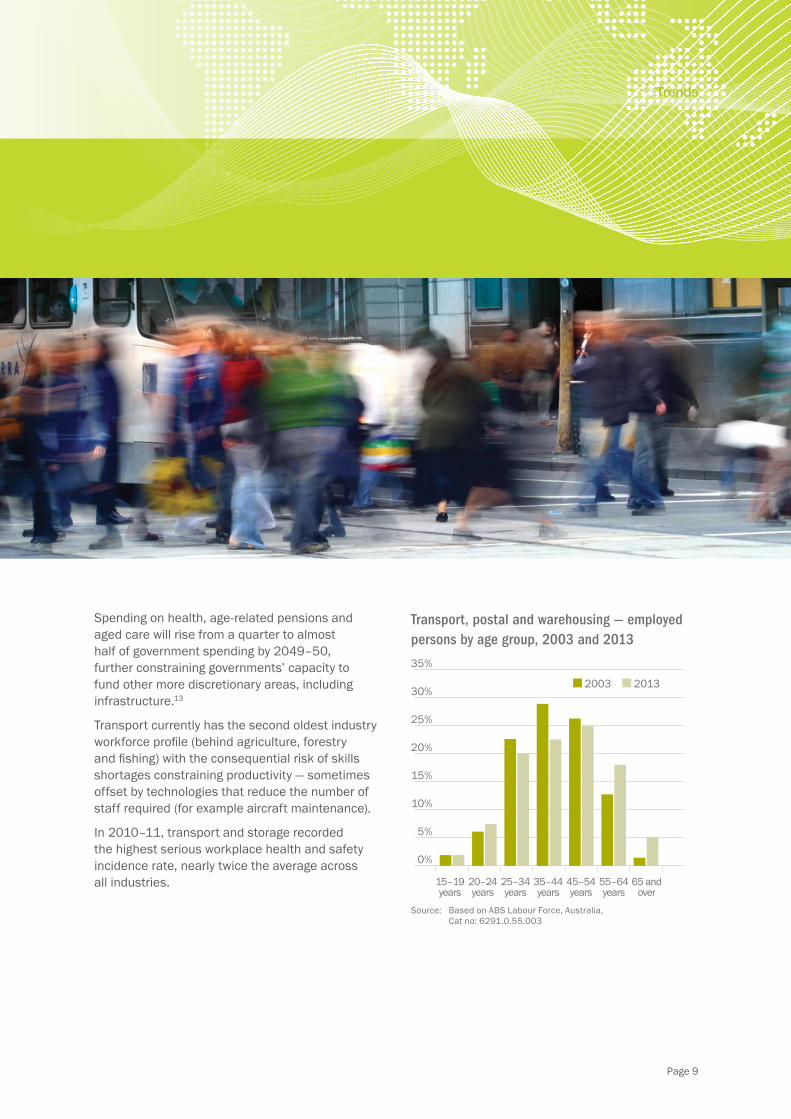
Transport currently has the second oldest industry workforce profile (behind agriculture, forestry and fishing) with the consequential risk of skills shortages constraining productivity — sometimes offset by technologies that reduce the number of staff required (for example aircraft maintenance).
In 2010–11, transport and storage recorded the highest serious workplace health and safety incidence rate, nearly twice the average across all industries.
Transport, postal and warehousing — employed persons by age group, 2003 and 2013
0%
5%
10%
15%
20%
25%
30%
35%
15–19years
25–34years
35–44years
45–54years
55–64years
65 andover
20–24years
2003 2013
Source: Based on ABS Labour Force, Australia, Cat no: 6291.0.55.003
Page 10
Trends
MODAL TRENDS
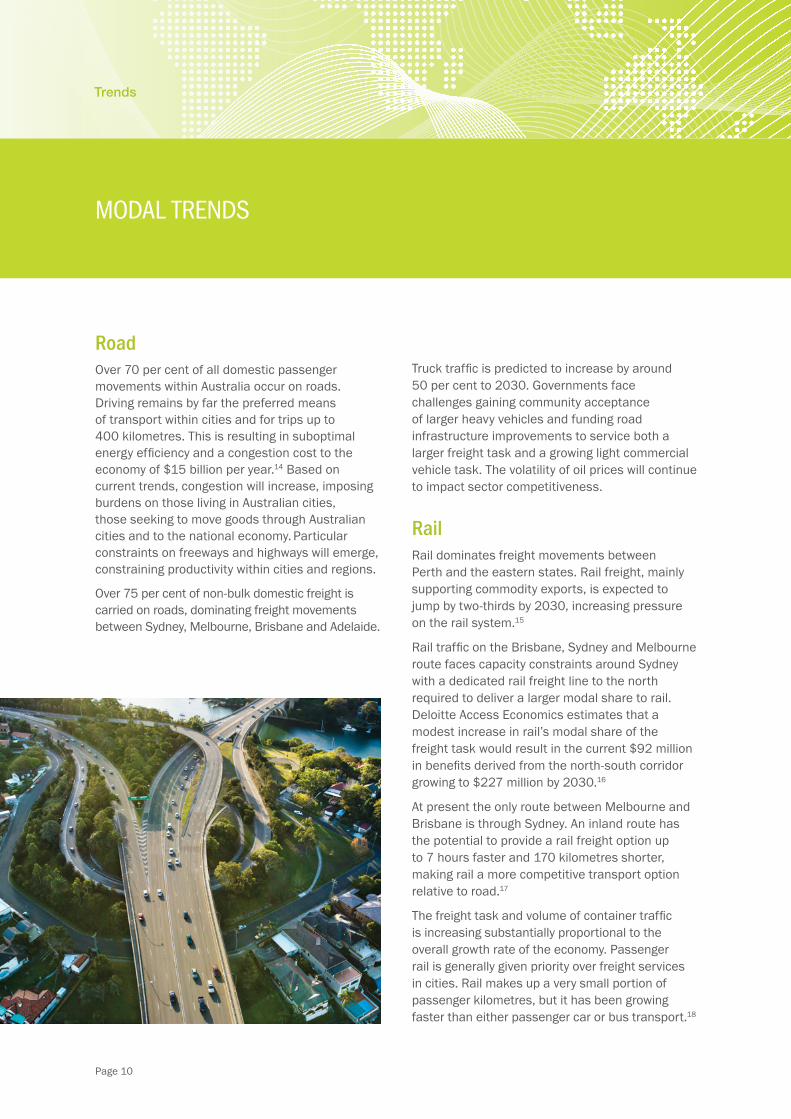
RoadOver 70 per cent of all domestic passenger movements within Australia occur on roads. Driving remains by far the preferred means of transport within cities and for trips up to 400 kilometres. This is resulting in suboptimal energy efficiency and a congestion cost to the economy of $15 billion per year.14 Based on current trends, congestion will increase, imposing burdens on those living in Australian cities, those seeking to move goods through Australian cities and to the national economy. Particular constraints on freeways and highways will emerge, constraining productivity within cities and regions.
Over 75 per cent of non-bulk domestic freight is carried on roads, dominating freight movements between Sydney, Melbourne, Brisbane and Adelaide.
Truck traffic is predicted to increase by around 50 per cent to 2030. Governments face challenges gaining community acceptance of larger heavy vehicles and funding road infrastructure improvements to service both a larger freight task and a growing light commercial vehicle task. The volatility of oil prices will continue to impact sector competitiveness.
RailRail dominates freight movements between Perth and the eastern states. Rail freight, mainly supporting commodity exports, is expected to jump by two-thirds by 2030, increasing pressure on the rail system.15
Rail traffic on the Brisbane, Sydney and Melbourne route faces capacity constraints around Sydney with a dedicated rail freight line to the north required to deliver a larger modal share to rail. Deloitte Access Economics estimates that a modest increase in rail’s modal share of the freight task would result in the current $92 million in benefits derived from the north-south corridor growing to $227 million by 2030.16
At present the only route between Melbourne and Brisbane is through Sydney. An inland route has the potential to provide a rail freight option up to 7 hours faster and 170 kilometres shorter, making rail a more competitive transport option relative to road.17
The freight task and volume of container traffic is increasing substantially proportional to the overall growth rate of the economy. Passenger rail is generally given priority over freight services in cities. Rail makes up a very small portion of passenger kilometres, but it has been growing faster than either passenger car or bus transport.18
Page 11
Trends
AviationAviation contributes over $32 billion to Australia’s GDP. It directly employs 149,000 people and over 160,000 people indirectly.19
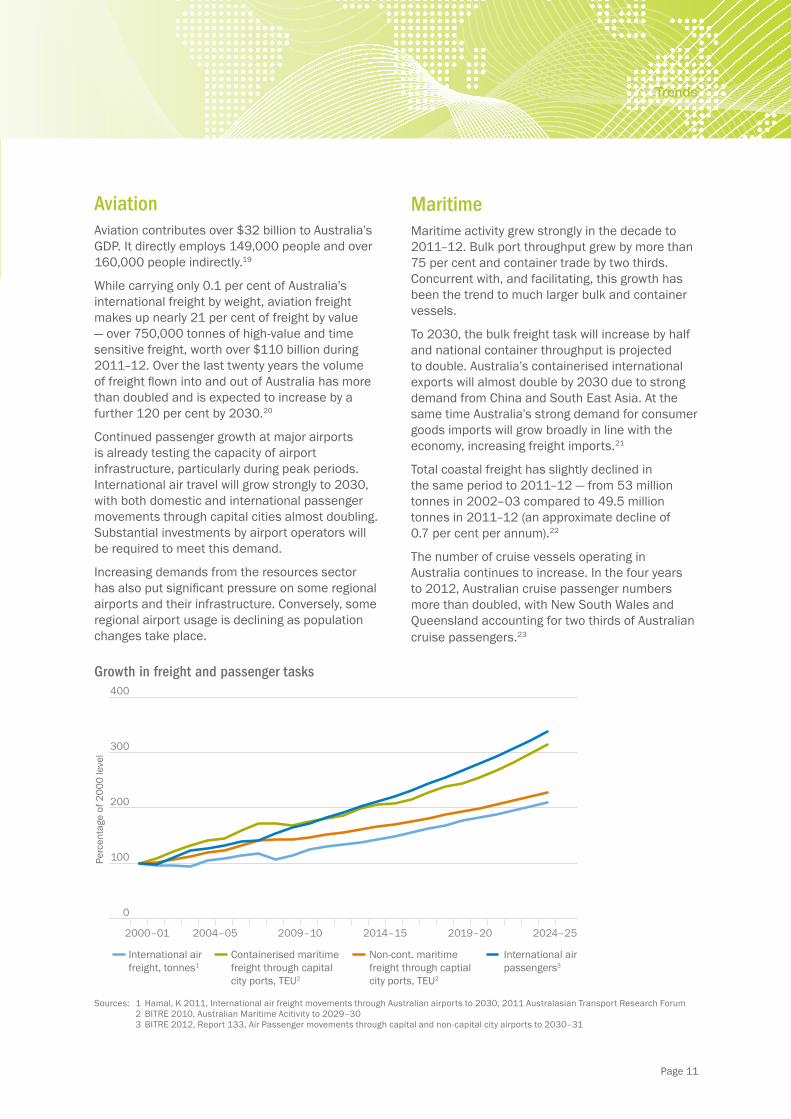
While carrying only 0.1 per cent of Australia’s international freight by weight, aviation freight makes up nearly 21 per cent of freight by value — over 750,000 tonnes of high-value and time sensitive freight, worth over $110 billion during 2011–12. Over the last twenty years the volume of freight flown into and out of Australia has more than doubled and is expected to increase by a further 120 per cent by 2030.20
Continued passenger growth at major airports is already testing the capacity of airport infrastructure, particularly during peak periods. International air travel will grow strongly to 2030, with both domestic and international passenger movements through capital cities almost doubling. Substantial investments by airport operators will be required to meet this demand.
Increasing demands from the resources sector has also put significant pressure on some regional airports and their infrastructure. Conversely, some regional airport usage is declining as population changes take place.
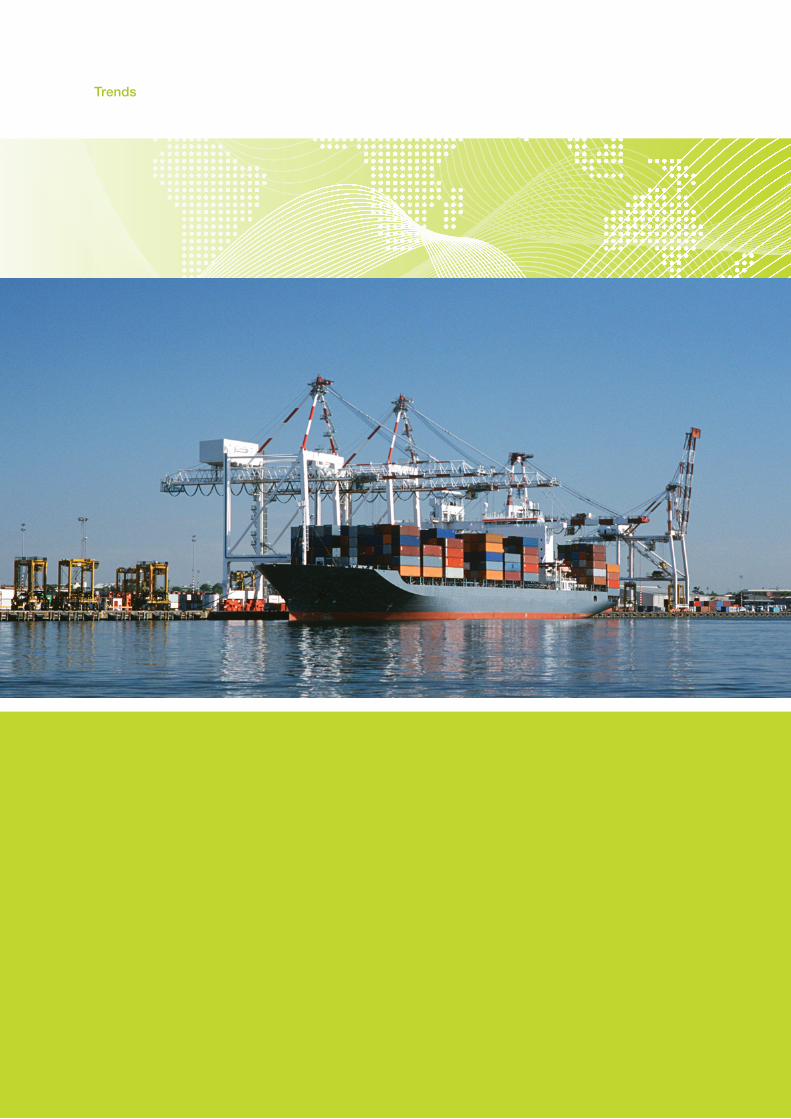
MaritimeMaritime activity grew strongly in the decade to 2011–12. Bulk port throughput grew by more than 75 per cent and container trade by two thirds. Concurrent with, and facilitating, this growth has been the trend to much larger bulk and container vessels.
To 2030, the bulk freight task will increase by half and national container throughput is projected to double. Australia’s containerised international exports will almost double by 2030 due to strong demand from China and South East Asia. At the same time Australia’s strong demand for consumer goods imports will grow broadly in line with the economy, increasing freight imports.21
Total coastal freight has slightly declined in the same period to 2011–12 — from 53 million tonnes in 2002–03 compared to 49.5 million tonnes in 2011–12 (an approximate decline of 0.7 per cent per annum).22
The number of cruise vessels operating in Australia continues to increase. In the four years to 2012, Australian cruise passenger numbers more than doubled, with New South Wales and Queensland accounting for two thirds of Australian cruise passengers.23
Growth in freight and passenger tasks
International air freight, tonnes1
Containerised maritime freight through capital city ports, TEU2
Non-cont. maritime freight through captial city ports, TEU2
International air passengers3
0
100
200
300
400
2024–252019–202014–152009–102004–052000–01
Perc
enta
ge o
f 200
0 le
vel
Sources: 1 Hamal, K 2011, International air freight movements through Australian airports to 2030, 2011 Australasian Transport Research Forum 2 BITRE 2010, Australian Maritime Acitivity to 2029–30 3 BITRE 2012, Report 133, Air Passenger movements through capital and non-capital city airports to 2030–31
Page 12
Trends
Public TransportPublic transport use has been increasing in all capital cities since 2004. Currently, one in six people in the capital cities uses mass transit for daily commuting.24 To 2030, the public transport task will grow by 30 per cent — primarily through population growth rather than a significant shift in the proportion of people using public transport.25
Public transport is not only confined to capital cities. A lack of reliable, efficient and affordable public transport options and limited services are issues for regional communities and economies. Poor or non-existent public transport within and between cities can exacerbate social isolation and limit access to health care, education and services in rural and remote communities.26
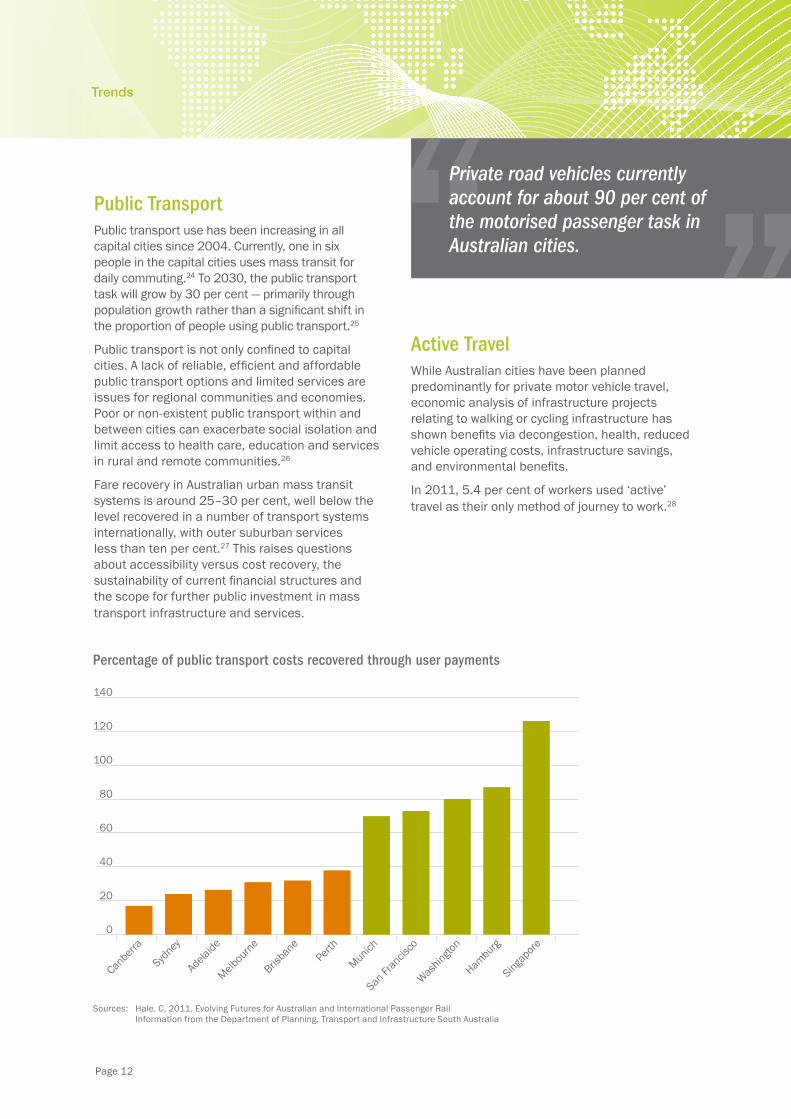
Fare recovery in Australian urban mass transit systems is around 25–30 per cent, well below the level recovered in a number of transport systems internationally, with outer suburban services less than ten per cent.27 This raises questions about accessibility versus cost recovery, the sustainability of current financial structures and the scope for further public investment in mass transport infrastructure and services.
Private road vehicles currently account for about 90 per cent of the motorised passenger task in Australian cities.
Active TravelWhile Australian cities have been planned predominantly for private motor vehicle travel, economic analysis of infrastructure projects relating to walking or cycling infrastructure has shown benefits via decongestion, health, reduced vehicle operating costs, infrastructure savings, and environmental benefits.
In 2011, 5.4 per cent of workers used ‘active’ travel as their only method of journey to work.28
Percentage of public transport costs recovered through user payments
0
20
40
60
80
100
120
140
Singapore
Hamburg
Washingto
n
San Fr
ancis
co
MunichPert
h
Brisban
e
Melbou
rne
Sydney
Canberr
a
Adelaide
Sources: Hale, C, 2011, Evolving Futures for Australian and International Passenger Rail Information from the Department of Planning, Transport and Infrastructure South Australia
Trends
Page 14
Trends
REGULATORY TRENDS
As the movement of people and goods increases in a dynamic international environment and national transport system, so too does the need for effective regulation. The Minister for Infrastructure and Regional Development currently administers around 90 Acts, most aimed at contributing to the safety and security of individuals, communities and assets. Additionally, the sector is subject to a range of broader economic regulatory settings.
Economic ReformSignificant regulatory reforms dating back to the 1970s have helped drive widespread changes in the transport industry. For example, road train mass limits varied significantly across the different jurisdictions prior to the adoption of uniform national mass limits. Since 1971, general mass limits for road trains in Western Australia and the Northern Territory have increased by around nine per cent, compared with sixty per cent in Queensland and South Australia. These regulatory changes enabled the growing freight task to be catered for with half the number of vehicles that would have otherwise been required.29
Page 15
Trends
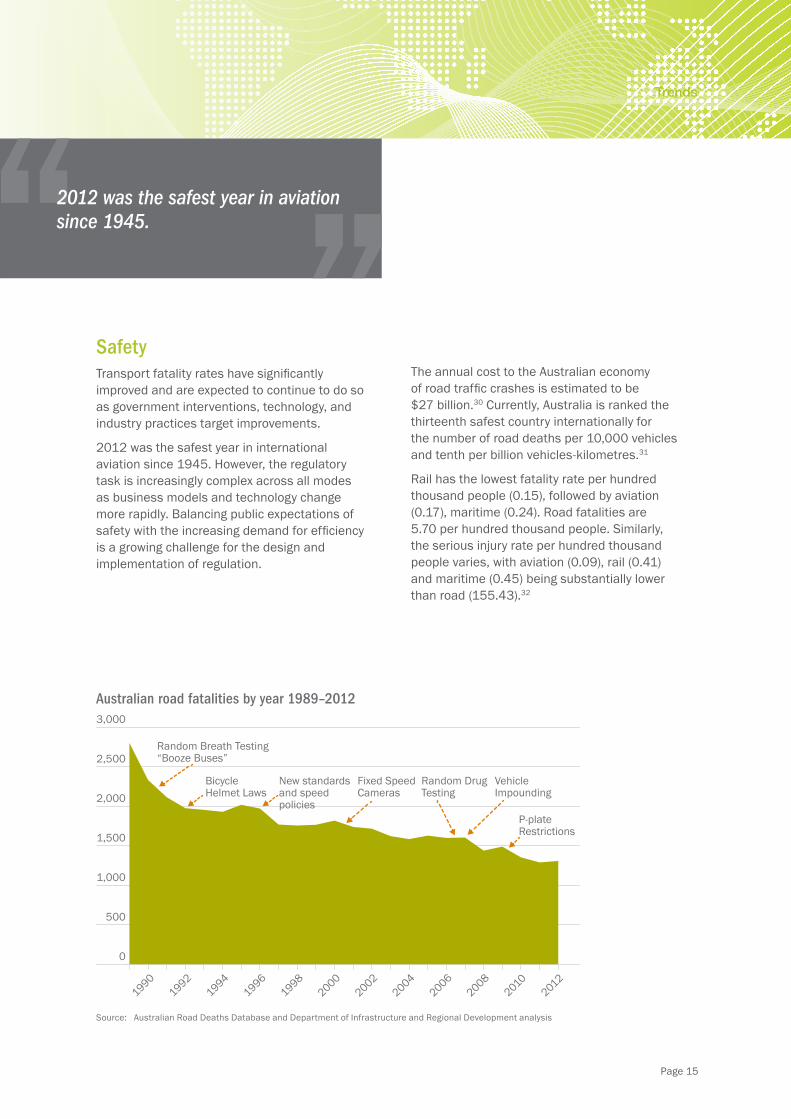
Australian road fatalities by year 1989–2012
0
500
1,000
1,500
2,000
2,500
3,000
20122010
20082006
20042002
20001998
19961994
19921990
Random Breath Testing “Booze Buses”
Bicycle Helmet Laws
Fixed SpeedCameras
Random DrugTesting
VehicleImpounding
P-plateRestrictions
New standards and speed policies
Source: Australian Road Deaths Database and Department of Infrastructure and Regional Development analysis
2012 was the safest year in aviation since 1945.
SafetyTransport fatality rates have significantly improved and are expected to continue to do so as government interventions, technology, and industry practices target improvements.
2012 was the safest year in international aviation since 1945. However, the regulatory task is increasingly complex across all modes as business models and technology change more rapidly. Balancing public expectations of safety with the increasing demand for efficiency is a growing challenge for the design and implementation of regulation.
The annual cost to the Australian economy of road traffic crashes is estimated to be $27 billion.30 Currently, Australia is ranked the thirteenth safest country internationally for the number of road deaths per 10,000 vehicles and tenth per billion vehicles-kilometres.31
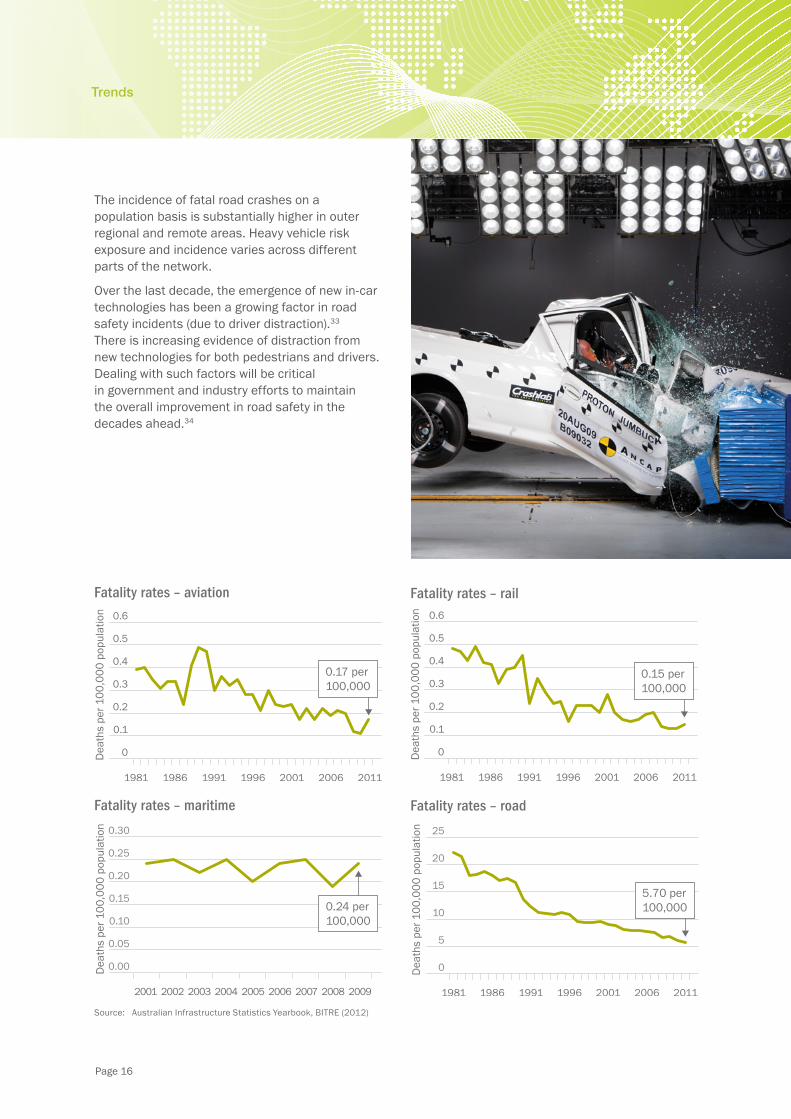
Rail has the lowest fatality rate per hundred thousand people (0.15), followed by aviation (0.17), maritime (0.24). Road fatalities are 5.70 per hundred thousand people. Similarly, the serious injury rate per hundred thousand people varies, with aviation (0.09), rail (0.41) and maritime (0.45) being substantially lower than road (155.43).32
Page 16
Trends
The incidence of fatal road crashes on a population basis is substantially higher in outer regional and remote areas. Heavy vehicle risk exposure and incidence varies across different parts of the network.
Over the last decade, the emergence of new in-car technologies has been a growing factor in road safety incidents (due to driver distraction).33 There is increasing evidence of distraction from new technologies for both pedestrians and drivers. Dealing with such factors will be critical in government and industry efforts to maintain the overall improvement in road safety in the decades ahead.34
0
0.1
0.2
0.3
0.4
0.5
0.6
2011200620011996199119861981
Dea
ths
per 1
00,0
00 p
opul
atio
n
0.17 per 100,000
Fatality rates – aviation
0
0.1
0.2
0.3
0.4
0.5
0.6
2011200620011996199119861981
Dea
ths
per 1
00,0
00 p
opul
atio
n
0.15 per 100,000
Fatality rates – rail
0.00
0.05
0.10
0.15
0.20
0.25
0.30
2007 2008 2009200620052004200320022001
Dea
ths
per 1
00,0
00 p
opul
atio
n
0.24 per 100,000
Fatality rates – maritime
0
5
10
15
20
25
Dea
ths
per 1
00,0
00 p
opul
atio
n
2011200620011996199119861981
5.70 per 100,000
Fatality rates – road
Source: Australian Infrastructure Statistics Yearbook, BITRE (2012)
Page 17
Trends
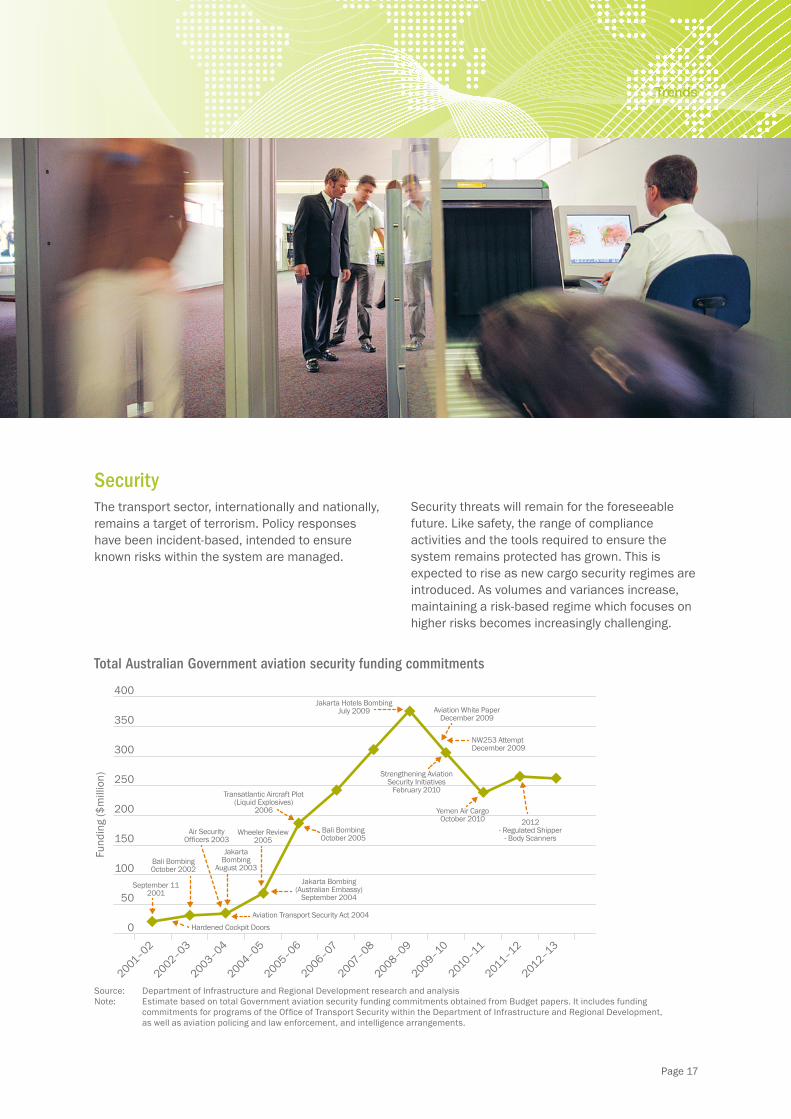
SecurityThe transport sector, internationally and nationally, remains a target of terrorism. Policy responses have been incident-based, intended to ensure known risks within the system are managed.
Security threats will remain for the foreseeable future. Like safety, the range of compliance activities and the tools required to ensure the system remains protected has grown. This is expected to rise as new cargo security regimes are introduced. As volumes and variances increase, maintaining a risk-based regime which focuses on higher risks becomes increasingly challenging.
Total Australian Government aviation security funding commitments
0
50
100
150
200
250
300
350
400
2001–02
2002–03
2003–04
2004–05
2005–06
2006–07
2007–08
2008–09
2009–10
2010–11
2011–12
2012–13
Fund
ing
($m
illio
n)
September 112001
Bali BombingOctober 2002
Air SecurityOfficers 2003
JakartaBombing
August 2003
Hardened Cockpit DoorsAviation Transport Security Act 2004
Jakarta Bombing(Australian Embassy)
September 2004
Wheeler Review2005
Bali BombingOctober 2005
Transatlantic Aircraft Plot(Liquid Explosives)
2006
Jakarta Hotels BombingJuly 2009 Aviation White Paper
December 2009
Strengthening AviationSecurity Initiatives
February 2010
Yemen Air CargoOctober 2010 2012
- Regulated Shipper- Body Scanners
NW253 Attempt December 2009
Source: Department of Infrastructure and Regional Development research and analysisNote: Estimate based on total Government aviation security funding commitments obtained from Budget papers. It includes funding commitments for programs of the Office of Transport Security within the Department of Infrastructure and Regional Development, as well as aviation policing and law enforcement, and intelligence arrangements.
Page 18
Trends
OTHER CHALLENGES AND OPPORTUNITIES
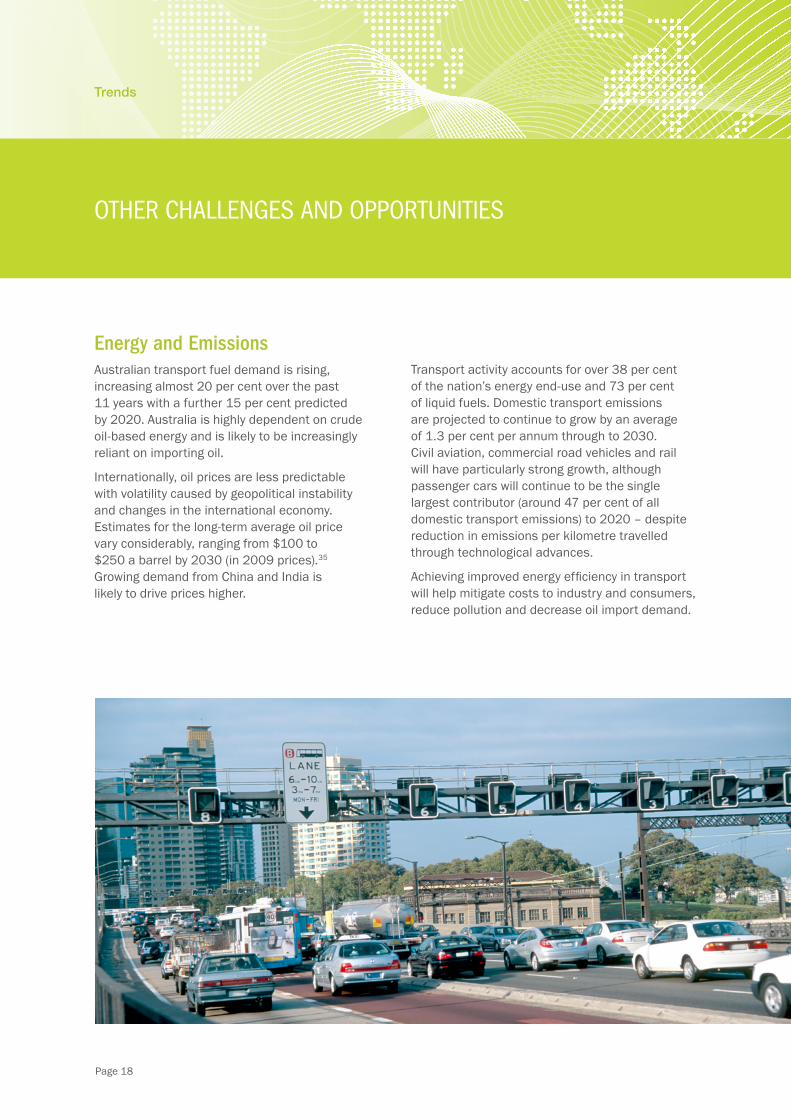
Energy and EmissionsAustralian transport fuel demand is rising, increasing almost 20 per cent over the past 11 years with a further 15 per cent predicted by 2020. Australia is highly dependent on crude oil-based energy and is likely to be increasingly reliant on importing oil.
Internationally, oil prices are less predictable with volatility caused by geopolitical instability and changes in the international economy. Estimates for the long-term average oil price vary considerably, ranging from $100 to $250 a barrel by 2030 (in 2009 prices).35 Growing demand from China and India is likely to drive prices higher.
Transport activity accounts for over 38 per cent of the nation’s energy end-use and 73 per cent of liquid fuels. Domestic transport emissions are projected to continue to grow by an average of 1.3 per cent per annum through to 2030. Civil aviation, commercial road vehicles and rail will have particularly strong growth, although passenger cars will continue to be the single largest contributor (around 47 per cent of all domestic transport emissions) to 2020 – despite reduction in emissions per kilometre travelled through technological advances.
Achieving improved energy efficiency in transport will help mitigate costs to industry and consumers, reduce pollution and decrease oil import demand.
Page 19
Trends
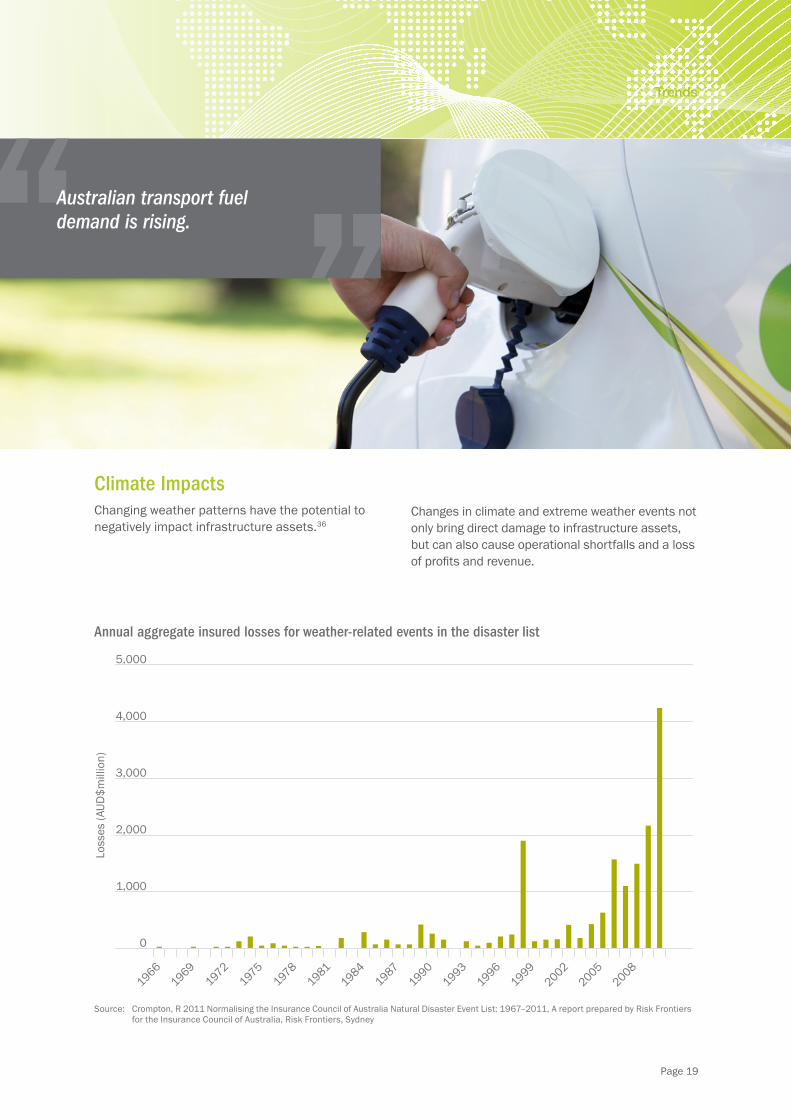
Climate ImpactsChanging weather patterns have the potential to negatively impact infrastructure assets.36
Australian transport fuel demand is rising.
Annual aggregate insured losses for weather-related events in the disaster list
0
1,000
2,000
3,000
4,000
5,000
19661969
1972
1975
1978
19811984
19871990
19931996
19992002
20052008
Loss
es (A
UD$m
illio
n)
Source: Crompton, R 2011 Normalising the Insurance Council of Australia Natural Disaster Event List: 1967–2011, A report prepared by Risk Frontiers for the Insurance Council of Australia, Risk Frontiers, Sydney
Changes in climate and extreme weather events not only bring direct damage to infrastructure assets, but can also cause operational shortfalls and a loss of profits and revenue.
Page 20
Trends
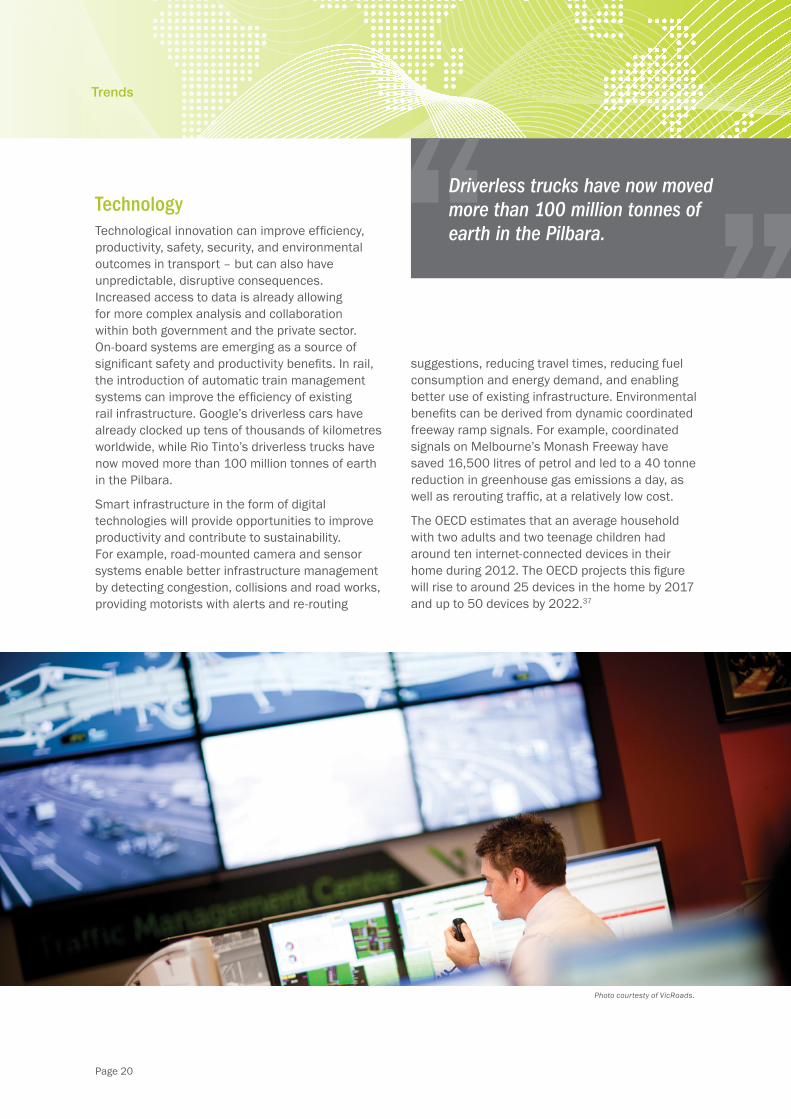
TechnologyTechnological innovation can improve efficiency, productivity, safety, security, and environmental outcomes in transport – but can also have unpredictable, disruptive consequences. Increased access to data is already allowing for more complex analysis and collaboration within both government and the private sector. On-board systems are emerging as a source of significant safety and productivity benefits. In rail, the introduction of automatic train management systems can improve the efficiency of existing rail infrastructure. Google’s driverless cars have already clocked up tens of thousands of kilometres worldwide, while Rio Tinto’s driverless trucks have now moved more than 100 million tonnes of earth in the Pilbara.
Smart infrastructure in the form of digital technologies will provide opportunities to improve productivity and contribute to sustainability. For example, road-mounted camera and sensor systems enable better infrastructure management by detecting congestion, collisions and road works, providing motorists with alerts and re-routing
suggestions, reducing travel times, reducing fuel consumption and energy demand, and enabling better use of existing infrastructure. Environmental benefits can be derived from dynamic coordinated freeway ramp signals. For example, coordinated signals on Melbourne’s Monash Freeway have saved 16,500 litres of petrol and led to a 40 tonne reduction in greenhouse gas emissions a day, as well as rerouting traffic, at a relatively low cost.
The OECD estimates that an average household with two adults and two teenage children had around ten internet-connected devices in their home during 2012. The OECD projects this figure will rise to around 25 devices in the home by 2017 and up to 50 devices by 2022.37
Driverless trucks have now moved more than 100 million tonnes of earth in the Pilbara.
Photo courtesty of VicRoads.
Page 21
Trends
The internet has changed the way we engage with transport: consumers now buy, book and choose seating preferences online. Information from Radio Frequency tags, remote sensors, barcodes, 2D scans and ‘just in time’ production, have all increased the pressure for the transport sector to respond to rich data regarding the movement of people and goods.
Research has shown that if 10 per cent of Australian employees were to telework 50 per cent of the time, the total annual gains to the Australian economy would be around $1.4–$1.9 billion. By 2020–21 the workplace participation impacts of telework enabled through new high speed broadband infrastructure could grow the annual GDP by $3.2 billion, and create an additional 25,000 full-time jobs.38
Social shifts due to the increased use of the internet may also reduce some transport use, easing congestion and associated environmental impacts in urban areas.
Page 22
Trends
Page 22 > Australia to 2030 Trends in Transport and Infrastructure
Page 23
Trends
CONCLUSION
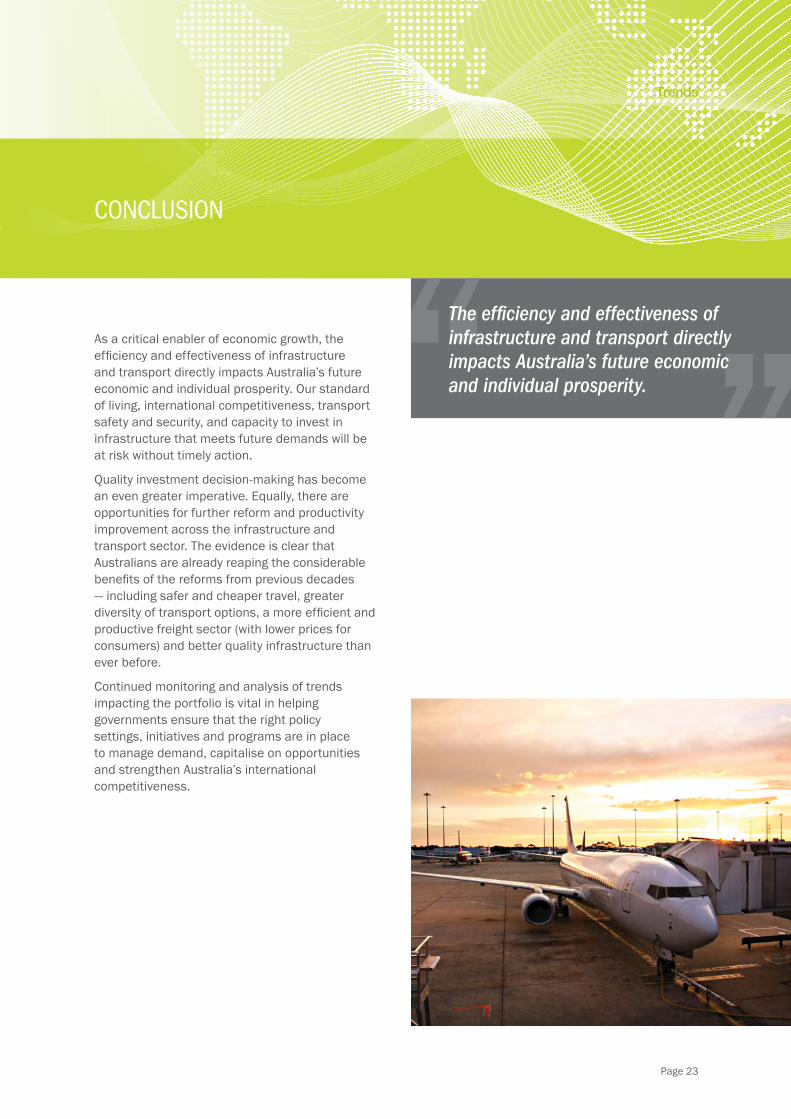
As a critical enabler of economic growth, the efficiency and effectiveness of infrastructure and transport directly impacts Australia’s future economic and individual prosperity. Our standard of living, international competitiveness, transport safety and security, and capacity to invest in infrastructure that meets future demands will be at risk without timely action.
Quality investment decision-making has become an even greater imperative. Equally, there are opportunities for further reform and productivity improvement across the infrastructure and transport sector. The evidence is clear that Australians are already reaping the considerable benefits of the reforms from previous decades — including safer and cheaper travel, greater diversity of transport options, a more efficient and productive freight sector (with lower prices for consumers) and better quality infrastructure than ever before.
Continued monitoring and analysis of trends impacting the portfolio is vital in helping governments ensure that the right policy settings, initiatives and programs are in place to manage demand, capitalise on opportunities and strengthen Australia’s international competitiveness.
The efficiency and effectiveness of infrastructure and transport directly impacts Australia’s future economic and individual prosperity.
Page 24
Trends
References1. OECD, 2013, OECD Economic Surveys: China 2013, OECD
Publishing
2. Australian Trade Commission, 2013, Data Alert 22 May 2013, Australian Government, Canberra
3. The Australian Government Treasury, 2013, Mid-Year Economic and Fiscal Outlook 2013–14, Australian Government, 2013
4. The Australian Government Treasury, 2010, Australia to 2050: Future Challenges, Australian Government, Canberra
5. Harris, P, 2013, Productivity and the National Income Outlook, Trans-Tasman Business Circle Productivity Series dinner, 18 September 2013
6. The Australian Government Treasury, 2010, Australia to 2050: Future Challenges, Australian Government, Canberra
7. Australian Bureau of Statistics, 2012, Estimates of Industry Multifactor Productivity, Australia: Detailed Productivity Estimates, Catalogue number 5260.0.55.002, Australian Bureau of Statistics, Canberra
8. Based on Organisation for Economic Co-operation and Development, Transport Infrastructure Investment and Maintenance Spending Dataset
9. ABARES 2013, Agricultural Commodities: December Quarter 2013, Australian Bureau of Agricultural and Resource Economics and Sciences, Canberra
10. BREE 2013, Resources and Energy Quarterly: December Quarter 2013, BREE, Canberra, December 2013
11. Linehan, V, Thorpe, S, Andrews, N, Kim, Y & Beaini, F, 2012, Food Demand to 2050: Opportunities for Australian Agriculture, ABARES Conference, Canberra
12. ABS Cat 3222.0, 26 November 2013
13. The Australian Government Treasury, 2010, Australia to 2050: Future Challenges, Australian Government, Canberra
14. Bureau of Infrastructure, Transport and Regional Economics, 2007, Estimating urban traffic and congestion cost trends for Australian cities, Working paper 71, BITRE, Canberra.
15. Based on Bureau of Infrastructure, Transport and Regional Economics data, analysis and projections
16. Deloitte Access Economics, 2011, The True Value Of Rail, Australasian Railway Association, Canberra)
17. Australian Rail Track Corporation, 2010, Melbourne–Brisbane Inland Rail Alignment Study, ARTC, Adelaide
18. Hale, C, 2011, Evolving Futures for Australian and International Passenger Rail, Australasian Transport Research Forum, Adelaide
19. Oxford Economics 2011, Economics Benefits from Air Transport in Australia
20. Based on Bureau of Infrastructure, Transport and Regional Economics data, analysis and projections
21. Based on Customs freight data from Australian Bureau of Statistics and Bureau of Infrastructure, Transport and Regional Economics data, analysis and projections
22. Based on Bureau of Infrastructure, Transport and Regional Economics data, analysis and projections
23. CLIA 2012, Cruise Industry Report Australia 2012, Cruise Lines International Association Australasia
24. Mees P and Groenhart 2012, Transport Policy at the Crossroads: travel to work in Australian capital cities 1976–011, School of Global, Urban and Social Studies, RMIT, Melbourne
25. Based on Bureau of Infrastructure, Transport and Regional Economics data, analysis and projections
26. Australian Bureau of Statistics, 2013, Review: Regional Development Australia Committee Plans, Catalogue no. 1861.0 – 2013, Australian Bureau of Statistics, Canberra
27. Based on Bureau of Infrastructure, Transport and Regional Economics data, analysis and projections
28. Based on Australian Bureau of Statistics 2011 census statistics29. Bureau of Infrastructure, Transport and Regional Economics 2011,
Truck productivity: sources, trends and future prospects, Report 123, Canberra
30. Department of Infrastructure and Regional Development, Road Safety, accessed October 2013, http://www.infrastructure.gov.au/roads/safety/
31. International Transport Forum, 2013, Road Safety Annual Report 2013, OECD, Paris, France
32. Bureau of Infrastructure, Transport and Regional Economics 2013, Yearbook 2012 Australian infrastructure statistics, Canberra
33. Joint Standing Committee on Road Safety (Staysafe), Parliament of New South Wales, Report on the inquiry into road user distraction, March 2013
34. Department of Infrastructure and Transport, 2010, In-car distractions and their impact on driving activities, Australian Government, Canberra
35. Bureau of Infrastructure, Transport and Regional Economics, 2012, Traffic Growth: Modelling a Global Phenomenon BITRE Report 128, Canberra
36. Department of Industry, Innovation, Climate Change, Science, Research and Tertiary Education, 2013, Climate Adaptation Outlook, Australian Government, Canberra
37. Organisation for Economic Co-operation and Development, 2013, Building Blocks for Smart Networks, OECD Digital Economy Papers, No. 215, OECD, Paris, France
38. Department of Broadband, Communications and the Digital Economy, 2013, Advancing Australia as a Digital Economy: Update to the National Digital Economy Strategy, Australian Government, Canberra

www.infrastructure.gov.auINFRA1996 February 2014