Embed Size (px)
Citation preview

PAPYRUS AUSTRALIA LTD
ABN 63 110 868 409
ANNUAL REPORT
FOR THE YEAR ENDED 30 JUNE 2012
For
per
sona
l use
onl
y

Contents
Corporate information 3
Directors’ report 4
Auditor’s independence declaration 17
Consolidated Statement of Comprehensive Income 18
Consolidated Statement of Financial Position 19
Statement of Changes in Equity 20
Consolidated Statement of Cash Flows 21
Notes to the Financial Statements 22
1 Nature of operations 22
2 General information and statement of compliance 22
3 Changes in accounting policies 22
4 Summary of accounting policies 24
5 Parent Information 32
6 Operating Segments 33
7 Revenue and expenses 33
8 Income tax expense 34
9 Earnings per share 35
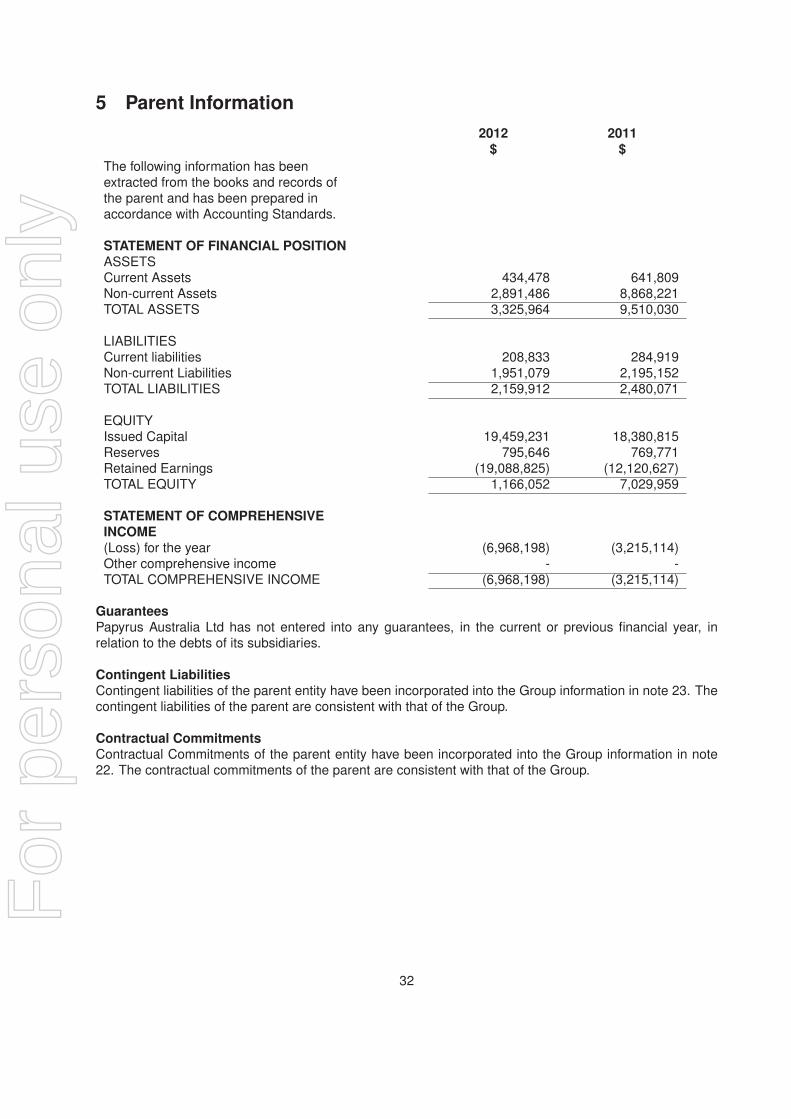
10 Cash and cash equivalents 36
11 Trade and other receivables 37
12 Other current assets 38
13 Property, plant and equipment 38
14 Intangible assets 39
15 Share based payments 39
16 Trade and other payables 41
17 Borrowings 41
18 Provisions 41
19 Other non-current liabilities 42
20 Issued capital 42
1
For
per
sona
l use
onl
y

21 Reserves 43
22 Committments for expenditure 43
23 Contingent liabilities and contingent assets 44
24 Auditor’s remuneration 44
25 Controlled and other entities 44
26 Financial risk management 45
27 Related party disclosure and key management personnel remuneration 47
28 Going concern 49
Directors’ Declaration 50
Auditor’s Report to the members of Papyrus Australia Limited 51
ASX Additional Information 54
2
For
per
sona
l use
onl
y

Corporate information
This annual report covers both Papyrus Australia Ltd (ABN 63 110 868 409) as a consolidated group(’Group’) comprising Papyrus Australia Ltd and its subsidiaries. The Group’s functional and presentationcurrency is Australian dollars.
A description of the Group’s operations and of its principal activities is included in the review of operationsand activities in the directors’ report on pages 5 to 10. The directors’ report is not part of the financial report.
DirectorsMr Edward Byrt, ChairmanMr Ramy Azer, Managing DirectorMr Donald Stephens, Non-Executive DirectorMr Christopher Smerdon, Non-Executive Director (Resigned 31 August 2011)Mr Colin Dunsford, Non-Executive Director
Company SecretaryMr Pierre Van Der Merwe
Registered OfficeC/- HLB Mann Judd (SA) Pty Ltd169 Fullarton RoadDULWICH SA 5065
Principal place of businessBuilding 42, Adelaide University Research Precinct12 Queen StreetTHEBARTON SA 5031
Share RegisterComputershare Investor Securities Pty LtdLevel 5, 115 Grenfell StreetADELAIDE SA 5000
Legal AdvisorsO’Loughlins LawyersLevel 2, 99 Frome StreetADELAIDE SA 5000
BankersNational Australia Bank22 - 28 King William StreetADELAIDE SA 5000
AuditorsGrant Thornton, South Australian PartnershipChartered AccountantsLevel 167 Greenhill RoadWAYVILLE SA 5034
3
For
per
sona
l use
onl
y

Directors’ report
Your directors present their report on the consolidated group for the financial year ended 30 June 2012.
DirectorsThe names of the Directors in office at any time during, or since the end of, the year are:
Mr Edward Byrt, ChairmanMr Ramy Azer, Managing DirectorMr Donald Stephens, Non-Executive DirectorMr Colin Dunsford, Non-Executive DirectorMr Christopher Smerdon (resigned 31 August 2011)
Directors have been in office since the start of the financial year to the date of this report unless otherwisestated.
Names, qualifications, experience and special responsibilities
Mr Edward Byrt, LLB, (Chairman)
Ted Byrt is a company director with over 30 years experience in commerce, corporate governance andinternational business. He is a specialist strategic advisor for major development and infrastructure projectswithin Australia and offshore.
Ted is a business advisor and Board member of several leading organisations in South Australia. Heis Presiding Member of the Development Assessment Commission, Chairman of the China Cluster, TheAustralian Advanced Manufacturing Centre Pty Ltd and SMAC Technologies Pty Ltd, a Director of TreyoLeisure & Entertainment Ltd (ASX listed) and a Board member of the Aboriginal Foundation of SA Inc. Heis also a member of the Company’s Audit committee and has been a Director of Papyrus since 2004.
Mr Ramy Azer, MSTC, MSc (Eng), Grad Dip Bus, Bachelor of Engineering (Mechanical), (ManagingDirector)
Ramy Azer is the founder and developed the Company’s technology. He has been a regular guest lecturerand speaker on issues including sustainable business development and innovation.
Ramy has been Managing Director since 2005 and prior to that had 10 years experience with PapyrusTechnology Pty Ltd.
Mr Donald Stephens, BAcc, FCA, (Non-Executive Director)
Donald Stephens is a Chartered Accountant and corporate adviser with over 20 years experience in theaccounting industry, including 14 years as a partner of HLB Mann Judd Stephens, a firm of CharteredAccountants.
Donald is a non-executive director of Mithril Resources Ltd and TW Holdings Ltd and is company secretaryto Toro Energy Ltd, Minotaur Exploration Ltd, and Petratherm Ltd (all ASX Listed entities). He holdsother public company secretarial positions and directorships with private companies and provides corporateadvisory services to a wide range of organisations.
He is also a member of the Company’s Audit committee.
4
For
per
sona
l use
onl
y

Mr Colin Dunsford, B.Ec., FCA, (Non-Executive Director)
Colin is a former partner of Ernst and Young, having joined the firm in May 2002 as a result of the integrationwith Arthur Andersen. At Arthur Andersen, Colin was Managing Partner and Division Head of the AdelaideAssurance and Business Advisory Division with many client responsibilities, a position held at Ernst andYoung until his retirement in July 2010. During his more than 40 year professional career, Colin has hadextensive experience with a wide range of corporate, government and incorporated clients in Australia andthe United States of America.
Colin’s current directorships include, Chairman of Bedford Group, Independent Gaming Corporation, AdelaideSymphony Orchestra and Leaders Institute of South Australia. Board member of Aboriginal Foundation ofSouth Australia and University of Adelaide Finance Committee. Colin joined the Board of Papyrus AustraliaLtd in October 2010 and is Chairman of the Company’s Audit committee.
Mr Christopher Smerdon, (Non-Executive Director)
Chris Smerdon has extensive experience in the Information Technology field. He founded Protech Australasiain 1984 and was Managing Director until he sold his interests in 1995. Under his leadership, Protechcommenced as a start up and was developed into a national business with offices located throughoutAustralia. In 1996, he established IT Services Group which in 2001 became part of Vectra Corporation Ltd,an international player in Security Consulting Solutions and Infrastructure. Chris is currently a Director of theSouth Australia Government Motorsport Board, Kangaroo Island Sealink Ltd and Coachlines of AustraliaPty Ltd.
COMPANY SECRETARY
Mr Pierre Van Der Merwe, CA
Pierre is a Chartered Accountant with over 20 years experience and is currently a director of HLB Mann Judd(SA) Pty Ltd, a firm of Chartered Accountants in Adelaide, and a number of other private companies. Heprovides corporate advice and support to a number of companies listed on the ASX, has held the positionof Company Secretary to ASX listed companies and is currently Company secretary to a number of unlistedcompanies. Pierre has extensive experience in the provision of professional services to clients, includingtax consulting, management of client accounting systems, reporting at Board level assisting with financialinterpretations and strategic planning. He is also a Fellow of the Financial Services Institute of Australasia.
REVIEW OF OPERATIONS
CorporateDuring the financial year:-
• The Company placed a total of 21,640,000 ordinary fully paid shares at a price of $0.05, raising $1.082million; and
• A total of 750,000 unlisted options with an exercise price of $0.12 and an expiry date of 30 June 2016were issued to key management personnel.
5
For
per
sona
l use
onl
y

The Company’s commercialisation strategy is to be a technology licensing company assisting suitableentities to establish banana veneering and fibre production factories in locations worldwide where bananasare grown. The Company’s revenue will be generated from technology licencing fees, machinery sales andsupport services. To that end the commercial focus during FY12 was on developing its operational activityin Egypt, the market for product in Egypt and Europe, and the development of the joint venture companyYellow Pallet BV based in the Netherlands. The Company significantly reduced its operating costs, includingthe non payment of directors’ fees, to preserve working capital. At 30 June 2012, the Company held $366kin available cash.
Mr Christopher Smerdon retired as a director of the Company on 31 August 2011. The Company chose notto replace the position.
The Company’s 2011 Annual Report was published: ASX Announcement 21 November 2011.
The Annual General Meeting of the Company was held on 23 November 2011 whereat the Chairmanand Managing Director gave comprehensive reviews of the Company’s operations: ASX Announcements21 October 2011 and 23 November 2011.
During the period Shareholder Newsletters were published: ASX Announcements - 20 October 2011, 18January 2012, 18 April 2012 and 25 June 2012.
The company’s leased facility at Yeerongpilly, Brisbane, Queensland (former Brimms factory) ceased on 30June 2012. Removal of all redundant plant and equipment has taken place and all settlement arrangementswith the landlord were achieved satisfactorily.
Intellectual PropertyThe Company’s intellectual property bank continued to grow. During FY12, patents were granted for theMethod and Apparatus for Removing Sheets of Fibres from Banana Plants (Original Patent) by the UnitedStates and Taiwan. Patent rights have now been granted for this patent in the following countries: Australia,China, Egypt, Hong Kong, Indonesia, Japan, Malaysia, Mexico, New Zealand, Peru, Philippines, Russia,Singapore, South Africa, Vietnam, African Regional Intellectual Property Organisation (ARIPO) countries,the United States and Taiwan.
The Company’s patent application for Improved Fibre Furnish has entered the national phase for patentprotection in the following Patent Cooperation Treaty (PCT) countries: Australia, Brazil, Canada, China,Egypt, Hong Kong, India, Japan, Mexico, New Zealand, Russia, Sri Lanka, Ukraine and USA. This patent isfor the production of fibre chips (to be used for the making of panel and other products) and directly relatesto the Fibre Production Unit, recently developed, and attaches to the Beta Veneering Unit (which is thepatent protected under the group’s Original Patent).
Capital RaisingA share placement announced to the market on 7 November 2011 injected $1082K in capital to theCompany. The first tranche of $722K occurred in November 2011: ASX Announcement 7 November 2011.The balance via the second tranche of $360k followed a General Meeting of Shareholders held on 18January 2012: ASX Announcement 18 January 2012. The funds raised were applied to working capitalrequirements in particular, to assist the Company in continuing to support the establishment of PapyrusEgypt and the Yellow Pallet project.
6
For
per
sona
l use
onl
y

Papyrus EgyptThe Company’s objective in Egypt is to develop the world’s first integrated commercial banana fibre andbanana veneer factory utilising waste banana tree trunks and developing strategic alliances with suppliers ofraw materials, users of the factory’s off take and distributers and users of the product produced in Egypt andEurope. Papyrus Australia Ltd in addition to being a 50% equity holder of the established company PapyrusEgypt will also supply the machinery, intellectual property and know-how under a licence agreement andmachinery purchase agreement.
The choice of Egypt, more specifically Sohag in Upper Egypt (over 500km South of Cairo in the Nile Valley),as the location of the first factory was a considered strategic decision of the Board, having regard to manyfactors not the least of which were:
• the identified demand in Egypt for a new indigenous renewable and sustainable source of fibre - Egyptdoes not have any forests and imports at great cost most of the fibre required for its considerabledomestic consumption;
• the comparatively cheaper and readily available energy, labour and infrastructure costs in UpperEgypt;
• the availability of abundant quantities of waste banana tree trunk material in Upper Egypt which iscurrently a nuisance waste by-product of banana fruit production; and
• the encouragement of the Egyptian government, the Executive Governor of the Sohag Governate inUpper Egypt (a Governate is the equivalent of a State in the Australian context), and leading businessorganisations such as the National Bank of Egypt and the Upper Egypt Investment Company, andregional communities, to establish a new, and for Upper Egypt, a significant economic enterprisewhich benefits the community and the environment.
Papyrus Egypt has been granted land by the local authorities of 2,000sqm in the Kawthar industrial estatein Sohag to build the factory which is around 1200 sqm of concrete and masonry construction build.The necessary operating infrastructures have been connected. This is at the cost of our partner, theEgypt Banana Fibre Company (EBFC). EBFC is solely responsible to fund the capital and initial operatingrequirements of Papyrus Egypt through the joint venture and Papyrus Australia will own 50% of the issuedshares in Papyrus Egypt. Details of EBFC have been advised to the market during FY12 - refer ShareholderNewsletters noted above.
Another important participant in Egypt is the Egyptian Government owned NAG- HAMADY Fiber BoardCompany also based in the Sohag Governate. NAG-HAMADY is Egypt’s largest producer of bagasse fibre(from sugarcane) MDF panelboard sold in Egypt and the Middle East region, and is seeking additionalsources of agricultural fibre for its growing business to export to Europe. NAG-HAMADY has successfullyundertaken testing of banana fibre (sourced from the Company’s Walkamin Demonstration factory in FarNorth Queensland) and the off take fibre from the Papyrus Egypt factory, once operational, will be anadditional natural fibre source for NAG-HAMADY for their existing business of panelboard manufacture.
As the Chairman said in the June 2012 Shareholder Newsletter, Egypt continues to challenge the Companybecause of the prolonged unsettled political environment and consequently the social and economic climate,that has caused some uncertainty and slowed the decision making processes of government and business.The Board is of the view that patience and persistence are required and remains confident of the future forthe Papyrus Egypt project.
7
For
per
sona
l use
onl
y

Yellow PalletThe company Yellow Pallet B.V. has been incorporated in the Netherlands with Papyrus Australia owning50% equity. Details of the other joint venture partners are contained in the Shareholder Newsletter No4 published in October 2011. The objective of the Yellow Pallet project is to develop technology andnew patented machinery to produce pallets from banana fibre for use in the logistic industry starting withtransport pallets for use initially by the banana industry in central and southern America.
The proposal is for Yellow Pallet to sell banana fibre producing factories which will comprise the patentedPapyrus banana veneering and fibre producing machines to be manufactured by the Papyrus Australiawholly owned subsidiary The Australian Advanced Manufacturing Centre Pty Ltd (AAMC). Yellow Pallet willalso be the sole supplier of proprietary adhesives and other specialist machines needed to manufacturebanana fibre pallets.
In March 2012 a consulting company to Yellow Pallet, Hollandia Systems B V (a leading Dutch machineryand processing equipment manufacturing company) had a senior engineer visit the Walkamin DemonstrationFactory to witness and assess the proprietary Papyrus technology and processes and validate the productioncapacity of the machines.
The pre-feasibility work already undertaken by the Yellow Pallet project team suggests that this projectwill:
• Prove the utilisation of waste banana fibre and create a new industry;
• Address the huge demand from the global shipping pallet market currently relying on forest sourcedtimber;
• Realise a price reduction per pallet from around US$11 to about US$9;
• Create at least 150 jobs per pallet factory;
• Create a stream of new bio-mass (renewable energy source) to Europe, USA and Japan; and
• Reduce carbon emissions and the use of wood.
In addition to being a 50% equity holder of this project, the Company, through its subsidiary AAMC, standsto significantly benefit from this project through the sale of the Papyrus proprietary machines for each factoryand ongoing maintenance contracts.
The Yellow Pallet project is supported in various ways by a number of governmental, institutional and privatecompanies in Europe.
The most recent activity of the project team is the preparation of a comprehensive business case to take toidentified funding institutions.
Product DevelopmentTesting of fibre and products occurred on several fronts during the year. The process was to submitbatch quantities of fibre chips taken from the Company’s Walkamin factory and utilising various recipes,techniques and formulae under heat test and pressure conditions to produce panel. The test panels havebeen submitted for independent testing and evaluation. The objective is to achieve results of suitablestandards and certification to enable banana fibre panel to be offered as a sustainable and superiorpanelboard product alternative to wood-based products for use in the construction industry.
The Australian trials with fibre conducted early in the year concluded more work was required on the bindingproperties for structural panel which has now been taken up by NAG-HAMADY in Egypt and the FraunhofferInstitute in Germany. However, for non structural panel such as ceiling/acoustic tiles and insulation itappears banana fibre is quite suitable and is to be market tested.
8
For
per
sona
l use
onl
y

NAG-HAMADY has now satisfactorily completed its own scientific analysis and industrial testing of bananafibre for the purpose of making fibre board (MDF). Together with another Egyptian company Abu El Holl,a large panelboard manufacturer introduced by NAG-HAMADY, we have jointly funded and commissionedthe Fraunhofer Institute to develop the formula to make certifiable industrial-use panelboard from bananafibre. Papyrus Australia will retain ownership of any new intellectual property developed by Fraunhoffer.These two Egyptian companies (NAG-HAMADY and Abu El Holl) remain active and interested prospectivecommercial participants in the business opportunities presented in Egypt and Europe for MDF and panelboard production from banana fibre, as an alternate to the use of wood products.
The Fraunhofer Institute is Europe’s largest agricultural application orientated research organisation and isregarded as a world leading panelboard research Institute. We expect this project to deliver an independentverification of the formula and the costs of producing panel board from banana fibre for certifiable industrialuse worldwide. The results are expected in Q1 of FY13.
EBFC continues to process the veneer produced and sold from the Walkamin Demonstration Factoryfor the making of floorboards (the veneer being applied to MDF/HDF substrate), skins for doors anddecorative panels for sale in Egypt and Europe. Additionally, EBFC has been supplying a company locatedin Holland, Steward Design Panels, with banana veneer laminate on bagasse MDF panel board. Stewardhas designed and engineered this product to create decorative acoustic ceiling panels, which has attractedthe architectural profession and are now being installed in major projects in Holland. Images of theseproducts and a catalogue can be viewed at Papyrus Australia’s website: www.papyrusaustralia.com.au.The banana veneered floorboards and the decorative banana veneered panels made by EBFC are the firsttotally "green" natural fibre panels available in Egypt and Europe - absolutely tree free. This is a significantmarketing edge for the Papyrus branded products.
During the year an alternative veneer drying process using pressure as an alternative to oven dryingwas trialled at the Company’s Walkamin factory. The testing was successful and the process has beendocumented. This drying process will now be applied at a commercial scale when the Egypt factory isready for production.
Testing for banana fibre strength and utility for the making of pallets for the Yellow Pallet project is beingconducted by the Wageningen University in the Netherlands and these results will be known in Q1 of FY13.
The Australian Advanced Manufacturing Centre Pty Ltd (AAMC)AAMC is the wholly owned subsidiary of Papyrus Australia Ltd located at Stirling Street, Thebarton, SouthAustralia. The Company’s main function is to design, build, commission and service machinery andequipment required by Papyrus and other customers.
The Board of AAMC decided to close down its precision engineering workshop early in the year due tothe down turn in the economy and limited work being available or prospectively available in the short term.The tool shop has been contracted out in the interim. The plant and equipment will be available to theCompany if and/or when required in the future.
The completion of 2 new veneering machines has been put on hold until such time as sufficient fundingarrangements are in place from Egypt.
9
For
per
sona
l use
onl
y

The Walkamin Demonstration FactoryThe Company previously reported that production at the Walkamin Demonstration Factory had been scaledback to preserve working capital while the Company focuses its efforts in the development of the Egyptfacility. Prior to the scale back in Q1, the Company was able to confidently demonstrate the machinery andin-line production - that is the linkages between the Log Yard and conveying system, to the Beta VeneeringUnit, to the drying process for veneer and Fibre Production Unit for fibre chips - worked seamlessly. Thiswas an important milestone in the context of developing the Company’s (through Papyrus Egypt) first fullscale operation in Egypt. Work continued during the period making minor enhancements to the BetaVeneering and the Fibre Production Units and producing sample batches of fibre forwarded for testingin Egypt, Germany and the Netherlands.
Environmental ValueThe Company continues to monitor the developments and opportunities in carbon emission reductioninitiatives worldwide. As previously reported, the Company is cognisant that the conversion of bananatree trunk waste into usable product will generate particularly in developing countries, "carbon certificates"which are able to be monetised and are presently tradeable in Europe.
Specifically in reference to the Company’s development in Egypt, a developing country, a carbon emissionreduction project is eligible within the United Nations sponsored Clean Development Mechanism (CDM)and Papyrus Egypt is likely to be eligible for carbon certificates which are presently tradeable in Europe. AsYellow Pallet factory facilities will be in developing countries as well, these same benefits are likely to apply.
Update post 30 June 2012In July 2012 the Company was pleased to receive the grant of patent from African Intellectual PropertyOrganization (OAPI) and Israel for the Company’s original patent application – Method and Apparatus forRemoving Sheets of Fibres from Banana Plants.
In July 2012 the Managing Director travelled to Egypt and Europe to progress the development of PapyrusEgypt and to advance the business of Yellow Pallet. He was joined by the Chairman in Egypt in late July2012. The Managing Director remained in Egypt until mid August. The Company will announce any materialdevelopments from Egypt/Europe as matters progress and as required.
Going Concern - cash position of the CompanyThe Directors of the Company have prepared a comprehensive cash budget for the 13 month periodSeptember 2012 to September 2013 demonstrating a positive cash position in each monthly period basedon expected cash inflows from the activities of Papyrus Egypt and the Yellow Pallet project and knownexpenditures.
In line with those expectations the Company is in receipt of a non conditional Letter of Credit (LOC) fromEBFC (the Company’s Egyptian joint venture partner) to the value of USD50k issued by the National Bankof Egypt. The Company is currently endeavouring to secure a further non conditional LOC of USD100kfrom EBFC. Additionally the Company expects to receive a cash payment into its Australian bank accountof USD50k from EBFC by the end of September 2012 - all as progress payments for machinery purchasefrom the Company’s engineering subsidiary AAMC.
The Company is also assisting EBFC in its negotiations to secure a loan of up to USD2.0M to PapyrusEgypt for further machinery payments to AAMC.
The Company is currently in negotiations to secure a company experienced in machinery developmentto assist AAMC with the development and construction of the proprietary Papyrus technology by way of alicence for a fee(s).
10
For
per
sona
l use
onl
y

OPERATING RESULTSThe consolidated loss of the group after providing for income tax amounted to ($5,391,335) [2011: ($4,791,977)].
INTERESTS IN THE SHARES AND OPTIONS OF THE COMPANY AND RELATED BODIES CORPORATE
As at the date of this report, the interests of the directors in the shares and options of Papyrus Australia Ltdwere:
Number of OrdinaryShares
Number of Optionsover Ordinary Shares
Mr Edward Byrt 4,796,597 416,667Mr Colin Dunsford 23,810 -Mr Ramy Azer 28,678,853 1,250,000Mr Donald Stephens 975,630 -
DIVIDENDS PAID OR RECOMMENDEDNo dividends were paid or declared since the start of the financial year. No recommendation for paymentof dividends has been made.
PRINCIPAL ACTIVITIESThe Group’s commercialisation strategy remains focused on being a technology licensing Group assistingsuitable entities to establish banana veneering and panel production factories in locations worldwide wherebananas are grown.
There have been no significant changes in the nature of those activities during the year.
SIGNIFICANT CHANGES IN THE STATE OF AFFAIRSNo matters or circumstances have arisen since the end of the financial year which significantly affected ormay significantly affect the operations of the Group, the results of those operations, or the state of affairs ofthe Group in future financial years.
FUTURE DEVELOPMENTSDisclosure of information regarding likely developments in the operations of the consolidated entity in futurefinancial years and the expected results of those operations is likely to result in unreasonable prejudice tothe consolidated entity. Accordingly, this information has not been disclosed in this report.
ENVIRONMENTAL REGULATIONSThe Group’s operations are not subject to any significant environmental regulations under either Commonwealthor State legislation. The Group however believes that it has adequate systems in place for the managementof any future environmental regulations.
SUBSEQUENT EVENTSNo matters or circumstances have arisen since 30 June 2012 that has significantly affected, or may significantlyaffect the operations of the Group.
11
For
per
sona
l use
onl
y

Unissued SharesAt the date of this report, the following options to acquire ordinary shares in the Company were on issue:
Issue Date Expiry Date ExercisePrice
Balance at 1July 2011
NetIssued/(Exercisedor expired) during
year
Balance at30 June
2012
14/08/2006 13/08/2011 $0.40 500,000 (500,000) -14/08/2006 13/08/2011 $0.50 500,000 (500,000) -08/10/2007 07/10/2012 $0.80 250,000 - 250,00008/10/2007 07/10/2012 $1.25 250,000 - 250,00015/10/2007 14/10/2012 $0.80 250,000 - 250,00015/10/2007 14/10/2012 $1.25 250,000 - 250,00001/07/2008 30/06/2013 $1.50 100,000 - 100,00001/07/2008 30/06/2013 $1.75 100,000 - 100,00017/03/2009 16/03/2014 $1.50 125,000 - 125,00017/03/2009 16/03/2014 $1.50 175,000 - 125,00017/02/2011 31/03/2013 $0.12 4,825,974 - 4,825,97424/03/2011 31/03/2013 $0.12 1,666,667 - 1,666,66701/07/2011 30/06/2016 $0.12 - 750,000 750,000
8,942,641 (250,000) 8,692,641
SHARE OPTIONS
Shares issued as a result of exercise of optionsNo shares were issued a result of an exercise of options during the financial year.
New options issuedDuring the financial year, 750,000 options were issued to an employee of the Company under the EmployeeShare Option Plan. The options have an exercise price of $0.12 and expire 30 June 2016.
INDEMNIFICATION AND INSURANCE OF DIRECTORS AND OFFICERSTo the extent permitted by law, the Company has indemnified (fully insured) each Director and the CompanySecretary of the Company for a premium of $15,388. The liabilities insured include costs and expensesthat may be incurred in defending civil or criminal proceedings (that may be brought) against the officers intheir capacity as officers of the Company or a related body, and any other payments arising from liabilitiesincurred by the officers in connection with such proceedings, other than where such liabilities arise out ofconduct involving a wilful breach of duty by the officers or the improper use by the officers of their positionor of information to gain advantage for themselves or someone else or to cause detriment to the Company.
REMUNERATION REPORT - AUDITED
This report outlines the remuneration arrangements in place for Directors and executives of Papyrus AustraliaLtd.
Remuneration philosophyThe Board is responsible for determining remuneration policies applicable to Directors and senior executivesof the Group. The broad policy is to ensure that remuneration properly reflects the individuals’ dutiesand responsibilities and that remuneration is competitive in attracting, retaining and motivating people withappropriate skills and experience. At the time of determining remuneration consideration is given by theBoard to the Group’s financial performance.
12
For
per
sona
l use
onl
y

Employment contractsThe employment conditions of the Managing Director, Mr Ramy Azer, are formalised in a services contractbetween his related entity Talisker (SA) Pty Ltd and Papyrus Australia Ltd and his fee is $300,000 per annum(exclusive of GST). The Company may terminate the services contract without cause by providing one (1)month’s written notice or making payment in lieu of notice, based on the annual fee. Termination paymentsare generally not payable on resignation or dismissal for serious misconduct. In the instance of seriousmisconduct the Company can terminate employment at any time.
The employment conditions of the Chief Executive Mr Geoff Whitbread, are formalised in a services contractdated 5 July 2010. The contract provides for a daily fee rate of $900 (exclusive of GST). Mr Whitbread isresponsible for the non engineering aspects of the Company’s operation and reports to Company’s Boardof Directors. The Company may terminate the services contract without cause by providing one (1) month’swritten notice or making payment in lieu of notice, being calculated as 20 days at the daily rate. Terminationpayments are generally not payable on resignation or dismissal for serious misconduct. In the instance ofserious misconduct the Company can terminate employment at any time.
Key management personnel remuneration and equity holdingsThe Board currently determines the nature and amount of remuneration for Board members and seniorexecutives of the Group. The policy is to align director and executive objectives with shareholder andbusiness objectives by providing a fixed remuneration component and offering specific long-term incentives.
The non-executive directors and other executives receive a superannuation guarantee contribution requiredby the government, which is currently 9%, and do not receive any other retirement benefits. Some individuals,however, may choose to sacrifice part of their salary to increase payments towards superannuation. Allremuneration paid to directors and executives is expensed as incurred. Executives are also entitled toparticipate in the Group share option scheme. Options are valued using the Black-Scholes methodology.
The board policy is to remunerate non-executive directors at market rates based on comparable companiesfor time, commitment and responsibilities. The Board determines payments to non-executive directors andreviews their remuneration annually, based on market practice, duties and accountability. Independentexternal advice is sought when required.
USE OF REMUNERATION CONSULTANTSDuring the financial year, there were no remuneration recommendations made in relation to key managementpersonnel for the Company by any remuneration consultants.
VOTING AND COMMENTS MADE AT THE COMPANY’S 2011 ANNUAL GENERAL MEETINGPapyrus Australia Ltd received more than 91% of "yes" votes on its remuneration report for the 2011 financialyear by proxy. The Company did not receive any specific feedback at the AGM on its remuneration report.
13
For
per
sona
l use
onl
y
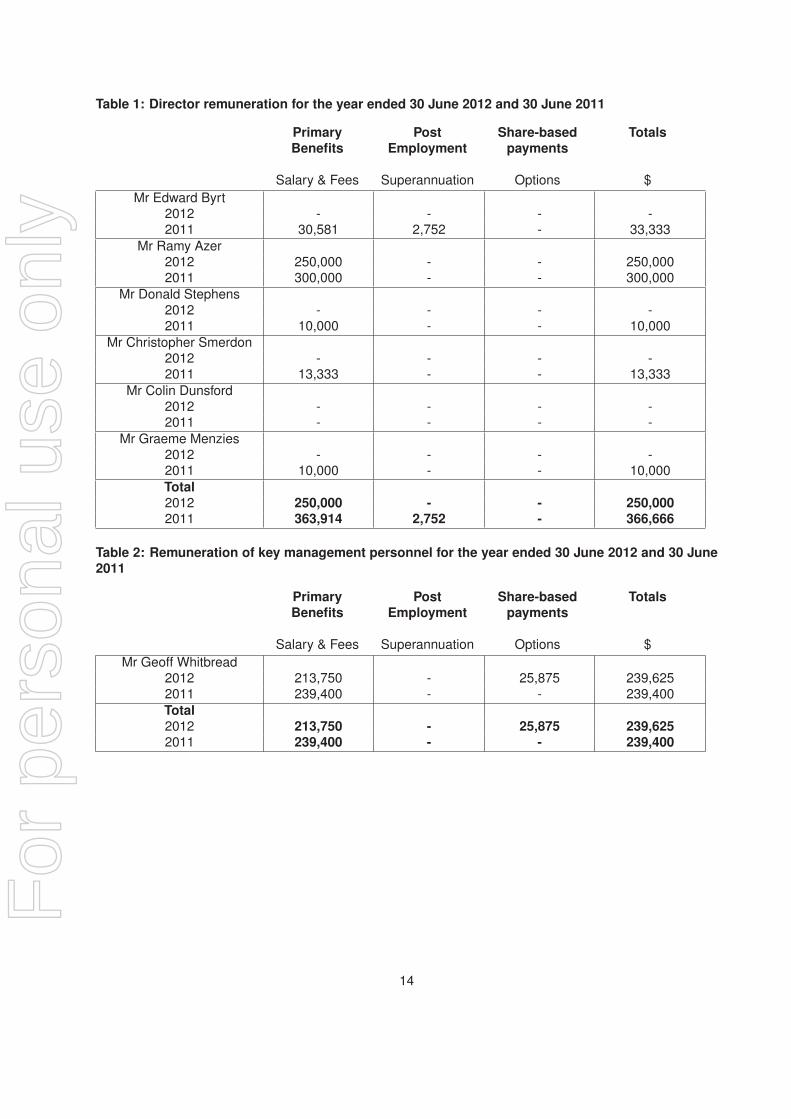
Table 1: Director remuneration for the year ended 30 June 2012 and 30 June 2011
PrimaryBenefits
PostEmployment
Share-basedpayments
Totals
Salary & Fees Superannuation Options $
Mr Edward Byrt2012 - - - -2011 30,581 2,752 - 33,333
Mr Ramy Azer2012 250,000 - - 250,0002011 300,000 - - 300,000
Mr Donald Stephens2012 - - - -2011 10,000 - - 10,000
Mr Christopher Smerdon2012 - - - -2011 13,333 - - 13,333
Mr Colin Dunsford2012 - - - -2011 - - - -
Mr Graeme Menzies2012 - - - -2011 10,000 - - 10,000
Total2012 250,000 - - 250,0002011 363,914 2,752 - 366,666
Table 2: Remuneration of key management personnel for the year ended 30 June 2012 and 30 June2011
PrimaryBenefits
PostEmployment
Share-basedpayments
Totals
Salary & Fees Superannuation Options $
Mr Geoff Whitbread2012 213,750 - 25,875 239,6252011 239,400 - - 239,400
Total2012 213,750 - 25,875 239,6252011 239,400 - - 239,400
14
For
per
sona
l use
onl
y

Table 3: Options granted as part of remuneration30 June 2012 Grant
DateGrant
NumberVesting
DateValue peroption at
grant date
Exerciseprice
Total fairvalue
% ofRemuner-
ation
Mr GeoffWhitbread
01/07/2011 500,000 01/07/2011 $0.035 $0.12 17,250 7.01%
Mr GeoffWhitbread
01/07/2011 250,000 01/01/2012 $0.035 $0.12 8,625 3.51%
No options were issued to any Key Management Personnel as part of remuneration for the year ended 30June 2011.
No portion of remuneration paid or payable to any Key Management Personnel employed by the Groupwas performance based in 2011 or 2012.
HLB Mann Judd (SA) Pty Ltd has received professional fees for accounting, taxation and secretarial servicesprovided during the year amounting to $67,308 (2011: $64,263). Mr Pierre Van Der Merwe, the CompanySecretary, is a director of HLB Mann Judd (SA) Pty Ltd and Mr Donald Stephens, Non-Executive Director,is a consultant to HLB Mann Judd (SA) Pty Ltd.
DIRECTORS’ MEETINGSThe number of meetings of Directors (including meetings of committees of Directors) held during the yearand the number of meetings attended by each Director were as follows:
Directors’ Meetings Audit Committee
Director Eligible Attended Eligible Attended
Mr Edward Byrt 16 16 2 2Mr Colin Dunsford 16 15 2 2Mr Ramy Azer 16 15 - -Mr Donald Stephens 16 13 2 2Mr Christopher Smerdon 2 2 - -
Members acting on the audit committee of the board are:Colin Dunsford (Chairman)Donald StephensEdward Byrt
PROCEEDINGS ON BEHALF OF THE GROUPNo person has applied for leave of Court to bring proceedings on behalf of the Group or intervene in anyproceedings to which the Group is a party for the purpose of taking responsibility on behalf of the Group forall or any part of those proceedings.
15
For
per
sona
l use
onl
y

AUDITOR INDEPENDENCE AND NON-AUDIT SERVICESGrant Thornton South Australian Partnership, in its capacity as auditor for Papyrus Australia Ltd, has notprovided any non-audit services throughout the reporting period. The auditor’s independence declarationfor the year ended 30 June 2012 as required under section 307C of the Corporations Act 2001 has beenreceived and can be found on page 17.
Signed in accordance with a resolution of the Directors.
Mr Ramy AzerManaging Director
27 September 2012
16
For
per
sona
l use
onl
y

Level 1,
67 Greenhill Rd
Wayville SA 5034
GPO Box 1270
Adelaide SA 5001
T 61 8 8372 6666
F 61 8 8372 6677
W www.grantthornton.com.au
Grant Thornton South Australian Partnership ABN 27 244 906 724
a subsidiary or related entity of Grant Thornton Australia Ltd ABN 41 127 556 389
Grant Thornton Australia Limited is a member firm within Grant Thornton International Ltd. Grant Thornton International Ltd and the member firms are not a worldwide partnership. Grant Thornton
Australia Limited, together with its subsidiaries and related entities, delivers its services independently in Australia.
Liability limited by a scheme approved under Professional Standards Legislation
AUDITOR�S INDEPENDENCE DECLARATION
TO THE DIRECTORS OF PAPYRUS AUSTRALIA LIMITED
In accordance with the requirements of section 307C of the Corporations Act 2001, as lead
auditor for the audit of Papyrus Australia Limited for the year ended 30 June 2012, I declare
that, to the best of my knowledge and belief, there have been:
a no contraventions of the auditor independence requirements of the Corporations Act
2001 in relation to the audit; and
b no contraventions of any applicable code of professional conduct in relation to the
audit.
GRANT THORNTON SOUTH AUSTRALIAN PARTNERSHIP Chartered Accountants
Justin Humphrey
Partner
Adelaide, 27 September 2012
For
per
sona
l use
onl
y

Consolidated Statement of Comprehensive Income
FOR THE YEAR ENDED 30 JUNE 2012
Consolidated Group
2012 2011$ $
Revenue from operating activities 7(a) 14,783 195,070Other income/(expenses) 7(b) 202,211 21,500Depreciation expense 7(c) (640,765) (280,148)Employee benefits expense 7(d) (981,223) (1,413,542)Other expenses 7(e) (1,162,899) (1,613,850)Impairment expense 13/14 (3,113,104) (1,989,489)
Loss before income tax expense (5,680,997) (5,080,459)
Income tax benefit/(expense) 8 289,662 288,482
Loss from continuing operations (5,391,335) (4,791,977)
Loss for the year (5,391,335) (4,791,977)
Loss attributable to members of the parententity
(5,391,335) (4,791,977)
Other comprehensive income - -
Total comprehensive income for the year (5,391,335) (4,791,977)
Total comprehensive income attributable tomembers of the parent entity
(5,391,335) (4,791,977)
Earnings per share: Cents Cents
Basic earnings per share 9 (4.43) (4.75)Diluted earnings per share 9 (4.43) (4.75)
The accompanying notes form part of these financial statements.
18
For
per
sona
l use
onl
y

Consolidated Statement of Financial Position
AS AT 30 JUNE 2012Consolidated Group
2012 2011Note $ $
CURRENT ASSETSCash and cash equivalents 10 366,071 832,919Trade and other receivables 11 35,651 52,551Other assets 12 40,649 74,356
TOTAL CURRENT ASSETS 442,371 959,826
NON-CURRENT ASSETSProperty, plant and equipment 13 1,810,628 5,093,770Intangible assets 14 2,144,593 2,888,330Other financial assets 25 19,367 -
TOTAL NON-CURRENT ASSETS 3,974,588 7,982,100
TOTAL ASSETS 4,416,959 8,941,926
CURRENT LIABILITIESTrade and other payables 16 82,386 223,940Borrowings 17 26,674 26,674Provisions 18 - 66,608Other current liabilities 19 100,000 -
TOTAL CURRENT LIABILITIES 209,060 317,222
NON-CURRENT LIABILITIESBorrowings 17 11,715 38,389Provisions 18 - 15,188Other non-current liabilities 19 3,030,132 3,118,031
TOTAL NON-CURRENT LIABILITIES 3,041,847 3,171,608
TOTAL LIABILITIES 3,250,907 3,488,830
NET ASSETS 1,166,052 5,453,096
EQUITYIssued capital 20 19,459,231 18,380,815Reserves 21 795,646 769,771Retained earnings/(accumulated losses) (19,088,825) (13,697,490)
TOTAL EQUITY 1,166,052 5,453,096
The accompanying notes form part of these financial statements.
19
For
per
sona
l use
onl
y

Statement of Changes in Equity
FOR THE YEAR ENDED 30 JUNE 2012
Consolidated Group
Issuedcapital
Retainedlosses
Share optionreserve
Total
$ $ $ $
Balance at 1 July 2010 16,889,136 (8,905,513) 761,252 8,744,875Total comprehensive loss - (4,791,977) - (4,791,977)Share based payments 21 - - 8,519 8,519Shares issued via privateplacement
20 1,558,234 - - 1,558,234
Transaction costs (net of tax) 20 (66,555) - - (66,555)
Balance as at 30 June 2011 18,380,815 (13,697,490) 769,771 5,453,096
Balance at 1 July 2011 18,380,815 (13,697,490) 769,771 5,453,096Total comprehensive loss - (5,391,335) - (5,391,335)Private placement on 9November 2011
20 722,000 - - 722,000
Private placement on 30January 2012
20 160,000 - - 160,000
Private placement on 10February 2012
20 200,000 - - 200,000
Transaction costs (net of tax) 20 (3,584) - - (3,584)Share-based payments 21 - - 25,875 25,875
Balance as at 30 June 2012 19,459,231 (19,088,825) 795,646 1,166,052
The accompanying notes form part of these financial statements.
20
For
per
sona
l use
onl
y

Consolidated Statement of Cash Flows
FOR THE FINANCIAL YEAR ENDED 30 JUNE 2012Consolidated Group
2012 2011Note $ $
CASH FLOWS FROM OPERATINGACTIVITIESReceipts from customers 41,513 158,007Research and Development concessionreceived
363,999 396,256
Payments to suppliers and employees (1,921,417) (3,156,338)Grant funds received - 623,023Interest received 14,783 92,929NET CASH USED IN OPERATING ACTIVITIES 10 (1,501,122) (1,886,123)
CASH FLOWS FROM INVESTING ACTIVITIESPayments for property, plant and equipment (92,024) (1,155,646)Purchase of develpoment assets (55,607) (23,525)Proceeds from sale of property, plant andequipment
131,700 -
NET CASH USED IN INVESTING ACTIVITIES (15,931) (1,179,171)
CASH FLOWS FROM FINANCINGACTIVITIESProceeds from issue of shares 1,082,000 1,558,234Transaction costs of issue of shares (5,121) (95,079)Repayment of borrowings (26,674) (9,054)NET CASH PROVIDED BY FINANCINGACTIVITIES
1,050,205 1,454,101
Net increase/(decrease) in cash and cashequivalents
(466,848) (1,611,193)
Cash at the beginning of the period 832,919 2,444,112
CASH AT THE END OF THE YEAR 10 366,071 832,919
The accompanying notes form part of these financial statements.
21
For
per
sona
l use
onl
y

Notes to the Financial Statements
FOR THE YEAR ENDED 30 JUNE 2012
These consolidated financial statements and notes represent those of Papyrus Australia Ltd and ControlledEntities (the "consolidated group" or group”).
The separate financial statements of the parent entity, Papyrus Australia Ltd, have not been presentedwithin this financial report as permitted by the Corporations Act 2001.
1 Nature of operations
Papyrus Australia Ltd’s principal activities is to continue its commercialisation strategy of being a technologylicensing Group assisting suitable entities to establish banana veneering and panel production factories inlocations worldwide where bananas are grown.
2 General information and statement of compliance
The consolidated general purpose financial statements of the Group have been prepared in accordance withthe requirements of the Corporations Act 2001, Australian Accounting Standards and other authoritativepronouncements of the Australian Accounting Standards Board. Compliance with Australian AccountingStandards results in full compliance with the International Financial Reporting Standards (IFRS) as issuedby the International Accounting Standards Board (IASB). Papyrus Australia Ltd is a for-profit entity for thepurpose of preparing the financial statements.
Papyrus Australia Ltd is a public company incorporated and domiciled in Australia and listed on the ASX(ASX Code: PPY).
The consolidated financial statements for the year ended 30 June 2012 (including comparatives) wereapproved and authorised for issue by the board of directors on 27 September 2012.
3 Changes in accounting policies
Adoption of AASBs and improvements to AASBs 2011 - AASB 1054 and AASB 2011-1
The AASB has issued AASB 1054 Australian Additional Disclosures and 2011-1 Amendments to AustralianAccounting Standards arising from the Trans-Tasman Convergence Project, and made several minor amendmentsto a number of AASBs. These standards eliminate a large portion of the differences between the Australianand New Zealand accounting standards and IFRS and retain only additional disclosures considered necessary.These changes also simplify some current disclosures for Australian entities and remove others.
Standards, amendments and interpretations to existing standards that are not yet effective andhave not been adopted early by the Company
At the date of authorisation of these financial statements, certain new standards, amendments and interpretationsto existing standards have been published but are not yet effective, and have not been adopted early by theGroup.
22
For
per
sona
l use
onl
y

Management anticipates that all of the relevant pronouncements will be adopted in the Group’s accountingpolicies for the first period beginning after the effective date of the pronouncement. Information on newstandards, amendments and interpretations that are expected to be relevant to the Group’s financial statementsis provided below.
Certain other new standards and interpretations have been issued but are not expected to have a materialimpact on the Company’s financial statements.
AASB 9 Financial Instruments (effective from 1 January 2015)
The AASB aims to replace AASB 139 Financial Instruments: Recognition and Measurement in its entirety.The replacement standard (AASB 9) is being issued in phases. To date, the chapters dealing with recognition,classification, measurement and derecognition of financial assets and liabilities have been issued. Thesechapters are effective for annual periods beginning 1 January 2015. Further chapters dealing with impairmentmethodology and hedge accounting are still being developed.
Management have yet to assess the impact that this amendment is likely to have on the financial statementsof the Company. However, they do not expect to implement the amendments until all chapters of AASB 9have been published and they can comprehensively assess the impact of all changes.
Consolidation Standards
A package of consolidation standards are effective for annual periods beginning or after 1 January 2013.Information on these new standards is presented below. The Group’s management have yet to assess theimpact of these new and revised standards on the Group’s consolidated financial statements.
AASB 10 Consolidated Financial Statements (AASB 10)
AASB 10 supersedes the consolidation requirements in AASB 127 Consolidated and Separate FinancialStatements (AASB 127) and Interpretation 112 Consolidation - Special Purpose Entities. It revised thedefinition of control together with accompanying guidance to identify an interest in a subsidiary. However,the requirements and mechanics of consolidation and the accounting for any non-controlling interests andchanges in control remain the same.
AASB 11 Joint Arrangements (AASB 11)
AASB 11 supersedes AASB 131 Interests in Joint Ventures (AASB 131). It aligns more closely the accountingby the investors with their rights and obligations relating to the joint arrangement. It introduces two accountingcategories (joint operations and joint ventures) whose applicability is determined based on the substance ofthe joint arrangement. In addition, AASB 131’s option of using proportionate consolidation for joint ventureshas been eliminated. AASB 11 now requires the use of the equity accounting method for joint ventures,which is currently used for investments in associates.
Consequential amendments to AASB 127 Separate Financial Statements (AASB 127) and AASB 128
Investments in Associates and Joint Ventures (AASB 128)
AASB 127 Consolidated and Separate Financial Statements was amended to AASB 127 Separate FinancialStatements which now deals only with separate financial statements. AASB 128 brings investments in jointventures into its scope. However, AASB 128’s equity accounting methodology remains unchanged.
AASB 13 Fair Value Measurement (AASB 13)
AASB 13 does not affect which items are required to be fair-valued, but clarifies the definition of fair valueand provides related guidance and enhanced disclosures about fair value measurements. It is applicablefor annual periods beginning on or after 1 January 2013. The Group’s management have yet to assess theimpact of this new standard.
23
For
per
sona
l use
onl
y

AASB 2011-9 Amendments to Australian Accounting Standards Presentation of Items of Other Comprehensive
Income (AASB 101 Amendments)
The AASB 101 Amendments require an entity to group items presented in other comprehensive incomeinto those that, in accordance with other IFRSs: (a) will not be reclassified subsequently to profit or lossand (b) will be reclassified subsequently to profit or loss when specific conditions are met. It is applicablefor annual periods beginning on or after 1 July 2012. The Group’s management expects this will change thecurrent presentation of items in other comprehensive income; however, it will not affect the measurementor recognition of such items.
AASB 2011-4 Amendments to Australian Accounting Standards to Remove Individual Key Management
Personnel Disclosure Requirements (AASB 124 Amendments)
AASB 2011-4 makes amendments to AASB 124 Related Party Disclosures to remove individual key managementpersonnel disclosure requirements, to achieve consistency with the international equivalent (which includesrequirements to disclose aggregate (rather than individual) amounts of KMP compensation), and removeduplication with the Corporations Act 2011. The amendments are applicable for annual periods beginningon or after 1 July 2013. The Group’s management have yet to assess the impact of these amendments.
4 Summary of accounting policies
(a). Overall considerations
The significant accounting policies that have been used in the preparation of these consolidated financialstatements are summarised below.
The consolidated financial statements have been prepared using the measurement bases specified byAustralian Accounting Standards for each type of asset, liability, income and expense. The measurementbases are more fully described in the accounting policies below.
In preparing the financial statements, all intercompany balances and transactions, income and expensesand profit and losses resulting from intra-group transactions have been eliminated in full. Subsidiariesare fully consolidated from the date on which control is transferred to the Group and ceases to beconsolidated from the date on which control is transferred out of the Group.
(b). Basis of consolidation
The Group financial statements consolidate those of the parent company and all of its subsidiaryundertakings drawn up to 30 June 2012. Subsidiaries are all entities over which the Group has thepower to control the financial and operating policies. The Group obtains and exercises control throughmore than half of the voting rights. All subsidiaries have a reporting date of 30 June.
(c). Income Tax
The income tax expense (revenue) for the year comprises current income tax expense (income) anddeferred tax expense (income).
Current income tax expense charged to profit or loss is the tax payable on taxable income. Current taxliabilities (assets) are measured at the amounts expected to be paid to (recovered from) the relevanttaxation authority.
Deferred income tax expense reflects movements in deferred tax asset and deferred tax liability balancesduring the year as well unused tax losses.
Current and deferred income tax expense (income) is charged or credited outside profit or loss whenthe tax relates to items that are recognised outside profit or loss.
24
For
per
sona
l use
onl
y

Except for business combinations, no deferred income tax is recognised from the initial recognitionof an asset or liability, where there is no effect on accounting or taxable profit or loss.
Deferred tax assets and liabilities are calculated at the tax rates that are expected to apply to theperiod when the asset is realised or the liability is settled and their measurement also reflects themanner in which management expects to recover or settle the carrying amount of the related asset orliability.
Deferred tax assets relating to temporary differences and unused tax losses are recognised only tothe extent that it is probable that future taxable profit will be available against which the benefits of thedeferred tax asset can be utilised.
Where temporary differences exist in relation to investments in subsidiaries, branches, associates, andjoint ventures, deferred tax assets and liabilities are not recognised where the timing of the reversalof the temporary difference can be controlled and it is not probable that the reversal will occur in theforeseeable future.
Current tax assets and liabilities are offset where a legally enforceable right of set-off exists and itis intended that net settlement or simultaneous realisation and settlement of the respective asset andliability will occur. Deferred tax assets and liabilities are offset where:
(a) a legally enforceable right of set-off exists; and
(b) the deferred tax assets and liabilities relate to income taxes levied by the same taxation authorityon either the same taxable entity or different taxable entities where it is intended that net settlementor simultaneous realisation and settlement of the respective asset and liability will occur in futureperiods in which significant amounts of deferred tax assets or liabilities are expected to be recoveredor settled.
(d). Investments in associates and joint ventures
Entities whose economic activities are controlled jointly by the Group and other ventures independent ofthe Group (joint ventures) are accounted for using the proportionate consolidation method, whereby theGroup’s share of the assets, liabilities, income and expenses is included line by line in the consolidatedfinancial statements.
Associates are those entities over which the Group is able to exert significant influence but which areneither subsidiaries nor joint ventures. Investments in associates are initially recognised at cost andsubsequently accounted for using the equity method. Any goodwill or fair value adjustment attributableto the Group’s share in the associate is not recognised separately and is included in the amountrecognised as investment in associates.
The carrying amount of the investments in associates is increased or decreased to recognise theGroup’s share of the profit or loss and other comprehensive income of the associate, adjusted wherenecessary to ensure consistency with the accounting policies of the Group.
Unrealised gains and losses on transactions between the Group and its associates and joint venturesare eliminated to the extent of the Group’s interest in those entities. Where unrealised losses areeliminated, the underlying asset is also tested for impairment.
25
For
per
sona
l use
onl
y

(e). Property, Plant and Equipment
Each class of property, plant and equipment is carried at cost or fair value as indicated less, whereapplicable, any accumulated depreciation and impairment losses.
Plant and equipmentPlant and equipment are measured on the cost basis and therefore carried at cost less accumulateddepreciation and any accumulated impairment. In the event the carrying amount of plant and equipmentis greater than the estimated recoverable amount, the carrying amount is written down immediately tothe estimated recoverable amount and impairment losses are recognised either in profit or loss or asa revaluation decrease if the impairment losses relate to a revalued asset. A formal assessment ofrecoverable amount is made when impairment indicators are present.
The carrying amount of plant and equipment is reviewed annually by directors to ensure it is not inexcess of the recoverable amount from these assets. The recoverable amount is assessed on thebasis of the expected net cash flows that will be received from the asset’s employment and subsequentdisposal. The expected net cash flows have been discounted to their present values in determiningrecoverable amounts.
The cost of fixed assets constructed within the consolidated group includes the cost of materials, directlabour, borrowing costs and an appropriate proportion of fixed and variable overheads.
Subsequent costs are included in the asset’s carrying amount or recognised as a separate asset,as appropriate, only when it is probable that future economic benefits associated with the item will flowto the Company and the cost of the item can be measured reliably. All other repairs and maintenanceare charged to the statement of comprehensive income during the financial period in which they areincurred.
DepreciationThe depreciable amount of all fixed assets including buildings and capitalised lease assets, but excludingfreehold land, is depreciated on a straight-line and dminishing value basis over the asset’s useful lifeto the Group commencing from the time the asset is held ready for use. Leasehold improvements aredepreciated over the shorter of either the unexpired period of the lease or the estimated useful lives ofthe improvements.
The useful life for each class of depreciable assets are:
Class of Fixed Asset Useful life
Plant and equipment 2.5 - 10 years
The assets’ residual values and useful lives are reviewed, and adjusted if appropriate, at the endof each reporting period.
An asset’s carrying amount is written down immediately to its recoverable amount if the asset’s carryingamount is greater than its estimated recoverable amount.
Gains and losses on disposals are determined by comparing proceeds with the carrying amount. Thesegains and losses are included in the statement of comprehensive income.
26
For
per
sona
l use
onl
y

(f). Intangible assets
Intangible assets acquired separately or in a business combination are initially measured at cost.The cost of an intangible asset acquired in a business combination is its fair value as at the dateof acquisition. Following initial recognition, intangible assets are carried at cost less any accumulatedamortisation and any accumulated impairment losses. Internally generated intangible assets, excludingcapitalised development costs, are expensed against profits in the year in which the expenditure isincurred.
The useful lives of intangible assets are assessed to be either finite or indefinite. Intangible assetswith finite lives are amortised over the useful life and assessed for impairment whenever there is anindication that the intangible asset may be impaired. The amortisation period and the amortisationmethod for an intangible asset with a finite useful life is reviewed at least at each financial year-end. Changes in the expected useful life or the expected pattern of consumption of future economicbenefits embodied in the asset are accounted for by changing the amortisation period or method, asappropriate, which is a change in accounting estimate. The amortisation expense on intangible assetswith finite lives is recognised in profit or loss in the expense category consistent with the function of theintangible asset.
Intangible assets with indefinite useful lives are tested for impairment annually either individually or atthe cash-generating unit level. Such intangibles are not amortised. The useful life of an intangible assetwith an indefinite life is reviewed each reporting period to determine whether indefinite life assessmentcontinues to be supportable. If not, the change in the useful life assessment from indefinite to finite isaccounted for as a change in an accounting estimate and is thus accounted for on a prospective basis.
(g). Leases
Leases of fixed assets where substantially all the risks and benefits incidental to the ownership ofthe asset, but not the legal ownership that is transferred to the Company, are classified as financeleases.
Finance leases are capitalised by recognising an asset and a liability at the lower of the amountsequal to the fair value of the leased property or the present value of the minimum lease payments,including any guaranteed residual values. Lease payments are allocated between the reduction of thelease liability and the lease interest expense for the period.
Leased assets are depreciated on a straight-line basis over the shorter of their estimated useful livesor the lease term.
Lease payments for operating leases, where substantially all the risks and benefits remain with thelessor, are recognised as expenses in the periods in which they are incurred.
Lease incentives under operating leases are recognised as a liability and amortised on a straight-line basis over the lease term.
27
For
per
sona
l use
onl
y

(h). Financial Instruments
Recognition and initial measurementFinancial assets and financial liabilities are recognised when the entity becomes a party to the contractualprovisions to the instrument. For financial assets, this is equivalent to the date that the companycommits itself to either the purchase or sale of the asset (ie trade date accounting is adopted).
Financial instruments are initially measured at fair value plus transaction costs, except where theinstrument is classified "at fair value through profit or loss", in which case transaction costs are expensedto profit or loss immediately.
Classification and subsequent measurementFinancial instruments are subsequently measured at fair value, amortised cost using the effectiveinterest rate method, or cost.
Amortised cost is the amount at which the financial asset or financial liability is measured at initialrecognition less principal repayments and any reduction for impairment, and adjusted for any cumulativeamortisation of the difference between that initial amount and the maturity amount calculated using theeffective interest method.
Fair value is determined based on current bid prices for all quoted investments. Valuation techniquesare applied to determine the fair value for all unlisted securities, including recent arm’s length transactions,reference to similar instruments and option pricing models.
The effective interest method is used to allocate interest income or interest expense over the relevantperiod and is equivalent to the rate that discounts estimated future cash payments or receipts (includingfees, transaction costs and other premiums or discounts) through the expected life (or when this cannotbe reliably predicted, the contractual term) of the financial instrument to the net carrying amount of thefinancial asset or financial liability. Revisions to expected future net cash flows will necessitate anadjustment to the carrying value with a consequential recognition of an income or expense item inprofit or loss.
The Company does not designate any interests in subsidiaries, associates or joint venture entities asbeing subject to the requirements of Accounting Standards specifically applicable to financial instruments.
(i). Loans and receivables
Loans and receivables are non-derivative financial assets with fixed or determinable paymentsthat are not quoted in an active market and are subsequently measured at amortised cost.
Loans and receivables are included in current assets, where they are expected to mature within12 months after the end of the reporting period.
28
For
per
sona
l use
onl
y

(i). Equity-settled compensationThe Company operates an employee share option plan. Share-based payments to employees aremeasured at the fair value of the instruments issued and amortised over the vesting periods. Share-based payments to non-employees are measured at the fair value of goods or services received or thefair value of the equity instruments issued, if it is determined the fair value of the goods or servicescannot be reliably measured, and are recorded at the date the goods or services are received. Thecorresponding amount is recorded to the option reserve. The fair value of options is determinedusing the Black-Scholes pricing model. The number of options expected to vest is reviewed andadjusted at the end of each reporting period such that the amount recognised for services receivedas consideration for the equity instruments granted is based on the number of equity instruments thateventually vest.
(j). Provisions
Provisions are recognised when the Company has a legal or constructive obligation, as a result ofpast events, for which it is probable that an outflow of economic benefits will result and that outflow canbe reliably measured.
Provisions are measured using the best estimate of the amounts required to settle the obligation atthe end of the reporting period.
(k). Cash and Cash Equivalents
Cash and cash equivalents include cash on hand, deposits available on demand with banks, othershort-term highly liquid investments with original maturities of 6 months or less, and bank overdrafts.Bank overdrafts are reported within short-term borrowings in current liabilities in the statement offinancial position.
(l). Employee benefits
Defined contribution plans The Group pays fixed superannuation contributions into independent entitiesin relation to several state plans and insurance for individual employees. The Group has no legal orconstructive obligations to pay contributions in addition to its fixed contributions, which are recognisedas an expense in the periodthat relevant employee services are received.
Short-term employee benefits
Short-term employee benefits, including annual leave entitlement, are current liabilities included inemployee benefits, measured at the undiscounted amount that the Group expects to pay as a result ofthe unused entitlement.
29
For
per
sona
l use
onl
y

(m). Revenue and Other Income
Revenue is measured at the fair value of the consideration received or receivable after taking intoaccount any trade discounts and volume rebates allowed. When the inflow of consideration is deferred,it is treated as the provision of financing and is discounted at a rate of interest that is generally acceptedin the market for similar arrangements. The difference between the amount initially recognised and theamount ultimately received is interest revenue. Revenue from the sale of goods is recognised at thepoint of delivery as this corresponds to the transfer of significant risks and rewards of ownership of thegoods and the cessation of all involvement in those goods.
Interest revenue is recognised using the effective interest rate method.
Revenue recognition relating to the provision of services is determined with reference to the stageof completion of the transaction at the end of the reporting period, where outcome of the contract canbe estimated reliably. Stage of completion is determined with reference to the services performed todate as a percentage of total anticipated services to be performed. Where the outcome cannot beestimated reliably, revenue is recognised only to the extent that related expenditure is recoverable.
All revenue is stated net of the amount of goods and services tax (GST).
(n). Borrowing Costs
Borrowing costs directly attributable to the acquisition, construction or production of assets that necessarilytake a substantial period of time to prepare for their intended use or sale are added to the cost of thoseassets, until such time as the assets are substantially ready for their intended use or sale.
All other borrowing costs are recognised in profit or loss in the period in which they are incurred.
(o). Goods and Services Tax (GST)
Revenues, expenses and assets are recognised net of the amount of GST, except where the amountof GST incurred is not recoverable from the Australian Taxation Office (ATO).
Receivables and payables are stated inclusive of the amount of GST receivable or payable. The netamount of GST recoverable from, or payable to, the ATO is included with other receivables or payablesin the statement of financial position.
Cash flows are presented on a gross basis. The GST components of cash flows arising from investingor financing activities which are recoverable from, or payable to, the ATO are presented as operatingcash flows included in receipts from customers or payments to suppliers.
(p). Government Grants
Government grants are recognised at fair value where there is reasonable assurance that the grantwill be received and all grant conditions will be met. Grants relating to expense items are recognisedas income over the periods necessary to match the grant to the costs they are compensating. Grantsrelating to assets are credited to deferred income at fair value and are credited to income over theexpected useful life of the asset on a straight-line basis.
(q). Contributed equity
Ordinary shares are classified as equity. Incremental costs directly attributable to the issue of newshares or options are shown in equity as a deduction, net of tax, from the proceeds.
30
For
per
sona
l use
onl
y

(r). Earnings per share
Basic earnings per share is calculated as net profit attributable to members of the parent, adjusted toexclude any costs of servicing equity (other than dividends), divided by the weighted average numberof ordinary shares, adjusted for any bonus element.
Diluted earnings per share adjusts the figures used in the determination of basic earnings per shareto take into account the weighted average number of shares assumed to have been issued for noconsideration in relation to dilutive potential ordinary shares.
(s). Comparative Figures
When required by Accounting Standards, comparative figures have been adjusted to conform to changesin presentation for the current financial year.
(t). Critical Accounting Estimates and Judgments
The Directors evaluate estimates and judgments incorporated into the financial statements based onhistorical knowledge and best available current information. Estimates assume a reasonable expectationof future events and are based on current trends and economic data, obtained both externally andwithin the Company.
Key estimates
(i) ImpairmentThe Company assesses impairment at the end of each reporting period by evaluating conditionsand events specific to the Group that may be indicative of impairment triggers. Recoverableamounts of relevant assets are reassessed using value-in-use calculations which incorporatevarious key assumptions.
(ii) Intangible assetsThe Group has capitalised the development costs in relation to the development of the BananaPly Technology. The recoverability of the asset is dependent on the successful commercialisationof the technology. As 30 June 2012, the commercialisation of the project was not yet complete.
31
For
per
sona
l use
onl
y
5 Parent Information
2012 2011$ $
The following information has beenextracted from the books and records ofthe parent and has been prepared inaccordance with Accounting Standards.
STATEMENT OF FINANCIAL POSITIONASSETSCurrent Assets 434,478 641,809Non-current Assets 2,891,486 8,868,221TOTAL ASSETS 3,325,964 9,510,030
LIABILITIESCurrent liabilities 208,833 284,919Non-current Liabilities 1,951,079 2,195,152TOTAL LIABILITIES 2,159,912 2,480,071
EQUITYIssued Capital 19,459,231 18,380,815Reserves 795,646 769,771Retained Earnings (19,088,825) (12,120,627)TOTAL EQUITY 1,166,052 7,029,959
STATEMENT OF COMPREHENSIVEINCOME(Loss) for the year (6,968,198) (3,215,114)Other comprehensive income - -TOTAL COMPREHENSIVE INCOME (6,968,198) (3,215,114)
GuaranteesPapyrus Australia Ltd has not entered into any guarantees, in the current or previous financial year, inrelation to the debts of its subsidiaries.
Contingent LiabilitiesContingent liabilities of the parent entity have been incorporated into the Group information in note 23. Thecontingent liabilities of the parent are consistent with that of the Group.
Contractual CommitmentsContractual Commitments of the parent entity have been incorporated into the Group information in note22. The contractual commitments of the parent are consistent with that of the Group.
32
For
per
sona
l use
onl
y

6 Operating Segments
The Board has considered the requirements of AASB 8 Operating Segments and the internal reports thatare reviewed by the chief operating decision maker (the Managing Director) in allocating resources andhave concluded at this time that there are no separately identifiable segments.
7 Revenue and expenses
Consolidated Group2012 2011
$ $
(a) RevenueInterest received from other parties 14,783 55,851Sales revenue - 139,219
14,783 195,070
(b) Other incomeNet profit on disposal of property, plantand equipment
- 21,500
Grant revenue 202,211 -202,211 21,500
(c) Depreciation of non-current assetsPlant and equipment 640,765 280,148Total depreciation 640,765 280,148
(d) Employee benefits expenseWages, salaries and other remunerationexpenses
1,012,324 1,715,416
Superannuation expense 24,820 65,287Transfer to/(from) annual leave provision (81,796) 14,140Share based payments expense 25,875 8,519Transfer to capitalised intangibles andplant and equipment
- (389,820)
Total employee benefits expense 981,223 1,413,542
33
For
per
sona
l use
onl
y

Consolidated Group2012 2011
$ $
(e) Other expensesAudit fees 37,000 37,500Legal fees 38,537 11,046Professional services 249,092 302,845Travel and accomodation 106,955 170,438Directors fees - 73,333Company secretarial 21,670 30,008Rent 165,914 240,635Communications expense 21,839 48,155Share registry and ASX expenses 64,503 111,918Marketing expenses 3,558 19,347Public relations cost - 39,170Contractors - 213,906Freight expenses - 46,571Motor vehicle costs 17,344 87,135Factory operating costs 24,025 153,223Net loss on disposal of plant andequipment
357,469 -
Other expenses 54,993 28,6201,162,899 1,613,850
8 Income tax expense
Consolidated Group2012 2011
$ $
The major components of income tax
expense are:
Statement of Comprehensive IncomeCurrent income tax charge/(benefit) 1,537 28,523Research and Delopment Tax offset (291,199) (317,005)Income tax expense/(benefit) reported inthe income statement
(289,662) (288,482)
34
For
per
sona
l use
onl
y

Consolidated Group2012 2011
$ $
A reconciliation between tax expense andthe product of accounting profit beforeincome tax multiplied by the Group’sapplicable income tax rate is as follows:
Accounting profit before income tax (5,680,997) (5,080,459)
At the Group’s statutory income tax rateof 30% (2011: 30%)
(1,704,299) (1,524,138)
Expenditure not allowable for income taxpurposes
998,860 596,847
Tax losses not recognised due to notmeeting recognition criteria
705,439 927,291
Tax portion of share issue costs 1,537 28,5231,537 28,523
The Group has tax losses arising in Australia of $10,172,276 (2011: $7,820,814) that are available indefinitelyfor offset against future taxable profits of the companies in which the losses arose.
Tax consolidationPapyrus Australia Ltd and its 100% owned Australian resident subsidiaries have formed a tax consolidatedgroup with effect from 01 July 2011. Papyrus Australia Ltd is the head entity of the tax consolidated group.
9 Earnings per share
Basic earnings per share amounts are calculated by dividing net profit for the year attributable to ordinaryequity holders of the parent by the weighted average number of ordinary shares outstanding during the year.
Diluted earnings per share amounts are calculated by dividing the net profit attributable to ordinary equityholders of the parent by the weighted average number of ordinary shares outstanding during the year plusthe weighted average number of ordinary shares that would be issued on the conversion of all the dilutivepotential ordinary shares into ordinary shares.
The following reflects the income and share data used in the basic and diluted earnings per share computations:
35
For
per
sona
l use
onl
y
Consolidated Group2012 2011
$ $
Net loss attributable to ordinary equityholders of the parent entity
(5,391,335) (4,791,977)
Weighted average number of ordinaryshares for basic earnings per share
121,606,841 100,967,047
Effect of dilutionShare options N/A N/AWeighted average number of ordinaryshares adjusted for the effect of dilution
121,606,841 100,967,047
In accordance with AASB 133 ’Earnings per Share’, as potential ordinary shares may only result in asituation where their conversion results in an increase in loss per share or decrease in profit per share fromcontinuing operations, no dilutive effect has been taking into account.
There have been no other transactions involving ordinary shares or potential ordinary shares betweenthe reporting date and the date of completion of these financial statements.
10 Cash and cash equivalents
Consolidated Group2012 2011
$ $
Cash at bank and in hand 366,071 832,919366,071 832,919
Cash at bank earns interest at floating rates based on daily deposit rates
Short-term deposits are made for varying periods between one day and six months, depending on theimmediate cash requirements of the Group, and earn interest at the respective short-term deposit rate.
Reconciliation to Statement of CashFlowsFor the purposes of the Statement ofCash Flows, cash and cash equivalentscomprise the following at 30 June:Cash at banks and in hand 366,071 832,919
366,071 832,919
36
For
per
sona
l use
onl
y

Consolidated Group2012 2011
$ $
Reconciliation of net loss after tax tonet cash flows from operationsNet profit/(loss) (5,391,335) (4,791,977)Adjustments for non-cash items:
Impairment of non-current assets 3,113,104 1,989,489Depreciation 640,765 280,148Share based payments 25,875 8,519Non cash tax expense 1,537 28,524Net (profit)/loss from sale of property,plant and equipment
357,469 -
Changes in assets and liabilities
Decrease/(Increase) in trade and otherreceivables
16,900 90,102
Decrease/(Increase) in other currentassets
33,707 72,343
(Decrease)/increase in trade and otherpayables
(293,041) (294,873)
(Decrease)/increase in provisions 81,796 29,328(Decrease)/increase in provisions (87,899) 702,274Net cash from operating activities (1,501,122) (1,886,123)
11 Trade and other receivables
Consolidated Group2012 2011
$ $
Trade receivables (i) 18,353 42,880Provision for doubtful debts - (26,400)Goods and Services Tax Receivable 17,298 36,071
35,651 52,551
(i) Trade receivables are non-interest bearing and are generally on 30-90 day terms. An allowance fordoubtful debts is made when there is objective evidence that a trade receivable is impaired. Noimpairment was recognised in 2011 and 2012 and no receivables are past due at balance date.
Information regarding the credit risk of current receivables is set out in note 26.
37
For
per
sona
l use
onl
y

12 Other current assets
Consolidated Group2012 2011
$ $
Prepayments 34,149 34,376Other 6,500 39,980
40,649 74,356
13 Property, plant and equipment
Consolidated Group2012 2011
$ $
Plant and equipmentCost
Opening balance 1,650,601 1,276,366Additions 72,657 374,235Disposals (441,769) -Transfer from Capital Works in Progress 3,886,615 -Impairment of assets (2,313,760) -
2,854,344 1,650,601
Accumulated depreciation
Opening balance 443,446 163,298Depreciation for the year 640,765 280,148Disposals (40,495) -
1,043,716 443,446Net book value of plant and equipment 1,810,628 1,207,155
Capital works in progressCost
Opening balance 3,886,615 3,124,139Additions - 762,476Transfer to plant and equipment (3,886,615) -
- 3,886,615
Total net book value of property, plantand equipment
1,810,628 5,093,770
In 2012, an impairment loss of $2,313,760 represented the group writing down its property plant andequipment to its recoverable amount. This was recognised in the statement of comprehensive incomein the line item "Impairment expense". The recoverable amount was based on value in use and determinedusing a discounted cash flow model. The discount rate applied on a pre-tax basis was 30.6%.
38
For
per
sona
l use
onl
y

14 Intangible assets
Consolidated Group2012 2011
$ $
Patents and intellectual propertyCost
Opening balance 710,840 687,315Additions 55,607 23,525Net book value of patents and intellectualproperty
766,447 710,840
Development costsCost
Opening balance 2,177,490 4,166,979Impairment of assets (799,344) (1,989,489)Net book value of development costs 1,378,146 2,177,490
Total net book value of intangibleassets
2,144,593 2,888,330
In 2012, an impairment loss of $799,344 (2011: $1,989,489) represented the group writing down its patentsand intellectual property to its recoverable amount. This was recognised in the statement of comprehensiveincome in the line item "Impairment expense". The recoverable amount was based on value in use anddetermined using a discounted cash flow model. The discount rate applied on a pre-tax basis was 30.6%.
15 Share based payments
Employee Share Option PlanThe Company has established the Papyrus Australia Ltd Employee Share Option Plan and a summary ofthe Rules of the Plan are set out below:
• All employees (full and part time) will be eligible to participate in the Plan after a qualifying period of12 months employment by a member of the Group, although the Board may waive this requirement.
• Options are granted under the Plan at the discretion of the board and if permitted by the board, maybe issued to an employee’s nominee.
• Each option is to subscribe for one fully paid ordinary share in the Company and will expire 5 yearsfrom its date of issue. An option is exercisable at any time from its date of issue. Options will beissued free. The exercise price of options will be determined by the board, subject to a minimumprice equal to the market value of the Company’s shares at the time the board resolves to offer thoseoptions. The total number of shares the subject of options issued under the Plan, when aggregatedwith issues during the previous 5 years pursuant to the Plan and any other employee share plan, mustnot exceed 5% of the Company’s issued share capital.
• If, prior to the expiry date of options, a person ceases to be an employee of a Group company forany reason other than retirement at age 60 or more (or such earlier age as the board permits),permanent disability, redundancy or death, the options held by that person (or that person’s nominee)automatically lapse on the first to occur of a) the expiry of the period of 6 months from the date of suchoccurrence, and b) the expiry date. If a person dies, the options held by that person will be exercisableby that person’s legal personal representative.
39
For
per
sona
l use
onl
y

• Options cannot be transferred other than to the legal personal representative of a deceased optionholder.
• The Company will not apply for official quotation of any options.
• Shares issued as a result of the exercise of options will rank equally with the Company’s previouslyissued shares.
• Option holders may only participate in new issues of securities by first exercising their options.
The Board may amend the Plan Rules subject to the requirements of the Listing Rules. The expenserecognised in the Statement of Comprehensive Income in relation to share-based payments is disclosed innote 4 (e). The following table illustrates the number (No.) and weighted average exercise prices (WAEP)and movements in share options under the Company’s Employee Share Option Plan issued during the year:
2012 2012 2011 2011No. WAEP No. WAEP
Outstanding at the beginning of theyear
8,942,641 0.33 2,450,000 0.90
Granted during the year 750,000 0.12 6,492,641 0.12Expired or lapsed during the year (1,000,000) 0.30 - -Outstanding at the end of the year 8,692,641 0.30 8,942,641 0.33
Exercisable at the end of the year 8,692,641 0.30 8,942,641 0.33
The outstanding balance as at 30 June 2012 is represented by:
• 250,000 options exercisable at any time until 7 October 2012 with an exercise price of $0.80.
• 250,000 options exercisable at any time until 7 October 2012 with an exercise price of $1.25.
• 250,000 options exercisable at any time until 14 October 2012 with an exercise price of $0.80.
• 250,000 options exercisable at any time until 14 October 2012 with an exercise price of $1.25.
• 100,000 options exercisable at any time until 30 June 2013 with an exercise price of $1.50.
• 100,000 options exercisable at any time until 30 June 2013 with an exercise price of $1.75.
• 125,000 options exercisable at any time until 16 April 2014 with an exercise price of $1.50.
• 125,000 options exercisable at any time until 16 April 2014 with an exercise price of $1.75.
• 6,492,641 options exercisable at any time until 31 March 2013 with an exercise price of $0.12.
• 750,000 options exercisable at any time until 30 June 2016 with an exercise price of $0.12.
The weighted average remaining contractual life for the share options outstanding as at 30 June 2012 was0.98 years (2011: 1.55 years).
The range of exercise prices for options outstanding at the end of the year was $0.12 - $1.75 (2011: $0.12- $1.75).
The weighted average fair value of options granted during the year was $0.035, as no options were issued(2011: Nil).
40
For
per
sona
l use
onl
y

The fair value of the equity-settled share options granted under the option plan is estimated as at the dateof grant using a Black-Scholes model taking into account the terms and conditions upon which the optionswere granted. The following table lists the inputs to the model used for the year ended 30 June 2012.
2012
Historical volatility (%) 107.1%
Risk free interest rate 4.96%
Expected life of options (years) 5
16 Trade and other payables
Consolidated Group2012 2011
$ $
Trade payables (i) 56,824 116,282Sundry payables and accrued expenses(ii)
25,562 107,658
82,386 223,940
i. Trade payables are non-interest bearing and are normally settled on 30-day terms.
ii. Sundry payables are non-interest bearing and are normally settled within 30 - 90 days.
Information regarding the credit risk of current payables is set out in note 26.
17 Borrowings
Consolidated Group2012 2011
$ $
CurrentObligations hire purchase contracts 26,674 26,674
26,674 26,674
Non-currentObligations hire purchase contracts 11,715 38,389
11,715 38,389
18 Provisions
Consolidated Group2012 2011
$ $
CurrentOpening balance 66,608 52,468Net increase/(decrease in provision) (66,608) 14,140Closing Balance 30 June - 66,608
41
For
per
sona
l use
onl
y
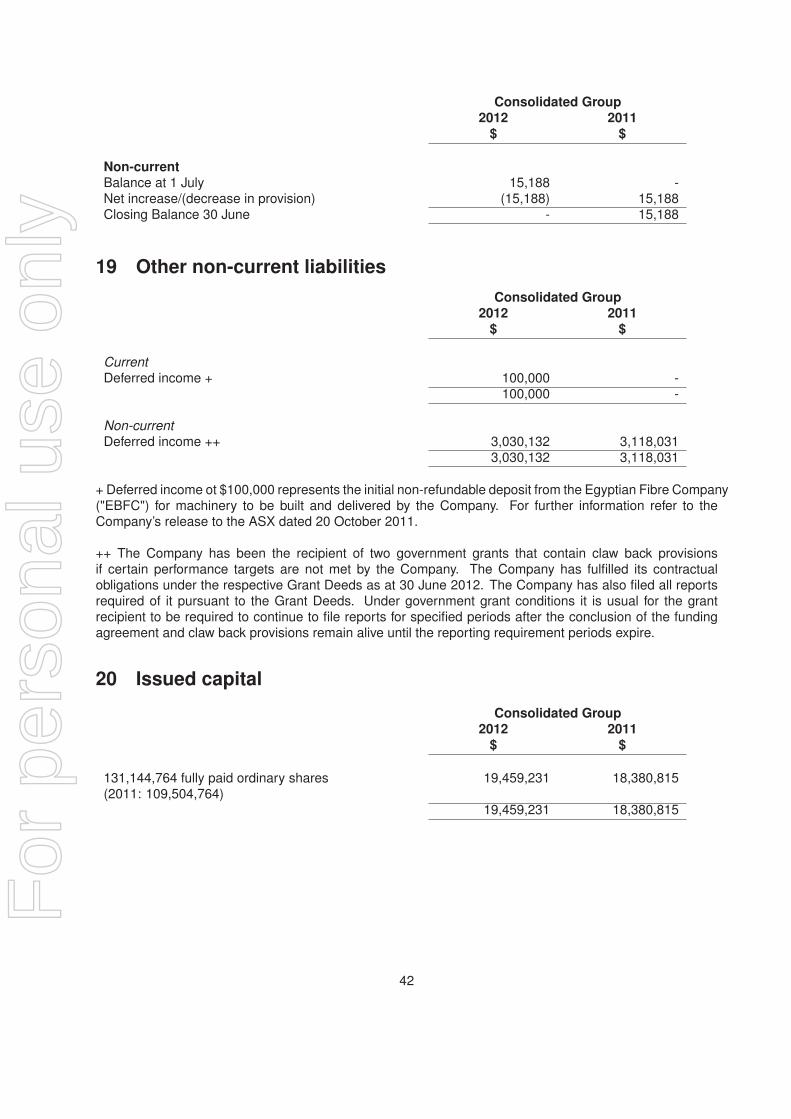
Consolidated Group2012 2011
$ $
Non-currentBalance at 1 July 15,188 -Net increase/(decrease in provision) (15,188) 15,188Closing Balance 30 June - 15,188
19 Other non-current liabilities
Consolidated Group2012 2011
$ $
Current
Deferred income + 100,000 -100,000 -
Non-current
Deferred income ++ 3,030,132 3,118,0313,030,132 3,118,031
+ Deferred income ot $100,000 represents the initial non-refundable deposit from the Egyptian Fibre Company("EBFC") for machinery to be built and delivered by the Company. For further information refer to theCompany’s release to the ASX dated 20 October 2011.
++ The Company has been the recipient of two government grants that contain claw back provisionsif certain performance targets are not met by the Company. The Company has fulfilled its contractualobligations under the respective Grant Deeds as at 30 June 2012. The Company has also filed all reportsrequired of it pursuant to the Grant Deeds. Under government grant conditions it is usual for the grantrecipient to be required to continue to file reports for specified periods after the conclusion of the fundingagreement and claw back provisions remain alive until the reporting requirement periods expire.
20 Issued capital
Consolidated Group2012 2011
$ $
131,144,764 fully paid ordinary shares(2011: 109,504,764)
19,459,231 18,380,815
19,459,231 18,380,815
42
For
per
sona
l use
onl
y

2012 2011Number $ Number $
Ordinary shares
Balance at beginning offinancial year
109,504,764 18,380,815 96,519,483 16,889,136
Shares issued pursuant toprivate placement
21,640,000 1,082,000 12,985,281 1,558,234
Transaction costs on sharesissued
- (3,584) - (66,555)
Balance at end of financialyear
131,144,764 19,459,231 109,504,764 18,380,815
Effective 1 July 1998, the Corporations legislation in place abolished the concepts of authorised capital andpar value shares. Accordingly, the Parent does not have authorised capital nor par value in respect of itsissued shares.
Fully paid ordinary shares carry one vote per share and carry the right to dividends (in the event sucha dividend was declared).
21 Reserves
Consolidated Group2012 2011
$ $
Share option reserve (a) 795,646 769,771795,646 769,771
(a) Share option reserveBalance at beginning of financial year 769,771 761,252Share based payments 25,875 8,519Balance at end of financial year 795,646 769,771
22 Committments for expenditure
Consolidated Group2012 2011
$ $
Operating leases
Not longer than 1 year 24,597 188,100Longer than 1 year and not longer than 5years
- 225,069
24,597 413,169
43
For
per
sona
l use
onl
y

Terms of lease arrangementsThe property leases are non-cancellable, with three year terms and rent payable monthly in advance.Contingent rental provisions within the lease agreement require the minimum lease payments shall beincreased by the lower of CPI or 4% per annum. An option exists to renew the lease at the end of the threeyear term for an additional 3 years.
23 Contingent liabilities and contingent assets
At the date of signing this report, the Group is not aware of any Contingent Asset or Liability that should bedisclosed in accordance with AASB 137.
24 Auditor’s remuneration
Consolidated Group2012 2011
$ $
Audit or review of the financial report 41,000 37,50041,000 37,500
No other services have been provided.
25 Controlled and other entities
Ownership interestCountry of
incorporation2012 2011
Name of entity % %
Parent entity
Papyrus Australia Limited (i)
Subsidiaries
PPY EU Pty Ltd (ii) Australia 100 100Papyrus Technology Pty Ltd (ii) Australia 100 100PPY Manufacturing Pty Ltd (ii) Australia 100 100Australian Advanced ManufacturingCentre Pty Ltd (ii)
Australia 100 100
Pulp Fiction Manufacturing Pty Ltd (ii) Australia 100 100
Other entities
Papyrus Egypt (iii) Egypt 50 -Yellow Pallet B.V. (iii) The Netherlands 50 -
i. Papyrus Australia Ltd is the head entity within the tax-consolidated group.
ii. These companies are members of the tax-consolidated group.
iii. These entities were non operating shell companies at 30 June 2012 (A total $19,367 was spent onthe initial setup of Yellow Pallet B.V. which has been classified as other financial assets in the Group’sStatement of Financial Position).
44
For
per
sona
l use
onl
y
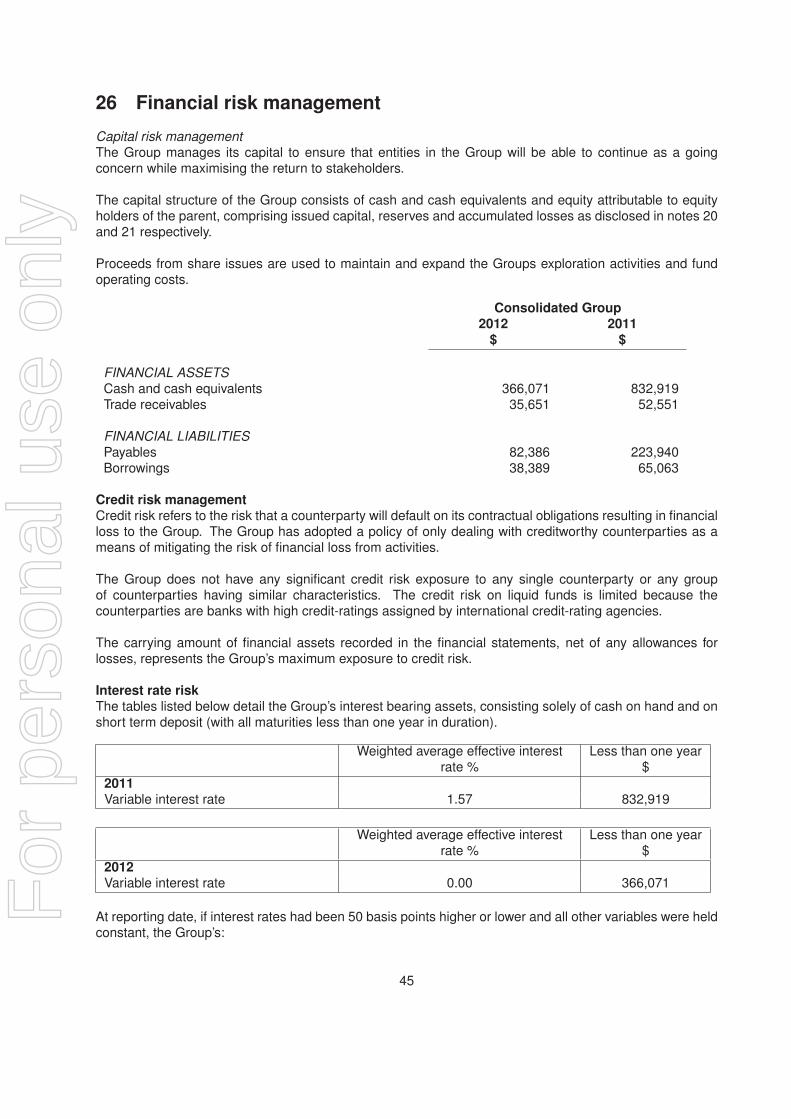
26 Financial risk management
Capital risk management
The Group manages its capital to ensure that entities in the Group will be able to continue as a goingconcern while maximising the return to stakeholders.
The capital structure of the Group consists of cash and cash equivalents and equity attributable to equityholders of the parent, comprising issued capital, reserves and accumulated losses as disclosed in notes 20and 21 respectively.
Proceeds from share issues are used to maintain and expand the Groups exploration activities and fundoperating costs.
Consolidated Group2012 2011
$ $
FINANCIAL ASSETS
Cash and cash equivalents 366,071 832,919Trade receivables 35,651 52,551
FINANCIAL LIABILITIES
Payables 82,386 223,940Borrowings 38,389 65,063
Credit risk managementCredit risk refers to the risk that a counterparty will default on its contractual obligations resulting in financialloss to the Group. The Group has adopted a policy of only dealing with creditworthy counterparties as ameans of mitigating the risk of financial loss from activities.
The Group does not have any significant credit risk exposure to any single counterparty or any groupof counterparties having similar characteristics. The credit risk on liquid funds is limited because thecounterparties are banks with high credit-ratings assigned by international credit-rating agencies.
The carrying amount of financial assets recorded in the financial statements, net of any allowances forlosses, represents the Group’s maximum exposure to credit risk.
Interest rate riskThe tables listed below detail the Group’s interest bearing assets, consisting solely of cash on hand and onshort term deposit (with all maturities less than one year in duration).
Weighted average effective interestrate %
Less than one year$
2011Variable interest rate 1.57 832,919
Weighted average effective interestrate %
Less than one year$
2012Variable interest rate 0.00 366,071
At reporting date, if interest rates had been 50 basis points higher or lower and all other variables were heldconstant, the Group’s:
45
For
per
sona
l use
onl
y

• net loss would increase or decrease by $1,478 which is mainly attributable to the Group’s exposure tointerest rates on its variable bank deposits.
Liquidity risk managementUltimate responsibility for liquidity risk management rests with the Board, which has built an appropriateliquidity risk management framework for the management of the Group’s short, medium and long-termfunding and liquidity management requirements. The Group manages liquidity risk by maintaining adequatereserves.
Liquidity and interest risk tablesThe following table details the Company’s and the Group’s remaining contractual maturity for its non-derivative financial liabilities. The table has been drawn up based on the undiscounted cash flows offinancial liabilities based on the earliest date on which the Group can be required to pay. The table includesboth interest and principal cash flows.
ConsolidatedWeighted average effective interest
rate%
Less than one year$
Longer than 1 yearand not longerthan 5 years
$
2011
Interest bearing 6.38% 26,674 38,389
Non-interest bearing 0.00% 223,940 -
Weighted average effective interestrate%
Less than one year$
Longer than 1 yearand not longerthan 5 years
$
2012Interest bearing 6.38% 26,674 11,715
Non-interest bearing 0.00% 82,386 -
46
For
per
sona
l use
onl
y

27 Related party disclosure and key management personnel remuneration
The following individuals are classified as key management personnel in accordance with AASB 124’Related Party Disclosures’:
Mr Edward Byrt, ChairmanMr Ramy Azer, Managing DirectorMr Donald Stephens, Non-Executive DirectorMr Christopher Smerdon, Non-Executive Director (resigned 31 August 2011)Mr Colin Dunsford, Non-Executive DirectorMr Pierre Van Der Merwe, Company SecretaryMr Geoff Whitbread, Chief Executive
Consolidated Group2012 2011
$ $
Short-term employee benefits 463,750 603,314Post employment benefits - 2,752Share-based payments 25,875 -
489,625 606,066
(a). Option holdings of Key Management Personnel
Directors
30 June
2012
Balance
at
begining
of period
Granted
as
remuner-
ation
Exercised Net
change
other
Balance
at end of
period
Expiry
Date
First
Exercise
Date
Last
Exercise
Date
RamyAzer*
1,250,000 - - - 1,250,000 31/03/13 17/02/11 31/03/13
EdwardByrt*
416,667 - - - 416,667 31/03/13 24/03/11 31/03/13
30 June
2011
Balance
at
begining
of period
Granted
as
remuner-
ation
Exercised Net
change
other
Balance
at end of
period
Expiry
Date
First
Exercise
Date
Last
Exercise
Date
RamyAzer*
- - - 1,250,000 1,250,000 31/03/13 17/02/11 31/03/13
EdwardByrt*
- - - 416,667 416,667 31/03/13 24/03/11 31/03/13
Options held by Messers Azer and Byrt relate to options issued in conjunction with a private placementconducted in February 2011.
47
For
per
sona
l use
onl
y

Executives
30 June
2012
Balance
at
begining
of period
Granted
as
remuner-
ation
Exercised Net
change
other
Balance
at end of
period
Expiry
Date
First
Exercise
Date
Last
Exercise
Date
GeoffWhitbread
- 500,000 - - 500,000 30/06/16 01/07/11 30/06/16
GeoffWhitbread
- 250,000 - - 250,000 30/06/16 01/01/12 30/06/16
(b). Shareholdings of Key Management Personnel
30 June 2011 Balance at1 July 2010
On Exercise ofOptions
Net ChangeOther
Balance30 June 2011
Mr Edward Byrt 973,264 - 833,333 1,806,597
Mr Ramy Azer 22,928,853 - 2,500,000 25,428,853
Mr Donald Stephens 975,630 - - 975,630
Mr Christopher Smerdon 506,399 - - 506,399
Mr Colin Dunsford 23,810 - - 23,810
Mr Geoff Whitbread 25,783 - 100,000 125,783
30 June 2012 Balance at1 July 2011
On Exercise ofOptions
Net ChangeOther
Balance30 June 2012
Mr Edward Byrt 1,806,597 - 2,990,000 4,796,597
Mr Ramy Azer 25,428,853 - 3,250,000 28,678,853
Mr Donald Stephens 975,630 - - 975,630
Mr Christopher Smerdon + 506,399 - (506,399) -
Mr Colin Dunsford 23,810 - - 23,810
Mr Geoff Whitbread 125,783 - - 125,783
+ The net change of (506,399) shares in Papyrus relating to Mr Smerdon is due to him no longer beinga director at 30 June 2012. Mr Smerdon did hold all 506,399 shares at 30 June 2012 in his capacity asa shareholder.
LoansThe wholly owned Group consists of those entities listed in note 25. Transactions between PapyrusAustralia Ltd and other entities in the wholly owned Group during the year consisted of loans advancedby Papyrus Australia Ltd to fund research and development activities.
Director related entitiesThe following transactions with related parties occurred during the financial year. All of the transactionswere undertaken on an arm’s length basis and at applicable commercial rates.
HLB Mann Judd (SA) Pty Ltd has received professional fees for accounting, taxation and secretarialservices provided during the year of $67,308 (2011: $64,263). $4,836 was owing to the entity at 30June 2012 (2011: Nil). Mr Pierre Van Der Merwe is a director of HLB Mann Judd (SA) Pty Ltd and MrDonald Stephens is a consultant to HLB Mann Judd (SA) Pty Ltd.
Einstien’s Cafe has received payments in relation to meals and refreshments made available to thestaff of Papyrus. Mr Ramy Azer is a director of Einstien’s Cafe. Papyrus has made payments of $2,530during the financial year (2011: $9,056). No amount was owed to the entity at 30 June 2012 (2011:$874).
48
For
per
sona
l use
onl
y

28 Going concern
The financial report has been prepared on the basis of a going concern. The financial report shows thegroup incurred a net loss of $5,391,335 and a net cash outflow from operating and investing activities of$1,517,053 during the year ended 30 June 2012. The group continues to be economically dependent on thegeneration of cashflow from the business and/ or raising additional capital for the continued development ofits Banana Ply Project and working capital. The group continues to be in consultation with its advisers toevaluate alternative means of raising additional capital.
The group’s ability to continue as a going concern is contingent upon generation of cashflow from itsbusiness and/ or successfully raising additional capital. If sufficient cash flow is not generated and/oradditional funds are not raised, the going concern basis may not be appropriate, with the result thatthe group may have to realise its assets and extinguish its liabilities, other than in the ordinary courseof business and at amounts different from those stated in the financial report. No allowance for suchcircumstances has been made in the financial report.
49
For
per
sona
l use
onl
y
Directors’ Declaration
The Directors of the company declare that:
1. the financial statements and notes, as set out on pages 18 to 49, are in accordance with the CorporationsAct 2001 and:
a. comply with Accounting Standards, which, as stated in accounting policy Note 1 to the financialstatements, constitutes explicit and unreserved compliance with International Financial ReportingStandards (IFRS); and
b. give a true and fair view of the financial position as at 30 June 2012 and of the performance for theyear ended on that date of the company and consolidated group;
2. the Managing Director and Chief Executive have each declared that:
a. the financial records of the company for the financial year have been properly maintained in accordancewith s 286 of the Corporations Act 2001;
b. the financial statements and notes for the financial year comply with Accounting Standards; and
c. the financial statements and notes for the financial year give a true and fair view; and
3. in the directors’ opinion there are reasonable grounds to believe that the company will be able to pay itsdebts as and when they become due and payable (refer to note 28).
This declaration is made in accordance with a resolution of the Board of Directors.
Mr Ramy AzerManaging Director
27 September 2012
50
For
per
sona
l use
onl
y

Level 1,
67 Greenhill Rd
Wayville SA 5034
GPO Box 1270
Adelaide SA 5001
T 61 8 8372 6666
F 61 8 8372 6677
W www.grantthornton.com.au
Grant Thornton South Australian Partnership ABN 27 244 906 724
a subsidiary or related entity of Grant Thornton Australia Ltd ABN 41 127 556 389
Grant Thornton Australia Limited is a member firm within Grant Thornton International Ltd. Grant Thornton International Ltd and the member firms are not a worldwide partnership. Grant Thornton
Australia Limited, together with its subsidiaries and related entities, delivers its services independently in Australia.
Liability limited by a scheme approved under Professional Standards Legislation
INDEPENDENT AUDITOR’S REPORT
TO THE MEMBERS OF PAPYRUS AUSTRALIA LIMITED
Report on the financial report
We have audited the accompanying financial report of Papyrus Australia Limited (the
“Company”), which comprises the consolidated statement of financial position as at 30 June
2012, the consolidated statement of comprehensive income, consolidated statement of
changes in equity and consolidated statement of cash flows for the year then ended, notes
comprising a summary of significant accounting policies and other explanatory information
and the directors’ declaration of the consolidated entity comprising the Company and the
entities it controlled at the year’s end or from time to time during the financial year.
Directors responsibility for the financial report
The Directors of the Company are responsible for the preparation of the financial report
that gives a true and fair view in accordance with Australian Accounting Standards and the
Corporations Act 2001 and for such internal control as the Directors determine are
necessary to enable the preparation of the financial report that gives a true and fair view and
is free from material misstatement, whether due to fraud or error. The Directors also state,
in the notes to the financial report, in accordance with Accounting Standard AASB 101
Presentation of Financial Statements, the financial statements comply with International
Financial Reporting Standards.
Auditor’s responsibility
Our responsibility is to express an opinion on the financial report based on our audit. We
conducted our audit in accordance with Australian Auditing Standards. Those standards
require us to comply with relevant ethical requirements relating to audit engagements and
plan and perform the audit to obtain reasonable assurance whether the financial report is
free from material misstatement.
For
per
sona
l use
onl
y
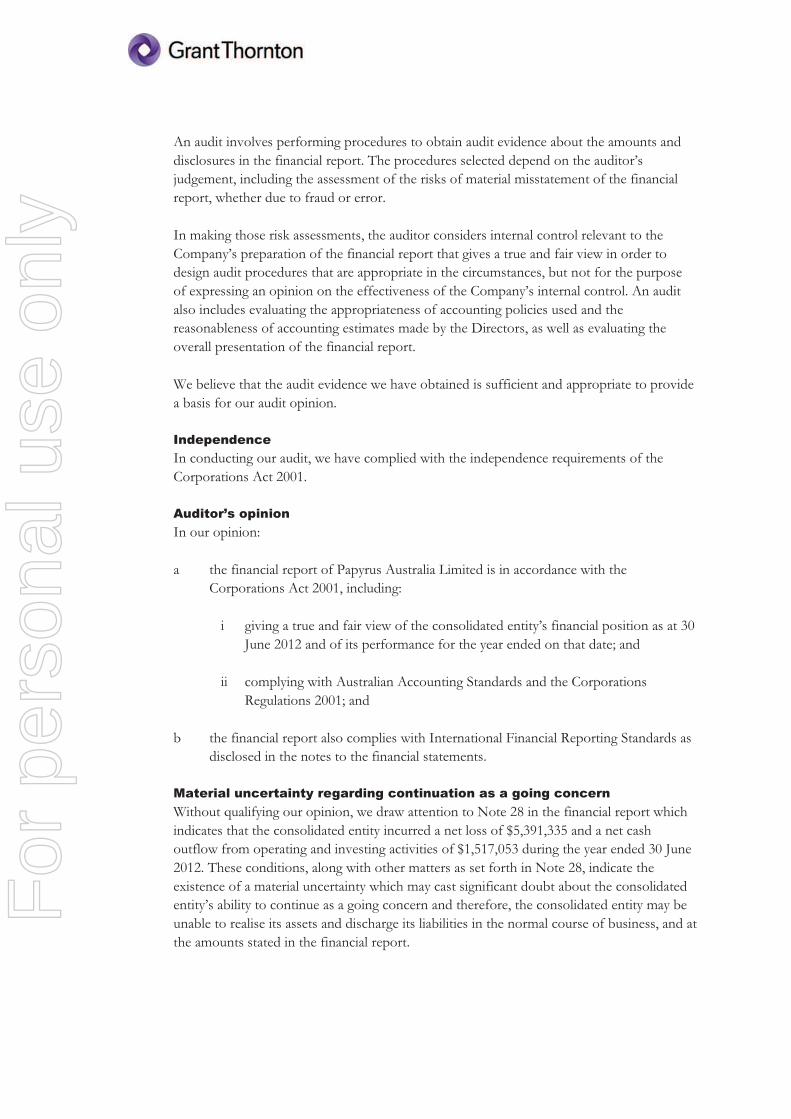
An audit involves performing procedures to obtain audit evidence about the amounts and
disclosures in the financial report. The procedures selected depend on the auditor’s
judgement, including the assessment of the risks of material misstatement of the financial
report, whether due to fraud or error.
In making those risk assessments, the auditor considers internal control relevant to the
Company’s preparation of the financial report that gives a true and fair view in order to
design audit procedures that are appropriate in the circumstances, but not for the purpose
of expressing an opinion on the effectiveness of the Company’s internal control. An audit
also includes evaluating the appropriateness of accounting policies used and the
reasonableness of accounting estimates made by the Directors, as well as evaluating the
overall presentation of the financial report.
We believe that the audit evidence we have obtained is sufficient and appropriate to provide
a basis for our audit opinion.
Independence
In conducting our audit, we have complied with the independence requirements of the
Corporations Act 2001.
Auditor’s opinion
In our opinion:
a the financial report of Papyrus Australia Limited is in accordance with the
Corporations Act 2001, including:
i giving a true and fair view of the consolidated entity’s financial position as at 30
June 2012 and of its performance for the year ended on that date; and
ii complying with Australian Accounting Standards and the Corporations
Regulations 2001; and
b the financial report also complies with International Financial Reporting Standards as
disclosed in the notes to the financial statements.
Material uncertainty regarding continuation as a going concern
Without qualifying our opinion, we draw attention to Note 28 in the financial report which
indicates that the consolidated entity incurred a net loss of $5,391,335 and a net cash
outflow from operating and investing activities of $1,517,053 during the year ended 30 June
2012. These conditions, along with other matters as set forth in Note 28, indicate the
existence of a material uncertainty which may cast significant doubt about the consolidated
entity’s ability to continue as a going concern and therefore, the consolidated entity may be
unable to realise its assets and discharge its liabilities in the normal course of business, and at
the amounts stated in the financial report.
For
per
sona
l use
onl
y

Report on the remuneration report
We have audited the remuneration report included in the directors’ report for the year
ended 30 June 2012. The Directors of the Company are responsible for the preparation and
presentation of the remuneration report in accordance with section 300A of the
Corporations Act 2001. Our responsibility is to express an opinion on the remuneration
report, based on our audit conducted in accordance with Australian Auditing Standards.
Auditor’s opinion on the remuneration report
In our opinion, the remuneration report of Papyrus Australia Limited for the year ended 30
June 2012, complies with section 300A of the Corporations Act 2001.
GRANT THORNTON SOUTH AUSTRALIAN PARTNERSHIP Chartered Accountants
Justin Humphrey
Partner
Adelaide, 27 September 2012
For
per
sona
l use
onl
y

ASX Additional Information
Additional information required by the Australian Securities Exchange Ltd and not shown elsewhere in thisreport is as follows. The information is current as at 30 September 2012.
Distribution of equity securities
Ordinary share capital
• 131,144,764 fully paid ordinary shares are held by 1,675 individual shareholders. There are norestricted and unquoted ordinary shares.
All issued ordinary shares carry one vote per share.
Options
• 8,692,641 unlisted options are held by 12 individual option holders. One holder, Taycol Nominees PtyLtd, holds 4,000,974 unlisted options (equivalent to 46.03% of total unlisted options).
The number of shareholders, by size of holding, in each class are:
Fully Paid OrdinaryShares
Unlisted Options
1-1,000 90 -
1,001 - 5,000 346 -
5,001 - 10,000 260 -
10,001 - 100,000 809 1
100,001 and over 170 11
1,675 12
Holding less than a marketableparcel
1,132 -
Substantial shareholders
Ordinary shareholdersFully paid
Number Percentage
Mr Ramy Azer <Azer FamilyA/C>
22,637,489 17.26%
Mrs Margaret Fuller 10,000,000 7.63%
54
For
per
sona
l use
onl
y

Twenty largest holders of quoted equity securities
Fully paid ordinary sharesNumber Percentage
Mr Ramy Azer <Azer Family A/C> 22,637,489 17.26%
Mrs Margaret Fay Fuller 10,000,000 7.63%
Bijo (SA) Pty Ltd <Azer Family A/C> 5,750,000 4.38%
Stroud Nominees Pty Ltd <Byrt Super Fund-EM Byrt A/C>
4,456,061 3.40%
Mrs Marcelle Boctor 4,000,000 3.05%
Mr Allan Harvey Moffatt <Est P N FlemingA/C>
3,500,000 2.67%
Phillips Contract Engineering Service Pty Ltd<Phillips Super Fund A/C>
1,540,000 1.17%
VP Rigano & Co Pty Ltd 1,285,045 0.98%
Mr Mohamed Abbas 1,125,000 0.86%
JP Morgan Nominees Australia Limited 1,059,000 0.81%
Your Child’s Nursery Pty Ltd <Steffensen S/FA/c>
1,035,353 0.79%
Mr Allan Harvey Moffatt + Mrs SuzanneMaureen Moffatt <Moffatt Super Fund A/C>
968,949 0.74%
Mr Vincent Peter Rigano <Awadalla FamilyA/C>
939,000 0.72%
Your Childs Nursery Pty Ltd <A G SteffensenFamily A/C>
888,931 0.68%
DCS Corporate Advisors Pty Ltd 723,054 0.55%
Mr Stephen John Ardron 699,126 0.53%
HSBC Custody Nominees (Australia) Limited 675,000 0.51%
Mr Grant Walter Gilbert + Mr Robert RoyGilbert <Gilbert Mtrs Staff S/F A/C>
667,000 0.51%
Mousetrap Nominees Pty Ltd 642,035 0.49%
Dorica Nominees Pty Ltd 600,000 0.46%
63,191,043 48.19%
55
For
per
sona
l use
onl
y

![ABB Australia Pty Ltd v CH2M Hill Australia Pty Limited ... Australia Pty Ltd v CH2M Hill Australia Pty Limited & Ors (No 2) [2017 ] NTSC 11 PARTIES: ABB Australia Pty Ltd (ABN 68](https://img.pdfslide.us/doc/110x75/5b18bc6e7f8b9a41258c071c/abb-australia-pty-ltd-v-ch2m-hill-australia-pty-limited-australia-pty-ltd-v.jpg)


![· Web viewBETWEEN MLA DONOR COMPANY LIMITED ABN 49 083 304 867 AND MEAT & LIVESTOCK AUSTRALIA LIMITED ABN 39 081 678 364 AND [Name of Participant] ABN [ABN] PROJECT NO. Click or](https://img.pdfslide.us/doc/110x75/60ac7bab27d8de0b6026afed/web-view-between-mla-donor-company-limited-abn-49-083-304-867-and-meat-livestock.jpg)