Embed Size (px)
Citation preview

Report prepared for
US Confectionery Industry Export Program
Australian Confectionery Market
Prepared by
ERU Consulting Group July 2002
Table of Contents 1 Executive Summary..............................................................................................................................1
1.1 Australian Profile .........................................................................................................................1 1.2 The Australian Confectionery Industry........................................................................................1 1.3 Distribution ..................................................................................................................................2 1.4 Trade ............................................................................................................................................2 1.5 Laws and Regulations ..................................................................................................................3 1.6 Customs and Tariffs .....................................................................................................................3 1.7 Conclusion ...................................................................................................................................3
2 Introduction ..........................................................................................................................................5 3 Geography ............................................................................................................................................6
3.1 Climate.........................................................................................................................................7 4 Economy...............................................................................................................................................8
4.1 Trade ............................................................................................................................................8 4.2 Foreign Exchange ......................................................................................................................11 4.3 Domestic Environment ..............................................................................................................11 4.4 Micro Economic Reforms..........................................................................................................12
5 Demographics.....................................................................................................................................13 5.1 Today .........................................................................................................................................13 5.2 Tomorrow ..................................................................................................................................16
6 Infrastructure ......................................................................................................................................18 6.1 Transportation ............................................................................................................................18
7 Industry Profile ...................................................................................................................................21 7.1 History .......................................................................................................................................22 7.2 Chocolate Confectionery ...........................................................................................................23 7.3 Sugar Confectionery ..................................................................................................................25 7.4 Gum ...........................................................................................................................................25 7.5 Industry Characteristics .............................................................................................................26 7.6 Industry Attractiveness ..............................................................................................................28 7.7 Major Players .............................................................................................................................30 7.8 Marketing Strategies of Industry................................................................................................32 7.9 Imports .......................................................................................................................................33
8 Production...........................................................................................................................................37 8.1 Production Trends and Outlook .................................................................................................38
9 Consumption.......................................................................................................................................39 9.1 Competitors in the Snack Category ...........................................................................................40 9.2 Consumer Behaviour .................................................................................................................40 9.3 Demand Determinants ...............................................................................................................41
10 Distribution.........................................................................................................................................43 10.1 Grocery Channel ........................................................................................................................44 10.2 Route Distribution......................................................................................................................44 10.3 Independent Wholesalers ...........................................................................................................45
11 Trade...................................................................................................................................................46 11.1 Confectionery Retail Channels ..................................................................................................46 11.2 Confectionery Retail Trends ......................................................................................................46 11.3 The Australian Grocery Sector ..................................................................................................47 11.4 The Australian Route Trade.......................................................................................................50
12 Laws and Regulations.........................................................................................................................52 12.1 Food Labelling ...........................................................................................................................52 12.2 Food Additives...........................................................................................................................55 12.3 Processing Aids..........................................................................................................................56 12.4 GM Foods ..................................................................................................................................56
13 Customs and Tariffs............................................................................................................................57

13.1 Import Documentation ...............................................................................................................57 13.2 Customs Valuation System ........................................................................................................58 13.3 Taxation .....................................................................................................................................58 13.4 Rules of Origin...........................................................................................................................58 13.5 Assistance ..................................................................................................................................59 13.6 Government Initiatives...............................................................................................................59 13.7 Imported Food Program.............................................................................................................60
14 Opportunities for US Confectionery...................................................................................................61 14.1 Adult Confectionery...................................................................................................................61 14.2 Children’s and Novelty Confectionery ......................................................................................61 14.3 Packaging Innovations ...............................................................................................................61 14.4 Functional Confectionery...........................................................................................................61 14.5 New Seasonal Opportunities - Halloween .................................................................................62 14.6 Chewing Gum ............................................................................................................................62 14.7 US Product Banner ....................................................................................................................62 14.8 Australia as an Export Base .......................................................................................................62
15 Conclusion ..........................................................................................................................................63 15.1 Barriers and Facilitators to Market Entry ..................................................................................63 15.2 Importance of Distribution.........................................................................................................63 15.3 Branding and Marketing ............................................................................................................64
16 Contacts ..............................................................................................................................................65 16.1 Trade ..........................................................................................................................................65 16.2 Distributors ................................................................................................................................68 16.3 Confectionery Importers ............................................................................................................69 16.4 Government Bodies and Industry Associations .........................................................................70
ERU Consulting Group
25-27 Garden Road, Donvale, Victoria, 3111.
Australia.
Phone +61 3 9842 7671 Fax +61 3 9842 8904
Email: [email protected]

1 Executive Summary
1.1 Australian Profile Australia is an island continent in the southern hemisphere roughly the same land mass of the United States. The climate varies from tropical monsoon in the north, and continental in the centre of the country, to temperate in the south. The estimated population of Australia in 2001 was 19.6 million people, with an estimated growth rate of 1.5 to 2% over the next ten years. Soil and climatic conditions have resulted in a heavy concentration of the population residing on the eastern sea border, with 78% of the population residing in New South Wales, Victoria and Queensland. Australia is also heavily urbanised with 70% of people residing in the state’s capital cities National gross domestic product in 2000-01 was A$641.4 billion (US$365.6 bn) which equates to a per capita GDP of A$33,281 (US$18,970). The Australian economy seems to have been relatively immune to the latest global downturn, experiencing a growth rate of around 4% in 2001. Australian trade for 2001 had a total value of A$303.8 billion (US$173.2 bn), exports accounting for A$153.7 billion (US$87.6 bn) and imports accounting for A$150.1 billion (US$85.6 bn), resulting in a surplus of A$3.6 billion (US$2.1 bn). Major trading partners with Australia include; Japan, United States, China, the Republic of Korea and New Zealand. Currently the AUD/USD exchange rate is 57 US cents. Australia has a relatively sophisticated transport infrastructure for all transport mediums, with the dominant mode of freight transport being road, rail plays an important part in transporting bulk freight long distances.
1.2 The Australian Confectionery Industry In 2001, the retail sales value of confectionery in Australia was A$2.53 billion (US$1.44 bn). This represented a 7% increase on the previous year. Chocolate accounts for around 60% of the total confectionery market with the major segments being chocolate bars (43%), blocks (27%), boxed assortments (12%), children’s novelties (7%) and seasonal (mainly Easter moulded – 11%). Sugar confectionery and gum, is estimated at A$838 million (US$477.7 m), accounted for 41% of the confectionery market. The chocolate confectionery business has a seasonal bias towards the colder months of the year and special gift occasions such as Easter, Christmas, Mother's Day and Valentines Day. In Australia, the confectionery market is in a mature phase of its life cycle with long-term volume growth limited to population growth (2-3%). There are some 85 firms producing confectionery in Australia however, the overall confectionery market is dominated by the resident multinational producers Cadbury Schweppes (36%), Nestlé Confectionery (22%) and Mars Confectionery (18%). Total confectionery imports accounted for around A$205 million (US$116.9 m) in 2001. This translates to a retail sales value of around A$420 million (US$239.4 m), some 17% of the national market. Major import suppliers come from New Zealand, United Kingdom, Belgium, Italy, Switzerland, United States and China. There are five different types of confectionery importers who operate in the Australian market;
1. Domicile manufacturers importing from overseas parent/related subsidiaries 2. Supermarkets importing directly 3. Specialised importing agents of international brands 4. Sales/marketing offices of overseas producers 5. Small niche/bulk confectionery import agents
1
Per capita consumption of confectionery is around 10.1 kgs per annum. In 2001, Australians consumed 4kg of sugar products, and 6.1kg of chocolate. In Australia, nine out of ten people consume confectionery regularly, 80% of which consume from both chocolate and sugar confectionery. Most consumers enjoy at least 2 or 3 different confectionery brands per week with heavy chocolate consumers eating on average 7 different brands each week. Confectionery accounts for about 43% of the Australian snack food market. Australians are the fourth largest consumers overall of processed snacking foods. The average Australian household spend is A$800 pa (US$456) on snack foods. However, compared to overseas consumers, Australians eat a wider variety of snack goods.
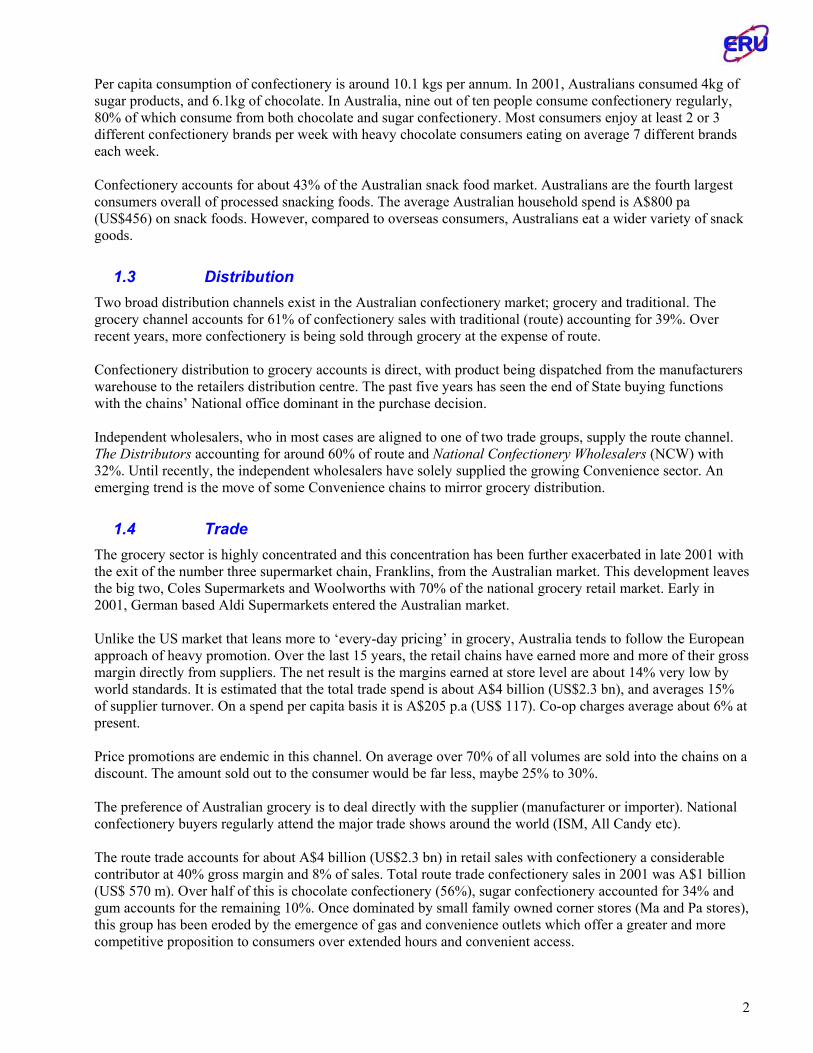
1.3 Distribution Two broad distribution channels exist in the Australian confectionery market; grocery and traditional. The grocery channel accounts for 61% of confectionery sales with traditional (route) accounting for 39%. Over recent years, more confectionery is being sold through grocery at the expense of route. Confectionery distribution to grocery accounts is direct, with product being dispatched from the manufacturers warehouse to the retailers distribution centre. The past five years has seen the end of State buying functions with the chains’ National office dominant in the purchase decision. Independent wholesalers, who in most cases are aligned to one of two trade groups, supply the route channel. The Distributors accounting for around 60% of route and National Confectionery Wholesalers (NCW) with 32%. Until recently, the independent wholesalers have solely supplied the growing Convenience sector. An emerging trend is the move of some Convenience chains to mirror grocery distribution.
1.4 Trade The grocery sector is highly concentrated and this concentration has been further exacerbated in late 2001 with the exit of the number three supermarket chain, Franklins, from the Australian market. This development leaves the big two, Coles Supermarkets and Woolworths with 70% of the national grocery retail market. Early in 2001, German based Aldi Supermarkets entered the Australian market. Unlike the US market that leans more to ‘every-day pricing’ in grocery, Australia tends to follow the European approach of heavy promotion. Over the last 15 years, the retail chains have earned more and more of their gross margin directly from suppliers. The net result is the margins earned at store level are about 14% very low by world standards. It is estimated that the total trade spend is about A$4 billion (US$2.3 bn), and averages 15% of supplier turnover. On a spend per capita basis it is A$205 p.a (US$ 117). Co-op charges average about 6% at present. Price promotions are endemic in this channel. On average over 70% of all volumes are sold into the chains on a discount. The amount sold out to the consumer would be far less, maybe 25% to 30%. The preference of Australian grocery is to deal directly with the supplier (manufacturer or importer). National confectionery buyers regularly attend the major trade shows around the world (ISM, All Candy etc). The route trade accounts for about A$4 billion (US$2.3 bn) in retail sales with confectionery a considerable contributor at 40% gross margin and 8% of sales. Total route trade confectionery sales in 2001 was A$1 billion (US$ 570 m). Over half of this is chocolate confectionery (56%), sugar confectionery accounted for 34% and gum accounts for the remaining 10%. Once dominated by small family owned corner stores (Ma and Pa stores), this group has been eroded by the emergence of gas and convenience outlets which offer a greater and more competitive proposition to consumers over extended hours and convenient access.
2

Other route channels are also growing, notably vending, cinema and fundraising. A number of companies have also enjoyed some success exploiting non-traditional sales opportunities (hardware stores, hotel liquor outlets, event ‘presence’ sales and on-line bulk sales).
1.5 Laws and Regulations In Australia the production and sale of processed foods are regulated at both Federal and State Government levels. Federal involvement principally arises through its responsibility for developing the Australian Food Standards Code, the setting of imports and export standards, and the inspection of exports and imports. State and local governments are responsible for enforcement of the Code. In the latter half of 1996 the Australian food regulating body joined forces with New Zealand, forming the Australia New Zealand Food Authority (ANZFA). By 2001, the process of developing ‘streamlined’ joint standards was completed, enabling harmonisation of food regulations between both countries. The new Code replaces existing food standards codes and food regulations operating in both Australia and New Zealand in approximately December 2002. Comprehensive labelling requirements are included in Part 1 of the Code. The Code also sets levels for food additives, processing aids, vitamin and mineral nutrients, and the purity of these substances, in foods. No novel, irradiated or genetically modified food is permitted for sale in Australia and New Zealand unless they have passed a pre-market safety assessment by ANZFA.
1.6 Customs and Tariffs All goods imported into Australia must be cleared by customs. Importers are responsible for obtaining a formal customs clearance for consignments of goods above set value limits. Goods entering the country attract customs duties and/or GST levies (10%). The relevant tariff rate for confectionery is 5% but this is reduced to 3% for developing countries and zero for under developed countries. No industry-specific subsidies or grants are available to this industry. The Australian Quarantine and Inspection Service (AQIS) and the Australia New Zealand Food Authority (ANZFA) jointly run the Imported Food Program (IFP), with ANZFA advising on food risk assessment policy and AQIS having operational responsibility for inspection and sampling. AQIS officers carry out inspections of food, and standards applied are set down in the Australian Food Standards Code (FSC). Food imported into Australia falls into one of three inspection categories, which determine the frequency of freight inspections. The three categories are risk, active surveillance and random surveillance. On the whole confectionery products are generally classified as low risk and are therefore subject to random inspections.
1.7 Conclusion US culture is readily accepted in Australia. With few exceptions, US licensed products sell well. Hollywood movies and American music dominate the local scene. The Australian palate, however, is different. From a confectionery standpoint, it is closer to the taste and preferences of Britain. This is particularly true of chocolate. US chocolate is coarser, bittersweet and not well received in Australia. Sour tasting sugar candy is also markedly less developed as a segment when compared with the US. However there are several identified opportunities for US confectionery including;
• Adult Confectionery • Children’s and Novelty Confectionery • Packaging Innovations • Functional Products • New Seasonal Opportunities – Halloween • Chewing Gum • US Product Banner • Australia as an Export Base
3

In developing a market entry strategy, US manufacturers should bear in mind the relatively small total market size, extent of confectionery manufacturer and brand concentration, price competitive nature of the market and the high levels of concentration of retail trade outlets. Advertising and promotional commitment is fundamental to facilitate broad based consumer trial. To obtain a substantial share of the Australian confectionery market, a wide distribution network is essential because of the impulse nature of confectionery purchase decisions. The fact that grocery retail (and for that matter, route retail) is highly concentrated, this allows fairy straightforward access to the entirety of the national market. Operational model options include; to operate either through an appointed local agent, or alternatively, establish their own local sales and marketing office. Smaller firms may consider forming a network with other manufacturers in order to share the costs associated with market entry, perhaps through a cross-branded strategy. Niche product specialists can take advantage of either direct supply or through a number of specialised local import agents.
4

2 Introduction This report has been prepared for the National Confectioners Association under a research engagement conducted by ERU Consulting Group for the US Confectionery Industry Export Program (USCIEP). The primary purpose of the research program was to provide US confectionery manufacturers and marketers with the market information necessary for making informed decisions regarding market opportunities in Australia for their products. In addition the research provides contact information, which will enable interested parties to immediately begin inquiries with appropriate distributors. Research findings will be shared with all interested US confectionery manufacturers and other interested parties. Based on the above considerations, the objective of the research has been specified: "to develop qualitative and quantitative intelligence on the Australian Confectionery Market, its distribution
channels and to produce alternative market entry strategies and a market contact base" The research engagement was commissioned on 10 May, 2002, the background research and trade interviews where conducted during May - June 2002 with the bulk of the report being written in late June. The scope of the engagement requirements has been reflected in the section headings of this report. A wide range of confectionery industry published information sources were reviewed during the research engagement and was supplemented by direct market and industry surveys consisting of interviews with manufacturers, importers/exporters, wholesalers, distributors, retailers from all categories and industry trade organisations involving some 40 persons covering major Australian capital cities. The report that follows has involved the collation and analysis of these different data and information sources into a composite and integrated market analysis. A detailed list of key industry contacts has been provided in chapter 16, laws and regulations in relation to the importation of confectionery into Australia and a selection of relevant reports and documents have been included on the CD Rom version of this report, these provide valuable information about the specifics of food regulations and import laws. Note: All currency conversions contained within this report were calculated based on an exchange rate of A$1:US$0.75.
5
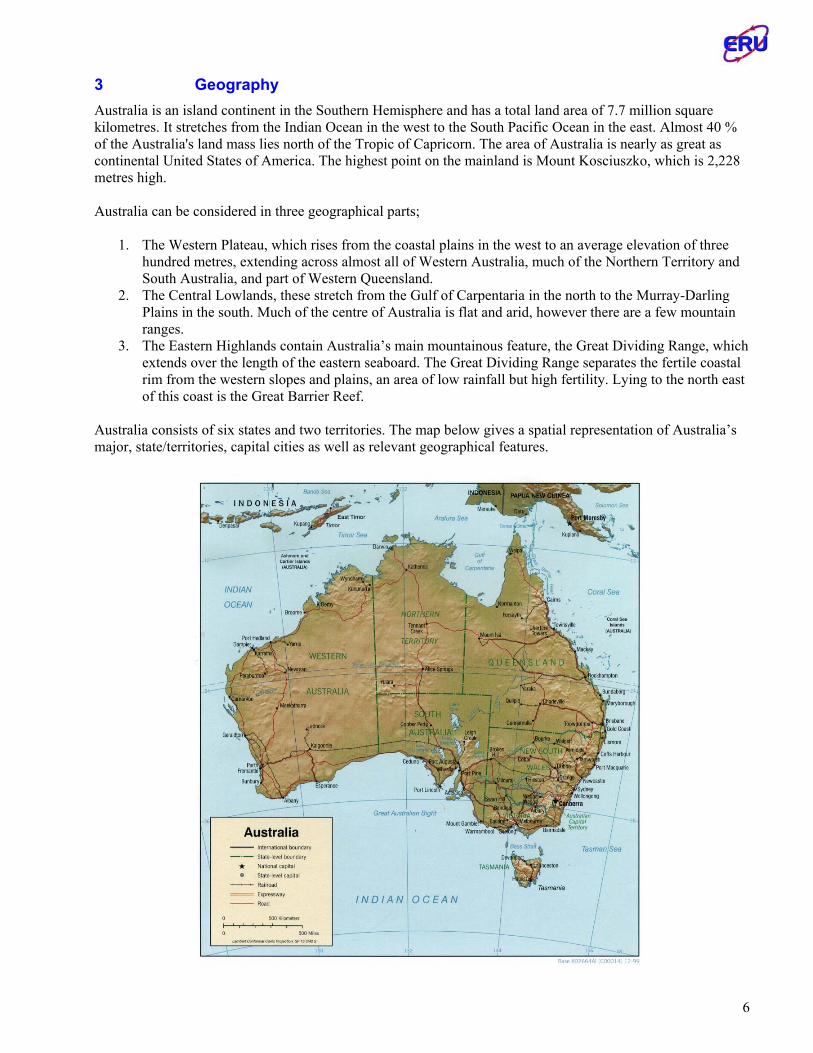
3 Geography Australia is an island continent in the Southern Hemisphere and has a total land area of 7.7 million square kilometres. It stretches from the Indian Ocean in the west to the South Pacific Ocean in the east. Almost 40 % of the Australia's land mass lies north of the Tropic of Capricorn. The area of Australia is nearly as great as continental United States of America. The highest point on the mainland is Mount Kosciuszko, which is 2,228 metres high. Australia can be considered in three geographical parts;
1. The Western Plateau, which rises from the coastal plains in the west to an average elevation of three hundred metres, extending across almost all of Western Australia, much of the Northern Territory and South Australia, and part of Western Queensland.
2. The Central Lowlands, these stretch from the Gulf of Carpentaria in the north to the Murray-Darling Plains in the south. Much of the centre of Australia is flat and arid, however there are a few mountain ranges.
3. The Eastern Highlands contain Australia’s main mountainous feature, the Great Dividing Range, which extends over the length of the eastern seaboard. The Great Dividing Range separates the fertile coastal rim from the western slopes and plains, an area of low rainfall but high fertility. Lying to the north east of this coast is the Great Barrier Reef.
Australia consists of six states and two territories. The map below gives a spatial representation of Australia’s major, state/territories, capital cities as well as relevant geographical features.
6
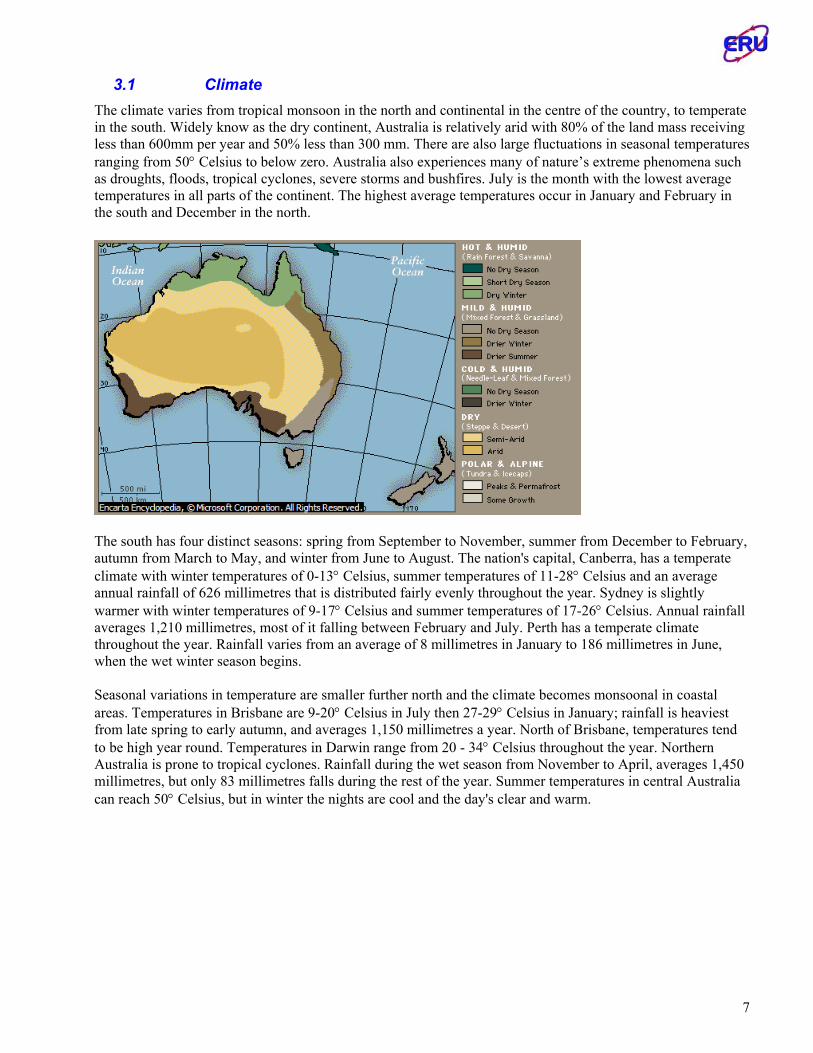
3.1 Climate The climate varies from tropical monsoon in the north and continental in the centre of the country, to temperate in the south. Widely know as the dry continent, Australia is relatively arid with 80% of the land mass receiving less than 600mm per year and 50% less than 300 mm. There are also large fluctuations in seasonal temperatures ranging from 50° Celsius to below zero. Australia also experiences many of nature’s extreme phenomena such as droughts, floods, tropical cyclones, severe storms and bushfires. July is the month with the lowest average temperatures in all parts of the continent. The highest average temperatures occur in January and February in the south and December in the north.
The south has four distinct seasons: spring from September to November, summer from December to February, autumn from March to May, and winter from June to August. The nation's capital, Canberra, has a temperate climate with winter temperatures of 0-13° Celsius, summer temperatures of 11-28° Celsius and an average annual rainfall of 626 millimetres that is distributed fairly evenly throughout the year. Sydney is slightly warmer with winter temperatures of 9-17° Celsius and summer temperatures of 17-26° Celsius. Annual rainfall averages 1,210 millimetres, most of it falling between February and July. Perth has a temperate climate throughout the year. Rainfall varies from an average of 8 millimetres in January to 186 millimetres in June, when the wet winter season begins. Seasonal variations in temperature are smaller further north and the climate becomes monsoonal in coastal areas. Temperatures in Brisbane are 9-20° Celsius in July then 27-29° Celsius in January; rainfall is heaviest from late spring to early autumn, and averages 1,150 millimetres a year. North of Brisbane, temperatures tend to be high year round. Temperatures in Darwin range from 20 - 34° Celsius throughout the year. Northern Australia is prone to tropical cyclones. Rainfall during the wet season from November to April, averages 1,450 millimetres, but only 83 millimetres falls during the rest of the year. Summer temperatures in central Australia can reach 50° Celsius, but in winter the nights are cool and the day's clear and warm.
7

4 Economy “Australia is the lucky country; yet its recent performance is more than a one-year wonder. Over the past ten years, Australia has enjoyed the fastest growth rate of any big developed economy. A series of reforms over the past two decades--from financial deregulation and reduced import barriers to the overhaul of taxes and labour relations--has made the economy much more competitive. Good policy has counted for more than good luck.” The Economist 6/04/2002
Australia is a market based economy and a member of the OECD. Gross domestic product (GDP) in 2000-01 was A$641.4 billion (US$365.5 bn) which equates to a per capita GDP of A$33,281 (US$18,970). Australia is one of the few industrialized economies that has been relatively unaffected by the latest global downturn, experiencing a growth rate of around 4% in 2001. That is not to say that it has not been unaffected. Export growth in 2000 was in the order of 25-30% in 2001 it was only 9%. This resilience has been due broadly to three factors. Firstly the Australian dollar has been weak which has made manufacturers highly competitive and has boosted exports. Second demand has been propped up by a boom in the housing sector. Finally, Australia has been relatively immune to the crash in the IT sector, which accounts for 15% of GDP compared to 45% in the US. Assuming that the global economy growth improves in the later part of 2002 market analysts expect to see growth sustained at a robust pace of 3.75 - 4% over the next financial year. The most critical domestic issue is the timing and the extent of the swing in activity from housing to business investment. Recent business surveys do indicate there is a significant recovery in business investment intentions but firmer evidence of a global recovery is needed before these are realized. Private consumption is set to remain strong with the improving labour market and lagged effects of increases in household wealth offsetting the impact of rising interest rates.
4.1 Trade The total value of trade in goods and services in 2001 was A$303.8 billion (US$173.2 bn), a 5% increase on the previous year, which is slightly lower than the five year average growth of 8%. Exports grew by 8% to A$153.7 billion (US$87.6 bn), the result of a 1% increase in export volumes and a 7% rise in prices received for exports. Imports increased by 1% to A$150.1 billion (US$85.6 bn), a result of a 6% increase in prices and a 4% decrease in volume. This result put the trade balance in a surplus of A$3.6 billion (US$2.1 bn), a turnaround of A$9.7 billion (US$5.5 bn) from it’s 2000 deficit of A$6.1 billion (US$3.5 bn). Merchandise trade recorded a surplus of A$4.8 billion (US$2.7 bn) while the trade in services recorded a deficit of A$1.2 billion (US$680 m) for 2001.
Australian Exports 2001
47%
8%17%
8%
20%
Primary Products Simply Transformed ManufacturersElaborately Transformed Manufacturers Other MerchandiseServices
Source: Australian Department of Foreign Affairs and Trade
8

Australian exports for the last five years have been growing at an average annual rate of 9% fuelled by the low value of the Australian dollar and the strong domestic economy. Nearly half of all exports are primary products, manufactured goods account for 25% simply transformed manufactures (STM) and elaborately transformed manufactures (ETM), services account for a further 20% and other merchandise accounts for 8%. The growth in exports during 2001 was a result of exports of primary products increasing by 12%, manufacturing exports growing by 8%, other merchandise exports growing by 18% and a fall in service exports of 2%. The chart on the previous shows a category breakdown of Australian exports.
Australian Imports 2001
12%8%
56%
1%
23%
Primary Products Simply Transformed ManufacturersElaborately Transformed Manufacturers Other MerchandiseServices
Source: Australian Department of Foreign Affairs and Trade During the last five years imports have been growing at an average rate of 9% pa. Nearly two thirds of Australian imports are manufactured goods, followed by services accounting for 23% and the remainder is made up of other merchandise trade. Major category changes to imports for 2001 included a 4% increase in manufacturing imports, a 21% increase in other merchandise imports and a 4% increase in service imports. The chart above shows a category breakdown of Australian imports.
4.1.1 Merchandise Trade In terms of global merchandise trade Australia is a small player accounting for 1.1% of global merchandise trade in 2000. Given this, Australia is predominantly a price taker (must except the market price) except for a few commodities of which it is a major global producer. Merchandise trade for 2001 was A$240.3 billion an increase of 6% on the previous year. Exports accounted for A$122.5 billion an 11% rise and imports accounted for A$117.7 billion an increase of 1%. Australia’s top five export categories include;
1. Coal at A$12.5 billion (10% of exports). 2. Crude Petroleum at A$ 6.5 billion (5% of exports). 3. Iron Ore at A$5.2 billion (4% of exports). 4. Non-monetary gold at A$5.2 billion (4% of exports). 5. Aluminium at A$4.7 billion (4% of exports).
Australia’s top five imports categories include;
1. Passenger Motor Vehicles at A$8.7 billion (7% of imports). 2. Crude Petroleum at A$7.7 billion (7% of imports).. 3. Telecommunications Equipment at A$5 billion (4% of imports). 4. Computers at A$4.8 billion (4% of imports). 5. Medicaments (including veterinary) at A$3.6 billion (3% of imports).
9

4.1.2 Distribution of Trade Members of the Asian Pacific Economic Community remain Australia’s largest regional trading group representing A$170.6 billion, 71% of total trade. Australia’s trade is spread across the following regions.
• North Asia accounts for A$85.1 billion or 35% of total trade. Exports account for A$50.4 billion and imports were A$34.7 billion leaving a surplus of A$15.7 billion.
• South East Asia accounts for A$32.9 billion or 14% of total trade. Exports account for A$15.4 billion and imports were A$17.5 billion leaving a deficit of A$2.1 billion.
• European Union accounts for A$41.2 billion or 17% of total trade. Exports account for A$14.7 billion and imports were A$26.5 billion leaving a deficit of A$11.7 billion.
• The Americas accounts for A$40 billion or 17% of total trade. Exports account for A$15.2 billion and imports were A$24.8 billion leaving a deficit of A$9.6 billion.
• Oceania accounts for A$16.1 billion or 7% of total trade. Exports account for A$9.7 billion and imports were A$6.4 billion leaving a surplus of A$3.3 billion.
Australian Trade 2001
40%
15%19%
19%
7%
North Asia South East Asia European Union Americas Oceania
Source: Australian Department of Foreign Affairs and Trade Australia’s top five individual trading partners are as follows;
1. Japan accounted for A$39 billion in trade during 2001 representing 16% of total trade. 2. United States accounted for A$33.3 billion in trade during 2001 representing 14% of total trade. 3. China accounted for A$17.9 billion in trade during 2001 representing 7% of total trade. 4. Republic of Korea accounted for A$14.2 billion in trade during 2001 representing 6% of total trade. 5. New Zealand accounted for A$11.9 billion in trade during 2001 representing 5% of total trade.
4.1.3 Trade Priorities Australia has a strong interest in the removal of barriers to investment and trade with the government’s stated priorities being:
• Domestic reform. • Improving bilateral relations. • Improving the regional framework for trade. • Strengthening the international trading system. • Promoting exports.
10

4.2 Foreign Exchange The AUD/USD exchange rate is currently around 57 US cents to A$1. Recently the Australian dollar has been appreciating which is a result of reducing risk aversion, some weakening of the US dollar and an improvement in fundaments (commodity prices, interest rate differentials and relative equity market returns). Further appreciation is expected with the rate topping 57 – 60 US cents in early 2003. However these gains will be progressively eroded as the US economy growth accelerates and as interest rate differentials and relative equity returns advantages are reduced. As the US economy improves so will the pace of capital inflows into the US, which will result in a depreciation of the Australian dollar to around the 55 US cents at the end of 2003.
4.3 Domestic Environment The Australian economy is set for robust growth during the next two years in respect to other economies around the globe. Analysts are predicting that consumer demand will continue to grow until the latter half of 2002 and early 2003 when the downturn in housing occurs as a result of the ending of the governments’ first home buyer scheme and increasing interest rates. Australian businesses’ balance sheets are in a healthy position given the solid growth in profits over the last year. Growth in household consumption is expected to remain strong, fuelled by increased household wealth and low debt servicing.
4.3.1 Fiscal Management "Monetary and fiscal policies have a medium-term orientation, with emphasis on price stability and a sound budgetary position …The fiscal policy framework aims at maintaining a balanced budget, on average, over the business cycle." Steven Hess, Moody’s 9/01/2002
The federal budget for 2001-02 has an estimated deficit of A$3 billion, which is largely a result of higher expenditure on defence, border protection and the first home buyers scheme. Prospects for 2002-03 bring the budget back into a surplus of A$2.1 billion. Recently sound fiscal management and monetary policy has left government finances in a healthy position. Since 1997 the government’s net debt has fallen from A$82.9 billion to A$39.3 billion. This brings Australia’s debt position well below the OECD average. Although the most recent budget is more about delivering election promises than sound fiscal management. Expenditure is relatively unchanged from the previous year at A$170.2 billion. Revenues are expected to grow by 1.8% in real terms during 2002-03 to A$169.6 billion.
4.3.2 Labour Market Despite the strong Australian economy, employment growth has remained sluggish over 2001. Heightened uncertainty surrounding the events of September 11 has delayed employment recovery, although strong activity during the latter half of 2001 is now flowing through and producing substantial employment opportunities. This is evidenced through unemployment dropping to 6.3% and an increase in the number of advertised positions. Further gains are expected in future quarters and unemployment is expected to stabilise at 6% by 2003. Due to the weak labour market in 2001 wage pressures were contained. However as employment grows, there are likely to be some pressures on wages.
4.3.3 Inflation The Reserve Bank of Australia (RBA) has set tight inflation targets for the Australian economy between 2-3%. Inflation has picked up in 2001 at about 3.5% due largely to a pass-through of a weaker currency. Inflation is forecast at 2.5% for 2002 as a result of increases in import prices and a strengthening Australian currency, coupled with moderate unit labour costs. The RBA’s official cash rates are currently 4.75%, with the bank signalling that it intends to restore rates to more neutral levels, which analysts believe are around 5.5%.
11
4.4 Micro Economic Reforms The Australian government has put in place many structural reforms in the last decade to improve the competitiveness and performance of the Australian economy. Some of the major reforms include;
• The restructuring of the labour market away from centralised wage fixing to enterprise bargaining. This has resulted in a more flexible and productive workforce.
• Reductions in tariffs and other microeconomic reforms have helped grow Australia’s export base through creating greater competitiveness and opening up new business opportunities.
• Australia introduced a new taxation system in July 2000 the Goods and Services Tax (GST), which lowered income tax, wholesale sales tax and thus reducing the complexity of the old system.
• Deregulation of the banking, communications and energy sectors, opening up these markets to greater competition.
• Strong corporate regulation and insolvency regimes which are business orientated.
12
5 Demographics
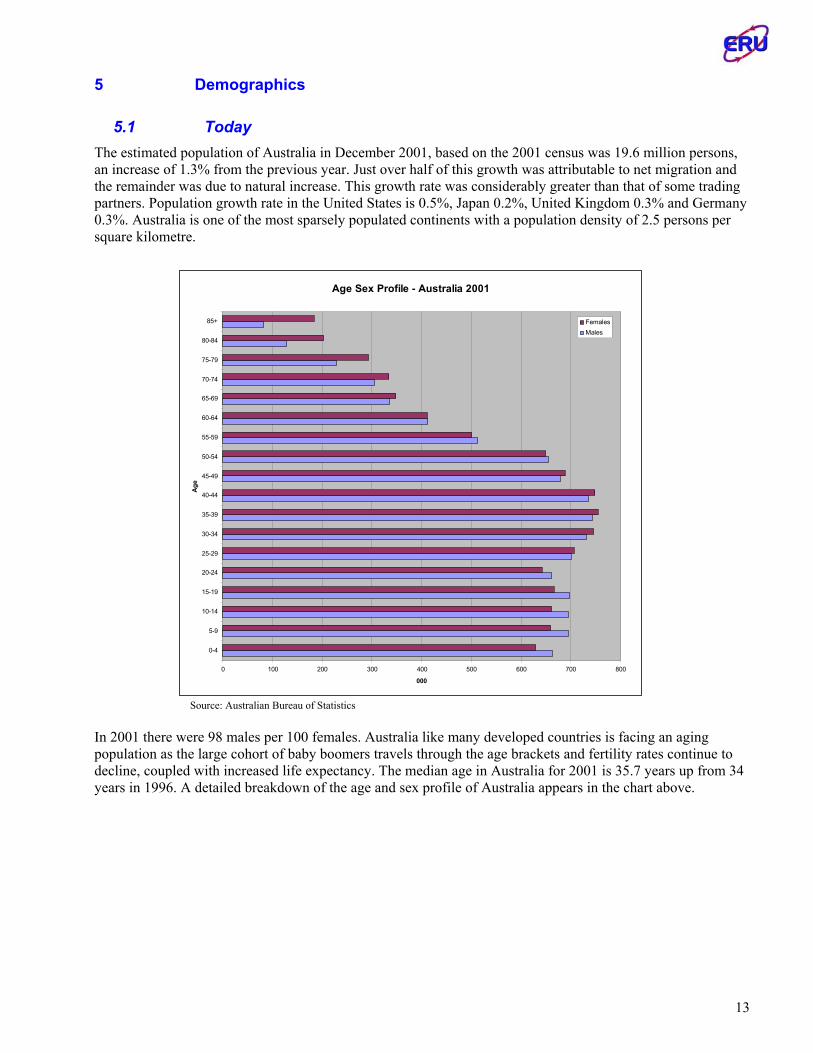
5.1 Today The estimated population of Australia in December 2001, based on the 2001 census was 19.6 million persons, an increase of 1.3% from the previous year. Just over half of this growth was attributable to net migration and the remainder was due to natural increase. This growth rate was considerably greater than that of some trading partners. Population growth rate in the United States is 0.5%, Japan 0.2%, United Kingdom 0.3% and Germany 0.3%. Australia is one of the most sparsely populated continents with a population density of 2.5 persons per square kilometre.
Age Sex Profile - Australia 2001
0 100 200 300 400 500 600 700 800
0-4
5-9
10-14
15-19
20-24
25-29
30-34
35-39
40-44
45-49
50-54
55-59
60-64
65-69
70-74
75-79
80-84
85+
Age
000
FemalesMales
Source: Australian Bureau of Statistics In 2001 there were 98 males per 100 females. Australia like many developed countries is facing an aging population as the large cohort of baby boomers travels through the age brackets and fertility rates continue to decline, coupled with increased life expectancy. The median age in Australia for 2001 is 35.7 years up from 34 years in 1996. A detailed breakdown of the age and sex profile of Australia appears in the chart above.
13

Soil and climatic conditions have been controlling factors in the concentration of population in the well-watered, fertile coastal regions of the east, southeast, and southwest. The largest populated of these regions is the south east and east. Within these coastal regions population is concentrated in urban centres particularly capital cities. To put this in perspective the most densely populated 1% of the continent contains 84% of the population. The map below shows the spatial distribution of Australia’s population.
The majority of Australia’s population (78%) resides in three states, New South Wales, Victoria and Queensland, all located on Australia’s south eastern sea border. The largest of these, New South Wales, accounts for one third of the nation’s population. The table below indicates the geographical spread of Australia’s population by states and territories.
State Population % of Population Median Age millions
New South Wales 6.6 34% 35.7 Victoria 4.9 25% 35.5 Queensland 3.7 19% 34.9 South Australia 1.5 8% 37.4 Western Australia 1.9 10% 34.5 Tasmania 0.5 3% 37.0 Northern Territory 0.2 1% 29.3 Australian Capital Territory 0.3 2% 32.9 Total 19.6 100%
Source: Australian Bureau of Statistics
14

With more than 70% of Australians live in the metropolitan areas of the capital cities of the six states, the country is highly urbanized. Less than 14% of the population live in rural areas. By far the largest two cities are Sydney and Melbourne, the state capitals of New South Wales and Victoria, together accounting for 39% of the population. The table below outlines the geographical spread of Australia’s population by major capital cities and principle metropolitan centres.
Population 2001 % of Population % of States Population
millions New South Wales Sydney 4.1 20.9% 62%
Newcastle 0.5 2.6% 8% Wollongong 0.3 1.5% 5%
Victoria Melbourne 3.5 17.9% 71%
Geelong 0.2 1.0% 4% Queensland Brisbane 1.7 8.7% 46%
Gold Coast 0.4 2.0% 11% South Australia Adelaide 1.1 5.6% 73% Western Australia Perth 1.4 7.1% 74% Tasmania Hobart 0.2 1.0% 40%
Launceston 0.1 0.5% 20% Northern Territory Darwin 0.1 0.5% 50% Australian Capital Territory Canberra 0.3 1.5% 100%
Total 13.9 70.9% Source: Australian Bureau of Statistics
Australia is a tolerant and inclusive society, a nation built by people from diverse backgrounds. Cultural diversity is a cornerstone in the national identity. Net migration plays an important part in the make up of Australia’s population and in the last five years net migration has added half a million people to Australia’s population (3% of total population). Most of the population of Australia is of European descent, Australian aborigines account for about 1% of the total population. Before World War II (1939-1945) the population was almost entirely of British origin, but since then more than 2 million continental Europeans have migrated to Australia. In the 1970s, after the removal of the White Australia Policy, tens of thousands of Southeast Asians were admitted to the country, mainly as refugees. The table below gives a breakdown of the Australian population by their region of birth.
Population 2000 % of Population millions
Oceania and Antarctica 15.1 78.6% Europe and former USSR 2.4 12.5% Middle East and North Africa 0.2 1.0% Southeast Asia 0.6 3.1% Northeast Asia 0.3 1.6% Southern Asia 0.2 1.0% The Americas 0.2 1.0% Other Africa 0.2 1.0%
Total 19.2 Source: Australian Bureau of Statistics
15
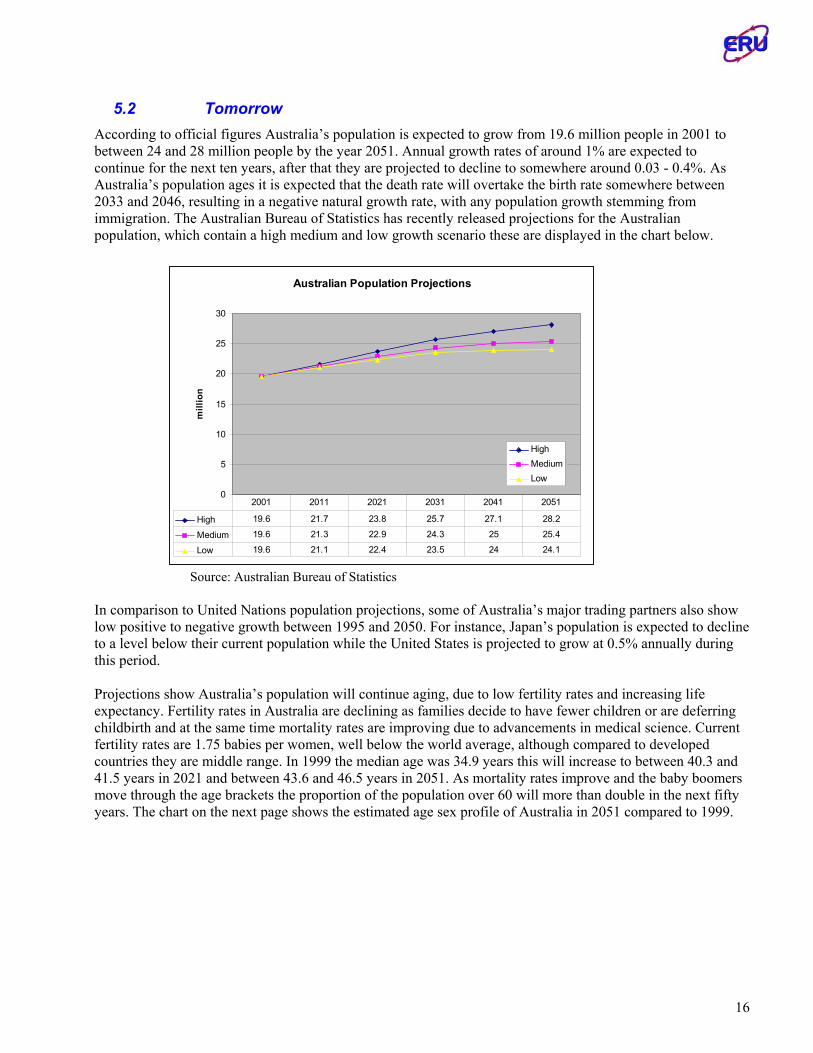
5.2 Tomorrow According to official figures Australia’s population is expected to grow from 19.6 million people in 2001 to between 24 and 28 million people by the year 2051. Annual growth rates of around 1% are expected to continue for the next ten years, after that they are projected to decline to somewhere around 0.03 - 0.4%. As Australia’s population ages it is expected that the death rate will overtake the birth rate somewhere between 2033 and 2046, resulting in a negative natural growth rate, with any population growth stemming from immigration. The Australian Bureau of Statistics has recently released projections for the Australian population, which contain a high medium and low growth scenario these are displayed in the chart below.
Australian Population Projections
0
5
10
15
20
25
30
mill
ion
HighMediumLow
High 19.6 21.7 23.8 25.7 27.1 28.2
Medium 19.6 21.3 22.9 24.3 25 25.4
Low 19.6 21.1 22.4 23.5 24 24.1
2001 2011 2021 2031 2041 2051
Source: Australian Bureau of Statistics In comparison to United Nations population projections, some of Australia’s major trading partners also show low positive to negative growth between 1995 and 2050. For instance, Japan’s population is expected to decline to a level below their current population while the United States is projected to grow at 0.5% annually during this period. Projections show Australia’s population will continue aging, due to low fertility rates and increasing life expectancy. Fertility rates in Australia are declining as families decide to have fewer children or are deferring childbirth and at the same time mortality rates are improving due to advancements in medical science. Current fertility rates are 1.75 babies per women, well below the world average, although compared to developed countries they are middle range. In 1999 the median age was 34.9 years this will increase to between 40.3 and 41.5 years in 2021 and between 43.6 and 46.5 years in 2051. As mortality rates improve and the baby boomers move through the age brackets the proportion of the population over 60 will more than double in the next fifty years. The chart on the next page shows the estimated age sex profile of Australia in 2051 compared to 1999.
16

Source: Australian Bureau of Statistics In terms of the near future the table below estimates the age profile of the population in 2011.
Age 2001 % of Population 2011 % of Population millions millions 0-14 years 4 20% 3.8 18% 15-64 years 13.1 67% 14.5 68% 65 plus 2.5 13% 3.0 14%
Source: Australian Bureau of Statistics All state populations are expected to grow over the next fifty years, with the exception of Tasmania and South Australia. However, they are all growing at different rates and the outcome will be a noticeably different population distribution. The major changes expected are that Queensland will overtake Victoria in terms of population size and ACT and the Northern Territory will overtake Tasmania. The major factor contributing to the changes in population distribution relate to internal migration, in 1999-2000 some 367,390 people moved between states and territories. Australia has a planned migration program which supports skilled migration and future net migration is expected to remain constant at 90,000 persons per year with the same age-gender profile in the near future. Net migration can have a large impact on population size overtime though the impact will tend to vary between states and territories. However, such impacts tend to have little effect on the age structure of the population. Currently the majority of migrants settle in NSW (43%) and other dominant states including Victoria (23%), Queensland (16%) and Western Australia (14%). It is also expected that the three largest states will continue to receive the majority of migrants.
17

6 Infrastructure
6.1 Transportation Australia is a large continent with a very concentrated population living in capital cities separated by vast distances. The chart below provides details of distances between Australian capital cities.
Distances Between Australian Capital Cities (km’s) CITY Adelaide Brisbane Darwin Hobart Melbourne Perth Sydney Adelaide 1,618 2,620 976 641 2,114 1,162 Brisbane 1,618 2,849 1,995 1,380 3,605 750 Darwin 2,620 2,849 3,747 3,132 2,648 3,151 Hobart 976 1,995 3,747 615 3,212 1,039 Melbourne 641 1,380 3,132 615 2,699 705 Perth 2,114 3,605 2,648 3,212 2,699 3,274 Sydney 1,162 750 3,151 1,320 705 3,274
The dominant medium of transport of freight is road, though rail plays an important part in transporting bulk freight long distances. Australia’s transport system has developed to serve primary production and mining for domestic and international markets, the manufacturing and tourism sectors as well as to meet the needs of a community separated by vast distances. Australia has relatively sophisticated transport infrastructure for all transport modes, which service the needs of the urban centres and a more basic infrastructure services rural areas where lower levels of demand exist.
6.1.1 Rail The structure of the rail industry in Australia has been under going tremendous change over the last five years as State and Federal Governments privatise their industry holdings. Australia’s rail network comprises of 40,000 kilometres of private and government broad, standard and narrow gauge track, including 4,150 km of sugar cane railways in Queensland. The mainline rail system comprises 8,000 km of standard gauge and 1,680 km of narrow gauge (link between Brisbane and Cairns). The Australian rail system also includes 270 km of tram networks in Melbourne, Adelaide, Sydney and the Snowy Mountains. The rail network is responsible for carrying one third of all domestic freight, some 535 million tonnes or 139.7 billion tonne kilometres in 2000-2001. The rail network is an integral part of the distribution process for intrastate and interstate freight and a range of regional produce and bulk export commodities. The map below details the national rail network.
18

6.1.2 Sea Australia has some of the world’s finest natural harbours and as a result coastal and transoceanic shipping are vital to the Australian economy. Some 70 ports serve the state capitals as well as industrial and mining centres. Major ports include Melbourne, Sydney, Port Dampier, Newcastle, Port Kembla, Gladstone, Hay Point, Weipa, Brisbane, Port Adelaide, Geelong and Fremantle. In 1999-2000 some 620.8 million tonnes of cargo moved across Australian wharves up 6% on the previous year. The majority of this is exports (74%), imports account for 9%, coastal cargo loaded and discharged account for 8% each. Major sea ports are shown on the map on the previous page and a detailed map of sea ports is provided below as well.
Coastal freight movement accounted for 102.1 million tonnes of cargo through Australian ports in 1999-2000. Coastal freight movement accounts for just under one third of all freight movements within Australia. This represents 108.9 billion tonne kilometres. The major freight items are bulk movements of natural resources.
19

6.1.3 Road Australia has approximately 865,000 km of roads, about half of which are paved. Highways are limited to the more densely populated areas. Some 10 million motor vehicles (more than one vehicle for every two persons) are registered.
6.1.4 Air A comprehensive network of airline services, including some 440 airports link major cities and even remote settlements around Australia. Domestic airlines (Qantas and Virgin Blue) carry over 10 million passengers annually. Because of the long distances between cities and the country's ideal flying conditions, Australians are especially air-minded. Qantas International Airline, operates services to many world capitals, and numerous international airlines operate to Australia.
20

7 Industry Profile The retail sales value (RSV) of confectionery in Australia was A$2.53 billion (US$1.44 bn) in 2001, up 7% on the previous year. Sales growth, averaging around 5% per annum throughout the 1990’s reflects both the number of new brands and product launches along with the continued high levels of advertising and promotional activity. Over A$110 million (estimate) (US$62.7 m) was spent on consumer advertising and promotion in 2001 supporting key brands. With some 5,000 different confectionery products and packs available in the market place, the Australian confectionery market place remains intensively competitive. Virtually every major global player is represented along with around 80 smaller producers. In Australia, as in other Western economies, the confectionery market is in a mature phase of its life cycle. Long-term volume growth is therefore limited to around 2-3% per annum, largely reflecting population growth. The confectionery market is divided into three main segments: chocolate confectionery, sugar confectionery and gum, with the largest, chocolate, having four distinct product segments: chocolate bars, chocolate blocks, boxed chocolate and other chocolate. The latter segment largely comprises novelty and seasonal items including Easter Eggs. The overall confectionery market is dominated by the resident multinational producers; Cadbury Schweppes (36%), Nestlé Confectionery (22%) and Mars Confectionery (18%). Shares for major categories are detailed below: Within individual market segments, the respective shares held by the companies vary considerably, with Cadbury more dominant in chocolate compared to Nestlé who dominates the sugar segment.
Australian Confectionery Market 2001 Retail Sales Value $2.53 billion
Chocolate confectionery
Sugar confectionery Gum
RSV $ $1490 million $838 million $201 million RSV % 59% 33% 8% Market shares
Cadbury 54% Nestlé 32% Wrigley 97% Mars 19% Mars (inclu. Kenman) 17% Others 3% Nestlé
17% Cadbury (inclu Chupa Chups, Trebor)
11%
Ferrero 2% Ferrero 3% House, generics 1% House, generics 11% Others 7% Others 26%
Source: Confectionery Manufacturers of Australasia (CMA)
21
7.1 History The formalisation of the Australian confectionery industry started when James Stedman set up a small factory in 1874. In 1918 the James Stedman Henderson Company established Sweetacres, in New South Wales. MacRobertsons commenced manufacturing in Victoria around 1900, followed by Hoadley. Nestlé began its food operations in 1908, manufacturing a variety of food products including chocolate products. The Allen's brand dates back to 1891 and Life Savers to 1921. Cadbury Fry Pascall began their Australian operations in 1928. Mars products were introduced in the late 1950s, when they were made, sold and distributed by MacRobertson. In the following three decades, the industry underwent major rationalisation, beginning with Cadbury's takeover of MacRobertson in 1967. In 1968, Hoadley acquired Stedman only to be acquired itself by Rowntree three years later. In 1979 Mars ceased its long standing manufacturing license with Mackintosh, establishing its own manufacturing plant in Ballarat, Victoria. Acquisitions both in Australia and overseas continued in the final two decades of the 20th century. The key corporate changes impacting on Australia include: Nestlé's acquisition of local firms Life Savers (1985) and Allen's (1985) and globally, the UK based Rowntree Mackintosh (1988). Nestlé Confectionery Ltd was established in 1991 bringing all its confectionery brands under the one banner group. Cadbury's acquisition of Beatrice Australia Limited (Red Tulip, Europe Strength Foods, Van Camp, James and Molly Bushell Confectionery) in 1987. Phillip Morris' acquisition of Jacobs Suchard (1990) and Terry's (1993) placing them under its Kraft Food operation. Mars acquisition of Kenman Kandy in 1997, the latter operating with considerable autonomy, marketing under its own company name. By century’s end, the combined national market share held by global giants Cadbury Schweppes, Nestlé and Mars accounted for around 75%. Yet, in spite of the extensive concentration of the industry since the 1950’s, the number of domestic confectionery manufacturers has doubled to around 140 firms, testimony to the plethora of niche opportunities characteristic of confectionery markets in industrialised countries.
22

7.2 Chocolate Confectionery In 2001, the top ten chocolate brands accounted for approximately 70% of sales. Cadbury has the major share in this sector at 54%, followed by Mars at 19% and Nestlé at 17%. However, within each of the chocolate segments, company shares vary considerably.
0.0
0.2
0.4
0.6
0.8
1.0
1.2
1.4
1.6
RSV $A Millions
1999 2000 2001
Chocolate Segment Sales 1999-2001
SEASONAL
CHILDRENS
ASSORTMENTS
BARS
MOULDED
Source: CMA In sales terms, ($ Value), chocolate accounts for around three-fifths of the total confectionery market with the major segments being chocolate bars (43%), blocks (27%), boxed assortments (12%), children’s novelties (7%) and seasonal (mainly Easter moulded – 11%).
7.2.1 Chocolate Bars With retail sales of A$636 million (US$362.5 m), chocolate bars are the largest chocolate sub-segment experiencing 6% growth over the past three years. Bars account for about 40% of chocolate sales and benefit from the highest level of advertising expenditure within the confectionery category. Competition is intense in this market with about 75% of sales made on impulse. The top selling bars in order are Mars Bar, Kit Kat and Cadburys Cherry Ripe. Mars has the highest market share in this segment at around 38% with three of its brands (Mars Bar, Snickers and M&M’s) in the top five. Cadbury, with major brands Cherry Ripe, Crunchie, Picnic and Time Out in the top eight has 32% share. Nestlé has the third highest share at 25%. Nestlé's Kit Kat is the second best seller in this segment, while its bars, Violet Crumble and Smarties, also rank in the top ten.
7.2.2 Chocolate Blocks The chocolate block market, estimated at A$415 million (US$236.6 m) in 2001, is dominated by Cadbury, with a 74% market share. Cadbury dominate the block category producing the eight top selling products in this segment, with Cadbury Dairy Milk being the top selling brand over the entire confectionery market. Its major competitor, Nestlé, has a 16% market share and is market leader in the dark and white chocolate segments with Nestlé Milky Bar and Nestlé Club, its most popular brands. Suchard's market share of 3% comes from Toblerone, Milka and Cote D'or products.
23

In recent years Nestle has attempted to gain market share in this segment through extending some of their current bar lines into block format, some examples of these include Smarties, Violet Crumble, Milky Bar and Rolo.
7.2.3 Boxed Chocolates The boxed chocolate market estimated at A$159 million (US$90.6 m) in 2001, is again dominated by Cadbury with a share around 38%, Lindt at 19% and Ferrero at 13%. In 1999, faced with sustained unfavourable US exchange rates, Russell Stover (Whitmans) exited the Australian market following a peak share of 22% in 1998. This was a regrettable development given that in a short space of time, Whitman’s had significantly expanded this segment through its heavy advertising and promotional activity. Being largely purchased as a gift item, boxed chocolate sales are highly seasonal, with 90% of sales around Valentines Day, Easter, Mother's Day and Christmas. Unlike other confectionery products that compete against each other or food substitutes, boxed chocolates compete against flowers, wine and compact discs as presents. The market for boxed chocolates is very price sensitive and retailers and manufacturers regularly cut prices to boost sales. The top sellers in this segment, in order, are Cadbury Roses, Favourites (Cadbury mini-bar twist wraps), Ferrero Rocher, Milk Tray (Cadbury) and Celebrations (Mars mini-bar twist wraps). Imported products from Ferrero, Nestlé (Baci) and Stuart Alexander (Guylian) are taking small but increasingly significant shares of the Australian market. About 70% of boxed chocolate sales are through grocery outlets. A number of assortment lines are now being successfully sold in impulse ‘counter-top’ packs of one, two or three items. Ferrero started this trend but have been followed by Lindor Balls (Lindt).
7.2.4 Other Chocolate Other chocolate, including Easter Eggs, other seasonal lines, and chocolate food products such as milk modifiers, totalled A$275 million (US$156.8 m) in 2001. Cadbury, Ferrero and Nestlé dominate this market with a 50%, 27% and 20.5% share respectively. In the Easter market, Cadbury's dominates with 70% market share. A major segment of The children’s category is children's lines (A$100 million). Over the past three years, growth in the children’s chocolate category has been spectacular, largely as a result of the very successful entry of Cadbury’s Yowie. This novel product incorporates a plastic indigenous animal within a chocolate shell and is further augmented by books, web site and various merchandising devices. Cadbury is the clear market leader in this category associated with Yowie number one brand followed by its Freddo Frog brand, which celebrated its 70th birthday in 2000. Other Cadbury brands include Caramello Koala, Curly Wurly and Furry Friends brands. Nestlé’s Smarties and Milky Bar products are also major brands. Ferrero's Kinder Surprise, the second most popular brand in 1996 is now sixth owing to some sales displacement from Yowies. Cadbury has also been successful in marketing its Crème Eggs, formerly an Easter-only line, all year round.
24

7.3 Sugar Confectionery In 2001 sugar confectionery and gum sales, estimated at A$838 million (US$477.7 m), accounted for 41% of the confectionery market. Products in this segment comprise sugar bags and packs (including pick and mix) candy rolls and medicated products. The chart below is the most recent breakdown of sugar confectionery product segments
Source: Nestle , varies slightly with AC Nielson data used elsewhere in this report.
he sugar segment is more fragmented than chocolate with the two largest companies accounting for half the
estlé's leading brands are Allen's Minties, Fantales, Kool Mints, Snakes Alive, Lifesavers, Jaffas, Butter
ugar-free brands were launched in the late 1990’s by both majors, Cadbury with Zeros and Nestlé with Zones)
7.4 Gum Th million (US$114.6 m) in 2001, accounts for 8% of confectionery sales
nd
rigley’s have been successful in several rather large direct mail campaigns containing product samples to
Sugar Confectionery Segment Sales 1995-98
289
118
69
92
108
268 271
251
131124
112
93
128124119
109116
76
86
84
0
50
100
150
200
250
300
1995 1996 1997 1998
RSV
$AU
S m
ill.
Bags/PacksChewing GumRolls/Pock. packsFunctionalOther
Tmarket: Nestlé with 32%, Mars 17% and Cadbury with 11%. Smaller operators can more easily penetrate this segment because sugar confectionery making is the simplest and least capital intensive. NMenthol, and medicated lines Soothers and Anticol. Cadbury's leading brands are Pascall Marshmallows, Chupa Chups (import agent), Trebor and Pascall Chocolate Eclairs. Other top selling brands include MarsStarburst, Sunrise jellies, Ferrero's Tic Tacs, and Stuart Alexander’s (import agent) Mentos. Sadding to impressive growth in the candy roll segment over the past four years.
e gum market estimated at A$201 with Wrigley’s being the major player led by its major brands Extra, PK, Juicy Fruit, Arrowmint, Freedent, aDoublemint. Other brands in this segment include Stimorol, which is imported by Stuart Alexander and new entrant Fernadale (Gleam, Vapours). In early 2002, Cadbury launched its 24/7 Brand (Trebor) with considerable fanfare though it is too early to judge the long-term impact on its competitors. WAustralian households. Direct mail was a major promotional vehicle for the launch of Airwaves and Xcite products.
25

7.5 Industry Characteristics The Australian confectionery industry and the successful players within it exhibit the following characteristics:
7.5.1 Impulse Buying Some 70% of confectionery products are bought on impulse, ensuring confectionery has one of the widest distribution bases of any consumer product. Even planned purchases tend to be associated with some form of treat, whether for oneself or others. Effective merchandising is paramount in the impulse food sector. Prominent displays, off aisle locations (eg end aisle, check-out) continue to be heavily utilised by the industry. Because confectionery is largely an impulse item, it is well recognised that it competes with other impulse categories, particularly savoury snacks, ice cream, biscuits and cereal/health bars. Category ‘blurring’ has featured, particularly between confectionery and biscuits. Five years ago, Australia’s largest biscuit manufacturer, Arnott’s, reformatted Tim Tams, a perennial favourite chocolate-coated biscuit, into single pack lines to compete alongside traditional chocolate bars. Whilst this line continues to sell, it has faced stiff opposition from ‘confectionery’ biscuit lines, especially Kit Kat (Nestle), Twix (Mars) and Breakaway (Cadbury). Industry commentators note that the consuming public appears resistant paying the higher confectionery price for a standard pantry items such as Tim Tams.
7.5.2 Efficient Selling and Distribution Network: With the high level of impulse purchasing, confectionery has one of the widest distribution networks of any consumer product, ensuring that it is always on hand to satisfy consumer needs. Manufacturers must ensure their product is efficiently distributed and readily available to consumers. Furthermore, the importance of supermarkets continues to grow and therefore strong relationships between confectionery manufacturers and supermarket chains are critical to ensure mass volume sales. Non-traditional distribution networks also extend from vendor selling machines to confectionery fundraising. Smaller producers find the use of school confectionery fundraising a critical source of volume and access to demand that is related more to families and friends supporting children's order sheets, rather than genuine consumer wants. In recent years, this business channel has become a target for the major brand owners with traditional fund-raising specialists such as the local subsidiary of US based World’s Finest Chocolates, being squeezed out of the market.
7.5.3 Strong Brand Names High profile brands with strong consumer loyalty are fundamental to maintaining market share, as well as in generating sales growth in the confectionery industry. A highly successful brand image also gives products a long life cycle. It also explains the dominance of multinationals that bring with them well-known international brands into the market place. Large companies with big promotion budgets are able to maintain strong brand images and introduce new brands. The difficulty of developing new brands and the underlying constraint of low long-term real growth helps to explain the industry's long history of mergers and acquisitions due to the difficulty of developing brand names. The dominance of multi-nationals in the confectionery market is largely due to the ownership of well-known local and international brand names.
26

In Australia the predominance of well-known brand names is evident from the products that hold the greatest market shares. Many of these brands have a long history, and account for the domination of foreign companies in the confectionery industry. For example, seven of the most successful bars in the Australian market are Mars Bar, Kit Kat, Cherry Ripe, Dairy Milk, Roses, Quality Street and Snickers, all launched before 1939. Others such as Pascall dates back to 1866, and Toblerone to 1908. The well known Australian Minties brand dates back to the 1920s.
7.5.4 Effective Media Support, Strong Merchandising In a mature market like confectionery, consumer interest needs to be constantly stimulated through strong merchandising. Advertising and promotional campaigns are also vital to the long-term success of brand images as well as to sales growth. Typically, major brands enjoy considerable promotional support by way of advertising, principally television (TVC’s) and, ‘below the line’ promotional spend with the retail trade. In 2001, the industry invested around A$110 million (US$62.7 m) in advertising with a similar amount below the line. The countervailing power of major confectionery producers to key distribution outlets such as supermarkets is critical to providing them with leverage in negotiating shelf space in supermarkets. Shelf heights and the positioning of end of aisle displays come at a high premium. With continued fragmentation of the traditional commercial television audience base, the industry has turned to other mediums for brand building promotions. In particular, outdoor and transit advertising is increasingly being utilised following the successful example in the soft drinks industry. Sponsorships also continue to enjoy popularity amongst industry marketers. The better known include the 2000 Olympics by Cadbury and the World Soccer Cup by Mars during the early 1990’s.
7.5.5 Product Innovation Whilst established brands are the mainstay of the industry, new innovative products and packaging drive market growth. New products need to be perceived as innovative and not just copycat products of another brand. In Australia, copycat products often fail to gain significant market share. New packaging, such as multi bags, has been an essential part of stimulating sales in supermarkets where there tends to be less impulse buying, or at least where the consumption decision is transferred from the point of purchase to the home. Many of the successful new launches have been line extensions of existing brands; ‘white’ chocolate variants (Kit Kat White, Aero White), teeth whitening and medicated gum lines (Wrigley’s Extra White and Air Waves), new size formats (Kit Kat Chunky), enrobed extruded chocolate (Cadbury Flake to Twirl) and subsequent wafer addition (Twirl to Time-Out), Snickers Light. New packaging size and configuration formats have also enjoyed considerable success evidenced by sales of fun-bag (multi-bag) mini-brands Cadbury’s Favourites and Mars’ Celebrations. Mars have also been successful in sales of single bite-size mini-bars. Licensed products have enjoyed mixed success. Star Wars and Spiderman have enjoyed moderate sales. Hollywood character licensing has yet to succeed with its most recent foray executed by Show Time Foods, which went into receivership in 1999. By contrast, Nestle, following its successful collaboration with Disney in the mid-1990s has sustained its 2001 success with Willie Wonka. It would appear that to succeed in licensed products, the commitment to trade support is even more critical than normal. Successful flavour innovations include sour sugar confectionery (Warheads, Skittles Sour) and all-natural flavours (Sunrise jellies).
27

In recent years, a number of confectionery marketing companies have established, sourcing bulk products from overseas or through local contract manufacturers, repackaging them and selling them under their own brand name. Ferndale has been very successful in the pocket pack counter lines through innovative cardboard packaging and brand positioning. Other new products include the internationally awarded Yowie (Cadbury), with a similar format to Ferrero’s Kinder Surprise featuring indigenous animal plastic novelty. In spite of the importance of bringing new products to the market, failure rates are typically high, reported anywhere between 70% and 90%. Even when success is attained, there are very few modern day examples of enduring brand staying power.
7.5.6 Seasonal Variation in Demand The chocolate confectionery business has a seasonal bias towards the colder months of the year and special gift occasions such as Easter, Christmas, Mother's Day and Valentines Day. Easter is the biggest selling season with sales of A$190 million (US$108.3 m) in 2001. Australian per capita consumption of chocolate Easter products is the highest in the world. For confectionery manufacturers, the later Easter is in the year, the better for sales generally, because the weather tends to be colder. Christmas, the next best sales period, represents less than A$50 million (US$28.5 m)of annual sales in 2001. Valentines Day is a relatively new event in Australia, beginning in the late 1970’s. Valentine sales are approaching A$30 million (US$17.1 m). In the mid-1990’s, the industry collectively funded a programme to develop sales opportunity around Halloween. Retailers were reluctant to join forces with suppliers and consequently, this opportunity remains unfulfilled.
7.5.7 Consumer Value Demand for confectionery is highly price elastic. Value for money is a key part of the purchase decision. Confectionery also faces strong competition from substitutes such as corn chips and biscuits, which increases the importance of competitively pricing and positioning of product lines. Some confectionery products such as Ferrero Rocher, Lindt, Gullyan and Toblerone target specific upper-markets; however in lower volume market segments, promotion as prestige confectionery lines, makes price less important, and a more differentiating feature of a product purchase.
7.6 Industry Attractiveness In spite of the immense power of retailers in the Australian market, promotional costs fundamental to the mass market keep entry barriers moderately high. Thus the Australian confectionery industry is a moderately attractive industry in which to operate. The following sections describe the industry’s attractiveness (utilising Porters Five Forces Model).
7.6.1 New Entrants As a general rule, entry barriers and exit barriers are high. Considerable expenditure is required for purpose-specific machinery. More importantly, it can take many years to establish a confectionery brand in the Australian market. Massive sums are required for advertising and promotion in order to develop brand franchise with the Australian community. Whilst the Australian confectionery market is relatively stable and mature, it is geographically well located to the burgeoning markets of the Asia Pacific Rim. For this reason, there is a likelihood that two new entrants could enter the Australian market in the near future, as a foothold for expansion to these growth markets to the north.
28

One company, US market leader Hershey Foods, has had two forays into the Australian market, in 1987 and 1990. On both occasions they operated through local based importing agents; whilst impressive trial rates were achieved by virtue of an excellent major media campaign, ultimately Australians were unimpressed with the bitter sweet style of the popular US chocolate. Nevertheless, Hershey clearly has the resources to overcome the high entry barriers into the local market, as well as the expertise to reformulate their product to suit the Australian palate. Hershey recently announced its appointment of Network Foods, a major national distribution firm, to act as agent for the Australian market. Similarly, the acquisition of Jacob Suchard, the giant sweets confectioner in 1990 by tobacco multinational, Philip Morris International, could see this company begin local manufacturing and would be complimented by the market power of its sister subsidiary, Kraft Foods. Currently, only a small number of Suchard brands are imported into Australia (eg Toblerone, Milka and more recently, Daim). These brands have an excellent reputation for quality and are positioned at the premium end of the market.
7.6.2 Inter Firm Competition In the mature Australian confectionery market, competition is fierce between the three major producers. Maintaining market share is first priority for these manufacturers. These companies are well down the experience curve and generally have chronic over capacity in their plants.
7.6.3 Threat of Substitutes The threat of substitutes in the confectionery market is not great. Whilst a number of snack food categories have grown in recent times, this has not been at the expense of the confectionery sector, but rather reflects a general change towards increased snacking behaviour by many Australians. In the past two years, there have been a number of brand extensions from the biscuit category, eg Arnotts Tim Tams. Consumer off take of these products has fallen short of expectation. The same is true for the health bar segment; sales of health bars have declined following the impressive penetration rates of five years ago. Fruit-based bars on the other hand have grown in sales, albeit from a small base.
7.6.4 Power of Supplies Reliability of supplies is not generally a problem, but from time to time, some raw ingredients need to be imported (eg peanuts). This occurs when local crops fail or the quality of their output fails to meet mandated residue and contamination thresholds or the high specification criteria imposed by downstream confectionery users. Australia does not have a cocoa industry and therefore must import all of its raw cocoa ingredients. Historically, procurement of this essential raw ingredient has never been a problem
7.6.5 Power of Buyers With the growing reliance on supermarkets for confectionery distribution, substantial downward pricing pressure exists on confectionery. Major supermarket chains are intensely price orientated. Their preference is for products that attract high brand loyalty and turnover as measured by direct product profitability (DPP) and space demand elasticity (SDE). Products that fulfil these criteria are rewarded by the allocation of generous shelf space in high traffic and impulse locations. Brands that are not established are not generally welcome by supermarket buyers unless they meet low price criteria. This latter aspect favours the major companies by virtue of the brand equity they possess.
29

The growth of private labels by supermarket companies poses an additional threat to manufacturers of national brands. It would appear though, that private labels are not doing as well in Australia as they have done in other parts of the world, particularly the United Kingdom. Although the introduction of the private label supermarket retailer Aldi could change this.
7.7 Major Players Currently, some 85 firms are involved in confectionery production, employing 7,500 people. However, the Australian confectionery market is dominated by three major foreign-owned companies, which have a combined market share of 75%.
7.7.1 Market Leader Cadbury Schweppes Australia Limited clearly dominates Australia's confectionery market. Cadbury Schweppes Plc of the United Kingdom wholly owns the company. Cadbury commands around 36% share of the overall confectionery market. Their sales cover around half of the domestic chocolate market, the largest segment of the total confectionery market and dominate the chocolate block segment. Cadbury has a smaller market position in sugar lines, accounting for 10% of the market share, behind the sugar segment market leader Nestle (38%). With the successful launch of the Time Out chocolate bar, Trebor (1995), Yowie (1997), Breakaway in 1999 and 24/7 in 2002. Cadbury has built further on its leading position in the market. Its main chocolate manufacturing plant is in Claremont, Tasmania with several other plants in Melbourne. Its strong brand image, low cost position, extensive distribution channels, and innovation in new product development support Cadbury’s strong market position. Around 7% of Cadbury’s production is directed at exports into Asia. With the economic pressures easing through most of this region, Cadbury is well placed to further develop these markets. Cadbury Australia oversees the Asian operations of the group including its most recent plant in Beijing. The division is also responsible for its Singapore cocoa grinding factory which supplies cocoa-based raw materials for use in Australia.
7.7.2 Market Challengers Nestlé Australia Limited is the next largest company with 22% market share in the Australian confectionery industry. It is a wholly owned subsidiary of Nestlé Ltd of Switzerland. Underpinning the company's position in the market is the company's strong brand names, extensive distributions systems, heavy and consistent market spending, and the support from Nestle SA (Switzerland) in terms of branding and product development. Nestle has four confectionery factories, of which the Campbellfield factory in Melbourne is the largest. Major products include sugar and chocolate global brands such as Kit Kat, Aero and Rollo as well as local brands Allens, Fantales, Minties and Life Savers. Mars Confectionery of Australia has an overall market share of about 18% and leads the chocolate bar category with 38% share. It is a privately owned subsidiary of the US giant M&M Mars Corporation, the world’s largest confectioner. It has a manufacturing plant in Ballarat, Victoria. Mars confectionery products include Mars Bars, Snickers, Maltesers, Bounty, Twix, Skittles, M&M's and Starburst as well as the Dove range of chocolate blocks. Whilst primarily reliant on organic growth, in December 1997 Mars acquired Kenman Kandy, which at the time, added approximately A$40 million dollars worth of sales and 3% to Mars' market share.
30

7.7.3 Market Followers Jacobs Suchard (Australia) Proprietary Limited imports confectionery, its principal brands being Toblerone, Milka, Terry's and Cote D'Or. Suchard's market share fell away in 1988, when it began importing its entire confectionery range. Up until then, Red Tulip manufactured Toblerone in Australia, but this ceased when Cadbury acquired Red Tulip. Jacob Suchard is now part of Kraft General Foods (Australia) Limited, which in turn is wholly owned by Philip Morris Companies Incorporated of the United States. As a top five global player, Suchard is a sleeping giant locally; most industry commentators expect the company will eventually turn its focus to the Australian market. However, the company has stated it may in future build a plant in Australia, given the company's interest in Asia, Australia would be a suitable base from which to supply countries within the region. Snack Brands Australia Pty Ltd (formerly Dollar Sweets Holdings Limited) which specialises in savoury snacks and confectionery, is another publicly listed foreign-owned company. Dollar Sweets acquired the biscuit and confectionery manufacturer Players Group Limited in 1994 and the S Alexanders business from World’s Finest Chocolates in 1998. Also in 1998, Dollar Sweets acquired a range of brands from the divestment of Smiths Snackfood Company, giving them around 30% market share of the Australian savory snackfood market, thus evoking a name change to Snack Brands Australia Pty Ltd. Until June 2002, its primary shareholder has been Australian packaging magnate, Richard Pratt. As we wrote this report, Arnotts (owned by US firm Cambells) has acquired Snack Brands increasing its share of the salty snack foods segment from 5.8% to 31.5%. Ferrero Australasia Manufacturing Pty Ltd imports Ferrero Rocher box chocolates and the popular Kinder Surprise, Nutella, in addition to manufacturing Tic Tacs at its plant in Lithgow, New South Wales. Ferrero's products are highly successful in Australia and overseas. It is a privately owned company with its headquarters based in Italy. 1998 also saw the Swiss chocolatier, Lindt Sprungli establish its own sales and marketing office in Australia with a small number of their lines being produced locally under contract. Other significant domestic players include, Snow Confectionery which has experienced considerable growth since reformatting its sugar brands for an aggressive grocery driven sales push. Other medium sized confectionery players include, Sunrise Confectioners, Allseps, Fyna Foods, Heritage Fine Chocolates and Ernest Hillier.
7.7.4 Niche Specialists The Wrigley Company Proprietary Limited, a wholly owned subsidiary of the Wm Wrigley Jnr Company (US) maintains its dominant position in the Australian gum market through its energetic sales force combined with heavy promotional investment. Following on from its successful 1990’s campaign to boost sales via a campaign based on dental benefits, it has attracted new customers to its teeth whitening and sinus clearing gum products. Sunrise Confectionery is a third generation Australian family business, typical of the many small firms operating in the national market. In the mid 1990’s the company developed an all-naturel colours jelly product, marketing under the name of Binkas. The product was well received but was hampered by the higher price and associated trade resistance stemming from greater manufacturing costs. In 1998, the product was relaunched under the banner of All Natural Confectionery Company, packaged in distinctive white bags. An advertising campaign, unheard of in small company circles, was launched. By September 2001, Sunrise was the grocery market leader of confectionery gel segments.
31
The balance of the industry comprises a relatively large number of smaller firms which tend to be specialist producers. The latter include, Just Natural (health food confectionery), Gregory King Chocolates Pty Ltd (contract and industrial chocolate) and Prydes Sweets Pty Ltd (sugar). There are a small number of specialty chocolate producers such as Chocolatier and Haighs, producing handmade/specialty chocolates for niche markets such as hotels, airlines and sporting events.
7.7.5 Retail Producers Darrell Lea Chocolate Shop is Australia’s only true national manufacturer/retailer. A family owned business located in Sydney, generates A$58 million through 88 company owned stores, 100 franchise agencies and 250 compact agencies throughout Australia as well as through exports of licorice. Darrell Lea has two production facilities located in Sydney. Main product lines include; chocolate gift lines and licorice.
7.8 Marketing Strategies of Industry In 1970, some 15 confectionery manufacturers accounted for 75% of the market, While, today, three multi-national companies, Cadbury, Nestlé and Mars, control the same share. In the case of confectionery products, some 5,000 products are currently sold in Australia. In the largest product segment, bars, the top ten selling brands account for less than 50% of retail sales value. Whilst it is true that the major companies, project a degree of corporate positioning, the major marketing effort is directed at the host of individual brands they all possess. Each brand is positioned differently along dimensions valued by consumers (eg value vs health, light vs heavy). Both Nestlé and Cadbury compete head to head in all chocolate and sugar segments. Mars on the other hand, is ostensibly confined to the bar and block segment. In a mature market, the major confectionery players are keen to hold on to (or gain) market share whilst stabilising return on investment. With this emphasis, the industry is intensely competitive. All three majors have low cost structures. Consequently, price promotions directed at consumers invariably invite speedy retaliation by all the majors, leading to a prolonged and damaging engagement. Fortunately, these sales promotion spirals rarely occur - a sign of mutual respect for the retaliation capability of fellow competitors. Consumer promotions mostly take the form of added value, such as bonus size increases or competitions. There is a growing trend to target more promotional funds to 'below the line' activities with the retailer. This trend is catalysed by the industry's growing reliance on grocery channels for sales. Co-operative advertising, listing fees and in-store promotions are integral to doing business with supermarket chains. Advertising, particularly television continues to be heavily utilised by the industry. Total industry advertising spend is around A$110million. Messages concerning confectionery products are simple, usually oriented around hedonic appeals. For this reason as well as the wide target market base, most advertising is directed through television. This medium permits the maximum opportunity to create the type of imagery and appeal that underlies product differentiation in this category.
32

7.9 Imports In 2001, total confectionery imports accounted for around A$205 million (US$116.9 m). This translates to a retail sales value of around A$420 million (US$239.4 m), some 17% of the national market.
Confectionery Imports 2001 A$mill FOB
-20406080
100120
Gum Sugarconfec
Chocolate
A$
mill
ion
Source: Australian Bureau of Statistics (ABS)
Australian Confectionery International Trade1991 - 2001
0
20
40
60
80
100
120
140
160
1991 1992 1993 1994 1995 1996 1997 1998 1999 2000 2001
$A m
ill
ImportsGumSugarChocExportsGumSugarChoc
Source: ABS New Zealand is the largest import source for chocolate mostly comprising products produced by Cadbury’s sister facility in Dunedin. Likewise, Ferrero accounts for most of the Italian sourced chocolate (only producing sugar lines in Australia) as does Lindt Sprungli from its parent in Switzerland. Overseas sources of sugar confectionery and gum are more diverse than for chocolate. Spain has become a significant source almost entirely due to Chupa Chups (mostly imported by Cadbury but novelties handled by JNH). US products include Jelly Belly (JNH).
33

CHOCOLATE - Imports by Value 2001
30%
14%13%
12%
11%
20%New Zealand UKBelg-LuxItaly Switzerland Other
SUGAR & GUM - Imports by Value 2001
11%
8%
14%
14%10%
43%
USAUKSpain New Zealand China Other
Source: ABS For classification purposes, five types of importers operate in the Australian market:
1. Domicile manufacturers importing from overseas parent/related subsidiaries. 2. Supermarket direct imports. 3. Specialised importing agents of international brands. 4. Sales/marketing offices of overseas producers. 5. Small niche/bulk import agents.
Contact details of the importers in the following discussion are provided at the end of this report.
7.9.1 Domicile Manufacturers Importing from Overseas Subsidiaries Whilst the major players, Cadbury, Nestle and Mars possess extensive production facilities in Australia, these firms also import from other locations within their global operations. This is often done when new products are tested in the local market. Additionally, Cadbury and Nestle both have factories in New Zealand and significant product interchange is evident.
7.9.2 Supermarket Direct Imports National grocery buyers regularly attend international confectionery fairs, particularly ISM (Cologne) and All Candy (Chicago). These buyers are particularly interested in sourcing new, innovative lines preferably on an exclusive basis. They also source low cost bulk product, particularly sugar confectionery, for house brand bag lines. The major buyers are Coles (Coles Supermarkets, BiLo, Target, Kmart), Woolworths (Woolworths Supermarkets, Big W). In addition, other smaller grocery chains account for significant imports, notably PriceLine.
7.9.3 Specialised Importing Agents of International Brands These companies have negotiated exclusive sales agency agreements with international brand owners and have the capability to both market and distribute these products. They operate nationally in the grocery, C Store and route channels. The major players are Stuart Alexanders, Network Foods and JNH.
34

7.9.3.1 Stuart Alexander Stuart Alexander is a privately owned, wholly Australian company based in Sydney. The Company has over 170 employees with more than half involved in sales and customer service. Although some sales representatives sell a multi-product range, others sell a mainly specialist selection. It is estimated Stuart Alexander's own representatives call on over 35,000 customers, at varying intervals depending on customer needs and geographic location. Agencies/Brands:
• Perfetti Van Melle - Mentos, Airheads, Peco, Meller • Chocolaterie Guylian - Guylian Chocolates • Frisk - Mints • Storck - Werther's Original and Campino • Stimorol
7.9.3.2 Network Foods Network Foods is owned by Malayan United Industries group and having recently formed an alliance with the major independent wholesale group The Distributors, covers around 70% of the route channel. Agencies/Brands:
• Lofthouse of Fleetwood, UK - Fisherman's Friend • Hershey Chocolates (Hershey International, USA) • Chupa Chups SA - SMINT • The Foreign Candy Company, US - Mega Warheads • Troll, USA • Beacon Sweets and Chocolates, South Africa - Fizzer and Beacon Liquorice Allsorts • Ampac Foods New Zealand - V Pop • Zeta Espacial, Spain - Pop Rocks • Leaf, Ireland - novelty bubble gums • Network Foods International, Malaysia - Crispy
7.9.3.3 JNH Australia Australian owned company operating across five divisions - toys, confectionery, nursery, homewares and footwear. JNH is the largest company in licensing, including Winnie the Pooh, Thomas and Friends, Digimon, Power Ranges and Blues Clues. Agencies/Brands:
• Crazy Planet, Jelly Belly, Cavendish and Harvey, Anthon Berg, Cap Candy. • Mega Warheads Candy, Chupa Chups Novelty, Pez, Almond Roca, • M&M Novelty Confectionery • Zed Gum
7.9.3.4 Confectionery Link Australian owned importer of seasonal and non-seasonal confectionery to all major retailers and a national network of wholesalers (plus exports to New Zealand). Agencies/Brands:
• Arcor sugar confectionery, Walcor chocolate novelties, Palmer seasonal novelties, Kidstar novelties, Nutrexpa (hip pocket packs).
35

7.9.3.5 Trialia Foods Melbourne based Australian owned chocolate importer. Agencies/Brands:
• Schmerling (Switzerland)
7.9.4 Sales/Marketing Offices of Overseas Producers These company owned subsidiaries source from their overseas parent and are responsible for marketing and sales. They deal direct with grocery buyers and utilise independent wholesalers for route distribution. They do not employ a significant sales field force outside of key account servicing. The major companies in this category are Kraft Foods (Jacob Suchard), Ferrero Australia (chocolate imports only – Tic Tacs are produced locally) and Lindt Sprungli
7.9.5 Small Niche/Bulk Import Agents These second tier importers often source overseas product on spec, mainly for re-bagging to route retailers. In some cases, they have agencies for brands often from developing countries (Asia, Central and Latin America). Candy Brokers Pty Ltd sources confectionery from Spain, United Kingdom, Thailand, Indonesia, Brazil, Malaysia, Pakistan, Mexico, Taiwan and China. Karams Confectionery supplies imported ‘re-bagged’ lines in various pack sizes and weights - some 100 lines of sweets as well as Easter and Christmas novelties.
36

8 Production Over the past decade, average annual production tonnage for sugar confectionery has increased 5% and 3% for chocolate. In 2001, sugar tonnage was 86,400 mT and chocolate, 126,000 mT of which exports accounted for 27,200 mT and 22,700 mT respectively. In terms of value of production, the chocolate segment accounts for around 58% of industry production and combined sugar and gum confectionery comprises 42% of the industry value of production.
Australian Confectionery Market - Tonnage1991 - 2001
0
50
100
150
200
250
1991 1992 1993 1994 1995 1996 1997 1998 1999 2000 2001
mT
'000
Sugar, gumChocolate
Source: ABS and CMA
Industry turnover depends on the volume of production and average unit values. During the Asian economic crisis, export growth was constrained. The recovery has allowed exports to expand modestly throughout the late 1990’s. Turnover (ex-factory prices) is forecast to increase from A$1,352 million (US$770.6 m) in 2001 to $1,602 million (US$913.1 m) in 2005. This is an average increase of 3.5 % annually. Revenue from chocolate sales is expected to increase faster than revenue from sugar confectionery sales. Whilst confectionery production is carried out in every major centre of Australia, the industry is concentrated mainly in the southern state of Victoria. The majority of Cadbury and Nestle operations is in Victoria as is all Mars’ confectionery production. Cadbury also has a large chocolate block facility in Claremont, Tasmania. Australia is a good place from which to manufacture confectionery owing to its abundant local supply of all ingredients (except cocoa) at competitive price and required quality, the availability of a skilled labour force, excellent transport infrastructure and diverse presence of essential support industries.
37

8.1 Production Trends and Outlook The volume of production is expected to increase with fairly steady growth. Export conditions are likely to be difficult in the short to medium term, restricting production. However, this assumes that Australian companies cannot create niche markets or through increased competitiveness, enter the European or North American markets. If this occurs, production is likely to increase considerably faster. Nonetheless, competition from imported New Zealand confectionery (especially chocolate products) is likely to increase. Thus, production is forecast to increase at an average rate of 2.4% per annum over the five years to 2007. Asian per capita consumption of sugar remains considerably below the level of Western countries and the health impact of these products is much less of an issue. In addition, Australia is closer to these markets than most potential competitors and has gained some competitive advantage through currency realignments. Nonetheless, Australian exports of confectionery are price elastic and any further appreciation of the Australian dollar against Asian currencies is expected to cause exports to decline. In the medium to long term, the forecast depreciation of the Australian dollar against Asian currencies along with higher discretionary spending in that region, is expected to boost export sales considerably. Australian confectionery manufacturers are well located to benefit from the recent opening up of Japan to confectionery imports. In order to penetrate this market, producers will need to modify some existing products to conform to local tastes. Exports might also be encouraged by the development of a line of confectionery that is seen as uniquely Australian. Such confectionery might be based on Australian fruit and nuts. For example, Koala King exports 95% of its production of chocolate-coated fruit and nuts, mainly to Japan. As part of the multilateral trade negotiations, overseas producers are exerting pressure for a reduction or discontinuation of manufacturing subsidies. If this occurred prior to any reduction in agricultural support, the competitive position of European manufacturers would deteriorate. This would benefit Australian producers both on the domestic market and in gaining export sales. Overall, industry sales are forecast to grow quite strongly. With the likelihood that cocoa prices will increase and the likely introduction of new higher value lines, real confectionery prices are expected to increase during the next five years. With respect to profitability, the industry will be significantly affected by changes in input costs, including the cost of raw materials and advertising expenditure. It is anticipated that while labour costs will increase, to a large extent this will be offset by ongoing productivity gains. Competitive pressure seems likely to produce further rationalisation within the industry aimed at modernisation, reduced duplication and economies of scale. In addition, the industry will move to higher margin products, chocolate bars are particularly important in this respect. Basically, the profitability of the confectionery industry over the next five years will depend on turnover, input costs and increased efficiency. A strong increase in profits is unlikely but there may be some modest growth.
38

9 Consumption Domestic demand for confectionery has been increasing by 5% annually (after allowing for inflation) since the early 1990’s, now accounting for around A$2.53 billion in retail sales, in volume terms sugar tonnage was 86,400 mT and chocolate, 126,000 mT. Per capita consumption of confectionery increased from around 9.5 kg to 10.1kg in the same period, with chocolate growing slightly ahead of sugar confectionery. Australians traditionally tend to consume more chocolate products than sugar products, compared with other countries. In 2001, Australians consumed 4kg of sugar products, and 6.1kg of chocolate, which on both counts is lower than in many other industrialised countries. Per capita consumption figures tend to vary from year to year, either due to climatic variations or economic conditions as seen from the chart below.
Confectionery Consumption - Australia1952 - 01
0
2
4
6
8
10
12
52 56 60 64 68 72 76 80 84 88 92 96 00
Kg p
er h
ead
ChocolateSugarTotal
Source: ABS
Australia is in the lower spectrum of global per capita confectionery consumption for industrialised nations. The Europeans and British are among the world's largest consumers of confectionery. On a per capita basis, Germany has the highest confectionery consumption with 14.9kg, followed by Switzerland 12.7kg, Belgium 12.5kg and Russia 11.9kg. Other countries with per capita consumption above 12kg include Norway, Ireland, United Kingdom and Denmark. This is around 3-4 kilograms per year more than Australia or the United States. In contrast, Japan has a very low level of confectionery consumption at 3.58kg per capita. Japan's chocolate and sugar consumption are now about equal, compared to 1994 when sugar consumption was dominant. Confectionery accounts for about 43% of the Australian snack food market, lower than in the US (50%), and the UK (60%). Confectionery manufacturers consider that these sort of low comparative consumption trends present them with an opportunity for growing markets.
39

9.1 Competitors in the Snack Category Australians are the fourth largest consumers of overall processed snacking foods behind the United States, Britain and Ireland. Australian household-spend on average A$800 per annum on snack foods, or 327 packets per annum, the equivalent of two fully loaded shopping trolleys. However, compared to overseas consumers, Australians eat a wider variety of snack goods, including confectionery, biscuits, health bars, potato chips and other flavoured snack foods. Compared with other consumers, Australians tend to use snacks as meal substitutes, with around one third of all snacks eaten, to replace a main meal.
Australian Snack MarketRelative Category Share
Chocolate23%
Sugar Confec20%
Savoury15%
Biscuits25%
Ice-cream17%
Australian Snack Market2001
0
500
1,000
1,500
2,000
2,500
3,000
Salty Snacks Nutritious Confectionery Biscuits Icecream
A$m
illio
n
Source: Retail World
9.2 Consumer Behaviour In Australia, nine out of ten people consume confectionery regularly, 80% of which consume from both chocolate and sugar confectionery categories. Most consumers enjoy at least 2 or 3 different confectionery brands per week with heavy chocolate consumers eating on average 7 different brands per week. Generally, females purchase more chocolate than sugar confectionery, than males. This is not surprising considering that 8 out of 10 grocery shoppers are female with most being the primary purchaser for the household. With respect to consumption, a gender bias is observable; males tend to be heavier confectionery consumers as children, but are overtaken by females in early adulthood.
Confectionery Consumption - Age & Sex
0
2
4
6
8
10
12
14
16
18
20
2-3 4-7 8-11 12-15 16-18 19-24 25-44 45-64 65 andover
ave
gram
s pe
r day
Chocolate Male FemaleSugar Confec Male Female
N ti l N t iti S (ABS bli h d 1999)National Nutrition Survey (ABS published 1999)
40

Impulse sales continue to dominate the confectionery purchase decision. Over 70% of confectionery is bought on impulse with single chocolate bars and children’s lines having the highest incidence of self-consumption - over 40% of these product purchases are consumed immediately. Consumers tend to consume different types of confectionery at different times during the day. Chocolate bars are more likely to be consumed in the afternoon, chocolate blocks in the evening, sugar confectionery throughout the day, with travelling a peak occasion. The relaxation of trading hours has impacted on the shopping behaviour. Both Sydney and Melbourne now permit 7 day – 24 hour shopping and the major supermarket chains have adopted these hours across many of their stores. Consumers are increasingly looking for ‘one-stop’ shopping convenience. Some 30% of shoppers now consider they do not have any particular shopping day. The rapid growth of Sunday shopping at the expense of Thursday and Friday shopping is evidence of this.
9.3 Demand Determinants The following factors influence the domestic demand for confectionery.
9.3.1 Retail Shift Purchases of confectionery are discretionary and hence are fairly responsive to both price and income changes. As grocery expands at the expense of small stores, impulse opportunities are reduced. The grocery shopper is often not the end-consumer of confectionery products. In 72% of cases, it is the female of the household, often the mother and logically, this can be a barrier to impulse confectionery purchase. To some extent, this loss of impulse opportunities has been offset by the increasing frequency of household shopping some 2.4 grocery shops per week.
9.3.2 Competing Categories Consumers face an increasing range of products (food and other) competing for the discretionary spend. These include health foods, new snack types (fruit chips, mini-meals) and mini-pack biscuits.
9.3.3 Health and Nutrition. Basically, the industry's products are perceived by many to be unhealthy. Being high in calories, confectionery is shunned not only by dieters, but also by those concerned about the link between obesity and heart disease. Renewed concern about dental health has also discouraged consumption. A recent study commissioned in New Zealand by the Confectionery Manufacturers of Australasia (but should equally apply in Australia) indicated that health concerns remained the principal reason barrier to increased consumption (80% of all respondents) with price and taste issues small by comparison. In the wake of recent publicity in the USA to introduce a so-called ‘fat tax’, a number of local food activists have climbed on to this band wagon. Whilst a new tax is not likely to gather much currency with the present government, a number of industry marketers are concerned that further restrictions on advertising to children may be contemplated. The industry is currently dedicating considerable resources to developing a communications programme designed to restore balance and commonsense to this growing debate.
9.3.4 Age and Sex Sugar confectionery consumption peaks at around 8-11 years of age with boys consuming more than girls. With age, sugar confectionery is displaced by a preference to chocolate product, again with boys consuming more than girls in the peak 16-18 year age group. Chocolate consumption drops off markedly towards the mid-20s.
41
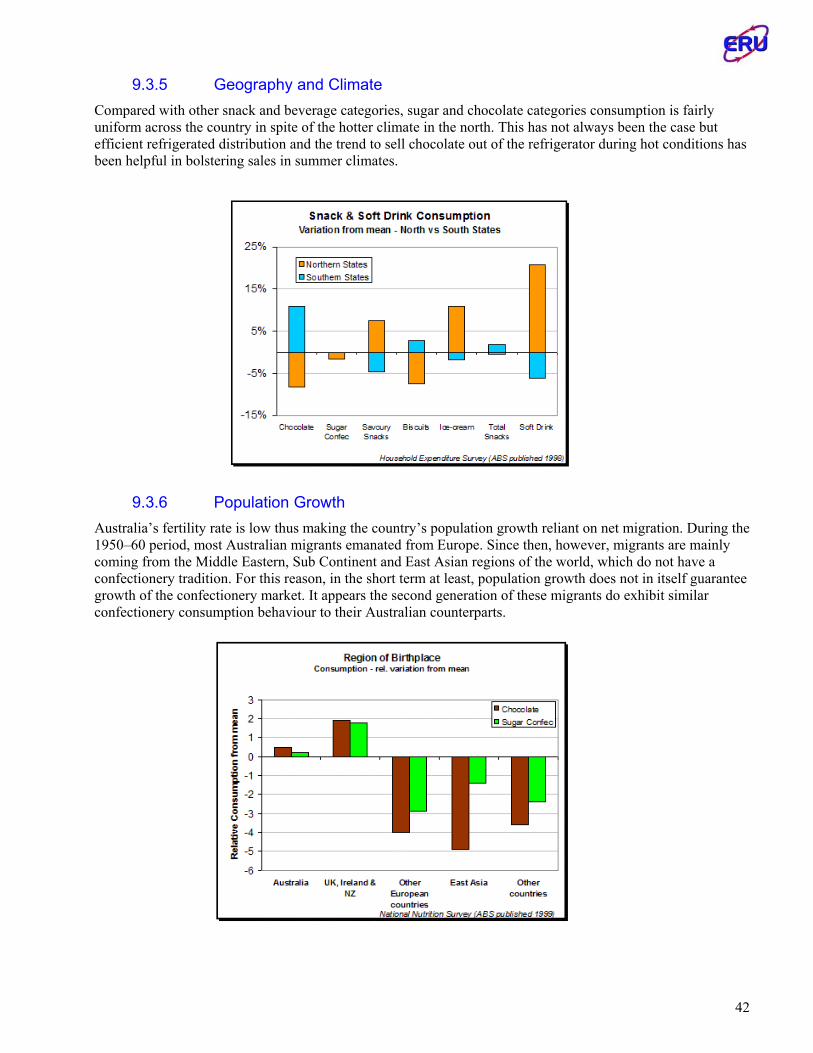
9.3.5 Geography and Climate Compared with other snack and beverage categories, sugar and chocolate categories consumption is fairly uniform across the country in spite of the hotter climate in the north. This has not always been the case but efficient refrigerated distribution and the trend to sell chocolate out of the refrigerator during hot conditions has been helpful in bolstering sales in summer climates.
9.3.6 Population Growth Australia’s fertility rate is low thus making the country’s population growth reliant on net migration. During the 1950–60 period, most Australian migrants emanated from Europe. Since then, however, migrants are mainly coming from the Middle Eastern, Sub Continent and East Asian regions of the world, which do not have a confectionery tradition. For this reason, in the short term at least, population growth does not in itself guarantee growth of the confectionery market. It appears the second generation of these migrants do exhibit similar confectionery consumption behaviour to their Australian counterparts.
42

10 Distribution The distribution network for confectionery is one of the widest in Australia. The major retail venues for purchasing confectionery are: supermarkets, milk bars, convenience stores, gas stations, department stores, specialty confectionery stores and fast food outlets. Local manufacturers of confectionery in Australia usually deal directly with large customers from supermarkets, convenience stores, gas stations and department stores. Smaller customers are required to purchase though a variety of wholesalers and distributors. Foreign manufacturers usually appoint an import agent who distributes their product in a similar manner to local manufacturers, although they usually supply specialty stores direct, as this is a large avenue for sales of imports. Two broad distribution channels exist in the Australian confectionery market, grocery and route. The diagram below illustrates the flow of confectionery products between major producers, distributors and retail outlets.
Domestic Manufacturer
Wholesaler
Corner StoreSupermarketsConvenience
Store
Import Agent
Other StoresDepartment stores Gas Station
Distributor
Local Presence
Confectionery Distribution Network
Domestic Manufacturer
Wholesaler
Corner StoreSupermarketsConvenience
Store
Import Agent
Other StoresDepartment stores Gas Station
Distributor
Local Presence
Domestic Manufacturer
Domestic Manufacturer
WholesalerWholesaler
Corner StoreCorner StoreSupermarketsSupermarketsConvenience
StoreConvenience
Store
Import AgentImport Agent
Other StoresOther StoresDepartment stores
Department stores Gas StationGas Station
DistributorDistributor
Local PresenceLocal Presence
Confectionery Distribution Network
Unlike other high impulse sales markets, such as ice-cream, soft-drinks and biscuits, confectionery has a more balanced split between grocery (supermarket, mass merchandise) with 61% of retail sales and traditional distribution (convenience and oil-convenience, independent small grocers) with 39%.
Channel Share Confectionery Sales A$
61 63 59
31 27 32
8 10 9
0
20
40
60
80
100
120
All Confec Chocolate Sugar/gum
ConvenienceRouteGrocery
Source Retail World
43

10.1 Grocery Channel Some 35% of confectionery sales in 1980 were sold through the grocery channel. Today, this figure is 61%. The Australian grocery sector is highly concentrated with two supermarket chains accounting for some three-quarters of national grocery confectionery sales. Faced with increasing power of the grocery channel, small and medium size confectionery suppliers are more vulnerable in their trade negotiations. This power imbalance is an even greater issue where suppliers do not posses strong national brands which attract consumer pull. These supermarket chains compete fiercely on price and consequently, manufactures have endured substantial erosion in margins as their distribution mix has shifted in favour of grocery. In turn, this decline in profitability has led to serious constraints in the pursuit of innovation through research and development. Confectionery distribution to grocery accounts is direct with product being dispatched from the manufacturers warehouse to the retailer’s distribution centre (DC). All major retailers have DC’s in each capital city. Transport times are coordinated with the retailer sometimes penalising the supplier if slotting times are missed. Payment is dictated by the trading terms, but is commonly 30 days after dispatch. Shorter payment terms can be achieved if discounts are given. The past five years has seen the end of state buying functions with the chain’s national office dominant in the purchase decision. It is expected that the supplier will present regular updates on the marketing programme. Sales promotions are measured through purchase of scan data (on sold by the retailers to AC Nielson). This data is very specific with the ability to measure SKU off take per store if required. Grocery retailers demand various fees from the supplier, particularly in the form of co-operative promotional funds. The intense concentration of the grocery chains imparts considerable power to them in making these demands.
10.2 Route Distribution From 1998 to 2001, the traditional sector has grown at a slightly higher rate than grocery (supermarkets) principally because of the growth of convenience stores. The number of convenience store outlets has increased by an impressive 30%, over the past two years, mainly through retro-fitting of petrol outlets. By contrast, the number of small family owned corner grocers continued to decline in number, largely as a consequence of both the high growth in the convenience/oil-convenience sector outlets and relaxation of trading hours in the supermarket sector over the past few years. Recent legislative changes now permit supermarkets in the most populous centres of Australia to trade 24 hours a day, seven days a week.
10.2.1 C Stores Up until recently, the independent route distributor has solely supplied the growing convenience sector. An emerging trend is the move of some convenience chains to mirror grocery distribution. In 1998, Shell embarked on a ‘cross-dock’ arrangement with major suppliers. This has enabled them to reduce the number of lines to around 40 stock keeping units (SKU’s) almost entirely of national brands. This move has delivered improved profitability to the Shell chain and has been eagerly watched by other C Store operators, particularly in the Oil sector. If ‘cross docking’ extends to other convenience chains, independent route distributors will come under even greater pressure. Already, this pressure has been too much for some. In the late 1990’s, a number of liquidations occurred. In this atmosphere, suppliers are becoming wary of financial exposure to independent distributors.
44
Even if other C Store chains retain third party distribution, it is likely that the banner supermarket wholesaler, Metcash, will gain the business at the expense of the independent wholesale sector. Recently, Metcash announced it had won distribution rights to Mobil Quix as well as a significant slice of Australia’s largest C Store operator, 7 Eleven. Indeed, their rate of growth was responsible for forcing out the only other significant banner wholesaler, Australian Independent Wholesalers (AIW) from the market in March 2002. With its inherent efficiencies derived largely from critical mass and hi-tech logistical systems, Metcash is almost certain to steal further business from the independent sector.
10.3 Independent Wholesalers Following a decade of mergers and collaborations, independent wholesalers in most cases are aligned to one of two trade groups The Distributors accounting for around 60% of route and National Confectionery Wholesalers (NCW) with 32%. These wholesale trade groups negotiate terms with suppliers on behalf of their members. Both have full national coverage and for the most part, their respective members have uniform systems management and IT. Even so, an accurate data information source for the route trade does not yet exist on a level that is available in the grocery sector. Consequently, suppliers are less enthusiastic about route promotions owing to the difficulty of timely measurement and control. Typically, national brand owners provide a 9% margin along with a 4% volume rebate to independent wholesalers. Smaller suppliers with less well-known brands are required to offer up to 28% margin. In turn, the wholesalers offer retailer inducements. In recent years, independents, particularly in the hotly contested major metropolitan areas, have forgone a significant share of the manufacturers margin in order to win business. It is not unusual for independents to offer 10-12% on goods, leaving a meagre margin to operate their warehouse and fleet. Where once, these independents were the lifeblood of the suppliers selling force, they have for the most part, become simple order takers. As a result, route suppliers are required to maintain their own field sales force to ensure that in-store merchandising objectives are achieved. Suppliers are reluctant to offer more margin to independents believing that extra monies will be squandered on retail discounts with no appreciable lift in sales volume.
45

11 Trade
11.1 Confectionery Retail Channels Confectionery is sold through two broad channels grocery and route (the latter sometimes referred to as ‘traditional’ or ‘impulse’). Over recent years, more confectionery is being sold through grocery at the expense of route currently 61% versus 39% and this trend is continuing unabated. This channel sales mix is a complete reversal from the situation 15 years ago (se industry profile). The chart below highlights that gum and chocolate bar sales are the confectionery mainstay of the route trade whilst the grocery channel dominates gift boxes and seasonal items.
Confectionery Split - Grocery vs Route3-year trends
58%
62%
68%
43%
85%
60%
95%
53%
50%
59%
62%
69%
43%
87%
58%
95%
56%
50%
61%
63%
71%
43%
87%
58%
95%
59%
50%
0% 50% 100%
TOT AL CONFECTIONERY
TOTAL CHOCOLATE
choc blocks
choc bars
choc assortments/gift
choc childrens
SEASONAL
TOTAL SUGAR
TOTAL GUM
2001 Grocery
2000 Grocery
1999 Grocery
Source: CMA
11.2 Confectionery Retail Trends Total retail confectionery sales are growing at around 5% annually, with 2001 sales of A$2.53 billion (US$1.4 bn). Chewing and bubble gum sales have experienced marked growth (20% annually) led largely by the sugar free and functional formats (teeth whitening, sinus clearing). These figures do not reflect the impressive performance of Cadbury’s 24/7 product released in March 2002 which could be expected to further grow the gum market at the expense of Wrigleys, which in 2001 had 97% share of the gum market and other counter mint lines. The chart below contains a breakdown of retail sales in confectionery segments over the past three years.
Total Retail Sales (A$'000) 1999 2000 2001 Average Annual Growth
Total Chocolate 1,353 1,380 1,490 5%
Chocolate Blocks 348 350 405 8% Chocolate Bars 563 598 636 6% Chocolate Boxed 157 160 174 5% Chocolate Children’s 123 106 100 -10% Chocolate Seasonal 162 165 175 4%
Sugar Confectionery 802 808 838 2% Gum 140 165 201 20% Total Confectionery 2,295 2,353 2,529 5%
Source: CMA
46

The decline in children’s chocolate novelties can almost be singularly accounted to the decline in sales of Cadbury’s Yowie range. This innovative product concept, launched with great success in 1996, appears to have hit its peak in 1998 and is now declining markedly. Sugar confectionery is growing at less than half the rate of its chocolate counterparts. In part, this could be attributable to the shift in promotional attention by the market leader in sugar, Nestle, as it strives to regain lost share in the chocolate segment. In its wake, a number of smaller players, notably Ferndale (pocket packs) and Sunrise (all naturel flavoured jellies) have made impressive inroads. Chocolate products account for nearly 60% of confectionery sales with blocks and bars being the best performers (see table). Seasonal sales are important to the confectionery market, accounting for A$175 million of which around A$140 million is Easter moulded chocolate eggs and bunnies.
Total Confectionery Sales - Retail A$'0003-year trend
1,353 1,380 1,490
802 808838
140 165201
-
500
1,000
1,500
2,000
2,500
3,000
1999 2000 2001
GUM
SUGAR
CHOCOLATE
Source: CMA
11.3 The Australian Grocery Sector
11.3.1 Main Players The grocery sector is very highly concentrated and this concentration has been further exacerbated in late 2001 with the exit of the number three supermarket chain, Franklins, from the Australian market. This development leaves the Big two, Coles Supermarkets (a division of Australia’s largest retailer Coles Myers Limited) and Woolworths (like Coles, wholly Australian owned, also trades as Safeway) with 70% of the national grocery retail market. Franklins, owned by the Hong Kong based Dairy Farm International, enjoyed considerable success in the 1980’s as a low cost dry grocery operation with its highly popular “No Frills” private label. In the early 1990’s, it followed its two larger competitors into the expanding fresh food offer. It failed to differentiate its offer and lacking the same scale as Coles and Woolworths, became progressively uncompetitive. In 2001, a decision was taken sell the group with the major segments going to independents, Woolworths, Foodland (West Australia), Pick ‘n Pay (South African T/As InterFrank) and Coles.
47

This development has been considered a lifeline to the independents that have continued to lose share to the big two. The independents are primarily supplied by the South African based Metcash who acquired and re-badged Davids Holdings in the mid 1990’s. Metcash supplies its own banner distribution groups, Campbells Cash & Carry (36 branches and 4 C Store distribution branches) and IGA (formerly Independent Grocers of Australia and includes 1,110 stores nationwide). The main competitor to Metcash distribution to banner independents was the Woolworths subsidiary Australian Independent Wholesalers (AIW). Suffering ongoing losses, AIW’s parent finally wound up its wholesale arm in March 2002. Early in 2001, German based Aldi Supermarkets entered the Australian market and by year’s end, had established 26 stores in Sydney. Unofficially, they are reported to have achieved 4% market share within their territory. This success has been based on the appeal of its low cost – private label dominated format. By mid 2002, Aldi will have commenced its roll-out of stores in Victoria, the nation’s second most populous state. They have already acquired a 45,000 m2 distribution centre in Melbourne (twice the size of their Sydney DC) suggesting a very aggressive penetration strategy for that market. The chart below indicates the main grocery shares in Australia at October 2001. With the demise of Franklin’s, Woolworths market share is expected to exceed 40% of the national market with Coles achieving 30%.
National Grocery Value Shares
35.9
26.6
12.9
13.3
5.3
3.9
2.1
37.1
27.4
11.7
12.2
5.7
3.8
2.2
38.3
28.1
11.8
9.9
6.2
3.7
2.1
0 10 20 30 40 5
WOOLWORTHS
COLES
METCASH + CAMBELLS
FRANKLINS
BI-LO
FAL (inclu ACTION)
Other
% Value - All Grocery
Y/E 28/10/2001
Y/E 29/10/2000
Y/E 31/10/1999
0
Source: Retail World Department stores and variety (mass merchandisers) are included in the grocery confectionery sales figures. These outlets represent a small share of overall grocery sales although increasingly, variety stores, particularly Target, are becoming more committed to seasonal sales, particularly Easter. Coles Myer Limited, the parent of number two grocer, Coles Supermarket, is dominant in both variety (Target and K Mart) as well as department stores (Myer, Grace Brothers). However, separate national buyers exist for each entity.
48

Grocery Retail Sales (A$'000) 1999 2000 2001 Average Annual Growth
Total Chocolate 838 857 935 6%
Chocolate Blocks 236 242 286 10% Chocolate Bars 241 256 274 7% Chocolate Boxed 133 139 151 7% Chocolate Children’s 73 62 58 -11% Chocolate Seasonal 154 156 166 4%
Sugar Confectionery 423 455 495 8% Gum 70 83 100 19% Total Confectionery 1,331 1,395 1,531 7% Source: CMA
Confectionery is usually displayed in one aisle (one side for some and larger supermarkets utilize both sides of the aisles) and at the checkout bar lines are also displayed. Confectionery is usually displayed on shelving for bars, blocks and boxed chocolate with sugar confectionery (bagged) on waterfall racks. There is also often bulk confectionery dispensers which dispense a variety of bulk sugar and chocolate confectionery. Soft drink or chips and other snack food will often be displayed opposite or in the next aisle. Most supermarkets have large refrigerated warehouses from which they usually deliver daily, or every other day, to outlets that will usually carry enough products to last 2-4 days.
11.3.2 Business Relationships Unlike the US market that leans more to ‘every-day pricing’ in grocery, Australia tends to follow the European approach of heavy promotion. Over the last 15 years, the retail chains have earned more and more of their gross margin directly off suppliers. The net result is the margins earned at store level are about 14% - very low by world standards. Confectionery sales account for about 5% of turnover of grocery stores. Overall Australian chains are no different to that elsewhere in the world. They need about 24-25% gross margin to survive. This means that 11% is earned via co-op charges, investment buying, new line fees and deferred rebates. This also means that supermarket buyers have to pay a great deal of attention to this part of the margin, and as a result many decisions have been taken to earn co-op promotion fees with secondary thought to the consumer. It is estimated that the total trade spend is about A$4 billion (US$2.3 bn), and averages 15% of supplier turnover. On a spend per capita basis it is A$205 p.a (US$117). Co-op charges alone average about 6% at present. In recent years investment buying has been a big issue. In the last year attempts have been made by the chains to earn the same profits without the need to buy the stock. This has been done by negotiating new trading terms and promising not to investment buy. Price promotions are endemic. Just to use up the generated co-op charges requires a very active promotional program. Until recently every product was expected to be promoted. Some buyers still think like that. On average over 70% of all volumes are sold into the chains on a discount. This may decline rapidly if the level of investment buying drops. The amount sold out to the consumer would be far less, maybe 25% to 30%. Promotional charges are very high, and it is very rare for a promotion to increase contribution over the value of the sales during the same period without a promotion.
49

Category Management is applied in both Woolworths and Coles. However in spite of all the reorganisation, the chains really have too much power for there to be many genuine partnerships. Efficient Consumer Response (ECR) will no doubt be applied successfully in those areas where genuine partnerships are not required. But with the current power imbalance it is hard to see genuine partnerships developing except among a very small number of parties. Companies like Coca Cola naturally have a lot of clout, particularly since Pepsi is not a significant player in Australia, so they can partner. Even companies like Heinz and Kraft might not have enough market clout to have a really balanced partnership - certainly nothing like the market power these companies have elsewhere in the world. In stark contrast to the US where extensive networks of brokers are utilised to negotiate trading terms with key accounts, the preference of Australian grocery is to deal directly with the supplier (manufacturer or importer). National confectionery buyers regularly attend the major trade shows around the world (ISM, All Candy etc) and are accustomed to direct importing either in bulk for private label, or finished branded product.
11.4 The Australian Route Trade The route trade accounts for about A$4 billion in retail sales with confectionery a considerable contributor at 40% gross margin and 8% of sales. As in most industrialised countries, the Australian route trade has become more diversified over the past quarter of a century. Once dominated by small family owned corner stores (Ma and Pa stores), this group has been eroded by the emergence of gas and convenience outlets which offer a greater and more competitive proposition to consumers over extended hours and convenient access. Almost 1,000 corner stores disappeared from the market between 1998 and 2001 when there were nearly 8,000 and this decline is forecast to continue at 2% per year. Conversely, Convenience stores grew by 30% over the same period led by international operator 7 Eleven (see chart below).
C Store numbers - National
0 50 100 150 200 250 300
7 Eleven
Caltex Star Mart
BP Express
Mobil Quix
Shell Select
Liberty Oil
City Conv. Stores
Advance
AA Petroleum
Foodies
Night Owl
Others
Source: Retail World Convenience stores (C-stores) in Australia are defined as retail businesses with a primary emphasis placed on providing consumers with a conveniently located shop to allow for quick purchases. Their typical trading area is between 50m2 and 300m2, typically have 24 hour trading hours and convenient off street parking. At the middle of 2001 there were 1,200 of these stores nationally, however 70% of these stores are in New South Wales and Victoria.
50

Convenience stores usually stock a range of products including car care, confectionery, snack foods, telephone cards and various major grocery lines. Confectionery display in these outlets is usually in an aisle arrangement with shelving and hanging space, as well as various stands and hanging space at the cashier and free standing about the store. Ma and Pa stores stock a range of products like cigarettes, confectionery, soft drinks, ice cream and a limited range of snack foods and grocery products, while some even serve fast food products. Displays and positioning of confectionery in these outlets are usually on or very near the counter and many offer pick-and-mix selections. Other route channels are also growing, notably vending (which is still under utilised in Australia), cinema and fundraising. A number of companies have also enjoyed some success exploiting non-traditional sales opportunities (hardware stores, hotel liquor outlets, event ‘presence’ sales and on-line bulk sales). In early 2002, Cadbury launched a ‘cash van’ initiative designed to forage small sales orders from offices, dry cleaners and other small but favourable impulse locations. The experiment proved too costly for the order sizes gained and has now been scrapped.
Route Trade Retail Sales (A$'000) 1999 2000 2001 Average Annual Growth
Total Chocolate 515 523 555 4%
Chocolate Blocks 112 107 119 3% Chocolate Bars 321 342 362 6% Chocolate Boxed 24 21 23 0% Chocolate Children’s 50 44 42 -8% Chocolate Seasonal 8 8 9 4%
Sugar Confectionery 379 352 343 -5% Gum 70 82 101 20% Total Confectionery 964 958 998 2%
Source: CMA
51

12 Laws and Regulations In Australia the production and sale of processed foods are regulated at both Federal and State Government levels. Federal involvement in food regulation principally arises through its responsibility for developing the Australian Food Standards Code, the setting of import and export standards and inspections. State and local governments are responsible for enforcement of the provisions of the Code. In the latter half of 1996 the Australian food regulating body joined forces with New Zealand, forming the Australia New Zealand Food Authority (ANZFA). By 2001, the process of developing ‘streamlined’ joint standards was completed enabling harmonisation of food regulations between both countries. The following discussion incorporates extracts published by ANZFA, chiefly from its web site (www.anzfa.gov.au). This site contains user guides and fact sheets on specific labelling requirements including nutrition information, percentage labelling, and warning and advisory declarations. A full copy of the Food Code is also available.
12.1 Food Labelling Comprehensive labelling requirements have been introduced in Part 1 of the Code to ensure that consumers have adequate information to enable them to make informed choices when purchasing food. In most circumstances packaged foods for retail sale or for catering purposes are required to bear a label setting out all the information prescribed in the new Code. Foods for catering purposes means those foods for use in restaurants, canteens, schools, caterers or self catering institutions, where food is offered for immediate consumption. Unless specifically exempted, the label on a package of food for retail sale or for catering purposes must include the information in the following sections:
12.1.1 Description of Food Clause 1 of Standard 1.2.2- states the label on a package of food must include a name or a description of the food. If there is a prescribed name for the food in the Code this must be included on the label. If there is no prescribed name for a food, the label must include a name or description of the food sufficient to indicate the true nature of the food. The name or description chosen should be specific enough to differentiate it from other foods. In accordance with food law and fair trading law, manufacturers must not represent foods in a false, misleading or deceptive manner.
12.1.2 Lot Identification Clause 2 of Standard 1.2.2- states that lot identification is required on packaged food to assist in the rare event of a food recall. A lot mark should identify the batch from which the food was manufactured. It should be able to identify the premises where the food was packed and/or prepared. A date mark and the supplier's address details can help satisfy the requirements of a lot mark. There are some specific exemptions from lot identification. These exemptions cover individual portions of ice cream/ice confection and food in small packages when the bulk packages and bulk container in which the food is stored or displayed for sale includes lot identification.
52
12.1.3 Australian Supplier Contact Details Clause 3 of Standard 1.2.2- states a supplier' s name and their business address in Australia or New Zealand are required on the label on a package of food. The term ' supplier' includes the packer, manufacturer, vendor or importer of the food. A business address means the location of the premises from which a business is being operated, and includes the street number, the street name, the town or suburb and, in Australia, the state or territory. A post office box address is not sufficient.
12.1.4 Mandatory Warning and Advisory Statements Standard 1.2.3 – Mandatory warning and advisory statements and declarations requires that certain foods, or foods containing certain substances, which may have implications for sensitive or health impaired individuals or allergy or food intolerance sufferers, must be labelled with a warning or advisory statement or declaration. The standard incorporates three categories of labelling based on the degree of risk to health and safety and the level of public awareness of any potential risks. The first level requires a warning statement to appear on the label of foods containing royal jelly, which can cause severe adverse reactions in some people. The second level requires advisory statements on those foods that contain a component that presents a risk that may not be obvious to the consumer, for example, foods containing aspartame, quinine, unpasteurised milk, or added caffeine would require an advisory statement on the label. The third level requires declaration on the label of those ingredients that can cause severe adverse reactions even in small amounts – these include peanuts and other nuts, seafood, fish, milk, gluten, eggs and soybeans. Manufacturers may use their own words for advisory statements as long as they convey the effect of the advice and the statement is prominent and legible. Warning statements must appear on labels in type of not less than 3mm (1.5mm on small packages). Eg Sugarfree chewing gum
Ingredients: sorbitol, gum base, mannitol, humectant (422), flavours, emulsifier (soya* lecithin), artificial sweetener (951) colours (133, 160A), antioxidant (320)
“PHENYLKETONURICS: CONTAINS PHENYLALANINE” Or “CONTAINS PHENYLALANINE”
12.1.5 Ingredient Listing Standard 1.2.4 states unless specifically exempted, the label of a package of food must list all the ingredients and compound ingredients used in the manufacturing of the food. An ingredient means any substance, including food additives, used in the preparation, manufacturing or handling of a food. A compound ingredient means an ingredient of a food that is itself made up of two or more ingredients, e.g. spaghetti, which is made up of flour, egg and water. Ingredients and compound ingredients must be declared in a statement of ingredients in descending order of ingoing weight subject to limited exceptions. The names of ingredients should be sufficiently detailed to describe the ingredient, and accurate to ensure they are not false, misleading or deceptive, or likely to mislead or deceive.
12.1.6 Date Marking Standard 1.2.5- Date marking of packaged food defines date marking and regulates the use of best-before and use-by dates. Packaged food is generally required to be date-marked. A date mark will usually be in the form of a ' best-before' date. Food with a ' best-before' date of two or more years is exempt from date marking. Additional exemptions, including those for small packages, are set out in clause 2. When for health and safety reasons a food should not be consumed after a certain date, a ' use-by' date is required. There are few foods that will be required to be labelled with a ‘use-by’ date. There are also prescribed forms for date marks and dates, and requirements to include statements of specific storage conditions on labels of packaged food.
53
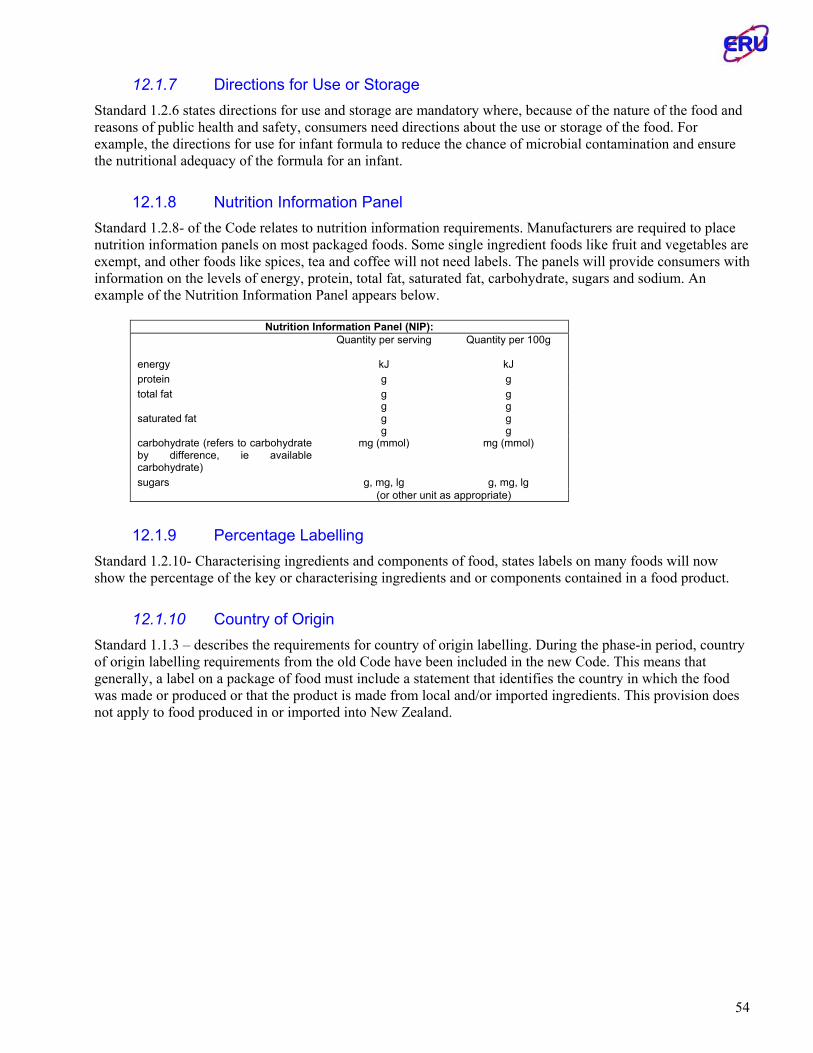
12.1.7 Directions for Use or Storage Standard 1.2.6 states directions for use and storage are mandatory where, because of the nature of the food and reasons of public health and safety, consumers need directions about the use or storage of the food. For example, the directions for use for infant formula to reduce the chance of microbial contamination and ensure the nutritional adequacy of the formula for an infant.
12.1.8 Nutrition Information Panel Standard 1.2.8- of the Code relates to nutrition information requirements. Manufacturers are required to place nutrition information panels on most packaged foods. Some single ingredient foods like fruit and vegetables are exempt, and other foods like spices, tea and coffee will not need labels. The panels will provide consumers with information on the levels of energy, protein, total fat, saturated fat, carbohydrate, sugars and sodium. An example of the Nutrition Information Panel appears below.
Nutrition Information Panel (NIP): Quantity per serving
Quantity per 100g
energy kJ kJ protein g g total fat g
g g g
saturated fat g g
g g
carbohydrate (refers to carbohydrate by difference, ie available carbohydrate)
mg (mmol) mg (mmol)
g, mg, lg g, mg, lg sugars (or other unit as appropriate)
12.1.9 Percentage Labelling Standard 1.2.10- Characterising ingredients and components of food, states labels on many foods will now show the percentage of the key or characterising ingredients and or components contained in a food product.
12.1.10 Country of Origin Standard 1.1.3 – describes the requirements for country of origin labelling. During the phase-in period, country of origin labelling requirements from the old Code have been included in the new Code. This means that generally, a label on a package of food must include a statement that identifies the country in which the food was made or produced or that the product is made from local and/or imported ingredients. This provision does not apply to food produced in or imported into New Zealand.
54

12.1.11 Additional General Information Requirements Legibility requirements standard 1.2.9 – states manufacturers and retailers can choose any type style or type size provided that the information displayed is in English and is legible and prominent so as to be in distinct contrast to the background. Other Specific Labelling Requirements. In addition to those core information requirements, there are the following labelling requirements, some of these are described in the following sections.
• Health claims (clause 1 of Standard 1.1.3). • Labelling of certain milk products and royal jelly (Standard 1.1.3; clauses 3 and 4). • Nutrition claims (division 3, Standard 1.2.8). • Labelling in relation to the vitamin and mineral content. (Standard 1.3.2). • Labelling of genetically modified food (Standard 1.5.2). • Irradiated food or food containing irradiated ingredients (Standard 1.5.3). • Novel foods (See Standard 1.5.1).
Commodity specific labelling requirements. In some cases, the commodity standards in Chapter 2 of the Code require that specific information be provided on the label of certain classes or types of foods. Manufacturers and retailers should consult the commodity standards to determine any additional labelling requirements for individual foods.
12.1.12 Exemptions from Labelling Requirements Clause 2 of Standard 1.2.1 - The following foods for retail sale or for catering purposes are generally exempt from bearing a label setting out the information prescribed by the new Code:
• Food not in a package. • Food in an inner package not designed for sale without an outer package, other than individual portion
packs which contain certain substances which must be declared (clause 4, Standard 1.2.3). • Food made and packaged from the premises. • Food packaged in the presence of purchaser. • Food delivered packaged, and ready for consumption, at the express order of the purchaser. • Food sold at a fundraising event.
Even when exempt from bearing a label, the new Code requires that certain information about a food be available to the consumer, either verbally or in writing, at the point of sale.
12.2 Food Additives The Code sets levels for food additives, processing aids, vitamins and mineral nutrients, and the purity of these substances, in foods. Additives can only be added to food in order to achieve an identified technological function according to good manufacturing practice. To set permitted levels of use, ANZFA carries out a risk assessment to characterise the health effects of these substances, and to estimate our potential exposure to them through our diet. All new food additives, processing aids and vitamin and minerals must be assessed by ANZFA, and approved for use by Ministers on the ANZFA Council prior to incorporation in the relevant standard. Food additives may not be used in food unless specifically listed in Standard 1.3.1. A food additive is any substance not normally consumed as a food by itself and not normally used as an ingredient of food, but which is intentionally added to food to achieve one or more approved technological functions. These include, for example, antioxidants, emulsifiers, colourants and preservatives.
55
Food additives are listed in Schedule 1 of the standard against the type of food or ingredient that they are permitted in. The presence of food additives in a food is declared in the ingredient list on the label on the food according to their class or function (listed in Schedule 1 of Standard 1.2.4) and followed by the specific additive name or code number. eg, acid (330), or acid (citric acid).
12.3 Processing Aids Processing aids are regulated under Standard 1.3.3. Processing aids are substances used in the processing of food to perform a technological purpose in the processing of raw materials, food or ingredients, but do not perform a function in the final food. Processing aids must be used at the lowest level necessary to achieve the technological purpose irrespective of any maximum permitted level specified. Labelling of processing aids is generally not required, however the presence of any allergens or genetic modification must be declared. Processing aids are not usually present in the food as sold. eg, processing aids are used to filter some beverages, the substances used in the filtration process do not usually remain in these beverages.
12.4 GM Foods No novel, irradiated or genetically modified food is permitted for sale in Australia and New Zealand unless they have passed a pre-market safety assessment by ANZFA. Food manufacturers are required to supply ANZFA with scientific information that satisfies specifications outlined in the relevant standard. This information is carefully examined and supplemented with information from world scientific literature and external experts. Once a new food regulated under one of these standards has completed the safety assessment process, a report is released for public comment. The food is added to the relevant standard and allowed for sale once approved by the food standards ministerial council. Under the amended standard, food or food ingredients must be labelled with the words ‘genetically modified’ if genetic material or protein from the genetic modification is present in the final food. A number of exemptions exist for the labelling of GM food. These include:
• Where a GM food has been refined and the effect of the refining process removes GM components – novel DNA and/or novel protein.
• Where a GM processing aid or additive is used during manufacture and carries no GM components (novel DNA and/or novel protein) into the final food.
• Where a flavour contains GM components and is present in the food in a concentration no more than 1g/kg (0.1%).
• Where a food or ingredient contains genetically modified food that is unintentionally present in a quantity of no more than 10g/kg (1%) per ingredient.
• Food intended for immediate consumption, which is prepared and sold from food premises and vending vehicles, including restaurants, take away outlets, caterers, or self-catering institutions.
56

13 Customs and Tariffs All goods imported into Australia must be cleared by customs. Importers are responsible for obtaining a formal customs clearance for consignments of goods above set value limits (currently A$250 for goods imported by sea or air and A$1,000 for goods imported by post). Goods entering the country attract customs duties and/or GST levies. Duty rates are dependent on a number of variables such as country of origin, advice on duty rates can be obtained from Customs Information Centre (CIC).
13.1 Import Documentation Australian Customs do not require companies or individuals to hold import licences, although permits to import restricted goods are required. The minimum level of documentation required by customs is;
• Completed Customs Entry or Informal Clearance Document (ICD). • Air waybill (AWB) or bill of lading (BLAD). • Invoices and other documents relating to the freight.
Customs do not require the completion of a special invoice beyond the normal commercial invoices. Bills of lading and receipts are acceptable providing they contain the following;
• Invoice terms (FOB,CIF). • Monetary unit referred to on invoice (i.e. US$). • Name and address of seller of goods. • Name and address of buyer of goods. • Complete description of goods. • Name of ship/aircraft goods arrived on. • Country of origin of the goods, including documentation from the manufacturer when preferential rates
of duty are being claimed. • Numbers of packages containing the goods and the marks and numbers on each package. • Quantity of the goods. • Selling price of goods. • Labour costs incurred in packing the goods into outside packages. • Value of outside packages. • Amount of royalties (if any) payable in respect to the goods. • Particulars of freight and insurance costs associated with the transport of goods to Australia. • Particulars of all arrangements and undertakings that have, or might have, the effect of varying the
selling price of the goods whether by way of discount, rebate, compensation or any other means. Importers are required to ensure goods entering Australia are correctly marked. Customs administers truth in labelling provisions. It is an offence to knowingly apply for imported goods to carry false trade descriptions. Trade description markings must be;
• In English • In prominent and legible characters • On a principle label or brand attached to the goods in a prominent position in a manner as permanent as
practicable • In certain circumstances must contain the country of origin.
Importers are legally required to retain commercial documents relating to the transaction for five years from the date of entry, as these documents may be required for a customs audit. Failure to meet this requirement may incur a financial penalty.
57

13.2 Customs Valuation System The system used by customs to value goods imported into Australia is based on the World Trade Organisations (WTO) Valuation Agreement, which is used by most trading nations. The most common method used is the transaction value method, based on the price paid/payable for the imported goods. However the price paid is sometimes subject to adjustment such as discounts, royalties and commissions, therefore if customs is not satisfied with the stated transactional value then they would consider alternative valuation methods that are;
• Identical goods value method. • The similar goods value method. • One of the three deductive-value methods (i.e. price in a sale in Australia of the imported goods,
identical goods or similar goods. This price must be adjusted for costs etc incurred between ‘the place of export’ and the sale in Australia).
• The computed-value method (i.e., a value based on production, general expenses, other costs and profit relating to the imported goods).
• The fallback-value method (i.e., a value determined by Customs having regard to all the above methods and other matters that Customs considers relevant).
Where the price involved in the customs valuation is not in Australian dollars, it will be converted into Australian dollars at the ruling rate of exchange when the goods were exported. The ruling rate of exchange will be published in the Commonwealth of Australia Gazette, General Notices, the Australian Financial Review and the Lloyd’s List Daily Commercial News Charges apply to cargo reporting and processing of import entries for goods regardless of transportation medium. Commercial customs clearances can be arranged by the owner or the customs broker (typically a fee for service arrangement).
13.3 Taxation Goods and Services Tax (GST) applies to most imported goods. A 10% tax is applied to the value of the taxable importation. The value of the taxable importation is the sum of;
• Customs value of goods. • Any customs duties payable. • Cost of transporting/insuring goods to Australia. • Any wine tax payable.
No special taxation provisions are applicable to the confectionery industry. However, the industry's products are subject to Goods and Services Tax (GST) of 10%.
13.4 Rules of Origin Some imported goods from certain countries attract a preferential rate of duty. Rule of Origin are used to determine the country of origin. An importer claiming a preferential rate must have a declaration from the manufacturer stating that the goods satisfies the requirements for preference. Audits are conducted to ensure that conditions are meet. The legislative basis for determining Origin in Australia is in Division 1A - Section 153A to 153S of the Customs Act 1901 and Regulations 107A and 107B. Trade between the United States and Australia does not attract preferential rates.
58

13.5 Assistance Customs offers a number of schemes that benefit importers and exporters some of these include;
• A licensed warehousing (under bond) system, which provides businesses with a duty deferral facility. This system allows importers/owners of the goods on which duty has not been paid to store them under bond in customs licensed premises until they are ready to pay duty on the remaining goods. Some limited activity is able to be carried out on these goods while they are under bond.
• A tariff concession system, a mechanism for granting a tariff concession order to allow concessional entry of imported goods. This applies where no substitutable goods are produced in Australia in the ordinary course of business.
• Dumping and subsidies. Remedial action can be taken against an overseas supplier if it is demonstrated that the dumping or subsidisation of goods has adversely affected an Australian industry producing similar goods.
• The accredited client program, a new program being developed for low-risk importers and exporters to streamline their reporting requirements. The accredited client program will operate through a mix of legislative and contractual arrangements and will be implemented in conjunction with the new integrated cargo system.
While the confectionery industry was in the past afforded tariff protection, since the late 1980s the level of such protection has been considerably eroded. For cocoa-based and sugar confectionery the tariff is now 5% for industrialised countries (4% for Singapore and Malaysia), dropping to 3% for developing nations and zero for undeveloped countries. Unilateral trade relationships exempt Papua New Guinea and New Zealand from import duty. The average effective rate of assistance to this industry was around 8% in 1995-96 according to the Industry Commission (now the Productivity Commission). It is currently around 5%. This decline reflects changes in government policy towards a much more user-based system of payment for research, as well as reductions in tariff protection.
13.6 Government Initiatives Trade modernisation legislation was passed by parliament in June 2001 which entails a series of significant changes to the passage of freight both into and out of Australia. These changes will be occurring over the next 18 months. Some features include;
• Open gateway communication system Customs Connect Facility (CCF). • Merging of several information systems into an Integrated Cargo System (ICS). • Tailored arrangements for low risk importers/exporters under Accredited Client Program (ACP). • Industry self assessment of low revenue, low risk freight. • Streamlined reporting system which combine cargo reports and declaration information.
In addition to this legislation, Australian Customs is working towards some of the elements of the International Trade Modernisation (ITM) legislation commencing in July 2002. With this in mind readers should consult current requirements at the Australian Customs web site www.customs.gov.au In addition to their web site Australian Customs operates a Customs Information Centre (CIC) which assists users to understand and use the services and programs administered by Customs.
59

13.7 Imported Food Program The Imported Food Program (IFP) is jointly run by the Australian Quarantine and Inspection Service (AQIS) and ANZFA, with ANZFA advising on food risk assessment policy and AQIS having operational responsibility for inspection and sampling. The legal basis for the inspection of imported food in Australia is the Imported Food Control Act 1992. Standards applied are set down in the Code and these same standards apply to foods manufactured in Australia. ANZFA is responsible for the Code and food inspection categories are regularly reviewed.
13.7.1 Categories of Inspection Food imported into Australia falls into one of three inspection categories, which determine the frequency of freight inspections. The three categories are risk, active surveillance and random surveillance. On the whole confectionery products are generally classified as low risk and are therefore subject to random inspections. Food is risk categorised if it has the potential to pose a high or medium risk to public health. All risk-categorised foods are referred to AQIS for inspection. Risk-categorised foods are inspected and tested against a pre-determined list of potential hazards. All surveillance foods referred to IFP are inspected, however, only some of these will have tests applied. Active surveillance classified foods have 10% of freight from every supplying country, referred to AQIS for inspection. These products are released upon sampling. The test results of active surveillance foods are periodically analysed by ANZFA to review the appropriate category classification for these foods. In terms of the random surveillance classified food, 5% of all consignments of all foods not included in the risk or active categories are referred to AQIS for inspection. These products are released upon sampling. Neither AQIS nor the importers have the ability to predict which shipment or which foods will be held for inspection.
13.7.2 Typical Inspection When food is referred to AQIS for inspection, inspectors are required to check the sample against the Code. Food is examined for label compliance and a visual inspection of the packaging for defects and indications of contamination. Samples may be taken of the product for analysis to ensure compliance with a range of standards including microbiology, chemical residues, additives and compositional requirements.
13.7.3 Non Compliance If for any reason a freight shipment failed these inspection there are several options available to an importer that will determine the fate of the imported food; treat the food, re-export the food, destruction of the food, or to downgrade the food (eg for use as animal food or fertiliser). Responsibility falls on the importer to ensure that foods they import comply with the Code. In the situation of an active or random surveillance food not complying, importers may have a holding order issued. A holding order against a foreign supplier effectively means that the food has been raised to risk status. Future shipments of that food from the offending supplier are automatically detained and held until compliance with Australia' s requirements is confirmed. After five clear inspections, the food reverts back to its prior surveillance category. Further information on importing foods into Australia and the Imported Foods Program can be accessed on the AQIS website http://www.affa.gov.au/docs/quarantine/import/food.html
60
14 Opportunities for US Confectionery US culture is readily accepted in Australia, with few exceptions US licensed products sell well. Hollywood movies and American music dominate the local scene. The Australian palate, however, is different. From a confectionery standpoint, it is closer to the taste and preferences of Britain. This is particularly true of chocolate. US chocolate is coarser, bittersweet and not well received in Australia. Sour tasting sugar candy is also markedly less developed as a segment when compared with the US. The success of Russell Stover demonstrates that quality chocolate assortments from the US can sell well. As Stover discovered through no fault of their own, foreign exchange rates can become critical to the viability of the business opportunity. Several identified opportunities for US confectionery exist and they are detailed in the following sections.
14.1 Adult Confectionery Australia has an aging population and since confectionery consumption declines with age there is a possible opportunity in increase this. It is possible that this market is also under serviced for example Australia does not have a well developed adult mint market. Products such as Altoids are not commonly available, though there is no evidence to suggest these products would not succeed. Recently there has been a trend toward premium products in this market, Lindt has been able to capitalise on this somewhat and have done well with their smaller package products and are looking at expanding into a premium block range as well.
14.2 Children’s and Novelty Confectionery The outstanding opportunity for US confectionery suppliers would likely be in the area of children’s novelty products. This is a small but rapidly growing segment of the Australian confectionery market but with one noticeable exception (Cadbury Yowie), has not attracted much in local innovation to the same extent as the US market.
14.3 Packaging Innovations Packaging is an important factor influencing confectionery purchases, it is also very important for new products, as it is often consumers first contact with the product. Packaging innovations can also lead to considerable sales growth in the confectionery market. Packaging therefore must be eye-catching, hygienic looking and convey to consumers the taste of the product, as this is usually the number one driving factor in confectionery purchases. Good packaging is seen by some to reflect quality of the product. Re-sealable packages (air tight) are seen as an example of this, it allows consumers to eat some of the product and then be able to reseal the bag/box and still eat fresh product at a later time.
14.4 Functional Confectionery Functional confectionery has been one of the fastest growing confectionery categories in recent times. The trend is toward low fat, all natural and sugar free lines, as consumers strive for a healthier lifestyle. Food Standards in Australia is progressively relaxing the prevailing prohibition on therapeutic claims. It is anticipated that in future brand owners will be able to make direct assertions regarding medical benefits in advertising and on labelling, as distinct from simple nutrient claims, i.e. low salt, sugar free. This of course would open up exciting opportunities for manufacturers to incorporate active ingredients within their products.
61

A recent survey showed that adult males are showing increased nutritional awareness and exhibiting a growing desire to eat a balanced diet. Some 74% of all adults consider the nutritional value of food to be very important while a further 23% consider nutrition to be somewhat important. However, this has not yet translated into actions yet, with the main motivator to purchase is being hunger (53%) compared with desire to boost nutritional input (17%).
14.5 New Seasonal Opportunities - Halloween In spite of efforts in the early 1990’s by the industry to establish Halloween as an event in Australia, it has been slow to develop. Confectionery sales for Halloween account for around A$15 million (US$8.6 m). Specific Halloween product might drive growth further but retailer support, which historically has been wanting, is crucial. Easter, Valentines and Christmas are well established and retailers are always looking for new innovative products for these seasons.
14.6 Chewing Gum The gum sector is dominated by Wrigley (97% share). This suggests that a competitor would be welcome by the trade. Afuture player would need to be prepared for stiff competition through the extensive field force employed by Wrigley, not to mention its broad product range.
14.7 US Product Banner As a group, US manufacturers could band together to command a larger and wider communications program and obtain larger shelf allocations in supermarkets. If they were to offer a range of US products covering a range of segments from members under a general US candy branding, they could command more power amongst distributors and retailers. US products could be merchandised, distributed and displayed together, enabling all US products to be able to leverage off world known US brands and the US confectionery banner. Offering a range of products under a US branding would enable appropriate point of sale merchandising and negotiation of shelf space with major supermarkets, department and discount stores. These point of sale materials would add benefit to all products displayed within, so that consumers will see and know where to go to purchase US products. The size and power of this merchandising approach would help convert latent consumer demand into product sales. Free standing point of sale merchandising and counter top merchandising under the US Candy banner will help remind consumers and stimulate latent demand in convenience stores, specialty stores, gas stations and milk bars. Cost saving and wider reach can be obtained using a co-operative advertising campaign linking products to the US candy banner and creating awareness that under the US candy banner there is a wide range of products to try. Sampling trials at shopping centres, movie pictures, train stations and in the central business district of major cities would also help to stimulate consumer interest and gives consumers direct product experience.
14.8 Australia as an Export Base US Manufacturers of confectionery may be interested in manufacturing product in Australia to supply both the domestic market and the growing Asia Pacific markets to Australia’s north. Australia is geographically ideal for establishing a South East Asian manufacturing base, given its stable political structure, good shipping service access and well educated work force. Australia is emerging as a favoured regional base for global companies interested in developing Asian market presence. The federal and state governments of Australia provide various grants and incentives to lure multinational companies to establish regional headquarters in Australia.
62

15 Conclusion In developing a market entry strategy, US manufacturers should bear in mind the relatively small total market size, extent of confectionery manufacturer and brand concentration, price competitive nature of the market and the high levels of concentration of retail trade outlets. These aspects have a significant bearing upon a market entry strategy related to an individual US manufacturer setting out to establish a solid brand position. Advertising and promotional commitment is fundamental to facilitate broad based consumer trial. So too, is the need to conduct sensory evaluation research to avoid the taste resistance Hershey encountered in their market entry in the late 1980’s.
15.1 Barriers and Facilitators to Market Entry The fact that grocery retail (and for that matter, route retail) is highly concentrated, this allows fairy straightforward access to the entirety of the national market. In fact, supply contracts with five national buyers (Coles, Woolworths, Metcash and the route networks NCW and the Distributors) guarantees access to almost 90% of the nations confectionery distribution network. Smaller firms may consider forming a network with other manufacturers in order to share the costs associated with market entry, perhaps through a cross-branded strategy. Such an approach enables a broader product range, which is preferable to national buyers. Niche product specialists can take advantage of either direct supply (say with a department store or variety chain) or through a number of specialised local import agents. Specialty confectionery retail chains exist in Australia but are virtually all vertically integrated, stocking only their own manufactured brands (Haighs Chocolates, Darrell Lea Chocolate Shops). Serious market contenders wanting to obtain a sizable share of the Australian market must change the recipe of their US products or at least do extensive taste testing to ensure compatibility with Australian tastes. It seems some Australians find US products too rich or bitter, particularly chocolate confectionery from the US. Therefore, to market US products on a mass basis, it is essential to cater to local taste preferences if broad market penetration is to be achieved. Pricing strategy too, is a critical consideration. While consumers will pay the price asked of imported confectionery, they tend to purchase the products in smaller amounts and less frequently. Unless the product or range is particularly unique to the market place, US products will need to be priced at levels competitive with domestic products.
15.2 Importance of Distribution For US suppliers seeking to penetrate the broad Australian market, the options are, to operate either through an appointed local agent, or alternatively, establish their own local sales and marketing office. Local representation will provide guidance on a range of local issues such as market data, legislative requirements, sales contacts and market development. Some form of product training and marketing support is required by the local agent to successfully sell US supplied products. The larger local agents are, Stuart Alexander, JNH and Network Foods. These agents currently access all major distribution channels either direct, or through third parties. Unlike the US, Australia does not utilise brokerage arrangements in any appreciable way. To obtain a substantial share of the Australian confectionery market, a wide distribution network is essential because of the impulse nature of confectionery purchase decisions. US confectionery manufacturers need to concentrate distribution in major cities, as this is where the majority of consumers are located. Grocery is a key distribution channel as they account for over 61% of all market sales and to succeed, this channel has to be serviced well.
63

Irrespective of which option is chosen, US exporters must be mindful of the need to comply with prevailing packaging and labelling laws. Enforcement of these laws occurs at the point of entry into Australia and chronic non-compliance may lead to costly automatic inspection of all shipped products. ‘Stock-outs’ are the bane of the retailer’s life. In recent years, national retailers have been known to delete lines that are not reliably supplied. For this reason, overseas suppliers must possess adequate local warehousing arrangements with the ability to hold at least six-eight weeks of stock.
15.3 Branding and Marketing Whether on an individual or a co-operative level, promotions require considerable funding and managerial input. Advertising is critical to achieve product awareness within the market and acts as a source to remind consumers to convert their latent demand to actual purchase. The main avenues to achieve this is via television, magazine, radio and innovative outdoor mediums. Point of sale merchandise is critical, as the US product has to be seen above the others. Innovative point of sale material can even stimulate impulse purchases in supermarkets. Outdoor advertising and advertising on moving billboards (trams, buses, and trains) are an ideal way to keep brand names fresh amongst consumers. Considerable effort and expenditure also needs to be put into trade promotions. Public relations and below the line marketing expenditure are also important to encourage and stimulate consumer participation and interest. Product sampling is important for new products. Competitions are also a useful method to generate consumer interest. Australian confectionery manufacturers are also trying to increase sales of chocolate confectionery during the summer months by encouraging retail outlets to store the product in refrigerated retail display space. Special merchandising is needed, and it would help increase sales levels during sluggish periods.
64

16 Contacts
16.1 Trade
16.1.1 Supermarkets Aldi Address 1 Sargaents Rd
Minchinbury, NSW, 2770 Australia
Locked Bag 56 St Mary’s, NSW, 2760 Australia
Phone +61 2 9675 9000 Fax +61 2 9675 9299 Website www.aldi.com.au Contacts Position Email Ms Kylie Cooper Confectionery Buyer Bi-Lo (Part of Coles Myer) Postal Address 800 Toorak Rd
Toronga, VIC, 3146 Australia
PO Box 480 Glen Iris, VIC, 3146 Australia
Phone +61 3 9829 6105 Fax +61 3 9829 5990 Website www.bi-lo.com.au Contacts Position Email Mike Reeves National Merchandise Manager -
Snacks [email protected]
Peter Lovely Senior Buyer – Snacks/Beverages/Seasonal
Campbell Cash and Carry (part of Metcash) Postal Address 4 Newington Rd
Silverwater, NSW, 2128 Australia
PO Box 2261 North Parramatta, NSW, 2151 Australia
Phone +61 2 9208 1164 Fax +61 2 9741 3399 Website www.metcash.com Contacts Position Email Fred Kinnaird General Manager - Merchandise [email protected] David Langer National Senior Confectionery Buyer [email protected] Coles Supermarkets (Part of Coles Myer) Postal Address 800 Toorak Rd
Toronga, VIC, 3146 Australia
PO Box 480 Glen Iris, VIC, 3146 Australia
Phone +61 3 9829 4111 Fax +61 3 9829 5288 Website www.coles.com.au
http://supplier.coles.com.au
Contacts Position Email Paul Ribeiro Senior Confectionery Buyer [email protected] Alex Campanelli Seasonal Confectionery Buyer [email protected] Food Chain (David Jones) Address Sydney Imperial Arc Level 1, 85
Castlereagh St Sydney, NSW, 2000 Australia
GPO Box 503 Sydney, NSW, 2000 Australia
Phone +61 2 9390 7414 Fax +61 Website www.davidjones.com.au Contacts Position Email Terry Scherer Merchandise Manager [email protected] Foodland Address 218 Bannister Rd
Canning Vale, WA 6155 Australia
Locked Bag 30 Canningvale, WA, 6970 Australia
Phone +61 8 311 6000 Fax +61 8 9311 6767 Website Contacts Position Email Trevor Coates Group Managing Director
65

Woolworths Supermarkets Address 540 George St Sydney, NSW, 2000
Australia Locked Bag 11 Fairfield, NSW, 2165 Australia
Phone +61 2 9892 7111 Fax +61 2 9892 7171 Website www.woolworths.com.au Contacts Position Email Carl Moll Manager Seasonal Confectionery and
Food [email protected]
Kerry Vogel Business Manager - Confectionery [email protected] Natalie Goss National Category Asst. - Confectionery [email protected]
16.1.2 Convenience Stores Caltex Address 19 -29 Martin Pl
Sydney, NSW, 2000 Australia
GPO Box 3916 Sydney, NSW, 2001 Australia
Phone +61 2 9250 5651 Fax +61 2 9250 5115 Website www.caltex.com.au Contacts Position Email Steven Friend National Confectionery Manager Mobil Oil Address 417 St Kilda Rd
Melbourne, VIC, 3000 Australia
GPO Box 4507 Melbourne, VIC, 3001 Australia
Phone +61 3 9252 3111 Fax +61 3 9252 3397 Website www.mobil.com.au Contacts Position Email Duncan Leggett Category Manager [email protected] Quix Address Cnr Millers & Koroit Rd
Altona, VIC, 3018
Phone +61 3 9252 3111 Fax +61 3 9286 5335 Website www.mobil.com.au Contacts Position Email Lillian Nankervis Category Manager [email protected] Shell Select Address 1 Spring St
Melbourne, VIC, 3000 Australia
PO Box 872K Melbourne, VIC, 3001 Australia
Phone +61 3 9666 8796 Fax +61 3 9666 5008 Website www.shell.com.au Contacts Position Email Matt Logan Confectionery Category Manager 7 - Eleven Address 357 Ferntree Gully Road
Mt Waverley, VIC, 3149 Australia
Phone +61 3 9541 0711 Fax +61 3 9541 0890 Website www.7-eleven.com Contacts Position Email
66

16.1.3 Department Stores David Jones Address 86 - 108 Castlereagh Street
Sydney, NSW, 2000 Australia
GPO Box 503 Sydney, NSW, 2000 Australia
Phone +61 2 9266 5544 Fax +61 2 9267 3895 Website www.davidjones.com.au Contacts Position Email Valerie Motelb Confectionery Buyer Jackie Neck Confectionery Buyer Myer Grace Brothers (Coles Myer) Address 800 Toorak Rd
Toronga, VIC, 3146 Australia
PO Box 480 Glen Iris, VIC, 3146 Australia
Phone +61 3 9829 4111 Fax +61 3 9829 5288 Website www.myer.com.au Contacts Position Email Cate Clark Buyer [email protected] Noella Taylor Buyer Assistant
16.1.4 Discount Variety Stores Big W (Woolworths) Address 2 City View Rd
Pennant Hills, NSW, 2121 Australia
Phone +61 2 9847 1273 Fax +61 2 9847 1500 Website www.Bigw.com.au Contacts Position Email Kathy Midson Assistant to Confectionery Buyer [email protected] Paul Howard Confectionery Buyer [email protected] Kmart (Coles Myer) Address PO Box 350
Toronga, VIC, 3146 Australia
800 Toorak Rd Toronga, VIC, 3146 Australia
Phone +61 3 9829 4497 Fax +61 3 9829 4580 Website www.kmart.com.au Contacts Position Email Anna Howden Seasonal Food Buyer [email protected] Shane Cavagnagh Confectionery Buyer Target (Coles Myer) Address 12-14 Thompson rd
North Geelong, VIC, 3215 Australia
Phone +61 3 5246 2000 Fax +61 3 5246 2700 Website www.target.com.au Contacts Position Email Zoran Vidovic [email protected] Steven Williamson Confectionery Buyer [email protected]
Merchandise Planner
67
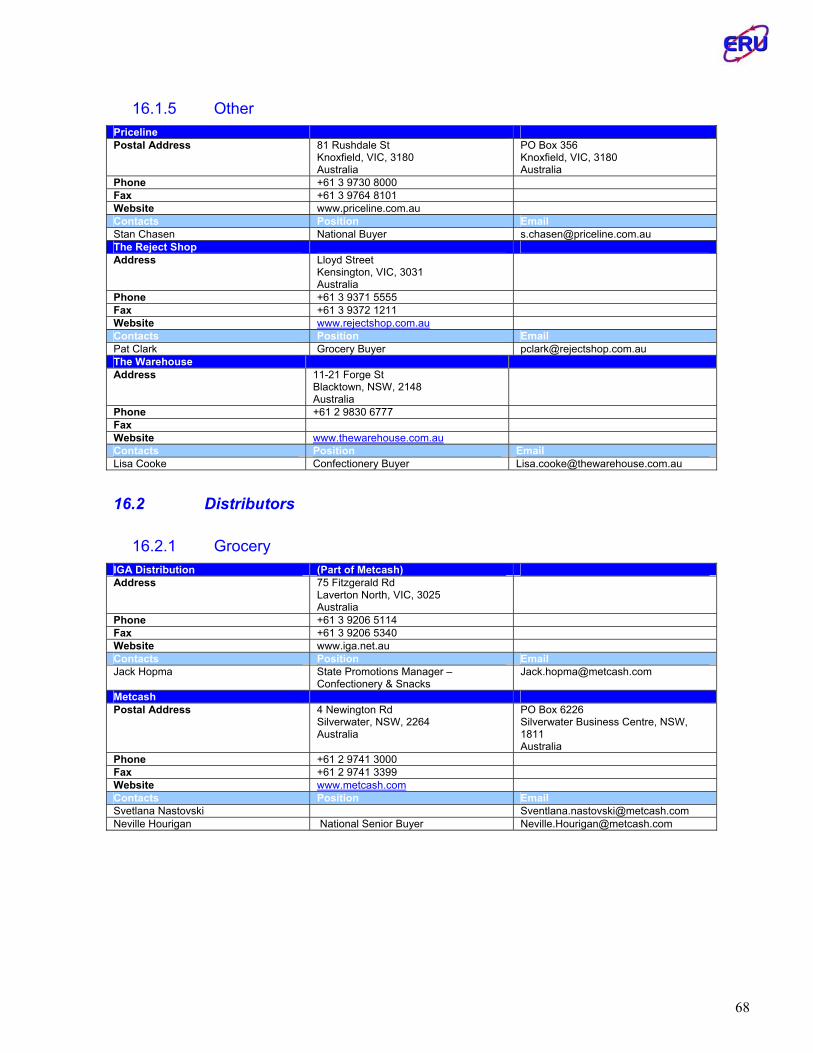
16.1.5 Other Priceline Postal Address 81 Rushdale St
Knoxfield, VIC, 3180 Australia
PO Box 356 Knoxfield, VIC, 3180 Australia
Phone +61 3 9730 8000 Fax +61 3 9764 8101 Website www.priceline.com.au Contacts Position Email Stan Chasen National Buyer [email protected] The Reject Shop Address Lloyd Street
Kensington, VIC, 3031 Australia
Phone +61 3 9371 5555 Fax +61 3 9372 1211 Website www.rejectshop.com.au Contacts Position Email Pat Clark Grocery Buyer [email protected] The Warehouse Address 11-21 Forge St
Blacktown, NSW, 2148 Australia
Phone +61 2 9830 6777 Fax Website www.thewarehouse.com.au Contacts Position Email Lisa Cooke Confectionery Buyer [email protected]
16.2 Distributors
16.2.1 Grocery IGA Distribution (Part of Metcash) Address 75 Fitzgerald Rd
Laverton North, VIC, 3025 Australia
Phone +61 3 9206 5114 Fax +61 3 9206 5340 Website www.iga.net.au Contacts Position Email Jack Hopma State Promotions Manager –
Confectionery & Snacks [email protected]
Metcash Postal Address 4 Newington Rd
Silverwater, NSW, 2264 Australia
PO Box 6226 Silverwater Business Centre, NSW, 1811 Australia
Phone +61 2 9741 3000 Fax +61 2 9741 3399 Website www.metcash.com Contacts Position Email Svetlana Nastovski [email protected] Neville Hourigan National Senior Buyer [email protected]
68
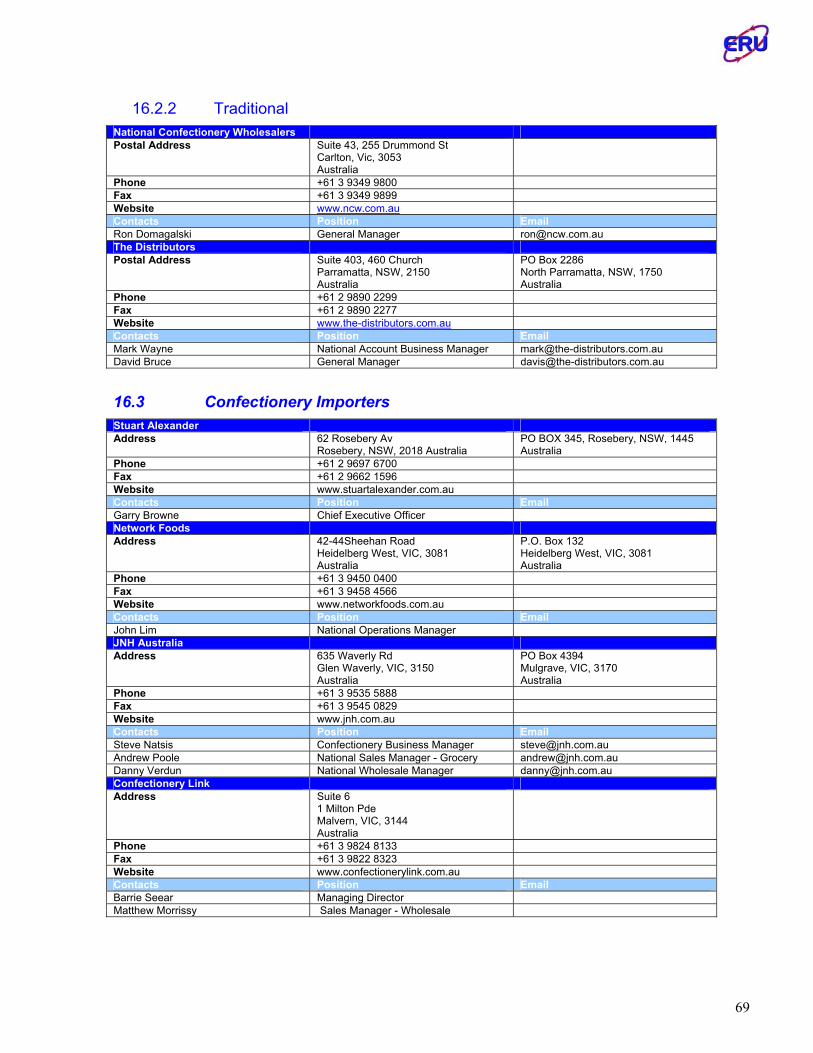
16.2.2 Traditional National Confectionery Wholesalers Postal Address Suite 43, 255 Drummond St
Carlton, Vic, 3053 Australia
Phone +61 3 9349 9800 Fax +61 3 9349 9899 Website www.ncw.com.au Contacts Position Email Ron Domagalski General Manager [email protected] The Distributors Postal Address Suite 403, 460 Church
Parramatta, NSW, 2150 Australia
PO Box 2286 North Parramatta, NSW, 1750 Australia
Phone +61 2 9890 2299 Fax +61 2 9890 2277 Website www.the-distributors.com.au Contacts Position Email Mark Wayne National Account Business Manager [email protected] David Bruce General Manager [email protected]
16.3 Confectionery Importers Stuart Alexander Address 62 Rosebery Av
Rosebery, NSW, 2018 Australia PO BOX 345, Rosebery, NSW, 1445 Australia
Phone +61 2 9697 6700 Fax +61 2 9662 1596 Website www.stuartalexander.com.au Contacts Position Email Garry Browne Chief Executive Officer Network Foods Address 42-44Sheehan Road
Heidelberg West, VIC, 3081 Australia
P.O. Box 132 Heidelberg West, VIC, 3081 Australia
Phone +61 3 9450 0400 Fax +61 3 9458 4566 Website www.networkfoods.com.au Contacts Position Email John Lim National Operations Manager JNH Australia Address 635 Waverly Rd
Glen Waverly, VIC, 3150 Australia
PO Box 4394 Mulgrave, VIC, 3170 Australia
Phone +61 3 9535 5888 Fax +61 3 9545 0829 Website www.jnh.com.au Contacts Position Email Steve Natsis Confectionery Business Manager [email protected] Andrew Poole National Sales Manager - Grocery [email protected] Danny Verdun National Wholesale Manager [email protected] Confectionery Link Address Suite 6
1 Milton Pde Malvern, VIC, 3144 Australia
Phone +61 3 9824 8133 Fax +61 3 9822 8323 Website www.confectionerylink.com.au Contacts Position Email Barrie Seear Managing Director Matthew Morrissy Sales Manager - Wholesale
69

Trialia Foods Address 327 Plummer St
Port Melbourne, VIC, 3207
Phone +61 3 9646 2621 Fax +61 3 9646 3955 Website Contacts Position Email Karam’s Confectionery Address 26-32 Plateau Rd
Reservoir, VIC, 3073 Australia
Phone +61 3 9460 7633 Fax +61 3 9460 7557 Website Contacts Position Email Susan Karam Managing Director [email protected] Candy Brokers Address 635 Waverly Rd
Glen Waverly, VIC, 3150 Australia
PO Box 49 Botany, NSW, 1455 Australia
Phone +61 2 9666 5566 Fax +61 2 9316 6003 Website www.candybrokers.com.au Contacts Position Email Bruce Catto Managing Director [email protected]
16.4 Government Bodies and Industry Associations Department of Foreign Affairs and Trade Address R.G. Casey Building,
John McEwen Crescent, Barton, ACT, 0221 Australia
Phone +61 2 6261 1111 Fax +61 2 6261 3111 Website www.dfat.gov.au Australian Customs Postal Address GPO Box 858
Canberra, ACT 2601 Australia
Phone +61 2 6272 5027 Fax +61 2 6272 3682 Website www.customs.gov.au Food Standards Australia New Zealand Formally ANZFA Address Boeing House
55 Blackall Street Barton, ACT 2600 Australia
Phone +61 2 6271 2222 Fax +61 2 6271 2278 Website www.anzfa.gov.au Confectionery Manufacturers of Australasia Address 689 Burke Rd
Camberwell, VIC, 3124 Australia
Postal Address PO Box 1307 Camberwell, VIC, 3124
Phone +61 3 9813 1600 Fax +61 3 9882 5473 Website www.candy.net.au Nutrition Australia Address c/- The Smart Food Centre
University of Wollongong, NSW 2522 Australia
Phone +61 2 4221 5346 Fax +61 2 4221 5717 Website www.nutritionaustralia.org
70