Embed Size (px)
Citation preview

Australia Private Equity & Venture Capital Index and Selected Benchmark StatisticsSeptember 30, 2015
Data as ofSeptember 30, 2015
Note on Methodology Changes:
Beginning this quarter, we have updated our approach for the calculation and display of select data points contained in this report:
1. We have moved to a commitment-based methodology for our equal-weighted return calculation. This is a better approach than the previously used, contribution-based methodology, as it does not vary over time and is more reflective of investor decision-making. Since contributions approach total commitments over time, this change will not have a meaningful impact on older vintage yearbenchmarks, but you may see some minor shifts in younger vintage year benchmarks.
2. The minimum and maximum values have been replaces with 5th and 95th percentile breakpoints, as the percentile values are less subject to outliers.
Australia Private Equity & Venture Capital Index and Selected Benchmark Statistics
Data as ofSeptember 30, 2015
Our goal is to provide you with the most accurate and relevant performance information possible; as a result, Cambridge Associates’ research organization continually monitors the constantly evolving private investments space and its fund managers. When we discern material changes in the structure of an asset class and/or a fund’s investment strategy, it is in the interest of all users of our benchmark statistics that we implement the appropriate classification realignments.
In addition, Cambridge Associates is always working to grow our private investments performance database and ensure that our benchmarks are as representative as possible of investors’ institutional-quality opportunity set. As a result we continually add funds to the database (both newly-raised funds and backfill funds) and occasionally we must remove funds that cease reporting. Our private investments performance database is dynamic and will reflect both classification adjustments and changes to the underlying pool of contributing funds. As a result, you may notice quarter to quarter changes in the results of some historical benchmark return analyses.
Disclaimer
Australia Private Equity & Venture Capital Index and Selected Benchmark Statistics
Data as ofSeptember 30, 2015
Cambridge Associates’ Private Investments Database is one of the most robust collections of institutional quality private fund performance. It contains the historical performance records of over 1,800 fund managers and their over 6,200 funds. In addition, we capture the performance information (gross) of over 71,000 investments underlying our venture capital, growth equity, buyout, mezzanine and private equity energy funds. This is one of the largest collections of portfolio-level performance information in the world and represents the investments of approximately 80% of these funds on a count basis and 86% on a total commitment basis. This fund and investment-level performance information is drawn from the quarterly and audited annual financial statements of the fund managers and each manager’s reported performance numbers are independently recreated from the financial statements and verified by Cambridge Associates.
Institutional Quality DataCambridge Associates strives to include only institutional quality funds in our benchmarks. “Institutional quality” funds, in our definition, tend to meet the following criteria: closed-end funds, commingled funds that invest 3rd party capital (we exclude firms that invest off of their balance sheet, such as a bank’s principal investing group or a corporate’s venture capital arm), and fund vehicles. This institutional quality screen seeks to provide investors with performance data consistent with their investible opportunity set.
Sources of Benchmark DataOur benchmark database utilizes the quarterly unaudited and annual audited fund financial statements produced by the fund managers (GPs) for their Limited Partners (LPs). These documents are provided to Cambridge Associates by the fund managers themselves. Unlike other data providers, Cambridge Associates does not use Freedom of Information Act (FOIA) requests, regulatory filings, manager surveys, or press “scrapings” to obtain information. Our goal is to have a complete historical record of the quarterly cash flows and net asset values for all funds in the benchmarks. We use a number of paths to encourage fund managers to submit their performance data to our database: our clients for whom we provide private investment performance reporting, our research organization’s regular meetings with thousands of managers, our special projects designed to enhance existing benchmarks or launch new ones, our exclusive relationships with over ten globally-diverse fund manager associations, and finally, our exclusive relationships with Thomson Reuters and the Institutional Limited Partners Association (ILPA). By leveraging these varied sources and proprietary relationships, Cambridge Associates has constructed a rich and diversified benchmark data set.
Vintage Year DefinitionVintage year is defined as the legal inception date as noted in a fund's financial statement. This date can usually be found in the first note to the audited financial statements and is prior to the first close or capital call.
Overview
Australia Private Equity & Venture Capital Index and Selected Benchmark Statistics
Data as ofSeptember 30, 2015
The Cambridge Associates’ benchmarks are reported on a one-quarter lag from the end of the performance quarter due to the reporting time frame of private investments fund managers.
Published Data: When the vast majority of a benchmark group’s (organized by asset class, e.g. Venture Capital or Real Estate) performance information is updated for a performance quarter, that benchmark is considered final and the data is “published” via the quarterly benchmark reports.
Changes to Data: After a benchmark group is published, any updates to historical data for these funds, which can include adding a fund and its performance history to the database (“backfills”) and/or updating past information for an existing fund due to late-arriving, updated, or refined information, would be reflected when that group is published for the next performance quarter.
In addition, Cambridge Associates may change the classification of certain funds; this often driven by the evolution of private investments and the resulting need to introduce new benchmarks or refine our classification scheme. For example, as growth equity emerged as an asset class we reclassified certain venture capital and buyout funds accordingly.
Survivorship Bias: In order to track the performance of a fund in our benchmarks, we require the complete set of financial statements from the fund’s inception to the most current reporting date. When an active fund stops providing financial statements, we reach out to the manager and make several attempts to encourage them to continue to submit their data. We may, during this communication period, roll forward the fund’s last reported quarter’s net asset value (NAV) for several quarters. When we are convinced that the manager will not resume reporting to us, the fund’s entire performance history is removed from the database.
When fund managers stop reporting before their fund’s return history is complete, an element of “survivorship bias” may be introduced to a performance database, which could skew the reported returns upwards if the funds dropping out had poorer returns than those funds that remained. Survivorship bias can affect all investment manager databases, including those for public stock managers and hedge funds. Compared to public stocks and hedge funds, however, the illiquid nature of private investments can actually help limit this survivorship effect. Whereas an underperforming stock manager may simply close up shop or drop out of databases as clients liquidate their positions and fire the manager, private investment partnerships owning illiquid assets continue to exist and require reporting to the limited partners, even if the original manager ceases to exist.
Over the last six years the number of fund managers that stopped reporting to Cambridge Associates represented an average of 0.8% (per year) of the total number of funds in the database during the respective year, and an average of 0.6% (per year) as a percentage of total NAV in the database during that respective year. During that same period the overall number of funds in our database increased by an average of 8% (per year). The performance of the small number of funds that have stopped reporting has been spread amongst all quartiles and has not been concentrated consistently in the poorer performing quartiles.
Timing of Final Benchmarks and Data Evolution
Australia Private Equity & Venture Capital Index and Selected Benchmark Statistics
Data as ofSeptember 30, 2015Australia Private Equity & Venture Capital Index and Selected Benchmark Statistics
Table of Contents
Australia Private Equity & Venture Capital (A$)
Fund Index Analysis 2mPME ReturnsIndex Returns
Fund Since Inception Analysis 7mPME ReturnsSince Inception Returns
Company Analysis 14
Methodology 16
| 1
Australia Private Equity & Venture Capital:
Fund Index Analysis
| 2
Data as ofSeptember 30, 2015
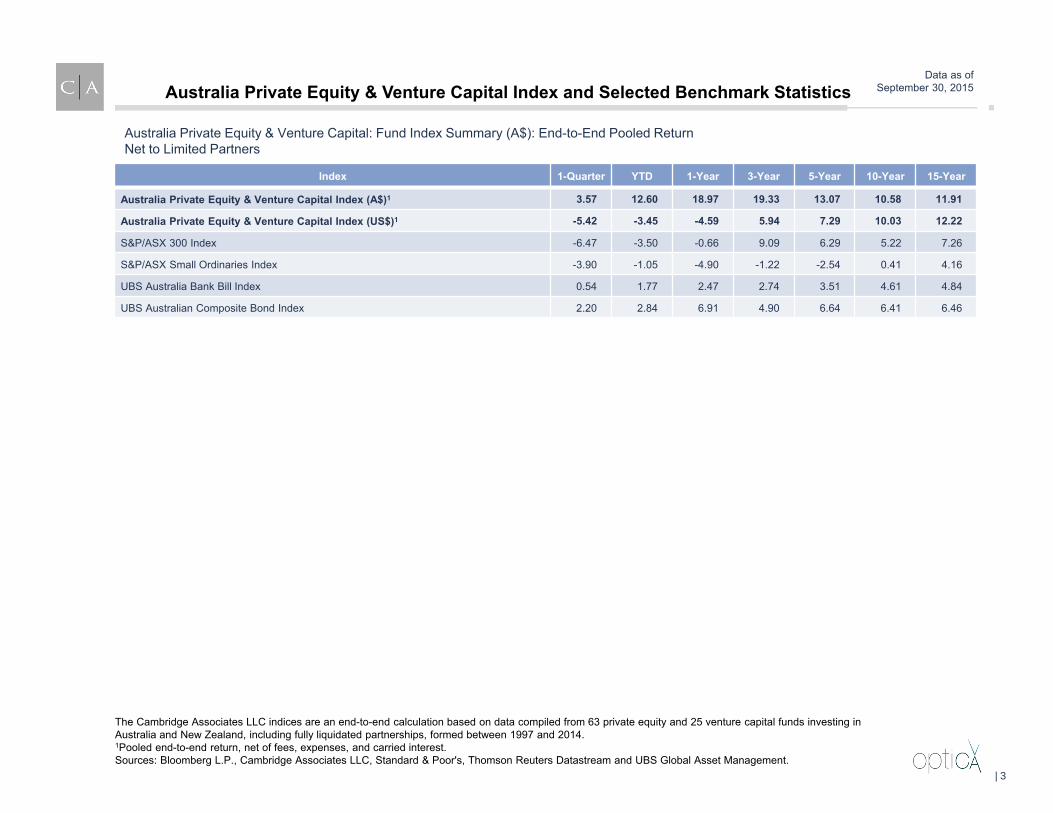
Index 1-Quarter YTD 1-Year 3-Year 5-Year 10-Year 15-Year
Australia Private Equity & Venture Capital Index (A$)1 3.57 12.60 18.97 19.33 13.07 10.58 11.91
Australia Private Equity & Venture Capital Index (US$)1 -5.42 -3.45 -4.59 5.94 7.29 10.03 12.22
S&P/ASX 300 Index -6.47 -3.50 -0.66 9.09 6.29 5.22 7.26
S&P/ASX Small Ordinaries Index -3.90 -1.05 -4.90 -1.22 -2.54 0.41 4.16
UBS Australia Bank Bill Index 0.54 1.77 2.47 2.74 3.51 4.61 4.84
UBS Australian Composite Bond Index 2.20 2.84 6.91 4.90 6.64 6.41 6.46
Australia Private Equity & Venture Capital: Fund Index Summary (A$): End-to-End Pooled ReturnNet to Limited Partners
The Cambridge Associates LLC indices are an end-to-end calculation based on data compiled from 63 private equity and 25 venture capital funds investing in Australia and New Zealand, including fully liquidated partnerships, formed between 1997 and 2014. 1Pooled end-to-end return, net of fees, expenses, and carried interest.Sources: Bloomberg L.P., Cambridge Associates LLC, Standard & Poor's, Thomson Reuters Datastream and UBS Global Asset Management.
Australia Private Equity & Venture Capital Index and Selected Benchmark Statistics
| 3
Data as ofSeptember 30, 2015
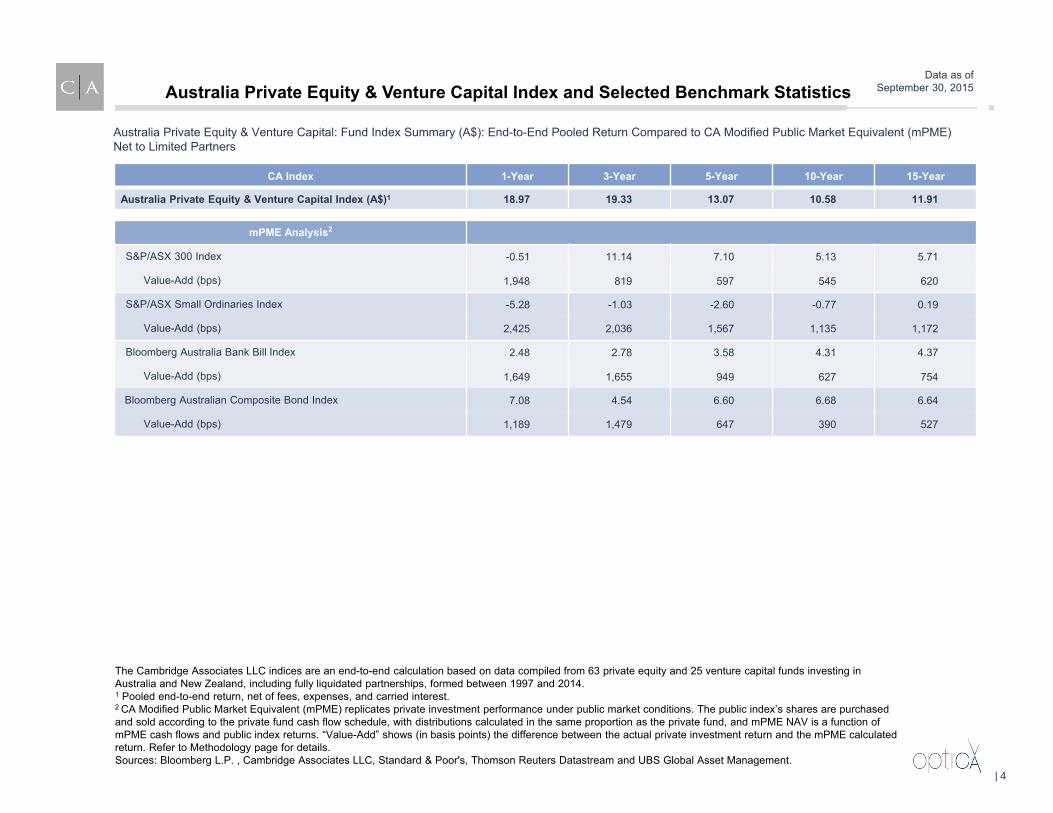
CA Index 1-Year 3-Year 5-Year 10-Year 15-Year
Australia Private Equity & Venture Capital Index (A$)1 18.97 19.33 13.07 10.58 11.91
mPME Analysis2
S&P/ASX 300 Index -0.51 11.14 7.10 5.13 5.71
Value-Add (bps) 1,948 819 597 545 620
S&P/ASX Small Ordinaries Index -5.28 -1.03 -2.60 -0.77 0.19
Value-Add (bps) 2,425 2,036 1,567 1,135 1,172
Bloomberg Australia Bank Bill Index 2.48 2.78 3.58 4.31 4.37
Value-Add (bps) 1,649 1,655 949 627 754
Bloomberg Australian Composite Bond Index 7.08 4.54 6.60 6.68 6.64
Value-Add (bps) 1,189 1,479 647 390 527
Australia Private Equity & Venture Capital: Fund Index Summary (A$): End-to-End Pooled Return Compared to CA Modified Public Market Equivalent (mPME)Net to Limited Partners
The Cambridge Associates LLC indices are an end-to-end calculation based on data compiled from 63 private equity and 25 venture capital funds investing in Australia and New Zealand, including fully liquidated partnerships, formed between 1997 and 2014. 1 Pooled end-to-end return, net of fees, expenses, and carried interest.2 CA Modified Public Market Equivalent (mPME) replicates private investment performance under public market conditions. The public index’s shares are purchased and sold according to the private fund cash flow schedule, with distributions calculated in the same proportion as the private fund, and mPME NAV is a function of mPME cash flows and public index returns. “Value-Add” shows (in basis points) the difference between the actual private investment return and the mPME calculated return. Refer to Methodology page for details.Sources: Bloomberg L.P. , Cambridge Associates LLC, Standard & Poor's, Thomson Reuters Datastream and UBS Global Asset Management.
Australia Private Equity & Venture Capital Index and Selected Benchmark Statistics
| 4
Data as ofSeptember 30, 2015
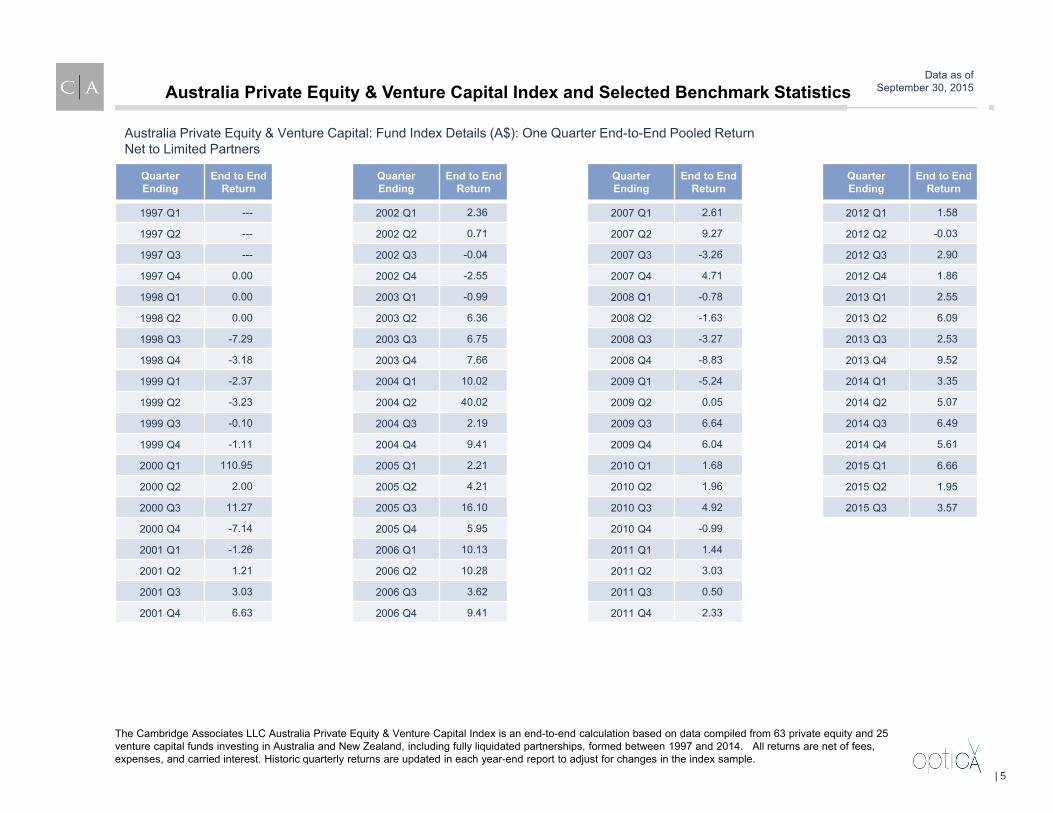
Australia Private Equity & Venture Capital: Fund Index Details (A$): One Quarter End-to-End Pooled ReturnNet to Limited Partners
The Cambridge Associates LLC Australia Private Equity & Venture Capital Index is an end-to-end calculation based on data compiled from 63 private equity and 25 venture capital funds investing in Australia and New Zealand, including fully liquidated partnerships, formed between 1997 and 2014. All returns are net of fees, expenses, and carried interest. Historic quarterly returns are updated in each year-end report to adjust for changes in the index sample.
QuarterEnding
End to EndReturn
QuarterEnding
End to EndReturn
QuarterEnding
End to EndReturn
QuarterEnding
End to EndReturn
1997 Q1 --- 2002 Q1 2.36 2007 Q1 2.61 2012 Q1 1.58
1997 Q2 --- 2002 Q2 0.71 2007 Q2 9.27 2012 Q2 -0.03
1997 Q3 --- 2002 Q3 -0.04 2007 Q3 -3.26 2012 Q3 2.90
1997 Q4 0.00 2002 Q4 -2.55 2007 Q4 4.71 2012 Q4 1.86
1998 Q1 0.00 2003 Q1 -0.99 2008 Q1 -0.78 2013 Q1 2.55
1998 Q2 0.00 2003 Q2 6.36 2008 Q2 -1.63 2013 Q2 6.09
1998 Q3 -7.29 2003 Q3 6.75 2008 Q3 -3.27 2013 Q3 2.53
1998 Q4 -3.18 2003 Q4 7.66 2008 Q4 -8.83 2013 Q4 9.52
1999 Q1 -2.37 2004 Q1 10.02 2009 Q1 -5.24 2014 Q1 3.35
1999 Q2 -3.23 2004 Q2 40.02 2009 Q2 0.05 2014 Q2 5.07
1999 Q3 -0.10 2004 Q3 2.19 2009 Q3 6.64 2014 Q3 6.49
1999 Q4 -1.11 2004 Q4 9.41 2009 Q4 6.04 2014 Q4 5.61
2000 Q1 110.95 2005 Q1 2.21 2010 Q1 1.68 2015 Q1 6.66
2000 Q2 2.00 2005 Q2 4.21 2010 Q2 1.96 2015 Q2 1.95
2000 Q3 11.27 2005 Q3 16.10 2010 Q3 4.92 2015 Q3 3.57
2000 Q4 -7.14 2005 Q4 5.95 2010 Q4 -0.99
2001 Q1 -1.26 2006 Q1 10.13 2011 Q1 1.44
2001 Q2 1.21 2006 Q2 10.28 2011 Q2 3.03
2001 Q3 3.03 2006 Q3 3.62 2011 Q3 0.50
2001 Q4 6.63 2006 Q4 9.41 2011 Q4 2.33
Australia Private Equity & Venture Capital Index and Selected Benchmark Statistics
| 5
Data as ofSeptember 30, 2015
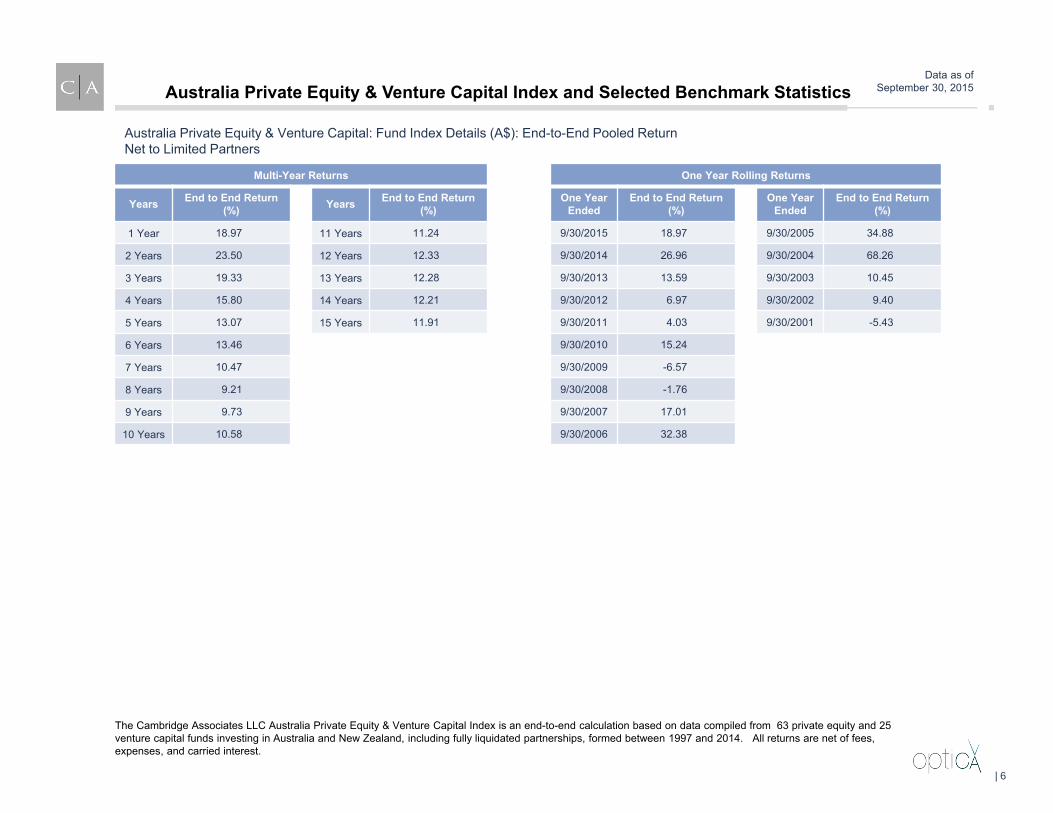
Australia Private Equity & Venture Capital: Fund Index Details (A$): End-to-End Pooled Return Net to Limited Partners
Multi-Year Returns
Years End to End Return (%) Years End to End Return
(%)
1 Year 18.97 11 Years 11.24
2 Years 23.50 12 Years 12.33
3 Years 19.33 13 Years 12.28
4 Years 15.80 14 Years 12.21
5 Years 13.07 15 Years 11.91
6 Years 13.46
7 Years 10.47
8 Years 9.21
9 Years 9.73
10 Years 10.58
One Year Rolling Returns
One Year Ended
End to End Return (%)
One Year Ended
End to End Return (%)
9/30/2015 18.97 9/30/2005 34.88
9/30/2014 26.96 9/30/2004 68.26
9/30/2013 13.59 9/30/2003 10.45
9/30/2012 6.97 9/30/2002 9.40
9/30/2011 4.03 9/30/2001 -5.43
9/30/2010 15.24
9/30/2009 -6.57
9/30/2008 -1.76
9/30/2007 17.01
9/30/2006 32.38
The Cambridge Associates LLC Australia Private Equity & Venture Capital Index is an end-to-end calculation based on data compiled from 63 private equity and 25 venture capital funds investing in Australia and New Zealand, including fully liquidated partnerships, formed between 1997 and 2014. All returns are net of fees, expenses, and carried interest.
Australia Private Equity & Venture Capital Index and Selected Benchmark Statistics
| 6
Australia Private Equity & Venture Capital:
Fund Since Inception Analysis
| 7

Data as ofSeptember 30, 2015
Australia Private Equity & Venture Capital (A$): Since Inception IRR & Multiples Compared to CA Modified Public Market Equivalent (mPME)Net to Limited Partners
Pooled IRR (%) and IRR-Based Value-Add (bps)
Vintage Year
Number of
Funds
CABenchmark
S&P/ASX 300 Index
S&P/ASX Small Ordinaries Index
IRR mPME IRR Value-Add mPME IRR Value-Add
1997 1 --- --- --- --- ---
1998 7 25.27 11.87 1,340 11.26 1,401
1999 2 --- --- --- --- ---
2000 1 --- --- --- --- ---
2001 4 25.56 9.88 1,568 12.40 1,317
2002 5 10.50 8.59 191 6.77 373
2003 2 --- --- --- --- ---
2004 5 8.82 5.27 355 2.88 594
2005 12 5.53 3.79 174 -1.26 679
2006 9 8.22 4.03 419 -1.47 969
2007 15 13.22 6.15 707 -1.17 1,439
2008 4 16.09 9.34 674 0.20 1,589
2009 4 10.63 7.27 336 -2.25 1,289
2010 4 35.13 10.56 2,457 -0.10 3,522
2011 8 14.60 4.62 998 -2.47 1,707
2012 3 -2.36 1.73 -409 -2.85 50
2013 --- --- --- --- --- ---
Notes: Based on data compiled from 61 private equity and 25 venture capital funds investing in Australia and New Zealand, including fully liquidated partnerships, formed between 1997 and 2013. Internal rates of returns are net of fees, expenses and carried interest. CA research shows that most funds take at least six years to settle into their final quartile ranking, and previous to this settling they typically rank in 2-3 other quartiles; therefore fund or benchmark performance metrics from more recent vintage years may be less meaningful. Benchmarks with --- (not applicable) have an insufficient number of funds in the vintage year sample to produce a meaningful return.mPME Note: Refer to Methodology page for further details on Cambridge Associates Modified PME (mPME).Sources: Bloomberg L.P., Cambridge Associates LLC, Standard & Poor's, Thomson Reuters Datastream and UBS Global Asset Management.
Total Value to Paid In (TVPI)
CA Benchmark
S&P/ASX 300 Index
S&P/ASX Small
Ordinaries Index
TVPI mPME TVPI mPME TVPI
--- --- ---
1.78 1.44 1.42
--- --- ---
--- --- ---
1.85 1.37 1.43
1.33 1.35 1.23
--- --- ---
1.29 1.19 1.09
1.35 1.22 0.94
1.42 1.19 0.94
1.61 1.24 0.96
1.49 1.27 1.00
1.37 1.23 0.94
1.97 1.23 1.00
1.24 1.07 0.96
0.96 1.03 0.96
--- --- ---
Distributions to Paid In (DPI)
CA Benchmark
S&P/ASX 300 Index
S&P/ASX Small
Ordinaries Index
DPI mPME DPI mPME DPI
--- --- ---
1.76 1.43 1.41
--- --- ---
--- --- ---
1.83 1.33 1.40
1.21 1.06 1.04
--- --- ---
1.18 1.07 1.02
1.05 0.99 0.79
0.96 0.82 0.69
1.16 0.96 0.76
1.02 0.86 0.69
0.31 0.33 0.25
1.06 0.77 0.62
0.16 0.18 0.15
0.01 0.02 0.02
--- --- ---
Australia Private Equity & Venture Capital Index and Selected Benchmark Statistics
| 8
Data as ofSeptember 30, 2015
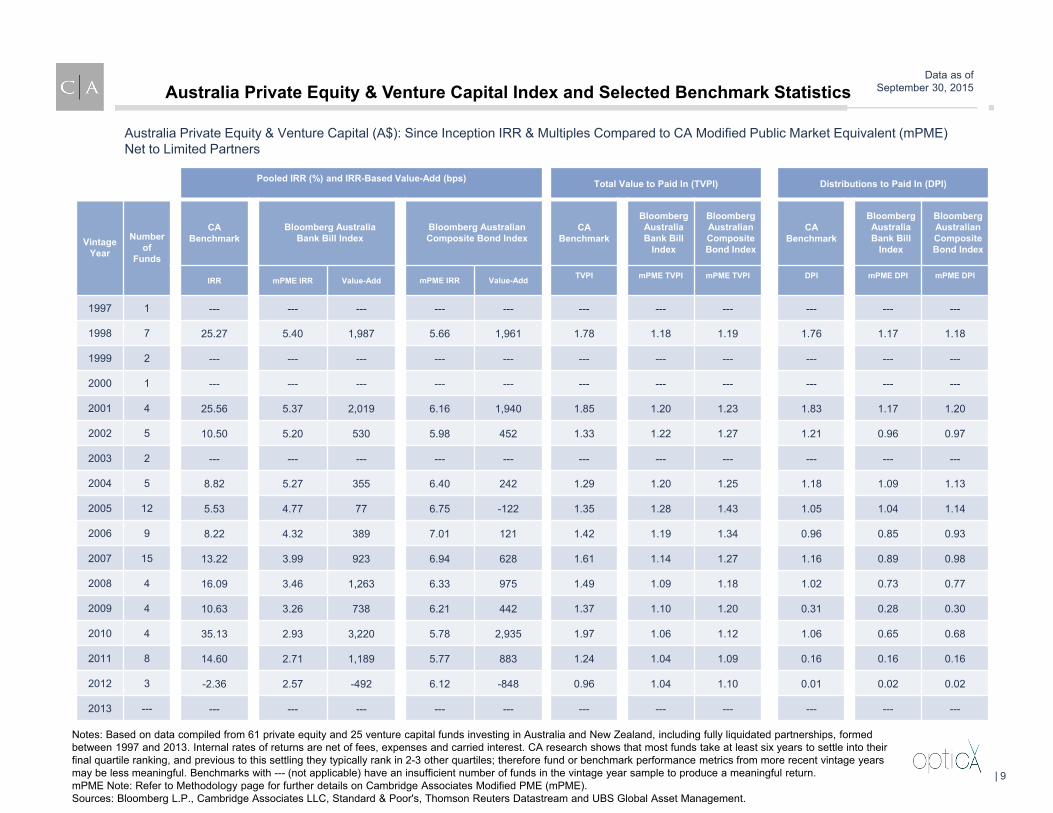
Australia Private Equity & Venture Capital (A$): Since Inception IRR & Multiples Compared to CA Modified Public Market Equivalent (mPME)Net to Limited Partners
Pooled IRR (%) and IRR-Based Value-Add (bps)
Vintage Year
Number of
Funds
CABenchmark
Bloomberg Australia Bank Bill Index
Bloomberg Australian Composite Bond Index
IRR mPME IRR Value-Add mPME IRR Value-Add
1997 1 --- --- --- --- ---
1998 7 25.27 5.40 1,987 5.66 1,961
1999 2 --- --- --- --- ---
2000 1 --- --- --- --- ---
2001 4 25.56 5.37 2,019 6.16 1,940
2002 5 10.50 5.20 530 5.98 452
2003 2 --- --- --- --- ---
2004 5 8.82 5.27 355 6.40 242
2005 12 5.53 4.77 77 6.75 -122
2006 9 8.22 4.32 389 7.01 121
2007 15 13.22 3.99 923 6.94 628
2008 4 16.09 3.46 1,263 6.33 975
2009 4 10.63 3.26 738 6.21 442
2010 4 35.13 2.93 3,220 5.78 2,935
2011 8 14.60 2.71 1,189 5.77 883
2012 3 -2.36 2.57 -492 6.12 -848
2013 --- --- --- --- --- ---
Total Value to Paid In (TVPI)
CA Benchmark
BloombergAustraliaBank Bill
Index
BloombergAustralianComposite Bond Index
TVPI mPME TVPI mPME TVPI
--- --- ---
1.78 1.18 1.19
--- --- ---
--- --- ---
1.85 1.20 1.23
1.33 1.22 1.27
--- --- ---
1.29 1.20 1.25
1.35 1.28 1.43
1.42 1.19 1.34
1.61 1.14 1.27
1.49 1.09 1.18
1.37 1.10 1.20
1.97 1.06 1.12
1.24 1.04 1.09
0.96 1.04 1.10
--- --- ---
Distributions to Paid In (DPI)
CA Benchmark
BloombergAustralia Bank Bill
Index
Bloomberg Australian Composite Bond Index
DPI mPME DPI mPME DPI
--- --- ---
1.76 1.17 1.18
--- --- ---
--- --- ---
1.83 1.17 1.20
1.21 0.96 0.97
--- --- ---
1.18 1.09 1.13
1.05 1.04 1.14
0.96 0.85 0.93
1.16 0.89 0.98
1.02 0.73 0.77
0.31 0.28 0.30
1.06 0.65 0.68
0.16 0.16 0.16
0.01 0.02 0.02
--- --- ---
Notes: Based on data compiled from 61 private equity and 25 venture capital funds investing in Australia and New Zealand, including fully liquidated partnerships, formed between 1997 and 2013. Internal rates of returns are net of fees, expenses and carried interest. CA research shows that most funds take at least six years to settle into their final quartile ranking, and previous to this settling they typically rank in 2-3 other quartiles; therefore fund or benchmark performance metrics from more recent vintage years may be less meaningful. Benchmarks with --- (not applicable) have an insufficient number of funds in the vintage year sample to produce a meaningful return.mPME Note: Refer to Methodology page for further details on Cambridge Associates Modified PME (mPME).Sources: Bloomberg L.P., Cambridge Associates LLC, Standard & Poor's, Thomson Reuters Datastream and UBS Global Asset Management.
Australia Private Equity & Venture Capital Index and Selected Benchmark Statistics
| 9
Data as ofSeptember 30, 2015
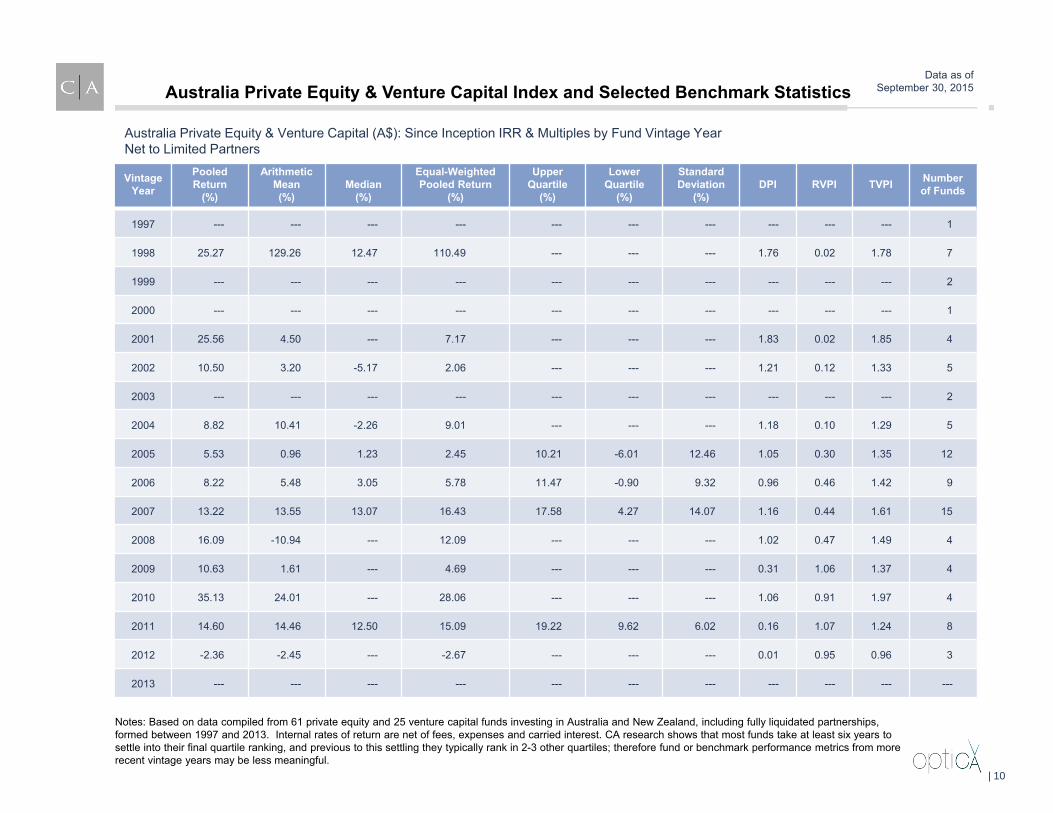
Australia Private Equity & Venture Capital (A$): Since Inception IRR & Multiples by Fund Vintage Year Net to Limited Partners
Australia Private Equity & Venture Capital Index and Selected Benchmark Statistics
Notes: Based on data compiled from 61 private equity and 25 venture capital funds investing in Australia and New Zealand, including fully liquidated partnerships, formed between 1997 and 2013. Internal rates of return are net of fees, expenses and carried interest. CA research shows that most funds take at least six years to settle into their final quartile ranking, and previous to this settling they typically rank in 2-3 other quartiles; therefore fund or benchmark performance metrics from more recent vintage years may be less meaningful.
VintageYear
Pooled Return
(%)
Arithmetic Mean (%)
Median (%)
Equal-WeightedPooled Return
(%)
UpperQuartile
(%)
Lower Quartile
(%)
Standard Deviation
(%)DPI RVPI TVPI Number
of Funds
1997 --- --- --- --- --- --- --- --- --- --- 1
1998 25.27 129.26 12.47 110.49 --- --- --- 1.76 0.02 1.78 7
1999 --- --- --- --- --- --- --- --- --- --- 2
2000 --- --- --- --- --- --- --- --- --- --- 1
2001 25.56 4.50 --- 7.17 --- --- --- 1.83 0.02 1.85 4
2002 10.50 3.20 -5.17 2.06 --- --- --- 1.21 0.12 1.33 5
2003 --- --- --- --- --- --- --- --- --- --- 2
2004 8.82 10.41 -2.26 9.01 --- --- --- 1.18 0.10 1.29 5
2005 5.53 0.96 1.23 2.45 10.21 -6.01 12.46 1.05 0.30 1.35 12
2006 8.22 5.48 3.05 5.78 11.47 -0.90 9.32 0.96 0.46 1.42 9
2007 13.22 13.55 13.07 16.43 17.58 4.27 14.07 1.16 0.44 1.61 15
2008 16.09 -10.94 --- 12.09 --- --- --- 1.02 0.47 1.49 4
2009 10.63 1.61 --- 4.69 --- --- --- 0.31 1.06 1.37 4
2010 35.13 24.01 --- 28.06 --- --- --- 1.06 0.91 1.97 4
2011 14.60 14.46 12.50 15.09 19.22 9.62 6.02 0.16 1.07 1.24 8
2012 -2.36 -2.45 --- -2.67 --- --- --- 0.01 0.95 0.96 3
2013 --- --- --- --- --- --- --- --- --- --- ---
| 10
Data as ofSeptember 30, 2015
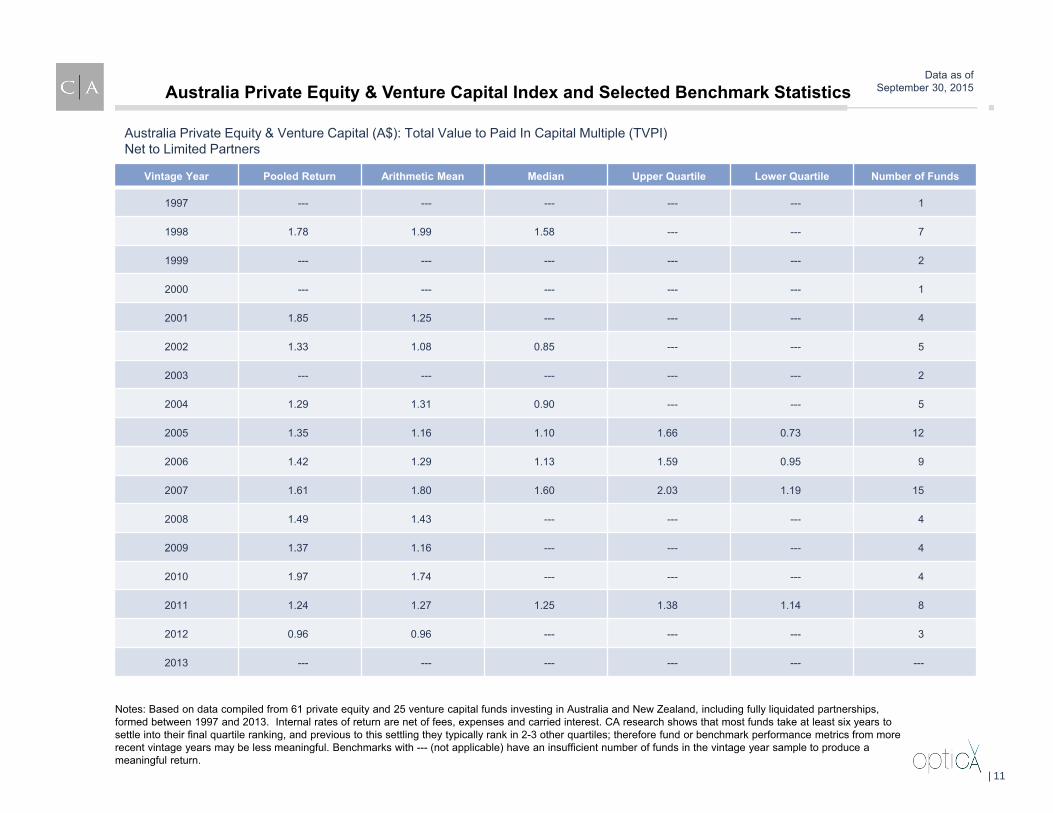
Vintage Year Pooled Return Arithmetic Mean Median Upper Quartile Lower Quartile Number of Funds
1997 --- --- --- --- --- 1
1998 1.78 1.99 1.58 --- --- 7
1999 --- --- --- --- --- 2
2000 --- --- --- --- --- 1
2001 1.85 1.25 --- --- --- 4
2002 1.33 1.08 0.85 --- --- 5
2003 --- --- --- --- --- 2
2004 1.29 1.31 0.90 --- --- 5
2005 1.35 1.16 1.10 1.66 0.73 12
2006 1.42 1.29 1.13 1.59 0.95 9
2007 1.61 1.80 1.60 2.03 1.19 15
2008 1.49 1.43 --- --- --- 4
2009 1.37 1.16 --- --- --- 4
2010 1.97 1.74 --- --- --- 4
2011 1.24 1.27 1.25 1.38 1.14 8
2012 0.96 0.96 --- --- --- 3
2013 --- --- --- --- --- ---
Australia Private Equity & Venture Capital (A$): Total Value to Paid In Capital Multiple (TVPI)Net to Limited Partners
Australia Private Equity & Venture Capital Index and Selected Benchmark Statistics
Notes: Based on data compiled from 61 private equity and 25 venture capital funds investing in Australia and New Zealand, including fully liquidated partnerships, formed between 1997 and 2013. Internal rates of return are net of fees, expenses and carried interest. CA research shows that most funds take at least six years to settle into their final quartile ranking, and previous to this settling they typically rank in 2-3 other quartiles; therefore fund or benchmark performance metrics from more recent vintage years may be less meaningful. Benchmarks with --- (not applicable) have an insufficient number of funds in the vintage year sample to produce a meaningful return.
| 11
Data as ofSeptember 30, 2015
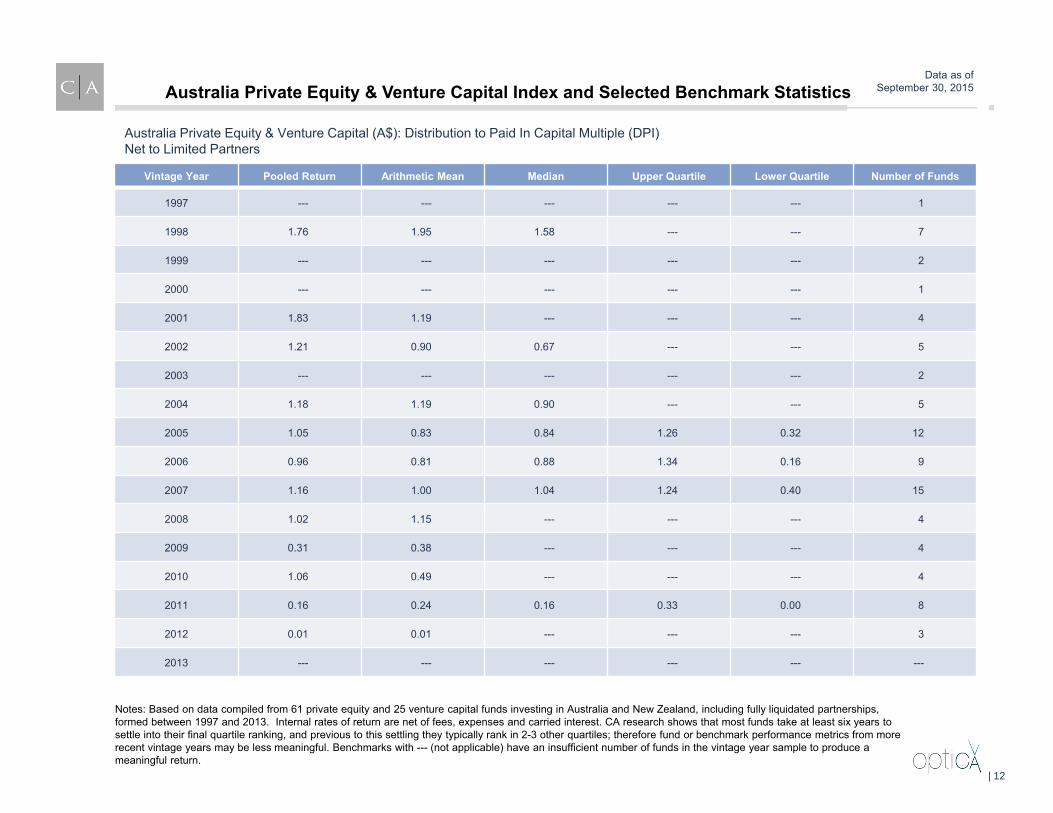
Australia Private Equity & Venture Capital (A$): Distribution to Paid In Capital Multiple (DPI)Net to Limited Partners
Australia Private Equity & Venture Capital Index and Selected Benchmark Statistics
Notes: Based on data compiled from 61 private equity and 25 venture capital funds investing in Australia and New Zealand, including fully liquidated partnerships, formed between 1997 and 2013. Internal rates of return are net of fees, expenses and carried interest. CA research shows that most funds take at least six years to settle into their final quartile ranking, and previous to this settling they typically rank in 2-3 other quartiles; therefore fund or benchmark performance metrics from more recent vintage years may be less meaningful. Benchmarks with --- (not applicable) have an insufficient number of funds in the vintage year sample to produce a meaningful return.
Vintage Year Pooled Return Arithmetic Mean Median Upper Quartile Lower Quartile Number of Funds
1997 --- --- --- --- --- 1
1998 1.76 1.95 1.58 --- --- 7
1999 --- --- --- --- --- 2
2000 --- --- --- --- --- 1
2001 1.83 1.19 --- --- --- 4
2002 1.21 0.90 0.67 --- --- 5
2003 --- --- --- --- --- 2
2004 1.18 1.19 0.90 --- --- 5
2005 1.05 0.83 0.84 1.26 0.32 12
2006 0.96 0.81 0.88 1.34 0.16 9
2007 1.16 1.00 1.04 1.24 0.40 15
2008 1.02 1.15 --- --- --- 4
2009 0.31 0.38 --- --- --- 4
2010 1.06 0.49 --- --- --- 4
2011 0.16 0.24 0.16 0.33 0.00 8
2012 0.01 0.01 --- --- --- 3
2013 --- --- --- --- --- ---
| 12
Data as ofSeptember 30, 2015
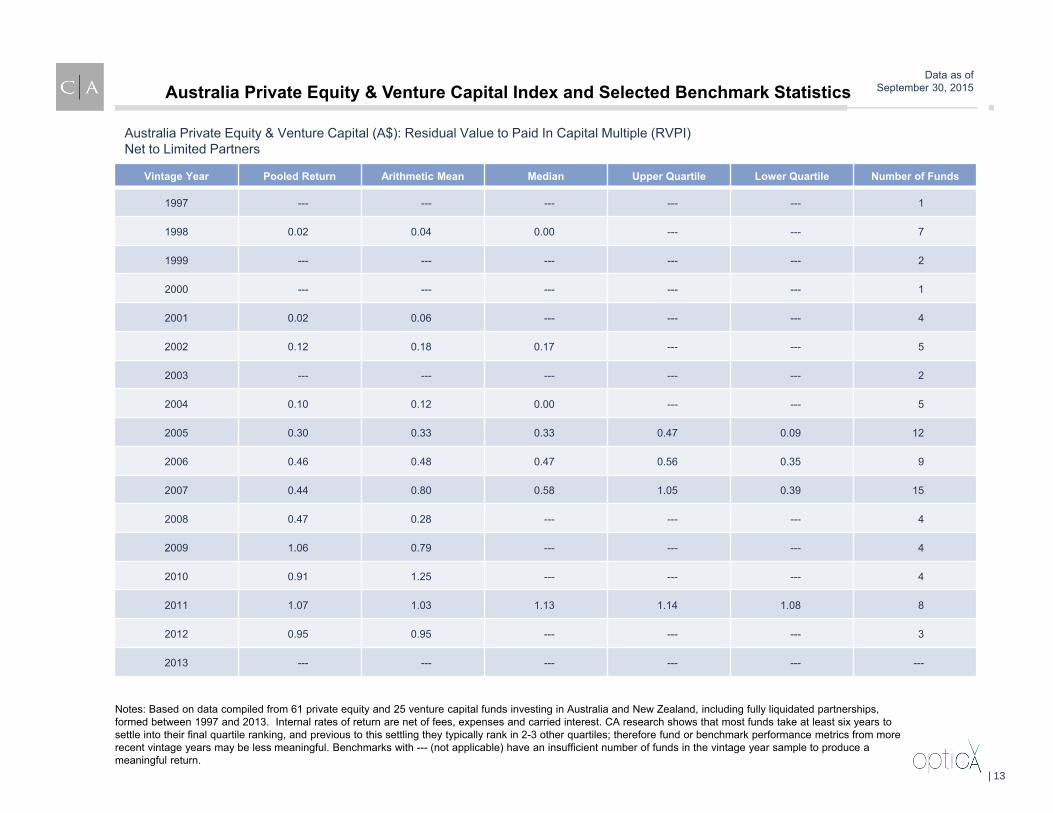
Australia Private Equity & Venture Capital (A$): Residual Value to Paid In Capital Multiple (RVPI)Net to Limited Partners
Australia Private Equity & Venture Capital Index and Selected Benchmark Statistics
Notes: Based on data compiled from 61 private equity and 25 venture capital funds investing in Australia and New Zealand, including fully liquidated partnerships, formed between 1997 and 2013. Internal rates of return are net of fees, expenses and carried interest. CA research shows that most funds take at least six years to settle into their final quartile ranking, and previous to this settling they typically rank in 2-3 other quartiles; therefore fund or benchmark performance metrics from more recent vintage years may be less meaningful. Benchmarks with --- (not applicable) have an insufficient number of funds in the vintage year sample to produce a meaningful return.
Vintage Year Pooled Return Arithmetic Mean Median Upper Quartile Lower Quartile Number of Funds
1997 --- --- --- --- --- 1
1998 0.02 0.04 0.00 --- --- 7
1999 --- --- --- --- --- 2
2000 --- --- --- --- --- 1
2001 0.02 0.06 --- --- --- 4
2002 0.12 0.18 0.17 --- --- 5
2003 --- --- --- --- --- 2
2004 0.10 0.12 0.00 --- --- 5
2005 0.30 0.33 0.33 0.47 0.09 12
2006 0.46 0.48 0.47 0.56 0.35 9
2007 0.44 0.80 0.58 1.05 0.39 15
2008 0.47 0.28 --- --- --- 4
2009 1.06 0.79 --- --- --- 4
2010 0.91 1.25 --- --- --- 4
2011 1.07 1.03 1.13 1.14 1.08 8
2012 0.95 0.95 --- --- --- 3
2013 --- --- --- --- --- ---
| 13

Australia Private Equity & Venture Capital:
Company Analysis
| 14
Data as ofSeptember 30, 2015
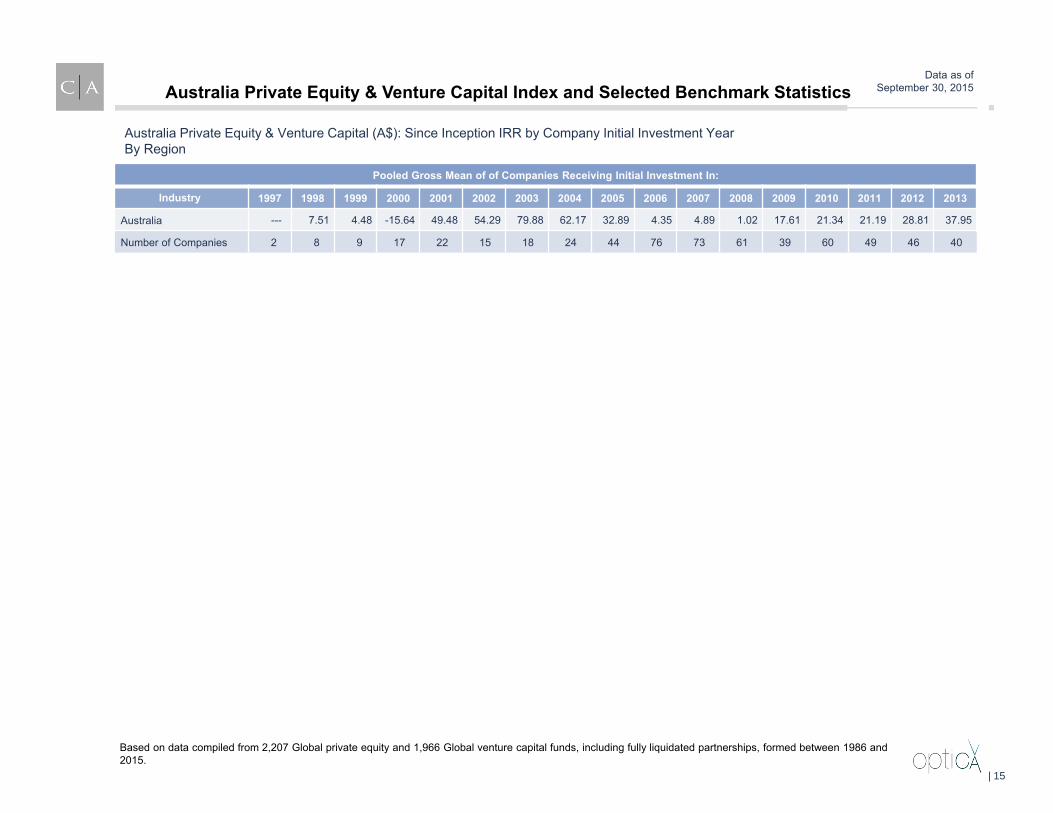
Pooled Gross Mean of of Companies Receiving Initial Investment In:
Industry 1997 1998 1999 2000 2001 2002 2003 2004 2005 2006 2007 2008 2009 2010 2011 2012 2013
Australia --- 7.51 4.48 -15.64 49.48 54.29 79.88 62.17 32.89 4.35 4.89 1.02 17.61 21.34 21.19 28.81 37.95
Number of Companies 2 8 9 17 22 15 18 24 44 76 73 61 39 60 49 46 40
Australia Private Equity & Venture Capital (A$): Since Inception IRR by Company Initial Investment YearBy Region
Australia Private Equity & Venture Capital Index and Selected Benchmark Statistics
Based on data compiled from 2,207 Global private equity and 1,966 Global venture capital funds, including fully liquidated partnerships, formed between 1986 and 2015.
| 15
Data as ofSeptember 30, 2015
Cambridge Associates LLC (CA) has established a database to monitor investments made by venture capital and other alternative asset partnerships. On September 30, 2015, 63 private equity and 25 venture capital funds investing in Australia and New Zealand, from the years 1997 through 2014 were included in the sample. Users of the analysis may find the following description of the data sources and calculation techniques helpful to their interpretation of information presented in the report:
1. Partnership financial statements and narratives are the primary source of information concerning cash flows and ending residual/ net asset values (NAV) for both partnerships and portfolio company investments.
2. Recognizing the alternative asset community's sensitivity to the distribution of information pertaining to individual fund investments, as a matter of policy CA only releases aggregated figures in its benchmark report.
3. Vintage year is defined as the legal inception date as noted in a fund's financial statement. This date can usually be found in the first note to the audited financial statements and is prior to the first close or capital call.
4. CA uses both the since inception internal rate of return and the end-to-end or horizon performance calculation in its benchmark reports:
a. The since inception internal rate of return (SI IRR) is a since inception calculation that solves for the discount rate, whichmakes the net present value of an investment equal to zero. The calculation is based on cash-on-cash returns over equalperiods modified for the residual value of the partnership’s equity or portfolio company’s NAV. The residual value attributedto each respective group being measured is incorporated as its ending value. Transactions are accounted for on a quarterlybasis, and annualized values are used for reporting purposes. Please note that all transactions are recorded on the 45th day ormidpoint of the quarter.
b. Cambridge Associates uses the end –to-end or horizon internal rate of return calculation to calculate the official quarterly,annual, and multi-year index figures. The horizon IRR performance calculation is a money-weighted return similar to the sinceinception IRR; however, it is measuring performance between two points in time. The calculation incorporates the beginningNAV (if any, treated as an inflow), interim cash flows and the ending NAV (if any, treated as an outflow). All interim cashflows are recorded on the mid-period date of the quarter. In order for a fund to be included in a horizon IRR calculation, thefund must have at least one quarterly contribution, distribution or NAV during the time frame being measured. Similar to thesince inception IRR, the horizon IRR is annualized for time frames greater than one year.
Description of Performance Measurement Methodology
Australia Private Equity & Venture Capital Index and Selected Benchmark Statistics
| 16
Data as ofSeptember 30, 2015
5. Additional Calculation Definitions:In order to provide meaningful statistics, Cambridge Associates has applied minimum fund count thresholds for each calculation.. See
minimum counts in parenthesis after each calculation.a. Pooled return aggregates all cash flows and ending NAVs in a sample to calculate a dollar-weighted return.(minimum 3 funds)b. Arithmetic mean averages the individual fund IRRs included in a vintage year. (minimum 3 funds)c. Median is the middle fund IRR of the group of individual fund IRRs included in a vintage year. (minimum 5 funds)d. Equal-weighted pooled return equally weights all cash flows and ending NAVs based on paid in capital to calculate a dollar-
weighted return. (minimum 3 funds)e. Upper/ lower quartile are the thresholds for the upper (top 25%) and lower (bottom 25%) quartiles based on the individual
fund IRRs included in a vintage year. Can be used in conjunction with the median to determine quartile placement. (minimum8 funds)
f. Standard deviation is measure of the dispersion of the individual returns. The calculation employs the standardmethodology for calculating a sample mean (not a population mean). (minimum 3 funds)
6. Realization ratio exhibits (TVPI, DPI, RVPI): CA has independently calculated the proper realization ratio for each fund in eachvintage year. Please note that each fund has been ranked within its respective vintage year by the corresponding realization ratio, asopposed to being ranked by IRR as they are ranked in the since inception IRR exhibit. As a result a fund's ranking within its vintageyear may change. For example, it is possible that a vintage year can have a different median fund when ranked by IRR vs. when rankedby TVPI, DPI or RVPI.
7. Cambridge Associates Modified Public Market Equivalent (mPME): The mPME calculation is a private-to-public comparison that seeks to replicate private investment performance under public market conditions. The public index’s shares are purchased and sold according to the private fund cash flow schedule, with distributions calculated in the same proportion as the private fund, and the mPME NAV (the value of the shares held by the public equivalent) is a function of mPME cash flows and public index returns. The mPME attempts to evaluate what return would have been earned had the dollars been deployed in the public markets instead of in private investments while avoiding the “negative NAV” issue inherent in some PME methodologies. “Value-Add” shows (in basis points) the difference between the actual private investment return and the mPME calculated return.
8. Exhibits detailing data for portfolio companies are grouped by year of the fund’s initial investment in a company, as opposed to vintageyear. Returns are gross returns.
Description of Performance Measurement Methodology (Continued)
Australia Private Equity & Venture Capital Index and Selected Benchmark Statistics
| 17

Copyright © 2016 by Cambridge Associates (“CA”). All rights reserved. Confidential.
This report may not be displayed, reproduced, distributed, transmitted, or used to create derivative works in any form, in whole or in portion, by any means, without written permission from CA. Copying of this publication is a violation of U.S. and global copyright laws (e.g., 17 U.S.C. 101 et seq.). Violators of this copyright may be subject to liability for substantial monetary damages. The information and material published in this report are confidential and non-transferable. Therefore, recipients may not disclose any information or material derived from this report to third parties, or use information or material from this report, without prior written authorization. This report is provided for informational purposes only. It is not intended to constitute an offer of securities of any of the issuers that may be described in the report. No part of this report is intended as a recommendation of any firm or any security, unless expressly stated otherwise. Nothing contained in this report should be construed as the provision of tax or legal advice. Past performance is not indicative of future performance. Any information or opinions provided in this report are as of the date of the report and CA is under no obligation to update the information or communicate that any updates have been made. Information contained herein may have been provided by third parties, including investment firms providing information on returns and assets under management, and may not have been independently verified. CA can neither assure nor accept responsibility for accuracy, but substantial legal liability may apply to misrepresentations of results made by a manager that are delivered to CA electronically, by wire, or through the mail. Managers may report returns to CA gross (before the deduction of management fees), net (after the deduction of management fees), or both.
CA includes the following: Cambridge Associates, LLC, a Massachusetts limited liability company with offices in Arlington, VA; Boston, MA; Dallas, TX; and Menlo Park, CA. Cambridge Associates Fiduciary Trust, LLC, a New Hampshire limited liability company chartered to serve as a non-depository trust company, and a wholly-owned subsidiary of Cambridge Associates, LLC. Cambridge Associates Limited, a limited company in England and Wales No. 06135829 authorised and regulated by the Financial Conduct Authority in the conduct of Investment Business. Cambridge Associates Limited, LLC, a Massachusetts limited liability company with a branch office in Sydney, Australia (ARBN 109 366 654). Cambridge Associates Asia Pte Ltd, a Singapore corporation (Registration No. 200101063G), and Cambridge Associates Investment Consultancy (Beijing) Ltd, a wholly owned subsidiary of Cambridge Associates, LLC registered with the Beijing Administration for Industry and Commerce (Registration No. 110000450174972).