Embed Size (px)
Citation preview
AUSTRALIA
This Data Spotlight note on Early Childhood Education and Care (ECEC) provides a summary of
ECEC policy inputs, outputs and outcomes in Australia. It uses data available within the OECD
Secretariat — Education at a Glance, the Programme for International Student Assessment (PISA) and
the OECD Family Database — to make comparisons between Australia’s ECEC system and the systems
in other OECD countries (see Box 1 for definition and comparability issues). This note complements the
2015 OECD publication, Starting Strong IV: Monitoring Quality in Early Childhood Education and Care.
Key characteristics of ECEC in Australia:
Resourcing of the ECEC system - The share of gross domestic product (GDP) devoted to ECEC (ISCED 0) is comparatively low (0.5% of GDP
compared with 0.8% on average across the OECD), as children in Australia are in an ECEC program for a shorter period and transition to school earlier than in many OECD countries.
- However, overall, annual per child expenditure on ECEC (ISCED 0) in Australia is higher than the OECD average (USD 12 364 and USD 8 618, respectively). In 2013, Australia was the fifth highest spender in ECEC per child in the OECD, showing high levels of investment in early years learning, especially in pre-primary education.
- A significant share of the funding for pre-primary education comes from private sources, which are in turn partly subsidised by the Australian Government.
1
- In pre-primary education (ISCED 02), there are about 5 children per teacher in Australia, which is 9 children fewer per teacher than the OECD average of 14 children per teacher, excluding the non-teaching staff, such as auxiliary staff.
Access and participation - Participation of 0-2 year-olds in formal childcare (ISCED 01) is around the OECD average (33%). Similarly,
participation of 3-4 year olds in pre-primary education (ISCED 02) is close to the average (e.g. for 3-year-olds rates were 69% in Australia compared with 71% across the OECD).
- Australia’s participation rates at age 4 have risen dramatically since 2005 (from 53% in 2005 to 85% in 2014), representing the fourth highest increase in the OECD.
Teacher’s academic qualification and working conditions - All teachers of pre-primary education who enter the profession have a Bachelor’s degree in Australia, as in most other
OECD countries. - Pre-primary teachers in Australia have an above average statutory salary, and a below average annual number of
teaching hours compared to the OECD average. A pre-primary education teacher in Australia can expect to earn an annual statutory starting salary around USD 43 000, considerably higher than the average starting salary of their colleagues across the OECD (around USD 29 494).
Monitoring Quality - Monitoring of ECEC settings is common practice in Australia where all ECEC settings are monitored by inspectors. As
inspections are in part subjective in nature, it is important that inspectors have a consistent understanding of what a quality service is to ensure that ratings are consistent (see Monitoring Quality in Early Childhood Education and Care Country Note: Australia).
Student performance at age 15 by participation in pre-primary education - The percentage of 15-year-olds in Australia who reported not attending pre-primary education in PISA 2012 was
low (4.5% compared with 7.1% across the OECD). Notably, children from a lower socio-economic background and in socio-economically disadvantaged schools were less likely to have participated in pre-primary education. Nevertheless, after accounting for socio-economic background, the relationship between attending pre-primary education and mathematics performance of 15 year-olds is significant and similar to the OECD average (32 and 31 score points respectively – equivalent to almost one year of formal schooling).
AUSTRALIA
2 © OECD 2016
Introduction
Participation in ECEC can have a positive effect on children’s early learning and development, as
well as on subsequent outcomes, such as academic success, labour market performance and
socio-economic mobility. The benefits of ECEC on child outcomes, however, depend on high quality.
Settings and programmes that have a high level of quality are positively associated with children’s
cognitive, social and behavioural development, with disadvantaged children benefitting significantly
from high-quality settings (OECD, 2011; Gambaro et al., 2014). Policy outcomes are associated with
both policy inputs and policy outputs.
For simplicity purposes, this note uses the term early childhood education and care (ECEC) to refer
to arrangements providing care and education for children under compulsory school age. This term
differs from those used by other sources in this note, including the ISCED 2011 classification (see Box 1
for the ISCED 2011 methodological distinction between childcare and pre-primary education). Because of
these differences in definitions, caution is needed when comparing data presented here.
The note is structured in three sections:
Policy inputs: This section presents indicators of the resources that are put into a system, the
level and type of sources that finance ECEC, and the regulations of staff-child ratios to achieve
outputs or results.
Policy outputs: This section covers indicators that are the result of policy inputs put in place,
such as enrolment rates by age. Trend data is presented to examine the changes in early
childhood education in recent years.
Policy outcomes: This section covers indicators on the outcomes of children that are associated
with both policy inputs and policy outputs. For example, indicators on student performance at
age 15 by participation in pre-primary education (drawn from PISA 2012).
Section 1. Policy inputs
Organisation of early childhood education and care services
The organisation of early childhood education and care services varies greatly from country to
country in terms of structures, but also regarding the age of children attending different types of settings
or the intensity of participation in different settings (see Box 1). Australia offers both education-only and
integrated ECEC programmes. Early childhood educational development programmes (ISCED 01) are
available for children from 0 to 3 years in a range of accredited childcare services (including long day
care and family day care), with an educational programme provided by qualified early childhood
educators. Pre-primary education or preschool (ISCED 02) education is offered to children from the age
of 3-4 years and delivered by qualified early childhood educators in a range of accredited institutions
(OECD, 2016a, Tables C2.4 and C2.5). Pre-primary education in Australia is of shorter duration to most
other OECD countries as children generally transition to school aged 4-5 years.
Public funding of early childhood education and care services
In Australia, public funding responsibilities are shared between the Australian Government and the
regional or state-level governments, while responsibilities for minimum standard setting, curriculum
development and monitoring of ECEC settings are at the regional or state level (OECD, 2015a, Table 1.2).
AUSTRALIA
© OECD 2016 3
Below-average expenditure on early childhood education and care as a percentage of GDP
The financial investment in ECEC settings and equipment is a key requirement for the development
of good and high-quality learning environments, and indicates that political priority is being given to the
care and education of young children. A sustainable level of public funding is essential to recruit
competent and qualified staff, ensure the quality of educational programmes, and promote their
development.
In Australia, public and private expenditure on early childhood education and care (ISCED 0) was
equal to 0.5% of GDP in 2013, which is below the OECD average of 0.8%. Only Estonia, Ireland, Japan
and Switzerland have lower expenditure levels on early childhood education and care (ISCED 0). Chile,
Denmark, Iceland, Israel, Norway, Slovenia and Sweden spent 1.0% or more of their GDP on early
childhood education and care (ISCED 0) (OECD, 2016a, Table C2.3). The shorter duration of
pre-primary education in Australia and earlier transition to school has the effect of reducing Australia’s
total expenditure on ECEC as a percentage of GDP.
Box 1. Distinction between early childhood educational development and pre-primary education:
The revised ISCED 2011 classification
There are many different ECEC systems and structures within OECD countries. Consequently, there is also a range of different approaches to identifying the boundary between early childhood education and childcare. The International Standard Classification of Education (ISCED) defines internationally comparable levels of education. In ISCED 2011, level 0 covers early childhood education for all ages, including very young children. As the educational properties of ISCED 0 programmes can be difficult to assess directly, several criteria are used to come up with a technical definition. For a programme to be reported as ISCED level 0 it must have: adequate intentional educational properties; be delivered by qualified staff members; take place in an institutionalised setting; meet a minimum intensity/duration; and be targeted at children from age 0 until entry into ISCED level 1 (OECD, 2016). Programmes classified at ISCED level 0 may be referred to in many ways nationally, for example: early childhood education and development, play school, reception, pre-primary, preschool, Kindergarten, Kita, Krippe or educación inicial. For programmes provided in crèches, day-care centres, private homes, nurseries, Tagespflege or guarderías, it is important to ensure that they meet the ISCED level 0 classification criteria specified in ISCED 2011. In ISCED 2011, programmes are sub-classified into two categories depending on age and the level of complexity of the educational content: early childhood educational development (ISCED 01) and pre-primary education (ISCED 02). ISCED 01 programmes are generally designed for children younger than 3 (OECD, 2016). This is a new category not covered by ISCED 1997. ISCED 02 is designed for children from age 3 years to the start of primary education. It corresponds exactly to level 0 in ISCED 1997. The comparability of programmes at ISCED level 0 depends on each country’s ability to report data according to the standard international definition. Early childhood programmes that are offered in some countries do not necessarily meet the criteria or definition of ISCED 01. This is the case of Belgium (except in the Flemish Community), the Czech Republic, France, Ireland, Italy, Japan, Luxembourg, the Netherlands, Poland, Portugal, the Slovak Republic, Switzerland and the United States. On the other hand, the coverage of ISCED 02 (pre-primary education) is larger, with 32 countries reporting data on enrolment rates at ages 3 and 4. Because of these differences, caution is needed when comparing available data on ISCED 01 drawn from Education at a Glance. The definition of ECEC in the OECD’s Starting Strong series differs from the ISCED 2011 definition. The OECD definition states that “the term early childhood education and care (ECEC) includes all arrangements providing care and education for children under compulsory school age, regardless of setting, funding, opening hours or programme content” (OECD, 2001). This means that settings considered an integral part of countries’ ECEC systems, but not covered by the ISCED classification, still fall under the terminology of ECEC. Data reported in Education at a Glance 2016, and presented here as ISCED level 0, use the ISCED 2011 classification (Figures 1, 2, 3 and 5). PISA 2012 uses the ISCED 1997 classification (Figure 6). The OECD Family Database definition of “formal” childcare among children aged 0-2 years includes centre-based services, organised day care, preschool and professional child-minders. That is, it includes ISCED 01 and other registered ECEC services (Figure 4). Sources: OECD (2016), Education at a Glance 2016: OECD Indicators, OECD Publishing, Paris, http://dx.doi.org/10.1878/eag-2016-en; OECD (2001), Starting Strong I: Early Childhood Education and Care, OECD Publishing, Paris, http://dx.doi.org/10.1787/9789264192829-en.
AUSTRALIA
4 © OECD 2016
Expenditure per child in early childhood education and care is higher than the OECD average
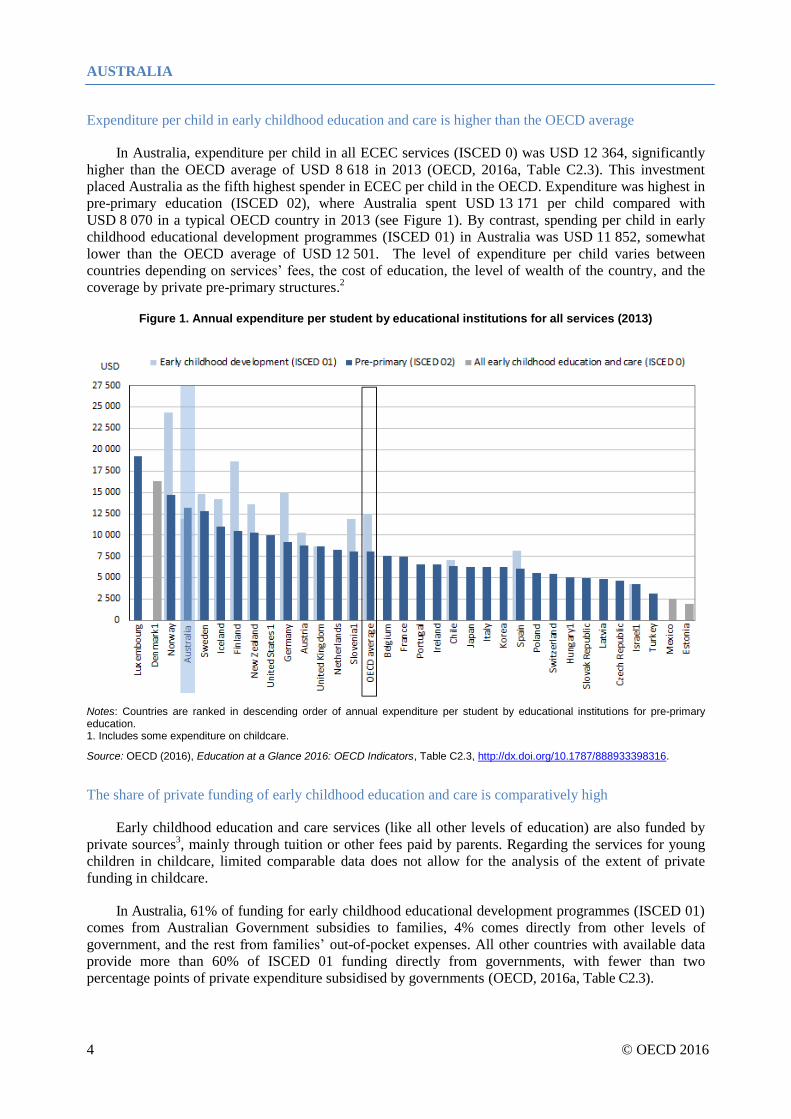
In Australia, expenditure per child in all ECEC services (ISCED 0) was USD 12 364, significantly
higher than the OECD average of USD 8 618 in 2013 (OECD, 2016a, Table C2.3). This investment
placed Australia as the fifth highest spender in ECEC per child in the OECD. Expenditure was highest in
pre-primary education (ISCED 02), where Australia spent USD 13 171 per child compared with
USD 8 070 in a typical OECD country in 2013 (see Figure 1). By contrast, spending per child in early
childhood educational development programmes (ISCED 01) in Australia was USD 11 852, somewhat
lower than the OECD average of USD 12 501. The level of expenditure per child varies between
countries depending on services’ fees, the cost of education, the level of wealth of the country, and the
coverage by private pre-primary structures.2
Figure 1. Annual expenditure per student by educational institutions for all services (2013)
Notes: Countries are ranked in descending order of annual expenditure per student by educational institutions for pre-primary education. 1. Includes some expenditure on childcare.
Source: OECD (2016), Education at a Glance 2016: OECD Indicators, Table C2.3, http://dx.doi.org/10.1787/888933398316.
The share of private funding of early childhood education and care is comparatively high
Early childhood education and care services (like all other levels of education) are also funded by
private sources3, mainly through tuition or other fees paid by parents. Regarding the services for young
children in childcare, limited comparable data does not allow for the analysis of the extent of private
funding in childcare.
In Australia, 61% of funding for early childhood educational development programmes (ISCED 01)
comes from Australian Government subsidies to families, 4% comes directly from other levels of
government, and the rest from families’ out-of-pocket expenses. All other countries with available data
provide more than 60% of ISCED 01 funding directly from governments, with fewer than two
percentage points of private expenditure subsidised by governments (OECD, 2016a, Table C2.3).
AUSTRALIA
© OECD 2016 5
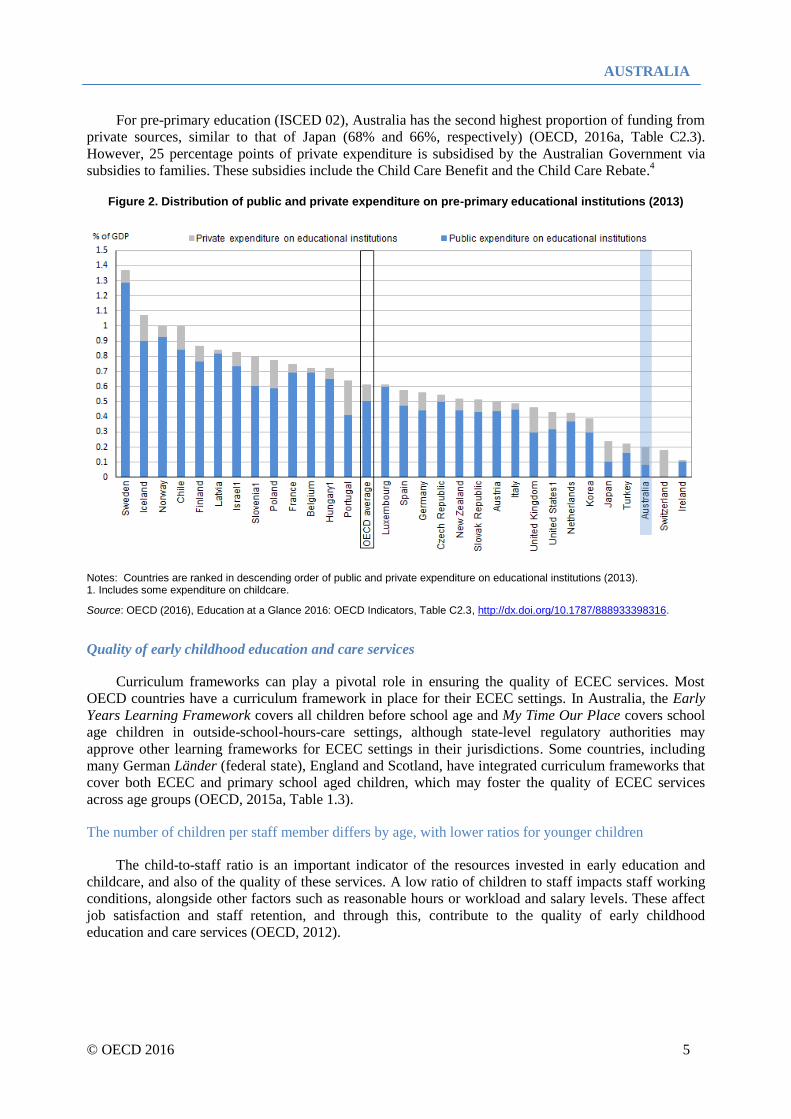
For pre-primary education (ISCED 02), Australia has the second highest proportion of funding from
private sources, similar to that of Japan (68% and 66%, respectively) (OECD, 2016a, Table C2.3).
However, 25 percentage points of private expenditure is subsidised by the Australian Government via
subsidies to families. These subsidies include the Child Care Benefit and the Child Care Rebate.4
Figure 2. Distribution of public and private expenditure on pre-primary educational institutions (2013)
Notes: Countries are ranked in descending order of public and private expenditure on educational institutions (2013). 1. Includes some expenditure on childcare.
Source: OECD (2016), Education at a Glance 2016: OECD Indicators, Table C2.3, http://dx.doi.org/10.1787/888933398316.
Quality of early childhood education and care services
Curriculum frameworks can play a pivotal role in ensuring the quality of ECEC services. Most
OECD countries have a curriculum framework in place for their ECEC settings. In Australia, the Early
Years Learning Framework covers all children before school age and My Time Our Place covers school
age children in outside-school-hours-care settings, although state-level regulatory authorities may
approve other learning frameworks for ECEC settings in their jurisdictions. Some countries, including
many German Länder (federal state), England and Scotland, have integrated curriculum frameworks that
cover both ECEC and primary school aged children, which may foster the quality of ECEC services
across age groups (OECD, 2015a, Table 1.3).
The number of children per staff member differs by age, with lower ratios for younger children
The child-to-staff ratio is an important indicator of the resources invested in early education and
childcare, and also of the quality of these services. A low ratio of children to staff impacts staff working
conditions, alongside other factors such as reasonable hours or workload and salary levels. These affect
job satisfaction and staff retention, and through this, contribute to the quality of early childhood
education and care services (OECD, 2012).
AUSTRALIA
6 © OECD 2016
Most countries have regulations in place regarding the maximum number of children per adult in
ECEC services. In Australia, ECEC settings are required to meet nationally consistent staff-to-child
ratios set out under the Education and Care Services National Regulations. In pre-primary education
settings (ISCED 02) there is a maximum of 11 children per staff member for children aged 3 years and
above. The staff-to-child ratio for children aged between 2 and 3 is 1:5 and for children under 2 the ratio
is 1:4.
Pre-primary teachers have a high level of education degree and below-average teaching hours
In OECD countries, the duration of initial teacher training varies more in pre-primary education
(ISCED 02) than at any other level of education: from two years for basic certification in Korea and
Japan to five years in Austria, Chile, France, Iceland and Italy. In Australia, the duration of initial ECEC
teacher training is four years. All teachers of pre-primary education who enter the profession have a
bachelor’s degree in Australia, as in most other OECD countries. In some countries, including England,
France, Iceland and Italy, initial teacher education of pre-primary teachers is at master level (OECD,
2014, Table D6.1a).
The annual number of teaching hours in Australia is below the OECD average. Australian
pre-primary teachers (ISCED02) have 40 weeks of teaching per year (similar to the OECD average) and
spend 885 hours in the classroom, which is around 10% below the OECD average of 1 005 hours
(OECD, 2016a, Table D4.1).
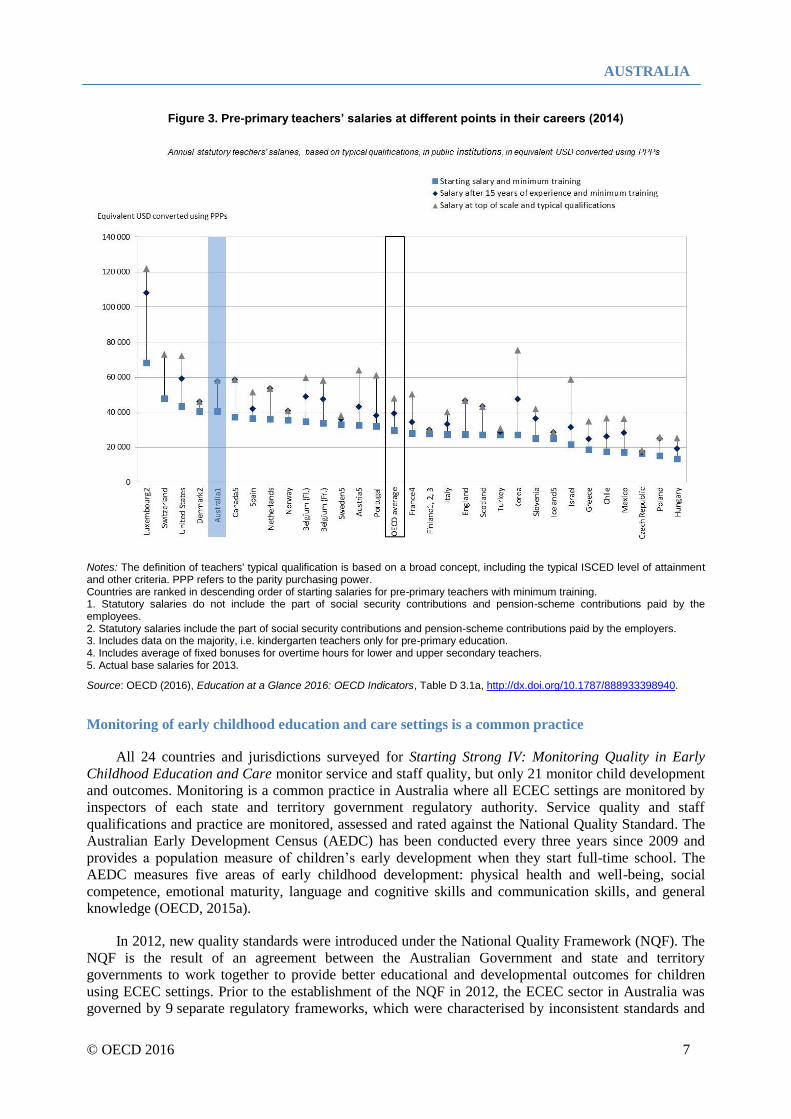
Salaries of pre-primary teachers are above the OECD average in absolute and relative terms
The statutory salary of teachers in pre-primary education5 in Australia in 2014 was significantly
higher than the OECD average, both for beginning teachers (USD 40 297 against USD 29 494, on
average) and for those with 10 or 15 years of experience (USD 57 445 in Australia against USD 36 491
and USD 39 245, on average). The statutory salary at the top of the scale is also above the OECD
average, with a top salary of USD 57 717 in Australia against an OECD average of USD 47 826 (see
Figure 3) (OECD, 2016a, Table D3.1). After including bonuses and allowances paid to teachers, the
average salary of pre-primary teachers in Australia is about one third higher than the OECD average
(USD 50 735 in Australia compared to an OECD average of USD 37 274) (OECD, 2016, Table D3.4). It
is important to note this data was provided by state and territory governments (as a state and territory
weighted average) and only relates to teachers in government sector pre-primary education.
To compare salary levels and the labour market situation between countries, teachers’ pay is
compared to earnings for similarly-educated workers based on teachers’ attainment level
(25-64 year-olds who work full time, full year). The salary for teachers in government sector pre-primary
education in Australia is 82% of the earnings of workers with tertiary education, which is slightly above
the OECD average of 74% (OECD, 2016a, Table D3.2).
AUSTRALIA
© OECD 2016 7
Figure 3. Pre-primary teachers’ salaries at different points in their careers (2014)
Notes: The definition of teachers' typical qualification is based on a broad concept, including the typical ISCED level of attainment and other criteria. PPP refers to the parity purchasing power. Countries are ranked in descending order of starting salaries for pre-primary teachers with minimum training. 1. Statutory salaries do not include the part of social security contributions and pension-scheme contributions paid by the employees. 2. Statutory salaries include the part of social security contributions and pension-scheme contributions paid by the employers. 3. Includes data on the majority, i.e. kindergarten teachers only for pre-primary education. 4. Includes average of fixed bonuses for overtime hours for lower and upper secondary teachers. 5. Actual base salaries for 2013.
Source: OECD (2016), Education at a Glance 2016: OECD Indicators, Table D 3.1a, http://dx.doi.org/10.1787/888933398940.
Monitoring of early childhood education and care settings is a common practice
All 24 countries and jurisdictions surveyed for Starting Strong IV: Monitoring Quality in Early
Childhood Education and Care monitor service and staff quality, but only 21 monitor child development
and outcomes. Monitoring is a common practice in Australia where all ECEC settings are monitored by
inspectors of each state and territory government regulatory authority. Service quality and staff
qualifications and practice are monitored, assessed and rated against the National Quality Standard. The
Australian Early Development Census (AEDC) has been conducted every three years since 2009 and
provides a population measure of children’s early development when they start full-time school. The
AEDC measures five areas of early childhood development: physical health and well-being, social
competence, emotional maturity, language and cognitive skills and communication skills, and general
knowledge (OECD, 2015a).
In 2012, new quality standards were introduced under the National Quality Framework (NQF). The
NQF is the result of an agreement between the Australian Government and state and territory
governments to work together to provide better educational and developmental outcomes for children
using ECEC settings. Prior to the establishment of the NQF in 2012, the ECEC sector in Australia was
governed by 9 separate regulatory frameworks, which were characterised by inconsistent standards and
AUSTRALIA
8 © OECD 2016
duplication. The NQF harmonised the separate regulatory frameworks into a single framework
underpinned by nationally consistent legislation, and an NQS (a set of benchmarks) against which
services are inspected (or assessed) and rated. Regulatory authorities in each state and territory inspect
and rate services in their own jurisdictions. As inspections are in part subjective in nature, it is important
that inspectors have a consistent understanding of what a quality service is to ensure that ratings are
consistent. This is discussed in further detail in Australia’s country note on Monitoring Quality in ECEC
(OECD, 2016b).
Section 2. Policy outputs
Participation in early childhood education and care services
Average participation rates of 0-2 year-olds in formal childcare6
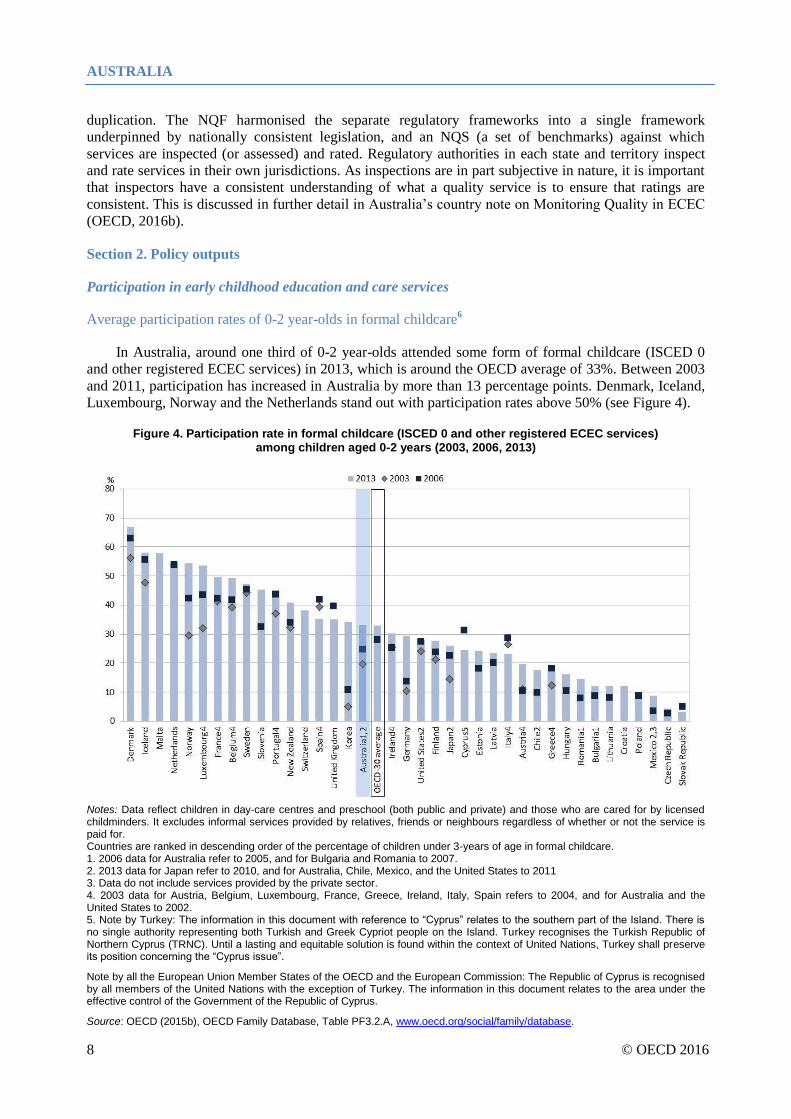
In Australia, around one third of 0-2 year-olds attended some form of formal childcare (ISCED 0
and other registered ECEC services) in 2013, which is around the OECD average of 33%. Between 2003
and 2011, participation has increased in Australia by more than 13 percentage points. Denmark, Iceland,
Luxembourg, Norway and the Netherlands stand out with participation rates above 50% (see Figure 4).
Figure 4. Participation rate in formal childcare (ISCED 0 and other registered ECEC services) among children aged 0-2 years (2003, 2006, 2013)
Notes: Data reflect children in day-care centres and preschool (both public and private) and those who are cared for by licensed childminders. It excludes informal services provided by relatives, friends or neighbours regardless of whether or not the service is paid for. Countries are ranked in descending order of the percentage of children under 3-years of age in formal childcare. 1. 2006 data for Australia refer to 2005, and for Bulgaria and Romania to 2007. 2. 2013 data for Japan refer to 2010, and for Australia, Chile, Mexico, and the United States to 2011 3. Data do not include services provided by the private sector. 4. 2003 data for Austria, Belgium, Luxembourg, France, Greece, Ireland, Italy, Spain refers to 2004, and for Australia and the United States to 2002. 5. Note by Turkey: The information in this document with reference to “Cyprus” relates to the southern part of the Island. There is no single authority representing both Turkish and Greek Cypriot people on the Island. Turkey recognises the Turkish Republic of Northern Cyprus (TRNC). Until a lasting and equitable solution is found within the context of United Nations, Turkey shall preserve its position concerning the “Cyprus issue”.
Note by all the European Union Member States of the OECD and the European Commission: The Republic of Cyprus is recognised by all members of the United Nations with the exception of Turkey. The information in this document relates to the area under the effective control of the Government of the Republic of Cyprus.
Source: OECD (2015b), OECD Family Database, Table PF3.2.A, www.oecd.org/social/family/database.
AUSTRALIA
© OECD 2016 9
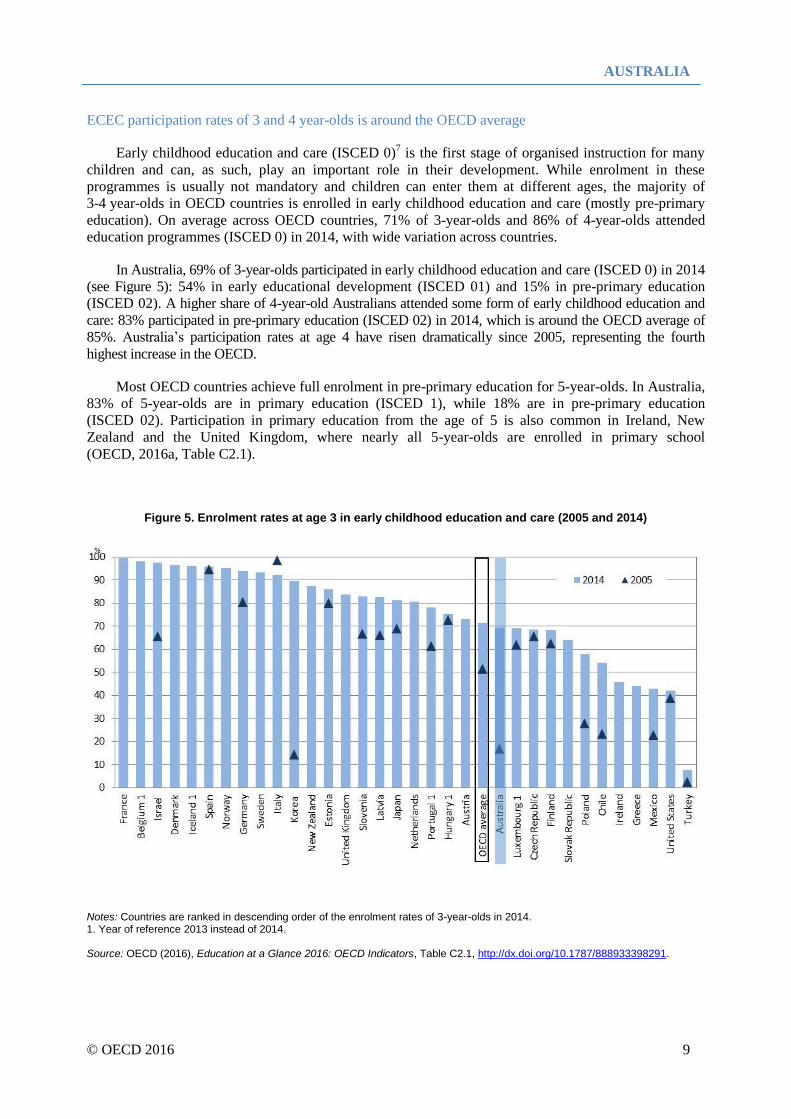
ECEC participation rates of 3 and 4 year-olds is around the OECD average
Early childhood education and care (ISCED 0)7 is the first stage of organised instruction for many
children and can, as such, play an important role in their development. While enrolment in these
programmes is usually not mandatory and children can enter them at different ages, the majority of
3-4 year-olds in OECD countries is enrolled in early childhood education and care (mostly pre-primary
education). On average across OECD countries, 71% of 3-year-olds and 86% of 4-year-olds attended
education programmes (ISCED 0) in 2014, with wide variation across countries.
In Australia, 69% of 3-year-olds participated in early childhood education and care (ISCED 0) in 2014
(see Figure 5): 54% in early educational development (ISCED 01) and 15% in pre-primary education
(ISCED 02). A higher share of 4-year-old Australians attended some form of early childhood education and
care: 83% participated in pre-primary education (ISCED 02) in 2014, which is around the OECD average of
85%. Australia’s participation rates at age 4 have risen dramatically since 2005, representing the fourth
highest increase in the OECD.
Most OECD countries achieve full enrolment in pre-primary education for 5-year-olds. In Australia,
83% of 5-year-olds are in primary education (ISCED 1), while 18% are in pre-primary education
(ISCED 02). Participation in primary education from the age of 5 is also common in Ireland, New
Zealand and the United Kingdom, where nearly all 5-year-olds are enrolled in primary school
(OECD, 2016a, Table C2.1).
Figure 5. Enrolment rates at age 3 in early childhood education and care (2005 and 2014)
Notes: Countries are ranked in descending order of the enrolment rates of 3-year-olds in 2014. 1. Year of reference 2013 instead of 2014. Source: OECD (2016), Education at a Glance 2016: OECD Indicators, Table C2.1, http://dx.doi.org/10.1787/888933398291.
AUSTRALIA
10 © OECD 2016
Early childhood education and care (ISCED 0), as well as primary and secondary education, is
mostly organised in public institutions in OECD countries and, on average, 68% of pre-primary
education pupils (3-5 year-olds) were enrolled in public institutions in 2014. Only in early childhood
development programmes (0-2 year-olds) were there more children enrolled in private institutions (58%)
than in public institutions (42%) in 2014. In Australia, the majority (77%) of pre-primary pupils was
enrolled in government-dependent private institutions in 2013, while 23% of pre-primary pupils attended
a public setting (OECD, 2016a, Table C2.2).
Section 3. Policy outcomes
The association between attending pre-primary education and 15-year-olds’ mathematics performance is
similar to the OECD average
Research in neurosciences has shown that the brain sensitivity of highly important developmental
areas, such as emotional control, social skills, language and numeracy peak in the first three years of a
child’s life (Gambaro et al., 2014). These findings indicate that the first years of children’s life are crucial
for their later development and learning. High quality ECEC can stimulate the development of these
skills, which highlights the importance of early development programmes and their level of quality
(OECD, 2006, 2012).
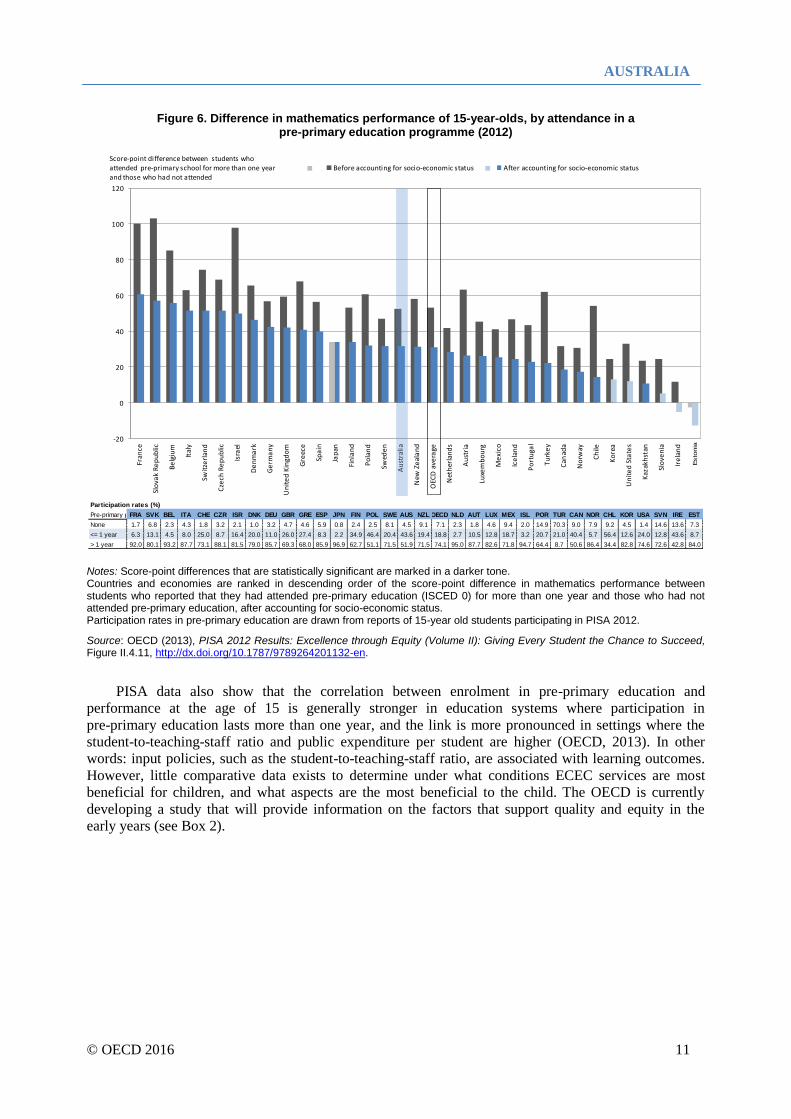
A strong start in education through ECEC is associated with higher performance in adolescence.
PISA results show that 15-year-olds who attended a pre-primary education programme tend to perform
better than students who did not attend pre-primary education. The percentage of 15-year-olds in
Australia who reported not attending pre-primary education in PISA 2012 was low (4.5% compared with
7.1% across the OECD, see Figure 6). Notably, children from a lower socio-economic background and in
socio-economically disadvantaged schools were less likely to have participated in pre-primary education.
Nevertheless, the benefits associated with pre-primary education remain even after accounting for
students’ socio-economic background. In Australia, the difference in PISA mathematics scores between
15-year-old students who had attended more than one year of pre-primary education and those who had
not attended pre-primary education was 32 score points, after accounting for socio-economic
background. This is the equivalent of almost one year of formal schooling8 (similar to the OECD average
difference of 31 score points) (see Figure 6).
AUSTRALIA
© OECD 2016 11
Figure 6. Difference in mathematics performance of 15-year-olds, by attendance in a pre-primary education programme (2012)
Notes: Score-point differences that are statistically significant are marked in a darker tone. Countries and economies are ranked in descending order of the score-point difference in mathematics performance between students who reported that they had attended pre-primary education (ISCED 0) for more than one year and those who had not attended pre-primary education, after accounting for socio-economic status. Participation rates in pre-primary education are drawn from reports of 15-year old students participating in PISA 2012.
Source: OECD (2013), PISA 2012 Results: Excellence through Equity (Volume II): Giving Every Student the Chance to Succeed, Figure II.4.11, http://dx.doi.org/10.1787/9789264201132-en.
PISA data also show that the correlation between enrolment in pre-primary education and
performance at the age of 15 is generally stronger in education systems where participation in
pre-primary education lasts more than one year, and the link is more pronounced in settings where the
student-to-teaching-staff ratio and public expenditure per student are higher (OECD, 2013). In other
words: input policies, such as the student-to-teaching-staff ratio, are associated with learning outcomes.
However, little comparative data exists to determine under what conditions ECEC services are most
beneficial for children, and what aspects are the most beneficial to the child. The OECD is currently
developing a study that will provide information on the factors that support quality and equity in the
early years (see Box 2).
Pre-primary p FRA SVK BEL ITA CHE CZR ISR DNK DEU GBR GRE ESP JPN FIN POL SWE AUS NZL OECD NLD AUT LUX MEX ISL POR TUR CAN NOR CHL KOR USA SVN IRE EST
None 1.7 6.8 2.3 4.3 1.8 3.2 2.1 1.0 3.2 4.7 4.6 5.9 0.8 2.4 2.5 8.1 4.5 9.1 7.1 2.3 1.8 4.6 9.4 2.0 14.9 70.3 9.0 7.9 9.2 4.5 1.4 14.6 13.6 7.3
<= 1 year 6.3 13.1 4.5 8.0 25.0 8.7 16.4 20.0 11.0 26.0 27.4 8.3 2.2 34.9 46.4 20.4 43.6 19.4 18.8 2.7 10.5 12.8 18.7 3.2 20.7 21.0 40.4 5.7 56.4 12.6 24.0 12.8 43.6 8.7
> 1 year 92.0 80.1 93.2 87.7 73.1 88.1 81.5 79.0 85.7 69.3 68.0 85.9 96.9 62.7 51.1 71.5 51.9 71.5 74.1 95.0 87.7 82.6 71.8 94.7 64.4 8.7 50.6 86.4 34.4 82.8 74.6 72.6 42.8 84.0
Participation rates (%)
-20
0
20
40
60
80
100
120
Fran
ce
Slo
vak
Re
pu
blic
Be
lgiu
m
Ital
y
Swit
zerl
and
Cze
ch R
ep
ub
lic
Isra
el
De
nm
ark
Ge
rma
ny
Un
ite
d K
ingd
om
Gre
ece
Spa
in
Jap
an
Fin
lan
d
Po
lan
d
Swed
en
Au
stra
lia
New
Ze
ala
nd
OEC
D a
vera
ge
Net
her
lan
ds
Au
stri
a
Luxe
mb
ou
rg
Me
xico
Ice
lan
d
Po
rtu
gal
Tu
rke
y
Can
ada
No
rway
Ch
ile
Ko
rea
Un
ite
d S
tate
s
Kaz
akh
stan
Slo
ven
ia
Ire
lan
d
Before accounting for socio-economic status After accounting for socio-economic statusScore-point difference between students who attended pre-primary school for more than one year and those who had not attended
Esto
nia
AUSTRALIA
12 © OECD 2016
Box 2. The development of international data on quality in early education and care
The OECD programme of work on ECEC includes a series of projects to develop the extent of available data on ECEC. These include: The TALIS Starting Strong Survey: is an international survey of ECEC staff and the quality of the learning and
well-being environment in different ECEC settings across OECD member and non-member economies. The objective is to collect data on staff characteristics, pre-service and in-service education, pedagogical practices and beliefs, organisation and management, and working conditions to give countries an internationally framed assessment of what actually happens in their ECEC settings, i.e. the quality of the learning and well-being environment children experience (instrument development and pilot study in 20116, field trial in 2017, main study in 2018 and reporting in 2019).
The International Early Learning (for Child Well-being) Study seeks to provide reliable, comparative information
on the social, emotional and cognitive development of children to assist countries to improve children’s outcomes. It will measure children’s early learning outcomes, at approximately five years of age, in the context of their ECEC experiences and home environments. The study will include a child assessment component as well as a parent questionnaire to gather information about the home learning environment. The study will be conducted in 3-6 countries from 2016 to 2019. Results on the study will be released in 2020. A thematic study on transitions from ECEC to primary school will analyse country policies and practices in
stimulating quality transitions from ECEC to primary education. This study will be based on existing literature and country background notes, which will form the basis of a comparative analytical report in 2017.
This work is published under the responsibility of the Secretary-General of the OECD. The opinions expressed and arguments
employed herein do not necessarily reflect the official views of OECD member countries.
This document and any map included herein are without prejudice to the status of or sovereignty over any territory, to the
delimitation of international frontiers and boundaries and to the name of any territory, city or area.
The data for Israel are supplied by and under the responsibility of the relevant Israeli authorities. The use of such data by the OECD
is without prejudice to the status of the Golan Heights, East Jerusalem and Israeli settlements in the West Bank under the terms of
international law.
© OECD (2016)
You can copy, download or print OECD content for your own use, and you can include excerpts from OECD publications,
databases and multimedia products in your own documents, presentations, blogs, websites and teaching materials, provided that
suitable acknowledgment of OECD as source and copyright owner is given. All requests for commercial use and translation
rights should be submitted to [email protected].
For more information on Early Childhood Education and Care, visit www.oecd.org/edu/earlychildhood.
Questions can be directed to:
Miho Taguma, Directorate for Education and Skills
Email: [email protected]
Country note author: Simone Bloem, independent consultant
Country note collaborators OECD: Maria Huerta, Ineke Litjens, Eric Charbonnier, Etienne
Albiser, Mernie Graziotin, Sophie Limoges, Rachel
Linden, Camilla Lorentzen and Elizabeth Zachary.
AUSTRALIA
© OECD 2016 13
NOTES
1 Australian Government spending on ECEC is primarily through subsidies to families (via the Child Care Benefit
and the Child Care Rebate). In the OECD reporting of data this expenditure is treated as a transfer to the
private sector and is therefore reported as ‘private expenditure’. This has the effect of understating the
level of public funding for ECEC in Australia.
2 For example, in the Netherlands and Switzerland, the actual level of spending and enrolment in pre-primary
education is likely to be underestimated in the absence of data on integrated programmes (some caution
is required before drawing conclusions about the conditions of access and quality of education and care
for young children).
3 Private sources include households and other private entities, such as private businesses and non-profit
organisations (e.g., religious organisations, charitable organisations, and business and labour
associations).
4 Child Care Benefit (CCB) is a means tested fee subsidy, payable to eligible parents using approved and registered
care. The rate of CCB depends on a number of factors. The Australian Government also provides the
Child Care Rebate (CCR), which is not means tested. The CCR covers 50% of the family’s out-of-pocket
childcare costs up to an annual limit per child, in addition to any other childcare assistance. The annual
limit for CCR payable for childcare costs in 2013-14 was AUD 7 500 per child per year (country chapter
for OECD series Benefits and Wages, www.oecd.org/els/social/workincentives).
5 The data refer to pre-primary teachers who teach in pre-primary education; only in Austria do data refer to
primary teachers teaching in pre-primary education.
6 The OECD Family Database definition is used here. This defines “formal” childcare services provided to
children aged 0-2 years including centre-based services, organised day care, pre-school and professional
child-minders.
7 ISCED 0 refers to programmes classified as ISCED 01 (early childhood development) and ISCED 02
(pre-primary education) depending on the age of the child.
8 39 score points in mathematics correspond to the equivalent of one year of formal schooling (OECD, 2013).
AUSTRALIA
14 © OECD 2016
REFERENCES
Gambaro, L., K. Stewart & J. Waldfogel (eds.) (2014), An Equal Start?: Providing Quality Early
Education and Care for Disadvantaged Children, Policy Press, Bristol.
OECD (2016a), Education at a Glance 2016: OECD Indicators, OECD Publishing, Paris. DOI:
http://dx.doi.org/10.1787/eag-2016-en.
OECD (2016b), Monitoring Quality in Early Childhood Education and Care Country Note: Australia,
OECD Publishing, Paris, http://www.oecd.org/edu/school/Monitoring-Quality-in-ECEC-
Australia.pdf.
OECD (2015a), Starting Strong IV: Monitoring Quality in Early Childhood Education and Care, OECD
Publishing, Paris, http://dx.doi.org/10.1787/9789264233515-en.
OECD (2015b), OECD Family Database, OECD, Paris, www.oecd.org/social/family/database.htm.
OECD (2014), Education at a Glance 2014: OECD Indicators, OECD Publishing, Paris,
http://dx.doi.org/10.1787/eag-2014-en.
OECD (2013), PISA 2012 Results: Excellence through Equity (Volume II): Giving Every Student the
Chance to Succeed, PISA, OECD Publishing, Paris, http://dx.doi.org/10.1787/9789264201132-en.
OECD (2011), Starting Strong III: A Quality Toolbox for Early Childhood Education and Care, OECD
Publishing, Paris, http://dx.doi.org/10.1787/9789264123564-en.
OECD (2006), Starting Strong II: Early Childhood Education and Care, OECD Publishing, Paris,
http://dx.doi.org/10.1787/9789264035461-en.
OECD (2001), Starting Strong I: Early Childhood Education and Care, OECD Publishing, Paris,
http://dx.doi.org/10.1787/9789264192829-en.
AUSTRALIA
© OECD 2016 15
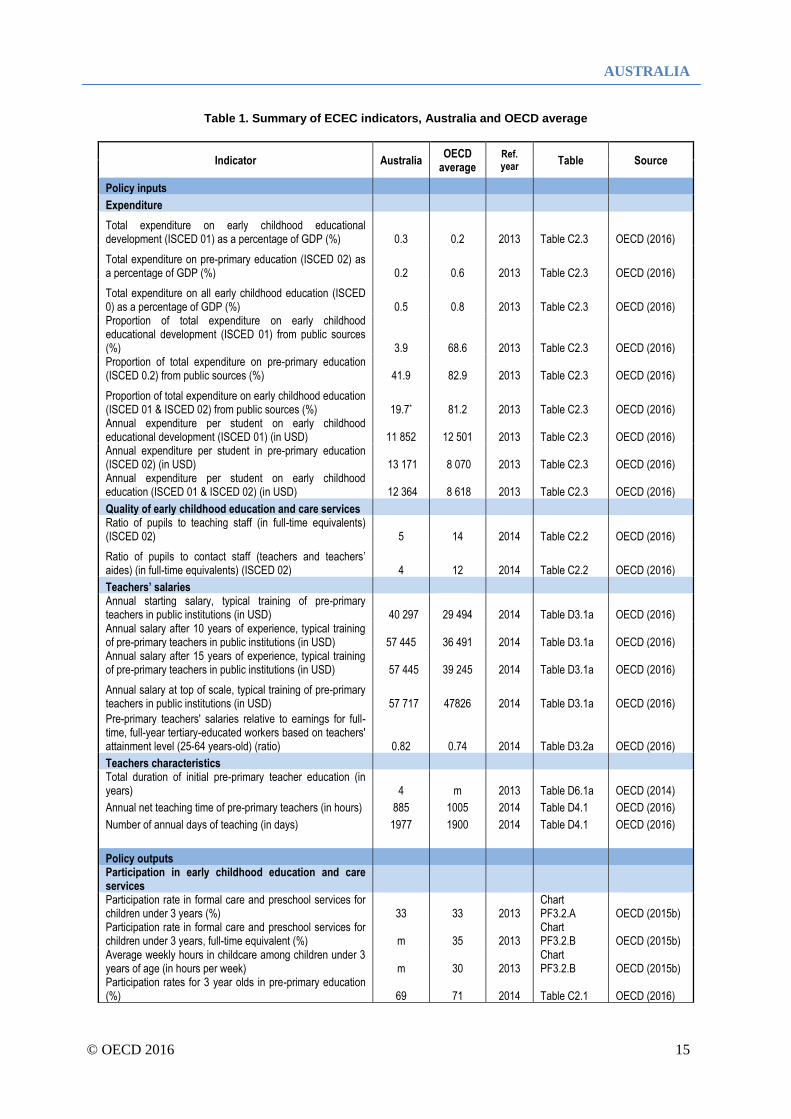
Table 1. Summary of ECEC indicators, Australia and OECD average
Indicator Australia OECD
average Ref. year Table Source
Policy inputs
Expenditure
Total expenditure on early childhood educational development (ISCED 01) as a percentage of GDP (%) 0.3 0.2 2013 Table C2.3 OECD (2016)
Total expenditure on pre-primary education (ISCED 02) as a percentage of GDP (%) 0.2 0.6 2013 Table C2.3 OECD (2016)
Total expenditure on all early childhood education (ISCED 0) as a percentage of GDP (%) 0.5 0.8 2013 Table C2.3 OECD (2016) Proportion of total expenditure on early childhood educational development (ISCED 01) from public sources (%) 3.9 68.6 2013 Table C2.3 OECD (2016) Proportion of total expenditure on pre-primary education (ISCED 0.2) from public sources (%) 41.9 82.9 2013 Table C2.3 OECD (2016)
Proportion of total expenditure on early childhood education (ISCED 01 & ISCED 02) from public sources (%) 19.7* 81.2 2013 Table C2.3 OECD (2016) Annual expenditure per student on early childhood educational development (ISCED 01) (in USD) 11 852 12 501 2013 Table C2.3 OECD (2016) Annual expenditure per student in pre-primary education (ISCED 02) (in USD) 13 171 8 070 2013 Table C2.3 OECD (2016) Annual expenditure per student on early childhood education (ISCED 01 & ISCED 02) (in USD) 12 364 8 618 2013 Table C2.3 OECD (2016)
Quality of early childhood education and care services Ratio of pupils to teaching staff (in full-time equivalents) (ISCED 02) 5 14 2014 Table C2.2 OECD (2016)
Ratio of pupils to contact staff (teachers and teachers’ aides) (in full-time equivalents) (ISCED 02) 4 12 2014 Table C2.2 OECD (2016)
Teachers’ salaries Annual starting salary, typical training of pre-primary teachers in public institutions (in USD) 40 297
29 494 2014 Table D3.1a OECD (2016)
Annual salary after 10 years of experience, typical training of pre-primary teachers in public institutions (in USD)
57 445
36 491 2014 Table D3.1a OECD (2016)
Annual salary after 15 years of experience, typical training of pre-primary teachers in public institutions (in USD) 57 445
39 245 2014 Table D3.1a OECD (2016)
Annual salary at top of scale, typical training of pre-primary teachers in public institutions (in USD) 57 717
47826 2014 Table D3.1a OECD (2016)
Pre-primary teachers' salaries relative to earnings for full-time, full-year tertiary-educated workers based on teachers' attainment level (25-64 years-old) (ratio) 0.82 0.74 2014 Table D3.2a OECD (2016)
Teachers characteristics Total duration of initial pre-primary teacher education (in years) 4 m 2013 Table D6.1a OECD (2014)
Annual net teaching time of pre-primary teachers (in hours) 885 1005 2014 Table D4.1 OECD (2016)
Number of annual days of teaching (in days) 1977 1900 2014 Table D4.1 OECD (2016)
Policy outputs Participation in early childhood education and care services Participation rate in formal care and preschool services for children under 3 years (%) 33 33 2013
Chart PF3.2.A OECD (2015b)
Participation rate in formal care and preschool services for children under 3 years, full-time equivalent (%) m 35 2013
Chart PF3.2.B OECD (2015b)
Average weekly hours in childcare among children under 3 years of age (in hours per week) m 30 2013
Chart PF3.2.B OECD (2015b)
Participation rates for 3 year olds in pre-primary education (%) 69 71 2014 Table C2.1 OECD (2016)
AUSTRALIA
16 © OECD 2016
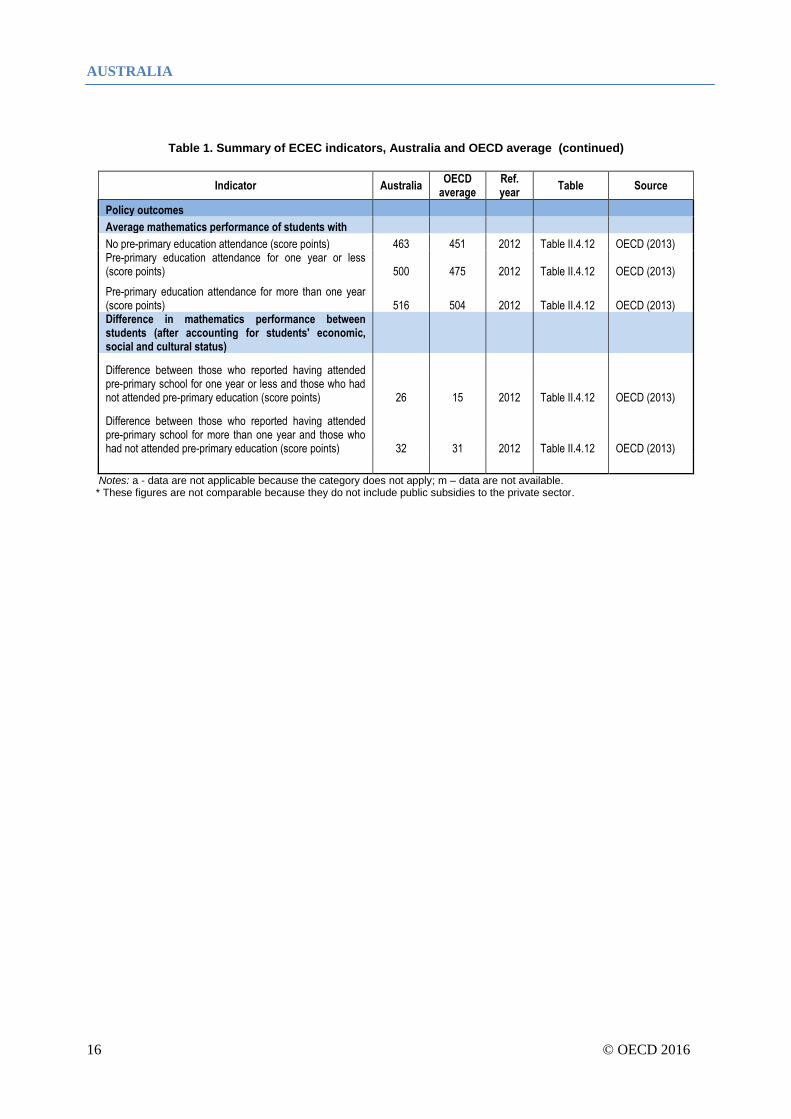
Table 1. Summary of ECEC indicators, Australia and OECD average (continued)
Indicator Australia OECD
average Ref. year
Table Source
Policy outcomes
Average mathematics performance of students with
No pre-primary education attendance (score points) 463 451 2012 Table II.4.12 OECD (2013) Pre-primary education attendance for one year or less (score points) 500 475 2012 Table II.4.12 OECD (2013)
Pre-primary education attendance for more than one year (score points) 516 504 2012 Table II.4.12 OECD (2013) Difference in mathematics performance between students (after accounting for students' economic, social and cultural status)
Difference between those who reported having attended pre-primary school for one year or less and those who had not attended pre-primary education (score points) 26 15 2012 Table II.4.12 OECD (2013)
Difference between those who reported having attended pre-primary school for more than one year and those who had not attended pre-primary education (score points) 32 31 2012 Table II.4.12 OECD (2013)
Notes: a - data are not applicable because the category does not apply; m – data are not available. * These figures are not comparable because they do not include public subsidies to the private sector.