Embed Size (px)
Citation preview
Government at a Glance 2017
Country Fact Sheetwww.oecd.org/gov/govataglance.htm
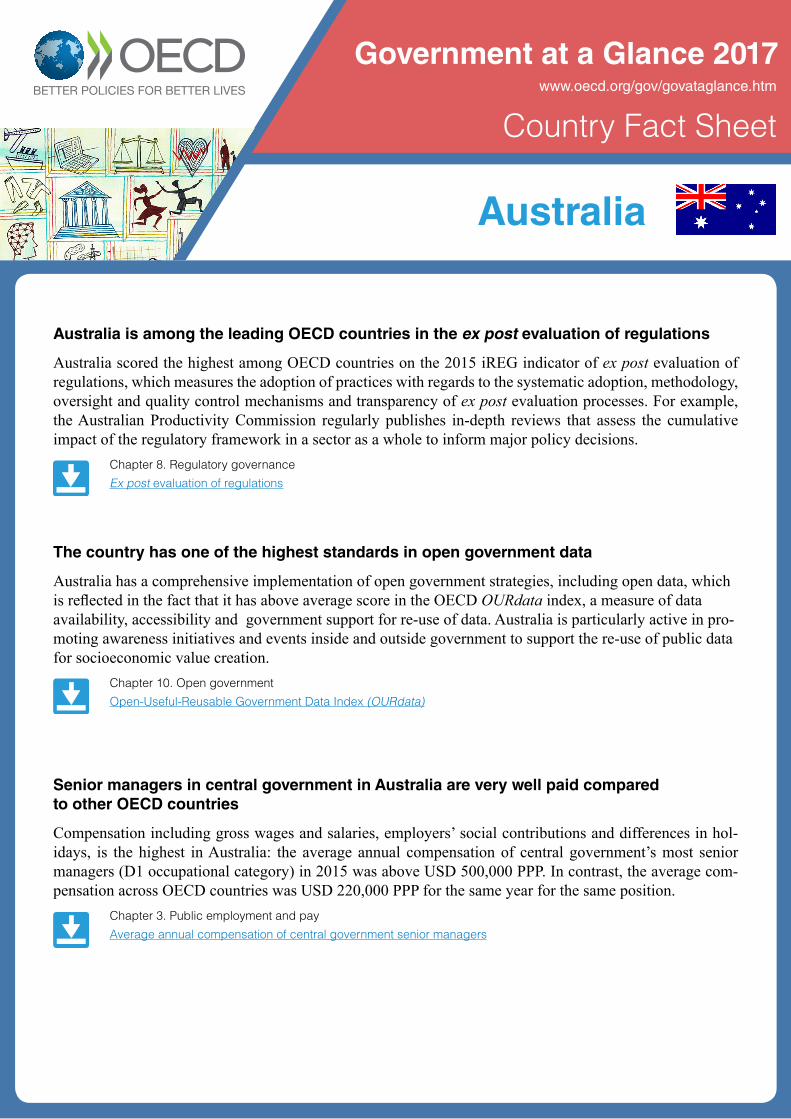
Australia is among the leading OECD countries in the ex post evaluation of regulations
Australia scored the highest among OECD countries on the 2015 iREG indicator of ex post evaluation of regulations, which measures the adoption of practices with regards to the systematic adoption, methodology, oversight and quality control mechanisms and transparency of ex post evaluation processes. For example, the Australian Productivity Commission regularly publishes in-depth reviews that assess the cumulative impact of the regulatory framework in a sector as a whole to inform major policy decisions.
Chapter 8. Regulatory governance
Ex post evaluation of regulations
The country has one of the highest standards in open government data
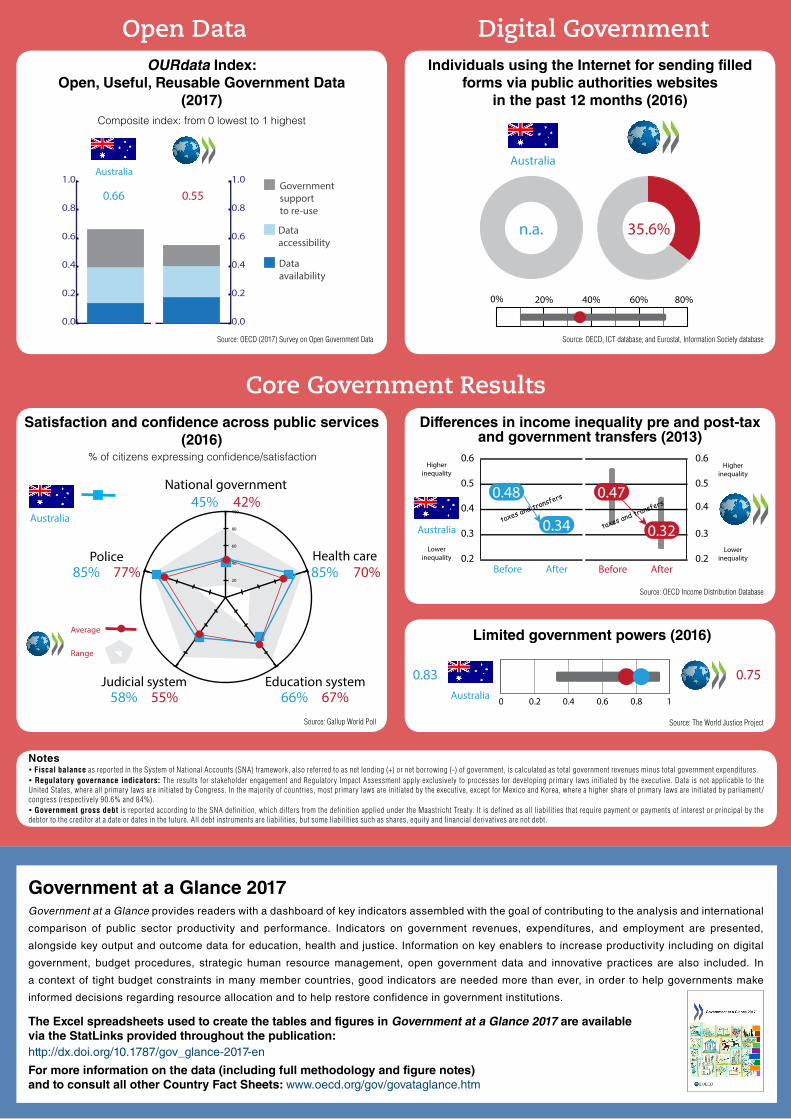
Australia has a comprehensive implementation of open government strategies, including open data, which is reflected in the fact that it has above average score in the OECD OURdata index, a measure of data availability, accessibility and government support for re-use of data. Australia is particularly active in pro-moting awareness initiatives and events inside and outside government to support the re-use of public data for socioeconomic value creation.
Chapter 10. Open government
Open-Useful-Reusable Government Data Index (OURdata)
Senior managers in central government in Australia are very well paid comparedto other OECD countries
Compensation including gross wages and salaries, employers’ social contributions and differences in hol-idays, is the highest in Australia: the average annual compensation of central government’s most senior managers (D1 occupational category) in 2015 was above USD 500,000 PPP. In contrast, the average com-pensation across OECD countries was USD 220,000 PPP for the same year for the same position.
Chapter 3. Public employment and pay
Average annual compensation of central government senior managers
Australia
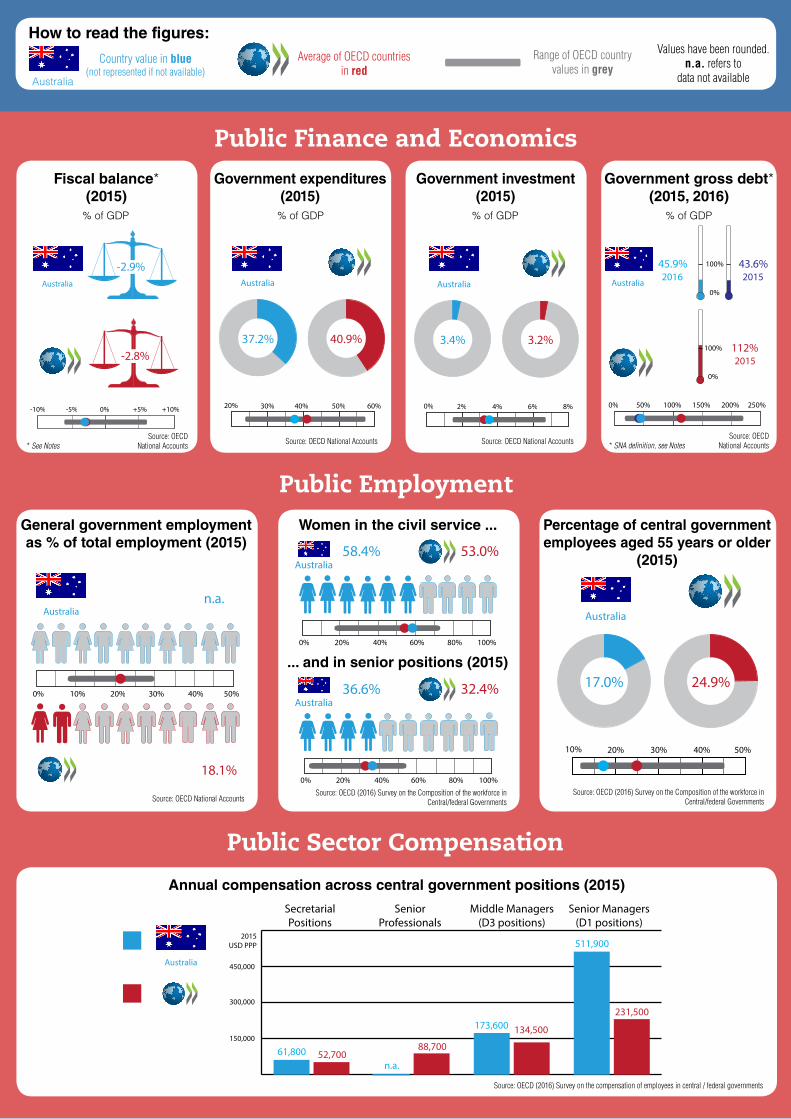
Fiscal balance*(2015)
Government expenditures(2015)
Government gross debt*(2015, 2016)
% of GDP % of GDP % of GDP
Source: OECD National Accounts Source: OECD National Accounts
G@G /dataG@G /data
26134,500
88,70052,700
Middle Managers(D3 positions)
Senior Managers(D1 positions)
SeniorProfessionals
SecretarialPositions
2015USD PPP
150,000
300,000
450,000
231,500
61,800
Australia
n.a.
173,600
511,900
Annual compensation across central government positions (2015)
Government investment(2015)
How to read the figures:
Australia
Country value in blue (not represented if not available)
Average of OECD countries in red
Range of OECD country values in grey
Public Finance and Economics
10% 20% 30% 40% 50%
24.9%17.0%
Australia
20% 30% 40% 50% 60%
40.9%37.2%
Australia
0% 2% 4% 6% 8%
3.2%3.4%
Australia
43.6%2015
45.9% 100%
0%
2016
112%100%
0%
2015
0% 50% 100% 150% 200% 250%
Australia
Values have been rounded. n.a. refers to
data not available
% of GDP
Source: OECD* SNA definition, see Notes National Accounts
Public Employment
Source: OECD (2016) Survey on the Composition of the workforce in Central/federal Governments
Source: OECD (2016) Survey on the compensation of employees in central / federal governments
... and in senior positions (2015)
Source: OECD* See Notes National Accounts
Public Sector Compensation
53.0%58.4%Australia
0% 20% 40% 60% 80% 100%
32.4%36.6%Australia
0% 20% 40% 60% 80% 100%
Women in the civil service ...
Source: OECD (2016) Survey on the Composition of the workforce in Central/federal Governments
Percentage of central government employees aged 55 years or older
(2015)
General government employmentas % of total employment (2015)
Source: OECD National Accounts
18.1%
n.a.Australia
0% 10% 20% 30% 40% 50%
-10% 0%-5% +5% +10%
-2.8%
-2.9%Australia
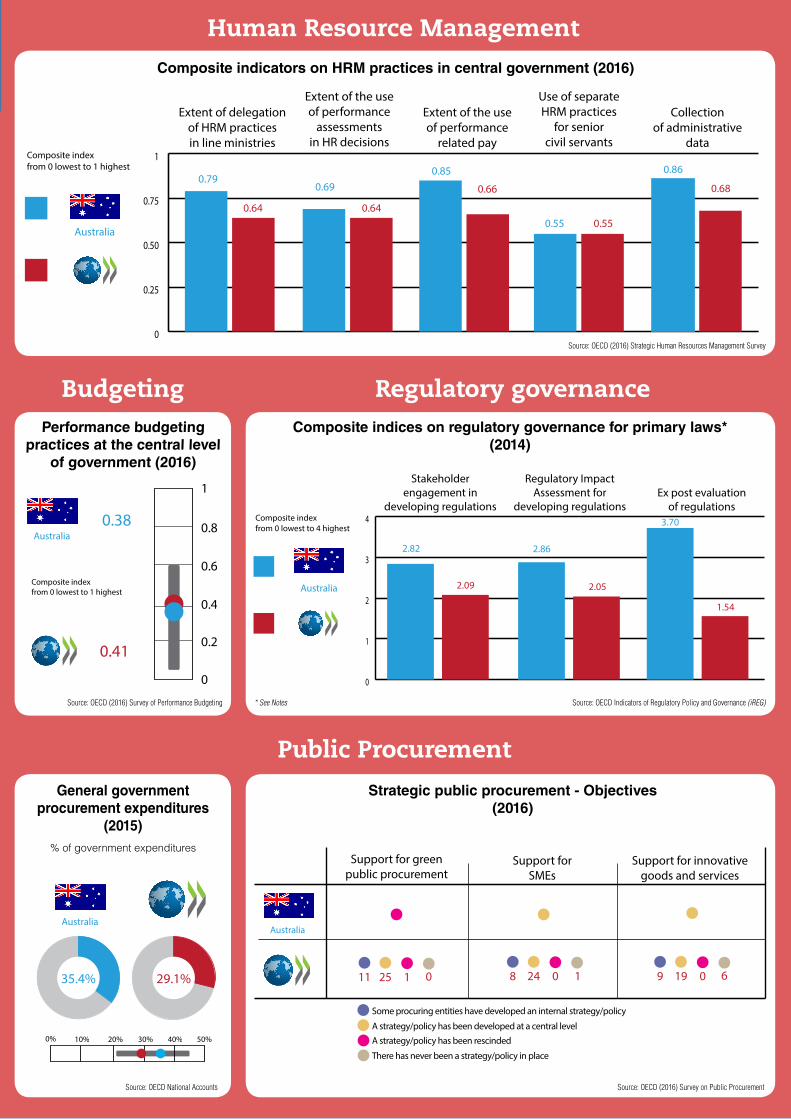
Budgeting
Women in Government
Extent of delegationof HRM practicesin line ministries
0.79
0.64
Extent of the useof performance
assessmentsin HR decisions
0.69
0.64
Extent of the useof performance
related pay
0.85
0.66
Use of separateHRM practices
for seniorcivil servants
0.55 0.55
Collectionof administrative
data
0.86
0.68
Composite indexfrom 0 lowest to 1 highest
0
0.25
0.50
0.75
1
Australia
G@G /data
Source: OECD (2016) Strategic Human Resources Management Survey
Composite indicators on HRM practices in central government (2016)
Human Resource Management
Composite indices on regulatory governance for primary laws*(2014)
G@G /data
Regulatory governance
0% 10% 20% 30% 40%
29.1%
50%
35.4%
Australia
Source: OECD National Accounts
General governmentprocurement expenditures
(2015)% of government expenditures
* See Notes Source: OECD Indicators of Regulatory Policy and Governance (iREG)
Public Procurement
Support for greenpublic procurement
Some procuring entities have developed an internal strategy/policy
A strategy/policy has been developed at a central level
Support forSMEs
Support for innovativegoods and services
11 25 1
A strategy/policy has been rescinded
There has never been a strategy/policy in place
0 8 24 0 1 9 19 0 6
Australia
Strategic public procurement - Objectives(2016)
Source: OECD (2016) Survey on Public Procurement
0.41
0
0.2
0.4
0.6
0.8
1
0.38Australia
Composite indexfrom 0 lowest to 1 highest
Performance budgetingpractices at the central level
of government (2016)
Source: OECD (2016) Survey of Performance Budgeting
Stakeholderengagement in
developing regulations
2.82
2.09
Regulatory ImpactAssessment for
developing regulations
2.86
2.05
Ex post evaluationof regulations
3.70
1.54
Composite indexfrom 0 lowest to 4 highest
0
1
2
3
4
Australia
Notes Fiscal balance as reported in the System of National Accounts (SNA) framework, also referred to as net lending (+) or net borrowing (-) of government, is calculated as total government revenues minus total government expenditures. Regulatory governance indicators: The results for stakeholder engagement and Regulatory Impact Assessment apply exclusively to processes for developing primary laws initiated by the executive. Data is not applicable to the United States, where all primary laws are initiated by Congress. In the majority of countries, most primary laws are initiated by the executive, except for Mexico and Korea, where a higher share of primary laws are initiated by parliament/congress (respectively 90.6% and 84%). Government gross debt is reported according to the SNA definition, which dif fers from the definition applied under the Maastricht Treaty. It is defined as all liabilities that require payment or payments of interest or principal by the debtor to the creditor at a date or dates in the future. All debt instruments are liabilities, but some liabilities such as shares, equity and financial derivatives are not debt.
Open Data Digital Government
0% 20% 40% 60% 80%
35.6%n.a.
Australia
Individuals using the Internet for sending filled forms via public authorities websites
in the past 12 months (2016)
Source: OECD, ICT database; and Eurostat, Information Society database
OURdata Index:Open, Useful, Reusable Government Data
(2017)Composite index: from 0 lowest to 1 highest
Source: OECD (2017) Survey on Open Government Data
0.0
0.2
0.4
0.6
0.8
1.0
0.66
0.0
0.2
0.4
0.6
0.8
1.0
0.55
Australia
Dataavailability
Dataaccessibility
Governmentsupportto re-use
Differences in income inequality pre and post-taxand government transfers (2013)
Australia
0.2
0.3
0.4
0.5
0.6Higher
inequality
Lowerinequality
Before After
0.48
0.34taxes and transfers
0.2
0.3
0.4
0.5
0.6
Before After
0.47
0.32taxes and transfers
Higherinequality
Lowerinequality
Source: OECD Income Distribution Database
Limited government powers (2016)
0.75
0 0.2 0.4 0.6 0.8 1
0.83Australia
Source: The World Justice Project
Core Government ResultsSatisfaction and confidence across public services
(2016)
70%
Judicial system Education system
85%20
40
60
80
100
Health care
67%66%55%58%
National government42%45%
Australia
Average
Range
Police77%85%
Source: Gallup World Poll
% of citizens expressing confidence/satisfaction
Government at a Glance 2017Government at a Glance provides readers with a dashboard of key indicators assembled with the goal of contributing to the analysis and international
comparison of public sector productivity and performance. Indicators on government revenues, expenditures, and employment are presented,
alongside key output and outcome data for education, health and justice. Information on key enablers to increase productivity including on digital
government, budget procedures, strategic human resource management, open government data and innovative practices are also included. In
a context of tight budget constraints in many member countries, good indicators are needed more than ever, in order to help governments make
informed decisions regarding resource allocation and to help restore confidence in government institutions.
http://dx.doi.org/10.1787/gov_glance-2017-en
The Excel spreadsheets used to create the tables and figures in Government at a Glance 2017 are available via the StatLinks provided throughout the publication:
For more information on the data (including full methodology and figure notes)and to consult all other Country Fact Sheets: www.oecd.org/gov/govataglance.htm


![First Revision No. 3-NFPA 2001-2016 [ Section No. 1.3 ] · PDF fileHFC-236fa Concentration Maximum Permitted Human Exposure Time (min) % vol. ppm 14.0 140,000 0.79 14.5 145,000 0.64](https://img.pdfslide.us/doc/110x75/5a7329247f8b9a93538e82d4/first-revision-no-3-nfpa-2001-2016-section-no-13-hfc-236fa-concentration.jpg)


![OriginalInvestigation | ObstetricsandGynecology ......titerscomparedwith51participantswithundetectableviralload(0.79[0.91]titersvs0.29[0.36] titers;P =.02)(eTable7intheSupplement](https://img.pdfslide.us/doc/110x75/612ddabe1ecc5158694272b5/originalinvestigation-obstetricsandgynecology-titerscomparedwith51participantswithundetectableviralload079091titersvs029036.jpg)