Embed Size (px)
Citation preview
Australia
Terry Maidment and Owen Gabbitas
1. Introduction The GTAP 6 I-O table for Australia was constructed from key input-output tables supplied by the Australian Bureau of Statistics and some supporting tables estimated from other data sources. The I-O table covers the Australian financial year ended 30 June 1997 and records margin activities such as transport as part of the supplying industry. The data were cleaned and transformed to meet GTAP’s requirements. This mainly involved employing the homogeneity assumption to convert from 106 ‘multi-product’ to ‘single-product’ industries and then mapping the data into 57 GTAP industries. The resulting I-O table was balanced using RAS procedures. Although the primary data sources and methodology used are different, the GTAP 6 Data Base is conceptually similar to the previous data base.
This paper describes the construction of the version 6 Australian I-O table for the Global Trade Analysis Project (GTAP) Model. Providing the Australian I-O table for this model is part of the Productivity Commission’s commitment as a member of the GTAP Consortium.
In line with GTAP requirements, the output data supplied consisted of the four matrices:
• the supply and use of the 57 GTAP products and three primary factors of production (land, labour and capital) without product taxes (matrix UF);
• the supply and use of the 57 GTAP products and three primary factors with product taxes (matrix UP);
• output of the 57 GTAP products (matrix OP); and • imports of the 57 GTAP products (matrix MF).
These matrices were constructed using a ‘building blocks’ approach. Detailed data on the
supply and use of local and imported products and on the associated product taxes and import duties involved were first derived or estimated from available data. The matrices were then assembled from these building blocks.
2. Source Data The primary data sources used to construct the Australian I-O table were electronic versions of the 1996-97 input-output (IO) tables made available by the Australian Bureau of Statistics for the Australian financial year ended 30 June 1997.1 The tables contain detailed data on the supply and use of 106 products in Australia and the associated product tax payments (table 1 in the annex at the end of this paper). The tables also contain data on the use of two primary factors of
1 ABS (2000) describes the concepts, sources and methods used in compiling the Australian input-output tables.
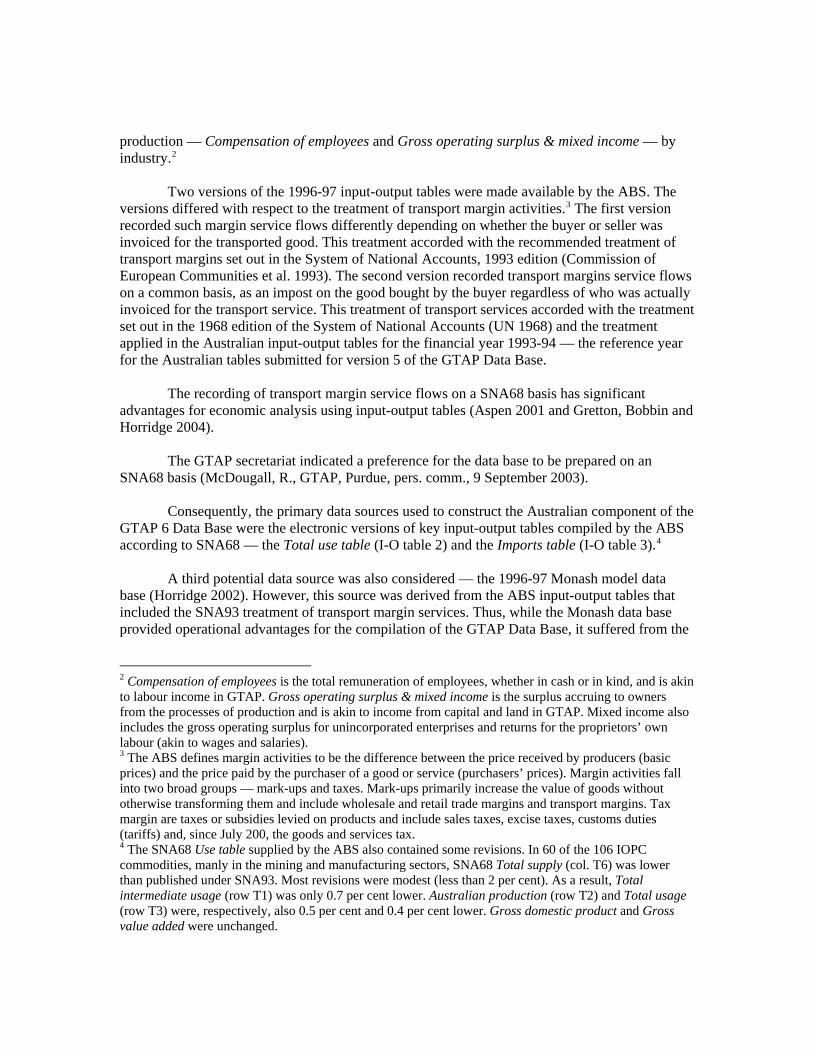
production — Compensation of employees and Gross operating surplus & mixed income — by industry.2
Two versions of the 1996-97 input-output tables were made available by the ABS. The versions differed with respect to the treatment of transport margin activities.3 The first version recorded such margin service flows differently depending on whether the buyer or seller was invoiced for the transported good. This treatment accorded with the recommended treatment of transport margins set out in the System of National Accounts, 1993 edition (Commission of European Communities et al. 1993). The second version recorded transport margins service flows on a common basis, as an impost on the good bought by the buyer regardless of who was actually invoiced for the transport service. This treatment of transport services accorded with the treatment set out in the 1968 edition of the System of National Accounts (UN 1968) and the treatment applied in the Australian input-output tables for the financial year 1993-94 — the reference year for the Australian tables submitted for version 5 of the GTAP Data Base.
The recording of transport margin service flows on a SNA68 basis has significant
advantages for economic analysis using input-output tables (Aspen 2001 and Gretton, Bobbin and Horridge 2004).
The GTAP secretariat indicated a preference for the data base to be prepared on an
SNA68 basis (McDougall, R., GTAP, Purdue, pers. comm., 9 September 2003). Consequently, the primary data sources used to construct the Australian component of the
GTAP 6 Data Base were the electronic versions of key input-output tables compiled by the ABS according to SNA68 — the Total use table (I-O table 2) and the Imports table (I-O table 3).4
A third potential data source was also considered — the 1996-97 Monash model data
base (Horridge 2002). However, this source was derived from the ABS input-output tables that included the SNA93 treatment of transport margin services. Thus, while the Monash data base provided operational advantages for the compilation of the GTAP Data Base, it suffered from the
2 Compensation of employees is the total remuneration of employees, whether in cash or in kind, and is akin to labour income in GTAP. Gross operating surplus & mixed income is the surplus accruing to owners from the processes of production and is akin to income from capital and land in GTAP. Mixed income also includes the gross operating surplus for unincorporated enterprises and returns for the proprietors’ own labour (akin to wages and salaries). 3 The ABS defines margin activities to be the difference between the price received by producers (basic prices) and the price paid by the purchaser of a good or service (purchasers’ prices). Margin activities fall into two broad groups — mark-ups and taxes. Mark-ups primarily increase the value of goods without otherwise transforming them and include wholesale and retail trade margins and transport margins. Tax margin are taxes or subsidies levied on products and include sales taxes, excise taxes, customs duties (tariffs) and, since July 200, the goods and services tax. 4 The SNA68 Use table supplied by the ABS also contained some revisions. In 60 of the 106 IOPC commodities, manly in the mining and manufacturing sectors, SNA68 Total supply (col. T6) was lower than published under SNA93. Most revisions were modest (less than 2 per cent). As a result, Total intermediate usage (row T1) was only 0.7 per cent lower. Australian production (row T2) and Total usage (row T3) were, respectively, also 0.5 per cent and 0.4 per cent lower. Gross domestic product and Gross value added were unchanged.
same limitations as the ABS tables on which it was based, and accordingly was not used in the current exercise.
Some secondary data sources referenced in this document were used to fill gaps in the
primary source data. These gaps arose either because the ABS restricted the release of certain statistics to preserve client confidentiality or because some of the supporting tables needed to construct the GTAP data base were not provided on an SNA68 basis.5 Any missing SNA68 supporting tables required, such as the duty and commodity tax tables, were estimated from data in the SNA68 tables supplied supplemented with data from the corresponding SNA93 tables.6
3. Processing of the Source Data The format of the ABS data, although similar to the format of the GTAP data requirements, did not fully match those requirements (Huff, McDougall and Walmsley 2000).
The main adjustments needed to map from the ABS format to GTAP were: • removal of negative values; • estimation of missing data vectors and flows; • treatment of complementary imports; • treatment of re-exports; • treatment of primary factors; • treatment of final demands; • converting multi-product industries to single-product industries; • mapping ABS products to their GTAP counterparts; and • balancing the data base.
The process for creating the GTAP 6 Data Base for Australia is illustrated in figure 1.
Details of each process are outlined below.
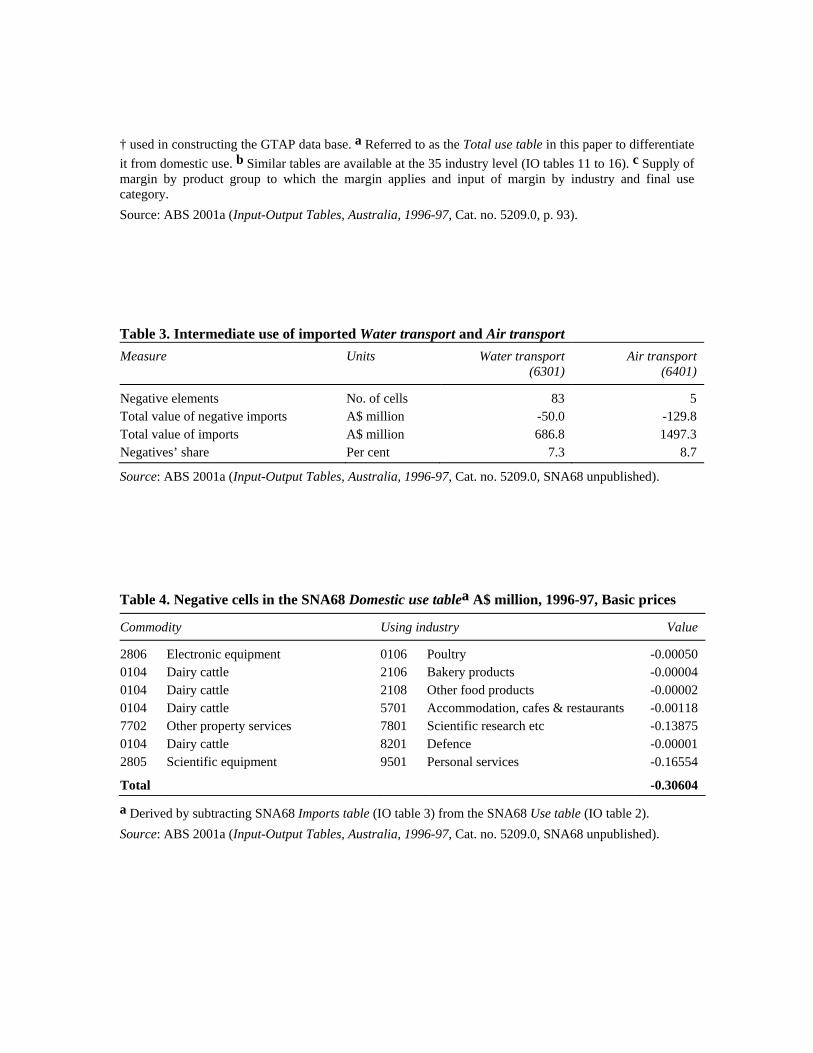
3.1 Removal of Negative Values Negative value flows were found to exist in the ABS tables for these reasons: • some negative flows of minor value for imports of Water transport and Air transport
remained as an artefact of ABS compilation procedures (summarised in table 3). These flows were set to zero and exports of these commodities were reduced by an offsetting amount to maintain the balance between their supply and use.
• some estimates of the use of domestically produced products, derived by deducting imports from total use, were found to be negative because the value of imports was slightly higher than total use (table 4). These negatives were removed by increasing domestic intermediate usage to zero and total use by the entries’ value. To maintain total sales, imports and exports of these commodities were both reduced by 50 per cent of the original negative value.
5 To preserve confidentiality, the ABS restricts the release of statistics where the disclosure of the statistics would enable the identification of data supplied by individuals or firms. 6 Table 2 in the annex lists all of the input-output tables available electronically.
• one estimate of the use of imported water transport services was found to be negative
reflecting the ‘net’ treatment of transport services in the Imports table (I-O table 3) because the ABS recorded the net value of imports — the value of goods imported less the value of exports of transport services.7 This practice meant that household final consumption expenditure on imported Water transport was -A$135.7 million. This negative was removed by setting private final consumption of imported Water transport to +$A25.7 million on the basis of information provided in the 1993-94 input-output tables (ABS 1997).8 To hold household consumption of Water transport fixed, domestic consumption of Water transport was reduced by A$161.4 million.9
7 Alternatively, imports of goods could be recorded in the Imports table (I-O tables 3) and the freight component could be recorded as an export of the relevant transport service (eg water transport) in the Use table (I-O table 2) and in the relevant margin table (eg I-O table 29). 8 Household final consumption of imported water transport in 1996-97 was set to 4 per cent of total intermediate usage, the same share as in the 1993-94 input-output tables (ABS 1997). 9 An adjustment to exports could not be made as this ‘net’ value could not be split up into the export and import components.
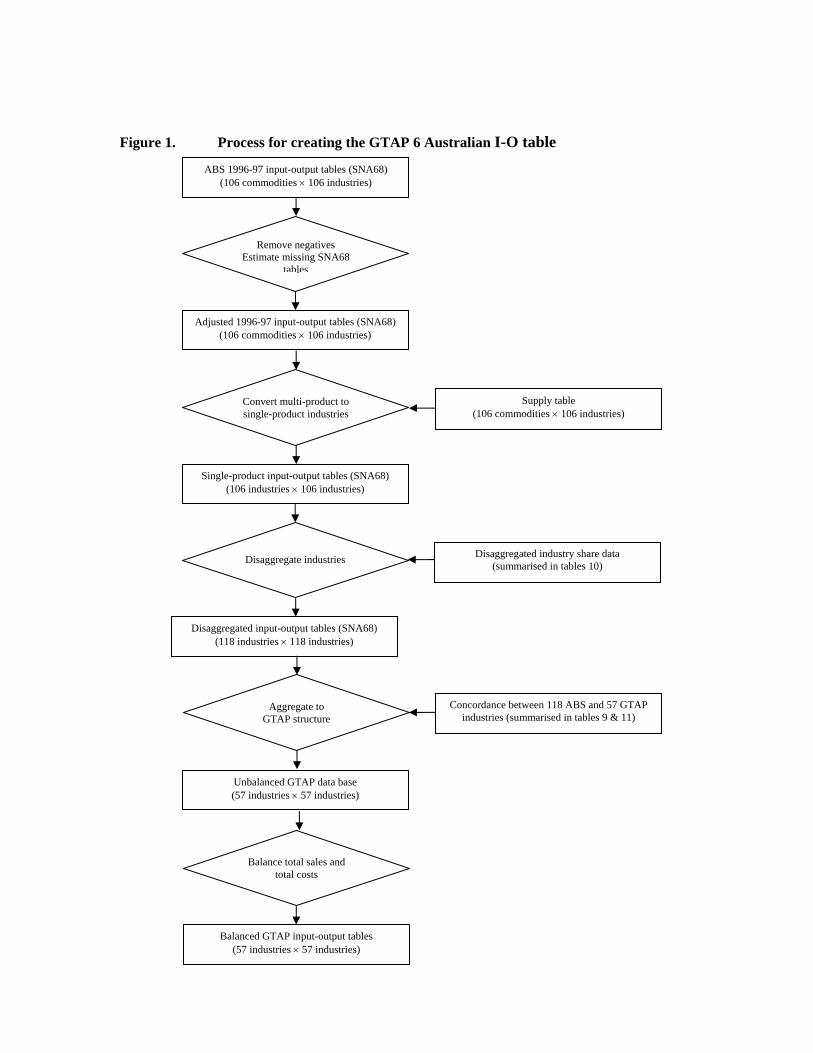
Figure 1. Process for creating the GTAP 6 Australian I-O table
ABS 1996-97 input-output tables (SNA68) (106 commodities × 106 industries)
Adjusted 1996-97 input-output tables (SNA68) (106 commodities × 106 industries)
Single-product input-output tables (SNA68) (106 industries × 106 industries)
Disaggregated input-output tables (SNA68) (118 industries × 118 industries)
Unbalanced GTAP data base (57 industries × 57 industries)
Convert multi-product to single-product industries
Supply table (106 commodities × 106 industries)
Disaggregate industries
Aggregate to GTAP structure
Balance total sales and total costs
Concordance between 118 ABS and 57 GTAP industries (summarised in tables 9 & 11)
Disaggregated industry share data (summarised in tables 10)
Remove negatives Estimate missing SNA68
tables
Balanced GTAP input-output tables (57 industries × 57 industries)
3.2 Estimation of Missing Data Vectors and Flows One of the GTAP matrices is valued at purchasers’ prices (matrix UP). In addition to data on basic prices (matrix UF), this requires product taxes to be known for the use of domestic and imported commodities.
In principle, this table could have been obtained from the ABS tables supplied together with the Taxes on products (net) table (I-O table 33). The information could also be obtained from the underlying ABS tables:
• sales tax by commodity and category of use (I-O table 34); • import duty by commodity and category of use (I-O table 35); • other taxes on products by commodity and category of use (I-O table 36); and • (less) subsidies on products by commodity and category of use (I-O table 37).
However, revised variants of these tables were not provided with the tables including the revised (SNA68) treatment of transport margins service flows. To complete the data set an implied ‘ad valorem’ duty, tax or subsidy rate with respect to basic price flows was estimated from tables with the initial (SNA93) treatment of transport services. This ad valorem rate was applied to the revised usage tables and imports table, as appropriate, to derive revised tables showing imports duty and all other (net) product taxes. Finally, the results so derived for each industry, for each product tax category, were applied to ensure that industry tables matched comparable values provided by the ABS.
As a result, SNA68 tables were estimated for: • duty on imports by commodity and using sector; • commodity taxes on products (net); and • taxes on products (net).10
The Duty table was estimated by: • estimating the SNA93 average rates of import duty by dividing the SNA93 Duty table
by the SNA93 Imports table; and • applying these average rates of import duty to the SNA68 Imports table.11
10 The prefix SNA68 or SNA93 is used to identify the source of the underlying data used to derive that table. The label SNA93 refers to data compiled on an SNA93 basis and sourced or derived from the electronic files underlying the published input-output tables (ABS 2001a). The label SNA68 refers to data compiled on an SNA68 basis and sourced or derived from the electronic SNA68 files supplied by the ABS. 11 The previous input-output tables report that custom duties on commodities for which an excise tax is levied on local product are treated as commodity taxes (ABS 1997, para. 27, p. 5). This would lead to a small over-reporting of commodes taxes and underreporting of duty. Based on estimates derived from the differences between the calculated average rates of duty and those estimated by the Commission as part of its annual assistance measures, $46 million of commodity tax revenue was re-classified as duty to overcome this underreporting.
Similarly, the Commodity taxes on products table covering the net effect of sales tax, taxes on products and subsidies on products was estimated by:
• calculating SNA93 Commodity taxes on products table by subtracting the SNA93
Duty table from the SNA93 Taxes on products table; • estimating the SNA93 average commodity tax rates on local and imported products by
dividing the SNA93 Commodity taxes on products table by the SNA93 Total use table; and
• applying these average commodity tax rates to the SNA68 Domestic use table and Imports table (giving commodity taxes on domestic use and commodity taxes on imports, respectively).12
Total product taxes on imports is the duty of duty and commodity taxes on imports. The Taxes on products table was calculated as the sum of duty and commodity taxes on
products. RAS procedures were applied to the Commodity taxes on products table to ensure that the column totals in the Taxes on products table matched the SNA68 Taxes less subsidies on products supplied by the ABS (row P3 in the in the Total use table). 3.3 Treatment of Complementary Imports The use and imports table supplied by the ABS distinguished between imports of goods produced in Australia (Competing imports, row P6) and those that are not (Complementary imports, row P5). Complementary imports in 1996-97 mostly comprised motor cycles (A$250.8 million) and natural rubber (A$78.8 million) (ABS 2001a, p. 92). Competing imports accounted for 99.7 per cent of Australian imports in 1996-97.
The GTAP Data Base assigns all imports to specified industry of origin products and makes no provision for complementary imports defined from the perspective of an individual country. In order to conform to GTAP accounting conventions, Complementary imports were allocated to each industry’s use of competing imports in the imports and total use tables and the totals were increased accordingly.
This treatment of complementary imports affected the building blocks used for all of the
matrices supplied to GTAP. 3.4 Treatment of Re-exports The imports table supplied by the ABS contained information on re-exports — goods temporarily brought into Australia that are subsequently exported (row 9909). Re-exports accounted for 2 per cent of Australian imports in 1996-97.
12 In a few isolated cases, the resulting commodity tax estimates for that industry were adjusted to ensure that activity at producer prices remained unchanged.
As re-exports are not permitted in the GTAP Data Base, re-exports were subtracted from total exports of that commodity and from total imports of that commodity. Handling and distribution costs associated with re-exports are included in the data base as they form part of Australian economic activity.
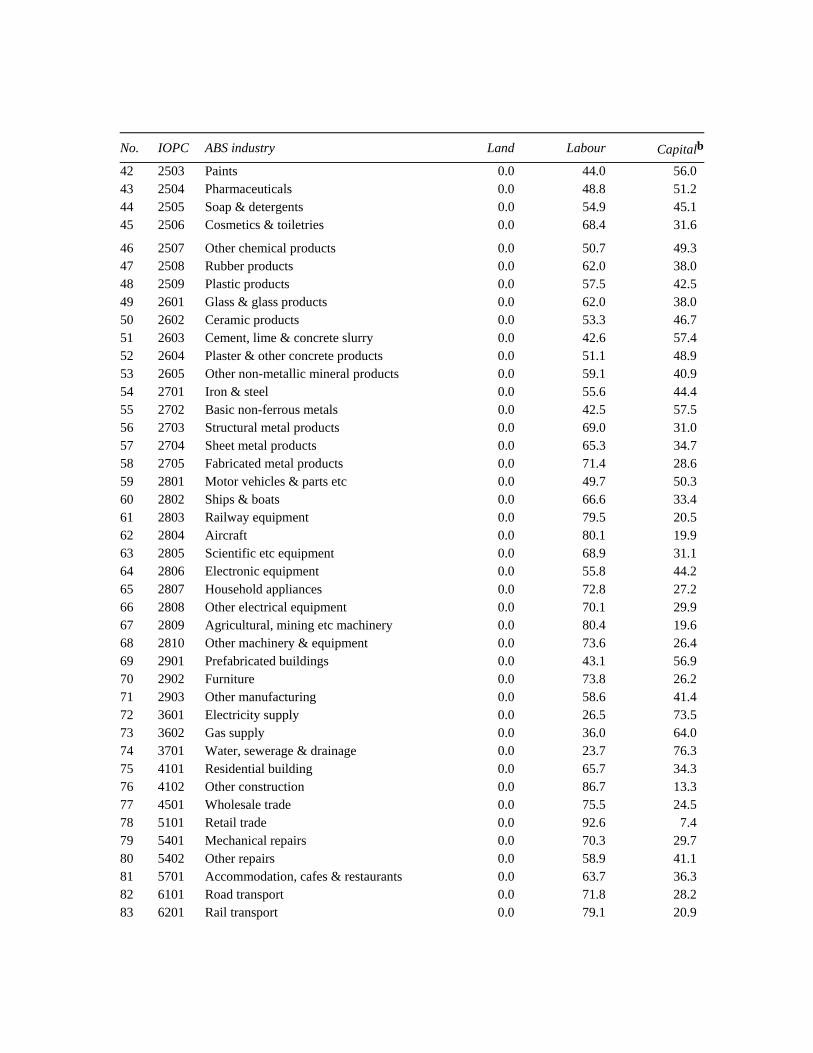
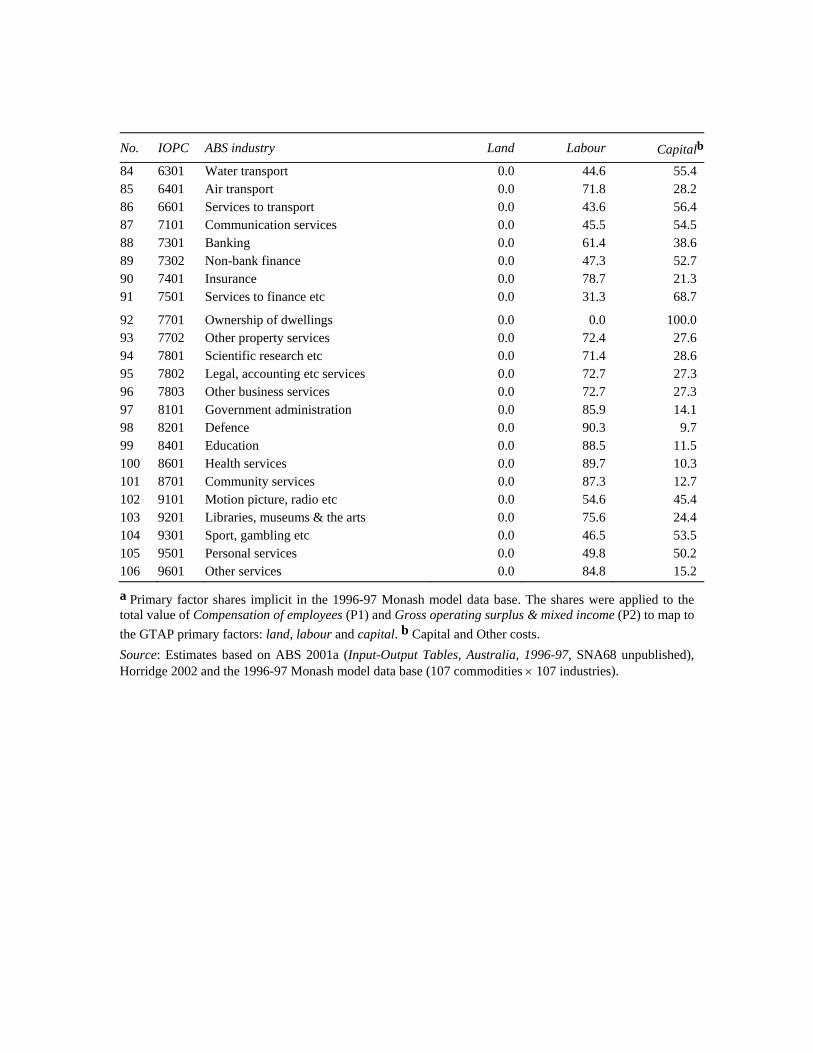
3.5 Treatment of Primary Factors of Production The total use table supplied by the ABS provided data on the use of two primary factors of production by each industry — Compensation of employees (row P1) and Gross operating surplus & mixed income (row P2). These categories overlap with the primary input categories specified for land, labour and capital in the GTAP Data Base.
To complete the GTAP Data Base, the ABS categories were mapped to GTAP categories using a decomposition applied in the benchmarking of the Monash model data base to the ABS input-output tables for 1996-97 (table 5). Horridge (2002) describes the derivation of the primary factor returns from the published input-output tables that underlie the shares used.
This treatment of primary factors of production affected the ‘building blocks’ used for all
of the matrices supplied to GTAP except for the imports matrix (matrix MF).
3.6 Treatment of Final Demands The ABS provided data on commodity sales to each category of final demand — household consumption; government consumption; gross fixed capital formation disaggregated to private, public enterprises and general government; changes in inventories; and exports (table 6).
The categorisation is similar to that applied in GTAP, with the exception that the ABS categories of Gross fixed capital formation — Private (column Q3); Gross fixed capital formation — Public enterprises (column Q4); and Gross fixed capital formation — General Government (column Q5). To complete the GTAP data base, these categories were aggregated to form the GTAP final demand category Investment.
This treatment of final demands affected the ‘building blocks’ used for the GTAP supply
and use matrices with and without product taxes (matrices UP and UF, respectively). 3.7 Converting Mult-product Industries to Single- product Industries The basic input-output tables provided by the ABS are ‘multi-product’ in nature, that is, each industry produce commodities characteristic of that industry and can also produce commodities characteristic of other industries (eg the Dairy products industry primarily produced Dairy products but also had some output of Meat and meat products).
Because the GTAP Model (and hence its data base) is ‘single product’ in nature, that is, each industry is defined as producing only one commodity and each commodity is produced by only one industry. The multi-product ABS input-output tables had to be converted to a single-product, or symmetric, data base. This was achieved by applying the industry technology assumption whereby all products produced by an industry are assumed to be produced with the same input-output structure. It also was assumed that an industry supplied each user of products it produced in proportion to its market share for that product. Production or market share information needed for the application of these assumptions was provided by the ABS.
The application of these assumptions enables the commodity by industry tables supplied
by the ABS to be converted to ‘industry by industry’, or symmetric, tables.
This treatment of ‘multi-product’ industries affected the ‘building blocks’ for all of the matrices supplied to GTAP.
3.8 Mapping ABS Products to their GTAP Counterparts The Australian input-output tables have 106 products compared to the 57 in the GTAP 6 Data Base, these are listed in tables 1 and 7, respectively.
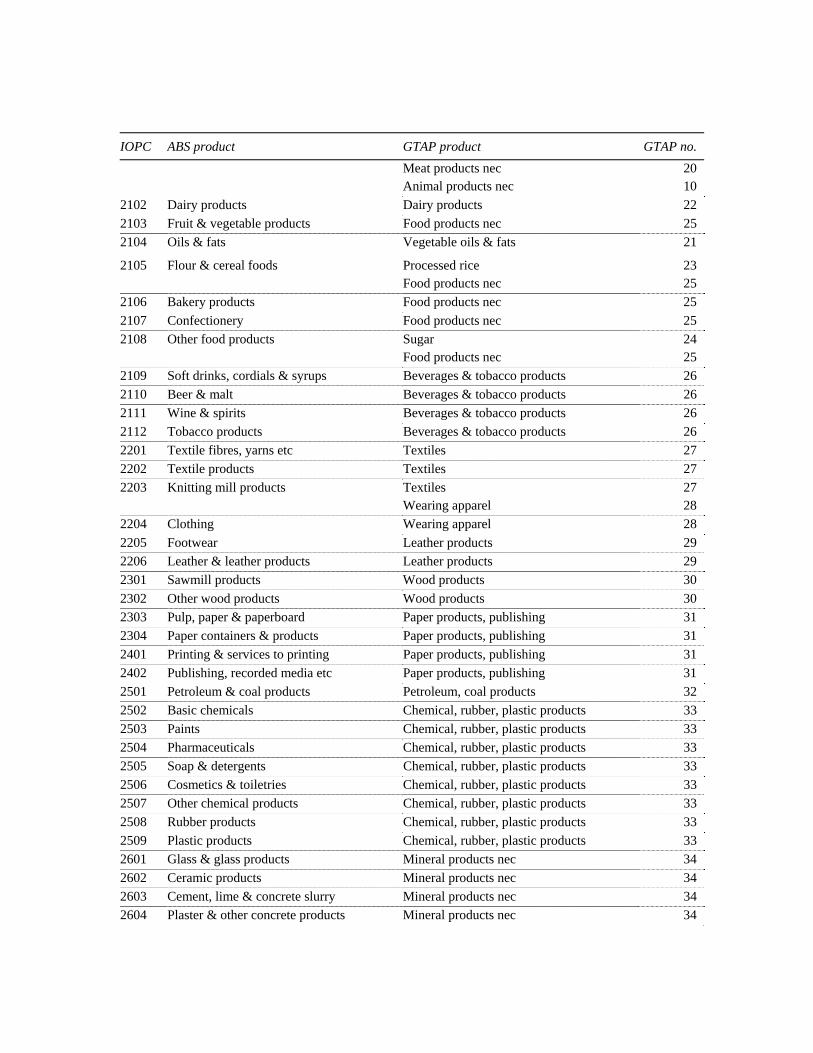
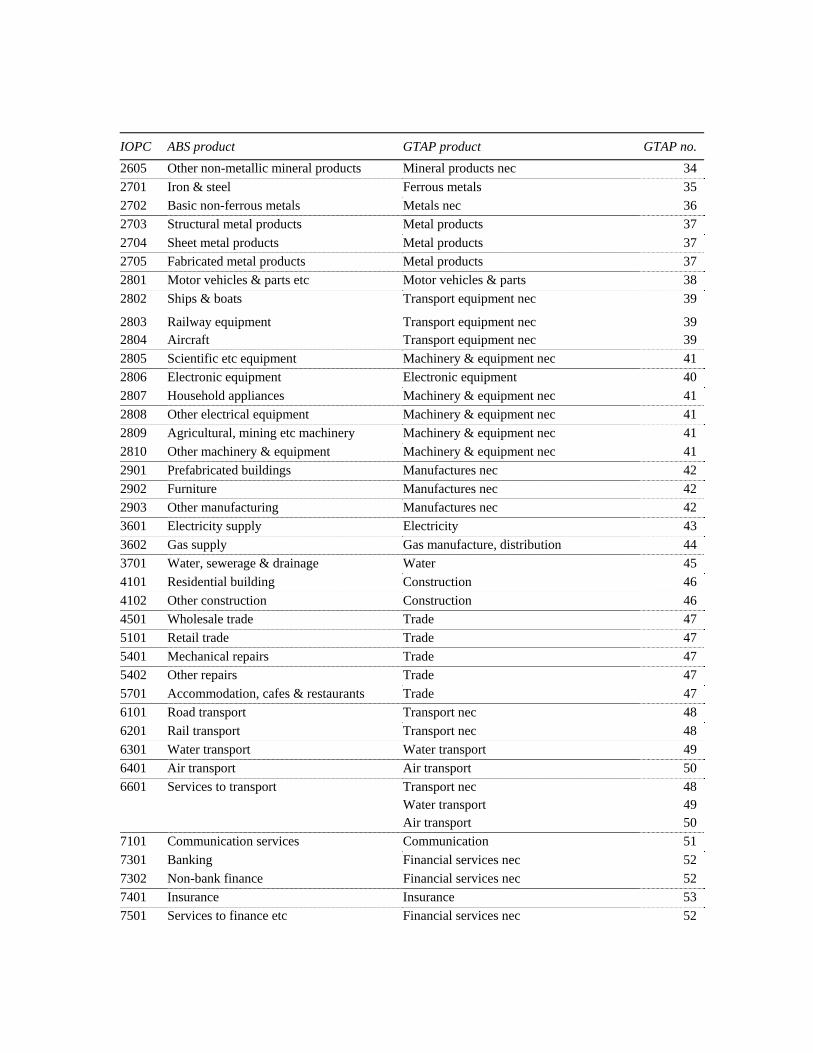
Table 8 lists the concordance used to map each ABS product to its GTAP counterparts. The concordance shows that 93 ABS products can be linked directly to one of GTAP
products without adjustment. However, 13 ABS products were linked to more than one GTAP product.13 For example, the ABS product Grains is linked to the GTAP products Paddy rice, Wheat, Oil-seeds and Cereal grains. The adjustment involved either splitting ABS products into components corresponding to GTAP products (disaggregating) or as part of a proportional allocation process (mapping).
Two techniques were used to map the 13 ABS products linked to more than one GTAP product.
The first technique used involved disaggregating the sales and production data supplied by the ABS for 8 of the 13 products into components corresponding to GTAP products (table 10). For example, the ABS product Sheep was split into two components, Wool and Sheepmeat, which, respectively, corresponded to the GTAP products Wool, silk-worm cocoons and Bovine cattle, sheep & goats, horses.
Some of the 1996-97 data bases for Monash model contain product structures more closely aligned to the GTAP classification than that used by the ABS in the input-output tables.14 The Monash model data bases contained detailed sales information for many of the components
13 The data used is too detailed to present here in full and is available from the authors on request. 14 The Monash model has a number of data bases loosely based on the 1996-97 ABS input-output tables. The main differences between these data bases relate to their sectoral classification, both in terms of the number and type of sectors, and whether they contain ‘multi-product’ or ‘single-product’ industries.
need to map the ABS products to GTAP. For example, the 115 × 113 Monash data base contained a breakdown of sales for Wool and Sheepmeat to each industry and category of final demand (household consumption, government consumption, investment, changes in inventories and exports).
For most of the 8 ABS products disaggregated, their sales in the ABS input-output tables
(ie the rows) were split between the components according to their share of the group’s sales in the corresponding Monash data base used.15 That is, exports of the Sheep (the ‘group’) were split 89.7 per cent to Wool and 10.3 per cent Sheepmeat (the ‘components’) according to their share of ‘wool’ exports in the Monash data base used (ie the sum of wool and Sheepmeat exports). Each component’s share of group sales is different for each industry and category of final demand.
A similar process was then used to disaggregate each industry in the ABS input-output tables (ie the columns).
In the absence of detailed product-specific sales information, the sales and costs of the
remaining ABS products (Services to agriculture and Flour & cereal foods) were disaggregated into their components using a constant share based on their share of total sales of the ABS product being disaggregated.
The second technique used involved mapping a constant proportion of all sales and costs of 9 of the ABS products (including 4 created as a result of the disaggregation process) to the relevant GTAP products (table 10). This approach presupposes that the sales and cost structure of each component takes on the same pattern as the group containing it. The proportions used to map each of the components were their share of total sales of the relevant group (tables 12 to 22).16
Care was taken to ensure that the values in the cross-over cells for each commodity and
industry split agreed with the mix of inputs used in Australian production and that the resulting total supply shares and values corresponded to the published totals (tables 12 to 22).
This mapping of ABS products affected the ‘building blocks’ for all of the matrices
supplied to GTAP. 3.9 Balancing the I-O Table Once all adjustments were completed, the GTAP data files were checked to ensure that: (a) total industry sales equalled total costs for each industry; and (b) the level and components of GDP agreed with estimates published by the ABS.
15 Two 1996-97 Monash model data bases were used to disaggregate the ABS products, one with 144 commodities and 144 industries and another with 115 commodities and 113 industries. 16 The share of imports was also used for imports of Processed rice.
Where there were differences between total sales and total costs for an industry, payments to the three primary factors of production were scaled equally to ensure that total costs matched total sales for that industry.
4. I-O Table Supplied to GTAP The data supplied to GTAP met the requirements set out in Huff, McDougall and Walmsley (2000). It contained four matrices in header array file format (table 23).
The supply and use matrix without product taxes (matrix UF) details the use of each GTAP product from local and imported sources and primary factors by each GTAP product and category of final demand. This matrix was constructed using three building blocks. The first building block consisted of data on the use of domestic production and came from the single-product SNA68 Domestic use table. The second building block consisted on the use of imports and came from the single-product SNA68 Imports table. The third building block consisted of data on the use of primary factors and came from the SNA68 Domestic use table. The resulting matrix is expressed in basic prices.
The supply and use matrix with product taxes (matrix UP) was constructed by adding two single building blocks to the supply and use matrix without product taxes (matrix UF). The building block for domestic use came from the single-product SNA68 Commodity taxes on domestic use table, while the building block for imports came from the single-product SNA68 Total product taxes on imports table. By definition, there are no product taxes on the three primary factors of production. The resulting matrix is expressed in producer prices.
The Value of output (matrix OP) was the value of Australian production (row T2) in the single-product SNA68 Total use table. The resulting matrix is expressed in market prices as it includes Taxes less subsidies on products (row P3), which is part of the GTAP matrix UP, and Other taxes less subsidies on production (row P4).17
The Value of imports cif (matrix MF) was the single-product variant of the Imports table. The resulting matrix is expressed in basic prices.
5. Comparability with Previous GTAP Data Bases The starting point for the GTAP version 5 of the Australian I-O table was the Monash model data base for the reference year 1993-94. That table was based on ABS input-output tables for that year; however, it had the advantage of commodity and industry disaggregations needed to provide information according to the GTAP sectoral classification.
17 Other taxes less subsidies on production (row P4) consist of all taxes that enterprises incur as a result of engaging in production other than taxes on products and include payroll taxes, taxes on land and local government rates.
The starting point for the GTAP 6 Data Base was a special version of the input-output tables compiled by the ABS on request from the Productivity Commission. This version differed from the published tables for 1996-97 with respect to the treatment of transport margin services (as outlined above).
Although this treatment is aligned to the treatment of transport services in the 1993-94
Monash data base (and supporting input-output tables), the treatment has not been carried forward to the most recent Monash data base, at this stage.
More generally, the GTAP 6 Data Base provided has been compiled according to the
statistical standards promulgated in the SNA93, whereas the version 5 data base provided by Mastoris, Travis and Welsh (2002) was based on data compiled according to the statistical standards promulgated in the SNA68. Details of the changes to the Australian national accounts and supporting output tables associated with the new standards are provided in ABS (1997).
6. Diagnostics The Australian I-O table was checked to ensure that:
(a) there were no negative values (other than where appropriate);
(b) the pre- and post disaggregation value of costs and sales balanced;
(c) total sales equalled total costs;
(d) the values for GDP, GDP(I) and GDP(E) were correct;
(e) that the components of GDP(I) and GDP(E) were correct; andthe GTAP entropy input-output cost shares appeared correct.18
References ABS (Australian Bureau of Statistics) 1994. Input-Output Tables, Australia, 1989-90, Cat.
no. 5209.0, April. —— 1995. Central Product Classification, October. —— 1997. Input-Output Tables, Australia, 1993-94, Cat. no. 5209.0, June. —— 1999. Input-Output Tables, Australia, 1994-95, Cat. no. 5209.0, March. —— 2000. Australian National Account: Concepts, Sources and Methodology, Cat. no. 5216.0,
November. —— 2001a. Input-Output Tables, Australia, 1996-97, Cat. no. 5209.0, March. —— 2001b. Input-Output Tables Product Details, Australian National Accounts, 1996-97, Cat.
no. 5215.0, March. Aspen, C. 2001. The SNA93 definition of basic prices with particular reference to transport
margins: is the SNA definition flawed? National Accounts, Statistics Directorate, Organisation of Economic Co-operation and Development, STD/NA (2011)11, Paris, 17 September.
Commission of European Communities, International Monetary Fund, Organisation of Economic
Co-operation and Development, United Nations and World Bank. 19930 System of National Accounts 1993 (SNA93), Brussels/Luxembourg, New York, Paris, Washington.
18 The entropy input-output cost shares used measure the difference in cost shares for each industry in the Australian I-O table compared to a representative GTAP Data Base and highlight any unusual cost shares (Walmsley and McDougall 2001).
Gretton, P., Bobbin, I. and Horridge, M. 2004. A users perspective on the treatment of transport
activities in input-output tables and suggestions for the future, Paper presented at the International Conference on Input-output and General Equilibrium: Data, Modelling and Policy Analysis, Brussels, 2–4 September.
Horridge, M. 2002. Preparation of a CGE data base for the 1996-97 Australian input-output
tables, Mimeo, Centre of Policy Studies, Monash University, April. Huff, K., McDougall, R. and Walmsley, T. 2000. Contributing Input-Output Tables to the GTAP
Data Base, GTAP Technical Paper No. 1, Release 4.2, January. Mastoris, I., Travis, J. and Welsh, A. 2002. ‘Australia’, Chapter 11.B in Dimaranan, B.V. and
McDougall, R.A. (eds), Global Trade, Assistance, and Production: The GTAP 5 Data Base, Center for Global Trade Analysis, Purdue University, pp. 11.B.1–11.B.33.
UN (United Nations). 1968. A System of National Accounts (SNA68), Studies in Methods,
series F, no. 2, rev. 3, Department of Economic and Social Affairs, Statistical Office of the United Nations, New York.
Walmsley, T. and McDougall, R. 2001. Using entropy to compute shares, mimeo, GTAP,
http://www.gtap.agecon.purdue.edu/resources/download/2041.pdf.
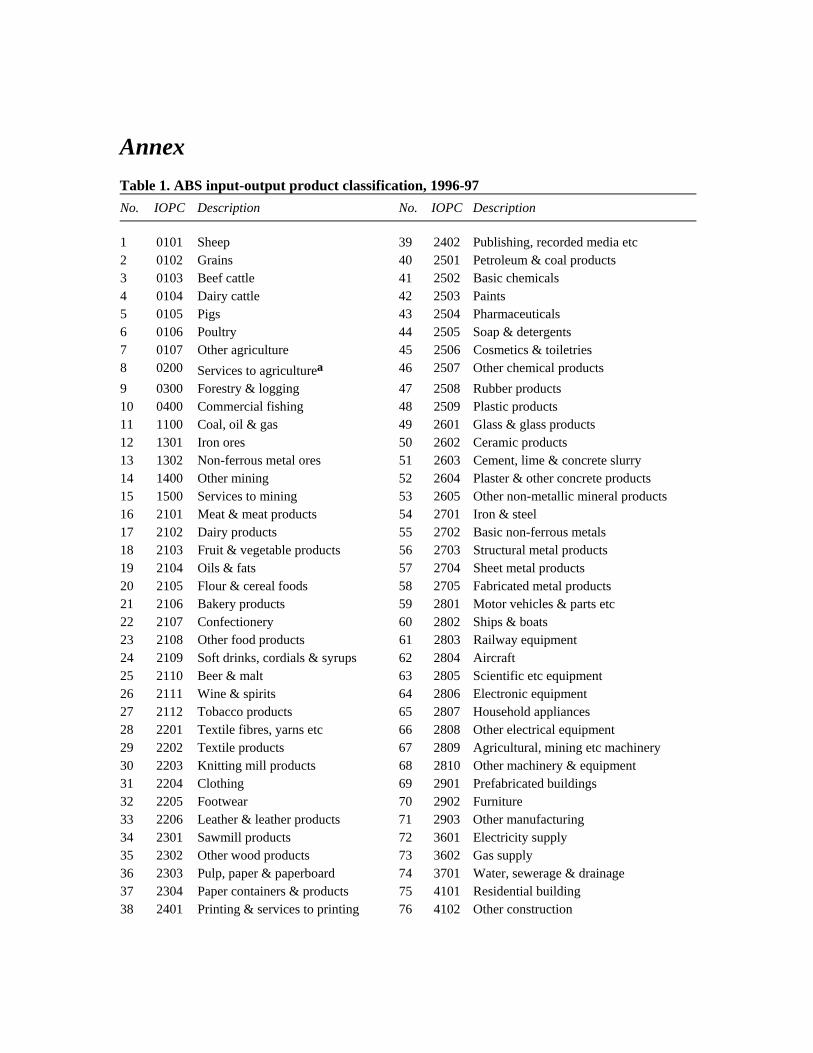
Annex Table 1. ABS input-output product classification, 1996-97 No. IOPC Description No. IOPC Description
1 0101 Sheep 39 2402 Publishing, recorded media etc 2 0102 Grains 40 2501 Petroleum & coal products 3 0103 Beef cattle 41 2502 Basic chemicals 4 0104 Dairy cattle 42 2503 Paints 5 0105 Pigs 43 2504 Pharmaceuticals 6 0106 Poultry 44 2505 Soap & detergents 7 0107 Other agriculture 45 2506 Cosmetics & toiletries 8 0200 Services to agriculturea 46 2507 Other chemical products 9 0300 Forestry & logging 47 2508 Rubber products 10 0400 Commercial fishing 48 2509 Plastic products 11 1100 Coal, oil & gas 49 2601 Glass & glass products 12 1301 Iron ores 50 2602 Ceramic products 13 1302 Non-ferrous metal ores 51 2603 Cement, lime & concrete slurry 14 1400 Other mining 52 2604 Plaster & other concrete products 15 1500 Services to mining 53 2605 Other non-metallic mineral products 16 2101 Meat & meat products 54 2701 Iron & steel 17 2102 Dairy products 55 2702 Basic non-ferrous metals 18 2103 Fruit & vegetable products 56 2703 Structural metal products 19 2104 Oils & fats 57 2704 Sheet metal products 20 2105 Flour & cereal foods 58 2705 Fabricated metal products 21 2106 Bakery products 59 2801 Motor vehicles & parts etc 22 2107 Confectionery 60 2802 Ships & boats 23 2108 Other food products 61 2803 Railway equipment 24 2109 Soft drinks, cordials & syrups 62 2804 Aircraft 25 2110 Beer & malt 63 2805 Scientific etc equipment 26 2111 Wine & spirits 64 2806 Electronic equipment 27 2112 Tobacco products 65 2807 Household appliances 28 2201 Textile fibres, yarns etc 66 2808 Other electrical equipment 29 2202 Textile products 67 2809 Agricultural, mining etc machinery 30 2203 Knitting mill products 68 2810 Other machinery & equipment 31 2204 Clothing 69 2901 Prefabricated buildings 32 2205 Footwear 70 2902 Furniture 33 2206 Leather & leather products 71 2903 Other manufacturing 34 2301 Sawmill products 72 3601 Electricity supply 35 2302 Other wood products 73 3602 Gas supply 36 2303 Pulp, paper & paperboard 74 3701 Water, sewerage & drainage 37 2304 Paper containers & products 75 4101 Residential building 38 2401 Printing & services to printing 76 4102 Other construction
No. IOPC Description No. IOPC Description
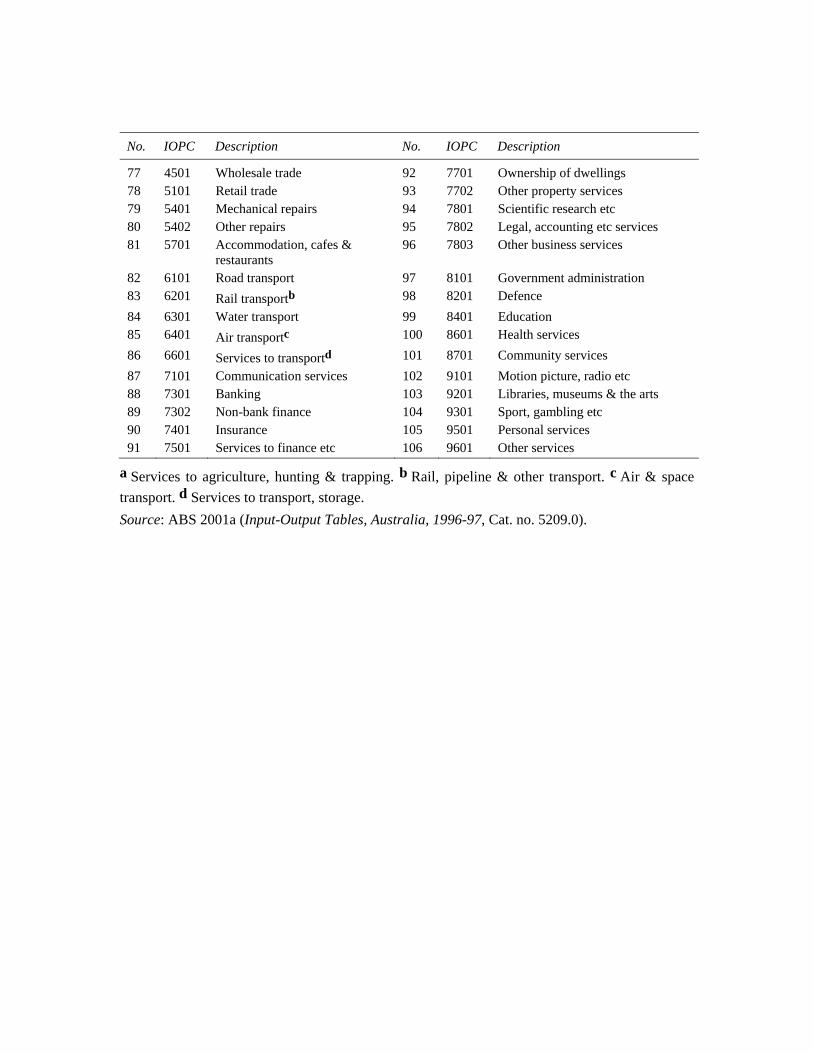
77 4501 Wholesale trade 92 7701 Ownership of dwellings 78 5101 Retail trade 93 7702 Other property services 79 5401 Mechanical repairs 94 7801 Scientific research etc 80 5402 Other repairs 95 7802 Legal, accounting etc services 81 5701 Accommodation, cafes &
restaurants 96 7803 Other business services
82 6101 Road transport 97 8101 Government administration 83 6201 Rail transportb 98 8201 Defence 84 6301 Water transport 99 8401 Education 85 6401 Air transportc 100 8601 Health services 86 6601 Services to transportd 101 8701 Community services 87 7101 Communication services 102 9101 Motion picture, radio etc 88 7301 Banking 103 9201 Libraries, museums & the arts 89 7302 Non-bank finance 104 9301 Sport, gambling etc 90 7401 Insurance 105 9501 Personal services 91 7501 Services to finance etc 106 9601 Other services
a Services to agriculture, hunting & trapping. b Rail, pipeline & other transport. c Air & space transport. d Services to transport, storage. Source: ABS 2001a (Input-Output Tables, Australia, 1996-97, Cat. no. 5209.0).
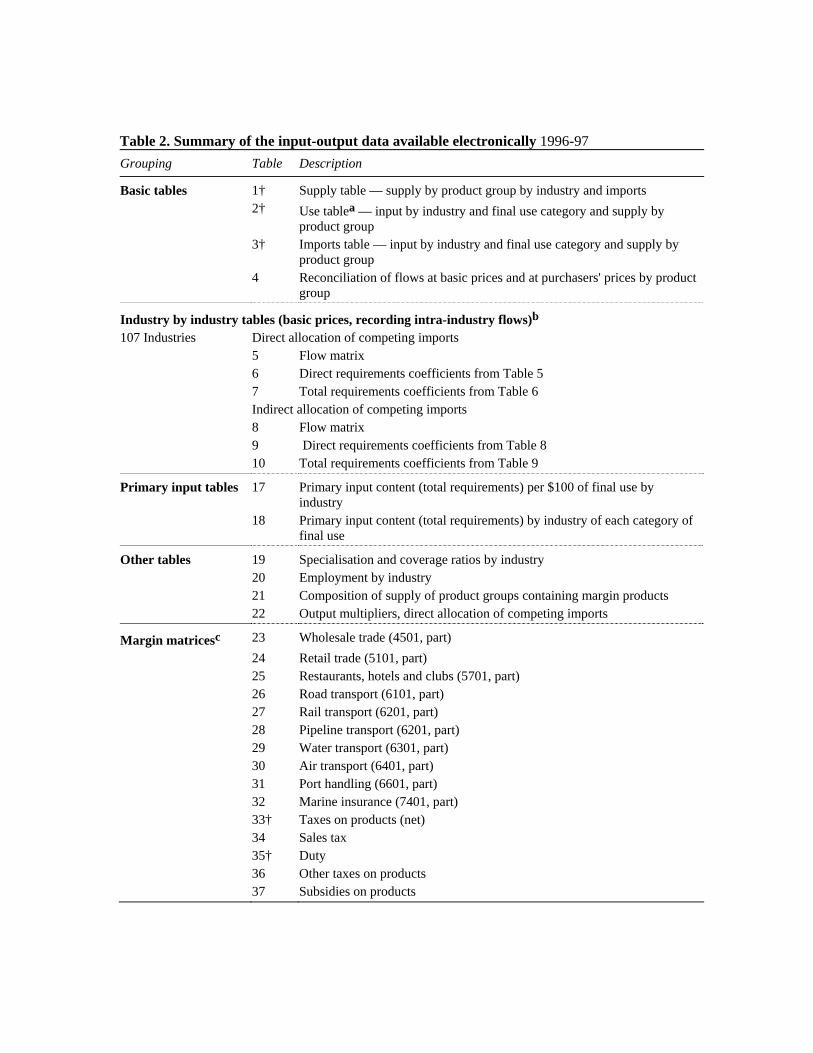
Table 2. Summary of the input-output data available electronically 1996-97 Grouping Table Description
Basic tables 1† Supply table — supply by product group by industry and imports 2† Use tablea — input by industry and final use category and supply by
product group 3† Imports table — input by industry and final use category and supply by
product group 4 Reconciliation of flows at basic prices and at purchasers' prices by product
group
Industry by industry tables (basic prices, recording intra-industry flows)b 107 Industries Direct allocation of competing imports 5 Flow matrix 6 Direct requirements coefficients from Table 5 7 Total requirements coefficients from Table 6 Indirect allocation of competing imports 8 Flow matrix 9 Direct requirements coefficients from Table 8 10 Total requirements coefficients from Table 9
Primary input tables 17 Primary input content (total requirements) per $100 of final use by industry
18 Primary input content (total requirements) by industry of each category of final use
Other tables 19 Specialisation and coverage ratios by industry 20 Employment by industry 21 Composition of supply of product groups containing margin products 22 Output multipliers, direct allocation of competing imports
Margin matricesc 23 Wholesale trade (4501, part) 24 Retail trade (5101, part) 25 Restaurants, hotels and clubs (5701, part) 26 Road transport (6101, part) 27 Rail transport (6201, part) 28 Pipeline transport (6201, part) 29 Water transport (6301, part) 30 Air transport (6401, part) 31 Port handling (6601, part) 32 Marine insurance (7401, part) 33† Taxes on products (net) 34 Sales tax 35† Duty 36 Other taxes on products 37 Subsidies on products
† used in constructing the GTAP data base. a Referred to as the Total use table in this paper to differentiate it from domestic use. b Similar tables are available at the 35 industry level (IO tables 11 to 16). c Supply of margin by product group to which the margin applies and input of margin by industry and final use category. Source: ABS 2001a (Input-Output Tables, Australia, 1996-97, Cat. no. 5209.0, p. 93).
Table 3. Intermediate use of imported Water transport and Air transport Measure Units Water transport
(6301) Air transport
(6401)
Negative elements No. of cells 83 5 Total value of negative imports A$ million -50.0 -129.8 Total value of imports A$ million 686.8 1497.3 Negatives’ share Per cent 7.3 8.7
Source: ABS 2001a (Input-Output Tables, Australia, 1996-97, Cat. no. 5209.0, SNA68 unpublished).
Table 4. Negative cells in the SNA68 Domestic use tablea A$ million, 1996-97, Basic prices
Commodity Using industry Value
2806 Electronic equipment 0106 Poultry -0.00050 0104 Dairy cattle 2106 Bakery products -0.00004 0104 Dairy cattle 2108 Other food products -0.00002 0104 Dairy cattle 5701 Accommodation, cafes & restaurants -0.00118 7702 Other property services 7801 Scientific research etc -0.13875 0104 Dairy cattle 8201 Defence -0.00001 2805 Scientific equipment 9501 Personal services -0.16554
Total -0.30604
a Derived by subtracting SNA68 Imports table (IO table 3) from the SNA68 Use table (IO table 2). Source: ABS 2001a (Input-Output Tables, Australia, 1996-97, Cat. no. 5209.0, SNA68 unpublished).
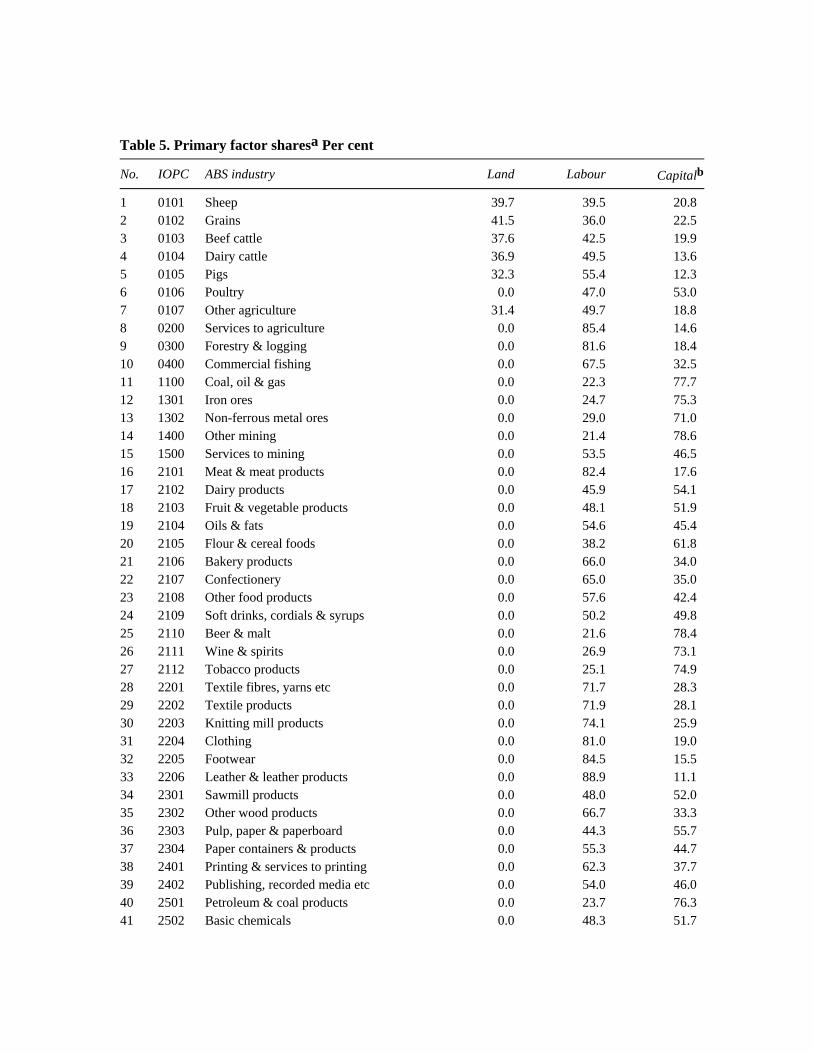
Table 5. Primary factor sharesa Per cent
No. IOPC ABS industry Land Labour Capitalb
1 0101 Sheep 39.7 39.5 20.8 2 0102 Grains 41.5 36.0 22.5 3 0103 Beef cattle 37.6 42.5 19.9 4 0104 Dairy cattle 36.9 49.5 13.6 5 0105 Pigs 32.3 55.4 12.3 6 0106 Poultry 0.0 47.0 53.0 7 0107 Other agriculture 31.4 49.7 18.8 8 0200 Services to agriculture 0.0 85.4 14.6 9 0300 Forestry & logging 0.0 81.6 18.4 10 0400 Commercial fishing 0.0 67.5 32.5 11 1100 Coal, oil & gas 0.0 22.3 77.7 12 1301 Iron ores 0.0 24.7 75.3 13 1302 Non-ferrous metal ores 0.0 29.0 71.0 14 1400 Other mining 0.0 21.4 78.6 15 1500 Services to mining 0.0 53.5 46.5 16 2101 Meat & meat products 0.0 82.4 17.6 17 2102 Dairy products 0.0 45.9 54.1 18 2103 Fruit & vegetable products 0.0 48.1 51.9 19 2104 Oils & fats 0.0 54.6 45.4 20 2105 Flour & cereal foods 0.0 38.2 61.8 21 2106 Bakery products 0.0 66.0 34.0 22 2107 Confectionery 0.0 65.0 35.0 23 2108 Other food products 0.0 57.6 42.4 24 2109 Soft drinks, cordials & syrups 0.0 50.2 49.8 25 2110 Beer & malt 0.0 21.6 78.4 26 2111 Wine & spirits 0.0 26.9 73.1 27 2112 Tobacco products 0.0 25.1 74.9 28 2201 Textile fibres, yarns etc 0.0 71.7 28.3 29 2202 Textile products 0.0 71.9 28.1 30 2203 Knitting mill products 0.0 74.1 25.9 31 2204 Clothing 0.0 81.0 19.0 32 2205 Footwear 0.0 84.5 15.5 33 2206 Leather & leather products 0.0 88.9 11.1 34 2301 Sawmill products 0.0 48.0 52.0 35 2302 Other wood products 0.0 66.7 33.3 36 2303 Pulp, paper & paperboard 0.0 44.3 55.7 37 2304 Paper containers & products 0.0 55.3 44.7 38 2401 Printing & services to printing 0.0 62.3 37.7 39 2402 Publishing, recorded media etc 0.0 54.0 46.0 40 2501 Petroleum & coal products 0.0 23.7 76.3 41 2502 Basic chemicals 0.0 48.3 51.7
No. IOPC ABS industry Land Labour Capitalb
42 2503 Paints 0.0 44.0 56.0 43 2504 Pharmaceuticals 0.0 48.8 51.2 44 2505 Soap & detergents 0.0 54.9 45.1 45 2506 Cosmetics & toiletries 0.0 68.4 31.6
46 2507 Other chemical products 0.0 50.7 49.3 47 2508 Rubber products 0.0 62.0 38.0 48 2509 Plastic products 0.0 57.5 42.5 49 2601 Glass & glass products 0.0 62.0 38.0 50 2602 Ceramic products 0.0 53.3 46.7 51 2603 Cement, lime & concrete slurry 0.0 42.6 57.4 52 2604 Plaster & other concrete products 0.0 51.1 48.9 53 2605 Other non-metallic mineral products 0.0 59.1 40.9 54 2701 Iron & steel 0.0 55.6 44.4 55 2702 Basic non-ferrous metals 0.0 42.5 57.5 56 2703 Structural metal products 0.0 69.0 31.0 57 2704 Sheet metal products 0.0 65.3 34.7 58 2705 Fabricated metal products 0.0 71.4 28.6 59 2801 Motor vehicles & parts etc 0.0 49.7 50.3 60 2802 Ships & boats 0.0 66.6 33.4 61 2803 Railway equipment 0.0 79.5 20.5 62 2804 Aircraft 0.0 80.1 19.9 63 2805 Scientific etc equipment 0.0 68.9 31.1 64 2806 Electronic equipment 0.0 55.8 44.2 65 2807 Household appliances 0.0 72.8 27.2 66 2808 Other electrical equipment 0.0 70.1 29.9 67 2809 Agricultural, mining etc machinery 0.0 80.4 19.6 68 2810 Other machinery & equipment 0.0 73.6 26.4 69 2901 Prefabricated buildings 0.0 43.1 56.9 70 2902 Furniture 0.0 73.8 26.2 71 2903 Other manufacturing 0.0 58.6 41.4 72 3601 Electricity supply 0.0 26.5 73.5 73 3602 Gas supply 0.0 36.0 64.0 74 3701 Water, sewerage & drainage 0.0 23.7 76.3 75 4101 Residential building 0.0 65.7 34.3 76 4102 Other construction 0.0 86.7 13.3 77 4501 Wholesale trade 0.0 75.5 24.5 78 5101 Retail trade 0.0 92.6 7.4 79 5401 Mechanical repairs 0.0 70.3 29.7 80 5402 Other repairs 0.0 58.9 41.1 81 5701 Accommodation, cafes & restaurants 0.0 63.7 36.3 82 6101 Road transport 0.0 71.8 28.2 83 6201 Rail transport 0.0 79.1 20.9
No. IOPC ABS industry Land Labour Capitalb
84 6301 Water transport 0.0 44.6 55.4 85 6401 Air transport 0.0 71.8 28.2 86 6601 Services to transport 0.0 43.6 56.4 87 7101 Communication services 0.0 45.5 54.5 88 7301 Banking 0.0 61.4 38.6 89 7302 Non-bank finance 0.0 47.3 52.7 90 7401 Insurance 0.0 78.7 21.3 91 7501 Services to finance etc 0.0 31.3 68.7
92 7701 Ownership of dwellings 0.0 0.0 100.0 93 7702 Other property services 0.0 72.4 27.6 94 7801 Scientific research etc 0.0 71.4 28.6 95 7802 Legal, accounting etc services 0.0 72.7 27.3 96 7803 Other business services 0.0 72.7 27.3 97 8101 Government administration 0.0 85.9 14.1 98 8201 Defence 0.0 90.3 9.7 99 8401 Education 0.0 88.5 11.5 100 8601 Health services 0.0 89.7 10.3 101 8701 Community services 0.0 87.3 12.7 102 9101 Motion picture, radio etc 0.0 54.6 45.4 103 9201 Libraries, museums & the arts 0.0 75.6 24.4 104 9301 Sport, gambling etc 0.0 46.5 53.5 105 9501 Personal services 0.0 49.8 50.2 106 9601 Other services 0.0 84.8 15.2
a Primary factor shares implicit in the 1996-97 Monash model data base. The shares were applied to the total value of Compensation of employees (P1) and Gross operating surplus & mixed income (P2) to map to the GTAP primary factors: land, labour and capital. b Capital and Other costs. Source: Estimates based on ABS 2001a (Input-Output Tables, Australia, 1996-97, SNA68 unpublished), Horridge 2002 and the 1996-97 Monash model data base (107 commodities × 107 industries).
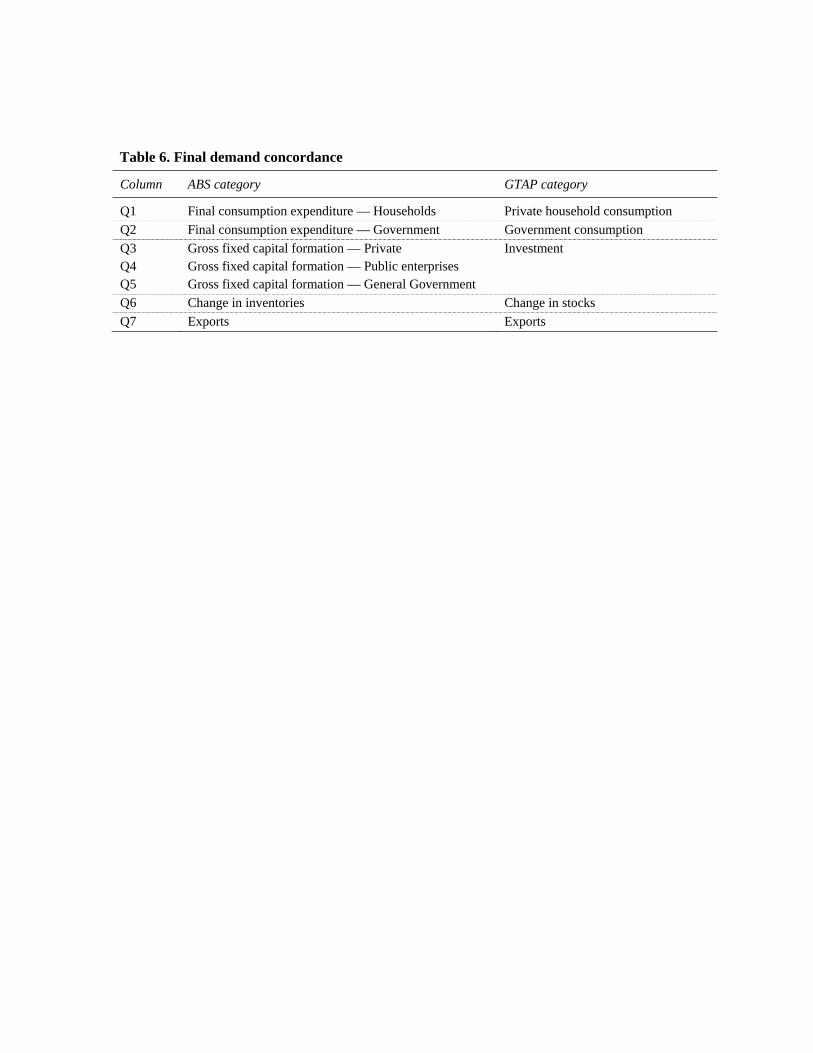
Table 6. Final demand concordance
Column ABS category GTAP category
Q1 Final consumption expenditure — Households Private household consumption Q2 Final consumption expenditure — Government Government consumption Q3 Gross fixed capital formation — Private Investment Q4 Gross fixed capital formation — Public enterprises Q5 Gross fixed capital formation — General Government Q6 Change in inventories Change in stocks Q7 Exports Exports
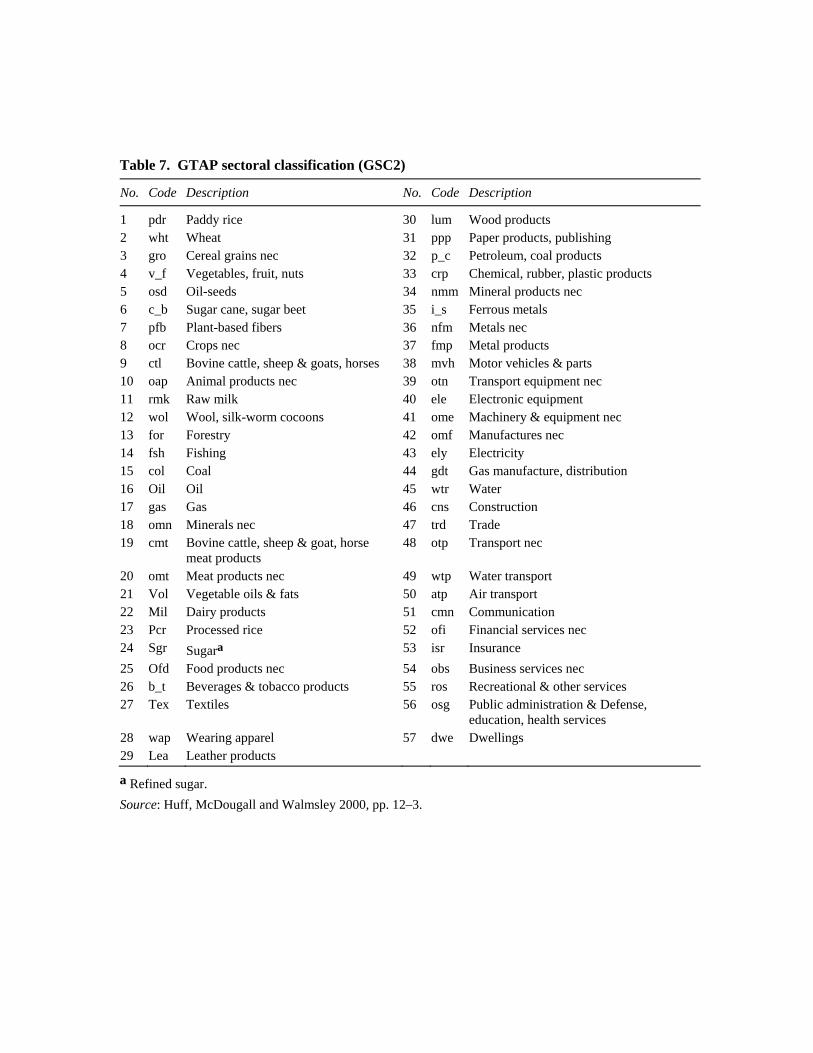
Table 7. GTAP sectoral classification (GSC2)
No. Code Description No. Code Description
1 pdr Paddy rice 30 lum Wood products 2 wht Wheat 31 ppp Paper products, publishing 3 gro Cereal grains nec 32 p_c Petroleum, coal products 4 v_f Vegetables, fruit, nuts 33 crp Chemical, rubber, plastic products 5 osd Oil-seeds 34 nmm Mineral products nec 6 c_b Sugar cane, sugar beet 35 i_s Ferrous metals 7 pfb Plant-based fibers 36 nfm Metals nec 8 ocr Crops nec 37 fmp Metal products 9 ctl Bovine cattle, sheep & goats, horses 38 mvh Motor vehicles & parts 10 oap Animal products nec 39 otn Transport equipment nec 11 rmk Raw milk 40 ele Electronic equipment 12 wol Wool, silk-worm cocoons 41 ome Machinery & equipment nec 13 for Forestry 42 omf Manufactures nec 14 fsh Fishing 43 ely Electricity 15 col Coal 44 gdt Gas manufacture, distribution 16 Oil Oil 45 wtr Water 17 gas Gas 46 cns Construction 18 omn Minerals nec 47 trd Trade 19 cmt Bovine cattle, sheep & goat, horse
meat products 48 otp Transport nec
20 omt Meat products nec 49 wtp Water transport 21 Vol Vegetable oils & fats 50 atp Air transport 22 Mil Dairy products 51 cmn Communication 23 Pcr Processed rice 52 ofi Financial services nec 24 Sgr Sugara 53 isr Insurance 25 Ofd Food products nec 54 obs Business services nec 26 b_t Beverages & tobacco products 55 ros Recreational & other services 27 Tex Textiles 56 osg Public administration & Defense,
education, health services 28 wap Wearing apparel 57 dwe Dwellings 29 Lea Leather products
a Refined sugar. Source: Huff, McDougall and Walmsley 2000, pp. 12–3.
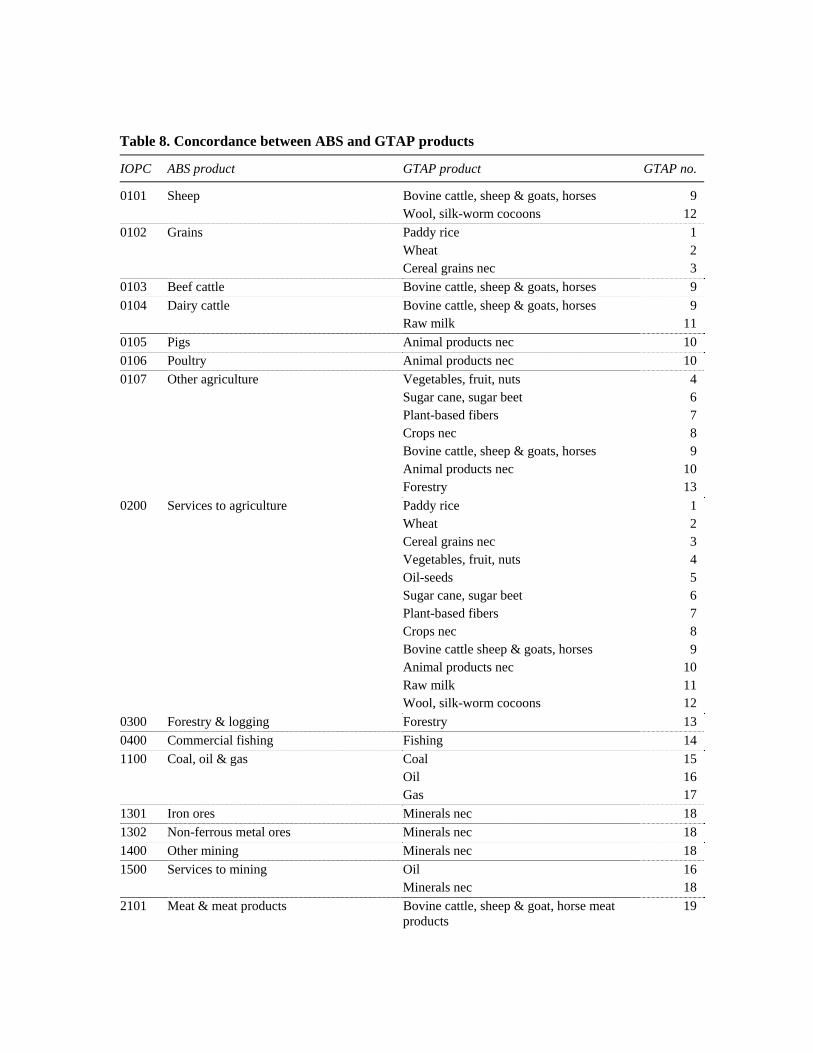
Table 8. Concordance between ABS and GTAP products
IOPC ABS product GTAP product GTAP no.
0101 Sheep Bovine cattle, sheep & goats, horses 9 Wool, silk-worm cocoons 12 0102 Grains Paddy rice 1 Wheat 2 Cereal grains nec 3 0103 Beef cattle Bovine cattle, sheep & goats, horses 9 0104 Dairy cattle Bovine cattle, sheep & goats, horses 9 Raw milk 11 0105 Pigs Animal products nec 10 0106 Poultry Animal products nec 10 0107 Other agriculture Vegetables, fruit, nuts 4 Sugar cane, sugar beet 6 Plant-based fibers 7 Crops nec 8 Bovine cattle, sheep & goats, horses 9 Animal products nec 10 Forestry 13 0200 Services to agriculture Paddy rice 1 Wheat 2 Cereal grains nec 3 Vegetables, fruit, nuts 4 Oil-seeds 5 Sugar cane, sugar beet 6 Plant-based fibers 7 Crops nec 8 Bovine cattle sheep & goats, horses 9 Animal products nec 10 Raw milk 11 Wool, silk-worm cocoons 12 0300 Forestry & logging Forestry 13 0400 Commercial fishing Fishing 14 1100 Coal, oil & gas Coal 15 Oil 16 Gas 17 1301 Iron ores Minerals nec 18 1302 Non-ferrous metal ores Minerals nec 18 1400 Other mining Minerals nec 18 1500 Services to mining Oil 16 Minerals nec 18 2101 Meat & meat products Bovine cattle, sheep & goat, horse meat
products 19
IOPC ABS product GTAP product GTAP no. Meat products nec 20 Animal products nec 10 2102 Dairy products Dairy products 22 2103 Fruit & vegetable products Food products nec 25 2104 Oils & fats Vegetable oils & fats 21
2105 Flour & cereal foods Processed rice 23 Food products nec 25 2106 Bakery products Food products nec 25 2107 Confectionery Food products nec 25 2108 Other food products Sugar 24 Food products nec 25 2109 Soft drinks, cordials & syrups Beverages & tobacco products 26 2110 Beer & malt Beverages & tobacco products 26 2111 Wine & spirits Beverages & tobacco products 26 2112 Tobacco products Beverages & tobacco products 26 2201 Textile fibres, yarns etc Textiles 27 2202 Textile products Textiles 27 2203 Knitting mill products Textiles 27 Wearing apparel 28 2204 Clothing Wearing apparel 28 2205 Footwear Leather products 29 2206 Leather & leather products Leather products 29 2301 Sawmill products Wood products 30 2302 Other wood products Wood products 30 2303 Pulp, paper & paperboard Paper products, publishing 31 2304 Paper containers & products Paper products, publishing 31 2401 Printing & services to printing Paper products, publishing 31 2402 Publishing, recorded media etc Paper products, publishing 31 2501 Petroleum & coal products Petroleum, coal products 32 2502 Basic chemicals Chemical, rubber, plastic products 33 2503 Paints Chemical, rubber, plastic products 33 2504 Pharmaceuticals Chemical, rubber, plastic products 33 2505 Soap & detergents Chemical, rubber, plastic products 33 2506 Cosmetics & toiletries Chemical, rubber, plastic products 33 2507 Other chemical products Chemical, rubber, plastic products 33 2508 Rubber products Chemical, rubber, plastic products 33 2509 Plastic products Chemical, rubber, plastic products 33 2601 Glass & glass products Mineral products nec 34 2602 Ceramic products Mineral products nec 34 2603 Cement, lime & concrete slurry Mineral products nec 34 2604 Plaster & other concrete products Mineral products nec 34
IOPC ABS product GTAP product GTAP no. 2605 Other non-metallic mineral products Mineral products nec 34 2701 Iron & steel Ferrous metals 35 2702 Basic non-ferrous metals Metals nec 36 2703 Structural metal products Metal products 37 2704 Sheet metal products Metal products 37 2705 Fabricated metal products Metal products 37 2801 Motor vehicles & parts etc Motor vehicles & parts 38 2802 Ships & boats Transport equipment nec 39
2803 Railway equipment Transport equipment nec 39 2804 Aircraft Transport equipment nec 39 2805 Scientific etc equipment Machinery & equipment nec 41 2806 Electronic equipment Electronic equipment 40 2807 Household appliances Machinery & equipment nec 41 2808 Other electrical equipment Machinery & equipment nec 41 2809 Agricultural, mining etc machinery Machinery & equipment nec 41 2810 Other machinery & equipment Machinery & equipment nec 41 2901 Prefabricated buildings Manufactures nec 42 2902 Furniture Manufactures nec 42 2903 Other manufacturing Manufactures nec 42 3601 Electricity supply Electricity 43 3602 Gas supply Gas manufacture, distribution 44 3701 Water, sewerage & drainage Water 45 4101 Residential building Construction 46 4102 Other construction Construction 46 4501 Wholesale trade Trade 47 5101 Retail trade Trade 47 5401 Mechanical repairs Trade 47 5402 Other repairs Trade 47 5701 Accommodation, cafes & restaurants Trade 47 6101 Road transport Transport nec 48 6201 Rail transport Transport nec 48 6301 Water transport Water transport 49 6401 Air transport Air transport 50 6601 Services to transport Transport nec 48 Water transport 49 Air transport 50 7101 Communication services Communication 51 7301 Banking Financial services nec 52 7302 Non-bank finance Financial services nec 52 7401 Insurance Insurance 53 7501 Services to finance etc Financial services nec 52
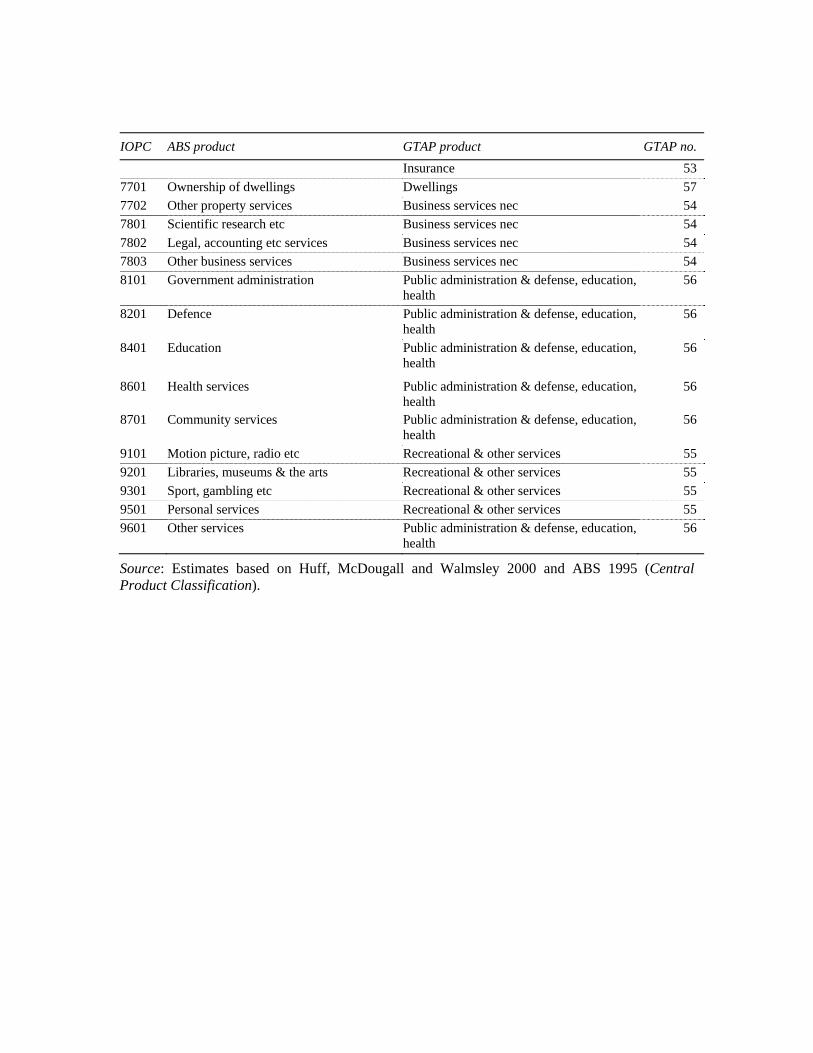
IOPC ABS product GTAP product GTAP no. Insurance 53 7701 Ownership of dwellings Dwellings 57 7702 Other property services Business services nec 54 7801 Scientific research etc Business services nec 54 7802 Legal, accounting etc services Business services nec 54 7803 Other business services Business services nec 54 8101 Government administration Public administration & defense, education,
health 56
8201 Defence Public administration & defense, education, health
56
8401 Education Public administration & defense, education, health
56
8601 Health services Public administration & defense, education, health
56
8701 Community services Public administration & defense, education, health
56
9101 Motion picture, radio etc Recreational & other services 55 9201 Libraries, museums & the arts Recreational & other services 55 9301 Sport, gambling etc Recreational & other services 55 9501 Personal services Recreational & other services 55 9601 Other services Public administration & defense, education,
health 56
Source: Estimates based on Huff, McDougall and Walmsley 2000 and ABS 1995 (Central Product Classification).
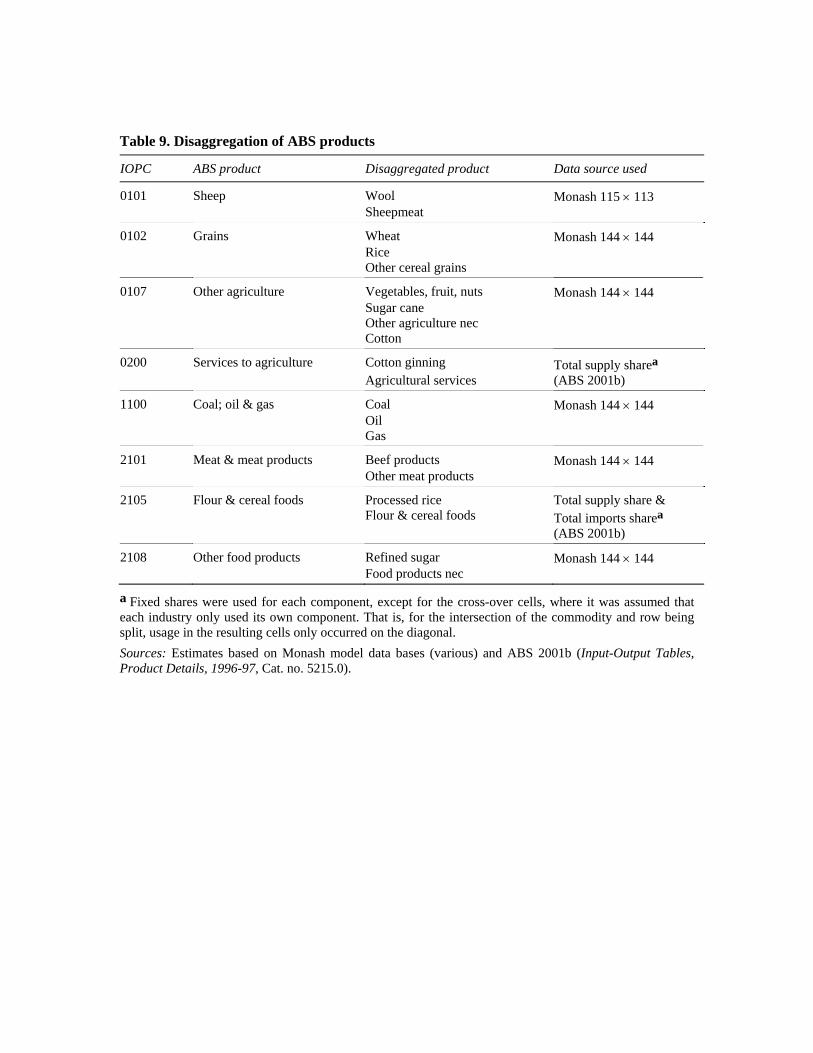
Table 9. Disaggregation of ABS products
IOPC ABS product Disaggregated product Data source used
0101 Sheep Wool Monash 115 × 113 Sheepmeat
0102 Grains Wheat Monash 144 × 144 Rice Other cereal grains
0107 Other agriculture Vegetables, fruit, nuts Monash 144 × 144 Sugar cane Other agriculture nec Cotton
0200 Services to agriculture Cotton ginning Total supply sharea Agricultural services (ABS 2001b)
1100 Coal; oil & gas Coal Monash 144 × 144 Oil Gas
2101 Meat & meat products Beef products Monash 144 × 144 Other meat products
2105 Flour & cereal foods Processed rice Total supply share & Flour & cereal foods Total imports sharea (ABS 2001b)
2108 Other food products Refined sugar Monash 144 × 144 Food products nec
a Fixed shares were used for each component, except for the cross-over cells, where it was assumed that each industry only used its own component. That is, for the intersection of the commodity and row being split, usage in the resulting cells only occurred on the diagonal. Sources: Estimates based on Monash model data bases (various) and ABS 2001b (Input-Output Tables, Product Details, 1996-97, Cat. no. 5215.0).
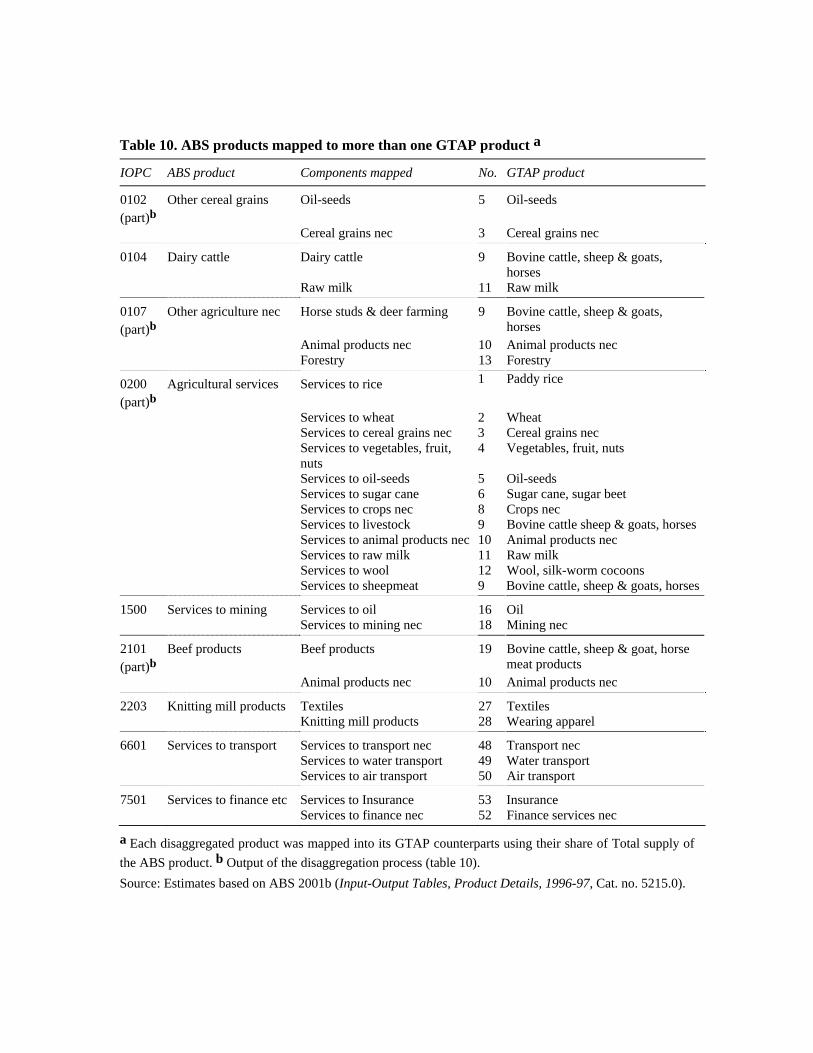
Table 10. ABS products mapped to more than one GTAP product a
IOPC ABS product Components mapped No. GTAP product
0102 (part)b
Other cereal grains Oil-seeds 5 Oil-seeds
Cereal grains nec 3 Cereal grains nec
0104 Dairy cattle Dairy cattle 9 Bovine cattle, sheep & goats, horses
Raw milk 11 Raw milk
0107 (part)b
Other agriculture nec Horse studs & deer farming 9 Bovine cattle, sheep & goats, horses
Animal products nec 10 Animal products nec Forestry 13 Forestry
0200 (part)b
Agricultural services Services to rice 1 Paddy rice
Services to wheat 2 Wheat Services to cereal grains nec 3 Cereal grains nec Services to vegetables, fruit,
nuts 4 Vegetables, fruit, nuts
Services to oil-seeds 5 Oil-seeds Services to sugar cane 6 Sugar cane, sugar beet Services to crops nec 8 Crops nec Services to livestock 9 Bovine cattle sheep & goats, horses Services to animal products nec 10 Animal products nec Services to raw milk 11 Raw milk Services to wool 12 Wool, silk-worm cocoons Services to sheepmeat 9 Bovine cattle, sheep & goats, horses
1500 Services to mining Services to oil 16 Oil Services to mining nec 18 Mining nec
2101 (part)b
Beef products Beef products 19 Bovine cattle, sheep & goat, horse meat products
Animal products nec 10 Animal products nec
2203 Knitting mill products Textiles 27 Textiles Knitting mill products 28 Wearing apparel
6601 Services to transport Services to transport nec 48 Transport nec Services to water transport 49 Water transport Services to air transport 50 Air transport
7501 Services to finance etc Services to Insurance 53 Insurance Services to finance nec 52 Finance services nec
a Each disaggregated product was mapped into its GTAP counterparts using their share of Total supply of the ABS product. b Output of the disaggregation process (table 10). Source: Estimates based on ABS 2001b (Input-Output Tables, Product Details, 1996-97, Cat. no. 5215.0).
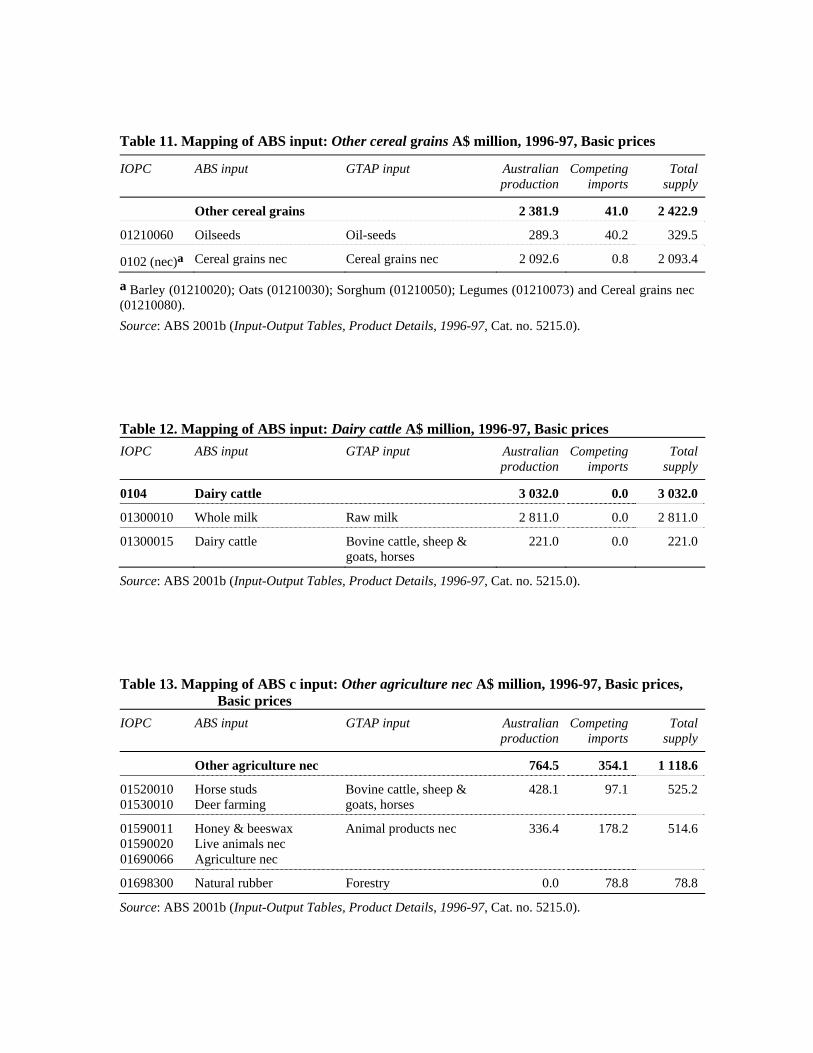
Table 11. Mapping of ABS input: Other cereal grains A$ million, 1996-97, Basic prices
IOPC ABS input GTAP input Australian production
Competing imports
Totalsupply
Other cereal grains 2 381.9 41.0 2 422.9
01210060 Oilseeds Oil-seeds 289.3 40.2 329.5
0102 (nec)a Cereal grains nec Cereal grains nec 2 092.6 0.8 2 093.4
a Barley (01210020); Oats (01210030); Sorghum (01210050); Legumes (01210073) and Cereal grains nec (01210080). Source: ABS 2001b (Input-Output Tables, Product Details, 1996-97, Cat. no. 5215.0).
Table 12. Mapping of ABS input: Dairy cattle A$ million, 1996-97, Basic prices IOPC ABS input GTAP input Australian
production Competing
imports Total
supply
0104 Dairy cattle 3 032.0 0.0 3 032.0
01300010 Whole milk Raw milk 2 811.0 0.0 2 811.0
01300015 Dairy cattle Bovine cattle, sheep & goats, horses
221.0 0.0 221.0
Source: ABS 2001b (Input-Output Tables, Product Details, 1996-97, Cat. no. 5215.0).
Table 13. Mapping of ABS c input: Other agriculture nec A$ million, 1996-97, Basic prices,
Basic prices IOPC ABS input GTAP input Australian
production Competing
imports Total
supply
Other agriculture nec 764.5 354.1 1 118.6
01520010 Horse studs Bovine cattle, sheep & 428.1 97.1 525.2 01530010 Deer farming goats, horses
01590011 Honey & beeswax Animal products nec 336.4 178.2 514.6 01590020 Live animals nec 01690066 Agriculture nec
01698300 Natural rubber Forestry 0.0 78.8 78.8
Source: ABS 2001b (Input-Output Tables, Product Details, 1996-97, Cat. no. 5215.0).
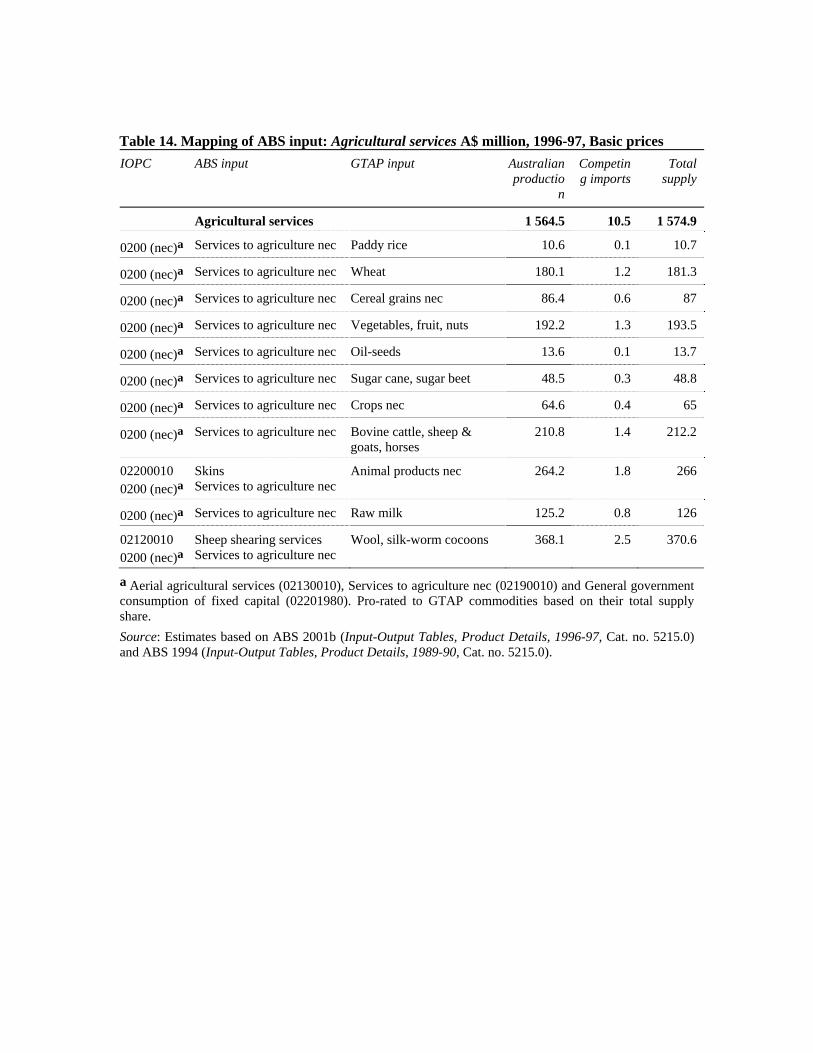
Table 14. Mapping of ABS input: Agricultural services A$ million, 1996-97, Basic prices IOPC ABS input GTAP input Australian
production
Competing imports
Totalsupply
Agricultural services 1 564.5 10.5 1 574.9
0200 (nec)a Services to agriculture nec Paddy rice 10.6 0.1 10.7
0200 (nec)a Services to agriculture nec Wheat 180.1 1.2 181.3
0200 (nec)a Services to agriculture nec Cereal grains nec 86.4 0.6 87
0200 (nec)a Services to agriculture nec Vegetables, fruit, nuts 192.2 1.3 193.5
0200 (nec)a Services to agriculture nec Oil-seeds 13.6 0.1 13.7
0200 (nec)a Services to agriculture nec Sugar cane, sugar beet 48.5 0.3 48.8
0200 (nec)a Services to agriculture nec Crops nec 64.6 0.4 65
0200 (nec)a Services to agriculture nec Bovine cattle, sheep & goats, horses
210.8 1.4 212.2
02200010 Skins Animal products nec 264.2 1.8 266 0200 (nec)a Services to agriculture nec
0200 (nec)a Services to agriculture nec Raw milk 125.2 0.8 126
02120010 Sheep shearing services Wool, silk-worm cocoons 368.1 2.5 370.6 0200 (nec)a Services to agriculture nec
a Aerial agricultural services (02130010), Services to agriculture nec (02190010) and General government consumption of fixed capital (02201980). Pro-rated to GTAP commodities based on their total supply share. Source: Estimates based on ABS 2001b (Input-Output Tables, Product Details, 1996-97, Cat. no. 5215.0) and ABS 1994 (Input-Output Tables, Product Details, 1989-90, Cat. no. 5215.0).
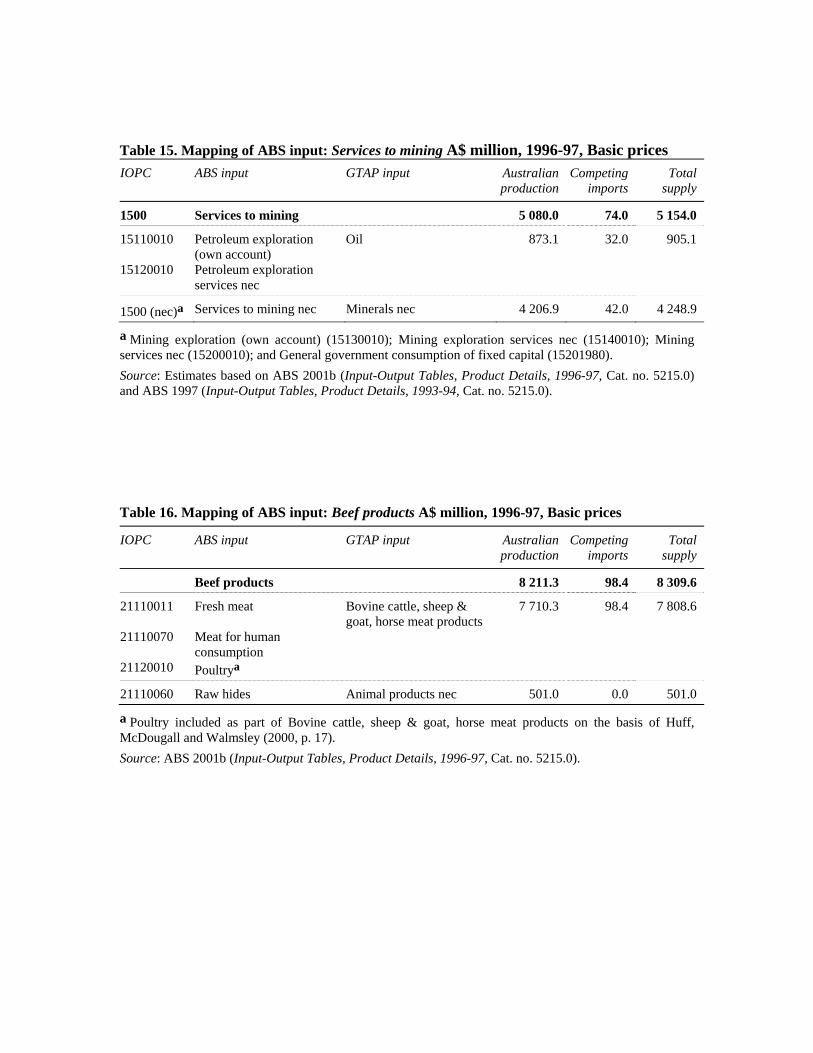
Table 15. Mapping of ABS input: Services to mining A$ million, 1996-97, Basic prices IOPC ABS input GTAP input Australian
production Competing
imports Total
supply
1500 Services to mining 5 080.0 74.0 5 154.0
15110010 Petroleum exploration (own account)
Oil 873.1 32.0 905.1
15120010 Petroleum exploration services nec
1500 (nec)a Services to mining nec Minerals nec 4 206.9 42.0 4 248.9
a Mining exploration (own account) (15130010); Mining exploration services nec (15140010); Mining services nec (15200010); and General government consumption of fixed capital (15201980). Source: Estimates based on ABS 2001b (Input-Output Tables, Product Details, 1996-97, Cat. no. 5215.0) and ABS 1997 (Input-Output Tables, Product Details, 1993-94, Cat. no. 5215.0).
Table 16. Mapping of ABS input: Beef products A$ million, 1996-97, Basic prices
IOPC ABS input GTAP input Australian production
Competing imports
Totalsupply
Beef products 8 211.3 98.4 8 309.6
21110011 Fresh meat Bovine cattle, sheep & goat, horse meat products
7 710.3 98.4 7 808.6
21110070 Meat for human consumption
21120010 Poultrya
21110060 Raw hides Animal products nec 501.0 0.0 501.0
a Poultry included as part of Bovine cattle, sheep & goat, horse meat products on the basis of Huff, McDougall and Walmsley (2000, p. 17). Source: ABS 2001b (Input-Output Tables, Product Details, 1996-97, Cat. no. 5215.0).
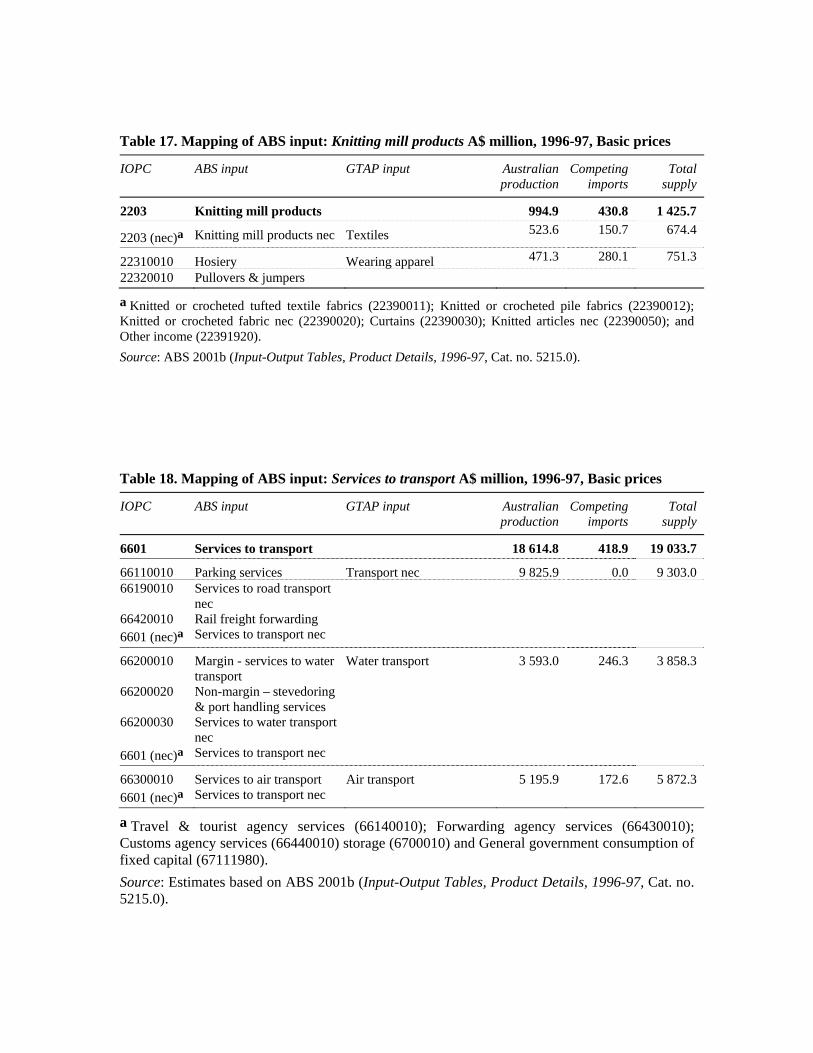
Table 17. Mapping of ABS input: Knitting mill products A$ million, 1996-97, Basic prices
IOPC ABS input GTAP input Australian production
Competing imports
Totalsupply
2203 Knitting mill products 994.9 430.8 1 425.7
2203 (nec)a Knitting mill products nec Textiles 523.6 150.7 674.4
22310010 Hosiery Wearing apparel 471.3 280.1 751.3 22320010 Pullovers & jumpers
a Knitted or crocheted tufted textile fabrics (22390011); Knitted or crocheted pile fabrics (22390012); Knitted or crocheted fabric nec (22390020); Curtains (22390030); Knitted articles nec (22390050); and Other income (22391920). Source: ABS 2001b (Input-Output Tables, Product Details, 1996-97, Cat. no. 5215.0).
Table 18. Mapping of ABS input: Services to transport A$ million, 1996-97, Basic prices
IOPC ABS input GTAP input Australian production
Competing imports
Totalsupply
6601 Services to transport 18 614.8 418.9 19 033.7
66110010 Parking services Transport nec 9 825.9 0.0 9 303.0 66190010 Services to road transport
nec
66420010 Rail freight forwarding 6601 (nec)a Services to transport nec
66200010 Margin - services to water transport
Water transport 3 593.0 246.3 3 858.3
66200020 Non-margin – stevedoring & port handling services
66200030 Services to water transport nec
6601 (nec)a Services to transport nec
66300010 Services to air transport Air transport 5 195.9 172.6 5 872.3 6601 (nec)a Services to transport nec
a Travel & tourist agency services (66140010); Forwarding agency services (66430010); Customs agency services (66440010) storage (6700010) and General government consumption of fixed capital (67111980). Source: Estimates based on ABS 2001b (Input-Output Tables, Product Details, 1996-97, Cat. no. 5215.0).
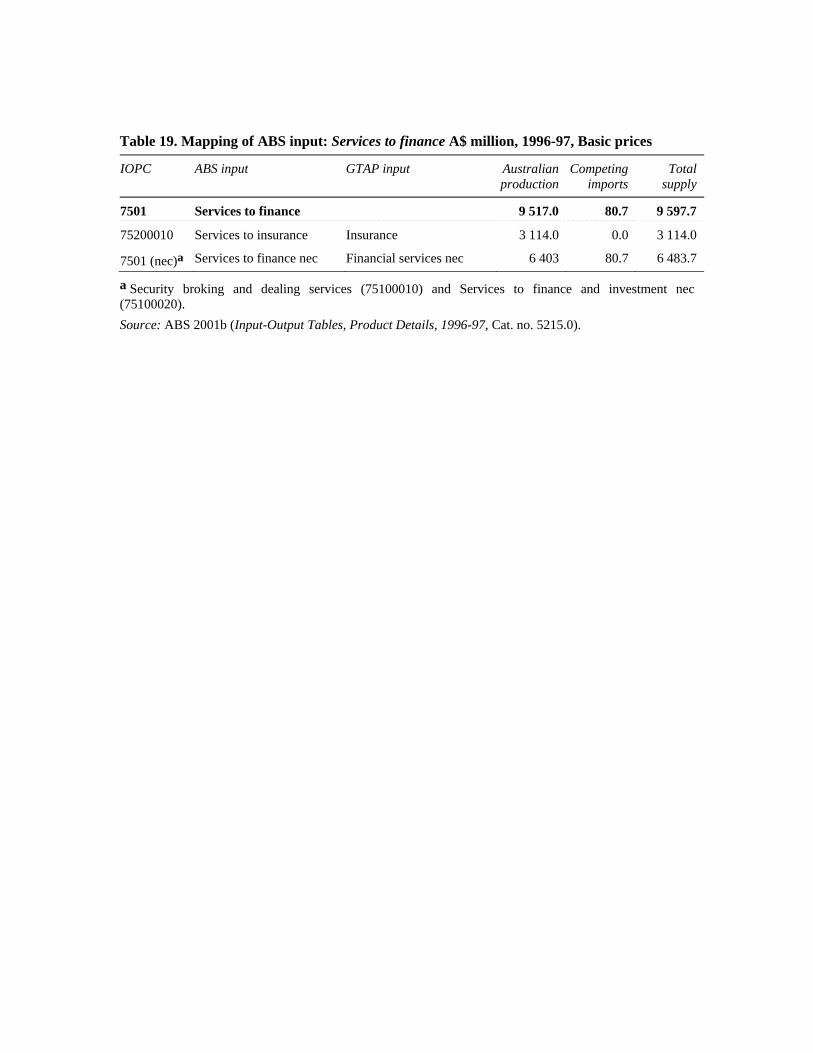
Table 19. Mapping of ABS input: Services to finance A$ million, 1996-97, Basic prices
IOPC ABS input GTAP input Australian production
Competing imports
Totalsupply
7501 Services to finance 9 517.0 80.7 9 597.7
75200010 Services to insurance Insurance 3 114.0 0.0 3 114.0
7501 (nec)a Services to finance nec Financial services nec 6 403 80.7 6 483.7
a Security broking and dealing services (75100010) and Services to finance and investment nec (75100020). Source: ABS 2001b (Input-Output Tables, Product Details, 1996-97, Cat. no. 5215.0).
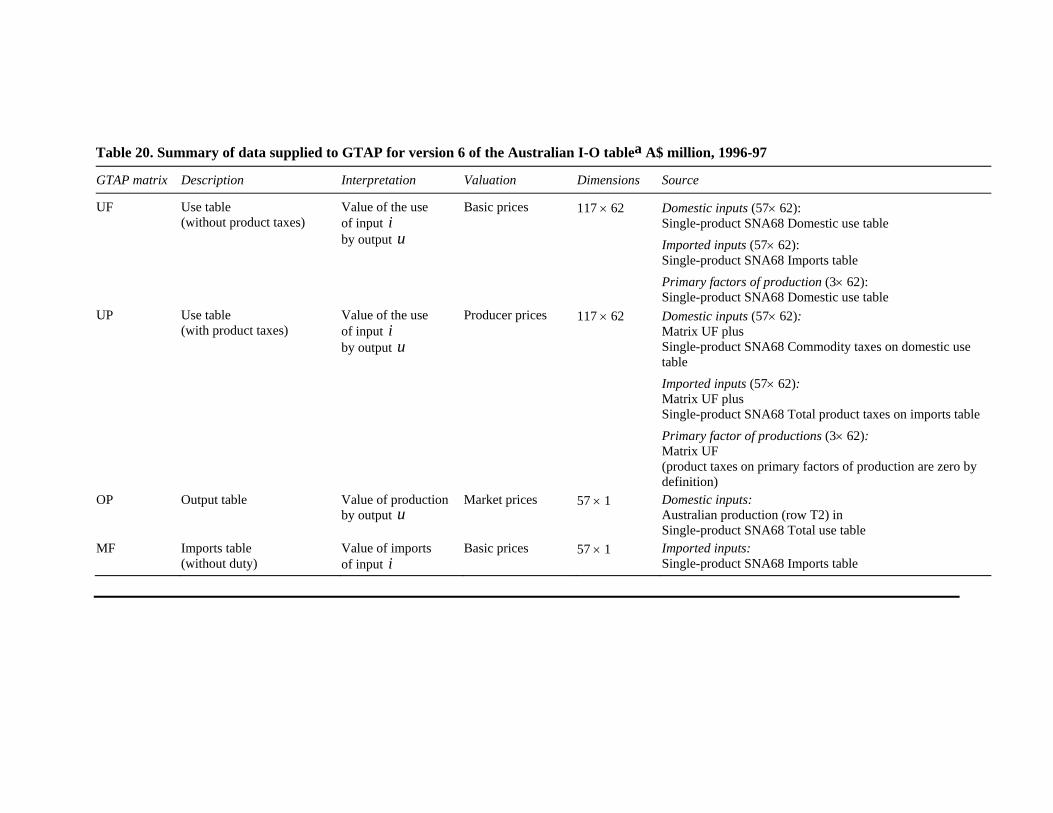
Table 20. Summary of data supplied to GTAP for version 6 of the Australian I-O tablea A$ million, 1996-97
GTAP matrix Description Interpretation Valuation Dimensions Source
UF Use table (without product taxes)
Value of the use of input i by output u
Basic prices 117 × 62 Domestic inputs (57× 62): Single-product SNA68 Domestic use table Imported inputs (57× 62): Single-product SNA68 Imports table Primary factors of production (3× 62): Single-product SNA68 Domestic use table
UP Use table (with product taxes)
Value of the use of input i by output u
Producer prices 117 × 62 Domestic inputs (57× 62): Matrix UF plus Single-product SNA68 Commodity taxes on domestic use table Imported inputs (57× 62): Matrix UF plus Single-product SNA68 Total product taxes on imports table Primary factor of productions (3× 62): Matrix UF (product taxes on primary factors of production are zero by definition)
OP Output table Value of production by output u
Market prices 57 × 1 Domestic inputs: Australian production (row T2) in Single-product SNA68 Total use table
MF Imports table (without duty)
Value of imports of input i
Basic prices 57 × 1 Imported inputs: Single-product SNA68 Imports table