Embed Size (px)
Citation preview

THIS REPORT CONTAINS ASSESSMENTS OF COMMODITY AND TRADE ISSUES MADE BY
USDA STAFF AND NOT NECESSARILY STATEMENTS OF OFFICIAL U.S. GOVERNMENT
POLICY
Date:
GAIN Report Number:
Approved By:
Prepared By:
Report Highlights:
Australia has proven to be an appealing and profitable market for U.S. companies for many years. Apart
from an extremely strict quarantine regime, it offers few barriers to entry, a familiar legal and corporate
framework, and a sophisticated – yet straightforward business culture. While it is important to
understand and appreciate Australia’s cultural differences, the long and successful history of U.S. firms
in Australia suggests the potential of this expanding market.
Food, beverage, and grocery manufacturing accounts for almost one third of the country’s
manufacturing sector. In 2015-16 turnover totaled US$92.35 billion, of which food and beverage
processing accounted for US$75.63 billion, fresh produce US$4.65 billion; and grocery (non-food)
US$12.29 billion.
Lindy Crothers, Agricultural Marketing Specialist
Rey Santella, Agricultural Counselor
2018 Food Processing Ingredients
Food Processing Ingredients
Australia
AS1805
3/26/2018
Required Report - public distribution

Post:
NOTE: The following chapters of the Harmonized Tariff Code were used for querying trade data to
include in this report.
Tariff code Description
02 Meat and edible meat offal
03 Fish and crustaceans, etc.
04 Dairy products; eggs; honey
0504 Guts, bladders and stomachs of animals (not fish)
07 Edible vegetables
08 Edible fruit and nuts
09 Coffee, tea, mate, and spices
10 Cereals (wheat, rye, barley, oats, corn, rice, buckwheat, millet, other cereals)
11 Products of milling industry; malt; starches; inulin; wheat gluten
12 Oilseeds; miscellaneous grains, seeds and fruit; industrial or medicinal plants; straw fodder
13 Lac; gums, resins, other vegetable saps, and extracts
15 Animal, vegetable fats, and oils
16 Preparations of meat, fish, crustaceans, mollusks
17 Sugar and sugar confectionery
18 Cocoa and cocoa preparations
19 Preparations of cereals, flour, starch or milk; pastry cooks’ products
20 Preparations of vegetables, fruit nuts or other parts of plants
21 Miscellaneous edible preparations (extracts, yeasts, sauces, soups, ice cream, NESOI)
22 Beverages, spirits, and vinegar NESOI = Not elsewhere specified or included
Canberra

Market Fact Sheet: Australia
Australia has proven to be an appealing and profitable market for U.S. companies for many years.
Underpinning Australia's strong economy is its open and transparent trade and investment environment,
business-friendly regulatory approach, and its trade and economic links with emerging economies,
particularly in Asia.
Australia is the world's 14th largest economy, with nominal GDP estimated to be US$1.2 trillion in
2017, accounting for 1.6 percent of the global economy. Australia has one of the highest levels of per
capita GDP in the world (at around US$50,000) and is ranked second for average wealth per adult. The
Australian economy has enjoyed 26 years of consecutive economic growth and is forecast to see annual
real GDP growth of 3 percent in 2018, up from around 2.5 percent in 2016/17. The unemployment rate
fell to around 5.4 percent in 2017 and the labor force participation rate rose to close to all-time highs.
The United States is by far the largest supplier of foreign capital to Australia. U.S. FDI accounted for
around one quarter of Australia’s total FDI stock in 2016, totaling $195 billion. This has risen strongly
over recent years, up from US$130 billion in 2013. Total U.S. investment in Australia (direct plus
indirect) is around $860 billion. Investment in Australia is facilitated in part by its stable
macroeconomic management and ease of doing business (it is ranked 15th internationally in the World
Bank’s 2016 ‘Doing Business’ index).
Australia’s total imports of food ingredients were valued at $12.9 billion in 2017, up by 5.5% over the
previous year. The United States is the second largest supplier of these products and imports from the
U.S. grew by 10.3% in 2017 to reach US$1.4 billion. U.S. products with the largest growth were dairy
products (cheese, milk and cream, and dried egg products); oil products (hydrogenated fats and oils,
margarine, and fish oil).
The U.S. - Australia Free Trade Agreement provides advantages for U.S. products as tariff rates for
many U.S. food products exported to Australia are zero.
Source: Global Trade Atlas

SECTION 1 – MARKET SUMMARY
Australia’s food, beverage, and grocery sectors account for almost one third of the country’s total
manufacturing sector. In 2015-16, turnover totaled US$92.35 billion (A$127 billion), of which food and
beverage processing accounted for US$75.63 billion (A$104 billion), fresh produce US$4.65 billion
(A$6.4 billion); and grocery US$12.29 billion (A$16.9 billion).
The industry is comprised of 30,750 enterprises (2016-17). The largest number of companies are in the
fresh produce sector (20,670), followed by food and beverage manufacturing (8,530) and grocery (non-
food) manufacturing (1,550).
Advantages and Challenges Facing U.S. Products in Australia
Advantages Challenges
U.S. culture well accepted and similar to Australia. Strict quarantine regulations for fresh
produce, meat, and dairy products.
No language barriers to overcome. Australia is a significant producer of a
wide variety of agricultural products.
U.S. products have excellent image and acceptance. ‘Buy Australian’ campaign is significant.
The United States and Australia have a free trade
agreement that minimizes import tariffs.
Australian labeling and advertising laws
are different from the United States. This
may require costly changes to food labels.
Australian consumers are experimental and desire new
and innovative products. This presents an opportunity to
test innovative products and capture/gain market share.
Need to produce innovative food products
to break into highly competitive retail food
sector as most categories have substantial
market leaders.
Counter-seasonal production and marketing seasons
between Australia and the United States mean that some
fruit and vegetable imports do not compete with locally
produced fruit and vegetables.
An increasing number of low cost foods
ingredients are available from developing
countries.
Australia does not produce sufficient quantities of some
ingredients or specific varieties (e.g. tea, coffee, cocoa,
nuts, dried fruit, and natural colors).
Many of the major trends in flavoring ingredients used
in Australia have their origins in the United States.
Australia has an affluent consumer base.
SECTION 2 – ROAD MAP FOR MARKET ENTRY
ENTRY STRATEGY There are many opportunities for imported products in the Australian food processing market and
many ways in which to gain market access. Market entry can be greatly facilitated by local
representation. The type of local representation depends on the exporter, and the products. The
local representative should be able to provide market knowledge, up-to-date information, guidance
on business practices, trade-related laws, food standards, sales contacts with existing and potential
buyers, and market development expertise. The U.S. supplier should provide samples, product
specifications, and nutritional data for all products and provide representatives with the necessary
training. Using marketing materials and product information will allow the representative to canvas
the customer base to determine the level of interest.
The majority of food ingredient imports move through a third party in the form of an import agent,
trader or wholesaler. Often this third party can provide invaluable assistance to help overseas
suppliers meet import conditions. The majority of food processors in Australia use import agents to
source product as well as buying direct from other processors or producers.
Due to the size of the U.S. market, U.S. manufacturers are able to develop a range of products far
beyond that which can be achieved in Australia. This enables U.S. exporters to deliver innovative
product lines that are otherwise not available - for example food colors and flavors.
The Australian market is very “Americanized,” with most U.S. food categories compatible with
Australian tastes, thus providing many opportunities for U.S. exporters.
It is suggested to engage a broker who knows the market, manufacturers, and generally has a strong
relationship with traders. These contacts should include the following: warehousing, distribution,
and assistance with customs and quarantine paperwork.
All food imported into Australia must first comply with strict quarantine requirements stipulated in
the Biosecurity Act 2015 and then the Imported Food Control Act 1992. A release issued after the
quarantine inspection is NOT a clearance from the IFIS inspection. NOTE: The Imported Food
Control Act 1992 is currently being amended through the Imported Food Control Amendment Bill
2017, which was introduced to the Australian House of Representatives in June 2017. Changes to
the legislation could impact imported foodstuff. Further information can be found at:
http://www.agriculture.gov.au/import/goods/food/reform.
To satisfy quarantine requirements it may be necessary for importers of certain foods to obtain an
import permit. This is particularly true for fresh fruit and vegetables or food that may contain any
milk, egg, meat or other animal products as an ingredient. In addition to obtaining a permit, some
products require additional conditions to be met before importation. To obtain up-to-date
information about quarantine import conditions refer to the Biosecurity Import Conditions System
(BICON) database that is maintained by the Australian Department of Agriculture and Water
Resources (http://www.agriculture.gov.au/import/online-services/bicon). The Food and Agriculture
Import Regulations and Standards (FAIRS) narrative report provides information on Australia’s
import requirements. A copy of the most recent version of this report is available at:
https://www.fas.usda.gov/data/australia-fairs-country-report-1.
MARKET STRUCTURE
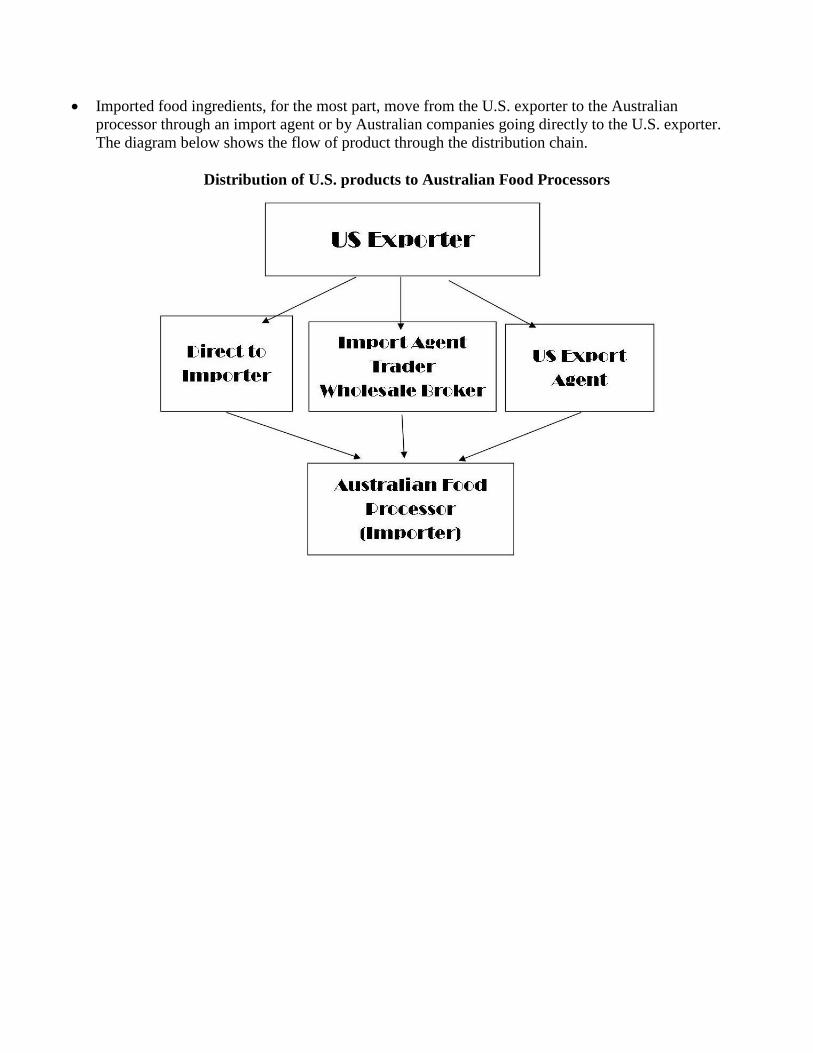
Imported food ingredients, for the most part, move from the U.S. exporter to the Australian
processor through an import agent or by Australian companies going directly to the U.S. exporter.
The diagram below shows the flow of product through the distribution chain.
Distribution of U.S. products to Australian Food Processors

SECTOR TRENDS AND MAJOR PLAYERS
Meat and Meat Production – The Australian meat processing industry has performed strongly over the
past five years. Favorable climatic conditions and surging export demand have aided the industry.
Strong overseas demand has boosted domestic beef and lamb prices and encouraged farmers to sell
livestock. Increased prices and production have, in turn, helped boost revenue for meat processors.
Industry revenue is forecast to grow at an annualized 7.7% over the five years through 2017-18 and is
expected to reach $21.1 billion. This includes further growth of 4.5% during 2017-18. Australia's meat
processors export approximately 60% of production (by value), with beef accounting for the majority of
industry exports. Over the past five years, demand has increased in some of the industry's largest export
markets, including Japan and South Korea. New export markets, such as the Middle East and China,
have been the strongest growth areas as world demand for meat has increased. Major players include:
Industry Park Pty Ltd. - trading as JBS Australia (20.5% market share); Teys Australia Pty Ltd (9.6%
market share); and Thomas Foods International Consolidated Pty Ltd. (7.0% market share).
Processed/cured pork products – Increasing import competition in the pig meat market has
contributed to growth in the value of imports. Processed pig meat and pork for further processing has
been progressively allowed into Australia since 1990. Imports generally account for one quarter of pig
products consumed domestically. The value of imports is estimated to increase at an annualized 3.6%
over the five years through 2017-18. The focus of local producers on large volumes of high-quality
product is expected to have boosted demand for imported, cheaper cuts of meat to fill domestic demand
gaps. In 2017-18, imports are expected to account for 7.5% of domestic demand. Denmark and the
United States are the most significant sources of imports. Major players include: Industry Park Pty Ltd.
- trading as JBS Australia. (34.7% market share); and Food Investments Pty Ltd. (15.1% market share).
Dairy Product Manufacturing (milk and butter) – Australian raw milk production is projected at 9.3
billion liters in 2017-18, marginally higher than the past five years. Imports are forecast to grow at an
annualized 12.9% over the five years through 2017-18. The majority of industry imports come from
New Zealand and Europe. The largest source of dairy imports is New Zealand, accounting for almost
two-thirds of imports due to its proximity to Australia. The United States is another major source of
butter and other dairy product imports to Australia. Major players include: Murray Goulburn Co-
operative Co. Ltd. (16% market share); Fonterra Co-operative Group Ltd. (12.4% market share);
Parmalat Australia Pty Ltd. (9.1% market share); and Lion Pty Ltd. (5.7% market share).
Cheese Manufacturing – Consumer attitudes towards health and nutrition strongly affect cheese
demand with concerns about obesity and heart disease negatively affecting demand. Australian dairy
manufacturers have responded by creating reduced-fat and low-fat cheese options, which have helped
maintain demand for cheese. Cheese, butter, and yoghurt consumption is expected to increase in 2017-
18. Supermarket demand is a key determinant of success for cheese manufacturers, as supermarkets
account for the largest portion of domestic cheese sales. Cheese manufacturers compete fiercely against
one another for supply contracts for private-label products conducted with major retailers. Demand from
supermarkets and grocery stores is expected to increase in 2017-18. Major players include: Bega
Cheese Ltd. (22.5% market share); Warrnambool Cheese and Butter Factory Company Holdings Ltd.
(13.8% market share); Lion Pty Ltd. (12.7% market share); Murray Goulburn Co-operative Company
Ltd. (9.8% market share); and Fonterra Co-operative Group Ltd. (8.6% market share).

Fruit and Vegetable Processing – The Australian domestic fruit and vegetable processing industry has
struggled with increasing external competition over the past five years. Rising import penetration and
high operating costs have hurt the industry’s performance. Industry revenue is expected to fall at an
annualized 1.1% through 2017-18. Supermarkets and grocery stores are major purchasers of processed
fruit and vegetables. Growing competition from imports has been replacing some supermarket demand
for locally processed fruit and vegetable products, particularly for private-label products. Supermarket
and grocery store demand is expected to increase in 2017-18 as Australian supermarkets are increasingly
investing in and stocking private-label products. Australia primarily imports processed fruit and
vegetables from New Zealand, China, and the United States. New Zealand is a key supplier given its
proximity and lower overhead costs. China and the United States have an advantage due to their
economies of scale, which is beneficial in an industry with limited product differentiation. However, the
United States has an advantage over China because of their reputation of trusted suppliers of safe, high
quality products – this should be emphasized when approaching this market. Imports have increased as
a percentage of domestic demand over the past five years. The dominance of Australia’s supermarket
giants Coles and Woolworths has encouraged growth in cheaper imports to be sold as private-label
products. Major players include: Simplot Australia (Holdings) Pty Ltd. (8.3% market share); Heinz
Wattie’s Pty Ltd. (7.0% market share); and Coca-Cola Amatil Ltd. (5.7% market share).
Oils and Fat Manufacturing – Rising demand for premium products, such as extra-virgin olive oil, has
supported industry growth over the past five years. However, the industry has faced increasing pressure
from supermarket private-label brands, imports, and substitute products. Industry revenue is expected to
increase at an annualized 1.1% over five years through 2017-18. In line with growing health
consciousness, many consumers have made efforts to avoid fats and oils in their food, limiting demand
for edible oils. Rising concerns regarding health issues have helped increase demand for olive oil over
the past five years. Many consumers view olive oil as healthier than other types of oils, such as
vegetable or canola oil. This is due to the links between olive oil and the reduced risk of blood pressure
problems and cardiovascular disease. In addition, rising disposable incomes over the past five years
have supported increased demand for premium olive oils, such as extra virgin varieties. Imports are
forecast to increase by an annualized 3.7% over five years through 2017-18, to account for 40.2% of
domestic demand. Imports have grown strongly over the past five years, despite the depreciation of the
Australian dollar since 2013-14 reducing the competitiveness of imported products by making them
more expensive. Key importing nations include Spain, Italy, and Malaysia. Spain and Italy account for a
large share of premium imports, while Malaysia is a key importer of lower-priced canola and palm oil.
Over the next five years, imports are expected to increase as a share of domestic demand, in line with
the projected appreciation of the dollar. Major players include: Grain Corp Ltd. (28.7% market share);
Boundary Bend Ltd. (13.9% market share); and Peerless Holdings Pty Ltd. (10.2% market share).
Flour Mill and Cereal Food Manufacturing – Imports are forecast to grow at an annualized 18.1%
over five years through 2016-17 (latest data available) and account for 31.0% of domestic demand. Key
trading partners are also located in the Asia-Pacific region, including New Zealand, Thailand,
Singapore, India, and China. The United States is also a key source for flour and grain mill products.
Various grains, rice, and specialty flours are popular with Australians due to an increased interest in
foreign foods and growing consumer use of foreign products in home cooking. Major players include:
Manildra Milling Pty Ltd. (26.7% market share); Food Investments Pty Ltd. (20.5% market share);
Ricegrowers Ltd. (16.5% market share); GrainCorp Ltd. (15.1% market share).

Bakery Product Manufacturing – The bakery product manufacturing industry is going through a
major period of change. While per capita bread consumption is falling, Australians are spending more
on higher quality, fresher breads and baked goods. Where the typical family used to purchase a few
loaves of factory-produced white bread once a week, consumers are now more likely to buy a range of
freshly baked bread, including sourdough, ciabatta, brioche, and baguettes. Over the past five years,
rising health consciousness has caused demand for whole meal, seeded, gluten-free and other breads,
which are perceived to be healthier products. The introduction of functional breads that have been
fortified with ancient grains or enriched with nutrients has also contributed to the growing demand for
premium breads and bakery products. White bread is the largest product segment in the industry,
followed by cakes, whole meal and seeded bread, and artisanal breads (sourdough, rye, brioche, fruit and
olive breads, flatbreads and ciabatta). Major players include: Bakers Delight Holdings Ltd. (14.3%
market share); and Retail Food Group Ltd. (4.9% market share).

SECTION 3 – COMPETITION
Australia’s total imports of food ingredients were valued at $12.9 billion in 2017, up by 5.5% over the
previous year. The United States is the second largest supplier of these products and imports from the
U.S. grew by 10.3% in 2017 to reach US$1.4 billion. U.S. products with the largest growth were dairy
products (cheese, milk and cream, and dried egg products); oil products (hydrogenated fats and oils,
margarine, and fish oil).
Australian Imports of Food Ingredients from the World
Partner Country United States Dollars
2015 2016 2017
World $12,003,092 $12,206,055 $12,880,023
New Zealand $1,948,655 $2,214,093 $2,414,148
United States $1,312,849 $1,233,707 $1,361,065
China $894,824 $895,211 $919,668
Thailand $733,482 $742,269 $767,758
Italy $524,869 $537,780 $586,576
Singapore $654,954 $611,168 $494,871
France $439,252 $430,475 $481,507
Malaysia $443,956 $452,894 $473,379
Vietnam $397,505 $422,177 $440,345
United Kingdom $390,625 $404,559 $424,581
Other $4,262,119 $4,261,721 $4,516,126
Source: Global Trade Atlas

Australian Imports of Food Processing Ingredients from the United States
Commodity Description
Millions United States Dollars
2015 2016 2017
Total Food Processing Products $1,312,849 $1,233,707 $1,361,065
Edible Fruit and Nuts; Citrus Fruit Or Melon Peel $189,681 $173,007 $217,984
Miscellaneous Edible Preparations $247,838 $231,816 $200,590
Meat and Edible Meat Offal $139,764 $147,784 $172,235
Beverages, Spirits And Vinegar $171,573 $161,037 $167,892
Dairy Products; Birds Eggs; Honey; Edible Animal Products
NESOI $94,533 $87,491 $145,947
Prep Vegetables, Fruit, Nuts Or Other Plant Parts $109,003 $108,182 $114,723
Cocoa And Cocoa Preparations $61,234 $62,778 $58,605
Prep Cereal, Flour, Starch Or Milk; Bakers Wares $67,557 $55,449 $55,401
Edible Preparations Of Meat, Fish, Crustaceans etc. $52,249 $44,611 $51,010
Oil Seeds Etc.; Miscellaneous Grain, Seed, Fruit, Plant etc. $28,124 $35,595 $33,875
Sugars And Sugar Confectionary $39,367 $25,179 $32,305
Animal Or Vegetable Fats, Oils etc. and Waxes $17,497 $16,532 $25,560
Edible Vegetables and Certain Roots and Tubers $17,416 $15,534 $20,218
Animal (Not Fish) Guts, Bladders, Stomachs and Parts $19,164 $14,285 $16,681
Fish, Crustaceans and Aquatic Invertebrates $13,572 $16,205 $12,671
Milling Products; Malt; Starch; Inulin; Wheat Gluten $17,871 $15,814 $12,245
Cereals $11,559 $10,031 $9,799
Lac; Gums, Resins and Other Vegetable Sap and Extract $9,074 $7,864 $9,149
Coffee, Tea, Mate and Spices $5,775 $4,513 $4,176 Source: Global Trade Atlas

SECTION 4 – BEST PRODUCT PROSPECTS The organic, healthy, and natural products market in Australia continues to grow rapidly.
Although Australia is a large producer of organic raw products, it does not have the manufacturing
capacity to satisfy demand for processed organic products. Prospects are excellent for organic and
natural ingredients as well as consumer-ready processed foods and beverages. Findings from a
Nielsen survey in 2016 show that Australian consumers are adopting a back-to-basics mindset,
focusing on simple ingredients and fewer artificial or processed foods. The top 10 ingredients being
avoided by Australian consumers are: Antibiotics/hormones in animal products; MSG; artificial
preservatives; artificial flavors; artificial sweeteners; foods with BPA packaging; artificial colors;
sugar; GM foods; and sodium. These ingredients are being avoided primarily because of their
perceived impact on health rather than actual medical conditions.
The survey showed that Australian’s want to eat healthier, but need help to make it happen. Almost
50% of consumers indicated that they wished there were more ‘all natural’ food products on shelves.
They also indicated that they would be willing to pay more for foods and beverages that don’t
contain unhealthy ingredients.
The types of products consumers want to see more of are: all natural; no artificial colors; low
sugar/sugar free; no artificial flavors; and low fat/fat free. U.S. exporters who are able to provide
ingredients and preparation methods that improve the nutritional profile of products will be strongly
positioned to succeed in this market.

SECTION 5 – POST CONTACT AND FURTHER INFORMATION
POST CONTACT
Office of Agricultural Affairs
U.S. Embassy
Moonah Place
Yarralumla, ACT 2600
Australia
Tel: +61 2 6214 5854
E-Mail: [email protected]
OTHER RELEVANT REPORTS
Copies of other reports from this office can be found by conducting a search at:
http://gain.fas.usda.gov/Lists/Advanced%20Search/AllItems.aspx
Food and Agriculture Import Regulations and Standards (FAIRS) – contains detailed information on
Australia’s food labeling and quarantine requirements.
Exporter Guide (search in the Exporter Assistance category).
Retail Foods Report (search in the Exporter Assistance category).
TRADE SHOWS
Fine Food is the largest food, beverage and equipment show in Australia and this region and presents
U.S. exporters with the most efficient and cost-effective way to enter the Australian market. Australia is
a very large country and internal transportation is expensive and time consuming. Fine Food offers an
opportunity for U.S. exporters to access a 'one-stop-shop' for entry to the Australian market because a
large number of the major importers, distributors, etc., exhibit at the show and at times represent other
companies. This presents an ideal opportunity for U.S. exhibitors to meet with a majority of the big
players in this market in one place. The show is held every September alternating between Melbourne
and Sydney. This year the show is in Melbourne, September 10-13, 2018.
Fine Food is endorsed by the U.S. Department of Agriculture. For information on participating in the
U.S. Pavilion at Fine Food, please contact the Office of Agricultural Affairs listed above.
Foodservice Australia – May 27-29, 2018.
Tim Collett, Managing Director
Specialised Events
Level 1, 578 Malvern Road
Prahran, VIC 3181
Australia
Email: [email protected]
Tel: +61 3 9999 5460
Bibliography
Australian Food and Grocery Council - State of the Industry Report
Euromonitor International, Packaged Food in Australia
IBISWorld, Meat Processing in Australia
IBISWorld, Cured Meat and Smallgoods Manufacturing in Australia
IBISWorld, Cheese Manufacturing in Australia
IBISWorld, Butter and Dairy Product Manufacturing in Australia
IBISWorld, Fruit and Vegetable Processing in Australia
IBISWorld, Flour and Grain Mill Product Manufacturing in Australia
IBISWorld, Bakery Product Manufacturing in Australia
IBISWorld, Edible Oils Manufacturing in Australia