Embed Size (px)
Citation preview
Austin–Round Rock–San Marcos, TX National Compensation Survey May 2010 _________________________________________________________________________________________ U.S. Department of Labor Hilda L. Solis, Secretary U.S. Bureau of Labor Statistics Keith Hall, Commissioner September 2010

ii
Preface
ata shown in this report were collected as part of the Bureau of Labor Statistics (BLS) National Compensa-
tion Survey (NCS). The survey could not have been con-ducted without the cooperation of the many private estab-lishments and government agencies that provided pay data included in this bulletin. The Bureau thanks these respon-dents for their cooperation. Field economists of the Bureau of Labor Statistics col-lected and reviewed the survey data. The Office of Com-pensation and Working Conditions, in cooperation with the Office of Field Operations and the Office of Technology and Survey Processing in the BLS National Office, de-signed the survey, processed the data, and prepared the survey for publication. For additional information regarding this survey, please contact any BLS regional office. You may also write to the Bureau of Labor Statistics at: Division of Compensation
Data Analysis and Planning, 2 Massachusetts Ave., NE., Room 4175, Washington, DC 20212, call (202) 691-6199, or send an e-mail to [email protected]. The data contained in this report are also available at http://www.bls.gov/ncs/ocs/compub.htm, the BLS Inter-net site. Data are presented in a Portable Document Format (PDF) file containing the core report and in an ASCII file containing the published table formats. Results of earlier surveys of this area are available from BLS regional offices, the Division of Compensation Data Analysis and Planning, or at the BLS Internet site. Material in this report is in the public domain and, with appropriate credit, may be reproduced without permission. This information will be made available to sensory-impaired individuals upon request. Voice phone: (202) 691-5200; Federal Relay Service: 1 (800) 877-8339.
D
iii
Contents
Page Introduction ................................................................................................................................................ 1 Tables:
1. Summary: Mean hourly earnings and weekly hours for selected worker and establishment characteristics .................................................................................................. 3 2. Civilian workers: Mean hourly earnings for full-time and part-time workers by work levels ............................................................................................................................... 4 3. Private industry workers: Mean hourly earnings for full-time and part-time workers by work levels ............................................................................................................................... 8 4. State and local government workers: Mean hourly earnings for full-time and part-time workers by work levels ............................................................................................................................... 11 5. Combined work levels for civilian workers: Mean hourly earnings for full-time and part-time workers ................................................................................................................... 12 6. Civilian workers: Hourly wage percentiles ................................................................................... 16 7. Private industry workers: Hourly wage percentiles ...................................................................... 19 8. State and local government workers: Hourly wage percentiles .................................................... 21 9. Full-time civilian workers: Hourly wage percentiles .................................................................... 22 10. Part-time civilian workers: Hourly wage percentiles .................................................................... 24 11. Full-time civilian workers: Mean and median hourly, weekly, and annual earnings and mean weekly and annual hours ................................................................................ 25 12. Full-time private industry workers: Mean and median hourly, weekly, and annual earnings and mean weekly and annual hours ................................................................................ 28 13. Full-time State and local government workers: Mean and median hourly, weekly, and annual earnings and mean weekly and annual hours ................................................................................ 30 14. Size of establishment: Mean hourly earnings of private industry establishments for major occupational groups ...................................................................................................... 31 15. Establishments with fewer than 100 workers: Mean and median hourly, weekly, and annual earnings and mean weekly and annual hours for full-time private industry workers .................... 32 16. Establishments with 100 workers or more: Mean and median hourly, weekly, and annual earnings and mean weekly and annual hours for full-time private industry workers .................... 33 17. Union and nonunion workers: Mean hourly earnings for major occupational groups .................. 34 18. Time and incentive workers: Mean hourly earnings for major occupational groups .................... 35 19. Industry sector: Mean hourly earnings for private industry workers by major occupational group ........................................................................................................ 36
Appendixes: A. Technical note ................................................................................................................................ A – 1 Appendix table 1. Number of workers represented by the survey ................................................ A – 5 Appendix table 2. Survey establishment response ........................................................................ A – 6 B. Standard Occupational Classification system ................................................................................ B – 1

1
Introduction
he tables in this report summarize the NCS results for the Austin–Round Rock–San Marcos, TX, Metropoli-
tan Statistical Area. Data were collected between February 2010 and July 2010; the average reference month is May 2010. Tabulations provide information on earnings of workers in a variety of occupations and at different work levels. Also contained in this report are information on the program, a technical note describing survey procedures, and an appendix with detailed information on occupational classifications. Most of the earnings estimates in this report are pre-sented as mean hourly earnings. Mean weekly and annual earnings, and the corresponding hours, also are provided for full-time employees in specific occupations. Some oc-cupations, such as teachers and fire fighters, typically have shorter or longer work schedules than do the majority of full-time workers. The weekly and annual estimates are useful for comparing the earnings of occupations having different work schedules. NCS products The Bureau’s National Compensation Survey (NCS) pro-vides comprehensive measures of occupational earnings, compensation cost trends, benefit incidence, and detailed plan provisions. The Employment Cost Index, a quarterly measure of the change in employer costs for wages and benefits, is derived from the NCS. Employer Costs for Employee Compensation measures employers’ average hourly costs for wages and benefits. NCS also measures the incidence and provisions of benefit plans. This bulletin is limited to data on occupational wages and salaries. Changes to the publications The NCS is in its fourth year of a 6-year transition from a sample of areas based on the U.S. Office of Management and Budget (OMB) December 1993 area definitions to a new sample of areas based on the December 2003 area de-finitions. The NCS is phasing in new metropolitan and mi-cropolitan areas as defined by OMB and county clusters defined specifically by BLS; at the same time, some areas under the December 1993 OMB definitions are being phased out of the sample.
About the tables The tables that follow present data on straight-time occupa-tional earnings, which include wages and salaries, incentive pay, cost-of-living adjustments, and hazard pay. These earnings exclude premium pay for overtime, vacations, hol-idays, nonproduction bonuses, and tips. About 800 de-tailed occupations, listed in appendix B, are used to de-scribe all occupations in the civilian nonfarm economy (excluding the Federal Government and private house-holds). Data are not shown for any occupations if they would raise concerns about the confidentiality of the survey respondents or if the data are insufficient to support reliable estimates. Table 1 presents an overview of all tables in this report. Mean hourly earnings, weekly hours, and relative standard errors are given for all industries, private industry, and State and local government for selected worker and estab-lishment characteristics. The worker characteristics include high-level and intermediate occupational aggregation, full-time or part-time status, union or nonunion status, and time or incentive pay. Establishment characteristics include goods producing, service providing, and size of establish-ment. Table 2 presents mean hourly earnings data by work level for occupational major groups and for detailed occu-pations. Separate data are also shown for full-time and part-time workers. Table 3 provides work level data for private industry workers. Table 4 provides similar data for State and local government workers. Table 5 simplifies the work levels by combining them into broader groups within major and detailed occupations, and for full-time and part-time workers. Tables 6 through 10 present hourly wage percentiles that describe the distribution of hourly earnings for indi-vidual workers within each published occupation. Data are provided for the 10th, 25th, 50th, 75th, and 90th percentiles for detailed occupations within all industries, private indus-try, State and local government, full-time workers, and part-time workers. Table 11 presents mean and median hourly, weekly, and annual earnings, and the associated hours, for major occu-pational groups and detailed occupations for full-time
T

2
workers. Table 12 provides the same type of information for private industry workers. Table 13 provides similar da-ta for State and local government workers. Table 14 presents mean hourly earnings data for estab-lishment employment sizes by high-level occupational ag-gregations in the private sector. Tables 15 and 16 provide mean and median hourly, weekly, and annual earnings data for full-time employees in private establishments with few-er than 100 workers, and in private establishments with 100 workers or more. Table 17 presents mean hourly earnings data for union and nonunion workers in all, private, and State and local
government establishments by high-level occupational ag-gregation. Table 18 provides hourly earnings data for time and incentive workers in all and private establishments by high-level occupational aggregation. Table 19 presents mean hourly earnings data for major industry divisions within the private sector. Appendix table 1 presents the number of workers represented by the survey, by high-level occupational ag-gregation and for all industries, private industry, and State and local government. Appendix table 2 provides the number of establishments in the sampling frame and the number of responding and nonresponding establishments.

Table 1. Summary: Mean hourly earnings1 and weekly hours for selected worker and establishment characteristics, Austin-RoundRock-San Marcos, TX, May 2010
Worker and establishmentcharacteristics
Civilianworkers
Private industryworkers
State and local governmentworkers
Hourly earnings
Meanweeklyhours3
Hourly earnings
Meanweeklyhours3
Hourly earnings
Meanweeklyhours3
MeanRelativeerror2
(percent)Mean
Relativeerror2
(percent)Mean
Relativeerror2
(percent)
All workers .......................................................... $21.08 4.2 36.3 $19.88 5.3 35.9 $25.57 5.0 37.7
Worker characteristics4,5
Management, professional, and related ........... 32.18 4.6 38.7 33.19 6.3 39.7 30.30 5.5 36.8Management, business, and financial .......... 34.19 6.0 40.5 34.37 6.3 40.7 33.88 12.4 40.0Professional and related ............................... 31.29 5.5 37.9 32.70 7.6 39.3 28.53 4.2 35.5
Service .............................................................. 10.82 10.9 32.4 9.14 7.3 31.3 19.36 19.7 39.9Sales and office ................................................ 16.91 5.1 34.9 17.01 6.0 34.2 16.37 6.0 39.0
Sales and related .......................................... 18.70 15.6 32.2 18.70 15.6 32.2 – – –Office and administrative support ................. 16.17 2.3 36.2 16.11 2.3 35.5 16.37 6.0 39.0
Natural resources, construction, andmaintenance ................................................... 18.82 5.2 40.7 18.91 5.4 40.7 – – –Construction and extraction ......................... 17.08 6.9 40.1 17.19 7.1 40.1 – – –Installation, maintenance, and repair ............ 21.03 8.2 41.3 21.24 8.5 41.5 – – –
Production, transportation, and materialmoving ............................................................ 11.69 5.2 36.9 11.68 5.2 37.0 – – –Production .................................................... 12.27 5.2 39.9 12.27 5.2 39.9 – – –Transportation and material moving ............. 10.97 6.4 33.8 10.95 6.5 33.9 – – –
Full time ............................................................ 22.54 4.6 40.0 21.55 5.8 40.1 25.87 5.4 39.9Part time ........................................................... 10.49 4.1 21.6 9.91 3.5 22.2 18.29 18.7 16.5
Union ................................................................ 23.85 15.4 40.0 – – – – – –Nonunion .......................................................... 21.02 4.3 36.2 19.87 5.4 35.8 25.36 5.1 37.7
Time .................................................................. 20.71 4.0 36.2 19.36 5.0 35.7 25.57 5.0 37.7Incentive ........................................................... 30.86 18.1 39.9 30.86 18.1 39.9 – – –
Establishment characteristics
Goods producing .............................................. 6( ) 6( ) 6( ) 24.01 6.1 40.2 6( ) 6( ) 6( )Service providing .............................................. 6( ) 6( ) 6( ) 19.07 6.2 35.2 6( ) 6( ) 6( )
1-99 workers ..................................................... 17.85 8.2 35.9 17.86 8.4 36.0 17.37 19.1 35.2100-499 workers ............................................... 17.43 8.2 35.4 17.16 9.6 34.8 19.08 11.4 40.0500 workers or more ......................................... 27.77 3.4 37.3 28.30 4.9 37.0 27.26 4.9 37.6
1 Earnings are the straight-time hourly wages or salaries paid to employees. Theyinclude incentive pay, cost-of-living adjustments, and hazard pay. Excluded are premiumpay for overtime, vacations, holidays, nonproduction bonuses, and tips. The mean iscomputed by totaling the pay of all workers and dividing by the number of workers,weighted by hours. See appendix A for more information.
2 The relative standard error (RSE) is the standard error expressed as a percent ofthe estimate. It can be used to calculate a "confidence interval" around a sampleestimate. For more information about RSEs, see appendix A.
3 Mean weekly hours are the hours an employee is scheduled to work in a week,exclusive of overtime.
4 Employees are classified as working either a full-time or a part-time schedule basedon the definition used by each establishment. Union workers are those whose wages aredetermined through collective bargaining. Wages of time workers are based solely on
hourly rate or salary; incentive workers are those whose wages are at least partiallybased on productivity payments such as piece rates, commissions, and productionbonuses.
5 Workers are classified by occupation using the 2000 Standard OccupationalClassification (SOC) system. See appendix B for more information.
6 Estimates for goods-producing and service-providing industries are published forprivate industry only. Industries are determined by the 2007 North American IndustryClassification System (NAICS).
NOTE: Dashes indicate that no data were reported or that data did not meet publicationcriteria.
SOURCE: Bureau of Labor Statistics, National Compensation Survey.
3

Table 2. Civilian workers: Mean hourly earnings1 for full-time and part-time workers2 by work levels3, Austin-RoundRock-San Marcos, TX, May 2010
Occupation4 and level
Total Full-time workers Part-time workers
MeanRelativeerror5
(percent)Mean
Relativeerror5
(percent)Mean
Relativeerror5
(percent)
All workers .............................................................................. $21.08 4.2 $22.54 4.6 $10.49 4.1
Management occupations ................................................. 41.52 10.0 41.52 10.0 – –Level 9 ............................................................. 31.24 4.2 31.24 4.2 – –Level 11 ............................................................ 39.63 8.0 39.63 8.0 – –Level 12 ............................................................ 54.04 4.7 54.04 4.7 – –Not able to be leveled ....................................... 50.11 7.6 50.11 7.6 – –
General and operations managers ................................... 45.37 10.1 45.37 10.1 – –Marketing and sales managers ........................................ 46.30 9.9 46.30 9.9 – –Financial managers .......................................................... 34.80 6.9 34.80 6.9 – –Engineering managers ..................................................... 56.28 11.3 56.28 11.3 – –
Business and financial operations occupations ............. 26.66 2.5 26.66 2.5 – –Level 7 ............................................................. 19.18 9.9 19.18 9.9 – –Level 9 ............................................................. 24.91 3.9 24.91 3.9 – –Level 11 ............................................................ 30.28 1.8 30.28 1.8 – –Not able to be leveled ....................................... 30.18 4.2 30.18 4.2 – –
Human resources, training, and labor relationsspecialists ................................................................... 24.85 3.8 24.85 3.8 – –
Management analysts ...................................................... 28.46 5.7 28.46 5.7 – –Accountants and auditors ................................................. 28.77 4.8 28.77 4.8 – –
Computer and mathematical science occupations ......... 37.07 5.1 37.01 5.4 – –Level 9 ............................................................. 30.70 5.2 30.70 5.2 – –Level 11 ............................................................ 41.23 8.4 41.23 8.4 – –Level 13 ............................................................ 55.05 1.6 – – – –
Computer software engineers .......................................... 45.96 2.3 45.96 2.3 – –Computer software engineers, applications ................. 46.69 2.4 46.69 2.4 – –Computer software engineers, systems software ......... 45.04 3.4 45.04 3.4 – –
Computer support specialists ........................................... 23.34 18.1 23.34 18.1 – –Computer systems analysts ............................................. 37.50 6.8 37.50 6.8 – –Network and computer systems administrators ................ 30.69 12.6 32.39 11.7 – –
Architecture and engineering occupations ..................... 31.79 6.5 31.58 6.5 – –Level 7 ............................................................. 22.57 3.6 22.57 3.6 – –Level 8 ............................................................. 31.01 1.3 31.01 1.3 – –Level 9 ............................................................. 32.98 4.0 32.98 4.0 – –Level 11 ............................................................ 44.41 .7 44.41 .7 – –Level 12 ............................................................ 47.74 4.3 47.37 4.4 – –
Engineers ......................................................................... 44.41 4.8 44.20 5.0 – –Level 11 ............................................................ 44.24 .9 44.24 .9 – –Level 12 ............................................................ 47.74 4.3 47.37 4.4 – –
Computer hardware engineers ..................................... 47.69 2.5 47.69 2.5 – –Electrical and electronics engineers ............................. 40.56 11.9 40.56 11.9 – –
Electronics engineers, except computer ................... 42.85 3.9 42.85 3.9 – –Engineering technicians, except drafters .......................... 21.50 4.6 21.50 4.6 – –
Electrical and electronic engineering technicians ......... 21.57 5.2 21.57 5.2 – –
Life, physical, and social science occupations ............... 23.75 7.3 27.16 7.3 – –
Community and social services occupations .................. 17.45 16.9 17.45 16.9 – –Level 9 ............................................................. 24.03 7.6 24.03 7.6 – –
Miscellaneous community and social service specialists 14.51 25.7 14.51 25.7 – –
Legal occupations .............................................................. 41.10 16.3 41.10 16.3 – –Level 11 ............................................................ 34.25 .4 34.25 .4 – –
Lawyers ............................................................................ 49.32 9.0 49.32 9.0 – –Level 11 ............................................................ 34.25 .4 34.25 .4 – –
Paralegals and legal assistants ........................................ 24.80 12.0 24.80 12.0 – –
Education, training, and library occupations .................. 28.68 6.2 30.40 7.0 15.80 12.3Level 7 ............................................................. 20.49 26.0 21.52 26.8 – –Level 8 ............................................................. 31.69 1.5 31.46 1.1 – –Level 9 ............................................................. 31.23 2.0 31.43 1.6 – –Level 11 ............................................................ 31.17 14.4 – – – –
Postsecondary teachers ................................................... 46.79 1.4 58.27 3.9 – –
See footnotes at end of table.
4

Table 2. Civilian workers: Mean hourly earnings1 for full-time and part-time workers2 by work levels3, Austin-RoundRock-San Marcos, TX, May 2010 — Continued
Occupation4 and level
Total Full-time workers Part-time workers
MeanRelativeerror5
(percent)Mean
Relativeerror5
(percent)Mean
Relativeerror5
(percent)
Education, training, and library occupations –ContinuedPrimary, secondary, and special education school
teachers ...................................................................... $29.32 4.9 $30.03 4.3 – –Level 8 ............................................................. 31.69 1.5 31.46 1.1 – –Level 9 ............................................................. 31.12 .7 31.12 .7 – –
Elementary and middle school teachers ....................... 31.42 .9 31.26 .7 – –Level 8 ............................................................. 31.80 1.7 31.44 .6 – –Level 9 ............................................................. 30.90 .1 30.90 .1 – –
Elementary school teachers, except specialeducation ............................................................ 31.21 .9 31.21 .9 – –
Middle school teachers, except special andvocational education ........................................... 31.79 1.9 31.34 .6 – –
Secondary school teachers .......................................... 32.02 2.2 32.02 2.2 – –
Arts, design, entertainment, sports, and mediaoccupations .................................................................. 21.50 14.0 23.38 11.4 – –
Designers ......................................................................... 15.33 12.6 16.09 11.6 – –Writers and editors ........................................................... 24.57 14.1 24.57 14.1 – –
Editors .......................................................................... 20.19 1.1 20.19 1.1 – –
Healthcare practitioner and technical occupations ........ 30.11 13.7 30.17 16.0 $29.73 6.8Level 7 ............................................................. 29.30 8.3 30.09 10.4 – –Level 8 ............................................................. 30.19 2.1 – – – –Level 9 ............................................................. 29.08 6.5 – – – –
Registered nurses ............................................................ 28.96 5.6 28.04 5.7 31.26 4.0Level 9 ............................................................. 29.08 6.5 – – – –
Health diagnosing and treating practitioner supporttechnicians .................................................................. 15.84 8.3 15.88 8.6 – –
Healthcare support occupations ....................................... 10.27 11.2 11.84 19.3 – –Level 2 ............................................................. – – 10.79 2.1 – –
Nursing, psychiatric, and home health aides .................... 8.39 6.2 9.30 12.6 – –Home health aides ........................................................ 7.41 3.3 – – – –Nursing aides, orderlies, and attendants ...................... 12.24 3.7 12.29 3.7 – –
Miscellaneous healthcare support occupations ................ 17.35 8.9 17.47 8.8 – –
Protective service occupations ......................................... 20.93 25.3 21.92 25.2 – –
Food preparation and serving related occupations ........ 8.49 9.6 9.67 18.7 6.71 3.4Level 1 ............................................................. 6.66 16.6 – – 5.47 14.8Level 2 ............................................................. 7.19 13.1 7.02 21.6 7.41 3.2Level 3 ............................................................. 9.83 12.8 – – – –Level 4 ............................................................. 11.56 3.4 – – – –
First-line supervisors/managers, food preparation andserving workers .......................................................... 18.04 8.0 – – – –
First-line supervisors/managers of food preparationand serving workers ............................................... 18.04 8.0 – – – –
Cooks ............................................................................... 10.48 4.0 11.02 5.6 – –Food service, tipped ......................................................... 3.51 5.6 3.00 25.1 3.93 18.8
Level 1 ............................................................. 4.50 12.5 – – 4.23 10.6Level 2 ............................................................. 3.04 18.0 – – 3.94 17.3
Waiters and waitresses ................................................ 2.62 5.5 – – 2.97 16.5Level 2 ............................................................. 2.31 1.9 – – – –
Dining room and cafeteria attendants and bartenderhelpers .................................................................... 8.64 6.3 – – – –
Fast food and counter workers ......................................... 8.73 3.8 9.34 7.9 8.12 3.4Level 2 ............................................................. 8.25 3.6 – – – –
Combined food preparation and serving workers,including fast food ................................................... 8.78 3.4 – – 8.12 3.4
Level 2 ............................................................. 8.29 3.4 – – – –Hosts and hostesses, restaurant, lounge, and coffee
shop ............................................................................ 8.52 .3 – – – –
Building and grounds cleaning and maintenanceoccupations .................................................................. 10.29 8.9 11.12 9.6 – –
Level 2 ............................................................. 9.66 8.6 – – – –
See footnotes at end of table.
5

Table 2. Civilian workers: Mean hourly earnings1 for full-time and part-time workers2 by work levels3, Austin-RoundRock-San Marcos, TX, May 2010 — Continued
Occupation4 and level
Total Full-time workers Part-time workers
MeanRelativeerror5
(percent)Mean
Relativeerror5
(percent)Mean
Relativeerror5
(percent)
Building and grounds cleaning and maintenanceoccupations –Continued
Building cleaning workers ................................................. $9.11 7.5 $9.54 8.6 – –Level 2 ............................................................. 9.66 8.6 – – – –
Janitors and cleaners, except maids andhousekeeping cleaners ........................................... 9.48 7.7 – – – –
Personal care and service occupations ........................... 11.16 10.7 11.83 10.3 – –
Sales and related occupations .......................................... 18.70 15.6 22.02 15.5 $9.92 1.3Level 1 ............................................................. 9.34 5.6 – – 9.13 5.5Level 2 ............................................................. 10.02 1.2 10.17 2.4 9.75 .5Level 3 ............................................................. 11.13 2.1 – – 10.55 1.7Level 4 ............................................................. 15.88 6.7 – – – –Level 5 ............................................................. 16.06 17.9 16.62 17.3 – –Not able to be leveled ....................................... 31.99 10.1 36.92 8.5 – –
First-line supervisors/managers, sales workers ............... 34.28 13.6 34.28 13.6 – –First-line supervisors/managers of retail sales workers 23.24 13.1 23.24 13.1 – –
Retail sales workers ......................................................... 11.39 4.0 12.61 5.8 9.85 .4Level 1 ............................................................. 9.34 5.6 – – 9.13 5.5Level 2 ............................................................. 10.02 1.2 10.17 2.4 9.75 .5Level 3 ............................................................. 11.23 2.4 – – 10.55 1.7
Cashiers, all workers .................................................... 10.14 1.1 10.46 1.2 9.76 1.8Level 1 ............................................................. 9.78 8.1 – – – –Level 2 ............................................................. 9.96 2.1 10.04 3.8 9.76 1.0
Cashiers ................................................................... 10.14 1.1 10.46 1.2 9.76 1.8Level 1 ............................................................. 9.78 8.1 – – – –Level 2 ............................................................. 9.96 2.1 10.04 3.8 9.76 1.0
Retail salespersons ...................................................... 12.37 10.3 14.33 8.8 9.62 7.2Level 3 ............................................................. 11.04 .1 – – – –
Office and administrative support occupations .............. 16.17 2.3 16.43 2.8 12.93 13.8Level 2 ............................................................. 10.84 4.1 10.99 5.3 10.16 3.4Level 3 ............................................................. 12.43 4.8 12.90 5.4 – –Level 4 ............................................................. 14.42 3.8 14.48 3.5 – –Level 5 ............................................................. 16.74 1.5 16.72 1.5 – –Level 6 ............................................................. 19.43 3.0 19.13 2.8 – –Level 7 ............................................................. 24.31 3.7 24.22 3.7 – –Not able to be leveled ....................................... 16.07 10.1 16.07 10.1 – –
Financial clerks ................................................................. 15.78 6.9 15.95 7.7 – –Level 5 ............................................................. 16.41 2.3 16.41 2.3 – –Level 6 ............................................................. 21.61 5.4 21.61 5.4 – –
Bookkeeping, accounting, and auditing clerks ............. 17.41 5.0 17.41 5.0 – –Level 5 ............................................................. 16.66 3.0 16.66 3.0 – –Level 6 ............................................................. 20.98 5.8 20.98 5.8 – –
Customer service representatives .................................... 16.16 10.6 15.16 8.3 – –Receptionists and information clerks ................................ 12.39 4.7 12.83 4.4 – –Stock clerks and order fillers ............................................ 11.65 10.4 13.28 10.8 9.62 9.1Secretaries and administrative assistants ........................ 19.34 5.0 19.27 5.1 – –
Level 5 ............................................................. 16.58 3.9 16.58 3.9 – –Level 6 ............................................................. 18.24 6.0 18.24 6.0 – –Level 7 ............................................................. 24.69 6.8 24.50 7.4 – –
Executive secretaries and administrative assistants .... 19.24 4.6 19.12 4.8 – –Level 6 ............................................................. 17.90 6.3 17.90 6.3 – –
Legal secretaries .......................................................... 21.62 2.5 21.62 2.5 – –Secretaries, except legal, medical, and executive ........ 18.20 5.8 18.20 5.8 – –
Level 5 ............................................................. 16.92 7.4 16.92 7.4 – –Office clerks, general ........................................................ 14.96 5.7 15.07 5.7 – –
Construction and extraction occupations ....................... 17.08 6.9 17.08 6.9 – –Level 2 ............................................................. 11.11 9.0 11.11 9.0 – –
Installation, maintenance, and repair occupations ......... 21.03 8.2 21.03 8.2 – –Automotive technicians and repairers .............................. 23.66 25.4 23.66 25.4 – –Industrial machinery installation, repair, and maintenance
workers ....................................................................... 17.59 12.1 17.59 12.1 – –
See footnotes at end of table.
6

Table 2. Civilian workers: Mean hourly earnings1 for full-time and part-time workers2 by work levels3, Austin-RoundRock-San Marcos, TX, May 2010 — Continued
Occupation4 and level
Total Full-time workers Part-time workers
MeanRelativeerror5
(percent)Mean
Relativeerror5
(percent)Mean
Relativeerror5
(percent)
Production occupations .................................................... $12.27 5.2 $12.27 5.2 – –Level 2 ............................................................. 9.31 13.6 9.31 13.6 – –Level 3 ............................................................. 11.29 9.2 11.29 9.2 – –Level 4 ............................................................. 13.96 10.0 13.96 10.0 – –Level 5 ............................................................. 18.58 2.9 18.58 2.9 – –Not able to be leveled ....................................... 9.93 9.7 9.93 9.7 – –
Electrical, electronics, and electromechanicalassemblers ................................................................. 9.85 5.6 9.85 5.6 – –
Butchers and other meat, poultry, and fish processingworkers ....................................................................... 10.73 9.9 10.73 9.9 – –
Transportation and material moving occupations .......... 10.97 6.4 11.16 7.1 $10.21 8.1Level 1 ............................................................. 8.58 13.5 – – 8.12 6.1Level 2 ............................................................. 10.55 2.6 10.43 2.6 – –Level 3 ............................................................. 13.37 14.1 – – – –
Laborers and material movers, hand ................................ 10.15 8.7 10.21 9.9 10.00 10.2Level 1 ............................................................. 8.58 13.5 – – 8.12 6.1Level 2 ............................................................. 10.26 5.5 – – – –
Laborers and freight, stock, and material movers,hand ........................................................................ 11.03 9.0 11.43 9.1 10.27 12.0
Level 1 ............................................................. 10.10 19.0 – – 8.32 8.1
1 Earnings are the straight-time hourly wages or salaries paid to employees.They include incentive pay, cost-of-living adjustments, and hazard pay. Excludedare premium pay for overtime, vacations, holidays, nonproduction bonuses, andtips. The mean is computed by totaling the pay of all workers and dividing by thenumber of workers, weighted by hours. See appendix A for more information.
2 Employees are classified as working either a full-time or a part-timeschedule based on the definition used by each establishment. Therefore, aworker with a 35-hour-per-week schedule might be considered a full-timeemployee in one establishment, but classified as part-time in another firm, wherea 40-hour week is the minimum full-time schedule.
3 Each occupation for which data are collected in an establishment isevaluated based on four factors, including knowledge, job controls andcomplexity, contacts, and physical environment. The knowledge factor is tailoredto 24 families of closely related jobs. Points are assigned based on the
occupation’s rank within each factor. The points are summed to determine theoverall level of the occupation. See appendix A for more information.
4 Workers are classified by occupation using the 2000 StandardOccupational Classification (SOC) system. See appendix B for more information.
5 The relative standard error (RSE) is the standard error expressed as apercent of the estimate. It can be used to calculate a "confidence interval" arounda sample estimate. For more information about RSEs, see appendix A.
SOURCE: Bureau of Labor Statistics, National Compensation Survey.
NOTE: Dashes indicate that no data were reported or that data did not meetpublication criteria. Overall occupational groups may include data for categoriesnot shown separately
7

Table 3. Private industry workers: Mean hourly earnings1 for full-time and part-time workers2 by work levels3,Austin-Round Rock-San Marcos, TX, May 2010
Occupation4 and level
Total Full-time workers Part-time workers
MeanRelativeerror5
(percent)Mean
Relativeerror5
(percent)Mean
Relativeerror5
(percent)
All workers .............................................................................. $19.88 5.3 $21.55 5.8 $9.91 3.5
Management occupations ................................................. 38.12 9.0 38.12 9.0 – –Level 9 ............................................................. 31.21 3.2 31.21 3.2 – –Not able to be leveled ....................................... 53.59 9.3 53.59 9.3 – –
General and operations managers ................................... 48.71 8.3 48.71 8.3 – –Marketing and sales managers ........................................ 46.30 9.9 46.30 9.9 – –Financial managers .......................................................... 34.56 6.9 34.56 6.9 – –Engineering managers ..................................................... 56.28 11.3 56.28 11.3 – –
Business and financial operations occupations ............. 28.34 4.4 28.34 4.4 – –Level 7 ............................................................. 19.76 11.5 19.76 11.5 – –Level 9 ............................................................. 26.50 7.6 26.50 7.6 – –Not able to be leveled ....................................... 30.18 4.2 30.18 4.2 – –
Human resources, training, and labor relationsspecialists ................................................................... 25.83 7.3 25.83 7.3 – –
Accountants and auditors ................................................. 30.18 5.8 30.18 5.8 – –
Computer and mathematical science occupations ......... 40.60 5.8 41.05 5.6 – –Level 9 ............................................................. 32.10 4.9 32.10 4.9 – –Level 11 ............................................................ 44.91 3.3 44.91 3.3 – –
Computer software engineers .......................................... 45.53 2.5 45.53 2.5 – –Computer software engineers, systems software ......... 45.04 3.4 45.04 3.4 – –
Architecture and engineering occupations ..................... 31.79 6.8 31.56 6.9 – –Level 7 ............................................................. 22.70 3.5 22.70 3.5 – –Level 8 ............................................................. 31.01 1.3 31.01 1.3 – –Level 9 ............................................................. 32.98 4.0 32.98 4.0 – –Level 11 ............................................................ 44.37 .7 44.37 .7 – –Level 12 ............................................................ 50.02 1.7 49.71 1.9 – –
Engineers ......................................................................... 44.73 5.3 44.50 5.5 – –Level 11 ............................................................ 44.19 .9 44.19 .9 – –Level 12 ............................................................ 50.02 1.7 49.71 1.9 – –
Computer hardware engineers ..................................... 47.69 2.5 47.69 2.5 – –Electrical and electronics engineers ............................. 39.99 17.3 39.99 17.3 – –
Engineering technicians, except drafters .......................... 21.62 4.7 21.62 4.7 – –Electrical and electronic engineering technicians ......... 21.57 5.2 21.57 5.2 – –
Legal occupations .............................................................. 42.12 17.3 42.12 17.3 – –
Arts, design, entertainment, sports, and mediaoccupations .................................................................. 21.53 15.0 23.59 12.1 – –
Designers ......................................................................... 15.33 12.6 16.09 11.6 – –Writers and editors ........................................................... 24.57 14.1 24.57 14.1 – –
Editors .......................................................................... 20.19 1.1 20.19 1.1 – –
Healthcare practitioner and technical occupations ........ 31.62 15.0 32.00 18.2 29.73 6.8Level 7 ............................................................. 30.57 6.5 31.76 8.6 – –Level 8 ............................................................. 30.19 2.1 – – – –Level 9 ............................................................. 30.69 4.2 – – – –
Registered nurses ............................................................ 30.21 4.1 29.59 4.2 31.26 4.0Level 9 ............................................................. 30.69 4.2 – – – –
Health diagnosing and treating practitioner supporttechnicians .................................................................. 16.06 9.0 16.12 9.3 – –
Healthcare support occupations ....................................... 9.86 13.7 11.64 25.0 – –Nursing, psychiatric, and home health aides .................... 7.75 3.6 – – – –
Home health aides ........................................................ 7.20 .9 – – – –Nursing aides, orderlies, and attendants ...................... 12.04 2.6 – – – –
Miscellaneous healthcare support occupations ................ 17.35 8.9 17.47 8.8 – –
Food preparation and serving related occupations ........ 8.36 9.7 9.52 19.5 6.71 3.4Level 1 ............................................................. 6.66 16.6 – – 5.47 14.8Level 2 ............................................................. 7.16 13.1 6.97 21.5 7.41 3.2Level 3 ............................................................. 9.83 12.8 – – – –
First-line supervisors/managers, food preparation andserving workers .......................................................... 18.04 8.0 – – – –
See footnotes at end of table.
8

Table 3. Private industry workers: Mean hourly earnings1 for full-time and part-time workers2 by work levels3,Austin-Round Rock-San Marcos, TX, May 2010 — Continued
Occupation4 and level
Total Full-time workers Part-time workers
MeanRelativeerror5
(percent)Mean
Relativeerror5
(percent)Mean
Relativeerror5
(percent)
Food preparation and serving related occupations–ContinuedFirst-line supervisors/managers of food preparation
and serving workers ............................................... $18.04 8.0 – – – –Cooks ............................................................................... 10.04 1.8 $10.61 4.0 – –Food service, tipped ......................................................... 3.51 5.6 3.00 25.1 $3.93 18.8
Level 1 ............................................................. 4.50 12.5 – – 4.23 10.6Level 2 ............................................................. 3.04 18.0 – – 3.94 17.3
Waiters and waitresses ................................................ 2.62 5.5 – – 2.97 16.5Level 2 ............................................................. 2.31 1.9 – – – –
Dining room and cafeteria attendants and bartenderhelpers .................................................................... 8.64 6.3 – – – –
Fast food and counter workers ......................................... 8.73 3.8 9.34 7.9 8.12 3.4Level 2 ............................................................. 8.25 3.6 – – – –
Combined food preparation and serving workers,including fast food ................................................... 8.78 3.4 – – 8.12 3.4
Level 2 ............................................................. 8.29 3.4 – – – –Hosts and hostesses, restaurant, lounge, and coffee
shop ............................................................................ 8.52 .3 – – – –
Building and grounds cleaning and maintenanceoccupations .................................................................. 9.39 10.7 10.11 15.0 – –
Level 2 ............................................................. 9.09 11.0 – – – –Building cleaning workers ................................................. 8.44 6.7 – – – –
Level 2 ............................................................. 9.09 11.0 – – – –Janitors and cleaners, except maids and
housekeeping cleaners ........................................... 8.71 8.7 – – – –
Personal care and service occupations ........................... 10.73 12.3 – – – –
Sales and related occupations .......................................... 18.70 15.6 22.02 15.5 9.92 1.3Level 1 ............................................................. 9.34 5.6 – – 9.13 5.5Level 2 ............................................................. 10.02 1.2 10.17 2.4 9.75 .5Level 3 ............................................................. 11.13 2.1 – – 10.55 1.7Level 4 ............................................................. 15.88 6.7 – – – –Level 5 ............................................................. 16.06 17.9 16.62 17.3 – –Not able to be leveled ....................................... 31.99 10.1 36.92 8.5 – –
First-line supervisors/managers, sales workers ............... 34.28 13.6 34.28 13.6 – –First-line supervisors/managers of retail sales workers 23.24 13.1 23.24 13.1 – –
Retail sales workers ......................................................... 11.39 4.0 12.61 5.8 9.85 .4Level 1 ............................................................. 9.34 5.6 – – 9.13 5.5Level 2 ............................................................. 10.02 1.2 10.17 2.4 9.75 .5Level 3 ............................................................. 11.23 2.4 – – 10.55 1.7
Cashiers, all workers .................................................... 10.14 1.1 10.46 1.2 9.76 1.8Level 1 ............................................................. 9.78 8.1 – – – –Level 2 ............................................................. 9.96 2.1 10.04 3.8 9.76 1.0
Cashiers ................................................................... 10.14 1.1 10.46 1.2 9.76 1.8Level 1 ............................................................. 9.78 8.1 – – – –Level 2 ............................................................. 9.96 2.1 10.04 3.8 9.76 1.0
Retail salespersons ...................................................... 12.37 10.3 14.33 8.8 9.62 7.2Level 3 ............................................................. 11.04 .1 – – – –
Office and administrative support occupations .............. 16.11 2.3 16.41 3.2 13.05 14.7Level 2 ............................................................. 10.69 4.2 10.82 5.5 10.16 3.4Level 3 ............................................................. 12.51 5.5 13.10 6.1 – –Level 4 ............................................................. 14.79 3.4 14.75 3.4 – –Level 5 ............................................................. 16.73 1.5 16.71 1.5 – –Level 6 ............................................................. 20.68 3.4 20.35 3.3 – –Level 7 ............................................................. 24.76 3.6 24.67 3.4 – –Not able to be leveled ....................................... 14.77 8.8 14.77 8.8 – –
Financial clerks ................................................................. 15.25 7.2 15.44 8.2 – –Level 5 ............................................................. 16.26 3.2 16.26 3.2 – –Level 6 ............................................................. 20.62 3.7 20.62 3.7 – –
Bookkeeping, accounting, and auditing clerks ............. 16.74 5.2 16.74 5.2 – –Level 5 ............................................................. 16.57 4.7 16.57 4.7 – –
Customer service representatives .................................... 16.16 10.6 15.16 8.3 – –
See footnotes at end of table.
9

Table 3. Private industry workers: Mean hourly earnings1 for full-time and part-time workers2 by work levels3,Austin-Round Rock-San Marcos, TX, May 2010 — Continued
Occupation4 and level
Total Full-time workers Part-time workers
MeanRelativeerror5
(percent)Mean
Relativeerror5
(percent)Mean
Relativeerror5
(percent)
Office and administrative support occupations–Continued
Receptionists and information clerks ................................ $12.39 4.7 $12.83 4.4 – –Stock clerks and order fillers ............................................ 11.65 10.4 13.28 10.8 $9.62 9.1Secretaries and administrative assistants ........................ 20.27 7.0 20.16 7.3 – –
Level 5 ............................................................. 16.39 2.8 16.39 2.8 – –Level 7 ............................................................. 25.74 4.8 – – – –
Executive secretaries and administrative assistants .... 20.44 5.2 20.17 6.0 – –Secretaries, except legal, medical, and executive ........ 18.77 9.1 18.77 9.1 – –
Office clerks, general ........................................................ 16.09 6.7 16.33 6.6 – –
Construction and extraction occupations ....................... 17.19 7.1 17.19 7.1 – –
Installation, maintenance, and repair occupations ......... 21.24 8.5 21.24 8.5 – –Automotive technicians and repairers .............................. 23.66 25.4 23.66 25.4 – –
Production occupations .................................................... 12.27 5.2 12.27 5.2 – –Level 2 ............................................................. 9.31 13.6 9.31 13.6 – –Level 3 ............................................................. 11.29 9.2 11.29 9.2 – –Level 4 ............................................................. 13.96 10.0 13.96 10.0 – –Level 5 ............................................................. 18.58 2.9 18.58 2.9 – –Not able to be leveled ....................................... 9.93 9.7 9.93 9.7 – –
Electrical, electronics, and electromechanicalassemblers ................................................................. 9.85 5.6 9.85 5.6 – –
Butchers and other meat, poultry, and fish processingworkers ....................................................................... 10.73 9.9 10.73 9.9 – –
Transportation and material moving occupations .......... 10.95 6.5 11.13 7.2 10.21 8.1Level 1 ............................................................. 8.58 13.5 – – 8.12 6.1Level 2 ............................................................. 10.50 2.5 10.36 2.5 – –Level 3 ............................................................. 13.37 14.1 – – – –
Laborers and material movers, hand ................................ 10.15 8.7 10.21 9.9 10.00 10.2Level 1 ............................................................. 8.58 13.5 – – 8.12 6.1Level 2 ............................................................. 10.26 5.5 – – – –
Laborers and freight, stock, and material movers,hand ........................................................................ 11.03 9.0 11.43 9.1 10.27 12.0
Level 1 ............................................................. 10.10 19.0 – – 8.32 8.1
1 Earnings are the straight-time hourly wages or salaries paid to employees.They include incentive pay, cost-of-living adjustments, and hazard pay. Excludedare premium pay for overtime, vacations, holidays, nonproduction bonuses, andtips. The mean is computed by totaling the pay of all workers and dividing by thenumber of workers, weighted by hours. See appendix A for more information.
2 Employees are classified as working either a full-time or a part-timeschedule based on the definition used by each establishment. Therefore, aworker with a 35-hour-per-week schedule might be considered a full-timeemployee in one establishment, but classified as part-time in another firm, wherea 40-hour week is the minimum full-time schedule.
3 Each occupation for which data are collected in an establishment isevaluated based on four factors, including knowledge, job controls andcomplexity, contacts, and physical environment. The knowledge factor is tailoredto 24 families of closely related jobs. Points are assigned based on the
occupation’s rank within each factor. The points are summed to determine theoverall level of the occupation. See appendix A for more information.
4 Workers are classified by occupation using the 2000 StandardOccupational Classification (SOC) system. See appendix B for more information.
5 The relative standard error (RSE) is the standard error expressed as apercent of the estimate. It can be used to calculate a "confidence interval" arounda sample estimate. For more information about RSEs, see appendix A.
SOURCE: Bureau of Labor Statistics, National Compensation Survey.
NOTE: Dashes indicate that no data were reported or that data did not meetpublication criteria. Overall occupational groups may include data for categoriesnot shown separately
10

Table 4. State and local government workers: Mean hourly earnings1 for full-time and part-time workers2 by worklevels3, Austin-Round Rock-San Marcos, TX, May 2010
Occupation4 and level
Total Full-time workers Part-time workers
MeanRelativeerror5
(percent)Mean
Relativeerror5
(percent)Mean
Relativeerror5
(percent)
All workers .............................................................................. $25.57 5.0 $25.87 5.4 $18.29 18.7
Management occupations ................................................. 52.23 23.2 52.23 23.2 – –
Business and financial operations occupations ............. 25.06 3.0 25.06 3.0 – –Level 9 ............................................................. 24.23 5.2 24.23 5.2 – –
Computer and mathematical science occupations ......... 30.43 10.8 29.27 11.7 – –Level 11 ............................................................ 37.67 13.3 37.67 13.3 – –
Life, physical, and social science occupations ............... 19.58 9.7 – – – –
Community and social services occupations .................. 21.11 5.5 21.11 5.5 – –Level 9 ............................................................. 23.50 7.5 23.50 7.5 – –
Legal occupations .............................................................. 34.76 1.6 34.76 1.6 – –Lawyers ............................................................................ 34.55 1.0 34.55 1.0 – –
Education, training, and library occupations .................. 30.22 4.4 32.49 4.6 14.97 12.0Level 7 ............................................................. 26.79 19.4 – – – –Level 9 ............................................................. 31.23 2.0 31.43 1.6 – –Level 11 ............................................................ 31.17 14.4 – – – –
Postsecondary teachers ................................................... 46.79 1.4 58.27 3.9 – –Primary, secondary, and special education school
teachers ...................................................................... 30.32 3.1 31.28 1.2 – –Level 9 ............................................................. 31.12 .7 31.12 .7 – –
Elementary and middle school teachers ....................... 31.17 .7 31.17 .7 – –Level 9 ............................................................. 30.90 .1 30.90 .1 – –
Elementary school teachers, except specialeducation ............................................................ 31.18 .9 31.18 .9 – –
Healthcare practitioner and technical occupations ........ 24.08 12.2 24.08 12.2 – –
Healthcare support occupations ....................................... 12.48 13.4 12.48 13.4 – –
Protective service occupations ......................................... 28.31 10.4 28.31 10.4 – –
Office and administrative support occupations .............. 16.37 6.0 16.50 5.7 – –Level 4 ............................................................. 13.31 9.1 13.57 8.9 – –Level 5 ............................................................. 16.76 4.5 16.76 4.5 – –Level 6 ............................................................. 17.19 6.7 17.20 6.7 – –
Secretaries and administrative assistants ........................ 18.19 6.1 18.19 6.1 – –Executive secretaries and administrative assistants .... 18.41 7.6 18.41 7.6 – –
Office clerks, general ........................................................ 12.96 5.1 12.96 5.1 – –
1 Earnings are the straight-time hourly wages or salaries paid to employees.They include incentive pay, cost-of-living adjustments, and hazard pay. Excludedare premium pay for overtime, vacations, holidays, nonproduction bonuses, andtips. The mean is computed by totaling the pay of all workers and dividing by thenumber of workers, weighted by hours. See appendix A for more information.
2 Employees are classified as working either a full-time or a part-timeschedule based on the definition used by each establishment. Therefore, aworker with a 35-hour-per-week schedule might be considered a full-timeemployee in one establishment, but classified as part-time in another firm, wherea 40-hour week is the minimum full-time schedule.
3 Each occupation for which data are collected in an establishment isevaluated based on four factors, including knowledge, job controls andcomplexity, contacts, and physical environment. The knowledge factor is tailoredto 24 families of closely related jobs. Points are assigned based on the
occupation’s rank within each factor. The points are summed to determine theoverall level of the occupation. See appendix A for more information.
4 Workers are classified by occupation using the 2000 StandardOccupational Classification (SOC) system. See appendix B for more information.
5 The relative standard error (RSE) is the standard error expressed as apercent of the estimate. It can be used to calculate a "confidence interval" arounda sample estimate. For more information about RSEs, see appendix A.
SOURCE: Bureau of Labor Statistics, National Compensation Survey.
NOTE: Dashes indicate that no data were reported or that data did not meetpublication criteria. Overall occupational groups may include data for categoriesnot shown separately
11

Table 5. Combined work levels1 for civilian workers: Mean hourly earnings2 for full-time and part-time workers3,Austin-Round Rock-San Marcos, TX, May 2010
Occupation4 and level
Total Full-time workers Part-time workers
MeanRelativeerror5
(percent)Mean
Relativeerror5
(percent)Mean
Relativeerror5
(percent)
All workers .............................................................................. $21.08 4.2 $22.54 4.6 $10.49 4.1
Management occupations ................................................. 41.52 10.0 41.52 10.0 – –Group II ............................................................. 17.64 10.9 – – – –Group III ............................................................ 38.20 6.7 – – – –
General and operations managers ................................... 45.37 10.1 45.37 10.1 – –Marketing and sales managers ........................................ 46.30 9.9 46.30 9.9 – –Financial managers .......................................................... 34.80 6.9 34.80 6.9 – –
Group III ............................................................ 33.53 7.9 33.53 7.9 – –Engineering managers ..................................................... 56.28 11.3 56.28 11.3 – –
Business and financial operations occupations ............. 26.66 2.5 26.66 2.5 – –Group II ............................................................. 20.99 4.7 – – – –Group III ............................................................ 28.42 2.9 – – – –
Human resources, training, and labor relationsspecialists ................................................................... 24.85 3.8 24.85 3.8 – –
Management analysts ...................................................... 28.46 5.7 28.46 5.7 – –Accountants and auditors ................................................. 28.77 4.8 28.77 4.8 – –
Group III ............................................................ 30.16 4.3 30.16 4.3 – –
Computer and mathematical science occupations ......... 37.07 5.1 37.01 5.4 – –Group II ............................................................. 20.67 7.5 – – – –Group III ............................................................ 37.63 5.6 – – – –Group IV ........................................................... 58.59 4.5 – – – –
Computer software engineers .......................................... 45.96 2.3 45.96 2.3 – –Group III ............................................................ 44.36 3.3 – – – –
Computer software engineers, applications ................. 46.69 2.4 46.69 2.4 – –Computer software engineers, systems software ......... 45.04 3.4 45.04 3.4 – –
Computer support specialists ........................................... 23.34 18.1 23.34 18.1 – –Computer systems analysts ............................................. 37.50 6.8 37.50 6.8 – –
Group III ............................................................ 34.87 5.7 34.87 5.7 – –Network and computer systems administrators ................ 30.69 12.6 32.39 11.7 – –
Architecture and engineering occupations ..................... 31.79 6.5 31.58 6.5 – –Group II ............................................................. 22.18 3.6 – – – –Group III ............................................................ 41.42 5.7 – – – –
Engineers ......................................................................... 44.41 4.8 44.20 5.0 – –Group II ............................................................. 26.77 7.5 – – – –Group III ............................................................ 44.17 1.5 – – – –
Computer hardware engineers ..................................... 47.69 2.5 47.69 2.5 – –Electrical and electronics engineers ............................. 40.56 11.9 40.56 11.9 – –
Group III ............................................................ 44.42 4.3 – – – –Electronics engineers, except computer ................... 42.85 3.9 42.85 3.9 – –
Group III ............................................................ 43.23 3.4 43.23 3.4 – –Engineering technicians, except drafters .......................... 21.50 4.6 21.50 4.6 – –
Group II ............................................................. 20.86 3.3 – – – –Electrical and electronic engineering technicians ......... 21.57 5.2 21.57 5.2 – –
Group II ............................................................. 20.87 4.0 20.87 4.0 – –
Life, physical, and social science occupations ............... 23.75 7.3 27.16 7.3 – –Group III ............................................................ 27.16 7.3 – – – –
Community and social services occupations .................. 17.45 16.9 17.45 16.9 – –Group II ............................................................. 13.75 21.5 – – – –Group III ............................................................ 24.03 7.6 – – – –
Miscellaneous community and social service specialists 14.51 25.7 14.51 25.7 – –
Legal occupations .............................................................. 41.10 16.3 41.10 16.3 – –Group III ............................................................ 33.86 1.5 – – – –Group IV ........................................................... 76.09 .3 – – – –
Lawyers ............................................................................ 49.32 9.0 49.32 9.0 – –Group III ............................................................ 34.26 .4 34.26 .4 – –Group IV ........................................................... 76.09 .3 76.09 .3 – –
Paralegals and legal assistants ........................................ 24.80 12.0 24.80 12.0 – –
Education, training, and library occupations .................. 28.68 6.2 30.40 7.0 15.80 12.3Group II ............................................................. 23.61 8.9 – – – –
See footnotes at end of table.
12

Table 5. Combined work levels1 for civilian workers: Mean hourly earnings2 for full-time and part-time workers3,Austin-Round Rock-San Marcos, TX, May 2010 — Continued
Occupation4 and level
Total Full-time workers Part-time workers
MeanRelativeerror5
(percent)Mean
Relativeerror5
(percent)Mean
Relativeerror5
(percent)
Education, training, and library occupations –ContinuedGroup III ............................................................ $36.95 6.1 – – – –
Postsecondary teachers ................................................... 46.79 1.4 $58.27 3.9 – –Group III ............................................................ 58.27 3.9 – – – –
Primary, secondary, and special education schoolteachers ...................................................................... 29.32 4.9 30.03 4.3 – –
Group II ............................................................. 27.89 9.2 – – – –Group III ............................................................ 31.12 .7 – – – –
Elementary and middle school teachers ....................... 31.42 .9 31.26 .7 – –Group II ............................................................. 31.87 1.5 – – – –Group III ............................................................ 30.90 .1 – – – –
Elementary school teachers, except specialeducation ............................................................ 31.21 .9 31.21 .9 – –
Middle school teachers, except special andvocational education ........................................... 31.79 1.9 31.34 .6 – –
Secondary school teachers .......................................... 32.02 2.2 32.02 2.2 – –
Arts, design, entertainment, sports, and mediaoccupations .................................................................. 21.50 14.0 23.38 11.4 – –
Group II ............................................................. 17.82 10.8 – – – –Group III ............................................................ 36.75 9.5 – – – –
Designers ......................................................................... 15.33 12.6 16.09 11.6 – –Group II ............................................................. 15.33 12.6 – – – –
Writers and editors ........................................................... 24.57 14.1 24.57 14.1 – –Editors .......................................................................... 20.19 1.1 20.19 1.1 – –
Healthcare practitioner and technical occupations ........ 30.11 13.7 30.17 16.0 $29.73 6.8Group I .............................................................. 13.25 2.3 – – – –Group II ............................................................. 24.85 10.3 – – – –Group III ............................................................ 41.75 22.2 – – – –
Registered nurses ............................................................ 28.96 5.6 28.04 5.7 31.26 4.0Group III ............................................................ 29.08 6.5 – – – –
Health diagnosing and treating practitioner supporttechnicians .................................................................. 15.84 8.3 15.88 8.6 – –
Healthcare support occupations ....................................... 10.27 11.2 11.84 19.3 – –Group I .............................................................. 8.85 6.3 – – – –
Nursing, psychiatric, and home health aides .................... 8.39 6.2 9.30 12.6 – –Group I .............................................................. 8.15 5.8 – – – –
Home health aides ........................................................ 7.41 3.3 – – – –Group I .............................................................. 7.40 3.3 – – – –
Nursing aides, orderlies, and attendants ...................... 12.24 3.7 12.29 3.7 – –Group I .............................................................. 11.79 2.2 11.84 2.3 – –
Miscellaneous healthcare support occupations ................ 17.35 8.9 17.47 8.8 – –Group I .............................................................. 14.96 7.1 – – – –
Protective service occupations ......................................... 20.93 25.3 21.92 25.2 – –
Food preparation and serving related occupations ........ 8.49 9.6 9.67 18.7 6.71 3.4Group I .............................................................. 7.83 8.2 – – – –
First-line supervisors/managers, food preparation andserving workers .......................................................... 18.04 8.0 – – – –
First-line supervisors/managers of food preparationand serving workers ............................................... 18.04 8.0 – – – –
Cooks ............................................................................... 10.48 4.0 11.02 5.6 – –Group I .............................................................. 10.48 4.0 – – – –
Food service, tipped ......................................................... 3.51 5.6 3.00 25.1 3.93 18.8Group I .............................................................. 3.51 5.6 – – – –
Waiters and waitresses ................................................ 2.62 5.5 – – 2.97 16.5Group I .............................................................. 2.62 5.5 – – 2.97 16.5
Dining room and cafeteria attendants and bartenderhelpers .................................................................... 8.64 6.3 – – – –
Group I .............................................................. 8.64 6.3 – – – –Fast food and counter workers ......................................... 8.73 3.8 9.34 7.9 8.12 3.4
Group I .............................................................. 8.73 3.8 – – – –
See footnotes at end of table.
13

Table 5. Combined work levels1 for civilian workers: Mean hourly earnings2 for full-time and part-time workers3,Austin-Round Rock-San Marcos, TX, May 2010 — Continued
Occupation4 and level
Total Full-time workers Part-time workers
MeanRelativeerror5
(percent)Mean
Relativeerror5
(percent)Mean
Relativeerror5
(percent)
Food preparation and serving related occupations–ContinuedCombined food preparation and serving workers,
including fast food ................................................... $8.78 3.4 – – $8.12 3.4Group I .............................................................. 8.78 3.4 – – 8.12 3.4
Hosts and hostesses, restaurant, lounge, and coffeeshop ............................................................................ 8.52 .3 – – – –
Group I .............................................................. 8.52 .3 – – – –
Building and grounds cleaning and maintenanceoccupations .................................................................. 10.29 8.9 $11.12 9.6 – –
Group I .............................................................. 9.85 7.8 – – – –Building cleaning workers ................................................. 9.11 7.5 9.54 8.6 – –
Group I .............................................................. 9.11 7.5 – – – –Janitors and cleaners, except maids and
housekeeping cleaners ........................................... 9.48 7.7 – – – –Group I .............................................................. 9.48 7.7 – – – –
Personal care and service occupations ........................... 11.16 10.7 11.83 10.3 – –Group I .............................................................. 9.50 14.0 – – – –
Sales and related occupations .......................................... 18.70 15.6 22.02 15.5 9.92 1.3Group I .............................................................. 11.18 5.8 – – – –Group II ............................................................. 23.32 21.6 – – – –
First-line supervisors/managers, sales workers ............... 34.28 13.6 34.28 13.6 – –First-line supervisors/managers of retail sales workers 23.24 13.1 23.24 13.1 – –
Retail sales workers ......................................................... 11.39 4.0 12.61 5.8 9.85 .4Group I .............................................................. 10.96 6.9 – – – –
Cashiers, all workers .................................................... 10.14 1.1 10.46 1.2 9.76 1.8Group I .............................................................. 10.22 .5 – – – –
Cashiers ................................................................... 10.14 1.1 10.46 1.2 9.76 1.8Group I .............................................................. 10.22 .5 10.39 1.5 9.98 .4
Retail salespersons ...................................................... 12.37 10.3 14.33 8.8 9.62 7.2Group I .............................................................. 12.21 13.2 14.40 11.0 9.62 7.6
Office and administrative support occupations .............. 16.17 2.3 16.43 2.8 12.93 13.8Group I .............................................................. 12.83 2.8 – – – –Group II ............................................................. 19.11 2.4 – – – –
Financial clerks ................................................................. 15.78 6.9 15.95 7.7 – –Group I .............................................................. 12.07 7.1 – – – –Group II ............................................................. 18.15 3.1 – – – –
Bookkeeping, accounting, and auditing clerks ............. 17.41 5.0 17.41 5.0 – –Group II ............................................................. 18.15 4.6 18.15 4.6 – –
Customer service representatives .................................... 16.16 10.6 15.16 8.3 – –Receptionists and information clerks ................................ 12.39 4.7 12.83 4.4 – –
Group I .............................................................. 12.39 4.7 12.83 4.4 – –Stock clerks and order fillers ............................................ 11.65 10.4 13.28 10.8 9.62 9.1
Group I .............................................................. 10.89 9.3 12.14 8.8 9.62 9.1Secretaries and administrative assistants ........................ 19.34 5.0 19.27 5.1 – –
Group II ............................................................. 19.46 5.2 – – – –Executive secretaries and administrative assistants .... 19.24 4.6 19.12 4.8 – –
Group II ............................................................. 19.22 4.8 19.09 4.9 – –Legal secretaries .......................................................... 21.62 2.5 21.62 2.5 – –Secretaries, except legal, medical, and executive ........ 18.20 5.8 18.20 5.8 – –
Group II ............................................................. 18.53 6.6 18.53 6.6 – –Office clerks, general ........................................................ 14.96 5.7 15.07 5.7 – –
Group I .............................................................. 13.56 7.1 13.70 7.2 – –Group II ............................................................. 16.75 9.6 16.75 9.6 – –
Construction and extraction occupations ....................... 17.08 6.9 17.08 6.9 – –Group I .............................................................. 11.77 2.3 – – – –Group II ............................................................. 23.37 9.0 – – – –
Installation, maintenance, and repair occupations ......... 21.03 8.2 21.03 8.2 – –Group I .............................................................. 15.46 8.6 – – – –Group II ............................................................. 22.93 10.9 – – – –
See footnotes at end of table.
14

Table 5. Combined work levels1 for civilian workers: Mean hourly earnings2 for full-time and part-time workers3,Austin-Round Rock-San Marcos, TX, May 2010 — Continued
Occupation4 and level
Total Full-time workers Part-time workers
MeanRelativeerror5
(percent)Mean
Relativeerror5
(percent)Mean
Relativeerror5
(percent)
Installation, maintenance, and repair occupations–Continued
Automotive technicians and repairers .............................. $23.66 25.4 $23.66 25.4 – –Industrial machinery installation, repair, and maintenance
workers ....................................................................... 17.59 12.1 17.59 12.1 – –Group II ............................................................. 18.58 13.3 – – – –
Production occupations .................................................... 12.27 5.2 12.27 5.2 – –Group I .............................................................. 10.69 9.6 – – – –Group II ............................................................. 20.11 3.1 – – – –
Electrical, electronics, and electromechanicalassemblers ................................................................. 9.85 5.6 9.85 5.6 – –
Butchers and other meat, poultry, and fish processingworkers ....................................................................... 10.73 9.9 10.73 9.9 – –
Transportation and material moving occupations .......... 10.97 6.4 11.16 7.1 $10.21 8.1Group I .............................................................. 10.92 7.4 – – – –
Laborers and material movers, hand ................................ 10.15 8.7 10.21 9.9 10.00 10.2Group I .............................................................. 10.19 10.1 – – – –
Laborers and freight, stock, and material movers,hand ........................................................................ 11.03 9.0 11.43 9.1 10.27 12.0
Group I .............................................................. 11.23 11.0 11.87 14.7 10.27 12.0
1 Combined work levels simplify the presentation of work levels by combininglevels 1 through 15 into four broad groups. Group I combines levels 1-4, group IIcombines levels 5-8, group III combines levels 9-12, and group IV combineslevels 13-15.
2 Earnings are the straight-time hourly wages or salaries paid to employees.They include incentive pay, cost-of-living adjustments, and hazard pay. Excludedare premium pay for overtime, vacations, holidays, nonproduction bonuses, andtips. The mean is computed by totaling the pay of all workers and dividing by thenumber of workers, weighted by hours. See appendix A for more information.
3 Employees are classified as working either a full-time or a part-timeschedule based on the definition used by each establishment. Therefore, aworker with a 35-hour-per-week schedule might be considered a full-timeemployee in one establishment, but classified as part-time in another firm, where
a 40-hour week is the minimum full-time schedule.4 Workers are classified by occupation using the 2000 Standard
Occupational Classification (SOC) system. See appendix B for more information.5 The relative standard error (RSE) is the standard error expressed as a
percent of the estimate. It can be used to calculate a "confidence interval" arounda sample estimate. For more information about RSEs, see appendix A.
SOURCE: Bureau of Labor Statistics, National Compensation Survey.
NOTE: Dashes indicate that no data were reported or that data did not meetpublication criteria. Overall occupational groups may include data for categoriesnot shown separately
15

Table 6. Civilian workers: Hourly wage percentiles1, Austin-Round Rock-San Marcos, TX, May 2010
Occupation2 10 25 Median50 75 90
All workers .............................................................................. $7.87 $11.00 $16.83 $27.31 $38.94
Management occupations ................................................. 17.78 25.00 36.56 51.92 71.54General and operations managers ................................... 28.73 30.84 43.27 52.93 67.31Marketing and sales managers ........................................ 21.63 37.02 46.97 51.28 60.09Financial managers .......................................................... 21.50 21.50 28.85 40.30 61.24Engineering managers ..................................................... 31.33 46.20 57.62 70.00 76.92
Business and financial operations occupations ............. 18.78 21.56 25.83 30.59 35.40Human resources, training, and labor relations
specialists ................................................................... 18.81 21.46 25.83 29.23 30.15Management analysts ...................................................... 21.25 24.31 28.42 30.73 39.28Accountants and auditors ................................................. 21.65 23.38 29.33 33.56 35.50
Computer and mathematical science occupations ......... 20.31 27.75 35.51 45.67 52.93Computer software engineers .......................................... 33.65 40.01 48.89 51.03 54.78
Computer software engineers, applications ................. 38.94 42.00 48.89 49.77 51.44Computer software engineers, systems software ......... 32.69 34.62 40.56 54.17 66.01
Computer support specialists ........................................... 15.00 16.31 18.44 27.82 44.71Computer systems analysts ............................................. 24.19 29.02 33.95 46.60 53.25Network and computer systems administrators ................ 16.00 24.86 29.05 35.64 43.32
Architecture and engineering occupations ..................... 18.71 20.81 26.20 41.08 52.35Engineers ......................................................................... 28.37 36.71 42.09 51.88 60.32
Computer hardware engineers ..................................... 35.09 37.86 45.24 52.88 67.68Electrical and electronics engineers ............................. 25.51 25.51 41.08 45.15 54.03
Electronics engineers, except computer ................... 40.62 41.08 42.06 43.27 49.04Engineering technicians, except drafters .......................... 16.92 17.84 20.81 23.12 28.61
Electrical and electronic engineering technicians ......... 16.92 17.83 20.81 24.32 28.61
Life, physical, and social science occupations ............... 17.31 17.31 24.36 25.47 33.36
Community and social services occupations .................. 7.25 10.35 17.37 21.71 24.45Miscellaneous community and social service specialists 7.25 9.56 10.35 21.40 22.22
Legal occupations .............................................................. 22.78 28.61 31.75 41.19 76.73Lawyers ............................................................................ 30.25 30.25 38.77 59.13 101.16Paralegals and legal assistants ........................................ 15.85 19.90 25.96 28.61 34.21
Education, training, and library occupations .................. 11.00 16.42 28.69 33.54 43.22Postsecondary teachers ................................................... 15.44 16.42 52.06 62.31 69.48Primary, secondary, and special education school
teachers ...................................................................... 12.60 28.16 29.72 33.37 37.36Elementary and middle school teachers ....................... 27.75 28.49 30.20 33.55 37.12
Elementary school teachers, except specialeducation ............................................................ 27.72 28.36 30.13 33.11 37.26
Middle school teachers, except special andvocational education ........................................... 28.11 28.49 30.30 34.31 37.08
Secondary school teachers .......................................... 27.47 28.74 31.02 35.82 39.27
Arts, design, entertainment, sports, and mediaoccupations .................................................................. 10.34 14.00 18.03 26.45 39.90
Designers ......................................................................... 10.82 12.00 14.00 16.83 22.80Writers and editors ........................................................... 15.01 16.61 21.52 29.09 39.90
Editors .......................................................................... 15.01 15.01 21.52 22.25 29.09
Healthcare practitioner and technical occupations ........ 14.25 19.43 26.79 32.17 39.00Registered nurses ............................................................ 23.77 25.59 28.57 32.17 33.66Health diagnosing and treating practitioner support
technicians .................................................................. 12.37 14.00 15.43 18.00 19.00
Healthcare support occupations ....................................... 6.51 7.25 7.49 12.29 17.66Nursing, psychiatric, and home health aides .................... 6.51 7.25 7.25 10.10 12.00
Home health aides ........................................................ 6.51 6.51 7.25 7.49 8.64Nursing aides, orderlies, and attendants ...................... 10.43 11.11 12.31 13.04 14.48
Miscellaneous healthcare support occupations ................ 12.22 15.38 17.66 20.50 21.50
Protective service occupations ......................................... 9.75 10.75 18.86 30.28 35.31
Food preparation and serving related occupations ........ 2.28 7.20 8.00 10.81 12.48
See footnotes at end of table.
16

Table 6. Civilian workers: Hourly wage percentiles1, Austin-Round Rock-San Marcos, TX, May 2010 —Continued
Occupation2 10 25 Median50 75 90
Food preparation and serving related occupations–Continued
First-line supervisors/managers, food preparation andserving workers .......................................................... $11.00 $11.00 $18.75 $23.25 $26.71
First-line supervisors/managers of food preparationand serving workers ............................................... 11.00 11.00 18.75 23.25 26.71
Cooks ............................................................................... 8.00 9.00 10.47 12.00 12.98Food service, tipped ......................................................... 2.13 2.15 2.39 3.50 7.25
Waiters and waitresses ................................................ 2.13 2.13 2.39 3.50 3.50Dining room and cafeteria attendants and bartender
helpers .................................................................... 6.50 7.25 8.75 9.81 10.83Fast food and counter workers ......................................... 7.20 7.25 7.87 9.35 11.26
Combined food preparation and serving workers,including fast food ................................................... 7.20 7.25 7.87 9.40 11.26
Hosts and hostesses, restaurant, lounge, and coffeeshop ............................................................................ 7.60 7.60 8.50 9.50 9.50
Building and grounds cleaning and maintenanceoccupations .................................................................. 7.25 8.00 10.13 12.00 14.46
Building cleaning workers ................................................. 7.25 7.25 8.50 10.78 11.10Janitors and cleaners, except maids and
housekeeping cleaners ........................................... 7.25 7.25 10.13 11.00 11.34
Personal care and service occupations ........................... 7.25 7.62 13.00 13.00 14.09
Sales and related occupations .......................................... 8.10 9.83 13.00 21.50 37.21First-line supervisors/managers, sales workers ............... 13.00 17.06 32.50 40.77 65.49
First-line supervisors/managers of retail sales workers 13.00 14.42 21.50 32.50 32.50Retail sales workers ......................................................... 7.75 9.00 10.25 13.62 17.43
Cashiers, all workers .................................................... 7.50 8.00 9.70 11.26 13.62Cashiers ................................................................... 7.50 8.00 9.70 11.26 13.62
Retail salespersons ...................................................... 8.50 9.71 11.19 15.39 17.95
Office and administrative support occupations .............. 10.74 12.29 15.66 19.23 23.24Financial clerks ................................................................. 10.70 12.32 16.00 18.57 20.78
Bookkeeping, accounting, and auditing clerks ............. 13.85 14.71 16.96 19.42 22.00Customer service representatives .................................... 11.00 11.75 15.61 18.05 23.26Receptionists and information clerks ................................ 9.50 11.00 11.46 14.42 16.00Stock clerks and order fillers ............................................ 8.50 8.99 10.63 13.20 18.00Secretaries and administrative assistants ........................ 13.44 15.66 18.18 22.50 26.27
Executive secretaries and administrative assistants .... 14.27 16.10 18.06 22.50 24.23Legal secretaries .......................................................... 12.97 12.97 24.04 28.13 30.29Secretaries, except legal, medical, and executive ........ 15.66 15.66 17.18 20.85 22.69
Office clerks, general ........................................................ 11.00 11.49 13.65 17.38 21.00
Construction and extraction occupations ....................... 10.00 11.88 16.50 22.00 26.25
Installation, maintenance, and repair occupations ......... 13.24 15.00 19.50 23.70 29.81Automotive technicians and repairers .............................. 13.05 13.55 21.97 41.00 41.85Industrial machinery installation, repair, and maintenance
workers ....................................................................... 12.50 14.33 15.00 19.74 27.62
Production occupations .................................................... 7.25 8.50 10.50 15.00 19.59Electrical, electronics, and electromechanical
assemblers ................................................................. 8.00 8.40 9.70 10.45 12.45Butchers and other meat, poultry, and fish processing
workers ....................................................................... 7.25 8.25 8.75 13.60 16.44
Transportation and material moving occupations .......... 7.25 9.00 11.00 12.38 14.12
See footnotes at end of table.
17

Table 6. Civilian workers: Hourly wage percentiles1, Austin-Round Rock-San Marcos, TX, May 2010 —Continued
Occupation2 10 25 Median50 75 90
Transportation and material moving occupations–Continued
Laborers and material movers, hand ................................ $7.25 $7.50 $9.25 $11.07 $13.04Laborers and freight, stock, and material movers,
hand ........................................................................ 7.50 9.00 10.00 12.00 18.77
1 Percentiles designate position in the earnings distribution and arecalculated from individual-worker earnings and the hours they arescheduled to work. At the 50th percentile, the median, half of the hoursare paid the same as or more than the rate shown, and half are paid thesame as or less than the rate shown. At the 25th percentile, one-fourthof the hours are paid the same as or less than the rate shown. At the75th percentile, one-fourth are paid the same as or more than the rateshown. The 10th and 90th percentiles follow the same logic. Hourlywages are the straight-time wages or salaries paid to employees. Theyinclude incentive pay, cost-of-living adjustments, and hazard pay.Excluded are premium pay for overtime, vacations, and holidays;
nonproduction bonuses; and tips.2 Workers are classified by occupation using the 2000 Standard
Occupational Classification (SOC) system. See appendix B for moreinformation.
SOURCE: Bureau of Labor Statistics, National Compensation Survey.
NOTE: Dashes indicate that no data were reported or that data did notmeet publication criteria. Overall occupational groups may include datafor categories not shown separately
18

Table 7. Private industry workers: Hourly wage percentiles1, Austin-Round Rock-San Marcos, TX, May 2010
Occupation2 10 25 Median50 75 90
All workers .............................................................................. $7.35 $10.10 $15.06 $24.86 $38.56
Management occupations ................................................. 14.44 23.08 33.30 51.92 67.31General and operations managers ................................... 28.73 43.27 43.27 52.93 67.31Marketing and sales managers ........................................ 21.63 37.02 46.97 51.28 60.09Financial managers .......................................................... 21.50 21.50 28.36 52.22 61.24Engineering managers ..................................................... 31.33 46.20 57.62 70.00 76.92
Business and financial operations occupations ............. 18.75 21.65 27.68 33.37 39.28Human resources, training, and labor relations
specialists ................................................................... 15.17 25.48 26.30 31.27 32.38Accountants and auditors ................................................. 21.65 25.50 30.99 34.62 36.01
Computer and mathematical science occupations ......... 24.86 31.54 40.56 49.04 54.17Computer software engineers .......................................... 33.26 39.45 45.67 51.03 56.47
Computer software engineers, systems software ......... 32.69 34.62 40.56 54.17 66.01
Architecture and engineering occupations ..................... 18.71 20.81 25.51 39.93 53.23Engineers ......................................................................... 25.51 35.96 44.04 53.48 64.15
Computer hardware engineers ..................................... 35.09 37.86 45.24 52.88 67.68Electrical and electronics engineers ............................. 25.51 25.51 40.62 54.03 64.57
Engineering technicians, except drafters .......................... 16.92 17.84 20.81 23.57 28.61Electrical and electronic engineering technicians ......... 16.92 17.83 20.81 24.32 28.61
Legal occupations .............................................................. 22.78 28.37 30.25 54.52 90.87
Arts, design, entertainment, sports, and mediaoccupations .................................................................. 10.34 14.00 17.25 26.45 39.90
Designers ......................................................................... 10.82 12.00 14.00 16.83 22.80Writers and editors ........................................................... 15.01 16.61 21.52 29.09 39.90
Editors .......................................................................... 15.01 15.01 21.52 22.25 29.09
Healthcare practitioner and technical occupations ........ 15.00 19.00 27.84 33.66 39.46Registered nurses ............................................................ 25.00 26.87 32.17 32.89 33.66Health diagnosing and treating practitioner support
technicians .................................................................. 12.00 13.93 16.00 18.00 19.00
Healthcare support occupations ....................................... 6.51 7.25 7.25 11.91 18.00Nursing, psychiatric, and home health aides .................... 6.51 6.51 7.25 7.49 11.11
Home health aides ........................................................ 6.51 6.51 7.25 7.25 7.49Nursing aides, orderlies, and attendants ...................... 10.50 11.18 11.91 13.26 13.26
Miscellaneous healthcare support occupations ................ 12.22 15.38 17.66 20.50 21.50
Food preparation and serving related occupations ........ 2.28 7.20 8.00 10.47 12.24First-line supervisors/managers, food preparation and
serving workers .......................................................... 11.00 11.00 18.75 23.25 26.71First-line supervisors/managers of food preparation
and serving workers ............................................... 11.00 11.00 18.75 23.25 26.71Cooks ............................................................................... 8.00 8.65 10.47 11.50 12.00Food service, tipped ......................................................... 2.13 2.15 2.39 3.50 7.25
Waiters and waitresses ................................................ 2.13 2.13 2.39 3.50 3.50Dining room and cafeteria attendants and bartender
helpers .................................................................... 6.50 7.25 8.75 9.81 10.83Fast food and counter workers ......................................... 7.20 7.25 7.87 9.35 11.26
Combined food preparation and serving workers,including fast food ................................................... 7.20 7.25 7.87 9.40 11.26
Hosts and hostesses, restaurant, lounge, and coffeeshop ............................................................................ 7.60 7.60 8.50 9.50 9.50
Building and grounds cleaning and maintenanceoccupations .................................................................. 7.25 7.25 8.50 11.00 12.73
Building cleaning workers ................................................. 7.25 7.25 8.00 9.00 11.00Janitors and cleaners, except maids and
housekeeping cleaners ........................................... 7.25 7.25 8.50 11.00 11.00
Personal care and service occupations ........................... 7.25 7.62 12.01 13.00 13.00
Sales and related occupations .......................................... 8.10 9.83 13.00 21.50 37.21First-line supervisors/managers, sales workers ............... 13.00 17.06 32.50 40.77 65.49
First-line supervisors/managers of retail sales workers 13.00 14.42 21.50 32.50 32.50
See footnotes at end of table.
19
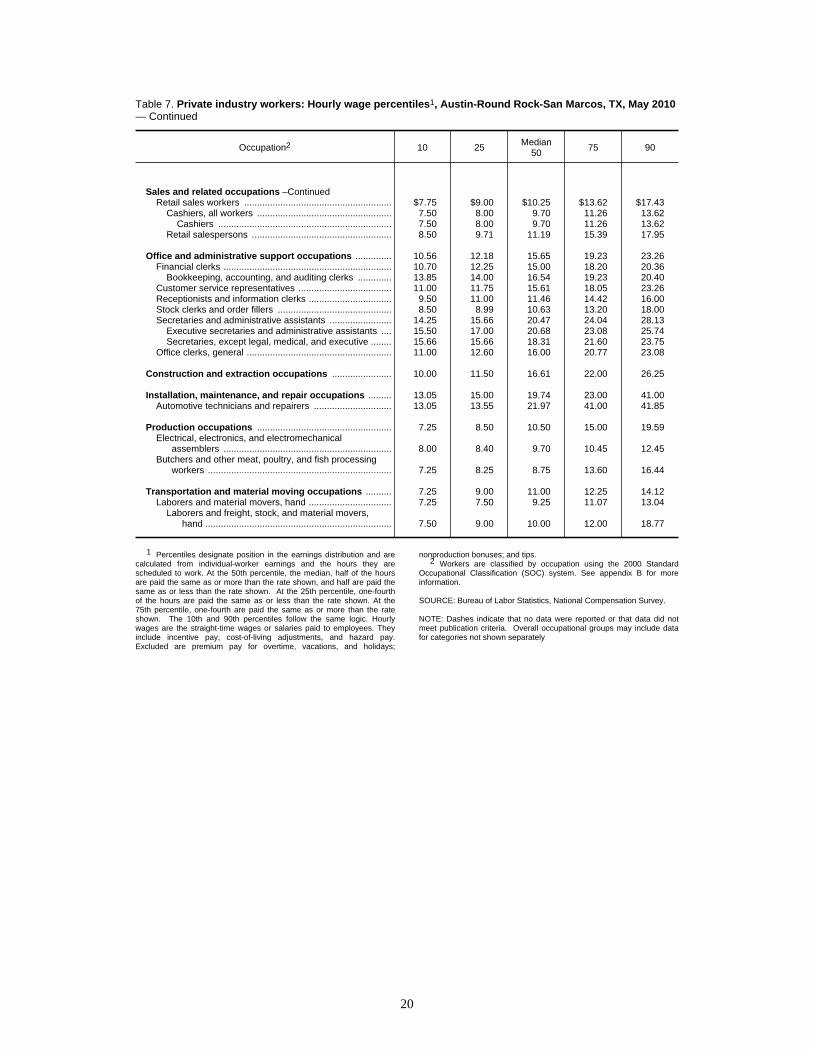
Table 7. Private industry workers: Hourly wage percentiles1, Austin-Round Rock-San Marcos, TX, May 2010— Continued
Occupation2 10 25 Median50 75 90
Sales and related occupations –ContinuedRetail sales workers ......................................................... $7.75 $9.00 $10.25 $13.62 $17.43
Cashiers, all workers .................................................... 7.50 8.00 9.70 11.26 13.62Cashiers ................................................................... 7.50 8.00 9.70 11.26 13.62
Retail salespersons ...................................................... 8.50 9.71 11.19 15.39 17.95
Office and administrative support occupations .............. 10.56 12.18 15.65 19.23 23.26Financial clerks ................................................................. 10.70 12.25 15.00 18.20 20.36
Bookkeeping, accounting, and auditing clerks ............. 13.85 14.00 16.54 19.23 20.40Customer service representatives .................................... 11.00 11.75 15.61 18.05 23.26Receptionists and information clerks ................................ 9.50 11.00 11.46 14.42 16.00Stock clerks and order fillers ............................................ 8.50 8.99 10.63 13.20 18.00Secretaries and administrative assistants ........................ 14.25 15.66 20.47 24.04 28.13
Executive secretaries and administrative assistants .... 15.50 17.00 20.68 23.08 25.74Secretaries, except legal, medical, and executive ........ 15.66 15.66 18.31 21.60 23.75
Office clerks, general ........................................................ 11.00 12.60 16.00 20.77 23.08
Construction and extraction occupations ....................... 10.00 11.50 16.61 22.00 26.25
Installation, maintenance, and repair occupations ......... 13.05 15.00 19.74 23.00 41.00Automotive technicians and repairers .............................. 13.05 13.55 21.97 41.00 41.85
Production occupations .................................................... 7.25 8.50 10.50 15.00 19.59Electrical, electronics, and electromechanical
assemblers ................................................................. 8.00 8.40 9.70 10.45 12.45Butchers and other meat, poultry, and fish processing
workers ....................................................................... 7.25 8.25 8.75 13.60 16.44
Transportation and material moving occupations .......... 7.25 9.00 11.00 12.25 14.12Laborers and material movers, hand ................................ 7.25 7.50 9.25 11.07 13.04
Laborers and freight, stock, and material movers,hand ........................................................................ 7.50 9.00 10.00 12.00 18.77
1 Percentiles designate position in the earnings distribution and arecalculated from individual-worker earnings and the hours they arescheduled to work. At the 50th percentile, the median, half of the hoursare paid the same as or more than the rate shown, and half are paid thesame as or less than the rate shown. At the 25th percentile, one-fourthof the hours are paid the same as or less than the rate shown. At the75th percentile, one-fourth are paid the same as or more than the rateshown. The 10th and 90th percentiles follow the same logic. Hourlywages are the straight-time wages or salaries paid to employees. Theyinclude incentive pay, cost-of-living adjustments, and hazard pay.Excluded are premium pay for overtime, vacations, and holidays;
nonproduction bonuses; and tips.2 Workers are classified by occupation using the 2000 Standard
Occupational Classification (SOC) system. See appendix B for moreinformation.
SOURCE: Bureau of Labor Statistics, National Compensation Survey.
NOTE: Dashes indicate that no data were reported or that data did notmeet publication criteria. Overall occupational groups may include datafor categories not shown separately
20
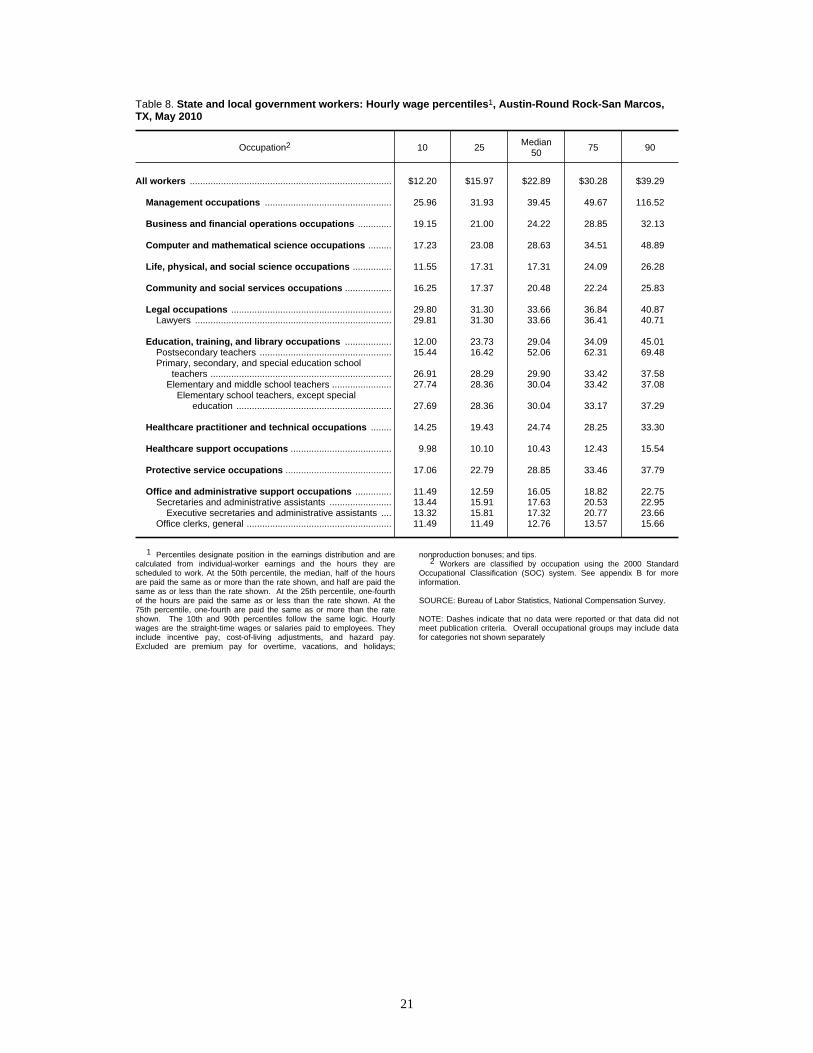
Table 8. State and local government workers: Hourly wage percentiles1, Austin-Round Rock-San Marcos,TX, May 2010
Occupation2 10 25 Median50 75 90
All workers .............................................................................. $12.20 $15.97 $22.89 $30.28 $39.29
Management occupations ................................................. 25.96 31.93 39.45 49.67 116.52
Business and financial operations occupations ............. 19.15 21.00 24.22 28.85 32.13
Computer and mathematical science occupations ......... 17.23 23.08 28.63 34.51 48.89
Life, physical, and social science occupations ............... 11.55 17.31 17.31 24.09 26.28
Community and social services occupations .................. 16.25 17.37 20.48 22.24 25.83
Legal occupations .............................................................. 29.80 31.30 33.66 36.84 40.87Lawyers ............................................................................ 29.81 31.30 33.66 36.41 40.71
Education, training, and library occupations .................. 12.00 23.73 29.04 34.09 45.01Postsecondary teachers ................................................... 15.44 16.42 52.06 62.31 69.48Primary, secondary, and special education school
teachers ...................................................................... 26.91 28.29 29.90 33.42 37.58Elementary and middle school teachers ....................... 27.74 28.36 30.04 33.42 37.08
Elementary school teachers, except specialeducation ............................................................ 27.69 28.36 30.04 33.17 37.29
Healthcare practitioner and technical occupations ........ 14.25 19.43 24.74 28.25 33.30
Healthcare support occupations ....................................... 9.98 10.10 10.43 12.43 15.54
Protective service occupations ......................................... 17.06 22.79 28.85 33.46 37.79
Office and administrative support occupations .............. 11.49 12.59 16.05 18.82 22.75Secretaries and administrative assistants ........................ 13.44 15.91 17.63 20.53 22.95
Executive secretaries and administrative assistants .... 13.32 15.81 17.32 20.77 23.66Office clerks, general ........................................................ 11.49 11.49 12.76 13.57 15.66
1 Percentiles designate position in the earnings distribution and arecalculated from individual-worker earnings and the hours they arescheduled to work. At the 50th percentile, the median, half of the hoursare paid the same as or more than the rate shown, and half are paid thesame as or less than the rate shown. At the 25th percentile, one-fourthof the hours are paid the same as or less than the rate shown. At the75th percentile, one-fourth are paid the same as or more than the rateshown. The 10th and 90th percentiles follow the same logic. Hourlywages are the straight-time wages or salaries paid to employees. Theyinclude incentive pay, cost-of-living adjustments, and hazard pay.Excluded are premium pay for overtime, vacations, and holidays;
nonproduction bonuses; and tips.2 Workers are classified by occupation using the 2000 Standard
Occupational Classification (SOC) system. See appendix B for moreinformation.
SOURCE: Bureau of Labor Statistics, National Compensation Survey.
NOTE: Dashes indicate that no data were reported or that data did notmeet publication criteria. Overall occupational groups may include datafor categories not shown separately
21

Table 9. Full-time1 civilian workers: Hourly wage percentiles2, Austin-Round Rock-San Marcos, TX, May2010
Occupation3
Full-time workers
10 25 Median50 75 90
All workers .............................................................................. $9.36 $12.20 $18.29 $28.54 $40.77
Management occupations ................................................. 17.78 25.00 36.56 51.92 71.54General and operations managers ................................... 28.73 30.84 43.27 52.93 67.31Marketing and sales managers ........................................ 21.63 37.02 46.97 51.28 60.09Financial managers .......................................................... 21.50 21.50 28.85 40.30 61.24Engineering managers ..................................................... 31.33 46.20 57.62 70.00 76.92
Business and financial operations occupations ............. 18.78 21.56 25.83 30.59 35.40Human resources, training, and labor relations
specialists ................................................................... 18.81 21.46 25.83 29.23 30.15Management analysts ...................................................... 21.25 24.31 28.42 30.73 39.28Accountants and auditors ................................................. 21.65 23.38 29.33 33.56 35.50
Computer and mathematical science occupations ......... 21.58 27.75 35.51 45.23 51.93Computer software engineers .......................................... 33.65 40.01 48.89 51.03 54.78
Computer software engineers, applications ................. 38.94 42.00 48.89 49.77 51.44Computer software engineers, systems software ......... 32.69 34.62 40.56 54.17 66.01
Computer support specialists ........................................... 15.00 16.31 18.44 27.82 44.71Computer systems analysts ............................................. 24.19 29.02 33.95 46.60 53.25Network and computer systems administrators ................ 24.86 24.86 29.05 43.32 43.32
Architecture and engineering occupations ..................... 18.71 20.81 25.51 41.08 51.35Engineers ......................................................................... 28.22 36.71 42.06 51.00 61.30
Computer hardware engineers ..................................... 35.09 37.86 45.24 52.88 67.68Electrical and electronics engineers ............................. 25.51 25.51 41.08 45.15 54.03
Electronics engineers, except computer ................... 40.62 41.08 42.06 43.27 49.04Engineering technicians, except drafters .......................... 16.92 17.84 20.81 23.12 28.61
Electrical and electronic engineering technicians ......... 16.92 17.83 20.81 24.32 28.61
Life, physical, and social science occupations ............... 21.81 24.36 25.06 26.66 36.84
Community and social services occupations .................. 7.25 10.35 17.37 21.71 24.45Miscellaneous community and social service specialists 7.25 9.56 10.35 21.40 22.22
Legal occupations .............................................................. 22.78 28.61 31.75 41.19 76.73Lawyers ............................................................................ 30.25 30.25 38.77 59.13 101.16Paralegals and legal assistants ........................................ 15.85 19.90 25.96 28.61 34.21
Education, training, and library occupations .................. 12.00 24.27 29.31 34.60 45.17Postsecondary teachers ................................................... 42.22 51.81 62.31 62.31 69.48Primary, secondary, and special education school
teachers ...................................................................... 26.55 28.23 29.90 33.51 37.36Elementary and middle school teachers ....................... 27.75 28.49 30.18 33.51 36.86
Elementary school teachers, except specialeducation ............................................................ 27.72 28.36 30.13 33.11 37.26
Middle school teachers, except special andvocational education ........................................... 28.09 28.49 30.30 33.91 36.06
Secondary school teachers .......................................... 27.47 28.74 31.02 35.82 39.27
Arts, design, entertainment, sports, and mediaoccupations .................................................................. 14.00 15.01 21.52 29.73 39.90
Designers ......................................................................... 12.00 14.00 14.00 16.83 25.00Writers and editors ........................................................... 15.01 16.61 21.52 29.09 39.90
Editors .......................................................................... 15.01 15.01 21.52 22.25 29.09
Healthcare practitioner and technical occupations ........ 14.25 19.00 26.31 32.17 39.00Registered nurses ............................................................ 23.31 25.29 26.87 32.17 32.17Health diagnosing and treating practitioner support
technicians .................................................................. 12.00 14.00 16.00 18.00 19.00
Healthcare support occupations ....................................... 7.25 7.25 10.43 14.14 20.50Nursing, psychiatric, and home health aides .................... 7.25 7.25 8.28 10.92 12.43
Nursing aides, orderlies, and attendants ...................... 10.43 11.18 12.33 13.08 14.48Miscellaneous healthcare support occupations ................ 12.00 15.61 17.66 20.50 21.50
Protective service occupations ......................................... 10.75 11.25 21.23 30.28 35.59
See footnotes at end of table.
22

Table 9. Full-time1 civilian workers: Hourly wage percentiles2, Austin-Round Rock-San Marcos, TX, May2010 — Continued
Occupation3
Full-time workers
10 25 Median50 75 90
Food preparation and serving related occupations ........ $2.39 $7.87 $9.50 $11.61 $14.40Cooks ............................................................................... 9.00 10.47 10.47 12.00 13.00Food service, tipped ......................................................... 2.13 2.13 2.39 2.39 2.45Fast food and counter workers ......................................... 7.87 7.87 7.87 10.54 14.40
Building and grounds cleaning and maintenanceoccupations .................................................................. 7.25 9.00 10.66 13.15 14.59
Building cleaning workers ................................................. 7.25 7.30 10.13 10.78 12.00
Personal care and service occupations ........................... 7.62 9.38 13.00 13.00 14.44
Sales and related occupations .......................................... 9.42 11.31 17.06 28.89 40.77First-line supervisors/managers, sales workers ............... 13.00 17.06 32.50 40.77 65.49
First-line supervisors/managers of retail sales workers 13.00 14.42 21.50 32.50 32.50Retail sales workers ......................................................... 7.85 9.60 12.10 15.70 17.95
Cashiers, all workers .................................................... 7.75 7.90 9.93 12.21 14.78Cashiers ................................................................... 7.75 7.90 9.93 12.21 14.78
Retail salespersons ...................................................... 9.71 11.40 15.08 17.95 17.95
Office and administrative support occupations .............. 11.20 12.69 15.70 19.23 23.08Financial clerks ................................................................. 10.70 12.32 16.07 18.64 20.78
Bookkeeping, accounting, and auditing clerks ............. 13.85 14.71 16.96 19.42 22.00Customer service representatives .................................... 11.00 11.75 15.06 17.54 18.53Receptionists and information clerks ................................ 10.75 11.20 12.00 14.50 16.00Stock clerks and order fillers ............................................ 9.25 9.25 13.20 15.65 18.00Secretaries and administrative assistants ........................ 13.44 15.66 18.12 22.50 26.27
Executive secretaries and administrative assistants .... 14.25 16.10 18.06 22.50 24.12Legal secretaries .......................................................... 12.97 12.97 24.04 28.13 30.29Secretaries, except legal, medical, and executive ........ 15.66 15.66 17.18 20.85 22.69
Office clerks, general ........................................................ 11.04 12.08 13.69 17.38 21.00
Construction and extraction occupations ....................... 10.00 11.88 16.50 22.00 26.25
Installation, maintenance, and repair occupations ......... 13.24 15.00 19.50 23.70 29.81Automotive technicians and repairers .............................. 13.05 13.55 21.97 41.00 41.85Industrial machinery installation, repair, and maintenance
workers ....................................................................... 12.50 14.33 15.00 19.74 27.62
Production occupations .................................................... 7.25 8.50 10.50 15.00 19.59Electrical, electronics, and electromechanical
assemblers ................................................................. 8.00 8.40 9.70 10.45 12.45Butchers and other meat, poultry, and fish processing
workers ....................................................................... 7.25 8.25 8.75 13.60 16.44
Transportation and material moving occupations .......... 7.25 9.25 11.00 12.51 14.12Laborers and material movers, hand ................................ 7.25 8.00 9.50 11.00 12.51
Laborers and freight, stock, and material movers,hand ........................................................................ 9.00 9.25 10.00 11.07 18.77
1 Employees are classified as working either a full-time or a part-timeschedule based on the definition used by each establishment. Therefore,a worker with a 35-hour-per-week schedule might be considered afull-time employee in one establishment, but classified as part-time inanother firm, where a 40-hour week is the minimum full-time schedule.
2 Percentiles designate position in the earnings distribution and arecalculated from individual-worker earnings and the hours they arescheduled to work. At the 50th percentile, the median, half of the hoursare paid the same as or more than the rate shown, and half are paid thesame as or less than the rate shown. At the 25th percentile, one-fourthof the hours are paid the same as or less than the rate shown. At the75th percentile, one-fourth are paid the same as or more than the rateshown. The 10th and 90th percentiles follow the same logic. Hourly
wages are the straight-time wages or salaries paid to employees. Theyinclude incentive pay, cost-of-living adjustments, and hazard pay.Excluded are premium pay for overtime, vacations, and holidays;nonproduction bonuses; and tips.
3 Workers are classified by occupation using the 2000 StandardOccupational Classification (SOC) system. See appendix B for moreinformation.
SOURCE: Bureau of Labor Statistics, National Compensation Survey.
NOTE: Dashes indicate that no data were reported or that data did notmeet publication criteria. Overall occupational groups may include datafor categories not shown separately
23

Table 10. Part-time1 civilian workers: Hourly wage percentiles2, Austin-Round Rock-San Marcos, TX, May2010
Occupation3
Part-time workers
10 25 Median50 75 90
All workers .............................................................................. $6.15 $7.25 $8.50 $11.00 $16.42
Education, training, and library occupations .................. 10.06 10.79 15.44 16.42 26.02
Healthcare practitioner and technical occupations ........ 22.86 24.84 28.88 33.66 39.46Registered nurses ............................................................ 25.86 28.73 33.66 33.66 33.66
Food preparation and serving related occupations ........ 2.15 3.50 7.25 8.50 10.25Food service, tipped ......................................................... 2.13 2.15 3.50 3.50 7.85
Waiters and waitresses ................................................ 2.13 2.15 3.50 3.50 3.50Fast food and counter workers ......................................... 7.20 7.25 7.25 8.61 10.10
Combined food preparation and serving workers,including fast food ................................................... 7.20 7.25 7.25 8.61 10.10
Sales and related occupations .......................................... 7.25 8.60 9.80 10.63 12.50Retail sales workers ......................................................... 7.25 8.60 9.77 10.46 12.50
Cashiers, all workers .................................................... 7.50 8.75 9.67 10.60 11.81Cashiers ................................................................... 7.50 8.75 9.67 10.60 11.81
Retail salespersons ...................................................... 7.25 8.50 9.79 10.46 11.20
Office and administrative support occupations .............. 8.50 8.99 10.61 14.73 23.26Stock clerks and order fillers ............................................ 8.50 8.50 8.99 10.43 13.00
Transportation and material moving occupations .......... 7.25 7.50 10.10 11.69 14.29Laborers and material movers, hand ................................ 7.25 7.50 8.90 12.12 14.29
Laborers and freight, stock, and material movers,hand ........................................................................ 7.50 7.50 9.00 12.52 14.29
1 Employees are classified as working either a full-time or a part-timeschedule based on the definition used by each establishment. Therefore,a worker with a 35-hour-per-week schedule might be considered afull-time employee in one establishment, but classified as part-time inanother firm, where a 40-hour week is the minimum full-time schedule.
2 Percentiles designate position in the earnings distribution and arecalculated from individual-worker earnings and the hours they arescheduled to work. At the 50th percentile, the median, half of the hoursare paid the same as or more than the rate shown, and half are paid thesame as or less than the rate shown. At the 25th percentile, one-fourthof the hours are paid the same as or less than the rate shown. At the75th percentile, one-fourth are paid the same as or more than the rateshown. The 10th and 90th percentiles follow the same logic. Hourly
wages are the straight-time wages or salaries paid to employees. Theyinclude incentive pay, cost-of-living adjustments, and hazard pay.Excluded are premium pay for overtime, vacations, and holidays;nonproduction bonuses; and tips.
3 Workers are classified by occupation using the 2000 StandardOccupational Classification (SOC) system. See appendix B for moreinformation.
SOURCE: Bureau of Labor Statistics, National Compensation Survey.
NOTE: Dashes indicate that no data were reported or that data did notmeet publication criteria. Overall occupational groups may include datafor categories not shown separately
24

Table 11. Full-time1 civilian workers: Mean and median hourly, weekly, and annual earnings and mean weekly andannual hours, Austin-Round Rock-San Marcos, TX, May 2010
Occupation2
Hourly earnings3 Weekly earnings4 Annual earnings5
Mean Median Mean MedianMean
weeklyhours
Mean MedianMeanannualhours
All workers ................................................ $22.54 $18.29 $903 $722 40.0 $46,122 $37,846 2,046
Management occupations ................... 41.52 36.56 1,684 1,473 40.6 87,400 76,997 2,105General and operations managers ..... 45.37 43.27 1,762 1,731 38.8 91,632 90,000 2,020Marketing and sales managers .......... 46.30 46.97 1,841 1,879 39.8 95,728 97,691 2,068Financial managers ............................ 34.80 28.85 1,385 1,161 39.8 72,010 60,353 2,070Engineering managers ....................... 56.28 57.62 2,286 2,305 40.6 118,861 119,848 2,112
Business and financial operationsoccupations .................................... 26.66 25.83 1,076 1,020 40.4 55,860 53,040 2,096
Human resources, training, and laborrelations specialists ...................... 24.85 25.83 985 1,000 39.6 51,228 52,006 2,061
Management analysts ........................ 28.46 28.42 1,138 1,137 40.0 59,186 59,103 2,080Accountants and auditors ................... 28.77 29.33 1,195 1,154 41.5 62,140 60,008 2,160
Computer and mathematical scienceoccupations .................................... 37.01 35.51 1,491 1,420 40.3 77,513 73,861 2,095
Computer software engineers ............ 45.96 48.89 1,849 1,956 40.2 96,149 101,693 2,092Computer software engineers,
applications ............................... 46.69 48.89 1,888 1,956 40.4 98,151 101,693 2,102Computer software engineers,
systems software ...................... 45.04 40.56 1,801 1,623 40.0 93,673 84,371 2,080Computer support specialists ............. 23.34 18.44 934 738 40.0 48,546 38,355 2,080Computer systems analysts ............... 37.50 33.95 1,528 1,577 40.7 79,433 81,999 2,118Network and computer systems
administrators ............................... 32.39 29.05 1,296 1,162 40.0 67,372 60,424 2,080
Architecture and engineeringoccupations .................................... 31.58 25.51 1,310 1,144 41.5 68,095 59,509 2,157
Engineers ........................................... 44.20 42.06 1,821 1,728 41.2 94,673 89,835 2,142Computer hardware engineers ....... 47.69 45.24 1,979 1,852 41.5 102,909 96,304 2,158Electrical and electronics engineers 40.56 41.08 1,698 1,673 41.9 88,271 87,000 2,177
Electronics engineers, exceptcomputer ............................... 42.85 42.06 1,714 1,682 40.0 89,138 87,487 2,080
Engineering technicians, exceptdrafters ......................................... 21.50 20.81 860 832 40.0 44,720 43,285 2,080
Electrical and electronicengineering technicians ............ 21.57 20.81 863 832 40.0 44,857 43,285 2,080
Life, physical, and social scienceoccupations .................................... 27.16 25.06 1,062 974 39.1 55,217 50,673 2,033
Community and social servicesoccupations .................................... 17.45 17.37 690 695 39.5 35,200 36,358 2,017
Miscellaneous community and socialservice specialists ......................... 14.51 10.35 570 398 39.3 29,649 20,696 2,044
Legal occupations ................................ 41.10 31.75 1,831 1,543 44.6 95,219 80,242 2,317Lawyers .............................................. 49.32 38.77 2,333 1,938 47.3 121,311 100,799 2,460Paralegals and legal assistants .......... 24.80 25.96 992 1,038 40.0 51,574 54,001 2,080
Education, training, and libraryoccupations .................................... 30.40 29.31 1,210 1,156 39.8 48,731 44,460 1,603
Postsecondary teachers ..................... 58.27 62.31 2,315 2,492 39.7 90,585 97,199 1,554Primary, secondary, and special
education school teachers ............ 30.03 29.90 1,193 1,178 39.7 45,511 44,341 1,515Elementary and middle school
teachers .................................... 31.26 30.18 1,241 1,191 39.7 46,479 44,730 1,487Elementary school teachers,
except special education ...... 31.21 30.13 1,239 1,191 39.7 46,311 44,570 1,484Middle school teachers, except
special and vocationaleducation .............................. 31.34 30.30 1,246 1,191 39.7 46,768 44,840 1,492
Secondary school teachers ............ 32.02 31.02 1,273 1,227 39.7 47,579 45,873 1,486
See footnotes at end of table.
25

Table 11. Full-time1 civilian workers: Mean and median hourly, weekly, and annual earnings and mean weekly andannual hours, Austin-Round Rock-San Marcos, TX, May 2010 — Continued
Occupation2
Hourly earnings3 Weekly earnings4 Annual earnings5
Mean Median Mean MedianMean
weeklyhours
Mean MedianMeanannualhours
Arts, design, entertainment, sports,and media occupations .................. $23.38 $21.52 $938 $855 40.1 $48,798 $44,456 2,087
Designers ........................................... 16.09 14.00 641 560 39.8 33,345 29,120 2,072Writers and editors ............................. 24.57 21.52 968 861 39.4 50,348 44,757 2,049
Editors ............................................ 20.19 21.52 797 840 39.5 41,465 43,661 2,053
Healthcare practitioner and technicaloccupations .................................... 30.17 26.31 1,164 1,010 38.6 59,870 50,301 1,985
Registered nurses .............................. 28.04 26.87 1,074 1,024 38.3 55,858 53,225 1,992Health diagnosing and treating
practitioner support technicians .... 15.88 16.00 615 600 38.7 31,955 31,200 2,012
Healthcare support occupations ......... 11.84 10.43 462 417 39.0 23,849 21,696 2,015Nursing, psychiatric, and home health
aides ............................................. 9.30 8.28 372 331 40.0 19,347 17,222 2,080Nursing aides, orderlies, and
attendants ................................. 12.29 12.33 491 493 40.0 25,557 25,646 2,080Miscellaneous healthcare support
occupations .................................. 17.47 17.66 642 622 36.7 33,369 32,335 1,910
Protective service occupations ........... 21.92 21.23 877 849 40.0 45,601 44,160 2,080
Food preparation and serving relatedoccupations .................................... 9.67 9.50 371 371 38.4 19,147 19,284 1,979
Cooks ................................................. 11.02 10.47 430 419 39.0 22,017 21,778 1,997Food service, tipped ........................... 3.00 2.39 104 78 34.8 5,330 4,037 1,778Fast food and counter workers ........... 9.34 7.87 374 315 40.0 19,426 16,365 2,080
Building and grounds cleaning andmaintenance occupations ............. 11.12 10.66 445 426 40.0 23,125 22,173 2,080
Building cleaning workers ................... 9.54 10.13 382 405 40.0 19,848 21,070 2,080
Personal care and serviceoccupations .................................... 11.83 13.00 473 520 40.0 23,868 27,040 2,018
Sales and related occupations ............ 22.02 17.06 887 682 40.3 46,107 35,485 2,094First-line supervisors/managers, sales
workers ......................................... 34.28 32.50 1,371 1,300 40.0 71,307 67,600 2,080First-line supervisors/managers of
retail sales workers ................... 23.24 21.50 929 860 40.0 48,332 44,720 2,080Retail sales workers ........................... 12.61 12.10 501 480 39.7 26,036 24,960 2,065
Cashiers, all workers ...................... 10.46 9.93 413 392 39.5 21,456 20,405 2,052Cashiers ..................................... 10.46 9.93 413 392 39.5 21,456 20,405 2,052
Retail salespersons ........................ 14.33 15.08 573 603 40.0 29,816 31,366 2,080
Office and administrative supportoccupations .................................... 16.43 15.70 649 620 39.5 33,619 31,932 2,046
Financial clerks ................................... 15.95 16.07 632 640 39.6 32,869 33,280 2,061Bookkeeping, accounting, and
auditing clerks ........................... 17.41 16.96 693 678 39.8 36,059 35,275 2,071Customer service representatives ...... 15.16 15.06 593 582 39.1 30,845 30,239 2,034Receptionists and information clerks .. 12.83 12.00 499 458 38.9 25,932 23,831 2,021Stock clerks and order fillers .............. 13.28 13.20 531 528 40.0 27,613 27,456 2,080Secretaries and administrative
assistants ...................................... 19.27 18.12 760 722 39.4 38,904 37,005 2,018Executive secretaries and
administrative assistants .......... 19.12 18.06 765 722 40.0 39,553 37,554 2,069Legal secretaries ............................ 21.62 24.04 865 962 40.0 44,967 49,999 2,080Secretaries, except legal, medical,
and executive ........................... 18.20 17.18 692 665 38.0 34,477 31,994 1,894Office clerks, general .......................... 15.07 13.69 602 546 40.0 31,121 28,371 2,065
Construction and extractionoccupations .................................... 17.08 16.50 685 660 40.1 35,632 34,320 2,087
See footnotes at end of table.
26

Table 11. Full-time1 civilian workers: Mean and median hourly, weekly, and annual earnings and mean weekly andannual hours, Austin-Round Rock-San Marcos, TX, May 2010 — Continued
Occupation2
Hourly earnings3 Weekly earnings4 Annual earnings5
Mean Median Mean MedianMean
weeklyhours
Mean MedianMeanannualhours
Installation, maintenance, and repairoccupations .................................... $21.03 $19.50 $869 $780 41.3 $45,195 $40,560 2,149
Automotive technicians and repairers 23.66 21.97 – – – – – –Industrial machinery installation,
repair, and maintenance workers 17.59 15.00 704 600 40.0 36,583 31,200 2,080
Production occupations ...................... 12.27 10.50 489 420 39.9 25,444 21,840 2,073Electrical, electronics, and
electromechanical assemblers ..... 9.85 9.70 394 388 40.0 20,495 20,176 2,080Butchers and other meat, poultry, and
fish processing workers ................ 10.73 8.75 429 350 40.0 22,326 18,200 2,080
Transportation and material movingoccupations .................................... 11.16 11.00 438 418 39.3 22,227 21,736 1,992
Laborers and material movers, hand .. 10.21 9.50 408 380 40.0 20,596 19,760 2,017Laborers and freight, stock, and
material movers, hand .............. 11.43 10.00 457 400 40.0 22,542 20,800 1,972
1 Employees are classified as working either a full-time or a part-timeschedule based on the definition used by each establishment. Therefore, aworker with a 35-hour-per-week schedule might be considered a full-timeemployee in one establishment, but classified as part-time in another firm,where a 40-hour week is the minimum full-time schedule.
2 Workers are classified by occupation using the 2000 StandardOccupational Classification (SOC) system. See appendix B for moreinformation.
3 Earnings are the straight-time hourly wages or salaries paid toemployees. They include incentive pay, cost-of-living adjustments, andhazard pay. Excluded are premium pay for overtime, vacations, holidays,nonproduction bonuses, and tips. The mean is computed by totaling the payof all workers and dividing by the number of workers, weighted by hours. Seeappendix A for more information.
4 Mean weekly earnings are the straight-time weekly wages or salaries
paid to employees. Median weekly earnings designates position - one-half ofthe hours are paid the same as or more than the rate shown. Mean weeklyhours are the hours an employee is scheduled to work in a week, exclusive ofovertime.
5 Mean annual earnings are the straight-time annual wages or salariespaid to employees. Median annual earnings designates position - one-half ofthe hours are paid the same as or more than the rate shown. Mean annualhours are the hours an employee is scheduled to work in a year, exclusive ofovertime.
SOURCE: Bureau of Labor Statistics, National Compensation Survey.
NOTE: Dashes indicate that no data were reported or that data did not meetpublication criteria. Overall occupational groups may include data forcategories not shown separately
27

Table 12. Full-time1 private industry workers: Mean and median hourly, weekly, and annual earnings and meanweekly and annual hours, Austin-Round Rock-San Marcos, TX, May 2010
Occupation2
Hourly earnings3 Weekly earnings4 Annual earnings5
Mean Median Mean MedianMean
weeklyhours
Mean MedianMeanannualhours
All workers ................................................ $21.55 $17.00 $864 $664 40.1 $44,818 $34,549 2,080
Management occupations ................... 38.12 33.30 1,553 1,348 40.7 80,751 70,100 2,118General and operations managers ..... 48.71 43.27 1,880 1,731 38.6 97,762 90,000 2,007Marketing and sales managers .......... 46.30 46.97 1,841 1,879 39.8 95,728 97,691 2,068Financial managers ............................ 34.56 28.36 1,375 1,134 39.8 71,522 58,989 2,069Engineering managers ....................... 56.28 57.62 2,285 2,305 40.6 118,843 119,848 2,112
Business and financial operationsoccupations .................................... 28.34 27.68 1,155 1,092 40.8 60,086 56,805 2,120
Human resources, training, and laborrelations specialists ...................... 25.83 26.30 1,002 1,033 38.8 52,124 53,735 2,018
Accountants and auditors ................... 30.18 30.99 1,274 1,222 42.2 66,270 63,565 2,196
Computer and mathematical scienceoccupations .................................... 41.05 40.86 1,660 1,656 40.4 86,302 86,100 2,102
Computer software engineers ............ 45.53 45.67 1,833 1,838 40.3 95,341 95,601 2,094Computer software engineers,
systems software ...................... 45.04 40.56 1,801 1,623 40.0 93,673 84,371 2,080
Architecture and engineeringoccupations .................................... 31.56 25.51 1,313 1,137 41.6 68,277 59,132 2,164
Engineers ........................................... 44.50 43.85 1,840 1,786 41.3 95,679 92,872 2,150Computer hardware engineers ....... 47.69 45.24 1,979 1,852 41.5 102,909 96,304 2,158Electrical and electronics engineers 39.99 40.62 1,718 1,673 43.0 89,357 87,000 2,235
Engineering technicians, exceptdrafters ......................................... 21.62 20.81 865 832 40.0 44,970 43,285 2,080
Electrical and electronicengineering technicians ............ 21.57 20.81 863 832 40.0 44,857 43,285 2,080
Legal occupations ................................ 42.12 30.25 1,912 1,664 45.4 99,426 86,521 2,360
Arts, design, entertainment, sports,and media occupations .................. 23.59 21.52 947 861 40.1 49,245 44,757 2,088
Designers ........................................... 16.09 14.00 641 560 39.8 33,345 29,120 2,072Writers and editors ............................. 24.57 21.52 968 861 39.4 50,348 44,757 2,049
Editors ............................................ 20.19 21.52 797 840 39.5 41,465 43,661 2,053
Healthcare practitioner and technicaloccupations .................................... 32.00 26.87 1,224 1,052 38.2 63,631 54,723 1,989
Registered nurses .............................. 29.59 32.17 1,110 1,169 37.5 57,743 60,769 1,952Health diagnosing and treating
practitioner support technicians .... 16.12 16.00 621 640 38.5 32,279 33,280 2,002
Healthcare support occupations ......... 11.64 9.50 451 408 38.8 23,454 21,216 2,016Miscellaneous healthcare support
occupations .................................. 17.47 17.66 642 622 36.7 33,369 32,335 1,910
Food preparation and serving relatedoccupations .................................... 9.52 9.36 365 360 38.3 18,889 18,720 1,984
Cooks ................................................. 10.61 10.47 414 419 39.0 21,526 21,778 2,030Food service, tipped ........................... 3.00 2.39 104 78 34.8 5,330 4,037 1,778Fast food and counter workers ........... 9.34 7.87 374 315 40.0 19,426 16,365 2,080
Building and grounds cleaning andmaintenance occupations ............. 10.11 9.00 404 360 40.0 21,028 18,720 2,080
Sales and related occupations ............ 22.02 17.06 887 682 40.3 46,107 35,485 2,094First-line supervisors/managers, sales
workers ......................................... 34.28 32.50 1,371 1,300 40.0 71,307 67,600 2,080First-line supervisors/managers of
retail sales workers ................... 23.24 21.50 929 860 40.0 48,332 44,720 2,080Retail sales workers ........................... 12.61 12.10 501 480 39.7 26,036 24,960 2,065
Cashiers, all workers ...................... 10.46 9.93 413 392 39.5 21,456 20,405 2,052Cashiers ..................................... 10.46 9.93 413 392 39.5 21,456 20,405 2,052
Retail salespersons ........................ 14.33 15.08 573 603 40.0 29,816 31,366 2,080
See footnotes at end of table.
28

Table 12. Full-time1 private industry workers: Mean and median hourly, weekly, and annual earnings and meanweekly and annual hours, Austin-Round Rock-San Marcos, TX, May 2010 — Continued
Occupation2
Hourly earnings3 Weekly earnings4 Annual earnings5
Mean Median Mean MedianMean
weeklyhours
Mean MedianMeanannualhours
Office and administrative supportoccupations .................................... $16.41 $15.66 $646 $604 39.4 $33,558 $31,387 2,045
Financial clerks ................................... 15.44 16.00 611 567 39.6 31,766 29,474 2,057Bookkeeping, accounting, and
auditing clerks ........................... 16.74 16.54 666 662 39.8 34,612 34,409 2,067Customer service representatives ...... 15.16 15.06 593 582 39.1 30,845 30,239 2,034Receptionists and information clerks .. 12.83 12.00 499 458 38.9 25,932 23,831 2,021Stock clerks and order fillers .............. 13.28 13.20 531 528 40.0 27,613 27,456 2,080Secretaries and administrative
assistants ...................................... 20.16 20.47 786 767 39.0 40,631 38,337 2,016Executive secretaries and
administrative assistants .......... 20.17 20.68 807 827 40.0 41,391 38,036 2,052Secretaries, except legal, medical,
and executive ........................... 18.77 18.31 696 548 37.1 36,212 28,492 1,929Office clerks, general .......................... 16.33 16.28 652 651 39.9 33,916 33,862 2,077
Construction and extractionoccupations .................................... 17.19 16.61 690 664 40.1 35,886 34,549 2,087
Installation, maintenance, and repairoccupations .................................... 21.24 19.74 882 780 41.5 45,845 40,560 2,158
Automotive technicians and repairers 23.66 21.97 – – – – – –
Production occupations ...................... 12.27 10.50 489 420 39.9 25,444 21,840 2,073Electrical, electronics, and
electromechanical assemblers ..... 9.85 9.70 394 388 40.0 20,495 20,176 2,080Butchers and other meat, poultry, and
fish processing workers ................ 10.73 8.75 429 350 40.0 22,326 18,200 2,080
Transportation and material movingoccupations .................................... 11.13 11.00 439 418 39.4 22,439 21,736 2,016
Laborers and material movers, hand .. 10.21 9.50 408 380 40.0 20,596 19,760 2,017Laborers and freight, stock, and
material movers, hand .............. 11.43 10.00 457 400 40.0 22,542 20,800 1,972
1 Employees are classified as working either a full-time or a part-timeschedule based on the definition used by each establishment. Therefore, aworker with a 35-hour-per-week schedule might be considered a full-timeemployee in one establishment, but classified as part-time in another firm,where a 40-hour week is the minimum full-time schedule.
2 Workers are classified by occupation using the 2000 StandardOccupational Classification (SOC) system. See appendix B for moreinformation.
3 Earnings are the straight-time hourly wages or salaries paid toemployees. They include incentive pay, cost-of-living adjustments, andhazard pay. Excluded are premium pay for overtime, vacations, holidays,nonproduction bonuses, and tips. The mean is computed by totaling the payof all workers and dividing by the number of workers, weighted by hours. Seeappendix A for more information.
4 Mean weekly earnings are the straight-time weekly wages or salaries
paid to employees. Median weekly earnings designates position - one-half ofthe hours are paid the same as or more than the rate shown. Mean weeklyhours are the hours an employee is scheduled to work in a week, exclusive ofovertime.
5 Mean annual earnings are the straight-time annual wages or salariespaid to employees. Median annual earnings designates position - one-half ofthe hours are paid the same as or more than the rate shown. Mean annualhours are the hours an employee is scheduled to work in a year, exclusive ofovertime.
SOURCE: Bureau of Labor Statistics, National Compensation Survey.
NOTE: Dashes indicate that no data were reported or that data did not meetpublication criteria. Overall occupational groups may include data forcategories not shown separately
29

Table 13. Full-time1 State and local government workers: Mean and median hourly, weekly, and annual earningsand mean weekly and annual hours, Austin-Round Rock-San Marcos, TX, May 2010
Occupation2
Hourly earnings3 Weekly earnings4 Annual earnings5
Mean Median Mean MedianMean
weeklyhours
Mean MedianMeanannualhours
All workers ................................................ $25.87 $23.40 $1,032 $936 39.9 $50,196 $44,653 1,940
Management occupations ................... 52.23 39.45 2,089 1,578 40.0 107,846 82,272 2,065
Business and financial operationsoccupations .................................... 25.06 24.22 1,002 969 40.0 51,953 50,400 2,073
Computer and mathematical scienceoccupations .................................... 29.27 28.63 1,171 1,145 40.0 60,878 59,550 2,080
Community and social servicesoccupations .................................... 21.11 20.48 841 820 39.9 42,885 43,031 2,032
Legal occupations ................................ 34.76 33.66 1,390 1,346 40.0 72,294 70,002 2,080Lawyers .............................................. 34.55 33.66 1,382 1,346 40.0 71,865 70,002 2,080
Education, training, and libraryoccupations .................................... 32.49 29.90 1,292 1,178 39.8 50,759 45,264 1,562
Postsecondary teachers ..................... 58.27 62.31 2,315 2,492 39.7 90,585 97,199 1,554Primary, secondary, and special
education school teachers ............ 31.28 30.13 1,242 1,189 39.7 46,513 44,550 1,487Elementary and middle school
teachers .................................... 31.17 30.04 1,238 1,189 39.7 46,398 44,550 1,488Elementary school teachers,
except special education ...... 31.18 30.04 1,237 1,189 39.7 46,295 44,460 1,485
Healthcare practitioner and technicaloccupations .................................... 24.08 24.74 959 989 39.8 47,464 48,487 1,971
Healthcare support occupations ......... 12.48 10.43 497 417 39.8 25,095 21,696 2,011
Protective service occupations ........... 28.31 28.85 1,132 1,154 40.0 58,887 60,008 2,080
Office and administrative supportoccupations .................................... 16.50 16.16 660 646 40.0 33,817 33,030 2,050
Secretaries and administrativeassistants ...................................... 18.19 17.63 728 705 40.0 36,786 36,001 2,022
Executive secretaries andadministrative assistants .......... 18.41 17.32 736 693 40.0 38,287 36,019 2,080
Office clerks, general .......................... 12.96 12.76 518 510 40.0 26,483 25,852 2,044
1 Employees are classified as working either a full-time or a part-timeschedule based on the definition used by each establishment. Therefore, aworker with a 35-hour-per-week schedule might be considered a full-timeemployee in one establishment, but classified as part-time in another firm,where a 40-hour week is the minimum full-time schedule.
2 Workers are classified by occupation using the 2000 StandardOccupational Classification (SOC) system. See appendix B for moreinformation.
3 Earnings are the straight-time hourly wages or salaries paid toemployees. They include incentive pay, cost-of-living adjustments, andhazard pay. Excluded are premium pay for overtime, vacations, holidays,nonproduction bonuses, and tips. The mean is computed by totaling the payof all workers and dividing by the number of workers, weighted by hours. Seeappendix A for more information.
4 Mean weekly earnings are the straight-time weekly wages or salaries
paid to employees. Median weekly earnings designates position - one-half ofthe hours are paid the same as or more than the rate shown. Mean weeklyhours are the hours an employee is scheduled to work in a week, exclusive ofovertime.
5 Mean annual earnings are the straight-time annual wages or salariespaid to employees. Median annual earnings designates position - one-half ofthe hours are paid the same as or more than the rate shown. Mean annualhours are the hours an employee is scheduled to work in a year, exclusive ofovertime.
SOURCE: Bureau of Labor Statistics, National Compensation Survey.
NOTE: Dashes indicate that no data were reported or that data did not meetpublication criteria. Overall occupational groups may include data forcategories not shown separately
30

Table 14. Size of establishment: Mean hourly earnings1 of private industry establishmentsfor major occupational groups, Austin-Round Rock-San Marcos, TX, May 2010
Occupational group2 Total 1-99workers
100-499workers
500workersor more
All workers .................................................................... $19.88 $17.86 $17.16 $28.30
Management, professional, and related ..................... 33.19 29.69 35.03 36.52Management, business, and financial .................... 34.37 32.38 28.78 38.29Professional and related ......................................... 32.70 28.47 36.78 35.73
Service ........................................................................ 9.14 9.22 9.48 –Sales and office .......................................................... 17.01 17.08 13.53 20.91
Sales and related .................................................... 18.70 18.98 12.06 37.80Office and administrative support ........................... 16.11 16.04 14.86 17.21
Natural resources, construction, and maintenance .... 18.91 19.33 16.68 –Construction and extraction ................................... 17.19 17.67 – –Installation, maintenance, and repair ...................... 21.24 20.66 – –
Production, transportation, and material moving ........ 11.68 12.08 10.80 14.83Production .............................................................. 12.27 12.67 11.38 15.76Transportation and material moving ....................... 10.95 11.52 9.88 –
Relative error3 (percent)
All workers .................................................................... 5.3 8.4 9.6 4.9
Management, professional, and related ..................... 6.3 11.7 16.3 3.2Management, business, and financial .................... 6.3 10.3 26.8 7.3Professional and related ......................................... 7.6 14.2 16.9 3.0
Service ........................................................................ 7.3 10.5 10.4 –Sales and office .......................................................... 6.0 8.8 4.1 8.3
Sales and related .................................................... 15.6 20.3 6.3 12.6Office and administrative support ........................... 2.3 4.2 6.7 4.0
Natural resources, construction, and maintenance .... 5.4 6.7 17.5 –Construction and extraction ................................... 7.1 2.1 – –Installation, maintenance, and repair ...................... 8.5 10.2 – –
Production, transportation, and material moving ........ 5.2 4.2 9.6 7.4Production .............................................................. 5.2 7.4 9.0 6.4Transportation and material moving ....................... 6.5 5.4 10.9 –
1 Earnings are the straight-time hourly wages or salariespaid to employees. They include incentive pay, cost-of-livingadjustments, and hazard pay. Excluded are premium pay forovertime, vacations, holidays, nonproduction bonuses, andtips. The mean is computed by totaling the pay of all workersand dividing by the number of workers, weighted by hours.See appendix A for more information.
2 Workers are classified by occupation using the 2000Standard Occupational Classification (SOC) system. Seeappendix B for more information.
3 The relative standard error (RSE) is the standard errorexpressed as a percent of the estimate. It can be used tocalculate a "confidence interval" around a sample estimate.For more information about RSEs, see appendix A.
SOURCE: Bureau of Labor Statistics, National CompensationSurvey.
NOTE: Dashes indicate that no data were reported or thatdata did not meet publication criteria.
31

Table 15. Establishments with fewer than 100 workers: Mean and median hourly, weekly, and annual earnings and meanweekly and annual hours for full-time1 private industry workers, Austin-Round Rock-San Marcos, TX, May 2010
Occupation2
Hourly earnings3 Weekly earnings4 Annual earnings5
Mean Median Mean MedianMeanweeklyhours
Mean MedianMeanannualhours
All workers .................................................................... $19.38 $15.85 $777 $600 40.1 $40,361 $31,200 2,083
Management occupations ....................................... 34.87 28.85 1,421 1,149 40.8 73,917 59,754 2,120
Business and financial operations occupations ... 26.68 25.46 1,125 1,000 42.2 58,483 52,000 2,192
Computer and mathematical science occupations 31.26 31.54 1,305 1,162 41.7 67,858 60,424 2,171
Legal occupations .................................................... 35.32 30.25 1,632 1,664 46.2 84,885 86,521 2,403
Arts, design, entertainment, sports, and mediaoccupations ........................................................ 17.44 15.01 698 600 40.0 36,281 31,225 2,080
Healthcare practitioner and technicaloccupations ........................................................ 39.90 31.87 1,525 1,275 38.2 79,279 66,290 1,987
Food preparation and serving relatedoccupations ........................................................ 8.90 8.26 338 320 38.0 17,560 16,640 1,973
Building and grounds cleaning and maintenanceoccupations ........................................................ 10.02 9.00 401 360 40.0 20,843 18,720 2,080
Sales and related occupations ................................ 21.39 17.95 863 718 40.4 44,900 37,336 2,099First-line supervisors/managers, sales workers ..... 26.91 29.28 1,076 1,171 40.0 55,975 60,900 2,080
First-line supervisors/managers of retail salesworkers ......................................................... 24.10 29.28 964 1,171 40.0 50,130 60,900 2,080
Retail sales workers ............................................... 12.41 10.00 491 400 39.6 25,535 20,800 2,057Cashiers, all workers .......................................... 8.76 8.10 343 324 39.1 17,819 16,848 2,033
Cashiers ......................................................... 8.76 8.10 343 324 39.1 17,819 16,848 2,033
Office and administrative support occupations .... 16.19 15.25 634 560 39.1 32,960 29,120 2,035Financial clerks ....................................................... 14.29 13.85 562 549 39.3 29,217 28,571 2,044
Bookkeeping, accounting, and auditing clerks ... 17.24 16.83 684 673 39.6 35,543 35,015 2,061Receptionists and information clerks ...................... 13.14 12.00 508 458 38.7 26,437 23,831 2,011Office clerks, general .............................................. 16.07 14.88 643 595 40.0 33,424 30,950 2,080
Construction and extraction occupations ............. 17.67 17.50 707 700 40.0 36,747 36,400 2,080
Installation, maintenance, and repair occupations 20.66 19.50 861 760 41.7 44,797 39,520 2,168
Production occupations .......................................... 12.67 10.23 503 409 39.7 26,177 21,276 2,066
Transportation and material moving occupations 11.77 11.00 458 418 38.9 23,171 21,736 1,968Laborers and material movers, hand ...................... 11.12 10.00 445 400 40.0 20,991 20,800 1,887
1 Employees are classified as working either a full-time or a part-time schedulebased on the definition used by each establishment. Therefore, a worker with a35-hour-per-week schedule might be considered a full-time employee in oneestablishment, but classified as part-time in another firm, where a 40-hour week isthe minimum full-time schedule.
2 Workers are classified by occupation using the 2000 Standard OccupationalClassification (SOC) system. See appendix B for more information.
3 Earnings are the straight-time hourly wages or salaries paid to employees.They include incentive pay, cost-of-living adjustments, and hazard pay. Excluded arepremium pay for overtime, vacations, holidays, nonproduction bonuses, and tips. Themean is computed by totaling the pay of all workers and dividing by the number ofworkers, weighted by hours. See appendix A for more information.
4 Mean weekly earnings are the straight-time weekly wages or salaries paid to
employees. Median weekly earnings designates position - one-half of the hours arepaid the same as or more than the rate shown. Mean weekly hours are the hours anemployee is scheduled to work in a week, exclusive of overtime.
5 Mean annual earnings are the straight-time annual wages or salaries paid toemployees. Median annual earnings designates position - one-half of the hours arepaid the same as or more than the rate shown. Mean annual hours are the hours anemployee is scheduled to work in a year, exclusive of overtime.
SOURCE: Bureau of Labor Statistics, National Compensation Survey.
NOTE: Dashes indicate that no data were reported or that data did not meetpublication criteria. Overall occupational groups may include data for categories notshown separately
32

Table 16. Establishments with 100 workers or more: Mean and median hourly, weekly, and annual earnings and meanweekly and annual hours for full-time1 private industry workers, Austin-Round Rock-San Marcos, TX, May 2010
Occupation2
Hourly earnings3 Weekly earnings4 Annual earnings5
Mean Median Mean MedianMeanweeklyhours
Mean MedianMeanannualhours
All workers .................................................................... $24.36 $18.15 $975 $720 40.0 $50,560 $37,440 2,075
Management occupations ....................................... 41.96 38.01 1,708 1,650 40.7 88,791 85,815 2,116Engineering managers ........................................... 56.28 57.62 2,285 2,305 40.6 118,843 119,848 2,112
Business and financial operations occupations ... 29.36 28.46 1,173 1,138 40.0 61,012 59,197 2,078
Computer and mathematical science occupations 43.60 42.76 1,748 1,765 40.1 90,921 91,790 2,085Computer software engineers ................................ 45.76 45.67 1,843 1,838 40.3 95,847 95,601 2,095
Architecture and engineering occupations ........... 35.79 34.57 1,448 1,412 40.4 75,279 73,445 2,103Engineers ............................................................... 46.85 45.30 1,913 1,827 40.8 99,457 94,994 2,123
Computer hardware engineers ........................... 47.69 45.24 1,979 1,852 41.5 102,909 96,304 2,158Electrical and electronics engineers ................... 50.26 49.82 2,010 1,993 40.0 104,542 103,630 2,080
Engineering technicians, except drafters ................ 21.57 20.81 863 832 40.0 44,857 43,285 2,080Electrical and electronic engineering technicians 21.57 20.81 863 832 40.0 44,857 43,285 2,080
Arts, design, entertainment, sports, and mediaoccupations ........................................................ 28.63 27.15 1,153 1,058 40.3 59,939 55,016 2,094
Writers and editors ................................................. 28.61 24.56 1,117 919 39.0 58,073 47,783 2,030
Healthcare practitioner and technicaloccupations ........................................................ 25.35 26.84 970 967 38.3 50,445 50,301 1,990
Registered nurses .................................................. 29.59 32.17 1,110 1,169 37.5 57,743 60,769 1,952
Sales and related occupations ................................ 23.20 14.18 930 566 40.1 48,362 29,453 2,085Cashiers, all workers .......................................... 12.95 12.85 518 514 40.0 26,942 26,728 2,080
Cashiers ......................................................... 12.95 12.85 518 514 40.0 26,942 26,728 2,080
Office and administrative support occupations .... 16.71 16.01 662 640 39.6 34,371 33,280 2,057Financial clerks ....................................................... 17.37 17.33 695 693 40.0 36,138 36,048 2,080Customer service representatives .......................... 14.68 13.06 571 523 38.9 29,703 27,171 2,023Secretaries and administrative assistants .............. 21.72 22.07 863 883 39.8 44,282 44,990 2,039
Executive secretaries and administrativeassistants ...................................................... 21.63 22.84 865 913 40.0 43,935 47,501 2,031
Secretaries, except legal, medical, andexecutive ...................................................... 21.83 21.60 861 861 39.4 44,759 44,782 2,051
Construction and extraction occupations ............. 16.68 16.61 672 664 40.3 34,939 34,549 2,095
Installation, maintenance, and repair occupations 25.91 26.98 1,036 1,079 40.0 53,896 56,118 2,080
Production occupations .......................................... 11.96 10.70 478 428 40.0 24,862 22,256 2,078Electrical and electronic equipment assemblers 12.19 11.32 488 453 40.0 25,365 23,546 2,080
1 Employees are classified as working either a full-time or a part-time schedulebased on the definition used by each establishment. Therefore, a worker with a35-hour-per-week schedule might be considered a full-time employee in oneestablishment, but classified as part-time in another firm, where a 40-hour week isthe minimum full-time schedule.
2 Workers are classified by occupation using the 2000 Standard OccupationalClassification (SOC) system. See appendix B for more information.
3 Earnings are the straight-time hourly wages or salaries paid to employees.They include incentive pay, cost-of-living adjustments, and hazard pay. Excluded arepremium pay for overtime, vacations, holidays, nonproduction bonuses, and tips. Themean is computed by totaling the pay of all workers and dividing by the number ofworkers, weighted by hours. See appendix A for more information.
4 Mean weekly earnings are the straight-time weekly wages or salaries paid to
employees. Median weekly earnings designates position - one-half of the hours arepaid the same as or more than the rate shown. Mean weekly hours are the hours anemployee is scheduled to work in a week, exclusive of overtime.
5 Mean annual earnings are the straight-time annual wages or salaries paid toemployees. Median annual earnings designates position - one-half of the hours arepaid the same as or more than the rate shown. Mean annual hours are the hours anemployee is scheduled to work in a year, exclusive of overtime.
SOURCE: Bureau of Labor Statistics, National Compensation Survey.
NOTE: Dashes indicate that no data were reported or that data did not meetpublication criteria. Overall occupational groups may include data for categories notshown separately
33

Table 17. Union1 and nonunion workers: Mean hourly earnings2 for major occupational groups, Austin-RoundRock-San Marcos, TX, May 2010
Occupational group3
Union Nonunion
Civilianworkers
Privateindustryworkers
State andlocal
governmentworkers
Civilianworkers
Privateindustryworkers
State andlocal
governmentworkers
All workers .................................................................... $23.85 – – $21.02 $19.87 $25.36
Management, professional, and related ..................... – – – 32.20 33.23 30.30Management, business, and financial .................... – – – 34.19 34.37 33.88Professional and related ......................................... – – – 31.32 32.76 28.53
Service ........................................................................ – – – 10.21 9.14 16.63Sales and office .......................................................... – – – 16.95 17.05 16.37
Sales and related .................................................... – – – 18.70 18.70 –Office and administrative support ........................... – – – 16.21 16.16 16.37
Natural resources, construction, and maintenance .... – – – 18.37 18.44 –Construction and extraction ................................... – – – 15.55 15.61 –Installation, maintenance, and repair ...................... – – – 21.03 21.24 –
Production, transportation, and material moving ........ – – – 11.69 11.68 –Production .............................................................. – – – 12.27 12.27 –Transportation and material moving ....................... – – – 10.97 10.95 –
Relative error4 (percent)
All workers .................................................................... 15.4 – – 4.3 5.4 5.1
Management, professional, and related ..................... – – – 4.6 6.4 5.5Management, business, and financial .................... – – – 6.0 6.3 12.4Professional and related ......................................... – – – 5.5 7.6 4.2
Service ........................................................................ – – – 7.5 7.3 12.7Sales and office .......................................................... – – – 5.2 6.1 6.0
Sales and related .................................................... – – – 15.6 15.6 –Office and administrative support ........................... – – – 2.3 2.4 6.0
Natural resources, construction, and maintenance .... – – – 6.4 6.8 –Construction and extraction ................................... – – – 7.3 7.8 –Installation, maintenance, and repair ...................... – – – 8.2 8.5 –
Production, transportation, and material moving ........ – – – 5.2 5.2 –Production .............................................................. – – – 5.2 5.2 –Transportation and material moving ....................... – – – 6.4 6.5 –
1 Union workers are those whose wages are determined throughcollective bargaining.
2 Earnings are the straight-time hourly wages or salaries paid toemployees. They include incentive pay, cost-of-living adjustments, andhazard pay. Excluded are premium pay for overtime, vacations, holidays,nonproduction bonuses, and tips. The mean is computed by totaling the payof all workers and dividing by the number of workers, weighted by hours. Seeappendix A for more information.
3 Workers are classified by occupation using the 2000 StandardOccupational Classification (SOC) system. See appendix B for more
information.4 The relative standard error (RSE) is the standard error expressed as a
percent of the estimate. It can be used to calculate a "confidence interval"around a sample estimate. For more information about RSEs, see appendixA.
SOURCE: Bureau of Labor Statistics, National Compensation Survey.
NOTE: Dashes indicate that no data were reported or that data did not meetpublication criteria.
34

Table 18. Time and incentive workers1: Mean hourly earnings2 for major occupationalgroups, Austin-Round Rock-San Marcos, TX, May 2010
Occupational group3
Time Incentive
Civilianworkers
Privateindustryworkers
Civilianworkers
Privateindustryworkers
All workers .................................................................... $20.71 $19.36 $30.86 $30.86
Management, professional, and related ..................... 31.62 32.34 – –Management, business, and financial .................... 33.53 33.32 – –Professional and related ......................................... 30.78 31.94 – –
Service ........................................................................ 10.77 9.06 – –Sales and office .......................................................... 16.13 16.08 25.14 25.14
Sales and related .................................................... 15.99 15.99 26.12 26.12Office and administrative support ........................... 16.18 16.12 – –
Natural resources, construction, and maintenance .... 17.94 17.96 – –Construction and extraction ................................... – 17.19 – –Installation, maintenance, and repair ...................... 19.23 19.22 – –
Production, transportation, and material moving ........ 11.59 11.59 – –Production .............................................................. 12.27 12.27 – –Transportation and material moving ....................... 10.68 10.65 – –
Relative error4 (percent)
All workers .................................................................... 4.0 5.0 18.1 18.1
Management, professional, and related ..................... 4.1 5.5 – –Management, business, and financial .................... 6.0 5.9 – –Professional and related ......................................... 5.1 7.0 – –
Service ........................................................................ 10.9 7.0 – –Sales and office .......................................................... 3.5 4.0 12.2 12.2
Sales and related .................................................... 11.2 11.2 13.6 13.6Office and administrative support ........................... 2.3 2.3 – –
Natural resources, construction, and maintenance .... 3.5 3.6 – –Construction and extraction ................................... – 7.1 – –Installation, maintenance, and repair ...................... 4.2 3.4 – –
Production, transportation, and material moving ........ 5.2 5.2 – –Production .............................................................. 5.2 5.2 – –Transportation and material moving ....................... 5.2 5.2 – –
1 Wages of time workers are based solely on hourly rateor salary. Incentive workers are those whose wages are atleast partially based on productivity payments such as piecerates, commissions, and production bonuses.
2 Earnings are the straight-time hourly wages or salariespaid to employees. They include incentive pay, cost-of-livingadjustments, and hazard pay. Excluded are premium pay forovertime, vacations, holidays, nonproduction bonuses, andtips. The mean is computed by totaling the pay of all workersand dividing by the number of workers, weighted by hours.See appendix A for more information.
3 Workers are classified by occupation using the 2000
Standard Occupational Classification (SOC) system. Seeappendix B for more information.
4 The relative standard error (RSE) is the standard errorexpressed as a percent of the estimate. It can be used tocalculate a "confidence interval" around a sample estimate.For more information about RSEs, see appendix A.
SOURCE: Bureau of Labor Statistics, National CompensationSurvey.
NOTE: Dashes indicate that no data were reported or thatdata did not meet publication criteria.
35

Table 19. Industry sector1: Mean hourly earnings2 for private industry workers by major occupational group, Austin-RoundRock-San Marcos, TX, May 2010
Occupational group3
Goods producing Service providing
Construc-tion
Manufac-turing
Trade,transpor-
tation,and utilities
Infor-mation
Financialactivities
Profes-sional andbusinessservices
Educationand
healthservices
Leisureand
hospitality
Otherservices
All workers ................................................ – $27.31 $20.12 $24.66 $20.19 – $16.88 $8.69 –
Management, professional, and related – 40.20 35.67 32.26 27.97 – – – –Management, business, and financial – 44.52 36.94 42.27 27.45 – – – –Professional and related ..................... – 38.83 34.93 23.16 29.97 – – – –
Service .................................................... – – – – – – 9.48 7.94 –Sales and office ...................................... – 20.56 17.12 16.32 16.31 – 16.45 11.03 –
Sales and related ................................ – – 18.03 – – – – – –Office and administrative support ....... – 20.65 15.26 16.35 15.52 – 16.45 11.74 –
Natural resources, construction, andmaintenance ..................................... – 20.07 18.23 – – – – – –
Construction and extraction ............... – – – – – – – – –Installation, maintenance, and repair .. – – 18.23 – – – – – –
Production, transportation, and materialmoving .............................................. – 12.97 12.67 – – – – 9.92 –
Production .......................................... – 12.79 15.70 – – – – – –Transportation and material moving ... – – 11.72 – – – – – –
Relative error4 (percent)
All workers ................................................ – 9.6 9.4 6.1 10.2 – 24.8 10.8 –
Management, professional, and related – 3.9 6.4 8.7 7.6 – – – –Management, business, and financial – 3.7 7.8 .2 9.3 – – – –Professional and related ..................... – 5.8 5.8 .3 10.7 – – – –
Service .................................................... – – – – – – 12.2 8.5 –Sales and office ...................................... – 2.1 12.4 8.7 10.0 – 4.6 21.2 –
Sales and related ................................ – – 18.4 – – – – – –Office and administrative support ....... – 2.4 4.9 1.5 6.6 – 4.6 25.8 –
Natural resources, construction, andmaintenance ..................................... – 13.0 2.3 – – – – – –
Construction and extraction ............... – – – – – – – – –Installation, maintenance, and repair .. – – 2.3 – – – – – –
Production, transportation, and materialmoving .............................................. – 2.9 7.6 – – – – 22.3 –
Production .......................................... – 3.6 20.0 – – – – – –Transportation and material moving ... – – 6.9 – – – – – –
1 Industry sectors are determined by the 2007 North American IndustryClassification System (NAICS).
2 Earnings are the straight-time hourly wages or salaries paid to employees. Theyinclude incentive pay, cost-of-living adjustments, and hazard pay. Excluded arepremium pay for overtime, vacations, holidays, nonproduction bonuses, and tips. Themean is computed by totaling the pay of all workers and dividing by the number ofworkers, weighted by hours. See appendix A for more information.
3 Workers are classified by occupation using the 2000 Standard OccupationalClassification (SOC) system. See appendix B for more information.
4 The relative standard error (RSE) is the standard error expressed as a percent ofthe estimate. It can be used to calculate a "confidence interval" around a sampleestimate. For more information about RSEs, see appendix A.
SOURCE: Bureau of Labor Statistics, National Compensation Survey.
NOTE: Dashes indicate that no data were reported or that data did not meet publicationcriteria.
36

A-1
Appendix A: Technical note
his section provides basic information on the proce-dures and concepts used to produce the data contained
in this report. It is divided into three parts: Planning for the survey; data collection; and processing and analyzing the data. Although this section answers some questions com-monly asked by data users, it is not a comprehensive de-scription of all of the steps required to produce the data.
Planning for the survey The overall design of the National Compensation Survey (NCS) includes questions of scope, frame, and sample se-lection. Survey scope This survey covered establishments employing one worker or more in private goods-producing industries (mining, construction, and manufacturing); private service-providing industries (trade, transportation, and utilities, information, financial activities, professional and business services, edu-cation and health services, leisure and hospitality, and other services); State governments; and local governments. Agriculture, forestry, fishing and hunting, private house-holds, and the Federal Government were excluded from the scope of the survey. For purposes of this survey, an estab-lishment is an economic unit that produces goods or servic-es, a central administrative office, or an auxiliary unit pro-viding support services to a company. For private industries in this survey, the establishment is usually at a single physical location. For State and local governments, an establishment is defined as all locations of a government agency within the sampled area. The statistical area covered by this survey is defined by the U.S. Office of Management and Budget (OMB) as of December 2003. The area title was updated in December 2009. The Austin–Round Rock–San Marcos, TX, Metro-politan Statistical Area includes Bastrop, Caldwell, Hays, Travis, and Williamson Counties, TX. Sampling frame The list of establishments from which the survey sample was selected (sampling frame) was developed from State unemployment insurance reports. Due to the volatility of industries within the private sector, sampling frames were developed using the most recent month of reference availa-ble at the time the sample was selected. Approximately
one-fifth of the private industry sample is reselected each year. The sampling frame for State and local government establishments is revised every 10 years. Sample design The sample for this survey area was selected using a two-stage stratified design with probability proportional to em-ployment sampling at each stage. The first stage of sample selection was a probability sample of establishments. The sample of establishments was drawn by first stratifying the sampling frame by industry and ownership. The number of sample establishments allocated to each stratum is approx-imately proportional to the stratum employment. Each sampled establishment is selected within a stratum with a probability proportional to its employment. Use of this technique means that the larger an establishment’s em-ployment, the greater its chance of selection. Weights were applied to each establishment when the data were tabulated so that it represents similar units (by industry and employ-ment size) in the economy that were not selected for collec-tion. The second stage of sample selection, detailed below, was a probability sample of occupations within a sampled establishment.
Data collection The collection of data from survey respondents required detailed procedures. Field economists collected the data, working out of the Bureau of Labor Statistics (BLS) Re-gional Offices and visiting each establishment surveyed. Other contact methods, such as mail and telephone, were used to clarify and update data. Occupational selection and classification Identification of the occupations for which wage data were to be collected was a multistep process:
1. Probability-proportional-to-size selection of estab-
lishment jobs 2. Classification of jobs into occupations based on the
2000 Standard Occupational Classification (SOC) system
3. Characterization of jobs as full-time versus part-time, union versus nonunion, and time versus incen-tive
4. Determination of the level of work of each job
T

A-2
For each occupation, wage data were collected for those workers whose jobs could be characterized by the criteria identified in the last three steps. If a specific work level could not be determined, wages were still collected. In step one, the jobs to be sampled were selected at each establishment by the BLS field economist. A complete list of employees was used for sampling, with each selected worker representing a job within the establishment. As with the selection of establishments, the selection of a job was based on probability proportional to its size in the establishment. The greater the number of people work-ing in a job in the establishment, the greater its chance of selection. The number of jobs for which data were collected in each establishment was based on the establishment’s em-ployment size. The number of jobs selected followed this schedule:
Number of employees
Number of selected jobs
1–49 Up to 4 50–249 6 250 or more 8
Exceptions include State and local government units, for which up to 20 jobs may be selected, and the aircraft manufacturing industry units (those matching NAICS code 336411) for which up to 32 jobs may be selected. The second step of the process entailed classifying the selected jobs into occupations based on their duties. NCS uses the 2000 Standard Occupational Classification (SOC) system. A selected job may fall into any one of about 800 occupational classifications, from accountant to zoologist. When workers could be classified in more than one occupa-tion, they were classified in the occupation that required the higher skill level. When there was no perceptible differ-ence in skill level, the workers were classified in the occu-pation that described their primary activity. Each occupational classification is an element of a broader classification known as a major group. Occupa-tions can fall into any of 22 major groups. Appendix B contains a complete list of all individual occupations, clas-sified by the major group to which they belong. In step three, certain other job characteristics of the chosen worker were identified. First, the worker was iden-tified as holding either a full-time or part-time job, based on the establishment’s definition of those terms. Then, the worker was classified as having a time versus incentive job, depending on whether any part of pay was directly based on the actual production of the worker, rather than solely on hours worked. Finally, the worker was identified as be-ing in a union job or a nonunion job. (See the “Union workers” section on the following page for more detail.)
Occupational leveling In the last step before wage data were collected, the work level of each selected job was determined using a “point factor leveling” process. Point factor leveling matches cer-tain aspects of a job to specific levels of work with as-signed point values. Points for each factor are then totaled to determine the overall work level for the job. The NCS program is in the process of converting from a nine-factor to a four-factor occupational leveling system. The conversion is being phased in via annual NCS sample replenishment groups and will require several years for full implementation. The four occupational leveling factors are:
• Knowledge • Job controls and complexity • Contacts (nature and purpose) • Physical environment
Each factor consists of several levels, and each level has an associated description and assigned points. A know-ledge guide for 24 families of closely related occupations contains short definitions of the point levels of knowledge expected for the occupations and presents relevant exam-ples. The other three factors use identical descriptions for all occupational categories and contain a definition of each point level within each factor. The description within each factor best matching the job is chosen. The point levels within each factor are designed to describe the thresholds of distinct levels of work. When a job does not meet the full description of a point level, the next lowest point level is used. Points for the four factors are totaled to determine the overall work level. NCS pub-lishes data for up to 15 work levels. Most supervisory occupations are evaluated based on their duties and responsibilities. A modified approach is used for professional and administrative supervisors when they direct professional work and are paid primarily to su-pervise. Such supervisory occupations are leveled based on the work level of the highest position reporting to them. For a complete description of point factor leveling, refer to the publication “National Compensation Survey: Guide for Evaluating Your Firm’s Jobs and Pay,” available at the BLS National Compensation Survey Internet site at http://www.bls.gov/ncs/ocs/sp/ncbr0004.pdf. Combined work levels This bulletin includes a table which simplifies the presenta-tion of work levels by combining them into four broad groups. The groups were determined by combinations of knowledge, job controls and complexity, contacts, physical environment, and supervisory duties, and are meant to be comparable across different occupations. The broad groups and the combined work levels are:

A-3
Group designation
Levels combined
Group I Levels 1–4 Group II Levels 5–8 Group III Levels 9–12 Group IV Levels 13–15
Collection period Survey data were collected over a 14-month period for the larger metropolitan areas in the NCS program. For the smaller metropolitan areas, data were collected over a 5-month period. For each establishment in the survey, the da-ta reflect the establishment’s most recent information at the time of collection. The payroll reference month shown in the tables reflects the average date of this information for all sample units. Earnings Earnings were defined as regular payments from the em-ployer to the employee as compensation for straight-time hourly work, or for any salaried work performed. The fol-lowing components were included as part of earnings:
• Incentive pay, including commissions, production bonuses, and piece rates
• Cost-of-living allowances • Hazard pay • Payments of income deferred due to participation
in a salary reduction plan • Deadhead pay, defined as pay given to transporta-
tion workers returning in a vehicle without freight or passengers
The following forms of payments were not considered part of straight-time earnings:
• Shift differentials, defined as extra payment for working a schedule that varies from the norm, such as night or weekend work
• Premium pay for overtime, holidays, and weekends • Bonuses not directly tied to production (such as
Christmas and profit-sharing bonuses) • Uniform and tool allowances • Free or subsidized room and board • Payments made by third parties (for example, tips) • On-call pay
To calculate earnings for various periods (hourly, week-ly, and annual), data on work schedules also were col-lected. For hourly workers, scheduled hours worked per day and per week, exclusive of overtime, were recorded. Annual weeks worked were determined. Because salaried workers who are exempt from overtime provisions often
work beyond the assigned work schedule, their typical number of hours actually worked was collected. The earnings estimates for aircraft pilots and flight en-gineers (SOC code 53-2010) and detailed occupations within this group, and the earnings estimates for flight at-tendants (SOC code 39-6031), included flight pay and flight hours only; these estimates may not reflect the total earnings and hours worked. Union workers The NCS defines a union worker as any employee in a un-ion occupation when all of the following conditions are met: a labor organization is recognized as the bargaining agent for all workers in the occupation; wage and salary rates are determined through collection bargaining or nego-tiations; and settlement terms, which must include earnings provisions and may include benefit provisions, are embo-died in a signed, mutually binding collective bargaining agreement. A nonunion worker is an employee in an occu-pation not meeting the conditions for union coverage. Processing and analyzing the data Data were processed and analyzed at the BLS National Of-fice following collection. Weighting and nonresponse Sample weights were calculated for each establishment and occupation in the survey. These weights reflected the rela-tive size of the occupation within the establishment and of the establishment within the sample universe. Weights were used to aggregate data for the individual establish-ments or occupations into the various data series. Some of the establishments surveyed could not supply or refused to supply information. If data were not provided by a sample member during the initial interview, the weights of res-ponding sample members in the same or similar “cells” were adjusted to account for the missing data. This tech-nique assumes that the mean value of data for the nonres-pondents equals the mean value of data for the respondents at some detailed “cell” level. Responding and nonrespond-ing establishments were classified into these cells accord-ing to industry and employment size. Responding and non-responding occupations within responding establishments were classified into cells that were additionally defined by major occupation group. If average hourly earnings data were not provided by a sample member during the update interview, then missing average hourly earnings were imputed by multiplying prior average hourly earnings by the rate of change in the aver-age hourly earnings of respondents. The regression model that takes into account available establishment characteris-tics is used to derive the rate of change in the average hour-ly earnings.

A-4
Establishments that were determined to be out of busi-ness or outside the scope of the survey had their weights changed to zero. Estimation The wage series in the tables are computed by combining the wages for each sampled occupation. Before being combined, individual wage rates are weighted by the num-ber of workers; the sample weight, adjusted for nonres-ponding establishments and other factors; and the occupa-tion’s scheduled hours of work. The sample weight reflects the inverse of each unit’s probability of selection at each sample selection stage and four weight adjustment factors. The first factor adjusts for establishment nonresponse and the second factor adjusts for occupational nonresponse. The third factor adjusts for any special situations that may have occurred during data collection. The fourth factor, post-stratification, also called benchmarking, is introduced to adjust estimated employment totals to the current counts of employment by industry. The latest available employ-ment counts were used to derive average hourly earnings in this publication. Not all calculated series met the criteria for publication. Before any series was published, it was reviewed to make sure that the number of observations underlying it was suf-ficient. This review prevented the publication of a series that could have revealed information about a specific estab-lishment. Estimates of the number of workers represent the total in all establishments within the scope of the study, and not the number actually surveyed. Because occupational struc-tures among establishments differ, estimates of the number of workers obtained from the sample of establishments serve to indicate only the relative importance of the occu-pational groups studied. Percentiles The percentiles presented in tables 6 through 10 are com-puted using earnings reported for individual workers in sampled establishment jobs and their scheduled hours of work. Establishments in the survey may report only indi-vidual-worker earnings for each sampled job. For the cal-culation of percentile estimates, the individual-worker hourly earnings are appropriately weighted and then ar-rayed from lowest to highest. The published 10th, 25th, 50th, 75th, and 90th percen-tiles designate position in the earnings distribution within each published occupation. At the 50th percentile, the me-
dian, half of the hours are paid the same as or more than the rate shown, and half are paid the same as or less than the rate shown. At the 25th percentile, one-fourth of the hours are paid the same as or less than the rate shown. At the 75th percentile, one-fourth are paid the same as or more than the rate shown. The 10th and 90th percentiles follow the same logic. Data reliability The data in this bulletin are estimates from a scientifically selected probability sample. There are two types of errors possible in an estimate based on a sample survey, sampling and nonsampling. Sampling errors occur because observations come only from a sample and not from an entire population. The sample used for this survey is one of a number of possible samples of the same size that could have been selected us-ing the sample design. Estimates derived from the different samples would differ from each other. A measure of the variation among these differing esti-mates is called the standard error or sampling error. It in-dicates the precision with which an estimate from a particu-lar sample approximates the average result of all possible samples. The relative standard error (RSE) is the standard error divided by the estimate. RSE data are provided alongside the earnings data in the bulletin tables. The standard error can be used to calculate a “confi-dence interval” around a sample estimate. As an example, suppose a table shows that mean hourly earnings for all workers were $17.75, with a relative standard error of 1.0 percent for this estimate. At the 90-percent level, the con-fidence interval for this estimate is from $17.46 to $18.04 ($17.75 minus and plus $0.29, where $0.29 is the product of 1.645 times 1.0 percent times $17.75). If all possible samples were selected to estimate the population value, the interval from each sample would include the true popula-tion value approximately 90 percent of the time. Nonsampling errors also affect survey results. They can stem from many sources, such as inability to obtain in-formation for some establishments, difficulties with survey definitions, inability of the respondents to provide correct information, or mistakes in recording or coding the data ob-tained. Although they were not specifically measured, the nonsampling errors were expected to be minimal due to the extensive training of the field economists who gathered the survey data, computer edits of the data, and detailed data review.

Appendix table 1. Number of workers1 represented by the survey, Austin-RoundRock-San Marcos, TX, May 2010
Occupational group2 Civilianworkers
Privateindustryworkers
State andlocal
governmentworkers
All workers .................................................................... 713,200 556,700 156,500
Management, professional, and related ..................... 259,900 154,900 105,000Management, business, and financial .................... 72,000 44,600 27,400Professional and related ......................................... 187,900 110,300 77,600
Service ........................................................................ 154,900 133,900 21,100Sales and office .......................................................... 182,400 156,200 26,200
Sales and related .................................................... 58,100 58,100 –Office and administrative support ........................... 124,300 98,100 26,200
Natural resources, construction, and maintenance .... 47,800 44,200 –Construction and extraction ................................... 27,100 25,900 –Installation, maintenance, and repair ...................... 20,700 18,300 –
Production, transportation, and material moving ........ 68,100 67,500 –Production .............................................................. 34,200 34,200 –Transportation and material moving ....................... 34,000 33,400 –
1 The number of workers represented by thesurvey are rounded to the nearest 100. Estimates ofthe number of workers provide a description of sizeand composition of the labor force included in thesurvey. Estimates are not intended, however, forcomparison to other statistical series to measureemployment trends or levels.
2 Workers are classified by occupation using the
2000 Standard Occupational Classification (SOC)system. See appendix B for more information.
SOURCE: Bureau of Labor Statistics, NationalCompensation Survey.
NOTE: Dashes indicate that no data were reported orthat data did not meet publication criteria.
A-5

Appendix table 2. Survey establishment response, Austin-Round Rock-SanMarcos, TX, May 2010
Establishments Total Privateindustry
State andlocal
government
Total in sampling frame1 ................................................ 27,642 27,072 570
Total in sample ............................................................... 276 242 34Responding ............................................................ 190 159 31Refused or unable to provide data ......................... 54 51 3Out of business or not in survey scope .................. 32 32 0
1 The list of establishments from which thesurvey sample was selected (sampling frame) wasdeveloped from State unemployment insurancereports and is based on the 2007 North AmericanIndustry Classification System (NAICS). For privateindustries, an establishment is usually a singlephysical location. For State and local governments,an establishment is defined as all locations of a
government entity.
SOURCE: Bureau of Labor Statistics, NationalCompensation Survey.
NOTE: Dashes indicate that no data were reported orthat data did not meet publication criteria.
A-6
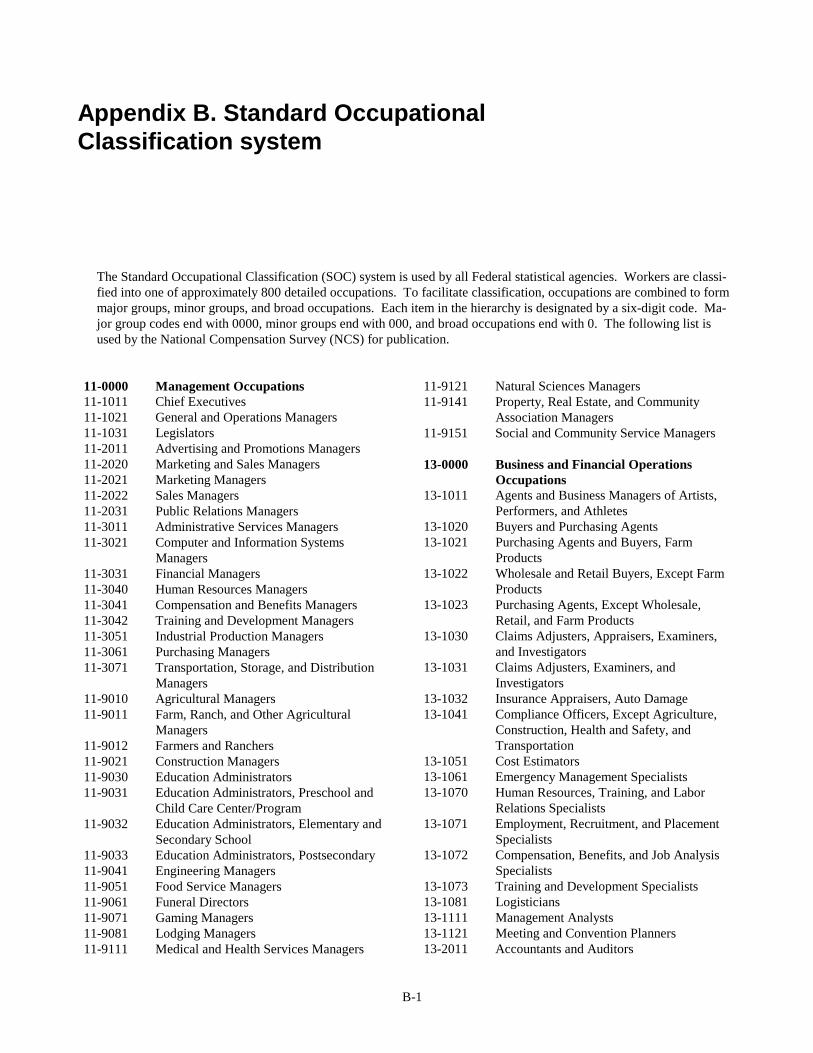
B-1
Appendix B. Standard Occupational Classification system
The Standard Occupational Classification (SOC) system is used by all Federal statistical agencies. Workers are classi-fied into one of approximately 800 detailed occupations. To facilitate classification, occupations are combined to form major groups, minor groups, and broad occupations. Each item in the hierarchy is designated by a six-digit code. Ma-jor group codes end with 0000, minor groups end with 000, and broad occupations end with 0. The following list is used by the National Compensation Survey (NCS) for publication.
11-0000 Management Occupations 11-1011 Chief Executives 11-1021 General and Operations Managers 11-1031 Legislators 11-2011 Advertising and Promotions Managers 11-2020 Marketing and Sales Managers 11-2021 Marketing Managers 11-2022 Sales Managers 11-2031 Public Relations Managers 11-3011 Administrative Services Managers 11-3021 Computer and Information Systems Managers 11-3031 Financial Managers 11-3040 Human Resources Managers 11-3041 Compensation and Benefits Managers 11-3042 Training and Development Managers 11-3051 Industrial Production Managers 11-3061 Purchasing Managers 11-3071 Transportation, Storage, and Distribution
Managers 11-9010 Agricultural Managers 11-9011 Farm, Ranch, and Other Agricultural Managers 11-9012 Farmers and Ranchers 11-9021 Construction Managers 11-9030 Education Administrators 11-9031 Education Administrators, Preschool and
Child Care Center/Program 11-9032 Education Administrators, Elementary and
Secondary School 11-9033 Education Administrators, Postsecondary 11-9041 Engineering Managers 11-9051 Food Service Managers 11-9061 Funeral Directors 11-9071 Gaming Managers 11-9081 Lodging Managers 11-9111 Medical and Health Services Managers
11-9121 Natural Sciences Managers 11-9141 Property, Real Estate, and Community Association Managers 11-9151 Social and Community Service Managers 13-0000 Business and Financial Operations Occupations 13-1011 Agents and Business Managers of Artists,
Performers, and Athletes 13-1020 Buyers and Purchasing Agents 13-1021 Purchasing Agents and Buyers, Farm Products 13-1022 Wholesale and Retail Buyers, Except Farm
Products 13-1023 Purchasing Agents, Except Wholesale, Retail, and Farm Products 13-1030 Claims Adjusters, Appraisers, Examiners,
and Investigators 13-1031 Claims Adjusters, Examiners, and Investigators 13-1032 Insurance Appraisers, Auto Damage 13-1041 Compliance Officers, Except Agriculture,
Construction, Health and Safety, and Transportation 13-1051 Cost Estimators 13-1061 Emergency Management Specialists 13-1070 Human Resources, Training, and Labor Relations Specialists 13-1071 Employment, Recruitment, and Placement
Specialists 13-1072 Compensation, Benefits, and Job Analysis
Specialists 13-1073 Training and Development Specialists 13-1081 Logisticians 13-1111 Management Analysts 13-1121 Meeting and Convention Planners 13-2011 Accountants and Auditors
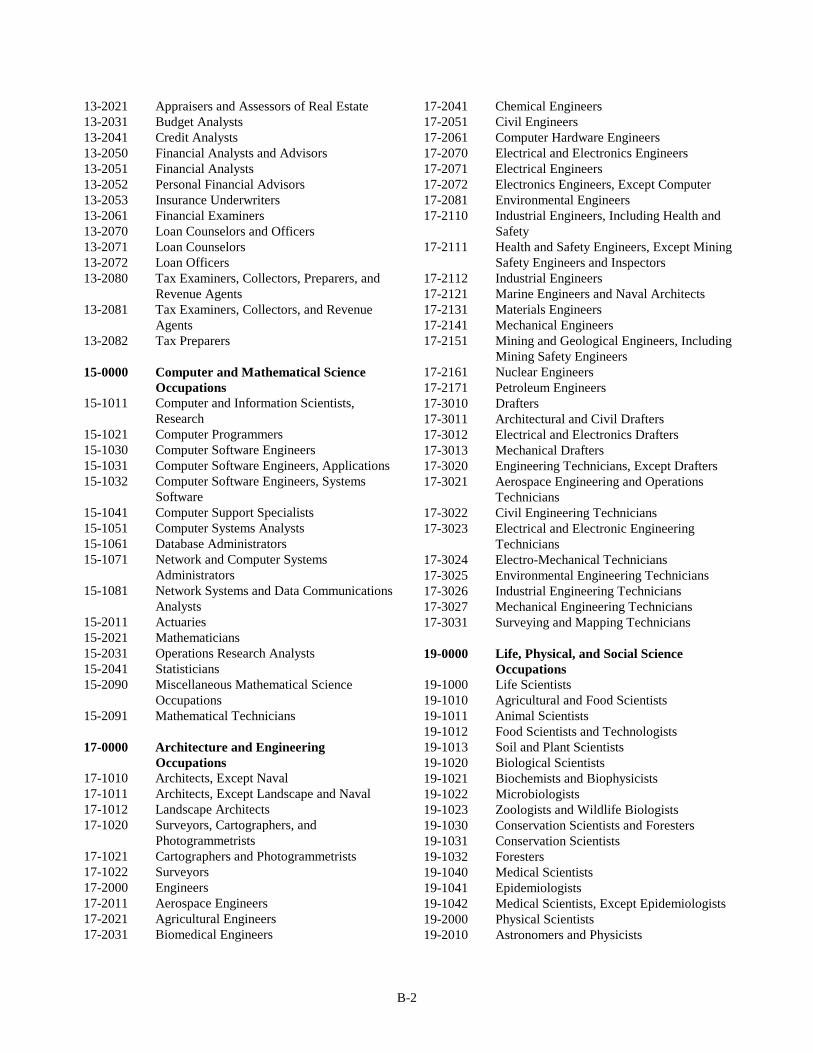
B-2
13-2021 Appraisers and Assessors of Real Estate 13-2031 Budget Analysts 13-2041 Credit Analysts 13-2050 Financial Analysts and Advisors 13-2051 Financial Analysts 13-2052 Personal Financial Advisors 13-2053 Insurance Underwriters 13-2061 Financial Examiners 13-2070 Loan Counselors and Officers 13-2071 Loan Counselors 13-2072 Loan Officers 13-2080 Tax Examiners, Collectors, Preparers, and
Revenue Agents 13-2081 Tax Examiners, Collectors, and Revenue
Agents 13-2082 Tax Preparers 15-0000 Computer and Mathematical Science Occupations 15-1011 Computer and Information Scientists, Research 15-1021 Computer Programmers 15-1030 Computer Software Engineers 15-1031 Computer Software Engineers, Applications 15-1032 Computer Software Engineers, Systems
Software 15-1041 Computer Support Specialists 15-1051 Computer Systems Analysts 15-1061 Database Administrators 15-1071 Network and Computer Systems Administrators 15-1081 Network Systems and Data Communications
Analysts 15-2011 Actuaries 15-2021 Mathematicians 15-2031 Operations Research Analysts 15-2041 Statisticians 15-2090 Miscellaneous Mathematical Science Occupations 15-2091 Mathematical Technicians 17-0000 Architecture and Engineering Occupations 17-1010 Architects, Except Naval 17-1011 Architects, Except Landscape and Naval 17-1012 Landscape Architects 17-1020 Surveyors, Cartographers, and Photogrammetrists 17-1021 Cartographers and Photogrammetrists 17-1022 Surveyors 17-2000 Engineers 17-2011 Aerospace Engineers 17-2021 Agricultural Engineers 17-2031 Biomedical Engineers
17-2041 Chemical Engineers 17-2051 Civil Engineers 17-2061 Computer Hardware Engineers 17-2070 Electrical and Electronics Engineers 17-2071 Electrical Engineers 17-2072 Electronics Engineers, Except Computer 17-2081 Environmental Engineers 17-2110 Industrial Engineers, Including Health and
Safety 17-2111 Health and Safety Engineers, Except Mining
Safety Engineers and Inspectors 17-2112 Industrial Engineers 17-2121 Marine Engineers and Naval Architects 17-2131 Materials Engineers 17-2141 Mechanical Engineers 17-2151 Mining and Geological Engineers, Including
Mining Safety Engineers 17-2161 Nuclear Engineers 17-2171 Petroleum Engineers 17-3010 Drafters 17-3011 Architectural and Civil Drafters 17-3012 Electrical and Electronics Drafters 17-3013 Mechanical Drafters 17-3020 Engineering Technicians, Except Drafters 17-3021 Aerospace Engineering and Operations
Technicians 17-3022 Civil Engineering Technicians 17-3023 Electrical and Electronic Engineering Technicians 17-3024 Electro-Mechanical Technicians 17-3025 Environmental Engineering Technicians 17-3026 Industrial Engineering Technicians 17-3027 Mechanical Engineering Technicians 17-3031 Surveying and Mapping Technicians 19-0000 Life, Physical, and Social Science Occupations 19-1000 Life Scientists 19-1010 Agricultural and Food Scientists 19-1011 Animal Scientists 19-1012 Food Scientists and Technologists 19-1013 Soil and Plant Scientists 19-1020 Biological Scientists 19-1021 Biochemists and Biophysicists 19-1022 Microbiologists 19-1023 Zoologists and Wildlife Biologists 19-1030 Conservation Scientists and Foresters 19-1031 Conservation Scientists 19-1032 Foresters 19-1040 Medical Scientists 19-1041 Epidemiologists 19-1042 Medical Scientists, Except Epidemiologists 19-2000 Physical Scientists 19-2010 Astronomers and Physicists

B-3
19-2011 Astronomers 19-2012 Physicists 19-2021 Atmospheric and Space Scientists 19-2030 Chemists and Materials Scientists 19-2031 Chemists 19-2032 Materials Scientists 19-2040 Environmental Scientists and Geoscientists 19-2041 Environmental Scientists and Specialists, Including Health 19-2042 Geoscientists, Except Hydrologists and Geographers 19-2043 Hydrologists 19-3011 Economists 19-3020 Market and Survey Researchers 19-3021 Market Research Analysts 19-3022 Survey Researchers 19-3030 Psychologists 19-3031 Clinical, Counseling, and School Psychologists 19-3032 Industrial-Organizational Psychologists 19-3041 Sociologists 19-3051 Urban and Regional Planners 19-3090 Miscellaneous Social Scientists and Related
Workers 19-3091 Anthropologists and Archeologists 19-3092 Geographers 19-3093 Historians 19-3094 Political Scientists 19-4011 Agricultural and Food Science Technicians 19-4021 Biological Technicians 19-4031 Chemical Technicians 19-4041 Geological and Petroleum Technicians 19-4051 Nuclear Technicians 19-4061 Social Science Research Assistants 19-4090 Miscellaneous Life, Physical, and Social
Science Technicians 19-4091 Environmental Science and Protection Technicians, Including Health 19-4092 Forensic Science Technicians 19-4093 Forest and Conservation Technicians 21-0000 Community and Social Services Occupations 21-1010 Counselors 21-1011 Substance Abuse and Behavioral Disorder
Counselors 21-1012 Educational, Vocational, and School Counselors 21-1013 Marriage and Family Therapists 21-1014 Mental Health Counselors 21-1015 Rehabilitation Counselors 21-1020 Social Workers 21-1021 Child, Family, and School Social Workers 21-1022 Medical and Public Health Social Workers
21-1023 Mental Health and Substance Abuse Social Workers
21-1090 Miscellaneous Community and Social Service Specialists 21-1091 Health Educators 21-1092 Probation Officers and Correctional Treatment Specialists 21-1093 Social and Human Service Assistants 21-2011 Clergy 21-2021 Directors, Religious Activities and Education 23-0000 Legal Occupations 23-1011 Lawyers 23-1020 Judges, Magistrates, and Other Judicial
Workers 23-1021 Administrative Law Judges, Adjudicators,
and Hearing Officers 23-1022 Arbitrators, Mediators, and Conciliators 23-1023 Judges, Magistrate Judges, and Magistrates 23-2011 Paralegals and Legal Assistants 23-2090 Miscellaneous Legal Support Workers 23-2091 Court Reporters 23-2092 Law Clerks 23-2093 Title Examiners, Abstractors, and Searchers 25-0000 Education, Training and Library Occupations 25-1000 Postsecondary Teachers 25-1011 Business Teachers, Postsecondary 25-1020 Math and Computer Teachers, Postsecondary 25-1021 Computer Science Teachers, Postsecondary 25-1022 Mathematical Science Teachers, Postsecondary 25-1030 Engineering and Architecture Teachers,
Postsecondary 25-1031 Architecture Teachers, Postsecondary 25-1032 Engineering Teachers, Postsecondary 25-1040 Life Sciences Teachers, Postsecondary 25-1041 Agricultural Sciences Teachers, Postsecondary 25-1042 Biological Science Teachers, Postsecondary 25-1043 Forestry and Conservation Science Teachers,
Postsecondary 25-1050 Physical Sciences Teachers, Postsecondary 25-1051 Atmospheric, Earth, Marine, and Space Sciences Teachers, Postsecondary 25-1052 Chemistry Teachers, Postsecondary 25-1053 Environmental Science Teachers, Postsecondary 25-1054 Physics Teachers, Postsecondary 25-1060 Social Sciences Teachers, Postsecondary 25-1061 Anthropology and Archeology Teachers,
Postsecondary

B-4
25-1062 Area, Ethnic, and Cultural Studies Teachers, Postsecondary
25-1063 Economics Teachers, Postsecondary 25-1064 Geography Teachers, Postsecondary 25-1065 Political Science Teachers, Postsecondary 25-1066 Psychology Teachers, Postsecondary 25-1067 Sociology Teachers, Postsecondary 25-1070 Health Teachers, Postsecondary 25-1071 Health Specialties Teachers, Postsecondary 25-1072 Nursing Instructors and Teachers, Postsecondary 25-1080 Education and Library Science Teachers,
Postsecondary 25-1081 Education Teachers, Postsecondary 25-1082 Library Science Teachers, Postsecondary 25-1110 Law, Criminal Justice, and Social Work
Teachers, Postsecondary 25-1111 Criminal Justice and Law Enforcement
Teachers, Postsecondary 25-1112 Law Teachers, Postsecondary 25-1113 Social Work Teachers, Postsecondary 25-1120 Arts, Communications, and Humanities
Teachers, Postsecondary 25-1121 Art, Drama, and Music Teachers, Postsecondary 25-1122 Communications Teachers, Postsecondary 25-1123 English Language and Literature Teachers,
Postsecondary 25-1124 Foreign Language and Literature Teachers,
Postsecondary 25-1125 History Teachers, Postsecondary 25-1126 Philosophy and Religion Teachers, Postsecondary 25-1190 Miscellaneous Postsecondary Teachers 25-1191 Graduate Teaching Assistants 25-1192 Home Economics Teachers, Postsecondary 25-1193 Recreation and Fitness Studies Teachers,
Postsecondary 25-1194 Vocational Education Teachers, Postsecondary 25-2000 Primary, Secondary, and Special Education
School Teachers 25-2010 Preschool and Kindergarten Teachers 25-2011 Preschool Teachers, Except Special Education 25-2012 Kindergarten Teachers, Except Special Education 25-2020 Elementary and Middle School Teachers 25-2021 Elementary School Teachers, Except Special
Education 25-2022 Middle School Teachers, Except Special and
Vocational Education 25-2023 Vocational Education Teachers, Middle
School
25-2030 Secondary School Teachers 25-2031 Secondary School Teachers, Except Special
and Vocational Education 25-2032 Vocational Education Teachers, Secondary
School 25-2040 Special Education Teachers 25-2041 Special Education Teachers, Preschool, Kindergarten, and Elementary School 25-2042 Special Education Teachers, Middle School 25-2043 Special Education Teachers, Secondary
School 25-3000 Other Teachers and Instructors 25-3011 Adult Literacy, Remedial Education, and
GED Teachers and Instructors 25-3021 Self-Enrichment Education Teachers 25-4010 Archivists, Curators, and Museum Technicians 25-4011 Archivists 25-4012 Curators 25-4013 Museum Technicians and Conservators 25-4021 Librarians 25-4031 Library Technicians 25-9011 Audio-Visual Collections Specialists 25-9021 Farm and Home Management Advisors 25-9031 Instructional Coordinators 25-9041 Teacher Assistants 27-0000 Arts, Design, Entertainment, Sports, and Media Occupations 27-1010 Artists and Related Workers 27-1011 Art Directors 27-1012 Craft Artists 27-1013 Fine Artists, Including Painters, Sculptors,
and Illustrators 27-1014 Multi-Media Artists and Animators 27-1020 Designers 27-1021 Commercial and Industrial Designers 27-1022 Fashion Designers 27-1023 Floral Designers 27-1024 Graphic Designers 27-1025 Interior Designers 27-1026 Merchandise Displayers and Window Trimmers 27-1027 Set and Exhibit Designers 27-2010 Actors, Producers, and Directors 27-2011 Actors 27-2012 Producers and Directors 27-2020 Athletes, Coaches, Umpires, and Related
Workers 27-2021 Athletes and Sports Competitors 27-2022 Coaches and Scouts 27-2023 Umpires, Referees, and Other Sports Officials 27-2030 Dancers and Choreographers

B-5
27-2031 Dancers 27-2032 Choreographers 27-2040 Musicians, Singers, and Related Workers 27-2041 Music Directors and Composers 27-2042 Musicians and Singers 27-3010 Announcers 27-3011 Radio and Television Announcers 27-3012 Public Address System and Other Announcers 27-3020 News Analysts, Reporters and Correspondents 27-3021 Broadcast News Analysts 27-3022 Reporters and Correspondents 27-3031 Public Relations Specialists 27-3040 Writers and Editors 27-3041 Editors 27-3042 Technical Writers 27-3043 Writers and Authors 27-3090 Miscellaneous Media and Communication
Workers 27-3091 Interpreters and Translators 27-4010 Broadcast and Sound Engineering Technicians and Radio Operators 27-4011 Audio and Video Equipment Technicians 27-4012 Broadcast Technicians 27-4013 Radio Operators 27-4014 Sound Engineering Technicians 27-4021 Photographers 27-4030 Television, Video, and Motion Picture Camera Operators and Editors 27-4031 Camera Operators, Television, Video, and
Motion Picture 27-4032 Film and Video Editors 29-0000 Healthcare Practitioner and Technical
Occupations 29-1011 Chiropractors 29-1020 Dentists 29-1021 Dentists, General 29-1022 Oral and Maxillofacial Surgeons 29-1023 Orthodontists 29-1024 Prosthodontists 29-1031 Dietitians and Nutritionists 29-1041 Optometrists 29-1051 Pharmacists 29-1060 Physicians and Surgeons 29-1061 Anesthesiologists 29-1062 Family and General Practitioners 29-1063 Internists, General 29-1064 Obstetricians and Gynecologists 29-1065 Pediatricians, General 29-1066 Psychiatrists 29-1067 Surgeons 29-1071 Physician Assistants
29-1081 Podiatrists 29-1111 Registered Nurses 29-1120 Therapists 29-1121 Audiologists 29-1122 Occupational Therapists 29-1123 Physical Therapists 29-1124 Radiation Therapists 29-1125 Recreational Therapists 29-1126 Respiratory Therapists 29-1127 Speech-Language Pathologists 29-1131 Veterinarians 29-2010 Clinical Laboratory Technologists and Technicians 29-2011 Medical and Clinical Laboratory Technologists 29-2012 Medical and Clinical Laboratory Technicians 29-2021 Dental Hygienists 29-2030 Diagnostic Related Technologists and Technicians 29-2031 Cardiovascular Technologists and Technicians 29-2032 Diagnostic Medical Sonographers 29-2033 Nuclear Medicine Technologists 29-2034 Radiologic Technologists and Technicians 29-2041 Emergency Medical Technicians and Paramedics 29-2050 Health Diagnosing and Treating Practitioner
Support Technicians 29-2051 Dietetic Technicians 29-2052 Pharmacy Technicians 29-2053 Psychiatric Technicians 29-2054 Respiratory Therapy Technicians 29-2055 Surgical Technologists 29-2056 Veterinary Technologists and Technicians 29-2061 Licensed Practical and Licensed Vocational
Nurses 29-2071 Medical Records and Health Information
Technicians 29-2081 Opticians, Dispensing 29-2090 Miscellaneous Health Technologists and
Technicians 29-2091 Orthotists and Prosthetists 29-9010 Occupational Health and Safety Specialists
and Technicians 29-9011 Occupational Health and Safety Specialists 29-9012 Occupational Health and Safety Technicians 29-9090 Miscellaneous Healthcare Practitioner and
Technical Workers 29-9091 Athletic Trainers 31-0000 Healthcare Support Occupations 31-1010 Nursing, Psychiatric, and Home Health
Aides 31-1011 Home Health Aides

B-6
31-1012 Nursing Aides, Orderlies, and Attendants 31-1013 Psychiatric Aides 31-2010 Occupational Therapist Assistants and Aides 31-2011 Occupational Therapist Assistants 31-2012 Occupational Therapist Aides 31-2020 Physical Therapist Assistants and Aides 31-2021 Physical Therapist Assistants 31-2022 Physical Therapist Aides 31-9011 Massage Therapists 31-9090 Miscellaneous Healthcare Support Occupations 31-9091 Dental Assistants 31-9092 Medical Assistants 31-9093 Medical Equipment Preparers 31-9094 Medical Transcriptionists 31-9095 Pharmacy Aides 31-9096 Veterinary Assistants and Laboratory Animal
Caretakers 33-0000 Protective Service Occupations 33-1010 First-Line Supervisors/Managers, Law Enforcement Workers 33-1011 First-Line Supervisors/Managers of Correctional Officers 33-1012 First-Line Supervisors/Managers of Police
and Detectives 33-1021 First-Line Supervisors/Managers of Fire
Fighting and Prevention Workers 33-2011 Fire Fighters 33-2020 Fire Inspectors 33-2021 Fire Inspectors and Investigators 33-2022 Forest Fire Inspectors and Prevention Specialists 33-3010 Bailiffs, Correctional Officers, and Jailers 33-3011 Bailiffs 33-3012 Correctional Officers and Jailers 33-3021 Detectives and Criminal Investigators 33-3031 Fish and Game Wardens 33-3041 Parking Enforcement Workers 33-3050 Police Officers 33-3051 Police and Sheriff's Patrol Officers 33-3052 Transit and Railroad Police 33-9011 Animal Control Workers 33-9021 Private Detectives and Investigators 33-9030 Security Guards and Gaming Surveillance
Officers 33-9031 Gaming Surveillance Officers and Gaming
Investigators 33-9032 Security Guards 33-9090 Miscellaneous Protective Service Workers 33-9091 Crossing Guards 33-9092 Lifeguards, Ski Patrol, and Other Recreational Protective Service Workers
35-0000 Food Preparation and Serving Related Occupations
35-1010 First-Line Supervisors/Managers, Food Preparation and Serving Workers
35-1011 Chefs and Head Cooks 35-1012 First-Line Supervisors/Managers of Food
Preparation and Serving Workers 35-2010 Cooks 35-2011 Cooks, Fast Food 35-2012 Cooks, Institution and Cafeteria 35-2014 Cooks, Restaurant 35-2015 Cooks, Short Order 35-2021 Food Preparation Workers 35-3011 Bartenders 35-3020 Fast Food and Counter Workers 35-3021 Combined Food Preparation and Serving
Workers, Including Fast Food 35-3022 Counter Attendants, Cafeteria, Food 35-3031 Waiters and Waitresses 35-3041 Food Servers, Nonrestaurant 35-9011 Dining Room and Cafeteria Attendants and
Bartender Helpers 35-9021 Dishwashers 35-9031 Hosts and Hostesses, Restaurant, Lounge,
and Coffee Shop Note: NCS tables may include the special group Food Service, Tipped, combining Bartenders, Waiters and Waitresses, and Dining Room and Cafeteria Attendants and Bartender Helpers. 37-0000 Building and Grounds Cleaning and
Maintenance Occupations 37-1010 First-Line Supervisors/Managers, Building
and Grounds Cleaning and Maintenance Workers
37-1011 First-Line Supervisors/Managers of Housekeeping and Janitorial Workers 37-1012 First-Line Supervisors/Managers of Landscaping, Lawn Service, and Groundskeeping Workers 37-2010 Building Cleaning Workers 37-2011 Janitors and Cleaners, Except Maids and
Housekeeping Cleaners 37-2012 Maids and Housekeeping Cleaners 37-2021 Pest Control Workers 37-3010 Grounds Maintenance Workers 37-3011 Landscaping and Groundskeeping Workers 37-3012 Pesticide Handlers, Sprayers, and Applicators, Vegetation 37-3013 Tree Trimmers and Pruners 39-0000 Personal Care and Service Occupations 39-1010 First-Line Supervisors/Managers of Gaming
Workers

B-7
39-1011 Gaming Supervisors 39-1012 Slot Key Persons 39-1021 First-Line Supervisors/Managers of Personal
Service Workers 39-2011 Animal Trainers 39-2021 Nonfarm Animal Caretakers 39-3010 Gaming Services Workers 39-3011 Gaming Dealers 39-3012 Gaming and Sports Book Writers and Runners 39-3021 Motion Picture Projectionists 39-3031 Ushers, Lobby Attendants, and Ticket Takers 39-3090 Miscellaneous Entertainment Attendants and
Related Workers 39-3091 Amusement and Recreation Attendants 39-3092 Costume Attendants 39-3093 Locker Room, Coatroom, and Dressing
Room Attendants 39-4011 Embalmers 39-4021 Funeral Attendants 39-5010 Barbers and Cosmetologists 39-5011 Barbers 39-5012 Hairdressers, Hairstylists, and Cosmetologists 39-5090 Miscellaneous Personal Appearance Workers 39-5091 Makeup Artists, Theatrical and Performance 39-5092 Manicurists and Pedicurists 39-5093 Shampooers 39-5094 Skin Care Specialists 39-6010 Baggage Porters, Bellhops, and Concierges 39-6011 Baggage Porters and Bellhops 39-6012 Concierges 39-6020 Tour and Travel Guides 39-6021 Tour Guides and Escorts 39-6022 Travel Guides 39-6030 Transportation Attendants 39-6031 Flight Attendants 39-6032 Transportation Attendants, Except Flight Attendants and Baggage Porters 39-9011 Child Care Workers 39-9021 Personal and Home Care Aides 39-9030 Recreation and Fitness Workers 39-9031 Fitness Trainers and Aerobics Instructors 39-9032 Recreation Workers 39-9041 Residential Advisors 41-0000 Sales and Related Occupations 41-1010 First-Line Supervisors/Managers, Sales
Workers 41-1011 First-Line Supervisors/Managers of Retail
Sales Workers
41-1012 First-Line Supervisors/Managers of Non-Retail Sales Workers 41-2000 Retail Sales Workers 41-2010 Cashiers, All Workers 41-2011 Cashiers 41-2012 Gaming Change Persons and Booth Cashiers 41-2020 Counter and Rental Clerks and Parts Salespersons 41-2021 Counter and Rental Clerks 41-2022 Parts Salespersons 41-2031 Retail Salespersons 41-3011 Advertising Sales Agents 41-3021 Insurance Sales Agents 41-3031 Securities, Commodities, and Financial Services Sales Agents 41-3041 Travel Agents 41-4010 Sales Representatives, Wholesale and Manufacturing 41-4011 Sales Representatives, Wholesale and
Manufacturing, Technical and Scientific Products
41-4012 Sales Representatives, Wholesale and Manufacturing, Except Technical and Scientific Products 41-9010 Models, Demonstrators, and Product Promoters 41-9011 Demonstrators and Product Promoters 41-9012 Models 41-9020 Real Estate Brokers and Sales Agents 41-9021 Real Estate Brokers 41-9022 Real Estate Sales Agents 41-9031 Sales Engineers 41-9041 Telemarketers 41-9090 Miscellaneous Sales and Related Workers 41-9091 Door-To-Door Sales Workers, News and
Street Vendors, and Related Workers 43-0000 Office and Administrative Support Occupations 43-1011 First-Line Supervisors/Managers of Office
and Administrative Support Workers 43-2011 Switchboard Operators, Including Answering
Service 43-2021 Telephone Operators 43-3000 Financial Clerks 43-3011 Bill and Account Collectors 43-3021 Billing and Posting Clerks and Machine Operators 43-3031 Bookkeeping, Accounting, and Auditing
Clerks 43-3041 Gaming Cage Workers 43-3051 Payroll and Timekeeping Clerks 43-3061 Procurement Clerks

B-8
43-3071 Tellers 43-4011 Brokerage Clerks 43-4021 Correspondence Clerks 43-4031 Court, Municipal, and License Clerks 43-4041 Credit Authorizers, Checkers, and Clerks 43-4051 Customer Service Representatives 43-4061 Eligibility Interviewers, Government Programs 43-4071 File Clerks 43-4081 Hotel, Motel, and Resort Desk Clerks 43-4111 Interviewers, Except Eligibility and Loan 43-4121 Library Assistants, Clerical 43-4131 Loan Interviewers and Clerks 43-4141 New Accounts Clerks 43-4151 Order Clerks 43-4161 Human Resources Assistants, Except Payroll and Timekeeping 43-4171 Receptionists and Information Clerks 43-4181 Reservation and Transportation Ticket
Agents and Travel Clerks 43-5011 Cargo and Freight Agents 43-5021 Couriers and Messengers 43-5030 Dispatchers 43-5031 Police, Fire, and Ambulance Dispatchers 43-5032 Dispatchers, Except Police, Fire, and Ambulance 43-5041 Meter Readers, Utilities 43-5061 Production, Planning, and Expediting Clerks 43-5071 Shipping, Receiving, and Traffic Clerks 43-5081 Stock Clerks and Order Fillers 43-5111 Weighers, Measurers, Checkers, and Samplers, Recordkeeping 43-6010 Secretaries and Administrative Assistants 43-6011 Executive Secretaries and Administrative
Assistants 43-6012 Legal Secretaries 43-6013 Medical Secretaries 43-6014 Secretaries, Except Legal, Medical, and Executive 43-9011 Computer Operators 43-9020 Data Entry and Information Processing
Workers 43-9021 Data Entry Keyers 43-9022 Word Processors and Typists 43-9031 Desktop Publishers 43-9041 Insurance Claims and Policy Processing
Clerks 43-9051 Mail Clerks and Mail Machine Operators,
Except Postal Service 43-9061 Office Clerks, General 43-9071 Office Machine Operators, Except Computer 43-9081 Proofreaders and Copy Markers 43-9111 Statistical Assistants
45-0000 Farming, Fishing, and Forestry Occupations 45-1011 First-Line Supervisors/Managers of Farming,
Fishing, and Forestry Workers 45-2011 Agricultural Inspectors 45-2021 Animal Breeders 45-2041 Graders and Sorters, Agricultural Products 45-2090 Miscellaneous Agricultural Workers 45-2091 Agricultural Equipment Operators 45-2092 Farmworkers and Laborers, Crop, Nursery,
and Greenhouse 45-2093 Farmworkers, Farm and Ranch Animals 45-3011 Fishers and Related Fishing Workers 45-3021 Hunters and Trappers 45-4011 Forest and Conservation Workers 45-4020 Logging Workers 45-4021 Fallers 45-4022 Logging Equipment Operators 45-4023 Log Graders and Scalers 47-0000 Construction and Extraction Occupations 47-1011 First-Line Supervisors/Managers of Construction Trades and Extraction Workers 47-2011 Boilermakers 47-2020 Brickmasons, Blockmasons, and Stonemasons 47-2021 Brickmasons and Blockmasons 47-2022 Stonemasons 47-2031 Carpenters 47-2040 Carpet, Floor, and Tile Installers and Finishers 47-2041 Carpet Installers 47-2042 Floor Layers, Except Carpet, Wood, and
Hard Tiles 47-2043 Floor Sanders and Finishers 47-2044 Tile and Marble Setters 47-2050 Cement Masons, Concrete Finishers, and
Terrazzo Workers 47-2051 Cement Masons and Concrete Finishers 47-2053 Terrazzo Workers and Finishers 47-2061 Construction Laborers 47-2070 Construction Equipment Operators 47-2071 Paving, Surfacing, and Tamping Equipment
Operators 47-2072 Pile-Driver Operators 47-2073 Operating Engineers and Other Construction
Equipment Operators 47-2080 Drywall Installers, Ceiling Tile Installers,
and Tapers 47-2081 Drywall and Ceiling Tile Installers 47-2082 Tapers 47-2111 Electricians 47-2121 Glaziers

B-9
47-2130 Insulation Workers 47-2131 Insulation Workers, Floor, Ceiling, and Wall 47-2132 Insulation Workers, Mechanical 47-2140 Painters and Paperhangers 47-2141 Painters, Construction and Maintenance 47-2142 Paperhangers 47-2150 Pipelayers, Plumbers, Pipefitters, and Steamfitters 47-2151 Pipelayers 47-2152 Plumbers, Pipefitters, and Steamfitters 47-2161 Plasterers and Stucco Masons 47-2171 Reinforcing Iron and Rebar Workers 47-2181 Roofers 47-2211 Sheet Metal Workers 47-2221 Structural Iron and Steel Workers 47-3010 Helpers, Construction Trades 47-3011 Helpers--Brickmasons, Blockmasons,
Stonemasons, and Tile and Marble Setters 47-3012 Helpers--Carpenters 47-3013 Helpers--Electricians 47-3014 Helpers--Painters, Paperhangers, Plasterers,
and Stucco Masons 47-3015 Helpers--Pipelayers, Plumbers, Pipefitters,
and Steamfitters 47-3016 Helpers--Roofers 47-4011 Construction and Building Inspectors 47-4021 Elevator Installers and Repairers 47-4031 Fence Erectors 47-4041 Hazardous Materials Removal Workers 47-4051 Highway Maintenance Workers 47-4061 Rail-Track Laying and Maintenance Equipment Operators 47-4071 Septic Tank Servicers and Sewer Pipe
Cleaners 47-4090 Miscellaneous Construction and Related
Workers 47-4091 Segmental Pavers 47-5010 Derrick, Rotary Drill, and Service Unit Operators, Oil, Gas, and Mining 47-5011 Derrick Operators, Oil and Gas 47-5012 Rotary Drill Operators, Oil and Gas 47-5013 Service Unit Operators, Oil, Gas, and Mining 47-5021 Earth Drillers, Except Oil and Gas 47-5031 Explosives Workers, Ordnance Handling
Experts, and Blasters 47-5040 Mining Machine Operators 47-5041 Continuous Mining Machine Operators 47-5042 Mine Cutting and Channeling Machine Operators 47-5051 Rock Splitters, Quarry 47-5061 Roof Bolters, Mining 47-5071 Roustabouts, Oil and Gas 47-5081 Helpers--Extraction Workers
49-0000 Installation, Maintenance, and Repair Occupations
49-1011 First-Line Supervisors/Managers of Mechanics, Installers, and Repairers 49-2011 Computer, Automated Teller, and Office
Machine Repairers 49-2020 Radio and Telecommunications Equipment
Installers and Repairers 49-2021 Radio Mechanics 49-2022 Telecommunications Equipment Installers
and Repairers, Except Line Installers 49-2090 Miscellaneous Electrical and Electronic
Equipment Mechanics, Installers, and Repairers 49-2091 Avionics Technicians 49-2092 Electric Motor, Power Tool, and Related
Repairers 49-2093 Electrical and Electronics Installers and Repairers, Transportation Equipment 49-2094 Electrical and Electronics Repairers, Commercial and Industrial Equipment 49-2095 Electrical and Electronics Repairers, Powerhouse, Substation, and Relay 49-2096 Electronic Equipment Installers and Repairers, Motor Vehicles 49-2097 Electronic Home Entertainment Equipment
Installers and Repairers 49-2098 Security and Fire Alarm Systems Installers 49-3011 Aircraft Mechanics and Service Technicians 49-3020 Automotive Technicians and Repairers 49-3021 Automotive Body and Related Repairers 49-3022 Automotive Glass Installers and Repairers 49-3023 Automotive Service Technicians and Mechanics 49-3031 Bus and Truck Mechanics and Diesel Engine
Specialists 49-3040 Heavy Vehicle and Mobile Equipment Service Technicians and Mechanics 49-3041 Farm Equipment Mechanics 49-3042 Mobile Heavy Equipment Mechanics, Except Engines 49-3043 Rail Car Repairers 49-3050 Small Engine Mechanics 49-3051 Motorboat Mechanics 49-3052 Motorcycle Mechanics 49-3053 Outdoor Power Equipment and Other Small
Engine Mechanics 49-3090 Miscellaneous Vehicle and Mobile Equipment Mechanics, Installers, and Repairers 49-3091 Bicycle Repairers 49-3092 Recreational Vehicle Service Technicians 49-3093 Tire Repairers and Changers 49-9010 Control and Valve Installers and Repairers

B-10
49-9011 Mechanical Door Repairers 49-9012 Control and Valve Installers and Repairers,
Except Mechanical Door 49-9021 Heating, Air Conditioning, and Refrigeration
Mechanics and Installers 49-9031 Home Appliance Repairers 49-9040 Industrial Machinery Installation, Repair,
and Maintenance Workers 49-9041 Industrial Machinery Mechanics 49-9042 Maintenance and Repair Workers, General 49-9043 Maintenance Workers, Machinery 49-9044 Millwrights 49-9045 Refractory Materials Repairers, Except
Brickmasons 49-9050 Line Installers and Repairers 49-9051 Electrical Power-Line Installers and Repairers 49-9052 Telecommunications Line Installers and Repairers 49-9060 Precision Instrument and Equipment Repairers 49-9061 Camera and Photographic Equipment Repairers 49-9062 Medical Equipment Repairers 49-9063 Musical Instrument Repairers and Tuners 49-9064 Watch Repairers 49-9090 Miscellaneous Installation, Maintenance, and
Repair Workers 49-9091 Coin, Vending, and Amusement Machine
Servicers and Repairers 49-9092 Commercial Divers 49-9093 Fabric Menders, Except Garment 49-9094 Locksmiths and Safe Repairers 49-9095 Manufactured Building and Mobile Home
Installers 49-9096 Riggers 49-9097 Signal and Track Switch Repairers 49-9098 Helpers--Installation, Maintenance, and Repair Workers 51-0000 Production Occupations 51-1011 First-Line Supervisors/Managers of Production and Operating Workers 51-2011 Aircraft Structure, Surfaces, Rigging, and
Systems Assemblers 51-2020 Electrical, Electronics, and Electromechanical Assemblers 51-2021 Coil Winders, Tapers, and Finishers 51-2022 Electrical and Electronic Equipment Assemblers 51-2023 Electromechanical Equipment Assemblers 51-2031 Engine and Other Machine Assemblers 51-2041 Structural Metal Fabricators and Fitters 51-2090 Miscellaneous Assemblers and Fabricators
51-2091 Fiberglass Laminators and Fabricators 51-2092 Team Assemblers 51-2093 Timing Device Assemblers, Adjusters, and
Calibrators 51-3011 Bakers 51-3020 Butchers and Other Meat, Poultry, and Fish
Processing Workers 51-3021 Butchers and Meat Cutters 51-3022 Meat, Poultry, and Fish Cutters and Trimmers 51-3023 Slaughterers and Meat Packers 51-3090 Miscellaneous Food Processing Workers 51-3091 Food and Tobacco Roasting, Baking, and
Drying Machine Operators and Tenders 51-3092 Food Batchmakers 51-3093 Food Cooking Machine Operators and Tenders 51-4010 Computer Control Programmers and Operators 51-4011 Computer-Controlled Machine Tool Operators, Metal and Plastic 51-4012 Numerical Tool and Process Control Programmers 51-4020 Forming Machine Setters, Operators, and
Tenders, Metal and Plastic 51-4021 Extruding and Drawing Machine Setters,
Operators, and Tenders, Metal and Plastic 51-4022 Forging Machine Setters, Operators, and
Tenders, Metal and Plastic 51-4023 Rolling Machine Setters, Operators, and
Tenders, Metal and Plastic 51-4030 Machine Tool Cutting Setters, Operators,
and Tenders, Metal and Plastic 51-4031 Cutting, Punching, and Press Machine
Setters, Operators, and Tenders, Metal and Plastic
51-4032 Drilling and Boring Machine Tool Setters, Operators, and Tenders, Metal and Plastic
51-4033 Grinding, Lapping, Polishing, and Buffing Machine Tool Setters, Operators, and
Tenders, Metal and Plastic 51-4034 Lathe and Turning Machine Tool Setters,
Operators, and Tenders, Metal and Plastic 51-4035 Milling and Planing Machine Setters, Operators, and Tenders, Metal and Plastic 51-4041 Machinists 51-4050 Metal Furnace and Kiln Operators and Tenders 51-4051 Metal-Refining Furnace Operators and Tenders 51-4052 Pourers and Casters, Metal 51-4060 Model Makers and Patternmakers, Metal and
Plastic 51-4061 Model Makers, Metal and Plastic

B-11
51-4062 Patternmakers, Metal and Plastic 51-4070 Molders and Molding Machine Setters, Operators, and Tenders, Metal and Plastic 51-4071 Foundry Mold and Coremakers 51-4072 Molding, Coremaking, and Casting Machine
Setters, Operators, and Tenders, Metal and Plastic
51-4081 Multiple Machine Tool Setters, Operators, and Tenders, Metal and Plastic
51-4111 Tool and Die Makers 51-4120 Welding, Soldering, and Brazing Workers 51-4121 Welders, Cutters, Solderers, and Brazers 51-4122 Welding, Soldering, and Brazing Machine
Setters, Operators, and Tenders 51-4190 Miscellaneous Metalworkers and Plastic
Workers 51-4191 Heat Treating Equipment Setters, Operators,
and Tenders, Metal and Plastic 51-4192 Lay-Out Workers, Metal and Plastic 51-4193 Plating and Coating Machine Setters, Operators, and Tenders, Metal and Plastic 51-4194 Tool Grinders, Filers, and Sharpeners 51-5010 Bookbinders and Bindery Workers 51-5011 Bindery Workers 51-5012 Bookbinders 51-5020 Printers 51-5021 Job Printers 51-5022 Prepress Technicians and Workers 51-5023 Printing Machine Operators 51-6011 Laundry and Dry-Cleaning Workers 51-6021 Pressers, Textile, Garment, and Related Materials 51-6031 Sewing Machine Operators 51-6040 Shoe and Leather Workers 51-6041 Shoe and Leather Workers and Repairers 51-6042 Shoe Machine Operators and Tenders 51-6050 Tailors, Dressmakers, and Sewers 51-6051 Sewers, Hand 51-6052 Tailors, Dressmakers, and Custom Sewers 51-6060 Textile Machine Setters, Operators, and
Tenders 51-6061 Textile Bleaching and Dyeing Machine Operators and Tenders 51-6062 Textile Cutting Machine Setters, Operators,
and Tenders 51-6063 Textile Knitting and Weaving Machine Setters, Operators, and Tenders 51-6064 Textile Winding, Twisting, and Drawing Out
Machine Setters, Operators, and Tenders 51-6090 Miscellaneous Textile, Apparel, and Furnishings Workers 51-6091 Extruding and Forming Machine Setters,
Operators, and Tenders, Synthetic and Glass Fibers
51-6092 Fabric and Apparel Patternmakers 51-6093 Upholsterers 51-7011 Cabinetmakers and Bench Carpenters 51-7021 Furniture Finishers 51-7030 Model Makers and Patternmakers, Wood 51-7031 Model Makers, Wood 51-7032 Patternmakers, Wood 51-7040 Woodworking Machine Setters, Operators,
and Tenders 51-7041 Sawing Machine Setters, Operators, and
Tenders, Wood 51-7042 Woodworking Machine Setters, Operators,
and Tenders, Except Sawing 51-8010 Power Plant Operators, Distributors, and
Dispatchers 51-8011 Nuclear Power Reactor Operators 51-8012 Power Distributors and Dispatchers 51-8013 Power Plant Operators 51-8021 Stationary Engineers and Boiler Operators 51-8031 Water and Liquid Waste Treatment Plant
and System Operators 51-8090 Miscellaneous Plant and System Operators 51-8091 Chemical Plant and System Operators 51-8092 Gas Plant Operators 51-8093 Petroleum Pump System Operators, Refinery
Operators, and Gaugers 51-9010 Chemical Processing Machine Setters, Operators, and Tenders 51-9011 Chemical Equipment Operators and Tenders 51-9012 Separating, Filtering, Clarifying, Precipitating, and Still Machine Setters, Operators, and Tenders 51-9020 Crushing, Grinding, Polishing, Mixing, and
Blending Workers 51-9021 Crushing, Grinding, and Polishing Machine
Setters, Operators, and Tenders 51-9022 Grinding and Polishing Workers, Hand 51-9023 Mixing and Blending Machine Setters, Operators, and Tenders 51-9030 Cutting Workers 51-9031 Cutters and Trimmers, Hand 51-9032 Cutting and Slicing Machine Setters, Operators, and Tenders 51-9041 Extruding, Forming, Pressing, and
Compacting Machine Setters, Operators, and Tenders
51-9051 Furnace, Kiln, Oven, Drier, and Kettle Operators and Tenders 51-9061 Inspectors, Testers, Sorters, Samplers, and
Weighers 51-9071 Jewelers and Precious Stone and Metal
Workers 51-9080 Medical, Dental, and Ophthalmic Laboratory
Technicians
B-12
51-9081 Dental Laboratory Technicians 51-9082 Medical Appliance Technicians 51-9083 Ophthalmic Laboratory Technicians 51-9111 Packaging and Filling Machine Operators
and Tenders 51-9120 Painting Workers 51-9121 Coating, Painting, and Spraying Machine
Setters, Operators, and Tenders 51-9122 Painters, Transportation Equipment 51-9123 Painting, Coating, and Decorating Workers 51-9130 Photographic Process Workers and Processing Machine Operators 51-9131 Photographic Process Workers 51-9132 Photographic Processing Machine Operators 51-9141 Semiconductor Processors 51-9190 Miscellaneous Production Workers 51-9191 Cementing and Gluing Machine Operators
and Tenders 51-9192 Cleaning, Washing, and Metal Pickling
Equipment Operators and Tenders 51-9193 Cooling and Freezing Equipment Operators
and Tenders 51-9194 Etchers and Engravers 51-9195 Molders, Shapers, and Casters, Except Metal
and Plastic 51-9196 Paper Goods Machine Setters, Operators,
and Tenders 51-9197 Tire Builders 51-9198 Helpers--Production Workers 53-0000 Transportation and Material Moving Occupations 53-1011 Aircraft Cargo Handling Supervisors 53-1021 First-Line Supervisors/Managers of Helpers,
Laborers, and Material Movers, Hand 53-1031 First-Line Supervisors/Managers of Transportation and Material-Moving Machine and Vehicle Operators 53-2010 Aircraft Pilots and Flight Engineers 53-2011 Airline Pilots, Copilots, and Flight Engineers 53-2012 Commercial Pilots 53-2020 Air Traffic Controllers and Airfield Operations Specialists 53-2021 Air Traffic Controllers 53-2022 Airfield Operations Specialists 53-3011 Ambulance Drivers and Attendants, Except
Emergency Medical Technicians 53-3020 Bus Drivers 53-3021 Bus Drivers, Transit and Intercity 53-3022 Bus Drivers, School
53-3030 Driver/Sales Workers and Truck Drivers 53-3031 Driver/Sales Workers 53-3032 Truck Drivers, Heavy and Tractor-Trailer 53-3033 Truck Drivers, Light or Delivery Services 53-3041 Taxi Drivers and Chauffeurs 53-4010 Locomotive Engineers and Operators 53-4011 Locomotive Engineers 53-4012 Locomotive Firers 53-4013 Rail Yard Engineers, Dinkey Operators, and Hostlers 53-4021 Railroad Brake, Signal, and Switch Operators 53-4031 Railroad Conductors and Yardmasters 53-4041 Subway and Streetcar Operators 53-5011 Sailors and Marine Oilers 53-5020 Ship and Boat Captains and Operators 53-5021 Captains, Mates, and Pilots of Water Vessels 53-5022 Motorboat Operators 53-5031 Ship Engineers 53-6011 Bridge and Lock Tenders 53-6021 Parking Lot Attendants 53-6031 Service Station Attendants 53-6041 Traffic Technicians 53-6051 Transportation Inspectors 53-7011 Conveyor Operators and Tenders 53-7021 Crane and Tower Operators 53-7030 Dredge, Excavating, and Loading Machine
Operators 53-7031 Dredge Operators 53-7032 Excavating and Loading Machine and Dragline Operators 53-7033 Loading Machine Operators, Underground
Mining 53-7041 Hoist and Winch Operators 53-7051 Industrial Truck and Tractor Operators 53-7060 Laborers and Material Movers, Hand 53-7061 Cleaners of Vehicles and Equipment 53-7062 Laborers and Freight, Stock, and Material
Movers, Hand 53-7063 Machine Feeders and Offbearers 53-7064 Packers and Packagers, Hand 53-7070 Pumping Station Operators 53-7071 Gas Compressor and Gas Pumping Station
Operators 53-7072 Pump Operators, Except Wellhead Pumpers 53-7073 Wellhead Pumpers 53-7081 Refuse and Recyclable Material Collectors 53-7111 Shuttle Car Operators 53-7121 Tank Car, Truck, and Ship Loaders