Embed Size (px)
Citation preview

Citation: Bach A, Ogunbowale L, Kotecha A and Spratt A. Do Subjective and Objective Indices of Disease Severity Correlate with Perceived Disability in New Glaucoma Referrals?. Austin J Clin Ophthalmol. 2015;2(3): 1052.
Austin J Clin Ophthalmol - Volume 2 Issue 3 - 2015ISSN : 2381-9162 | www.austinpublishinggroup.com Spratt et al. © All rights are reserved
Austin Journal of Clinical OphthalmologyOpen Access
Abstract
Purpose/Aim: To assess the relationship between newly referred glaucoma patients’ perceived visual disability, visual field parameters of disease severity and an objective index of disease severity derived from scanning laser polarimetry.
Materials/Methods: This is a prospective case series with newly diagnosed and treatment naïve new glaucoma-clinic patients. Self-reported visual disability was assessed using the vision-specific National Eye Institute Visual Function Questionnaire (NEIVFQ-25) and the glaucoma-specific Viswanathan (Vis-Q) questionnaire.. Standard automated perimetry provided psychophysical indices of disease severity, including Mean Deviation (MD) scores and binocular Integrated Visual Field (IVF) scores using Progressor software. Objective, structural measures of the optic nerve and peripapillary retinal nerve fiber layer were made using the scanning laser polarimeter from which the nerve fiber index value was used as an index of disease severity, both monocularly and by binocular summation.
Correlations between questionnaire responses, visual field indices and objective structural indices were assessed using Spearman’s rank correlation coefficient.
Results: Seventy five patients were eligible the study. Monocular and binocular visual field indices showed weak correlations with self-reported questionnaire scores (Spearman’s rho: NEIVFQ-25 ‘worse’ eye MD r=0.23, p=0.05, IVF score r=-0.16, p=0.19; Vis-Q ‘better’ eye MD r=0.30, p=0.009, IVF r=-0.24, p=0.04). Neither monocular nor binocular objective structural indices of glaucoma damage correlated with self-reported questionnaire scores.
Conclusions: Visual field indices show weak correlations with patients’ perceived visual disability. Objective, structural measures of glaucoma severity at the optic nerve do not correlate with patients’ perceived visual disability. Designing wholly objective modes of self-assessment that yield information about patients’ experiences remains an important, but necessary challenge for early diagnosis and treatment of glaucoma.
Keywords: Glaucoma; Patient-reported outcomes; Visual fields; Nerve fiber index
IntroductionGlaucoma is a progressive optic neuropathy that results in
characteristic morphological changes in the Optic Nerve Head (ONH) and Retinal Nerve Fiber Layer (RNFL) as well as corresponding defects within the Visual Field (VF) [1]. Glaucoma is the leading cause of irreversible blindness worldwide [2], and is becoming more prevalent as life expectancy increases [3]. The condition is considered to be asymptomatic in its early stages due to the mid-peripheral location of defects in the VF in addition to preservation of the central VF and Visual Acuity (VA) until its more advanced stages.
Typically, clinical measures of ONH structure and function, such as visual fields, and RNFL thickness, as well as Intraocular Pressure (IOP) are used to diagnose the condition and monitor its
Research Article
Do Subjective and Objective Indices of Disease Severity Correlate with Perceived Disability in New Glaucoma Referrals?Bach A1, Ogunbowale L2, Kotecha A2 and Spratt A1*1Department of Ophthalmology, Nova Southeastern University, Larkin Community Hospital, Beraja Medical Institute Coral Gables, USA2NIHR Biomedical Research Centre for Ophthalmology, Moorfields Eye Hospital NHS Foundation Trust and UCL Institute of Ophthalmology, UK
*Corresponding author: Alexander Spratt, Department of Ophthalmology, Nova Southeastern University, Larkin Community Hospital, Beraja Medical Institute Coral Gables, 2550 S Douglas Rd, Coral Gables, Florida, 33134, USA
Received: March 19, 2015; Accepted: June 30, 2015; Published: July 07, 2015
progression. These measures provide the clinician with information regarding patient prognosis and management requirements, but they are clinician-based measures of disease severity, and as such probably provide little indication of the true level of patients’ ‘functional ability’ and hence their vision-related quality of life (QoL).
Previous studies have examined the relationship between automated VF parameters of glaucoma patients with their responses to questionnaires that self-assess perceived visual disability. Some authors report a modest association between perceived visual disability and the severity of binocular VF loss [4-6], others report only weak correlations [7,8]. These differences may be explained by the use of assorted questionnaires to quantify perceived visual disability and by inadequacies of the widely employed Esterman binocular VF test strategy when used to assess patients with mild and moderate

Austin J Clin Ophthalmol 2(3): id1052 (2015) - Page - 02
Spratt A Austin Publishing Group
Submit your Manuscript | www.austinpublishinggroup.com
degrees of glaucomatous VF loss. Other confounding factors may be related to glaucoma-independent causes of poor automated VF performance such as poor understanding of what the test requires, poor concentration and reduced manual dexterity. Combined with the phenomenon of short-term intra-test variability of automated VF performance in glaucoma patients these factors add to the relative subjectivity of this psychophysical test [9].
Structural evaluation of the ONH and RNFL has been the subject of technological advances in recent years. Compared with VF testing, ONH and RNFL technologies offer great potential for precise, quantitative and more objective assessments of disease stage and progression. The scanning laser polarimeter (SLP) is one such device with high sensitivity in the detection of glaucomatous RNFL defects [10,11] and it has support for its use in the screening of glaucoma suspects [12]. The commercially available SLP, the GDx (GDx ECC; Carl Zeiss Meditec Inc., Dublin, California, USA) provides an overall nerve fiber index (NFI) score. This score is indicative of the percentage likelihood that an optic nerve is glaucomatous based on how far its analysis deviates from the normative database. A recent study showed a positive correlation between RNFL thickness and the National Eye Institute Visual Function Questionnaire (NEIVFQ-25) [13]. Perceived visual disability is an extremely important aspect of glaucoma as it may be able to give the clinician a better insight into early progression of the disease.
Accordingly, the purpose of this study is to examine how patients’ own perceived level of visual disability is associated with VF parameters indicative of glaucoma severity and an objective measure of glaucoma severity derived using RNFL imaging technology for newly diagnosed patients. The goal is to be able to have an easy to perform, at home test to help patients realize that they may be having symptoms of glaucoma and to see an eye care professional. We tested the hypothesis that the NEIVFQ-25 would be able to accurately associate perceived visual function with clinical measurements.
MethodsWe chose to study a cohort of newly referred patients in order
to remove the potential impact of diagnosis itself on questionnaire responses obtained. Patients attending the Glaucoma Service at Moorfields Eye Hospital, London, between November 2006 and January 2007 were invited to participate. Patients attending the clinic were a mixture of external tertiary referrals, referrals from other departments within the hospital and optometrist or general-practitioner initiated referrals. Only patients with no prior ophthalmologist diagnosis of glaucoma were eligible for this study.
To be included in the study all patients were required to be native English speakers and have a best corrected Snellen VA of 6/12 or better in each eye. Patients with ocular co-morbdities other than glaucoma were excluded, although the presence of mild cataract was not an exclusion criterion. The inclusion level for Snellen VA was chosen to help prevent the inclusion of patients with significant cataract. Local research ethics committee approval was obtained prior to commencement of the study and informed consent, according to the tenets of the Declaration of Helsinki, was obtained prior to examination from each subject.
Measurement of perceived visual disabilityMany different patient-reported outcome questionnaires exist
to assess the impact of disease on patients’ perceived general well-being and ability to perform multiple tasks of daily living. Vision-specific questionnaires evaluate the impact of eye disease in terms of symptoms, social and physical functioning and the general and mental health perceptions of patients. Surveys were completed by patients, without supervision, prior to seeing an ophthalmologist.
Global ophthalmic functionThe 25 question National Eye Institute Visual Function
Questionnaire (NEIVFQ-25) is a validated, generic questionnaire designed to measure the impact of ophthalmic disease on patients’ functional ability [14,15]. The NEIVFQ-25 scores range from 0–100; lower scores indicate poorer ability [5,8,16-18].
Glaucoma statusGlaucoma-specific questionnaires take a disease specific approach
with the aim of better understanding and quantifying the functional ability of glaucoma patients. The Viswanathan questionnaire (Vis-Q) [4], modified from that of Drance [19], asks 10 questions about such things as finding dropped objects, difficulty with stairs and dark adaptation with a forced binary ‘yes’ or ‘no’ response. Previous research has demonstrated its correlations with VF parameters [20] but it has not been validated formally. For this study, Vis-Q scores were inverted to be comparable with those of the NEIVFQ-25, such that lower scores indicate a greater difficulty with tasks and a poorer perceived functional ability.
Clinical measures of disease severity: visual field assessment
All patients underwent Humphrey Fields Analyser (HFA; Zeiss
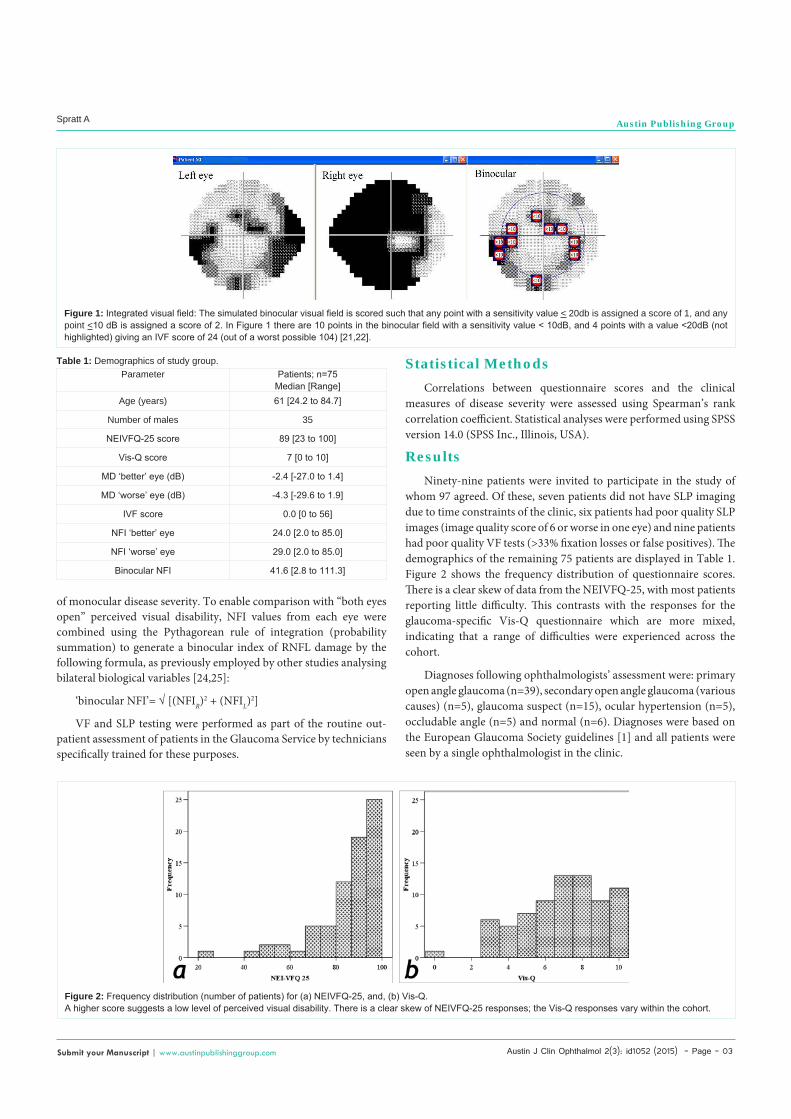
Humphrey Systems, Dublin, California, USA) testing using the SITA standard threshold 24-2 test strategy. Mean Deviation (MD) scores were recorded for each eye as an index of monocular disease severity. To be included in the data analysis, patients had to display reliable visual field tests, defined as < 33% fixation losses and false positive tests. A binocular visual field score was generated using the Integrated Visual Field (IVF) function of Progressor software (Moorfields Eye Hospital, London, UK / Medisoft Ltd., Leeds, UK) which integrates raw, point-by-point sensitivity data from each monocular HFA to produce a simulated binocular visual field in which patients’ best sensitivity at each corresponding location of the central 24° of visual field is displayed and scored (Figure 1) [21].
Clinical measures of disease severity: optic nerve head assessment
The GDx ECC SLP was used to provide an objective, structural measure of glaucoma severity by measurement of the peripapillary RNFL thickness. To be included in the study, patients’ images had to have an image quality score of 7 or greater (on a range of 0 to 10, where 10 represents ideal quality image). This inclusion criterion acted as a further, indirect, control of visually significant cataract that may have otherwise influenced questionnaire responses. The enhanced corneal compensation (ECC) algorithm is more sensitive than previous SLP algorithms at detecting early glaucomatous change [22]. The NFI, a discriminating software-derived summary parameter of peripapillary nerve fibre layer thickness [23] was used as a marker
Austin J Clin Ophthalmol 2(3): id1052 (2015) - Page - 03
Spratt A Austin Publishing Group
Submit your Manuscript | www.austinpublishinggroup.com
of monocular disease severity. To enable comparison with “both eyes open” perceived visual disability, NFI values from each eye were combined using the Pythagorean rule of integration (probability summation) to generate a binocular index of RNFL damage by the following formula, as previously employed by other studies analysing bilateral biological variables [24,25]:
‘binocular NFI’= √ [(NFIR)2 + (NFIL)
2]
VF and SLP testing were performed as part of the routine out-patient assessment of patients in the Glaucoma Service by technicians specifically trained for these purposes.
Statistical MethodsCorrelations between questionnaire scores and the clinical
measures of disease severity were assessed using Spearman’s rank correlation coefficient. Statistical analyses were performed using SPSS version 14.0 (SPSS Inc., Illinois, USA).
ResultsNinety-nine patients were invited to participate in the study of
whom 97 agreed. Of these, seven patients did not have SLP imaging due to time constraints of the clinic, six patients had poor quality SLP images (image quality score of 6 or worse in one eye) and nine patients had poor quality VF tests (>33% fixation losses or false positives). The demographics of the remaining 75 patients are displayed in Table 1. Figure 2 shows the frequency distribution of questionnaire scores. There is a clear skew of data from the NEIVFQ-25, with most patients reporting little difficulty. This contrasts with the responses for the glaucoma-specific Vis-Q questionnaire which are more mixed, indicating that a range of difficulties were experienced across the cohort.
Diagnoses following ophthalmologists’ assessment were: primary open angle glaucoma (n=39), secondary open angle glaucoma (various causes) (n=5), glaucoma suspect (n=15), ocular hypertension (n=5), occludable angle (n=5) and normal (n=6). Diagnoses were based on the European Glaucoma Society guidelines [1] and all patients were seen by a single ophthalmologist in the clinic.
Figure 1: Integrated visual field: The simulated binocular visual field is scored such that any point with a sensitivity value < 20db is assigned a score of 1, and any point <10 dB is assigned a score of 2. In Figure 1 there are 10 points in the binocular field with a sensitivity value < 10dB, and 4 points with a value <20dB (not highlighted) giving an IVF score of 24 (out of a worst possible 104) [21,22].
Parameter Patients; n=75Median [Range]
Age (years) 61 [24.2 to 84.7]
Number of males 35
NEIVFQ-25 score 89 [23 to 100]
Vis-Q score 7 [0 to 10]
MD ‘better’ eye (dB) -2.4 [-27.0 to 1.4]
MD ‘worse’ eye (dB) -4.3 [-29.6 to 1.9]
IVF score 0.0 [0 to 56]
NFI ‘better’ eye 24.0 [2.0 to 85.0]
NFI ‘worse’ eye 29.0 [2.0 to 85.0]
Binocular NFI 41.6 [2.8 to 111.3]
Table 1: Demographics of study group.
Figure 2: Frequency distribution (number of patients) for (a) NEIVFQ-25, and, (b) Vis-Q.A higher score suggests a low level of perceived visual disability. There is a clear skew of NEIVFQ-25 responses; the Vis-Q responses vary within the cohort.

Austin J Clin Ophthalmol 2(3): id1052 (2015) - Page - 04
Spratt A Austin Publishing Group
Submit your Manuscript | www.austinpublishinggroup.com
Perceived visual disability and visual field parametersAnalysis of overall NEIVFQ-25 score with monocular MD values
revealed a weak correlation between higher levels of perceived visual disability and worse MD values (Spearman’s rho: ‘better’ eye r=0.19, p=0.12; ‘worse’ eye r=0.23, p=0.05; Figure 3). A slightly stronger correlation was seen between poorer scores in the glaucoma-specific Vis-Q questionnaire and worse monocular MD values (Spearman’s rho: ‘better’ eye r=0.30, p=0.009; ‘worse’ eye r=0.28, p=0.014; Figure 4).
There was a weak correlation between poorer questionnaire scores and worse binocular IVF scores (Spearman’s rho: NEIVFQ-25 r=-0.16, p=0.19; Vis-Q r=-0.24, p=0.04; Figure 4).
A feature of this dataset is that patients predominantly had early VF defects as illustrated by the low MD scores, and that the majority of patients had an IVF score of zero (n=52, 69%), indicating no binocular overlapping VF defect.
Perceived visual disability and optic disc parametersPatients exhibited a wide range of NFI scores but there was no
correlation between questionnaire responses and monocular NFI scores (Spearman’s rho: NEIVFQ-25: ‘better’ eye r=0.15, p=0.22, ‘worse’ eye r=0.09, p=0.43; Vis-Q: ‘better’ eye r=-0.07, p=0.57, ‘worse’
eye r=-0.13, p=0.28; Figure 5A), or binocular NFI score (Spearman’s rho: NEIVFQ-25 r=0.14, p=0.23; Vis-Q r=-0.09, p=0.44; Figure 5B).
NEIVFQ-25 subscale analysisIn addition to generating an overall composite score, the
NEIVFQ-25 questions are also grouped into 12 sub-scales to allow further analyses. Subscale analyses showed that in this cohort of patients worsening monocular MD values or binocular IVF scores were associated with greater reported problems in the ‘general vision’, ‘distance activities’ and ‘peripheral vision’ domains (Table 2). Counter intuitively, reduced ‘role difficulty’ was associated with a worse NFI score. Graphical inspection suggests this may be the result of a small number of outliers skewing the relationship (Figure 6).
DiscussionThis cohort of mixed, predominantly early glaucoma and glaucoma
suspect patients, generally had early monocular VF loss, with the majority (69%) having no overlapping VF defect. There was a weak correlation between perceived visual disability and psychophysical VF indices of disease severity. The correlations between VF indices and perceived visual disability were stronger when reported via the glaucoma-specific Vis-Q questionnaire than the more general, vision-specific NEIVFQ-25. This is likely to represent the relative strength of
Figure 3: Monocular MD values versus (a) NEIVFQ-25 scores, and, (b) Vis-Q scores.Key: open circles = better eye, filled circles = worse eye.NEIVFQ-25 ‘better’ eye r = 0.19, p=0.12, ’worse’ eye r = 0.23, p=0.05; Vis-Q ‘better’ eye ‘r’ = 0.30, p=0.009, ‘worse’ eye r = 0.28, p=0.014. Patients had predominantly early VF loss, illustrated by the low MD scores.
Figure 4: Binocular IVF score versus (a) NEIVFQ-25 scores, and, (b) Vis-Q scores.NEIVFQ-25 r=-0.16, p=0.19; Vis-Q r=-0.24, p=0.04. Patients predominantly had little or no overlapping VF loss, illustrated by the low IVF scores.
Austin J Clin Ophthalmol 2(3): id1052 (2015) - Page - 05
Spratt A Austin Publishing Group
Submit your Manuscript | www.austinpublishinggroup.com
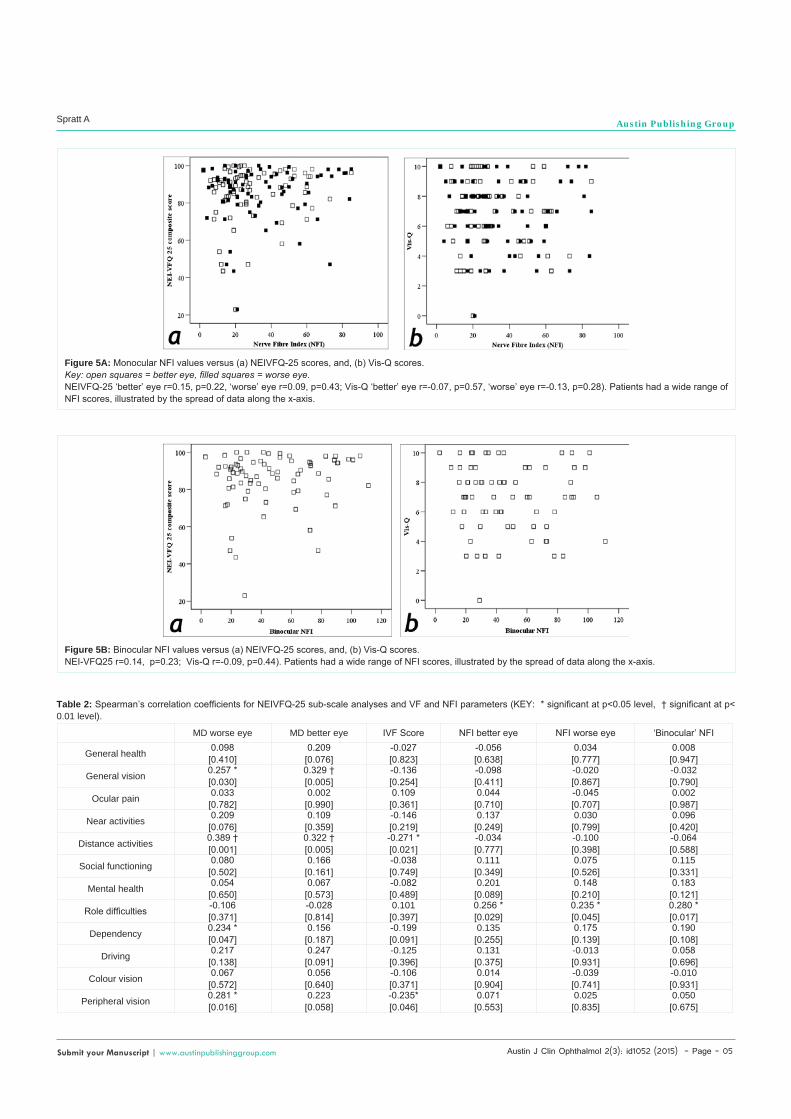
Figure 5A: Monocular NFI values versus (a) NEIVFQ-25 scores, and, (b) Vis-Q scores.Key: open squares = better eye, filled squares = worse eye.NEIVFQ-25 ‘better’ eye r=0.15, p=0.22, ‘worse’ eye r=0.09, p=0.43; Vis-Q ‘better’ eye r=-0.07, p=0.57, ‘worse’ eye r=-0.13, p=0.28). Patients had a wide range of NFI scores, illustrated by the spread of data along the x-axis.
Figure 5B: Binocular NFI values versus (a) NEIVFQ-25 scores, and, (b) Vis-Q scores.NEI-VFQ25 r=0.14, p=0.23; Vis-Q r=-0.09, p=0.44). Patients had a wide range of NFI scores, illustrated by the spread of data along the x-axis.
MD worse eye MD better eye IVF Score NFI better eye NFI worse eye ‘Binocular’ NFI
General health 0.098[0.410]
0.209[0.076]
-0.027[0.823]
-0.056[0.638]
0.034[0.777]
0.008[0.947]
General vision 0.257 *[0.030]
0.329 †[0.005]
-0.136[0.254]
-0.098[0.411]
-0.020[0.867]
-0.032[0.790]
Ocular pain 0.033[0.782]
0.002[0.990]
0.109[0.361]
0.044[0.710]
-0.045[0.707]
0.002[0.987]
Near activities 0.209[0.076]
0.109[0.359]
-0.146[0.219]
0.137[0.249]
0.030[0.799]
0.096[0.420]
Distance activities 0.389 †[0.001]
0.322 †[0.005]
-0.271 *[0.021]
-0.034[0.777]
-0.100[0.398]
-0.064[0.588]
Social functioning 0.080[0.502]
0.166[0.161]
-0.038[0.749]
0.111[0.349]
0.075[0.526]
0.115[0.331]
Mental health 0.054[0.650]
0.067[0.573]
-0.082[0.489]
0.201[0.089]
0.148[0.210]
0.183[0.121]
Role difficulties -0.106[0.371]
-0.028[0.814]
0.101[0.397]
0.256 *[0.029]
0.235 *[0.045]
0.280 *[0.017]
Dependency 0.234 *[0.047]
0.156[0.187]
-0.199[0.091]
0.135[0.255]
0.175[0.139]
0.190[0.108]
Driving 0.217[0.138]
0.247[0.091]
-0.125[0.396]
0.131[0.375]
-0.013[0.931]
0.058[0.696]
Colour vision 0.067[0.572]
0.056[0.640]
-0.106[0.371]
0.014[0.904]
-0.039[0.741]
-0.010[0.931]
Peripheral vision 0.281 *[0.016]
0.223[0.058]
-0.235*[0.046]
0.071[0.553]
0.025[0.835]
0.050[0.675]
Table 2: Spearman’s correlation coefficients for NEIVFQ-25 sub-scale analyses and VF and NFI parameters (KEY: * significant at p<0.05 level, † significant at p< 0.01 level).

Austin J Clin Ophthalmol 2(3): id1052 (2015) - Page - 06
Spratt A Austin Publishing Group
Submit your Manuscript | www.austinpublishinggroup.com
using a disease specific questionnaire in the assessment of perceived visual disability and suggests that the questions of the glaucoma-specific questionnaire are more tailored and sensitive to detecting the functional difficulties caused by glaucomatous VF loss. A weakness of this approach, compared with the use of generic vision-specific questionnaire, is that the results do not allow for comparison of the visual disability impact of glaucoma with that of other ophthalmic conditions [26].
Our study adds to the body of evidence that links perceived visual disability with VF parameters, but demonstrates weaker correlations for those newly diagnosed glaucoma with the NEIVFQ-25 than some authors have reported [6,8,13]. However our dataset is different, consisting predominantly of early, diagnosis naïve, glaucoma patients. It may be that the questions contained within the NEIVFQ-25 are not sensitive enough to detect the problems encountered by this group of patients. The NEI-VFQ was developed to measure the effects of a variety of ocular conditions on daily functioning and QOL and many of its questions are focussed towards the assessment of central vision function. Studies with glaucoma patients have shown good correlations between NEI-VFQ scores and visual function in more severe disease [5,8]. In our study, the sub-scale analysis did reveal significant difficulties in distance vision, general vision and peripheral vision with worsening VF indices, in agreement with other studies [8].
Glaucoma-specific questionnaires were developed in an attempt to address the relative weaknesses of vision-specific questionnaires, incorporating questions specific to the visual disabilities experienced by glaucoma patients. The Vis-Q questionnaire evolved from Mills and Drance’s questionnaire designed to assess visual disability in patients with severe glaucoma, determined from the extent of binocular VF loss [19]. That the Vis-Q appeared somewhat more sensitive to the difficulties experience by our group of early disease patients supports the use of disease-specific questionnaires over vision-specific questionnaires in this patient group.
Figure 6: Monocular NFI values versus the ‘Role Difficulty’ sub-scale of NEIVFQ-25.Key: open diamonds = better eye, filled diamonds = worse eye.Many patients have a maximum score suggesting no perceived problems in role difficulty. The small number of outliers may be skewing the data.
Other glaucoma-specific questionnaires have been reported in the literature, including the Glaucoma Symptom Scale (GSS) [27], the Symptom Impact Glaucoma (SIG), the Glaucoma Health Perceptions Index (GHPI) [28] and the Glaucoma Quality of Life (GQL-15) questionnaire [29]. The GSS examines the visual and non-visual symptoms of glaucoma treatment but does not specifically assess task performance. The SIG and GHPI were developed by the Collaborative Initial Glaucoma Treatment Study group with the aim of providing a more complete understanding of the overall impact of glaucoma, and are interview administered questionnaires. The GQL-15 has15 rating-scored questions that assess the degree of functional disability caused by glaucoma and was developed through glaucoma focus-group discussion. All of these questionnaires have been shown to be sensitive to the problems encountered by glaucoma patients. Our choice of the Vis-Q questionnaire for this study was based on a number of factors, including the simplicity of its design and relative ease of administration so as to minimise the impact of the study on the patient clinic journey. Perhaps the use of different glaucoma-specific questionnaires in this cohort of patients may have yielded different results. Scoring by Rasch analysis has also been suggested as an alternative way to better understand patient responses to questionnaires [30,31].
This is the first study to examine the association between patients’ perceived visual disability and an objective, structural measure of glaucoma severity derived from imaging technology. We attempted to generate a ‘binocular’ structural ONH index in order to compare binocular structural and functional correlations with patient perceptions. Despite this cohort displaying a wide range of NFI scores, as illustrated in Figures 5 and 6, we found no correlation between the extent of glaucomatous damage suggested by the SLP and patients’ perceived visual disability, even when using the glaucoma-specific Vis-Q. It is possible that the results simply reflect that our choice of questionnaires, or indeed questionnaires as a modality, are not sufficiently sensitive tools with which to detect the problems experienced by patients with early glaucoma as detected through imaging methods. Questionnaires rely on patients’ understanding of what the presented task might involve, their assessment of the task’s relative difficulty and their own perceptions of their ability to perform that task. It is clear that no two persons with the same disease status will report the same experience [32], and it has recently been shown that personality influences patient responses to vision-specific questionnaires [33]. A study recently reviewed tracking ocular movements while patients watched television to detect early changes in a patient’s visual field. This is a more objective measurement of psychophysical changes, but much more expensive and difficult to disseminate throughout the public [34]. A combination test, both subjective and objective, will likely yield a much higher correlation with disease progression of glaucoma than either individually.
It is also possible that our choice of imaging technology may not be sensitive enough to be a useful indicator of the disease related experiences of our patients. Our rationale for using the SLP for this study was based on its ability to generate a ‘score’ of optic nerve damage without requiring operator input to delineate the optic nerve head boundaries; that is, it provides a purely objective measure of disease status. A similar study design using different imaging modalities (such as the scanning laser ophthalmoscope or

Austin J Clin Ophthalmol 2(3): id1052 (2015) - Page - 07
Spratt A Austin Publishing Group
Submit your Manuscript | www.austinpublishinggroup.com
optical coherence tomography) in a more severely affected cohort of glaucoma patients may yield different results.
The uniqueness of our study is in the cohort examined; patients were diagnosis naïve, and it is not yet clear what impact diagnosis itself has on the perceived visual disability of glaucoma patients. Notwithstanding the relatively weak correlations demonstrated in this study, our patients did report a wide range of experiences attributable to visual impairment. The importance of these experiences, and the variety of levels of perceived visual disability they suggest, remain undiminished by our inability to correlate this with the results of white-on-white VF testing and novel imaging technology. However, it would be useful to examine the experiences reported by individuals without any ocular pathology and compare them to those reported by our cohort. This would help us differentiate ‘normal’ experiences from those attributable to the disease and clarify whether our results are truly representative of early disease status.
The challenge remains to find discerning tools that help us to understand the perceived visual disability suffered by patients with early glaucoma and thereafter to be able to measure and monitor changes in a way that relates to the patient’s perceptions. Our study adds to the existing data in demonstrating that there are currently no ways to for patients to subjectively or objectively determine when to seek evaluation for glaucoma or progression once glaucoma has been diagnosed. Further studies are needed to design accurate and inexpensive tools to help diagnose and monitor patients with glaucoma so that their treatment is timely and outcomes are improved.
AcknowledgmentDr Kotecha has received a proportion of her funding from the
Department of Health’s National Institute for Health Research Biomedical Research Centre for Ophthalmology at Moorfields Eye Hospital NHS Foundation Trust and the UCL Institute of Ophthalmology. The views expressed in this publication are those of the authors and not necessarily those of the Department of Health.
There are no financial disclosures to declare. This article has not been published elsewhere and that it has not been submitted simultaneously for publication elsewhere. The authors report no conflicts of interest.
References1. European Glaucoma Society Terminology and Guidelines for Glaucoma.
2003; DOGMA Srl: Savona, Italy.
2. Resnikoff S, Pascolini D, Etya’ale D, Kocur I, Pararajasegaram R, Pokharel GP, et al. Global data on visual impairment in the year 2002. Bull World Health Organ. 2004; 82: 844-851.
3. Tuck MW, Crick RP. The projected increase in glaucoma due to an ageing population. Ophthalmic Physiol Opt. 2003; 23: 175-179.
4. Viswanathan AC, McNaught AI, Poinoosawmy D, Fontana L, Crabb DP, Fitzke FW, et al. Severity and stability of glaucoma: patient perception compared with objective measurement. Arch Ophthalmol. 1999; 117: 450-454.
5. Parrish RK, Gedde SJ, Scott IU, Feuer WJ, Schiffman JC, Mangione CM, et al. Visual function and quality of life among patients with glaucoma. Arch Ophthalmol. 1997; 115: 1447-1455.
6. McKean-Cowdin R, Varma R, Wu J, Hays RD, Azen SP. Los Angeles Latino Eye Study Group. Severity of visual field loss and health-related quality of life. Am J Ophthalmol. 2007; 143: 1013-1023.
7. Mills RP, Janz NK, Wren PA, Guire KE. Correlation of visual field with quality-of-life measures at diagnosis in the Collaborative Initial Glaucoma Treatment Study (CIGTS). J Glaucoma. 2001; 10: 192-198.
8. Jampel HD, Friedman DS, Quigley H, Miller R. Correlation of the binocular visual field with patient assessment of vision. Invest Ophthalmol Vis Sci. 2002; 43: 1059-1067.
9. Keltner JL, Johnson CA, Quigg JM, Cello KE, Kass MA, Gordon MO. Confirmation of visual field abnormalities in the Ocular Hypertension Treatment Study. Ocular Hypertension Treatment Study Group. Arch Ophthalmol. 2000; 118: 1187-1194.
10. Reus NJ, Lemij HG. Diagnostic accuracy of the GDx VCC for glaucoma. Ophthalmology. 2004; 111: 1860-1865.
11. Zangwill LM, Weinreb RN, Beiser JA, Berry CC, Cioffi GA, Coleman AL, et al. Baseline topographic optic disc measurements are associated with the development of primary open-angle glaucoma: the Confocal Scanning Laser Ophthalmoscopy Ancillary Study to the Ocular Hypertension Treatment Study. Arch Ophthalmol. 2005; 123: 1188-1197.
12. Shaikh A, Salmon JF. The role of scanning laser polarimetry using the GDx variable corneal compensator in the management of glaucoma suspects. Br J Ophthalmol. 2006; 90: 1454-1457.
13. Gracitelli CP, Abe RY, Tatham AJ, Rosen PN, Zangwill LM, Boer ER, et al. Association between progressive retinal nerve fiber layer loss and longitudinal change in quality of life in glaucoma. JAMA Ophthalmol. 2015; 133: 384-390.
14. Mangione CM, Lee PP, Pitts J, Gutierrez P, Berry S, Hays RD. Psychometric properties of the National Eye Institute Visual Function Questionnaire (NEI-VFQ). NEI-VFQ Field Test Investigators. Arch Ophthalmol 1998; 116: 1496-1504.
15. Mangione CM, Lee PP, Gutierrez PR, Spritzer K, Berry S, Hays RD. National Eye Institute Visual Function Questionnaire Field Test Investigators. Development of the 25-item National Eye Institute Visual Function Questionnaire. Arch Ophthalmol. 2001; 119: 1050-1058.
16. Owen CG, Rudnicka AR, Smeeth L, Evans JR, Wormald RP, Fletcher AE. Is the NEI-VFQ-25 a useful tool in identifying visual impairment in an elderly population? BMC Ophthalmol. 2006; 6: 24.
17. Cusick M, SanGiovanni JP, Chew EY, Csaky KG, Hall-Shimel K, Reed GF, et al. Central visual function and the NEI-VFQ-25 near and distance activities subscale scores in people with type 1 and 2 diabetes. Am J Ophthalmol. 2005; 139: 1042-1050.
18. Lindblad AS, Clemons TE. Responsiveness of the National Eye Institute Visual Function Questionnaire to progression to advanced age-related macular degeneration, vision loss, and lens opacity: AREDS Report no. 14. Arch Ophthalmol. 2005; 123: 1207-1214.
19. Mills RP, Drance SM. Esterman disability rating in severe glaucoma. Ophthalmology. 1986; 93: 371-378.
20. Iester M, Zingirian M. Quality of life in patients with early, moderate and advanced glaucoma. Eye (Lond). 2002; 16: 44-49.
21. Crabb DP, Viswanathan AC, McNaught AI, Poinoosawmy D, Fitzke FW, Hitchings RA. Simulating binocular visual field status in glaucoma. Br J Ophthalmol. 1998; 82: 1236-1241.
22. Da Pozzo S, Fuser M, Vattovani O, Di Stefano G, Ravalico G. GDx-VCC performance in discriminating normal from glaucomatous eyes with early visual field loss. Graefes Arch Clin Exp Ophthalmol. 2006; 244: 689-695.
23. Sharma P, Sample PA, Zangwill LM, Schuman JS. Diagnostic tools for glaucoma detection and management. Surv Ophthalmol. 2008; 53 Suppl1: S17-32.
24. Garcia Medina MR, Cain WS. Bilateral integration in the common chemical sense. Physiol Behav. 1982; 29: 349-353.
25. Nelson-Quigg JM, Cello K, Johnson CA. Predicting binocular visual field sensitivity from monocular visual field results. Invest Ophthalmol Vis Sci. 2000; 41: 2212-2221.
26. Spratt A, Kotecha A, Viswanathan A. Quality of life in glaucoma. Journal of Current Glaucoma Practice. 2008; 2: 39-45.

Austin J Clin Ophthalmol 2(3): id1052 (2015) - Page - 08
Spratt A Austin Publishing Group
Submit your Manuscript | www.austinpublishinggroup.com
27. Lee BL, Gutierrez P, Gordon M, Wilson MR, Cioffi GA, Ritch R, et al. The Glaucoma Symptom Scale. A brief index of glaucoma-specific symptoms. Arch Ophthalmol. 1998; 116: 861-866.
28. Janz NK, Wren PA, Lichter PR, Musch DC, Gillespie BW, Guire KE. Quality of life in newly diagnosed glaucoma patients: The Collaborative Initial Glaucoma Treatment Study. Ophthalmology. 2001; 108: 887-897.
29. Nelson P, Aspinall P, Papasouliotis O, Worton B, O’Brien C. Quality of life in glaucoma and its relationship with visual function. J Glaucoma. 2003; 12: 139-150.
30. Stelmack J, Szlyk JP, Stelmack T, Babcock-Parziale J, Demers-Turco P, Williams RT, et al. Use of Rasch person-item map in exploratory data analysis: a clinical perspective. J Rehabil Res Dev. 2004; 41: 233-241.
31. Massof RW. Understanding Rasch and item response theory models: applications to the estimation and validation of interval latent trait measures from responses to rating scale questionnaires. Ophthalmic Epidemiology. 2011; 18: 1–19.
32. Feinstein AR, Josephy BR, Wells CK. Scientific and clinical problems in indexes of functional disability. Ann Intern Med. 1986; 105: 413-420.
33. Warrian KJ, Spaeth GL, Lankaranian D, Lopes JF, Steinmann WC. The effect of personality on measures of quality of life related to vision in glaucoma patients. Br J Ophthalmol. 2009; 93: 310-315.
34. Crabb DP, Smith ND, Zhu H. What’s on TV? Detecting age-related neurodegenerative eye disease using eye movement scanpaths. Front Aging Neurosci. 2014; 6: 312.
Citation: Bach A, Ogunbowale L, Kotecha A and Spratt A. Do Subjective and Objective Indices of Disease Severity Correlate with Perceived Disability in New Glaucoma Referrals?. Austin J Clin Ophthalmol. 2015;2(3): 1052.
Austin J Clin Ophthalmol - Volume 2 Issue 3 - 2015ISSN : 2381-9162 | www.austinpublishinggroup.com Spratt et al. © All rights are reserved


![Clinical & Experimental Ophthalmology...astigmatism, less intraoperative and postoperative inflammation, and less time for visual recovery [8]. Moreover, they also result in greater](https://img.pdfslide.us/doc/110x75/5f09ffc67e708231d42985c1/clinical-experimental-ophthalmology-astigmatism-less-intraoperative-and.jpg)