Embed Size (px)
Citation preview
AURA 2016First Australian report on antimicrobial use and resistance in human health
Summary report

AURA 2016First Australian report on antimicrobial use and resistance in human health
Summary report
© Commonwealth of Australia 2016
This work is copyright. It may be reproduced in whole or in part for study or training purposes, subject to the
inclusion of an acknowledgement of the source.
Address requests and inquiries concerning reproduction and rights for purposes other than those indicated
above in writing to:
AURA – Commonwealth Programs, Australian Commission on Safety and Quality in Health Care, GPO Box 5480,
Sydney NSW 2001
Or email [email protected]
Suggested citation: Australian Commission on Safety and Quality in Health Care (ACSQHC). AURA 2016: first
Australian report on antimicrobial use and resistance in human health – summary report. Sydney: ACSQHC, 2016.
An online version of this report can be accessed at www.safetyandquality.gov.au.
ISBN: 978-1-925224-47-4 (print) 978-1-925224-48-1 (online)
Acknowledgements
Many individuals and organisations gave their time and expertise over an extended period to this report and
the Antimicrobial Use and Resistance in Australia (AURA) project, which were conducted by the Commission.
In particular, the Commission wishes to thank the Australian Government Department of Health, the states
and territories and their public hospitals, contributing private hospitals, the Australian Group on Antimicrobial
Resistance, the National Centre for Antimicrobial Stewardship, SA Health, Queensland Health, Pathology
Queensland, Sullivan Nicolaides Pathology, NPS MedicineWise, the National Neisseria Network, the Australian
Mycobacterium Reference Laboratory Network and other key experts who have provided their time and
considered advice. The involvement and willingness of all concerned to share their experience and expertise are
greatly appreciated.
Members of the AURA Project Reference Group are Professor John Turnidge, Dr Phillipa Binns, Professor Marilyn
Cruickshank, Dr Jenny Firman, Ms Aine Heaney, Mr Duncan McKenzie, Adjunct Professor Kathy Meleady, Dr Brett
Mitchell, Professor Graeme Nimmo, Dr Alicia Segrave, Professor Karin Thursky, Dr Morgyn Warner, Professor
Roger Wilson and Associate Professor Leon Worth.
The members of the Commission’s AURA team are also acknowledged for their significant contribution to the
development of the AURA Surveillance System and this report.
Disclaimer
This report is based on the best data and evidence available at the time of development.
Edited and designed by Biotext Pty Ltd
FIRST AUSTRALIAN REPORT ON ANTIMICROBIAL USE AND RESISTANCE IN HUMAN HEALTH: SUMMARY REPORT | 2016 iii
Overview ...........................................................................................1What is antimicrobial resistance? ...................................................................... 1
Antimicrobial use and appropriateness of prescribing ............................. 1
Antimicrobial resistance ....................................................................................... 2
International comparisons ................................................................................... 3
Using information for action ............................................................................... 3
Antimicrobial use and appropriateness ...................................5Key messages ........................................................................................................... 5
Antimicrobial use in hospitals ............................................................................ 6
Antimicrobial use in the community – primary care ................................. 7
Antimicrobial use in the community – residential aged care facilities ............................................................................................... 10
Antimicrobial resistance ............................................................ 13Key messages ..........................................................................................................13
Resistance trends of concern ............................................................................17
International comparisons ......................................................... 19Key messages ..........................................................................................................19
Antimicrobial use in hospitals ......................................................................... 20
Antimicrobial use in the community ............................................................ 20
Antimicrobial resistance ......................................................................................21
Using information for action ................................................... 25Key messages .........................................................................................................25
References .................................................................................... 28
Contents

FIRST AUSTRALIAN REPORT ON ANTIMICROBIAL USE AND RESISTANCE IN HUMAN HEALTH: SUMMARY REPORT | 2016 1
OverviewAURA 2016: first Australian report on antimicrobial use and resistance in human health provides the most comprehensive picture of antimicrobial resistance (AMR), antimicrobial use (AU) and appropriateness of prescribing in Australia to date. It sets a baseline that will allow trends to be monitored over time. AURA 2016 also highlights areas where future work will inform action to prevent the spread of AMR.
Comprehensive, coordinated and effective surveillance of AMR and AU is a national priority. Surveillance is essential to understand the magnitude, distribution and impact of AMR and AU, as well as to identify emerging issues and trends. It allows the early detection of critical antimicrobial resistances to ensure that effective action can be taken, and provides information on the effectiveness of measures designed to promote appropriate AU and contain AMR. Surveillance is a critical component of Australia’s National Antimicrobial Resistance Strategy.
The Antimicrobial Use and Resistance in Australia (AURA) Surveillance System is the new system to coordinate data from a range of sources, and allow integrated analysis and reporting at a national level. The AURA Surveillance System brings together partner programs such as the Australian Group on Antimicrobial Resistance, the National Antimicrobial Prescribing Survey (NAPS), the National Antimicrobial Utilisation Surveillance Program (NAUSP) and Queensland Health’s OrgTRx system. Data is also sourced from the Pharmaceutical Benefits Scheme and the Repatriation Pharmaceutical Benefits Scheme (PBS/RPBS), NPS MedicineWise, the National Neisseria Network, the National Notifiable Diseases Surveillance System, the Report on government services 2015, and Sullivan Nicolaides Pathology.
The AURA Surveillance System will provide critical information needed by clinicians, policy makers, researchers and health system managers to target efforts to inform antimicrobial stewardship, and AMR policy and program development.
This summary report of AURA 2016 presents the key messages and data from that report.
What is antimicrobial resistance?
AMR is an issue of great importance for health care in Australia. AMR occurs when bacteria change to protect themselves from the effects of antimicrobials. This means that the antimicrobial can no longer eradicate or stop the growth of the bacteria. Antimicrobials can be life-saving agents in the fight against infection, but their effectiveness is diminished by AMR.
AMR has a direct impact on patient care and patient outcomes; it is a critical and immediate challenge to health systems around the world. It increases the complexity of treatment and the duration of hospital stay, and places an additional burden on patients, healthcare providers and the healthcare system.
Antimicrobial use and appropriateness of prescribing
AU is a key driver of AMR – the more we use antimicrobials, the more likely it is that resistance will develop. Appropriate use of antimicrobials can be life-saving, but inappropriate use needs to be monitored and minimised to prevent and contain AMR. Inappropriate use might include prescribing antimicrobials when they are not
FIRST AUSTRALIAN REPORT ON ANTIMICROBIAL USE AND RESISTANCE IN HUMAN HEALTH: SUMMARY REPORT | 20162
OvERvIEW
necessary, prescribing the wrong type of antimicrobial or prescribing for the incorrect duration.
On any given day in 2014, around 38% of patients in Australian hospitals were receiving antimicrobial therapy. Around 23% of these prescriptions were considered inappropriate, and around 24% were noncompliant with guidelines. Prescriptions for surgical prophylaxis are a significant concern – this indication is the most common reason for prescribing antimicrobials in hospitals (13.1% of all prescriptions), but also has the highest proportion of inappropriate use (40.2% of prescriptions were deemed to be inappropriate).
Antimicrobial prescribing is high in the community, with 46% of Australians being dispensed at least one antimicrobial in 2014. High volumes of antimicrobials are prescribed unnecessarily for upper respiratory tract infections.
In residential aged care facilities, 11.3% of the residents were on antimicrobials, but only 4.5% had a suspected or confirmed infection. Antimicrobials are sometimes used unnecessarily in residential aged care facilities for urinary tract infections, and unspecified skin and soft tissue infections.
Antimicrobial resistance
Data from hospitals, residential aged care facilities and the community was reported for priority organisms. Resistances and trends of concern include resistance to third-generation cephalosporins and carbapenems in Enterobacteriaceae, decreased susceptibility to ceftriaxone in Neisseria gonorrhoeae, resistance to ciprofloxacin in Shigella species, and resistance to erythromycin in Streptococcus agalactiae.
FIRST AUSTRALIAN REPORT ON ANTIMICROBIAL USE AND RESISTANCE IN HUMAN HEALTH: SUMMARY REPORT | 2016 3
OvERvIEW
International comparisons
AU in the Australian community is higher than in many other countries. Rates of AMR in gram-negative organisms (Escherichia coli and Klebsiella pneumoniae) are lower than in other countries, but high to very high for gram-positive organisms (Staphylococcus aureus and Enterococcus faecium). Australia has low rates of resistance to fluoroquinolones compared with other countries, reflecting the restricted use of this antimicrobial class in Australia.
Using information for action
The information generated through surveillance of AU and AMR more accurately informs and supports strategies to prevent and contain AMR. A national, comprehensive and coordinated surveillance system, such as the AURA Surveillance System, provides data that can be used at many levels – by individuals, healthcare services, jurisdictional health authorities, national bodies and global AMR organisations – to ensure appropriate and effective use of antimicrobials, timely response to emerging resistance and coordinated efforts.
AURA 2016 provides valuable data and comprehensive analyses of AMR, AU and appropriateness of prescribing in Australia, and sets a baseline that will allow AMR and AU trends to be monitored over time. It also highlights areas where additional work would improve understanding and inform further action.
AURA 2016 and a detailed data supplement are available at www.safetyandquality.gov.au/antimicrobial-use-and-resistance-in-australia.

FIRST AUSTRALIAN REPORT ON ANTIMICROBIAL USE AND RESISTANCE IN HUMAN HEALTH: SUMMARY REPORT | 2016 5
Antimicrobial use and appropriateness
Key messages
Hospitals
• AU in hospitals was highest in 2010, and has gradually declined since then. However, on any given day in 2014, 38.4% of hospital patients were being treated with an antimicrobial.
• There is large variation in the rates of AU between states and territories, but the factors driving this variation are unclear.
• Data shows that 23.0% of prescriptions were considered inappropriate and 24.3% were noncompliant with guidelines. Inappropriate use was highest for respiratory tract infections and surgical prophylaxis.
Community
• AU in the community is high, with 46% of the population being dispensed at least one systemic antimicrobial prescription in 2014–15. AU is highest in children (0–9 years old) and older people (aged 65 and over).
• Prescribing varies across states and territories, and across local areas.
• High volumes of antimicrobials are prescribed unnecessarily for respiratory tract infections – more than 50% of people with colds and other upper respiratory tract infections were prescribed an antimicrobial when it was not recommended by guidelines.
• Some antimicrobials are prescribed more in winter, which suggests that they are potentially misused to treat viral illnesses such as colds and influenza.
FIRST AUSTRALIAN REPORT ON ANTIMICROBIAL USE AND RESISTANCE IN HUMAN HEALTH: SUMMARY REPORT | 20166
ANTIMICROBIAL USE AND APPROPRIATENESS
Residential aged care facilities
• In residential aged care facilities, 11.3% of the residents were on antimicrobials, but only 4.5% had a suspected or confirmed infection.
• One in five antimicrobial prescriptions was written for residents who had no signs or symptoms of infection in the week before starting the antimicrobial. Of patients who did have signs of infection and were prescribed antimicrobials, only one-third of these prescriptions were appropriate.
• Antimicrobials are sometimes used unnecessarily in residential aged care facilities for urinary tract infections, and unspecified skin and soft tissue infections.
Inappropriate use of antimicrobials – such as prescribing antimicrobials when they are not necessary, or prescribing the wrong type of antimicrobial – is a key driver of AMR. To prevent and contain AMR, it is important that AU is monitored, and that inappropriate use is minimised.
Antimicrobial use in hospitals
Data on AU in hospitals is sourced from the 2014 NAUSP report.1
Use of antimicrobials in Australian hospitals peaked in 2010, and has declined since then. The rates of use have decreased for some classes of antimicrobials, but have increased for other classes.
There are more than 100 different antimicrobial agents, but 20 of these account for 92% of all antibacterials used in hospitals. Data from NAUSP shows that by far the most commonly prescribed antimicrobial in hospitals is amoxicillin–clavulanate, followed by flucloxacillin, cefazolin and amoxicillin.
Differences in prescribing rates
Antimicrobial usage rates are measured as defined daily doses (DDDs) per 1000 occupied-
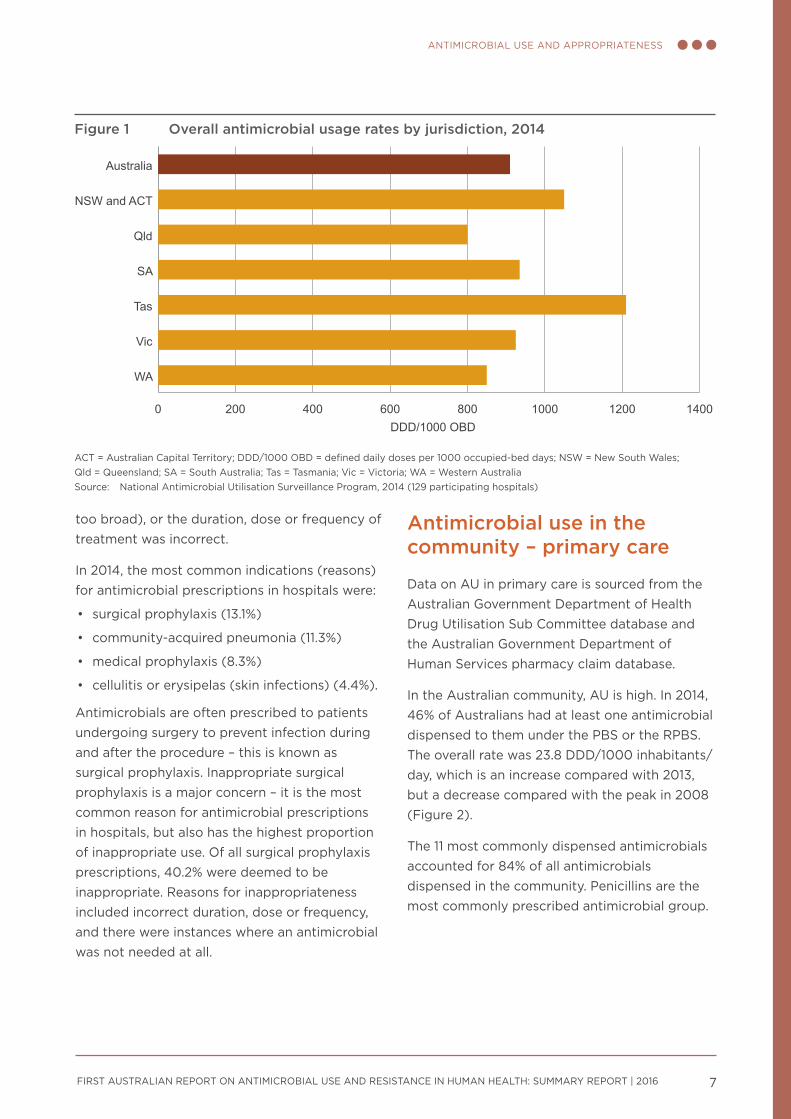
bed days (OBDs), which allows data to be compared across hospitals, jurisdictions or countries. There is large variation in AU among states and territories – Tasmania has the highest rate of AU, and Queensland has the lowest (Figure 1).
Aminoglycosides, cephalosporins, fluoroquinolones and macrolides represent the classes of antimicrobials most likely to drive AMR. Overall, the usage rates of these four antimicrobial classes have declined in the large and medium public hospitals, and principal referral hospitals, that participate in NAUSP. Specifically, over the past five years:
• rates of gentamicin use (the most commonly used aminoglycoside) have decreased steadily across Australia
• use of ceftriaxone (the most commonly prescribed third-generation cephalosporin) and some macrolides appears to be seasonal, reflecting their role in the treatment of lower respiratory tract infections
• rates of fluoroquinolone use have remained relatively constant.
Understanding variation in prescribing rates is critical to improving the quality, value and appropriateness of AU. However, there is currently insufficient evidence to identify which factors are driving variation in volumes and patterns of AU in Australian hospitals.
Appropriateness of prescribing
Data on appropriateness of prescribing in hospitals is sourced from the 2014 NAPS report.2
On any given day in an Australian hospital in 2014, 38.4% of patients were being administered an antimicrobial. Of these prescriptions, 24.3% were noncompliant with guidelines and 23.0% were considered to be inappropriate prescriptions. The main reasons why prescriptions were deemed to be inappropriate were that an antimicrobial was not needed, the antimicrobial chosen was incorrect (spectrum
FIRST AUSTRALIAN REPORT ON ANTIMICROBIAL USE AND RESISTANCE IN HUMAN HEALTH: SUMMARY REPORT | 2016 7
ANTIMICROBIAL USE AND APPROPRIATENESS
too broad), or the duration, dose or frequency of treatment was incorrect.
In 2014, the most common indications (reasons) for antimicrobial prescriptions in hospitals were:
• surgical prophylaxis (13.1%)
• community-acquired pneumonia (11.3%)
• medical prophylaxis (8.3%)
• cellulitis or erysipelas (skin infections) (4.4%).
Antimicrobials are often prescribed to patients undergoing surgery to prevent infection during and after the procedure – this is known as surgical prophylaxis. Inappropriate surgical prophylaxis is a major concern – it is the most common reason for antimicrobial prescriptions in hospitals, but also has the highest proportion of inappropriate use. Of all surgical prophylaxis prescriptions, 40.2% were deemed to be inappropriate. Reasons for inappropriateness included incorrect duration, dose or frequency, and there were instances where an antimicrobial was not needed at all.
Antimicrobial use in the community – primary care
Data on AU in primary care is sourced from the Australian Government Department of Health Drug Utilisation Sub Committee database and the Australian Government Department of Human Services pharmacy claim database.
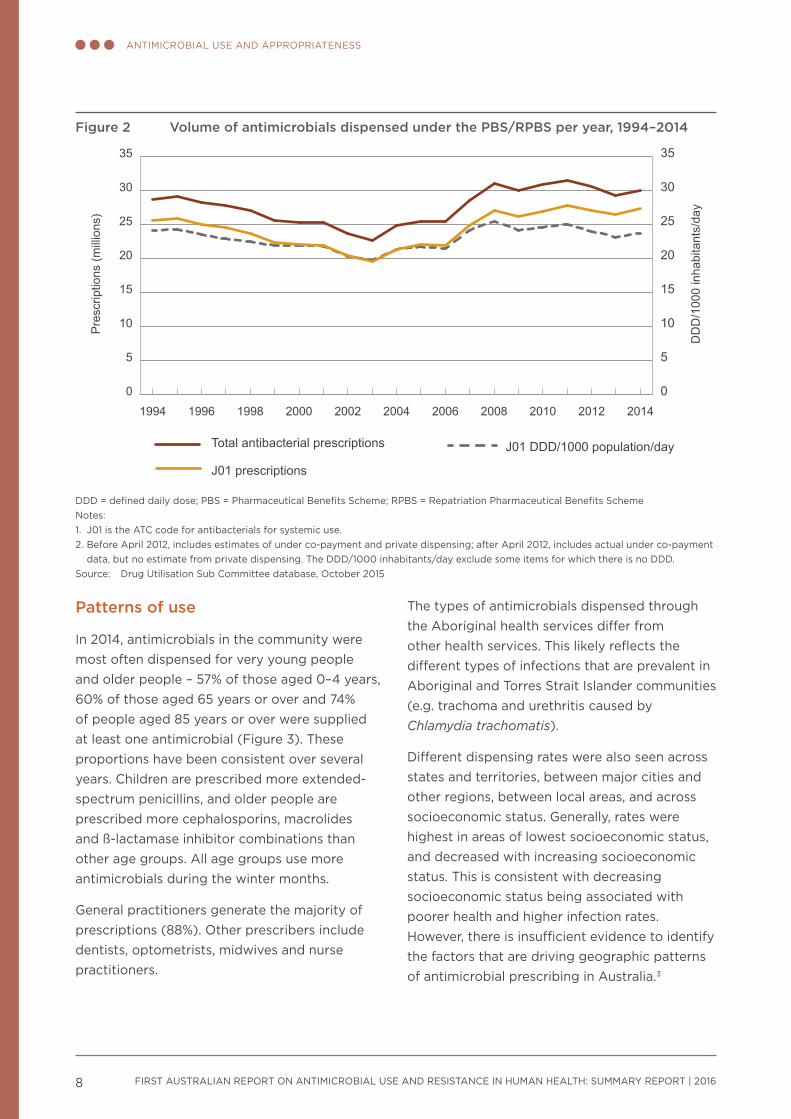
In the Australian community, AU is high. In 2014, 46% of Australians had at least one antimicrobial dispensed to them under the PBS or the RPBS. The overall rate was 23.8 DDD/1000 inhabitants/day, which is an increase compared with 2013, but a decrease compared with the peak in 2008 (Figure 2).
The 11 most commonly dispensed antimicrobials accounted for 84% of all antimicrobials dispensed in the community. Penicillins are the most commonly prescribed antimicrobial group.
Figure 1 Overall antimicrobial usage rates by jurisdiction, 2014
0 200 400 600 800 1000 1200 1400
WA
Vic
Tas
SA
Qld
NSW and ACT
Australia
DDD/1000 OBD
ACT = Australian Capital Territory; DDD/1000 OBD = defined daily doses per 1000 occupied-bed days; NSW = New South Wales; Qld = Queensland; SA = South Australia; Tas = Tasmania; vic = victoria; WA = Western Australia Source: National Antimicrobial Utilisation Surveillance Program, 2014 (129 participating hospitals)
FIRST AUSTRALIAN REPORT ON ANTIMICROBIAL USE AND RESISTANCE IN HUMAN HEALTH: SUMMARY REPORT | 20168
ANTIMICROBIAL USE AND APPROPRIATENESS
Patterns of use
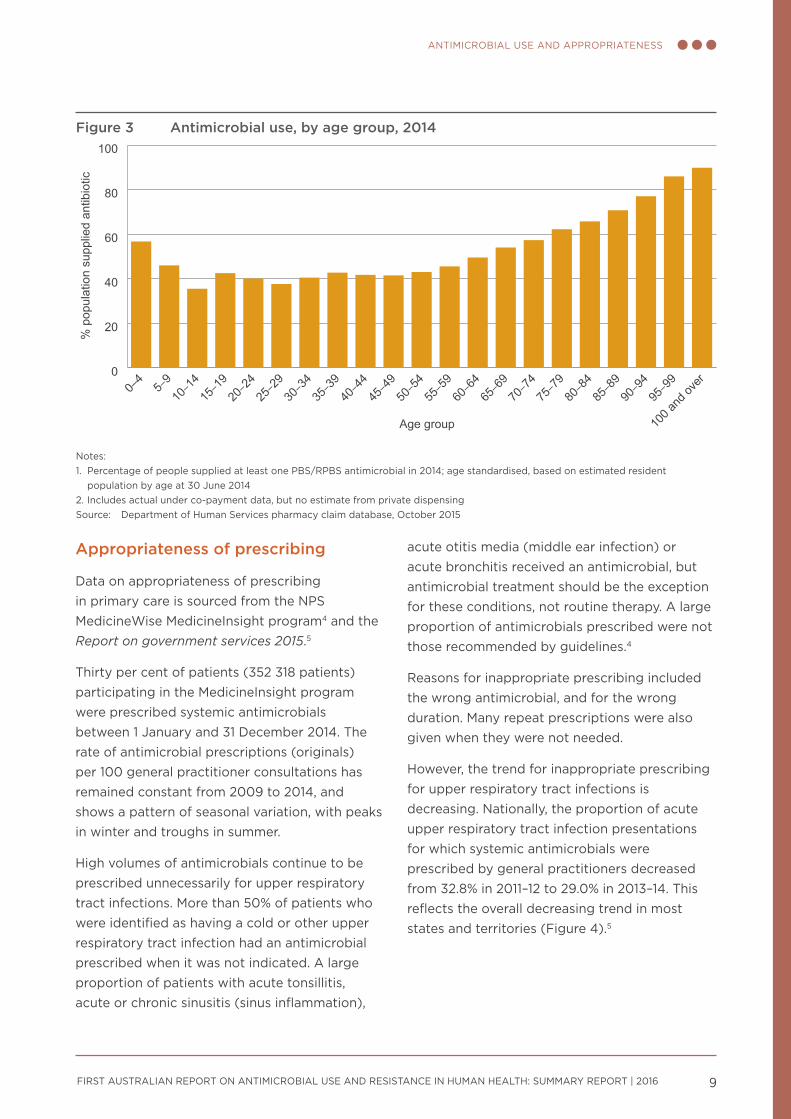
In 2014, antimicrobials in the community were most often dispensed for very young people and older people – 57% of those aged 0–4 years, 60% of those aged 65 years or over and 74% of people aged 85 years or over were supplied at least one antimicrobial (Figure 3). These proportions have been consistent over several years. Children are prescribed more extended-spectrum penicillins, and older people are prescribed more cephalosporins, macrolides and ß-lactamase inhibitor combinations than other age groups. All age groups use more antimicrobials during the winter months.
General practitioners generate the majority of prescriptions (88%). Other prescribers include dentists, optometrists, midwives and nurse practitioners.
The types of antimicrobials dispensed through the Aboriginal health services differ from other health services. This likely reflects the different types of infections that are prevalent in Aboriginal and Torres Strait Islander communities (e.g. trachoma and urethritis caused by Chlamydia trachomatis).
Different dispensing rates were also seen across states and territories, between major cities and other regions, between local areas, and across socioeconomic status. Generally, rates were highest in areas of lowest socioeconomic status, and decreased with increasing socioeconomic status. This is consistent with decreasing socioeconomic status being associated with poorer health and higher infection rates. However, there is insufficient evidence to identify the factors that are driving geographic patterns of antimicrobial prescribing in Australia.3
Figure 2 Volume of antimicrobials dispensed under the PBS/RPBS per year, 1994–2014
0
5
10
15
20
25
30
35
0
5
10
15
20
25
30
35
J01 DDD/1000 population/day
J01 prescriptions
Total antibacterial prescriptions
20142012201020082006200420022000199819961994
Pre
scrip
tions
(mill
ions
)
DD
D/1
000
inha
bita
nts/
day
DDD = defined daily dose; PBS = Pharmaceutical Benefits Scheme; RPBS = Repatriation Pharmaceutical Benefits SchemeNotes:1. J01 is the ATC code for antibacterials for systemic use.2. Before April 2012, includes estimates of under co-payment and private dispensing; after April 2012, includes actual under co-payment
data, but no estimate from private dispensing. The DDD/1000 inhabitants/day exclude some items for which there is no DDD.Source: Drug Utilisation Sub Committee database, October 2015
FIRST AUSTRALIAN REPORT ON ANTIMICROBIAL USE AND RESISTANCE IN HUMAN HEALTH: SUMMARY REPORT | 2016 9
ANTIMICROBIAL USE AND APPROPRIATENESS
Appropriateness of prescribing
Data on appropriateness of prescribing in primary care is sourced from the NPS MedicineWise MedicineInsight program4 and the Report on government services 2015.5
Thirty per cent of patients (352 318 patients) participating in the MedicineInsight program were prescribed systemic antimicrobials between 1 January and 31 December 2014. The rate of antimicrobial prescriptions (originals) per 100 general practitioner consultations has remained constant from 2009 to 2014, and shows a pattern of seasonal variation, with peaks in winter and troughs in summer.
High volumes of antimicrobials continue to be prescribed unnecessarily for upper respiratory tract infections. More than 50% of patients who were identified as having a cold or other upper respiratory tract infection had an antimicrobial prescribed when it was not indicated. A large proportion of patients with acute tonsillitis, acute or chronic sinusitis (sinus inflammation),
acute otitis media (middle ear infection) or acute bronchitis received an antimicrobial, but antimicrobial treatment should be the exception for these conditions, not routine therapy. A large proportion of antimicrobials prescribed were not those recommended by guidelines.4
Reasons for inappropriate prescribing included the wrong antimicrobial, and for the wrong duration. Many repeat prescriptions were also given when they were not needed.
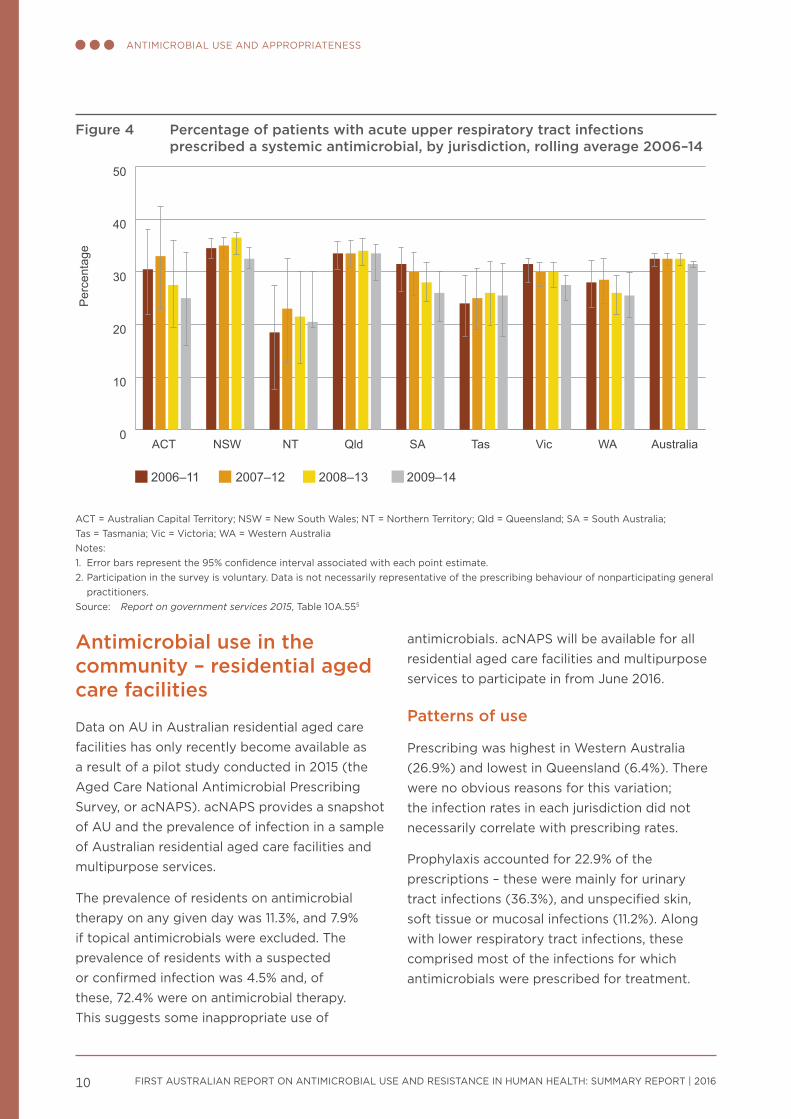
However, the trend for inappropriate prescribing for upper respiratory tract infections is decreasing. Nationally, the proportion of acute upper respiratory tract infection presentations for which systemic antimicrobials were prescribed by general practitioners decreased from 32.8% in 2011–12 to 29.0% in 2013–14. This reflects the overall decreasing trend in most states and territories (Figure 4).5
Figure 3 Antimicrobial use, by age group, 2014
0
20
40
60
80
100
100 a
nd ov
er
95–9
990–9
485–8
980–8
475–7
970–7
465–6
960–6
455–5
950–5
445–4
940–4
435–3
930–3
425–2
920–2
415–1
910–1
45–
90–
4
Age group
% p
opul
atio
n su
pplie
d an
tibio
tic
Notes:1. Percentage of people supplied at least one PBS/RPBS antimicrobial in 2014; age standardised, based on estimated resident
population by age at 30 June 20142. Includes actual under co-payment data, but no estimate from private dispensingSource: Department of Human Services pharmacy claim database, October 2015
FIRST AUSTRALIAN REPORT ON ANTIMICROBIAL USE AND RESISTANCE IN HUMAN HEALTH: SUMMARY REPORT | 201610
ANTIMICROBIAL USE AND APPROPRIATENESS
Antimicrobial use in the community – residential aged care facilities
Data on AU in Australian residential aged care facilities has only recently become available as a result of a pilot study conducted in 2015 (the Aged Care National Antimicrobial Prescribing Survey, or acNAPS). acNAPS provides a snapshot of AU and the prevalence of infection in a sample of Australian residential aged care facilities and multipurpose services.
The prevalence of residents on antimicrobial therapy on any given day was 11.3%, and 7.9% if topical antimicrobials were excluded. The prevalence of residents with a suspected or confirmed infection was 4.5% and, of these, 72.4% were on antimicrobial therapy. This suggests some inappropriate use of
antimicrobials. acNAPS will be available for all residential aged care facilities and multipurpose services to participate in from June 2016.
Patterns of use
Prescribing was highest in Western Australia (26.9%) and lowest in Queensland (6.4%). There were no obvious reasons for this variation; the infection rates in each jurisdiction did not necessarily correlate with prescribing rates.
Prophylaxis accounted for 22.9% of the prescriptions – these were mainly for urinary tract infections (36.3%), and unspecified skin, soft tissue or mucosal infections (11.2%). Along with lower respiratory tract infections, these comprised most of the infections for which antimicrobials were prescribed for treatment.
Figure 4 Percentage of patients with acute upper respiratory tract infections prescribed a systemic antimicrobial, by jurisdiction, rolling average 2006–14
0
10
20
30
40
50
Per
cent
age
2009–142008–132007–122006–11
AustraliaWAVicTasSAQldNTNSWACT
ACT = Australian Capital Territory; NSW = New South Wales; NT = Northern Territory; Qld = Queensland; SA = South Australia; Tas = Tasmania; vic = victoria; WA = Western AustraliaNotes:1. Error bars represent the 95% confidence interval associated with each point estimate.2. Participation in the survey is voluntary. Data is not necessarily representative of the prescribing behaviour of nonparticipating general
practitioners.Source: Report on government services 2015, Table 10A.555
FIRST AUSTRALIAN REPORT ON ANTIMICROBIAL USE AND RESISTANCE IN HUMAN HEALTH: SUMMARY REPORT | 2016 11
ANTIMICROBIAL USE AND APPROPRIATENESS
Appropriateness of prescribing
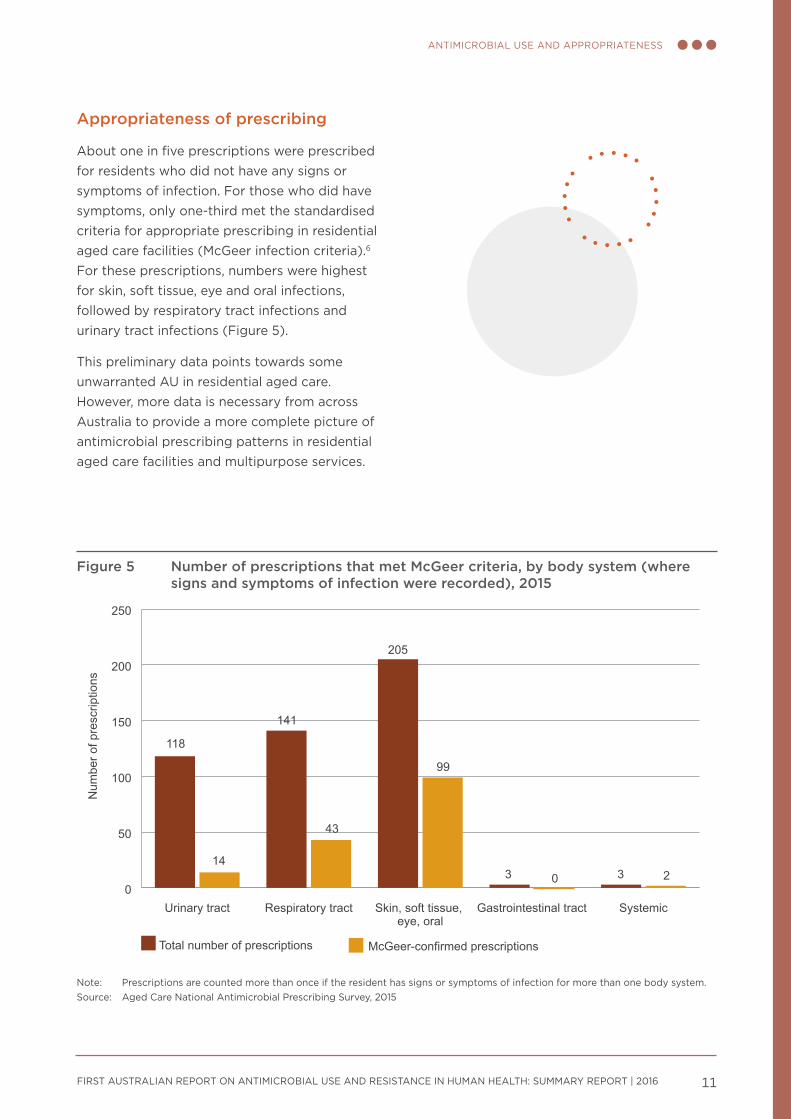
About one in five prescriptions were prescribed for residents who did not have any signs or symptoms of infection. For those who did have symptoms, only one-third met the standardised criteria for appropriate prescribing in residential aged care facilities (McGeer infection criteria).6 For these prescriptions, numbers were highest for skin, soft tissue, eye and oral infections, followed by respiratory tract infections and urinary tract infections (Figure 5).
This preliminary data points towards some unwarranted AU in residential aged care. However, more data is necessary from across Australia to provide a more complete picture of antimicrobial prescribing patterns in residential aged care facilities and multipurpose services.
Figure 5 Number of prescriptions that met McGeer criteria, by body system (where signs and symptoms of infection were recorded), 2015
0
50
100
150
200
250
McGeer-confirmed prescriptionsTotal number of prescriptions
SystemicGastrointestinal tractSkin, soft tissue, eye, oral
Respiratory tractUrinary tract
Num
ber o
f pre
scrip
tions
118
14
141
43
205
99
3 0 3 2
Note: Prescriptions are counted more than once if the resident has signs or symptoms of infection for more than one body system.Source: Aged Care National Antimicrobial Prescribing Survey, 2015

FIRST AUSTRALIAN REPORT ON ANTIMICROBIAL USE AND RESISTANCE IN HUMAN HEALTH: SUMMARY REPORT | 2016 13
Antimicrobial resistance
Key messages
• Acinetobacter baumannii – rates of resistance are low overall (<5%), and higher in hospitals than in the community.
• Enterobacteriaceae – strains of Escherichia coli that produce extended-spectrum ß-lactamases are now a problem in community infections, because they are often multidrug resistant.
• Enterococcus species – Australia has one of the highest rates of vancomycin resistance in Enterococcus faecium in the world. Rates of resistance to key antimicrobial agents are very low (<1%) in E. faecalis, but high (45–94.5%) in E. faecium.
• Mycobacterium tuberculosis – overall resistance rates have not changed significantly in the past decade. Multidrug resistance is low, but has been gradually increasing (1.7% in 2014); extremely drug-resistant strains are occasionally found but remain rare.
• Neisseria gonorrhoeae – rates of resistance to two main antimicrobials (benzylpenicillin and ciprofloxacin) remain steady at around 30%. Rates of resistance to two other key antimicrobials (azithromycin and decreased susceptibility to ceftriaxone) are low but gradually increasing.
• Neisseria meningitidis – rates of resistance to the four key antimicrobials used for treatment remain very low (0–2%).
• Pseudomonas aeruginosa – overall rates of resistance to key antimicrobials are 10% or less, with rates higher in public hospitals than in other settings.
• Salmonella species – rates of resistance to a key antimicrobial class (fluoroquinolones) are very low (1%) in nontyphoidal Salmonella species, but more than 12% in typhoidal Salmonella species.
FIRST AUSTRALIAN REPORT ON ANTIMICROBIAL USE AND RESISTANCE IN HUMAN HEALTH: SUMMARY REPORT | 201614
ANTIMICROBIAL RESISTANCE
• Shigella species – although data is limited, the presence of resistance to a key antimicrobial (ciprofloxacin) in almost 10.6% of Shigella sonnei isolates is of concern.
• Staphylococcus aureus – between 15.8% and 17.4% of isolates are methicillin-resistant S. aureus (MRSA). Community strains of MRSA now cause a significant proportion of infections in both the community and hospitals.
• Streptococcus agalactiae – no isolates were resistant to one key antimicrobial (benzylpenicillin), but resistance to another important antimicrobial (erythromycin) exceeded 20%. This means that protocols for prophylaxis may need to be reconsidered.
• Streptococcus pneumoniae – resistance (as defined for strains causing infections other than meningitis) was low (around 2%) for one key antimicrobial (benzylpenicillin), but high (21–26%) for other key antimicrobials.
• Streptococcus pyogenes – resistance to key antimicrobials used for treatment is absent or very low (3%).
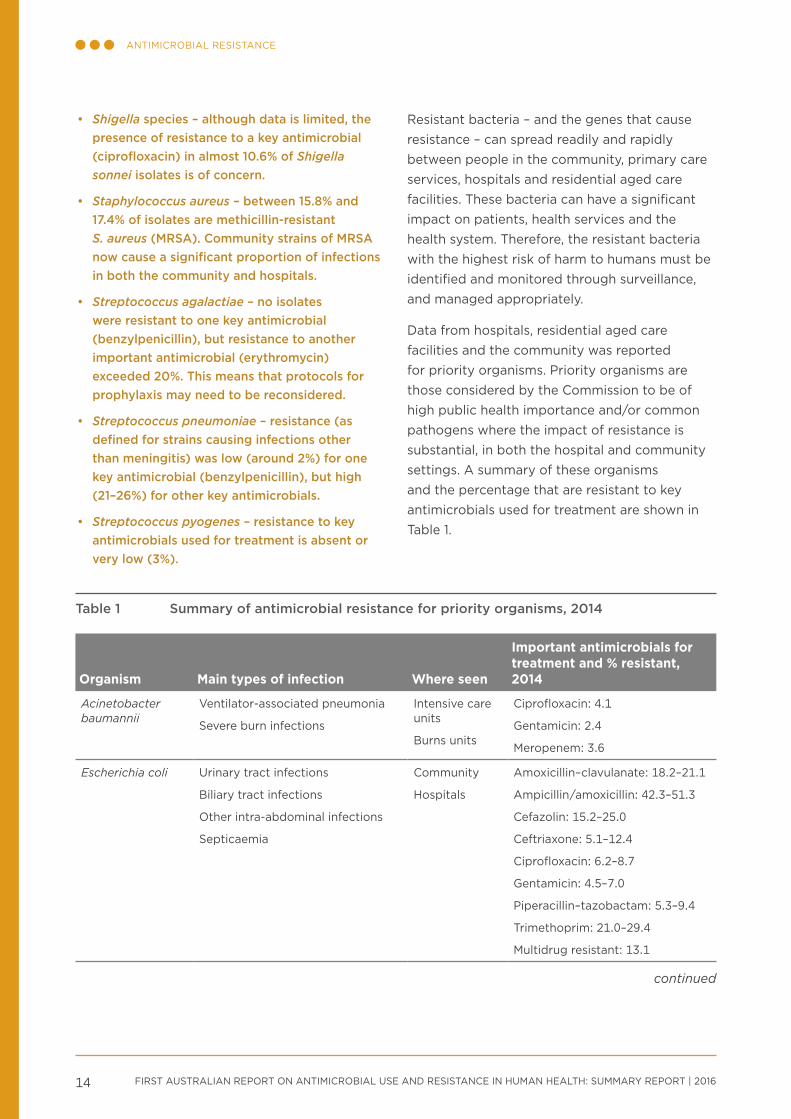
Resistant bacteria – and the genes that cause resistance – can spread readily and rapidly between people in the community, primary care services, hospitals and residential aged care facilities. These bacteria can have a significant impact on patients, health services and the health system. Therefore, the resistant bacteria with the highest risk of harm to humans must be identified and monitored through surveillance, and managed appropriately.
Data from hospitals, residential aged care facilities and the community was reported for priority organisms. Priority organisms are those considered by the Commission to be of high public health importance and/or common pathogens where the impact of resistance is substantial, in both the hospital and community settings. A summary of these organisms and the percentage that are resistant to key antimicrobials used for treatment are shown in Table 1.
Table 1 Summary of antimicrobial resistance for priority organisms, 2014
Organism Main types of infection Where seen
Important antimicrobials for treatment and % resistant, 2014
Acinetobacter baumannii
ventilator-associated pneumonia
Severe burn infections
Intensive care units
Burns units
Ciprofloxacin: 4.1
Gentamicin: 2.4
Meropenem: 3.6
Escherichia coli Urinary tract infections
Biliary tract infections
Other intra-abdominal infections
Septicaemia
Community
Hospitals
Amoxicillin–clavulanate: 18.2–21.1
Ampicillin/amoxicillin: 42.3–51.3
Cefazolin: 15.2–25.0
Ceftriaxone: 5.1–12.4
Ciprofloxacin: 6.2–8.7
Gentamicin: 4.5–7.0
Piperacillin–tazobactam: 5.3–9.4
Trimethoprim: 21.0–29.4
Multidrug resistant: 13.1
continued
FIRST AUSTRALIAN REPORT ON ANTIMICROBIAL USE AND RESISTANCE IN HUMAN HEALTH: SUMMARY REPORT | 2016 15
ANTIMICROBIAL RESISTANCE
Organism Main types of infection Where seen
Important antimicrobials for treatment and % resistant, 2014
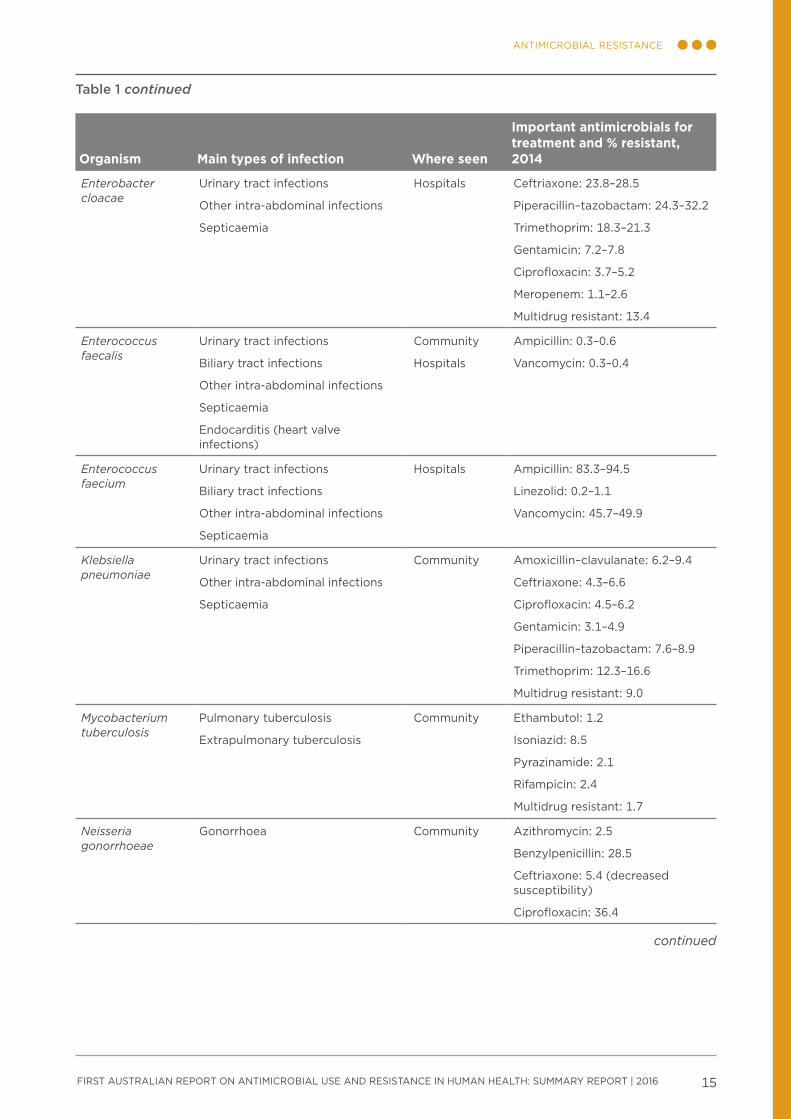
Enterobacter cloacae
Urinary tract infections
Other intra-abdominal infections
Septicaemia
Hospitals Ceftriaxone: 23.8–28.5
Piperacillin–tazobactam: 24.3–32.2
Trimethoprim: 18.3–21.3
Gentamicin: 7.2–7.8
Ciprofloxacin: 3.7–5.2
Meropenem: 1.1–2.6
Multidrug resistant: 13.4
Enterococcus faecalis
Urinary tract infections
Biliary tract infections
Other intra-abdominal infections
Septicaemia
Endocarditis (heart valve infections)
Community
Hospitals
Ampicillin: 0.3–0.6
vancomycin: 0.3–0.4
Enterococcus faecium
Urinary tract infections
Biliary tract infections
Other intra-abdominal infections
Septicaemia
Hospitals Ampicillin: 83.3–94.5
Linezolid: 0.2–1.1
vancomycin: 45.7–49.9
Klebsiella pneumoniae
Urinary tract infections
Other intra-abdominal infections
Septicaemia
Community Amoxicillin–clavulanate: 6.2–9.4
Ceftriaxone: 4.3–6.6
Ciprofloxacin: 4.5–6.2
Gentamicin: 3.1–4.9
Piperacillin–tazobactam: 7.6–8.9
Trimethoprim: 12.3–16.6
Multidrug resistant: 9.0
Mycobacterium tuberculosis
Pulmonary tuberculosis
Extrapulmonary tuberculosis
Community Ethambutol: 1.2
Isoniazid: 8.5
Pyrazinamide: 2.1
Rifampicin: 2.4
Multidrug resistant: 1.7
Neisseria gonorrhoeae
Gonorrhoea Community Azithromycin: 2.5
Benzylpenicillin: 28.5
Ceftriaxone: 5.4 (decreased susceptibility)
Ciprofloxacin: 36.4
Table 1 continued
continued
FIRST AUSTRALIAN REPORT ON ANTIMICROBIAL USE AND RESISTANCE IN HUMAN HEALTH: SUMMARY REPORT | 201616
ANTIMICROBIAL RESISTANCE
Organism Main types of infection Where seen
Important antimicrobials for treatment and % resistant, 2014
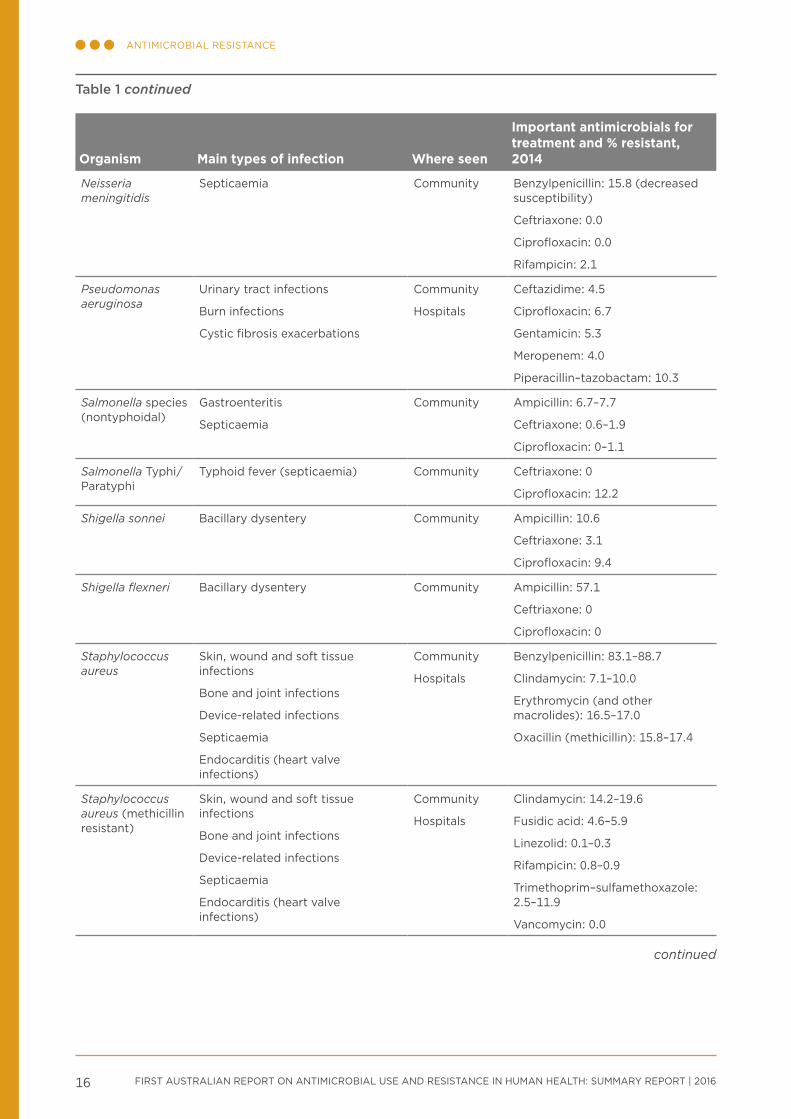
Neisseria meningitidis
Septicaemia Community Benzylpenicillin: 15.8 (decreased susceptibility)
Ceftriaxone: 0.0
Ciprofloxacin: 0.0
Rifampicin: 2.1
Pseudomonas aeruginosa
Urinary tract infections
Burn infections
Cystic fibrosis exacerbations
Community
Hospitals
Ceftazidime: 4.5
Ciprofloxacin: 6.7
Gentamicin: 5.3
Meropenem: 4.0
Piperacillin–tazobactam: 10.3
Salmonella species (nontyphoidal)
Gastroenteritis
Septicaemia
Community Ampicillin: 6.7–7.7
Ceftriaxone: 0.6–1.9
Ciprofloxacin: 0–1.1
Salmonella Typhi/Paratyphi
Typhoid fever (septicaemia) Community Ceftriaxone: 0
Ciprofloxacin: 12.2
Shigella sonnei Bacillary dysentery Community Ampicillin: 10.6
Ceftriaxone: 3.1
Ciprofloxacin: 9.4
Shigella flexneri Bacillary dysentery Community Ampicillin: 57.1
Ceftriaxone: 0
Ciprofloxacin: 0
Staphylococcus aureus
Skin, wound and soft tissue infections
Bone and joint infections
Device-related infections
Septicaemia
Endocarditis (heart valve infections)
Community
Hospitals
Benzylpenicillin: 83.1–88.7
Clindamycin: 7.1–10.0
Erythromycin (and other macrolides): 16.5–17.0
Oxacillin (methicillin): 15.8–17.4
Staphylococcus aureus (methicillin resistant)
Skin, wound and soft tissue infections
Bone and joint infections
Device-related infections
Septicaemia
Endocarditis (heart valve infections)
Community
Hospitals
Clindamycin: 14.2–19.6
Fusidic acid: 4.6–5.9
Linezolid: 0.1–0.3
Rifampicin: 0.8–0.9
Trimethoprim–sulfamethoxazole: 2.5–11.9
vancomycin: 0.0
Table 1 continued
continued
FIRST AUSTRALIAN REPORT ON ANTIMICROBIAL USE AND RESISTANCE IN HUMAN HEALTH: SUMMARY REPORT | 2016 17
ANTIMICROBIAL RESISTANCE
Organism Main types of infection Where seen
Important antimicrobials for treatment and % resistant, 2014
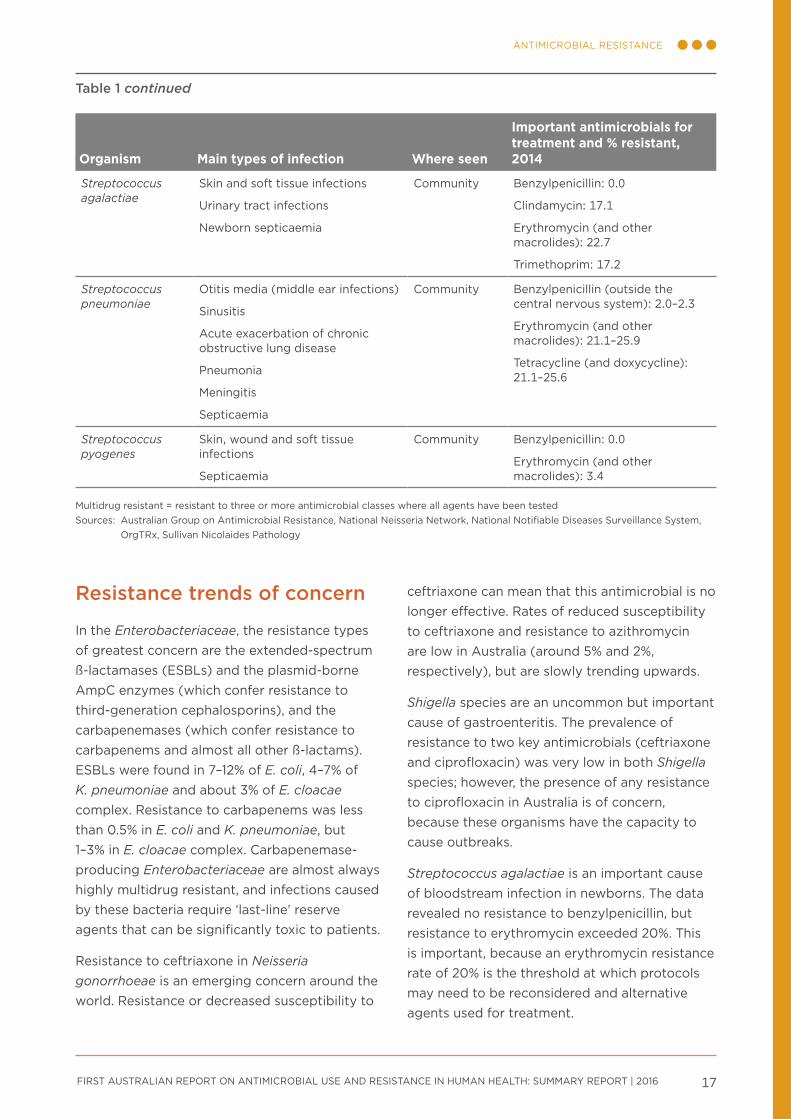
Streptococcus agalactiae
Skin and soft tissue infections
Urinary tract infections
Newborn septicaemia
Community Benzylpenicillin: 0.0
Clindamycin: 17.1
Erythromycin (and other macrolides): 22.7
Trimethoprim: 17.2
Streptococcus pneumoniae
Otitis media (middle ear infections)
Sinusitis
Acute exacerbation of chronic obstructive lung disease
Pneumonia
Meningitis
Septicaemia
Community Benzylpenicillin (outside the central nervous system): 2.0–2.3
Erythromycin (and other macrolides): 21.1–25.9
Tetracycline (and doxycycline): 21.1–25.6
Streptococcus pyogenes
Skin, wound and soft tissue infections
Septicaemia
Community Benzylpenicillin: 0.0
Erythromycin (and other macrolides): 3.4
Multidrug resistant = resistant to three or more antimicrobial classes where all agents have been testedSources: Australian Group on Antimicrobial Resistance, National Neisseria Network, National Notifiable Diseases Surveillance System,
OrgTRx, Sullivan Nicolaides Pathology
Resistance trends of concern
In the Enterobacteriaceae, the resistance types of greatest concern are the extended-spectrum ß-lactamases (ESBLs) and the plasmid-borne AmpC enzymes (which confer resistance to third-generation cephalosporins), and the carbapenemases (which confer resistance to carbapenems and almost all other ß-lactams). ESBLs were found in 7–12% of E. coli, 4–7% of K. pneumoniae and about 3% of E. cloacae complex. Resistance to carbapenems was less than 0.5% in E. coli and K. pneumoniae, but 1–3% in E. cloacae complex. Carbapenemase-producing Enterobacteriaceae are almost always highly multidrug resistant, and infections caused by these bacteria require ‘last-line’ reserve agents that can be significantly toxic to patients.
Resistance to ceftriaxone in Neisseria gonorrhoeae is an emerging concern around the world. Resistance or decreased susceptibility to
ceftriaxone can mean that this antimicrobial is no longer effective. Rates of reduced susceptibility to ceftriaxone and resistance to azithromycin are low in Australia (around 5% and 2%, respectively), but are slowly trending upwards.
Shigella species are an uncommon but important cause of gastroenteritis. The prevalence of resistance to two key antimicrobials (ceftriaxone and ciprofloxacin) was very low in both Shigella species; however, the presence of any resistance to ciprofloxacin in Australia is of concern, because these organisms have the capacity to cause outbreaks.
Streptococcus agalactiae is an important cause of bloodstream infection in newborns. The data revealed no resistance to benzylpenicillin, but resistance to erythromycin exceeded 20%. This is important, because an erythromycin resistance rate of 20% is the threshold at which protocols may need to be reconsidered and alternative agents used for treatment.
Table 1 continued

FIRST AUSTRALIAN REPORT ON ANTIMICROBIAL USE AND RESISTANCE IN HUMAN HEALTH: SUMMARY REPORT | 2016 19
International comparisons
Key messages
• AU in Australian hospitals can appear comparatively high or low, depending on the measure used. These comparative differences may reflect different healthcare practices (e.g. indications treated in hospitals or community primary care) in different countries.
• AU in the Australian community is higher than in many other countries.
• Rates of AMR in gram-negative organisms (Escherichia coli and Klebsiella pneumoniae) in Australia are lower than in other countries, but rates of AMR in gram-positive organisms (Staphylococcus aureus and Enterococcus faecium) are high to very high.
• Australia has low rates of resistance to fluoroquinolones compared with other countries, reflecting the restricted use of this antimicrobial class in Australia.
FIRST AUSTRALIAN REPORT ON ANTIMICROBIAL USE AND RESISTANCE IN HUMAN HEALTH: SUMMARY REPORT | 201620
INTERNATIONAL COMPARISONSINTERNATIONAL COMPARISONS
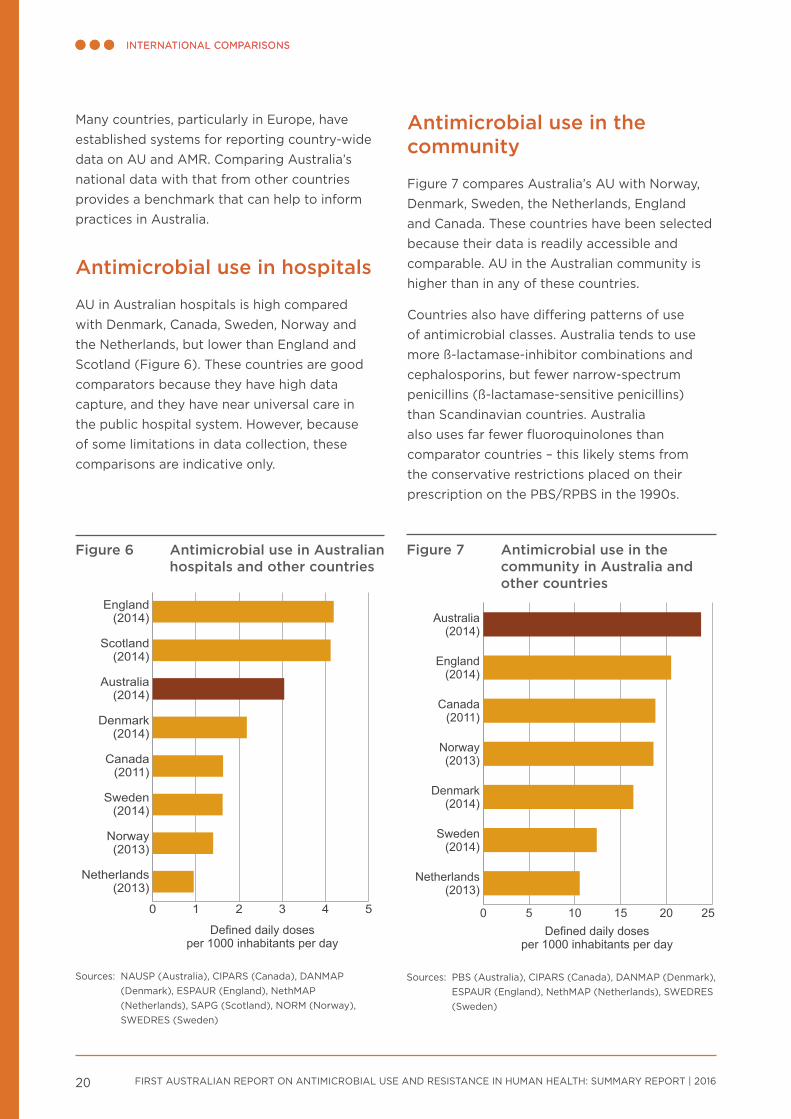
Many countries, particularly in Europe, have established systems for reporting country-wide data on AU and AMR. Comparing Australia’s national data with that from other countries provides a benchmark that can help to inform practices in Australia.
Antimicrobial use in hospitals
AU in Australian hospitals is high compared with Denmark, Canada, Sweden, Norway and the Netherlands, but lower than England and Scotland (Figure 6). These countries are good comparators because they have high data capture, and they have near universal care in the public hospital system. However, because of some limitations in data collection, these comparisons are indicative only.
Antimicrobial use in the community
Figure 7 compares Australia’s AU with Norway, Denmark, Sweden, the Netherlands, England and Canada. These countries have been selected because their data is readily accessible and comparable. AU in the Australian community is higher than in any of these countries.
Countries also have differing patterns of use of antimicrobial classes. Australia tends to use more ß-lactamase-inhibitor combinations and cephalosporins, but fewer narrow-spectrum penicillins (ß-lactamase-sensitive penicillins) than Scandinavian countries. Australia also uses far fewer fluoroquinolones than comparator countries – this likely stems from the conservative restrictions placed on their prescription on the PBS/RPBS in the 1990s.
Figure 6 Antimicrobial use in Australian hospitals and other countries
0 500 1000 1500 2000
Sweden(2014)
Netherlands(2013)
Australia(2014)
Denmark(2014)
England(2014)
Defined daily doses per 1000 occupied-bed days
Defined daily doses per 1000 inhabitants per day
0 1 2 3 4 5
Netherlands(2013)
Norway(2013)
Sweden(2014)
Canada(2011)
Denmark(2014)
Australia(2014)
Scotland(2014)
England(2014)
Sources: NAUSP (Australia), CIPARS (Canada), DANMAP (Denmark), ESPAUR (England), NethMAP (Netherlands), SAPG (Scotland), NORM (Norway), SWEDRES (Sweden)
Figure 7 Antimicrobial use in the community in Australia and other countries
0 5 10 15 20 25
Netherlands(2013)
Sweden(2014)
Denmark(2014)
Norway(2013)
Canada(2011)
England(2014)
Australia(2014)
Defined daily doses per 1000 inhabitants per day
Sources: PBS (Australia), CIPARS (Canada), DANMAP (Denmark), ESPAUR (England), NethMAP (Netherlands), SWEDRES (Sweden)
FIRST AUSTRALIAN REPORT ON ANTIMICROBIAL USE AND RESISTANCE IN HUMAN HEALTH: SUMMARY REPORT | 2016 21
INTERNATIONAL COMPARISONSINTERNATIONAL COMPARISONS
Antimicrobial resistance
Comparisons of AMR are available from other countries for four of the priority organisms: Escherichia coli, Klebsiella pneumoniae, Enterococcus faecium and Staphylococcus aureus.
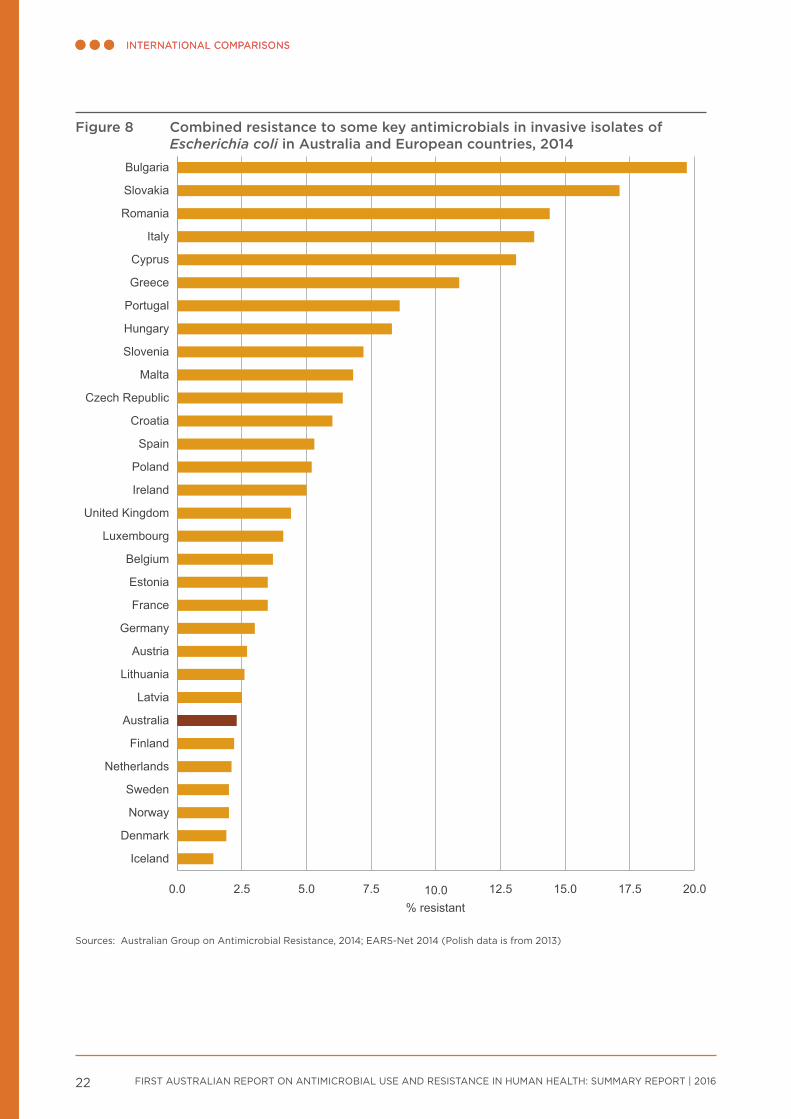
Resistance to some key antimicrobials, including fluoroquinolones, is very low in Australia for E. coli (Figure 8) and K. pneumoniae compared with many European countries. These organisms are both gram-negative.
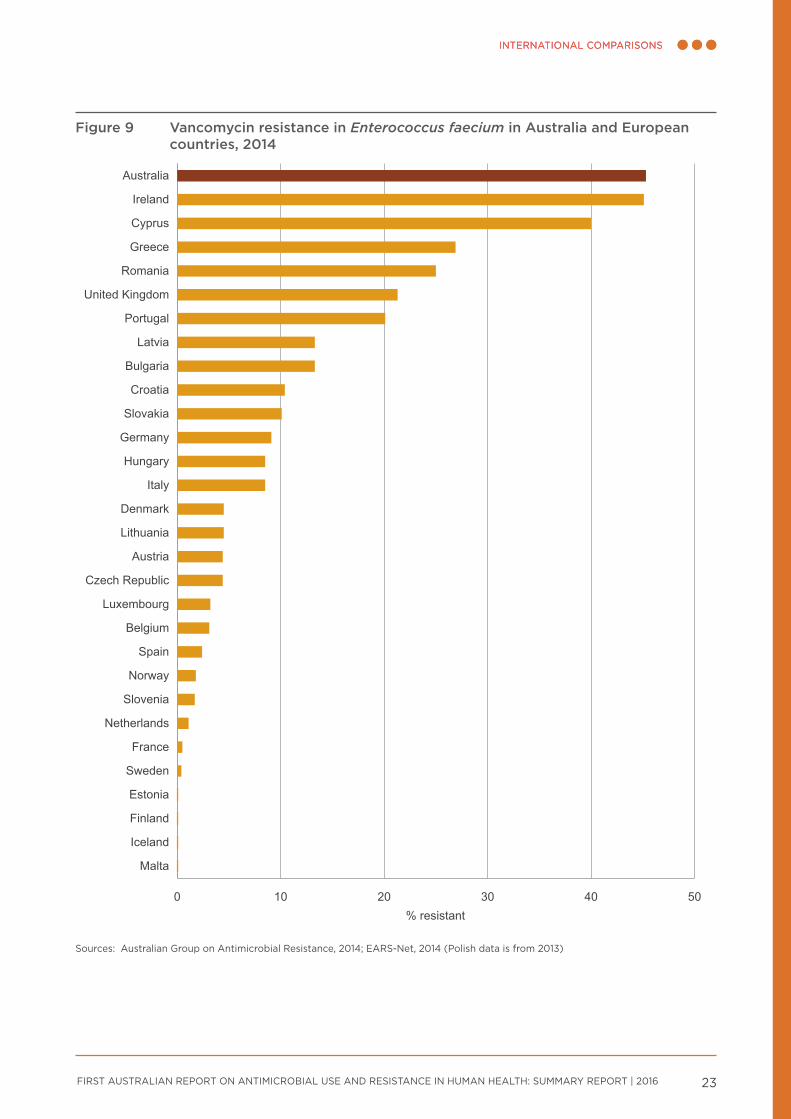
In contrast to the gram-negative pathogens discussed above (E. coli and K. pneumoniae), rates of resistance to methicillin in S. aureus and to vancomycin in E. faecium (both gram-positive bacteria) are high to very high in Australia compared with other countries (see Figure 9). The reasons for this are not clear, but it is likely that the drivers of resistance in gram-negative and gram-positive bacteria are different.
FIRST AUSTRALIAN REPORT ON ANTIMICROBIAL USE AND RESISTANCE IN HUMAN HEALTH: SUMMARY REPORT | 201622
INTERNATIONAL COMPARISONSINTERNATIONAL COMPARISONS
Figure 8 Combined resistance to some key antimicrobials in invasive isolates of Escherichia coli in Australia and European countries, 2014
0.0 2.5 5.0 7.5 10.0 12.5 15.0 17.5 20.0
Iceland
Denmark
Norway
Sweden
Netherlands
Finland
Australia
Latvia
Lithuania
Austria
Germany
France
Estonia
Belgium
Luxembourg
United Kingdom
Ireland
Poland
Spain
Croatia
Czech Republic
Malta
Slovenia
Hungary
Portugal
Greece
Cyprus
Italy
Romania
Slovakia
Bulgaria
% resistant
Sources: Australian Group on Antimicrobial Resistance, 2014; EARS-Net 2014 (Polish data is from 2013)
FIRST AUSTRALIAN REPORT ON ANTIMICROBIAL USE AND RESISTANCE IN HUMAN HEALTH: SUMMARY REPORT | 2016 23
INTERNATIONAL COMPARISONSINTERNATIONAL COMPARISONS
Figure 9 Vancomycin resistance in Enterococcus faecium in Australia and European countries, 2014
0 10 20 30 40 50
Malta
Iceland
Finland
Estonia
Sweden
France
Netherlands
Slovenia
Norway
Spain
Belgium
Luxembourg
Czech Republic
Austria
Lithuania
Denmark
Italy
Hungary
Germany
Slovakia
Croatia
Bulgaria
Latvia
Portugal
United Kingdom
Romania
Greece
Cyprus
Ireland
Australia
% resistant
Sources: Australian Group on Antimicrobial Resistance, 2014; EARS-Net, 2014 (Polish data is from 2013)

FIRST AUSTRALIAN REPORT ON ANTIMICROBIAL USE AND RESISTANCE IN HUMAN HEALTH: SUMMARY REPORT | 2016 25
Using information for action
Key messages
• Effective surveillance systems should be more than just data collections – they should also provide meaningful and accessible information so that actions can be taken to prevent and contain AMR.
• AURA 2016 provides valuable data and comprehensive analyses of AMR, AU and appropriateness of prescribing in Australia, and sets a baseline that will allow trends in AMR and AU to be monitored over time.
• AURA 2016 highlights areas where additional work would improve understanding and inform further action. The Australian Commission on Safety and Quality in Health Care, in partnership with a number of organisations and the jurisdictions, is undertaking a range of activities to strengthen the AURA Surveillance System.
• A national alert system for critical antimicrobial resistances was established in March 2016.
• Future AURA reports will continue to improve and expand in line with the development of the AURA Surveillance System, the implementation of the National Antimicrobial Resistance Strategy, and the achievement of a better understanding of where investment in research and data collection is most valuable.
FIRST AUSTRALIAN REPORT ON ANTIMICROBIAL USE AND RESISTANCE IN HUMAN HEALTH: SUMMARY REPORT | 201626
USING INFORMATION FOR ACTION
Under the National Safety and Quality Health Service Standards, Standard 3: Preventing and Controlling Healthcare Associated Infections requires healthcare organisations to monitor patterns of AU locally, and use this information to guide antimicrobial stewardship practices, as well as meet infection control requirements.7
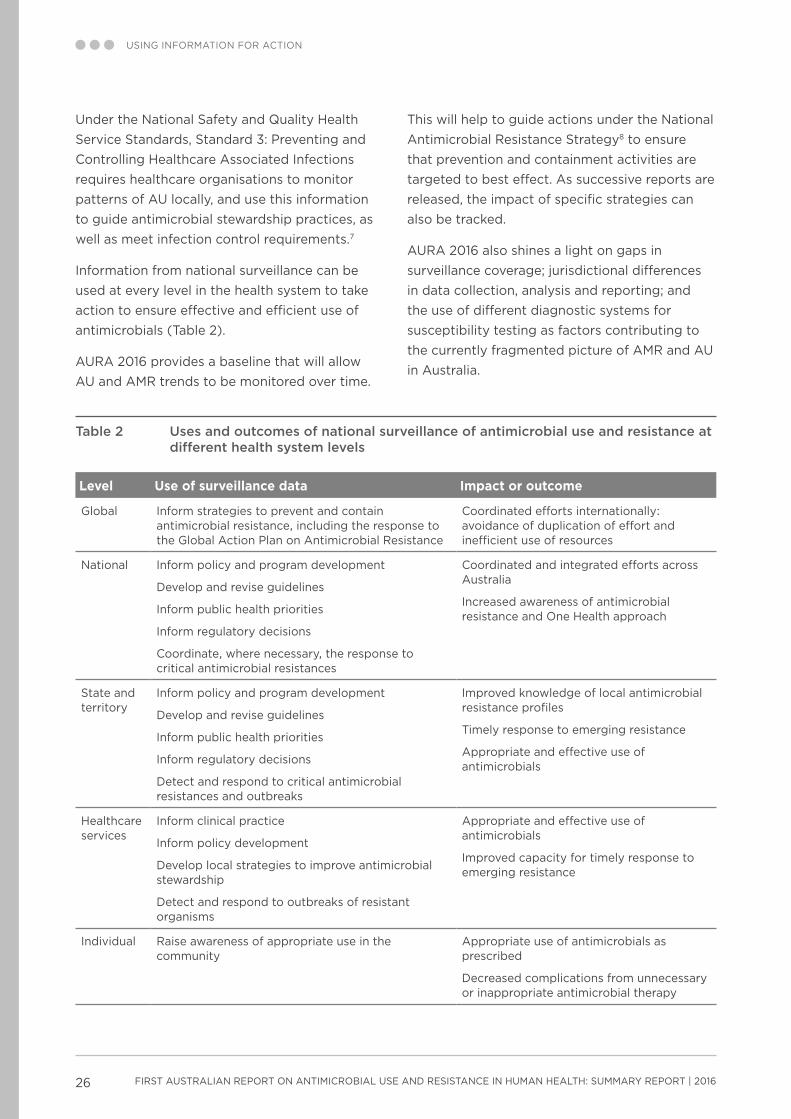
Information from national surveillance can be used at every level in the health system to take action to ensure effective and efficient use of antimicrobials (Table 2).
AURA 2016 provides a baseline that will allow AU and AMR trends to be monitored over time.
This will help to guide actions under the National Antimicrobial Resistance Strategy8 to ensure that prevention and containment activities are targeted to best effect. As successive reports are released, the impact of specific strategies can also be tracked.
AURA 2016 also shines a light on gaps in surveillance coverage; jurisdictional differences in data collection, analysis and reporting; and the use of different diagnostic systems for susceptibility testing as factors contributing to the currently fragmented picture of AMR and AU in Australia.
Table 2 Uses and outcomes of national surveillance of antimicrobial use and resistance at different health system levels
Level Use of surveillance data Impact or outcome
Global Inform strategies to prevent and contain antimicrobial resistance, including the response to the Global Action Plan on Antimicrobial Resistance
Coordinated efforts internationally: avoidance of duplication of effort and inefficient use of resources
National Inform policy and program development
Develop and revise guidelines
Inform public health priorities
Inform regulatory decisions
Coordinate, where necessary, the response to critical antimicrobial resistances
Coordinated and integrated efforts across Australia
Increased awareness of antimicrobial resistance and One Health approach
State and territory
Inform policy and program development
Develop and revise guidelines
Inform public health priorities
Inform regulatory decisions
Detect and respond to critical antimicrobial resistances and outbreaks
Improved knowledge of local antimicrobial resistance profiles
Timely response to emerging resistance
Appropriate and effective use of antimicrobials
Healthcare services
Inform clinical practice
Inform policy development
Develop local strategies to improve antimicrobial stewardship
Detect and respond to outbreaks of resistant organisms
Appropriate and effective use of antimicrobials
Improved capacity for timely response to emerging resistance
Individual Raise awareness of appropriate use in the community
Appropriate use of antimicrobials as prescribed
Decreased complications from unnecessary or inappropriate antimicrobial therapy
FIRST AUSTRALIAN REPORT ON ANTIMICROBIAL USE AND RESISTANCE IN HUMAN HEALTH: SUMMARY REPORT | 2016 27
USING INFORMATION FOR ACTION
AURA 2016 provides guidance on future work in relation to surveillance, such as:
• improving data analysis and interpretation at the national level
• increasing data coverage across geographical areas (jurisdictional, urban, regional, rural and remote areas), patient settings (primary care, residential aged care and hospitals) and hospital types
• improving data collection methods to allow better benchmarking and comparisons between hospitals
• increasing participation in national data collection surveys such as NAPS, NAUSP and acNAPS
• improving data collection and reporting of AMR in all jurisdictions
• continuing to monitor emerging resistances and changes in patterns of resistance, and ensuring that they can be rapidly identified and contained to prevent outbreaks.
The Commission has established a national alert system for critical antimicrobial resistances. Although critical antimicrobial resistances are not currently widespread in Australia, outbreaks have the potential to spread, and cause great harm to patients and the healthcare system.
Other areas identified in AURA 2016 that warrant further consideration are:
• assessing factors that drive variation in AU and prescribing across jurisdictions
• improving appropriateness of prescribing in hospitals (particularly for surgical prophylaxis) and the community (particularly for upper respiratory tract infections)
• advancing a response to the issue of inappropriate surgical prophylaxis
• promoting the Antimicrobial Stewardship Clinical Care Standard in community and primary care.
As successive AURA reports are released, the impact of specific strategies can also be
tracked. In addition, AMR and AU surveillance will be better integrated across jurisdictions and existing programs, to provide coordination of data and reports from a single, trusted source of information. Achieving these objectives will support the objectives of the National Strategy by informing strategic planning for coordinated and integrated action.
AURA 2016 is the first report of its kind in Australia. It is anticipated that regular reports will continue to be produced, with increasing capability to provide greater reach of surveillance, along with improved analyses and data reporting. In turn, this will result in the prevention and containment of AMR, and improved health outcomes for all Australians.
FIRST AUSTRALIAN REPORT ON ANTIMICROBIAL USE AND RESISTANCE IN HUMAN HEALTH: SUMMARY REPORT | 201628
References1. Australian Commission on Safety and Quality
in Health Care and SA Health. Antimicrobial use in hospitals: 2014 report of the National Antimicrobial Utilisation Surveillance Program. Sydney: ACSQHC, 2015.
2. Australian Commission on Safety and Quality in Health Care. Antimicrobial prescribing practice in Australian hospitals: results of the 2014 National Antimicrobial Prescribing Survey. Sydney: ACSQHC, 2015.
3. Australian Commission on Safety and Quality in Health Care and National Health Performance Authority. Australian atlas of healthcare variation. Sydney: ACSQHC, 2015.
4. NPS MedicineWise. MedicineInsight post market review report 3: antibiotics (unpublished). 2015.
5. Productivity Commission. Report on government services 2015. Canberra: Productivity Commission, 2015.
6. McGeer A, Campbell B, Emori TG, et al. Definitions of infection for surveillance in long-term care facilities. American Journal of Infection Control 1991;19:1–7.
7. Australian Commission on Safety and Quality in Health Care. National Safety and Quality Health Service Standards. Sydney: ACSQHC, 2012.
8. Australian Government Department of Health. First National Antimicrobial Resistance Strategy 2015–2019: responding to the threat of antimicrobial resistance. Canberra: DoH, 2015.

Australian Commission on Safety and Quality in Health Care
Level 5, 255 Elizabeth Street SYDNEY NSW 2000
GPO Box 5480 SYDNEY NSW 2001
Telephone: (02) 9126 3600 Fax: (02) 9126 3613 [email protected]
www.safetyandquality.gov.au