Embed Size (px)
Citation preview

August 5, 2014
The NMSDC Network
NAEP Supplier Diversity Institute l Chicago, IL l August 4 – 5, 2014 2
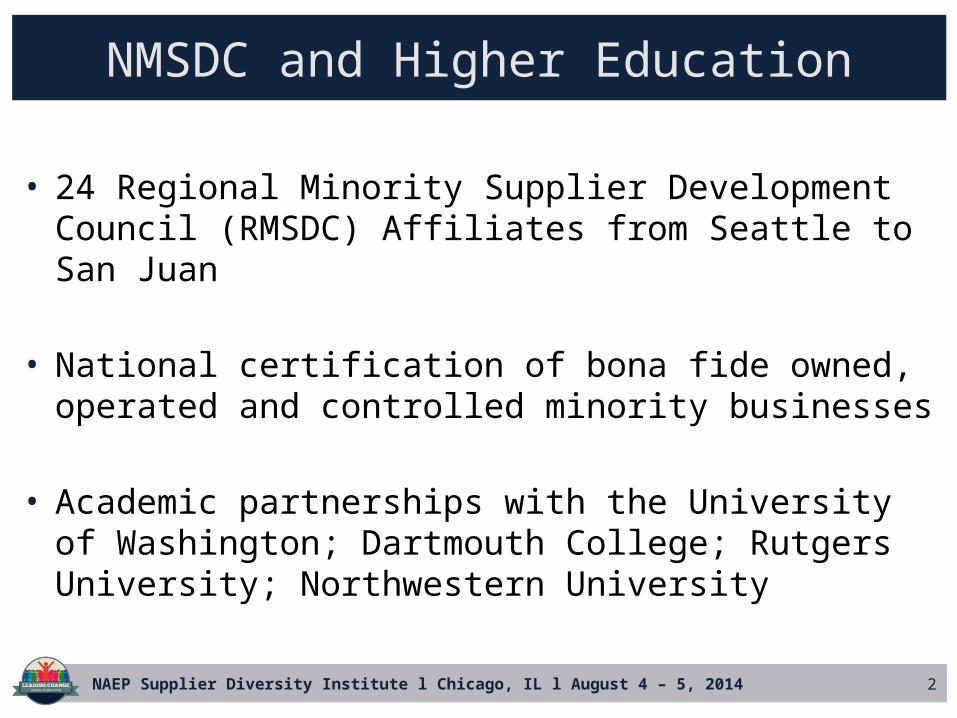
NMSDC and Higher Education
• 24 Regional Minority Supplier Development Council (RMSDC) Affiliates from Seattle to San Juan
• National certification of bona fide owned, operated and controlled minority businesses
• Academic partnerships with the University of Washington; Dartmouth College; Rutgers University; Northwestern University
NAEP Supplier Diversity Institute l Chicago, IL l August 4 – 5, 2014 3
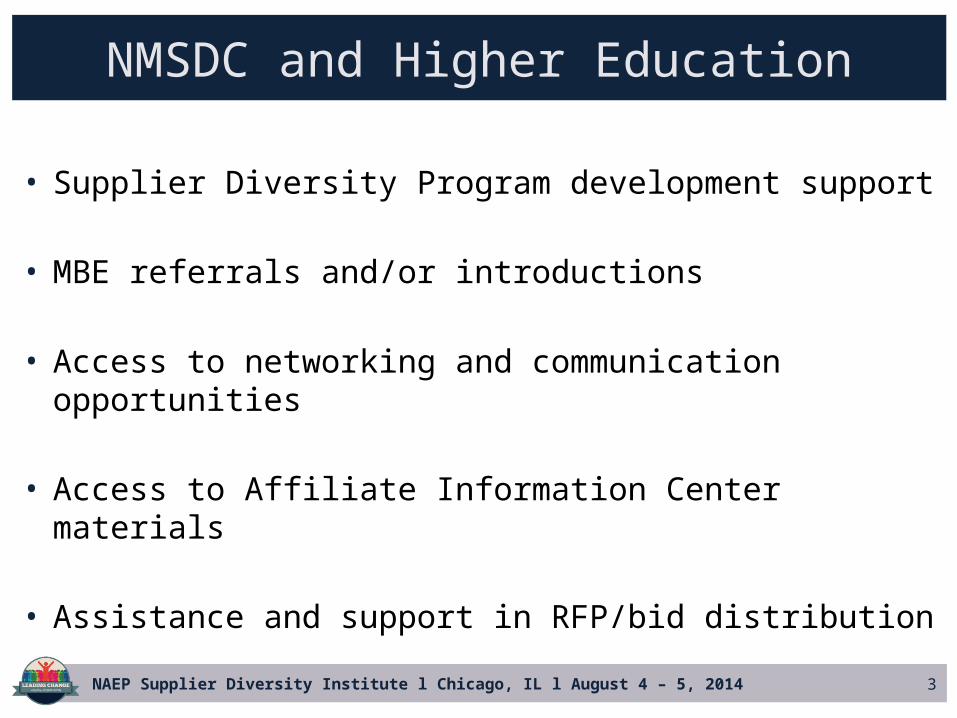
NMSDC and Higher Education
• Supplier Diversity Program development support
• MBE referrals and/or introductions
• Access to networking and communication opportunities
• Access to Affiliate Information Center materials
• Assistance and support in RFP/bid distribution
Proprietary & Confidential. © 2014 NMSDC® All rights reserved.
Mission and Vision− Core Competencies − New Network Map
Minority Business Enterprises (MBE) Demographics
MBE Top 10 Industries & Annual Sales The Story Behind the Numbers
− Economic Impact of MBEs− Capacity Building
Agenda
4
NMSDC Overview
Proprietary & Confidential. © 2014 NMSDC® All rights reserved.
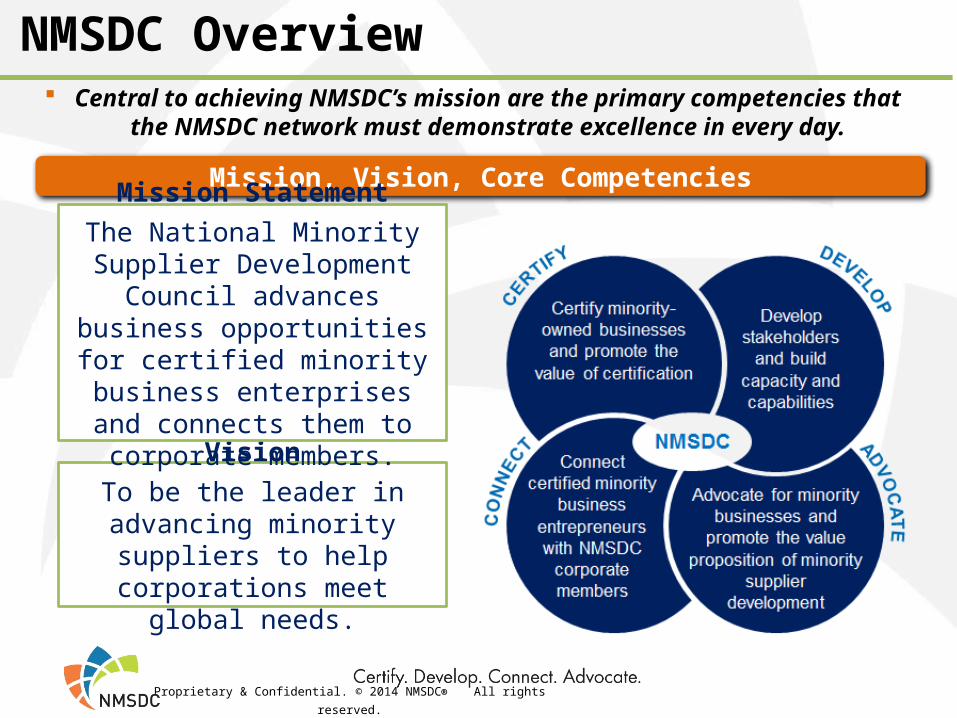
Mission, Vision, Core Competencies
NMSDC Overview
5
Central to achieving NMSDC’s mission are the primary competencies that the NMSDC network must demonstrate excellence in every day.
VisionTo be the leader in advancing
minority suppliers to help corporations meet global needs.
Mission StatementThe National Minority Supplier Development Council advances
business opportunities for certified minority business
enterprises and connects them to corporate members.
Proprietary & Confidential. © 2014 NMSDC® All rights reserved.
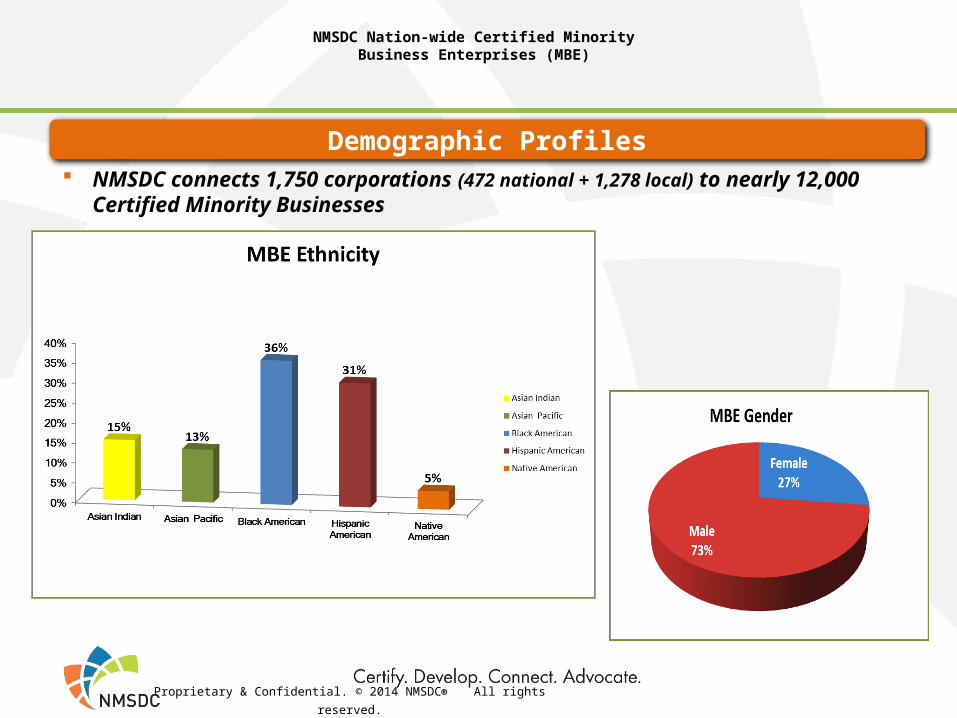
NMSDC Nation-wide Certified Minority Business Enterprises (MBE)
Demographic Profiles
6
NMSDC connects 1,750 corporations (472 national + 1,278 local) to nearly 12,000 Certified Minority Businesses
Proprietary & Confidential. © 2014 NMSDC® All rights reserved.
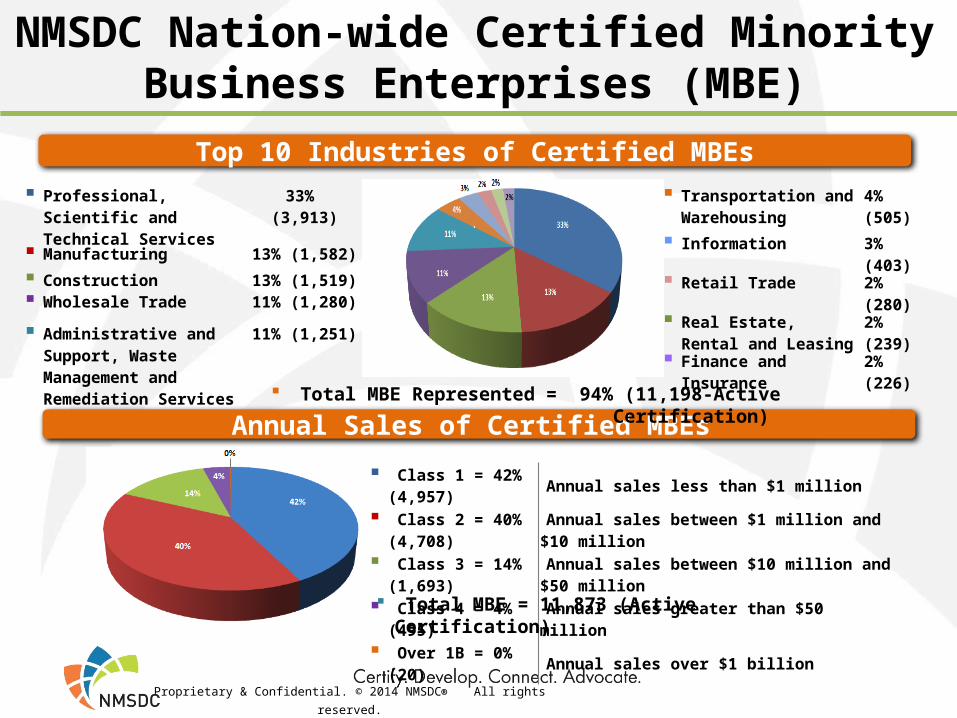
Class 1 = 42% (4,957) Annual sales less than $1 million Class 2 = 40% (4,708) Annual sales between $1 million and $10 million
Class 3 = 14% (1,693) Annual sales between $10 million and $50 million
Class 4 = 4% (495) Annual sales greater than $50 million
Over 1B = 0% (20) Annual sales over $1 billion
Top 10 Industries of Certified MBEs
Annual Sales of Certified MBEs
NMSDC Nation-wide Certified Minority Business Enterprises (MBE)
7
Total MBE = 11,873 (Active Certification)
Professional, Scientific and Technical Services
33% (3,913)
Manufacturing 13% (1,582)
Construction 13% (1,519) Wholesale Trade 11% (1,280)
Administrative and Support, Waste Management and Remediation Services
11% (1,251)
Transportation and Warehousing
4% (505)
Information 3% (403)
Retail Trade 2% (280)
Real Estate, Rental and Leasing
2% (239)
Finance and Insurance 2% (226)
Total MBE Represented = 94% (11,198-Active Certification)
Proprietary & Confidential. © 2014 NMSDC® All rights reserved.
Supplier Diversity and Economic Viability
Source: Minority Business Growth and Global Reach Fact Sheet, MBDA, 2011
Why should higher education care ? Value Proposition: Minority Business is critical to the economic growth of
U.S.
8
Proprietary & Confidential. © 2014 NMSDC® All rights reserved.
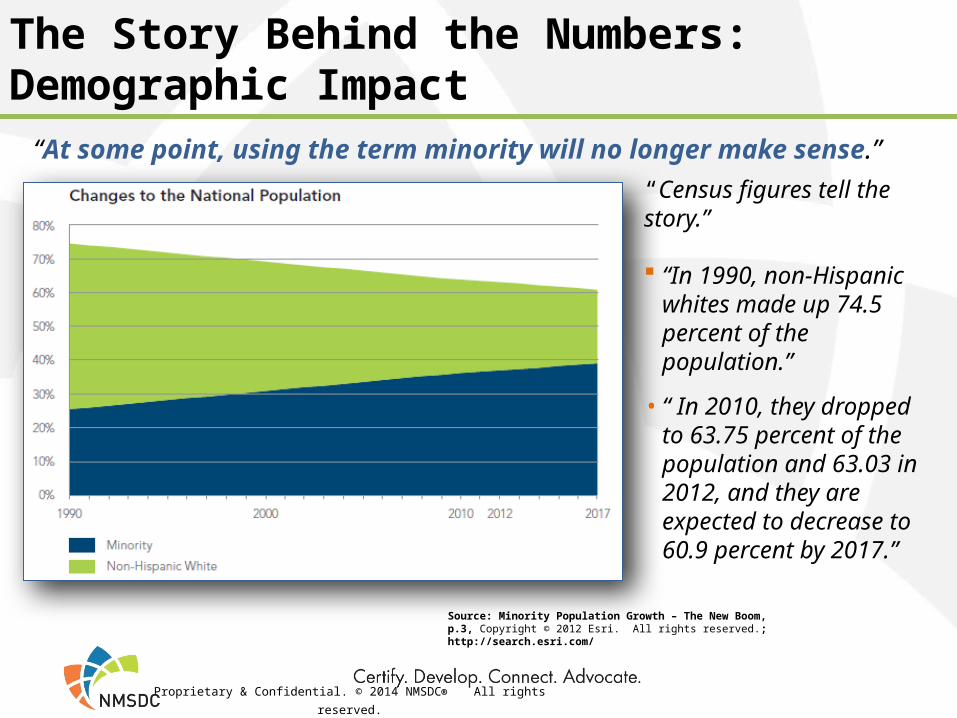
Source: Minority Population Growth – The New Boom, p.3, Copyright © 2012 Esri. All rights reserved.; http://search.esri.com/
The Story Behind the Numbers:Demographic Impact
“In 1990, non-Hispanic whites made up 74.5 percent of the population.”
• “ In 2010, they dropped to 63.75 percent of the population and 63.03 in 2012, and they are expected to decrease to 60.9 percent by 2017.”
“At some point, using the term minority will no longer make sense.”
“Census figures tell the story.”
9
Proprietary & Confidential. © 2014 NMSDC® All rights reserved.
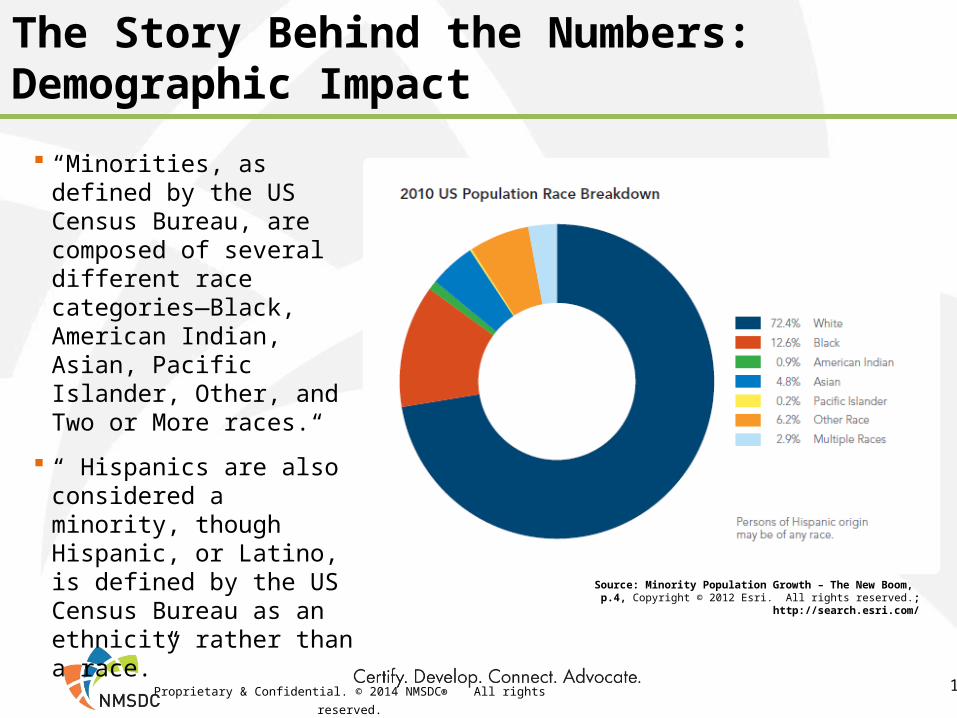
The Story Behind the Numbers:Demographic Impact
Source: Minority Population Growth – The New Boom, p.4, Copyright © 2012 Esri. All rights reserved.; http://search.esri.com/
“Minorities, as defined by the US Census Bureau, are composed of several different race categories—Black, American Indian, Asian, Pacific Islander, Other, and Two or More races.“
“ Hispanics are also considered a minority, though Hispanic, or Latino, is defined by the US Census Bureau as an ethnicity rather than a race.”
10
Proprietary & Confidential. © 2014 NMSDC® All rights reserved.
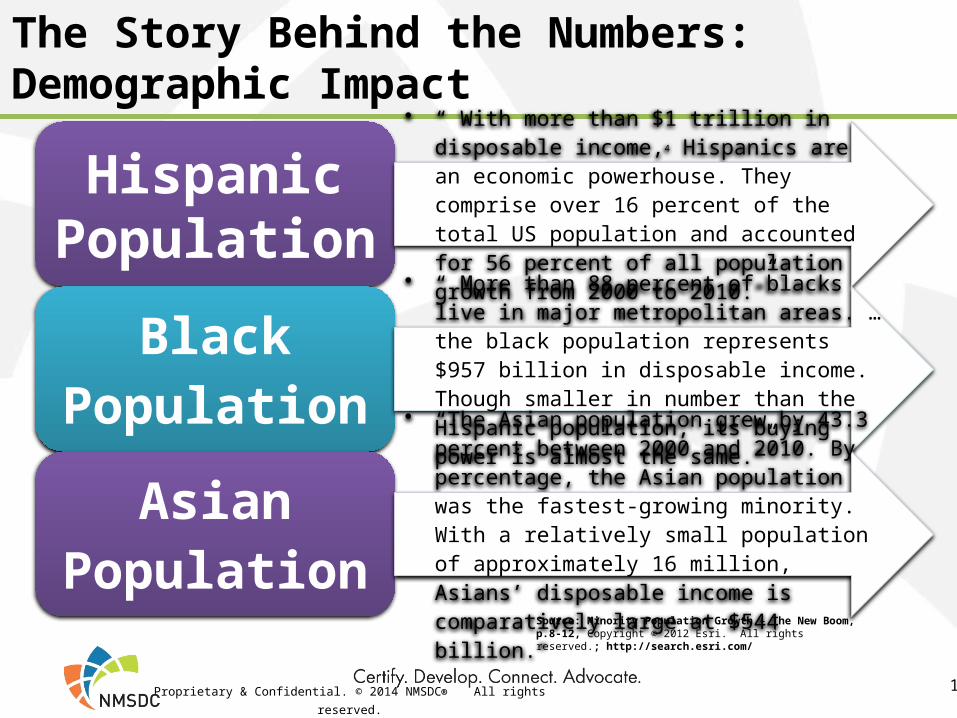
The Story Behind the Numbers:Demographic Impact
Hispanic Population
• “ With more than $1 trillion in disposable income,4 Hispanics are an economic powerhouse. They comprise over 16 percent of the total US population and accounted for 56 percent of all population growth from 2000 to 2010.”
Black Population
• “ More than 88 percent of blacks live in major metropolitan areas. …the black population represents $957 billion in disposable income. Though smaller in number than the Hispanic population, its buying power is almost the same.”
Asian Population
• “The Asian population grew by 43.3 percent between 2000 and 2010. By percentage, the Asian population was the fastest-growing minority. With a relatively small population of approximately 16 million, Asians’ disposable income is comparatively large at $544 billion.”
Source: Minority Population Growth – The New Boom, p.8-12, Copyright © 2012 Esri. All rights reserved.; http://search.esri.com/
11
Proprietary & Confidential. © 2014 NMSDC® All rights reserved.
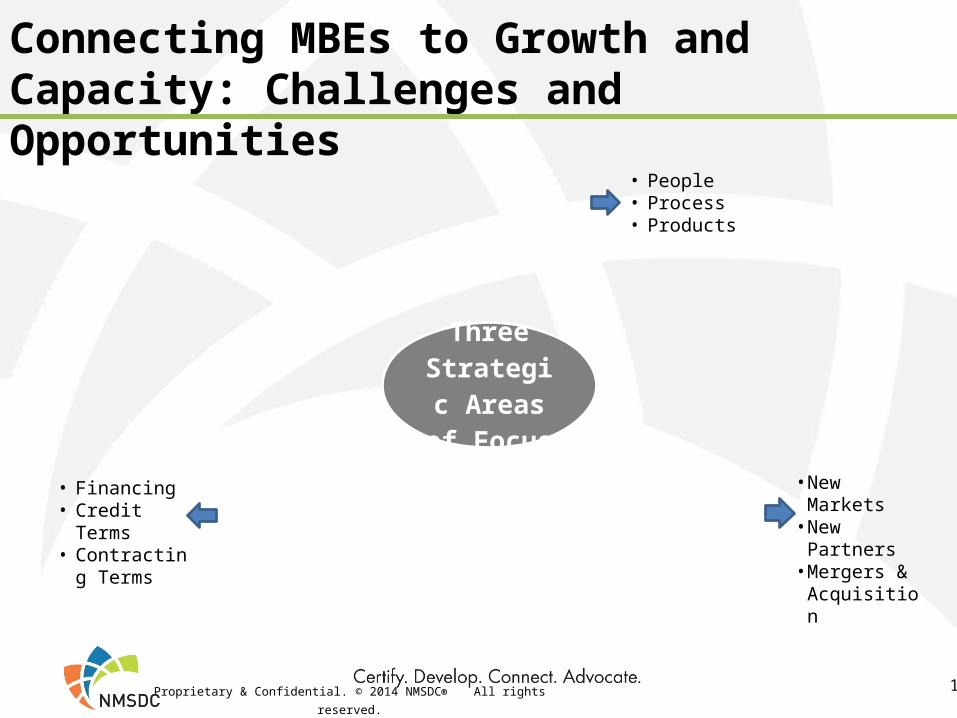
Connecting MBEs to Growth and Capacity: Challenges and Opportunities
Three Strategic Areas of Focus
12
• People• Process• Products
• New Markets• New Partners• Mergers &
Acquisition
• Financing• Credit Terms• Contracting
Terms
Proprietary & Confidential. © 2014 NMSDC® All rights reserved.
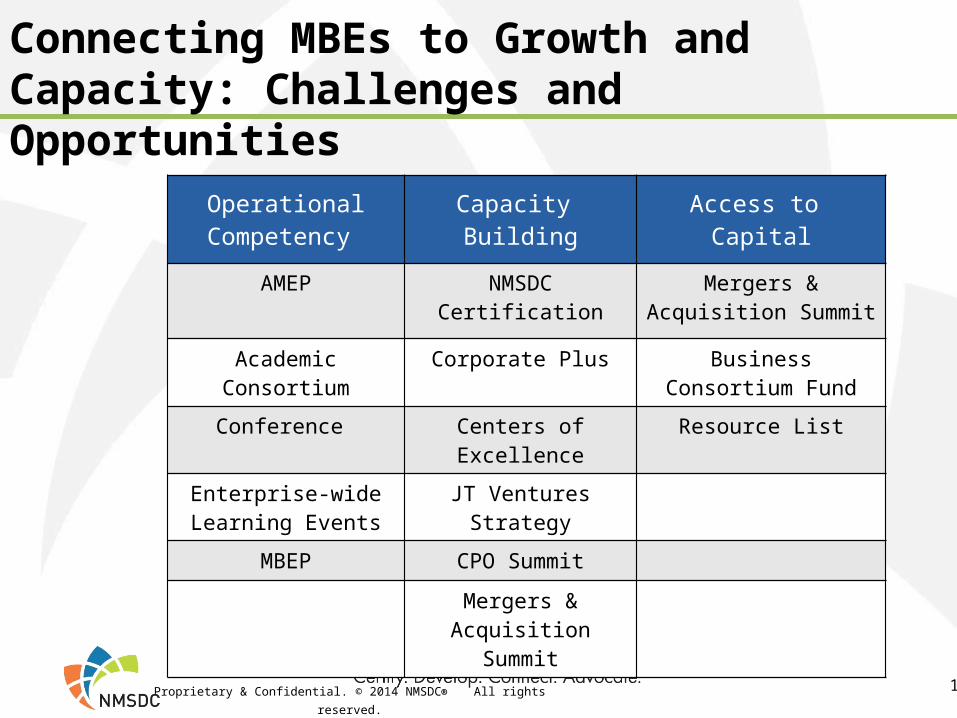
Operational Competency
Capacity BuildingAccess to
Capital
AMEP NMSDC Certification Mergers & Acquisition Summit
Academic Consortium Corporate Plus Business Consortium Fund
Conference Centers of Excellence Resource List
Enterprise-wide Learning Events
JT Ventures Strategy
MBEP CPO Summit
Mergers & Acquisition Summit
13
Connecting MBEs to Growth and Capacity: Challenges and Opportunities
NAEP Supplier Diversity Institute l Chicago, IL l August 4 – 5, 2014 15
NMSDC and Higher Education – a natural fit


![2009 NMSDC Annual Report[1]](https://img.pdfslide.us/doc/110x75/551e37ef4a795982108b4a7b/2009-nmsdc-annual-report1.jpg)