Embed Size (px)
Citation preview
August 2015
OIES PAPER: EL 13
Gas-to-power market and investment incentive for
enhancing generation capacity: an analysis of Ghana’s electricity sector
Jorik Fritsch Rahmatallah Poudineh
Gas-to-power market investment incentive for enhancing generation capacity:
an analysis of Ghana’s
i
The contents of this paper are the authors’ sole responsibility. They do not
necessarily represent the views of the Oxford Institute for Energy Studies or any of
its members.
Copyright © 2015
Oxford Institute for Energy Studies
(Registered Charity, No. 286084)
This publication may be reproduced in part for educational or non-profit purposes without special
permission from the copyright holder, provided acknowledgment of the source is made. No use of this
publication may be made for resale or for any other commercial purpose whatsoever without prior
permission in writing from the Oxford Institute for Energy Studies.
ISBN 978-1-78467-035-1
Gas-to-power market investment incentive for enhancing generation capacity:
an analysis of Ghana’s
ii
Contents
Abstract .................................................................................................................................................. 1
List of abbreviations ............................................................................................................................. 2
1. Introduction .................................................................................................................................... 3
2. The state of Ghana’s electricity sector ........................................................................................ 4
2.1 Power generation .......................................................................................................................... 4 2.2 Electricity sector institutions .......................................................................................................... 5 2.3 Access to electricity ....................................................................................................................... 6
3. Discovery of natural gas and implications for the electricity sector ....................................... 7
3.1 Delays and transparency in the gas sector development ............................................................. 9 4. Economic value of gas-to-power and export utilization .......................................................... 10
4.1 International precedents ............................................................................................................. 10 4.2 The economic value of gas-to-power utilization .......................................................................... 10 4.3 Construction of a LNG export terminal ........................................................................................ 11 4.4 The economic value of exports ................................................................................................... 12 4.5 Further economic and institutional evaluation: gas-to-power versus exports ............................. 14
5. Key challenges for advancement of Ghana’s electricity industry .......................................... 17
5.1 Effective tariff setting to encourage investment .......................................................................... 17 5.2 Lack of an effective regulatory framework for investment .......................................................... 22 5.3 Missing skills and experience ..................................................................................................... 22
6. Conclusion ................................................................................................................................... 24
Bibliography ........................................................................................................................................ 25
Figures
Figure 1: Peak capacity demand with 20% reserves margin (MW), 2012–2022 .................................... 4
Figure 2: Offshore oil and gas fields Ghana, 2011 ................................................................................. 7
Figure 3: Route of the West African Gas Pipeline (WAGP) .................................................................... 8
Figure 4: Infrastructure projects in Ghana’s natural gas sector, 2014 .................................................... 9
Figure 5: Cost of fuel (in US$ per MMBtu) to Ghana’s thermal power plants ....................................... 11
Figure 6: Institutional and regulatory framework of Ghana’s gas sector .............................................. 14
Figure 7: Fundamental principles of electricity tariff design .................................................................. 18
Figure 8: Generation and Distribution Tariffs in Ghana, 2007–2015 .................................................... 20
Figure 9: Inflation rate in Ghana, 2007–2014 ....................................................................................... 20
Tables Table 1: Installed electricity generation capacity Ghana, 2013 .............................................................. 4
Table 2: Economic netback gas price for the export scenario .............................................................. 13
Table 3: Ghana’s fiscal performance, 2013 .......................................................................................... 15
Table 4: Common electricity tariff structures ......................................................................................... 19
Table 5: End user distribution tariffs in Ghana, 2015 ............................................................................ 21
Gas-to-power market investment incentive for enhancing generation capacity:
an analysis of Ghana’s
1
Gas-to-power market and investment incentive for enhancing generation capacity: an analysis of Ghana’s electricity sector
Jorik Fritsch
SOAS, University of London, London, UK
Rahmatallah Poudineh1
Oxford Institute for Energy Studies, Oxford, UK
Abstract
Ghana’s electricity generation capacity is currently insufficient to meet demand, making
power outages and load shedding common. The resulting impact is potentially devastating for
the country’s growth prospects. Traditionally, lack of an affordable and reliable fuel supply
for power generation, coupled with ineffective institutions and an unfavourable investment
climate, have resulted in Ghana’s electricity sector performing poorly. In light of the 2007
discovery of natural gas reserves in Ghanaian waters, this paper examines whether domestic
gas could advance the performance of the electricity sector, and if so, how. The results of our
analysis show that utilization of gas reserves in Ghana’s gas-to-power market is an
economically superior strategy compared to an export-oriented utilization scheme. The lack
of an effective regulatory framework for investment, skill shortages, and an inefficient
electricity pricing structure continue to be the main constraining factors. Our analysis also
considers possible approaches to modification of the electricity tariff in order to send the right
signal to potential investors in generation capacity, without compromising the affordability of
power supply.
JEL classifications: L97, L98, L50
Keywords: gas to power, electricity in Ghana, generation adequacy, tariff setting
1 Corresponding author: Oxford institute for Energy Studies, 57 Woodstock Road, Oxford OX2 6FA, United Kingdom. Email:
[email protected]. The authors would like to thank Bassam Fattouh and Jonathan Stern for their invaluable
comments on the earlier version of this paper.
Gas-to-power market investment incentive for enhancing generation capacity:
an analysis of Ghana’s
2
List of abbreviations
AAF Automatic Adjustment Formula
Bcf Billion cubic feet
BOST Bulk Oil Supply and Transport Company
CAPEX Capital expenditures
ECG Electricity Company of Ghana
ESSDP Energy Sector Strategy and Development Plan
GDP Gross Domestic Product
GRIDCo Ghana Grid Company
IBT Inclining block tariff
IOC International oil and Gas Company
IPP Independent power producer
kWh kilowatt-hour
LCO Light crude oil
LNG Liquefied natural gas
MMBtu Million British thermal units
MMscfd Million standard cubic feet per day
NEDCo Northern Electricity Distribution Company
NES National Electrification Scheme
NGV Natural gas vehicle
PPP Public Private Partnership
PURC Public Utilities Regulatory Commission
SME Small and medium-sized enterprise
VALCO Volta Aluminium Company
VRA Volta River Authority
WAGP West African Gas Pipeline
Gas-to-power market investment incentive for enhancing generation capacity:
an analysis of Ghana’s
3
1. Introduction
Suffering from high inflation rates, falling commodity prices, and massive unemployment, Ghana was
at the brink of economic collapse at the start of the new millennium. Since then, however, the
economic climate in Ghana has improved and the country has received frequent praise from
international observers (IMF, 2013: 4; The Economist, 2013). Indeed, many have referred to Ghana
as Africa’s rising star (Lenhardt, Menocal, and Engel, 2015: 7; Brunts, 2008), thanks in no small
measure to the country’s stable multi-party democracy – by regional standards – and annual
economic growth rates in excess of 6 per cent over the last decade. With the increase of economic
activities and households’ income, the demand for electricity in Ghana has surged too. Crucially,
however, because Ghanaian generation capacity has not risen proportionally, electricity is presently in
short supply. Since 2008, load shedding has become an ordinary aspect of life for households and
firms in Ghana. As the cost of compensating for poor electricity reliability through back-up diesel
generators is immense, many of the small businesses have adjusted their opening hours in order to
avoid the worst of the load shedding and power outages in their local area. Such adaptive measures
significantly lower productivity. The lack of electricity therefore forms a serious barrier to further
economic growth and development in Ghana.2
According to the World Bank, Ghana currently loses 1 per cent in economic growth per annum due to
frequent power outages and systematic load shedding (World Bank, 2013: 76). Ghana Grid Company
(GRIDCo) – the public company in charge of electricity transmission – goes further, estimating that
the shortfall in electricity supply reduces economic growth by 2–6 per cent per annum (2010: 9).
Either way, comparing these estimates to Ghana’s average annual GDP growth of 6.5 per cent over
the last 10 years makes it clear that a shortage of electricity is taking a substantial toll on economic
growth in Ghana. On a microeconomic level, Ghanaian companies experienced additional operating
costs of $62m per month in 2014, due to power outages and load shedding which had to be bridged
through the use of expensive diesel generators (Boateng, 2014).
The 2007 discovery in Ghanaian waters of the Jubilee gas and oil field, which is estimated to hold 3
billion barrels of oil (bbl) and 335 billion cubic feet (Bcf) of natural gas, could have a significant impact
on the Ghana’s electricity sector. This paper discusses the resulting opportunities and challenges
faced by the electricity sector and explores the possible approaches for enhancing generation
adequacy. We examine how domestic gas could advance the performance of the electricity sector,
and outline the economic principles upon which the regulatory model for investment and electricity
tariffs need to be based in order to send the right signals to the potential investors in generation
capacity.
The next section provides an overview of the electricity sector in Ghana, before section 3 describes
the discovery of natural gas in 2007 and its implications for the sector. Section 4 explores the
economic value of gas-to-power and export utilization and also considers their institutional and
political economy perspectives. Key challenges facing the electricity sector in its bid to enhance its
reliability are explained in section 5, before concluding remarks are set out in section 6.
2 The supply of electricity provides an imperative foundation upon which economic growth can be achieved. According to
Bernard (2012, 41), reliable electricity supply ‘mostly acts as an enabler of development, potentially affecting a large array of
outcomes (economic, social, environmental, etc.)’. Also, Eberhard (2007: 236) concludes that connecting South African
townships to the electricity grid created the basis for more economic activity in townships (which some townships went on to
utilize better than others).
Gas-to-power market investment incentive for enhancing generation capacity:
an analysis of Ghana’s
4
2. The state of Ghana’s electricity sector
2.1 Power generation
Ghana’s current total dependable installed capacity for electricity generation amounts to 2,125 MW
(World Bank, 2013: 9), of which 51 per cent is hydroelectric, 48.9 per cent thermal, and 0.1 per cent
renewable (see Table 1 below).
Table 1: Installed electricity generation capacity Ghana, 2013
Generation company Installed capacity (MW)
Volta River Authority (VRA) Hydro 1,080
Volta River Authority (VRA) Thermal 771
Volta River Authority (VRA) Solar 3
Independent Power Producers (IPPs) Thermal 271
Source: World Bank (2013)
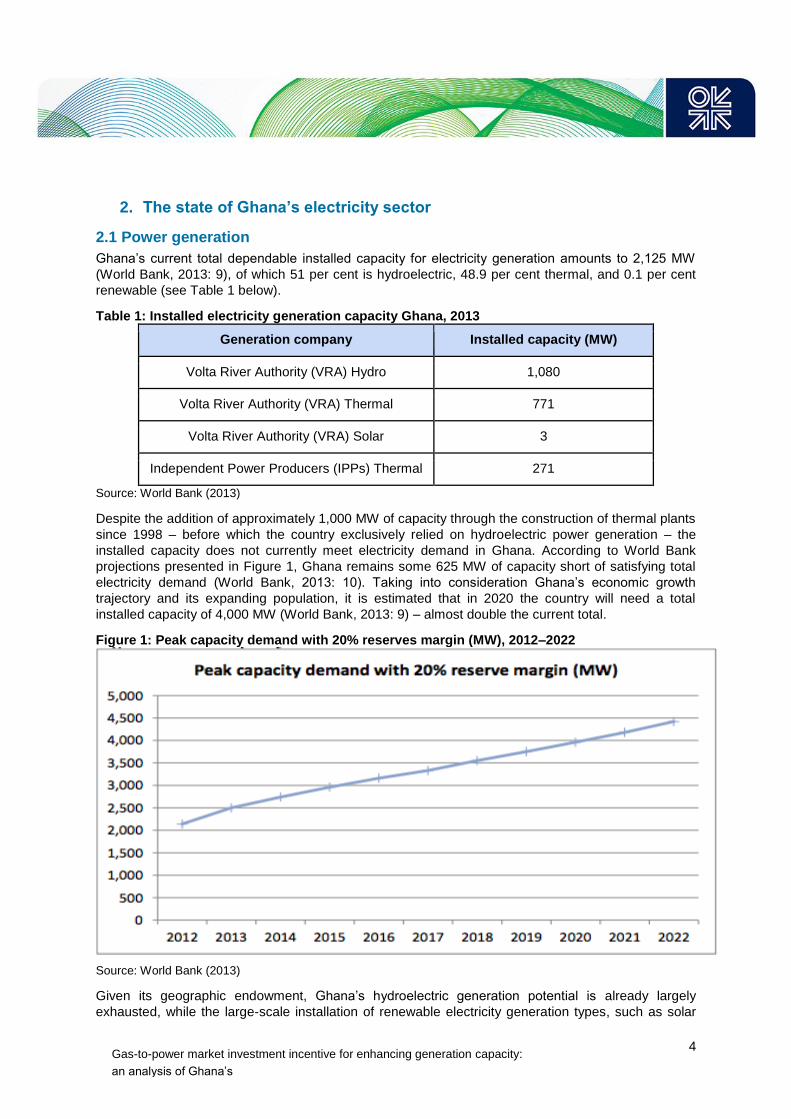
Despite the addition of approximately 1,000 MW of capacity through the construction of thermal plants
since 1998 – before which the country exclusively relied on hydroelectric power generation – the
installed capacity does not currently meet electricity demand in Ghana. According to World Bank
projections presented in Figure 1, Ghana remains some 625 MW of capacity short of satisfying total
electricity demand (World Bank, 2013: 10). Taking into consideration Ghana’s economic growth
trajectory and its expanding population, it is estimated that in 2020 the country will need a total
installed capacity of 4,000 MW (World Bank, 2013: 9) – almost double the current total.
Figure 1: Peak capacity demand with 20% reserves margin (MW), 2012–2022
Source: World Bank (2013)
Given its geographic endowment, Ghana’s hydroelectric generation potential is already largely
exhausted, while the large-scale installation of renewable electricity generation types, such as solar
Gas-to-power market investment incentive for enhancing generation capacity:
an analysis of Ghana’s
5
and wind, is not feasible in a region which has such little experience with renewable energies.
Therefore, efforts to catch up with Ghana’s rising demand for electricity are focused on increasing
thermal power generation. The Energy Sector Strategy and Development Plan (ESSDP), published
by the Ministry of Energy, explicitly states that achieving 50 per cent thermal-based generation
capacity by 2015 is a key goal of the country’s energy strategy (Ministry of Energy, 2010: 6). While
this goal has been narrowly missed (thermal generation capacity stands at 48.9%), efforts to increase
thermal power generation continue. The state-owned Volta River Authority (VRA) – Ghana’s main
electric power utility corporation – is in the process of upgrading simple-cycle plants to combined-
cycle plants (VRA, 2015). Together with greenfield thermal developments, the VRA is planning to add
1,000 MW of thermal capacity within five years.
Ghana’s thermal power plants have been (and are being) built with the intention to fuel them with
natural gas supplied to Ghana through the West African Gas Pipeline (WAGP). Contrary to the
expectations of the Ghanaian government, the WAGP has hitherto been unable to fulfil its role as a
reliable supplier of gas. After being delayed by two years, the WAGP eventually began transporting
gas from Nigeria to Ghana and other West African countries in 2009. To the disadvantage of thermal
generation, gas transfers to Ghana have been inconsistent ever since. Whereas 120m MMscfd
(million standard cubic feet per day) of gas exports were contractually agreed upon between the
Nigerian and Ghanaian governments, this quantity has never been provided by Nigeria due to high
domestic demand and political instability in Nigeria’s oil-producing regions. During 2014 Ghana on
average received only 30 MMscfd of gas (Energy Commission, 2014: 19). While this presents only
one fourth of the agreed volume, delivery performance improved compared to 2012 and 2013, when
damage to the pipeline in Togolese waters interrupted gas supply to Ghana for a 12-month period.
Even if Ghana was supplied with all of the contracted 120 MMscfd, this quantity would still not be
enough to fuel all of Ghana’s existing thermal power plants, let alone the future thermal developments
(Energy Commission, 2014: 43).
Due to the lack of reliable gas supplies, Light Crude Oil (LCO) has been the predominant fuel in
Ghana’s thermal power generation. Though LCO is less complex to import, its use in electricity
generation is extremely costly: compared to gas, thermal power generation using LCO is three times
more expensive (World Energy Council, 2013: 7). Since 2010, oil from Ghana’s Jubilee field can be
refined in the coastal town of Tema to be used as LCO in Ghana’s thermal plants. Yet this only makes
LCO marginally cheaper, as the opportunity cost of using Ghana’s oil as fuel for thermal generation is
high.
Lack of an affordable fuel for thermal power generation and the resulting dependency on expensive
LCO have placed a significant financial constraint on the Ghanaian electricity sector. To secure a
comparatively inexpensive fuel for thermal generation capacity, the availability of which the VRA and
Independent Power Producers (IPPs) can rely on, is thus a key challenge in ‘curing’ Ghana’s
electricity sector. The significance of this situation is elevated by the steadily decreasing water levels
of Lake Volta at the Akosombo Dam – home to Ghana’s crucial 1,020 MW Akosombo hydroelectric
plant. There is growing concern that the low water levels that have reduced generation capacity on
several occasions in past dry seasons may become a permanent problem (Andoh, 2014). Amidst a
long-term downwards trend, the average water level at Akosombo has fallen from 84 metres in 2010,
to 81 metres in 2012, and 77 metres in 2014. Thus, considering the existing power generation
capacity, Ghana’s electricity sector appears to be in a crisis.
2.2 Electricity sector institutions
Ghana’s electricity sector is largely comprised of state-owned companies. Private sector participation
can only be found in electricity generation: two independent power producers (IPPs) are operating
thermal plants that contribute 271 MW of installed capacity, which amounts to approximately 13 per
cent of Ghana’s overall capacity (World Bank, 2013: 9). The public VRA is the dominant actor in
electricity generation and is responsible for 1,854 MW of installed capacity, or 87 per cent of overall
Gas-to-power market investment incentive for enhancing generation capacity:
an analysis of Ghana’s
6
capacity. The VRA reported a loss of $28m in 2012, a loss of $39m in 2013, and is expected to
declare yet larger losses in its 2014 annual report (VRA, 2013). In the recent past, the VRA has
repeatedly failed to pay for its supplies of LCO on time and as a consequence is treated as a high-risk
client by oil suppliers. However, the VRA is not the only institution in the Ghanaian electricity sector
displaying financial fragility.
The Electricity Company of Ghana (ECG) is the country’s main electricity distribution company. Due to
poorly maintained infrastructure, a shortage of essential skills in Ghana’s labour pool, and operational
practices lacking transparency, the ECG suffers from significant system losses (27 per cent in 2012)
and a weak tariff collection regime (World Bank, 2013: 10). At a time when not enough electricity is
available in the first place, high system losses are particularly painful. The ECG declared a loss of
$41.5m in 2012 and is expected to have generated a loss of approximately $60m in 2013 (ECG,
2013: 17). The financial performance of the Northern Electricity Distribution Company (NEDCo),
responsible for distribution in northern Ghana, resembles that of the ECG.3
Considering the poor fiscal situation of Ghana’s electricity producers and distributors, the finances of
the Ghana Grid Company Limited (GRIDCo) – the sole publicly-owned electricity transmission
company – are surprisingly good. Operating at a small but consistent profit since the establishment of
the company in 2008, GRIDCo has been referred to as a ‘well-run transmission company’ that is
‘financially viable’ by the World Bank, which has also called for the company to be given more
responsibility in devising a long-term plan for the power sector (World Bank, 2013: 11).
Regulation of Ghana’s electricity sector is performed by the Public Utilities Regulatory Commission
(PURC). Although a mechanism is in place to ensure that tariffs are adjusted periodically – called the
automatic indexation scheme – PURC has struggled to alter electricity tariffs because of interference
from the government (World Bank, 2013: 31). The performance of PURC is further constrained by a
shortage of staff with experience and skills relevant to the work of a regulatory authority and low
levels of transparency in the commission’s decision making process on tariff adjustments. Ghana’s
electricity sector thus does not only suffer from insufficient generation capacity, but also from
financially unviable, inefficient key companies and poor regulation.
2.3 Access to electricity
Making electricity available to the entire population has been a stated goal of the Ghanaian
government since it approved the National Electrification Scheme (NES) in 1989 (Ministry of Energy,
1989: 29). At the time of the last survey in 2010, 60.5 per cent of Ghana’s households could access
electricity, making electricity in Ghana more available than anywhere else in West Africa (World Bank,
2010).
However, progress to achieve the NES goal to connect 100 per cent of Ghana’s households to the
electricity grid by 2020 has slowed considerably since the early 2000s. In 1989, with the electrification
rate running at 28 per cent, the Ghanaian government’s primary challenge was the expansion of
access (Abavana, 2011). Electricity demand has grown since then of course, partly due to the
increased number of people with power access. The government now has the double challenge of
complying with NES objectives to improve electricity access while raising generation capacity to meet
increased demand from the existing consumers. Confronted with this problem, the Ghanaian
government has reduced its efforts toward further electrification in order to avoid worsening the
shortages of existing electricity customers. This decision has been partly informed by the fact that
many of the communities that remain unconnected to electricity grids live in isolated rural areas that
lack political and economic influence. Ghana’s dearth of electricity thus contributes to rising inequality
in the country.
3 The NEDCo distributes electricity in Ghana’s less densely populated north and in terms of unit sales is substantially smaller than the ECG.
Gas-to-power market investment incentive for enhancing generation capacity:
an analysis of Ghana’s
7
3. Discovery of natural gas and implications for the electricity sector
Kosmos Energy discovered the Jubilee oil and gas field in Ghanaian waters in 2007. Estimated to
hold 3 billion barrels of oil (bbl) and 335 billion cubic feet (Bcf) of natural gas, the discovery is of great
significance for Ghana’s energy sector. While oil production at the Jubilee field began in 2010,
associated gas has not yet been produced. As the government’s Energy Sector Strategy and
Development Plan (2010) banned the flaring of gas in order to maximize benefits of gas utilization,
associated gas has until now been re-injected into the Jubilee field (Ministry of Energy, 2010: 18). Oil
production levels have been suffering from this practice (Dontoh, 2014). In the wake of the Jubilee
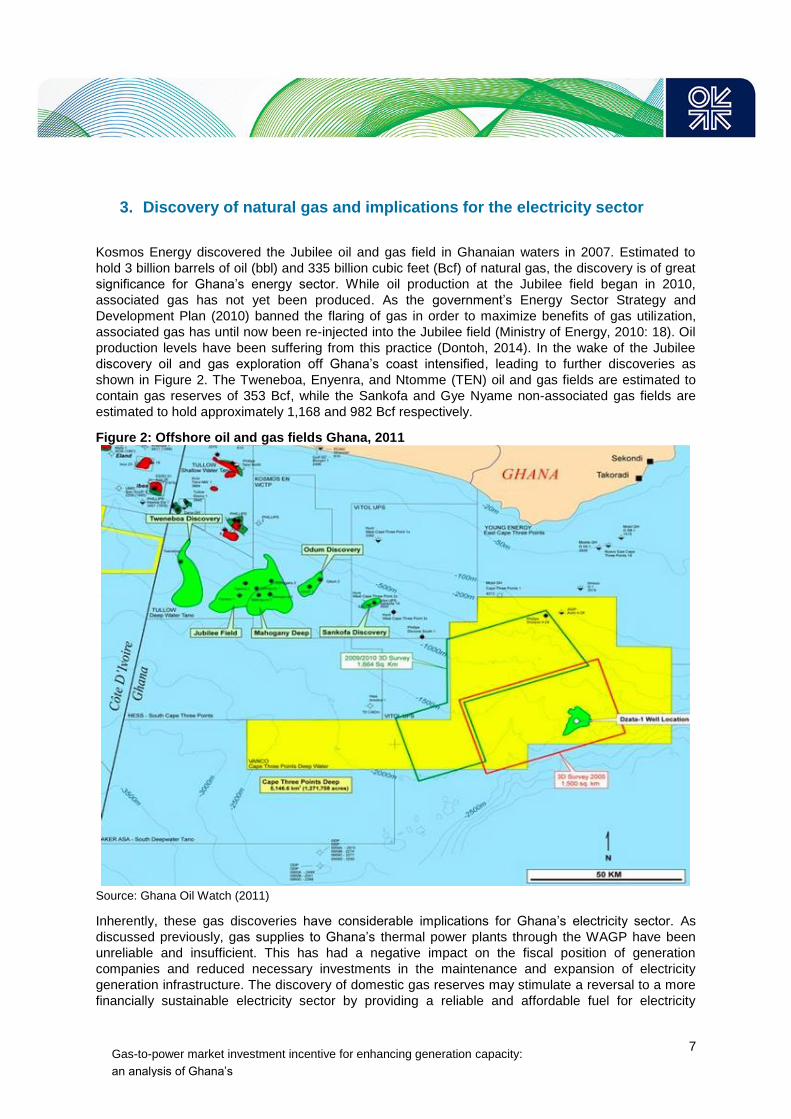
discovery oil and gas exploration off Ghana’s coast intensified, leading to further discoveries as
shown in Figure 2. The Tweneboa, Enyenra, and Ntomme (TEN) oil and gas fields are estimated to
contain gas reserves of 353 Bcf, while the Sankofa and Gye Nyame non-associated gas fields are
estimated to hold approximately 1,168 and 982 Bcf respectively.
Figure 2: Offshore oil and gas fields Ghana, 2011
Source: Ghana Oil Watch (2011)
Inherently, these gas discoveries have considerable implications for Ghana’s electricity sector. As
discussed previously, gas supplies to Ghana’s thermal power plants through the WAGP have been
unreliable and insufficient. This has had a negative impact on the fiscal position of generation
companies and reduced necessary investments in the maintenance and expansion of electricity
generation infrastructure. The discovery of domestic gas reserves may stimulate a reversal to a more
financially sustainable electricity sector by providing a reliable and affordable fuel for electricity
Gas-to-power market investment incentive for enhancing generation capacity:
an analysis of Ghana’s
8
generation. In theory, the use of domestic gas reserves can greatly improve the VRA’s fiscal position,
allowing it to invest in additional generation capacity and make Ghana more attractive for IPPs. Also,
developing gas to power market reduces reliance on Nigerian imports through the WAGP. Thus, the
utilization of domestic gas reserves would be a large step towards enhancing the performance of the
electricity sector. In addition, relative to the utilization of LCO, gas is also an environmentally friendly
fuel with lower outputs of harmful air emissions (US Environmental Protection Agency, 2015).
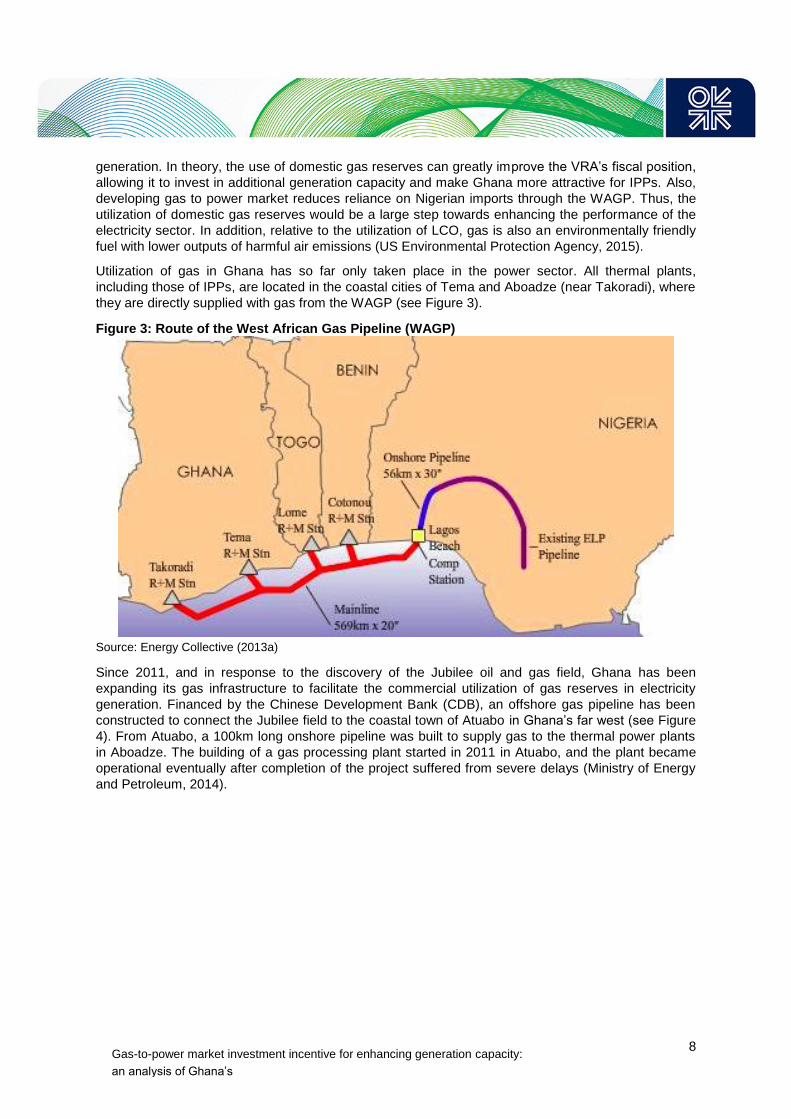
Utilization of gas in Ghana has so far only taken place in the power sector. All thermal plants,
including those of IPPs, are located in the coastal cities of Tema and Aboadze (near Takoradi), where
they are directly supplied with gas from the WAGP (see Figure 3).
Figure 3: Route of the West African Gas Pipeline (WAGP)
Source: Energy Collective (2013a)
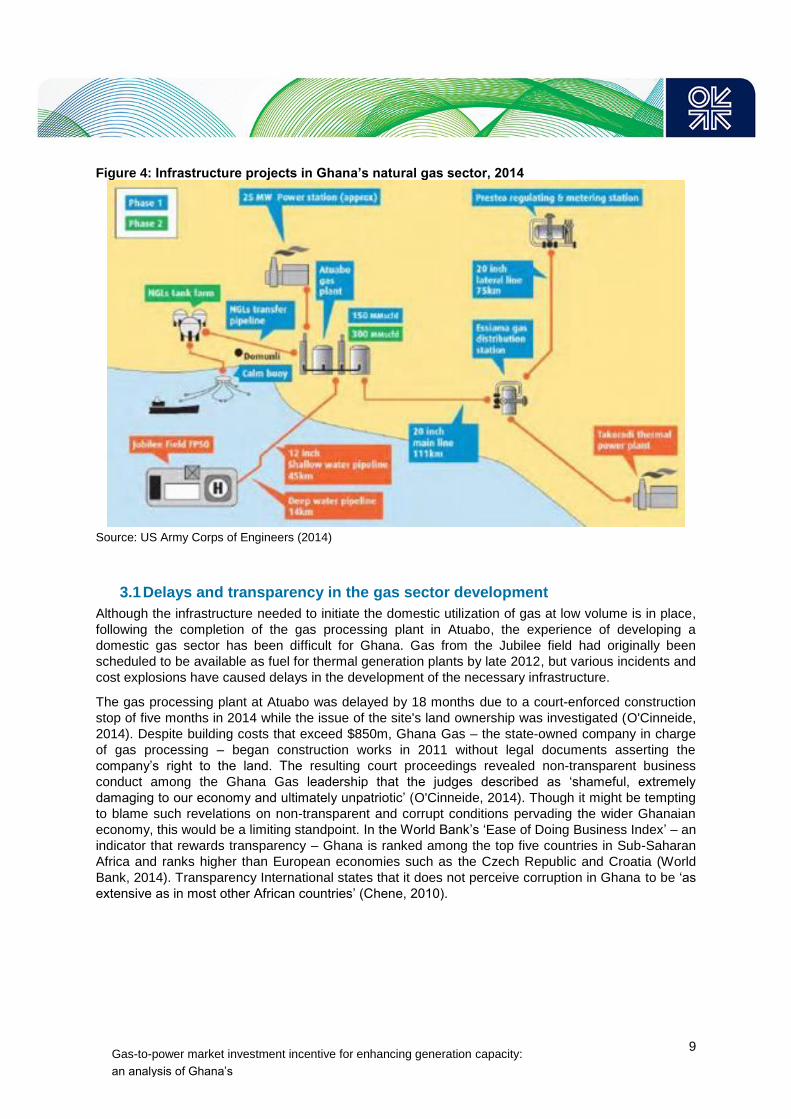
Since 2011, and in response to the discovery of the Jubilee oil and gas field, Ghana has been
expanding its gas infrastructure to facilitate the commercial utilization of gas reserves in electricity
generation. Financed by the Chinese Development Bank (CDB), an offshore gas pipeline has been
constructed to connect the Jubilee field to the coastal town of Atuabo in Ghana’s far west (see Figure
4). From Atuabo, a 100km long onshore pipeline was built to supply gas to the thermal power plants
in Aboadze. The building of a gas processing plant started in 2011 in Atuabo, and the plant became
operational eventually after completion of the project suffered from severe delays (Ministry of Energy
and Petroleum, 2014).
Gas-to-power market investment incentive for enhancing generation capacity:
an analysis of Ghana’s
9
Figure 4: Infrastructure projects in Ghana’s natural gas sector, 2014
Source: US Army Corps of Engineers (2014)
3.1 Delays and transparency in the gas sector development
Although the infrastructure needed to initiate the domestic utilization of gas at low volume is in place,
following the completion of the gas processing plant in Atuabo, the experience of developing a
domestic gas sector has been difficult for Ghana. Gas from the Jubilee field had originally been
scheduled to be available as fuel for thermal generation plants by late 2012, but various incidents and
cost explosions have caused delays in the development of the necessary infrastructure.
The gas processing plant at Atuabo was delayed by 18 months due to a court-enforced construction
stop of five months in 2014 while the issue of the site's land ownership was investigated (O'Cinneide,
2014). Despite building costs that exceed $850m, Ghana Gas – the state-owned company in charge
of gas processing – began construction works in 2011 without legal documents asserting the
company’s right to the land. The resulting court proceedings revealed non-transparent business
conduct among the Ghana Gas leadership that the judges described as ‘shameful, extremely
damaging to our economy and ultimately unpatriotic’ (O'Cinneide, 2014). Though it might be tempting
to blame such revelations on non-transparent and corrupt conditions pervading the wider Ghanaian
economy, this would be a limiting standpoint. In the World Bank’s ‘Ease of Doing Business Index’ – an
indicator that rewards transparency – Ghana is ranked among the top five countries in Sub-Saharan
Africa and ranks higher than European economies such as the Czech Republic and Croatia (World
Bank, 2014). Transparency International states that it does not perceive corruption in Ghana to be ‘as
extensive as in most other African countries’ (Chene, 2010).
Gas-to-power market investment incentive for enhancing generation capacity:
an analysis of Ghana’s
10
4. Economic value of gas-to-power and export utilization
4.1 International precedents
Countries can utilize natural gas reserves in a number of ways. Gas can be employed for industrial
use (for example to produce cement), to produce fertilizers, to heat homes, or to fuel natural gas
vehicles (NGVs). This paper, however, is focused on the in-depth evaluation of two options: the gas-
to-power utilization of gas and gas exports. Many countries around the world began the development
of their domestic gas sectors with the advancement of the gas-to-power market (Cho, 2010: 97),
including Colombia, Thailand, Israel, Tanzania, and many others. Not only does gas-to-power
utilization generate a high economic value of gas compared to most other domestic utilization
opportunities, it also has positive spillover effects as reliable and sufficient electricity supply enables
growth. On the other hand, countries such as Yemen, Nigeria, and Indonesia have prioritized gas
exports. This is while the need for gas as a fuel for thermal electricity generation in these three
countries is no less than in Tanzania or Thailand. However, for reasons examined below, some
countries decided to export their gas reserves instead of utilizing it domestically in the gas-to-power
market (as well as other sectors at a later stage). To pursue a mixed strategy of creating both a
domestic gas-to-power industry and export facilities is not an option in Ghana’s case: the required
infrastructure investments for both options relative to Ghana’s total proved gas reserves are unviable
(Nexant, 2014: 9).
This section examines the economic value of both utilization options. The opportunity cost of an
export policy is the domestic utilization of gas reserves, and the opportunity cost of domestic gas
utilization is the foregone revenue from exports. In order to determine which of the two options the
government of Ghana should pursue, we must assess the economic value of exports and domestic
gas-to-power utilization.
4.2 The economic value of gas-to-power utilization
With insufficient supply of gas available to the domestic gas-to-power market, thermal plants have
been fuelled with LCO. Ghana imported LCO until 2010 but now refines oil for this purpose from the
Jubilee oil field. Yet despite the availability of domestic oil, the opportunity of producing gas and
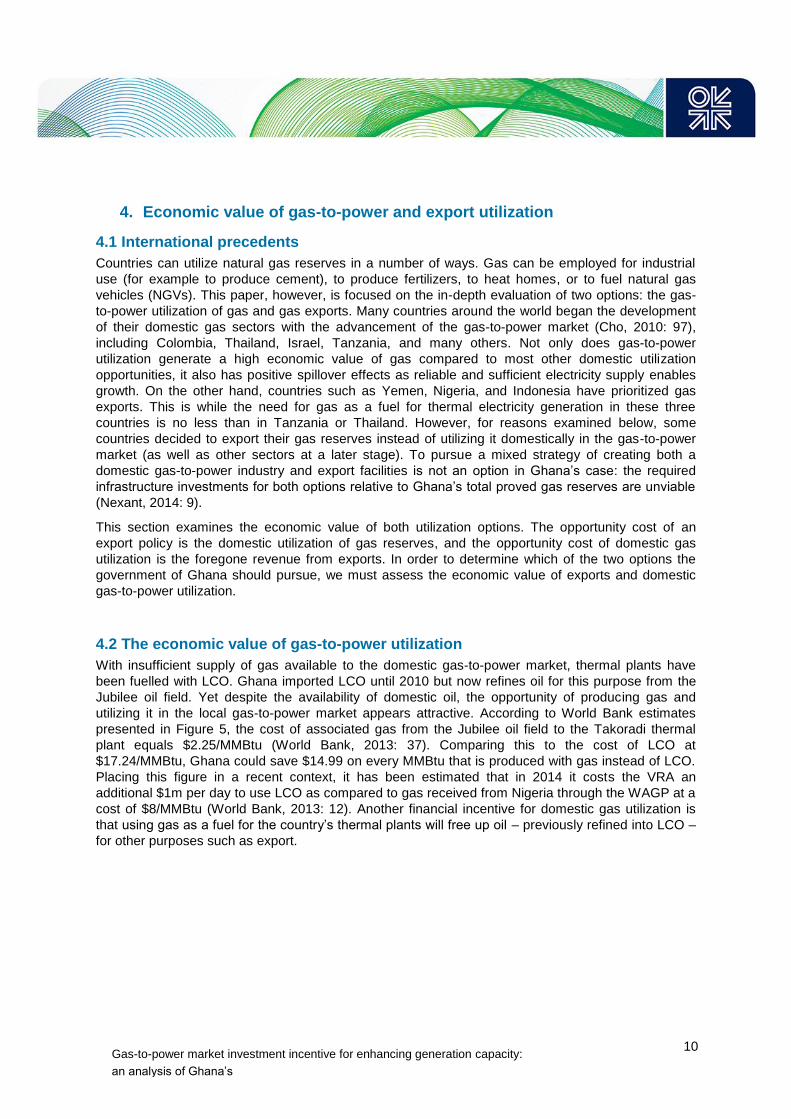
utilizing it in the local gas-to-power market appears attractive. According to World Bank estimates
presented in Figure 5, the cost of associated gas from the Jubilee oil field to the Takoradi thermal
plant equals $2.25/MMBtu (World Bank, 2013: 37). Comparing this to the cost of LCO at
$17.24/MMBtu, Ghana could save $14.99 on every MMBtu that is produced with gas instead of LCO.
Placing this figure in a recent context, it has been estimated that in 2014 it costs the VRA an
additional $1m per day to use LCO as compared to gas received from Nigeria through the WAGP at a
cost of $8/MMBtu (World Bank, 2013: 12). Another financial incentive for domestic gas utilization is
that using gas as a fuel for the country’s thermal plants will free up oil – previously refined into LCO –
for other purposes such as export.
Gas-to-power market investment incentive for enhancing generation capacity:
an analysis of Ghana’s
11
Figure 5: Cost of fuel (in US$ per MMBtu) to Ghana’s thermal power plants
Source: World Bank (2013)
Assuming that operations and maintenance (O&M) costs do not differ based on gas or LCO used as
fuel in thermal plants, gas could be sold to the VRA and IPPs at a price just below the price of LCO.
Even if gas was sold to thermal plants at a marginally cheaper rate than LCO ($16/MMBtu for
example), this would still create an economic incentive for the VRA and IPPs, as costs can be cut and
profit margins improved. In practice, thermal plants have been heavily subsidized by the Ghanaian
government as electricity generation tariffs have not been adjusted to take into account the need to
use expensive LCO for thermal power production. Instead of selling gas to thermal plants at its
economic price, one can thus assume it will be offered at a lower price (for instance $8/MMBtu – the
same price at which WAGP supplies gas) thereby replacing existing direct subsidies.
4.3 Construction of a LNG export terminal
The global demand for LNG is growing rapidly. From an annual demand of 100m tonnes in 2000, it
had soared to more than 200m tonnes in 2010 and is projected to reach 400m tonnes by 2020 (Ernst
& Young, 2014). In light of this forecast, LNG export terminals worldwide have been highly successful
in securing finance, although this is becoming a more difficult task given: the recent decline in the oil
price, cuts in capital expenditure by the energy industry, and the highly uncertain outlook for LNG
given the uncertainty in regional demand outlooks in the light of new LNG supply currently under
construction. Nevertheless, after looking at two recent LNG export terminal construction projects in
Nigeria and Papua New Guinea, the financing for an LNG export terminal in Ghana still seems highly
feasible.
Nigeria, a fellow West African country, is home to massive gas reserves that it uses domestically and
exports, both through the WAGP and in the form of LNG. An LNG export terminal project known as
NLNGPlus raised $2.2bn for the development of a new export terminal in 2006. Although Nigeria has
a much lower ranking in the World Bank’s ‘Ease of Doing Business Index’ than Ghana and has a
higher likelihood of political risks emerging, 20 international commercial banks and the African
Gas-to-power market investment incentive for enhancing generation capacity:
an analysis of Ghana’s
12
Development Bank provided loans for the project (Doing Business, 2014; Maplecroft, 2014; Lee,
2013: 6).4 For an LNG export project completed in 2014 in Papua New Guinea – a country with a
GDP per capita 35 per cent lower than that of Ghana – $19bn in funds were sourced from a variety of
commercial banks and international organizations (Lee, 2013: 8). The involvement of export credit
agencies providing loan guarantees proved crucial to attract loans from commercial banks in both
projects.
With the demand for LNG growing and a range of precedents for successfully financed LNG export
projects, it is probable that Ghana will be able to attract financing for an export facility. The
attractiveness of an LNG export project in Ghana is heightened by a combination of recent
technological innovations and the fact that the country’s gas reserves are offshore. Floating LNG
(FLNG) export terminals have been pioneered by Shell in Australia since 2011 and have been gaining
popularity for the liquefaction of offshore gas reserves (Shell, 2014). Located directly above the gas
reserves, FLNG export vessels remove the need for expensive pipelines to an onshore terminal,
thereby reducing environmental impact and capital expenditures (CAPEX). At an approximate price of
$2.4bn for an FLNG export vessel, the capital cost per tonne of LNG produced with an FLNG vessel
is roughly $540 as compared to greenfield onshore terminals that commonly feature capital costs of
$2,500 (Riviera, 2013). With comparatively little funding needed for a FLNG export terminal, a viable
LNG export project in Ghana is therefore a practicable option.
For the export scenario, LNG is considered Ghana’s only realistic option for export within a five-year
timeframe. Pipeline exports to countries in the region are not feasible. The WAGP transports gas from
Nigeria to Ghana via Benin and Togo. To reverse the flow of gas in order for Ghana to export gas to
Benin and Togo is not possible due to binding contracts not due to expire before 2030 (West African
Gas Pipeline Company, 2014). To build an entirely new pipeline within five years to do the job is
equally inconceivable. Apart from Benin and Togo, the negotiations regarding a pipeline that supplies
regional states with Ghanaian gas would need to be preceded by lengthy domestic discussions in
those countries on whether to develop a domestic gas market at all.
4.4 The economic value of exports
With LNG thus being Ghana’s only feasible export option, the economic value of exporting gas in this
manner can be determined by using the economic netback method. The netback is calculated by
subtracting all costs associated with delivering LNG from the price for gas. The figures presented in
Table 2 assume that Ghana will export its LNG to Japan, which was the world’s largest importer of
LNG in 2014.
4 In the Ease of Doing Business ranking Nigeria is ranked 170th, while Ghana is ranked 70th. In Maplecroft’s Political Risk Index Nigeria is described as a ‘high risk country’, while Ghana is a ‘medium risk country’.
Gas-to-power market investment incentive for enhancing generation capacity:
an analysis of Ghana’s
13
Table 2: Economic netback gas price for the export scenario
$/MMBtu
Long-term gas price forecast 7.3
Transport cost from Jubilee oil field to LNG export
terminal
0.5
Liquefaction costs 1.3
Shipping costs to Japan 1.8
Regasification costs 0.4
Economic Netback Gas Price 3.3
Source: World Bank (2013) and authors’ calculations
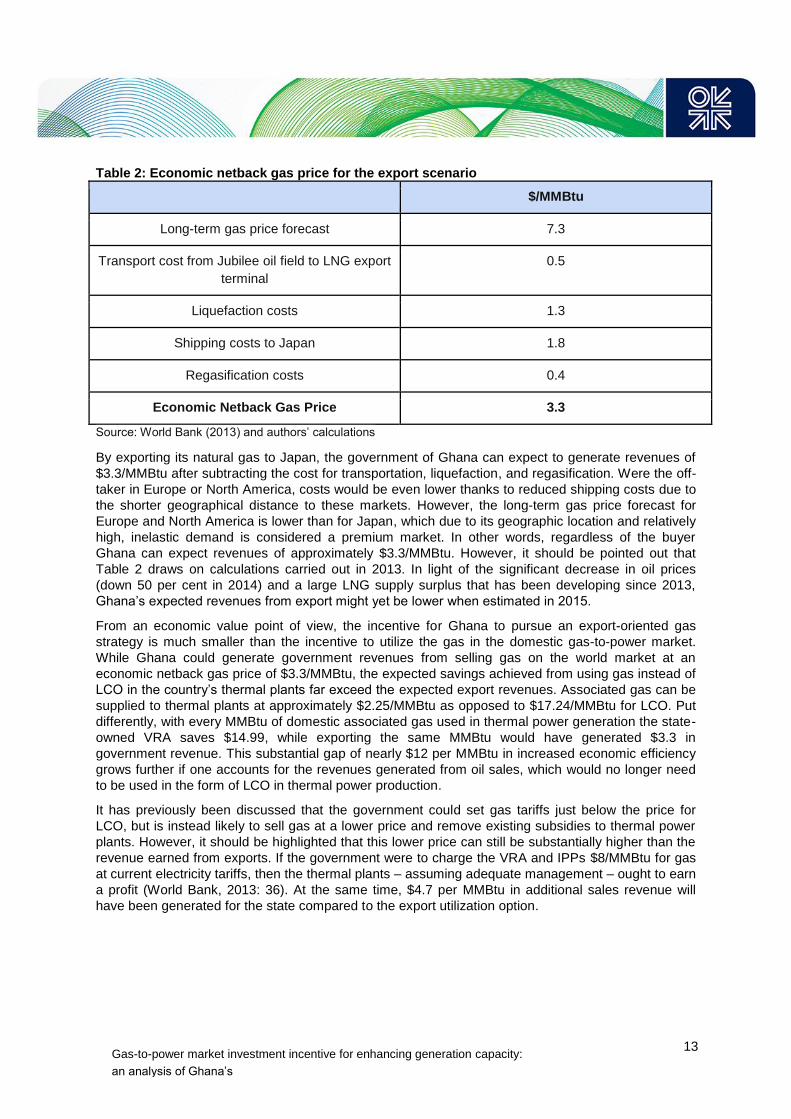
By exporting its natural gas to Japan, the government of Ghana can expect to generate revenues of
$3.3/MMBtu after subtracting the cost for transportation, liquefaction, and regasification. Were the off-
taker in Europe or North America, costs would be even lower thanks to reduced shipping costs due to
the shorter geographical distance to these markets. However, the long-term gas price forecast for
Europe and North America is lower than for Japan, which due to its geographic location and relatively
high, inelastic demand is considered a premium market. In other words, regardless of the buyer
Ghana can expect revenues of approximately $3.3/MMBtu. However, it should be pointed out that
Table 2 draws on calculations carried out in 2013. In light of the significant decrease in oil prices
(down 50 per cent in 2014) and a large LNG supply surplus that has been developing since 2013,
Ghana’s expected revenues from export might yet be lower when estimated in 2015.
From an economic value point of view, the incentive for Ghana to pursue an export-oriented gas
strategy is much smaller than the incentive to utilize the gas in the domestic gas-to-power market.
While Ghana could generate government revenues from selling gas on the world market at an
economic netback gas price of $3.3/MMBtu, the expected savings achieved from using gas instead of
LCO in the country’s thermal plants far exceed the expected export revenues. Associated gas can be
supplied to thermal plants at approximately $2.25/MMBtu as opposed to $17.24/MMBtu for LCO. Put
differently, with every MMBtu of domestic associated gas used in thermal power generation the state-
owned VRA saves $14.99, while exporting the same MMBtu would have generated $3.3 in
government revenue. This substantial gap of nearly $12 per MMBtu in increased economic efficiency
grows further if one accounts for the revenues generated from oil sales, which would no longer need
to be used in the form of LCO in thermal power production.
It has previously been discussed that the government could set gas tariffs just below the price for
LCO, but is instead likely to sell gas at a lower price and remove existing subsidies to thermal power
plants. However, it should be highlighted that this lower price can still be substantially higher than the
revenue earned from exports. If the government were to charge the VRA and IPPs $8/MMBtu for gas
at current electricity tariffs, then the thermal plants – assuming adequate management – ought to earn
a profit (World Bank, 2013: 36). At the same time, $4.7 per MMBtu in additional sales revenue will
have been generated for the state compared to the export utilization option.
Gas-to-power market investment incentive for enhancing generation capacity:
an analysis of Ghana’s
14
4.5 Further economic and institutional evaluation: gas-to-power versus exports
Based on an economic value analysis, it is evident that the government should utilize the country’s
gas reserves in the domestic gas-to-power market rather than to earn export revenues. However, as
the decision of countries such as Yemen and Nigeria to prefer the export option demonstrates,
economic value is not the only criterion upon which the choice whether to export or domestically
utilize gas reserves is made. Ghana’s domestic gas sector has experienced a range of severe
problems, raising the issue of whether further efforts to develop the domestic gas sector should be
abandoned in favour of an export strategy. These problems relate to the lack of adequately trained
and experienced staff and poor institutional development in terms of the sector’s design, competition,
and regulation.
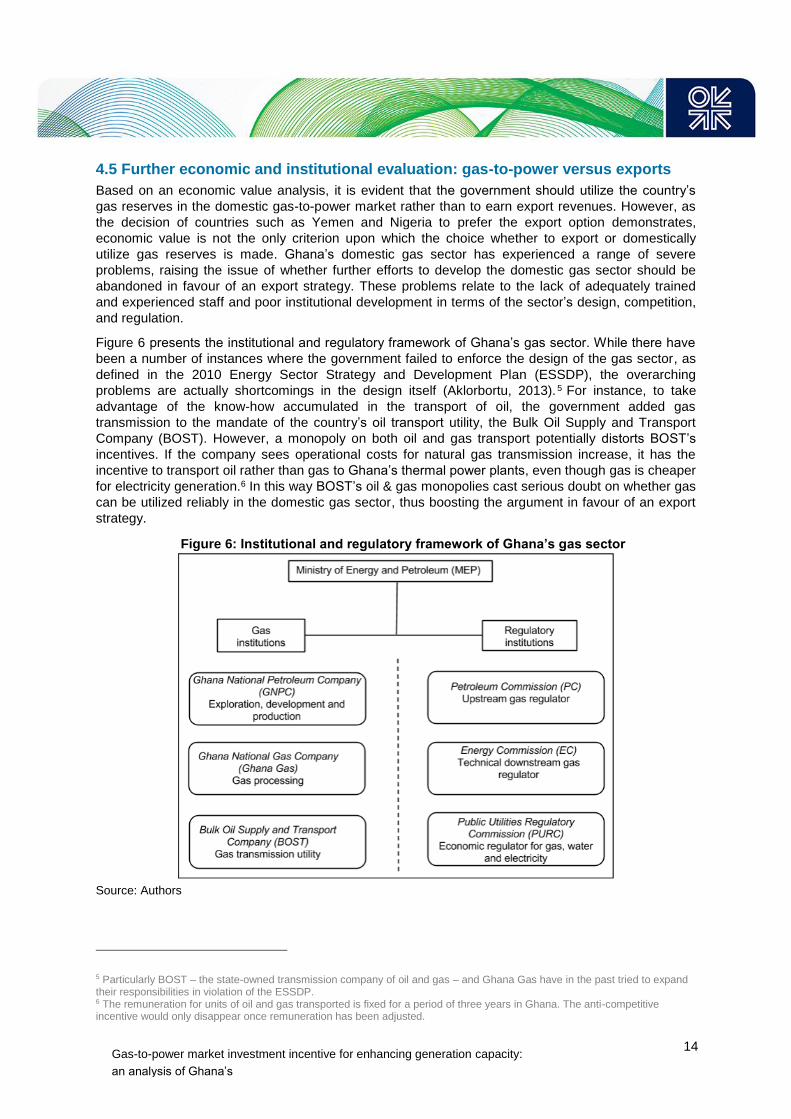
Figure 6 presents the institutional and regulatory framework of Ghana’s gas sector. While there have
been a number of instances where the government failed to enforce the design of the gas sector, as
defined in the 2010 Energy Sector Strategy and Development Plan (ESSDP), the overarching
problems are actually shortcomings in the design itself (Aklorbortu, 2013).5 For instance, to take
advantage of the know-how accumulated in the transport of oil, the government added gas
transmission to the mandate of the country’s oil transport utility, the Bulk Oil Supply and Transport
Company (BOST). However, a monopoly on both oil and gas transport potentially distorts BOST’s
incentives. If the company sees operational costs for natural gas transmission increase, it has the
incentive to transport oil rather than gas to Ghana’s thermal power plants, even though gas is cheaper
for electricity generation.6 In this way BOST’s oil & gas monopolies cast serious doubt on whether gas
can be utilized reliably in the domestic gas sector, thus boosting the argument in favour of an export
strategy.
Figure 6: Institutional and regulatory framework of Ghana’s gas sector
Source: Authors
5 Particularly BOST – the state-owned transmission company of oil and gas – and Ghana Gas have in the past tried to expand their responsibilities in violation of the ESSDP. 6 The remuneration for units of oil and gas transported is fixed for a period of three years in Ghana. The anti-competitive incentive would only disappear once remuneration has been adjusted.
Gas-to-power market investment incentive for enhancing generation capacity:
an analysis of Ghana’s
15
Furthermore, Ghana divides the regulatory responsibilities in the downstream gas sector between a
technical regulator and an economic regulator (see Figure 7) – a mechanism that is unique in gas
regulation worldwide (Kapika and Eberhard, 2013: 195). This dual approach is often criticized for a
number of reasons, chiefly the lengthy decision-making process due to consultation processes
between the two regulators, and the fact that some issues may be addressed by both regulators while
others remain entirely unaddressed (Kapika and Eberhard, 2013: 206). While dual regulation
encourages specialization, equal attention to technical and economic regulation, and competition
between the two regulators, the lack of qualified human capital to pursue gas regulation in general –
not to mention an unexplored approach for which no experience-based guidelines are available–
implies that Ghana should avoid experimenting with new methods of regulation. Like the decision to
place BOST in charge of oil and gas transport, a regulatory arrangement has been selected that is
highly unusual by international standards of best practice. The current regulatory framework of the
gas sector exposes it to substantial risks, especially given that Ghana is the first country to use dual
regulation. Opting to utilize Ghana’s gas reserves for export would avoid these domestic regulatory
risks.
Given the severe capacity constraints among the institutions of Ghana’s gas sector highlighted above,
the government is highly reliant on IOCs to develop its gas reserves. IOCs inherent skills and
experience in energy markets – developing infrastructure, securing financing etc. – are essential to
create enabling conditions in the Ghanaian gas-to-power market. Thus the preferences of IOCs
matter a great deal, specifically as to whether to engage in upstream and downstream activities aimed
at export or for domestic utilization. IOCs usually favour utilization of gas reserves for exports as
opposed to domestic utilization. For IOCs, the world market for LNG is more attractive than producing
gas for the domestic market, particularly with regard to pricing and flexibility. In particular, due to a
larger role that IOCs play in the export process, IOCs usually earn higher revenues from export
projects. In addition, encouraging export strategies allows IOCs to avoid the fragility of domestic gas
markets, including the risk of the VRA being unable to pay for gas supplies. IOCs are thus unlikely to
offer Ghana the same level of financial, technical, and managerial support for developing its domestic
gas-to-power market as they might if Ghana opted for an export-led strategy.
Finally, earning a steady flow of export revenues from selling fossil fuels abroad is obviously an
attractive option, especially for developing countries. Yemen, previously mentioned for its strategic
decision to focus on the export of its gas reserves, funds nearly its entire government budget through
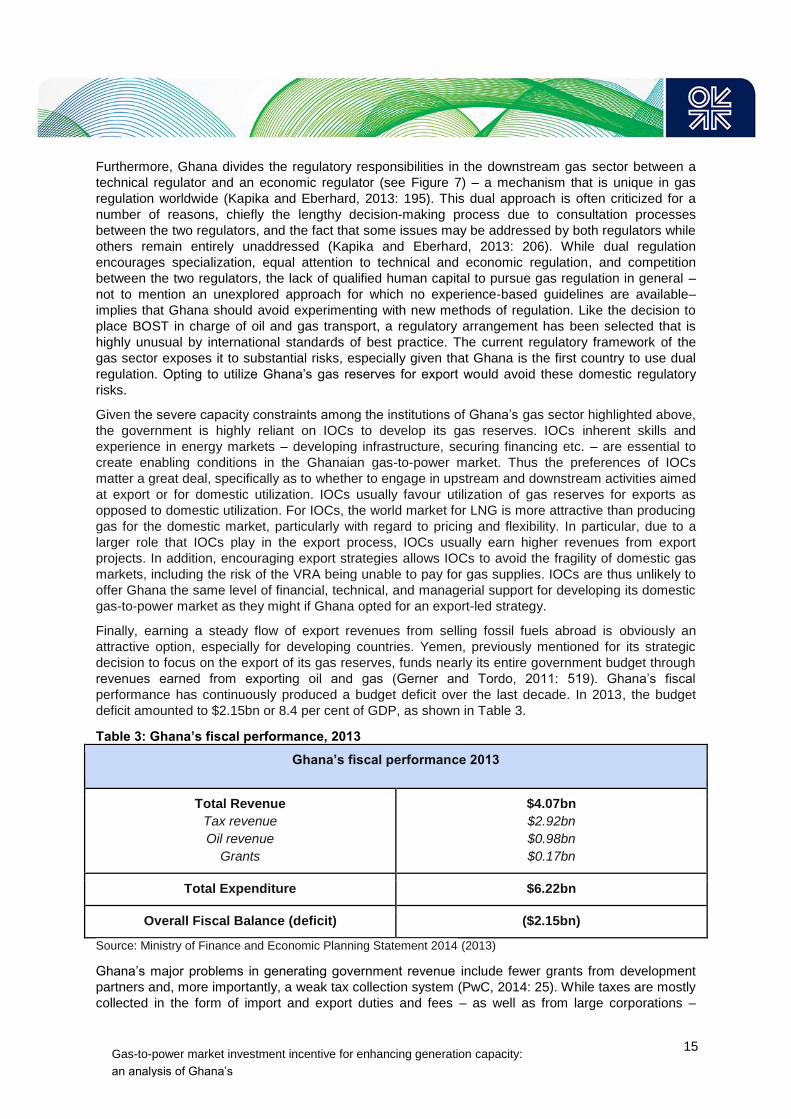
revenues earned from exporting oil and gas (Gerner and Tordo, 2011: 519). Ghana’s fiscal
performance has continuously produced a budget deficit over the last decade. In 2013, the budget
deficit amounted to $2.15bn or 8.4 per cent of GDP, as shown in Table 3.
Table 3: Ghana’s fiscal performance, 2013
Ghana’s fiscal performance 2013
Total Revenue
Tax revenue
Oil revenue
Grants
$4.07bn
$2.92bn
$0.98bn
$0.17bn
Total Expenditure $6.22bn
Overall Fiscal Balance (deficit) ($2.15bn)
Source: Ministry of Finance and Economic Planning Statement 2014 (2013)
Ghana’s major problems in generating government revenue include fewer grants from development
partners and, more importantly, a weak tax collection system (PwC, 2014: 25). While taxes are mostly
collected in the form of import and export duties and fees – as well as from large corporations –
Gas-to-power market investment incentive for enhancing generation capacity:
an analysis of Ghana’s
16
taxation of SMEs (small and medium-sized enterprises) and households remains sporadic, with an
informal sector compromising 80 per cent of the total labour force (Osei-Boateng, 2011: 4). While the
export of Ghana’s gas reserves is unlikely to balance the budget, it would decrease the deficit and
reduce the need for the government either to increase revenue from other sources or cut expenditure.
The considerations presented above as advantages of exporting gas could also be perceived as
drawbacks. By depending on gas revenues, Ghana would become more fiscally vulnerable due to
possible price changes of gas on the world market, while the domestic electricity crisis would persist.
Furthermore, the export of gas reserves could encourage Dutch disease in Ghana, signs of which can
already be detected from the export of oil (Arthur and Arthur, 2015: 64).7 As predicted by the resource
curse, exporting gas could compromise economic diversification in Ghana by making exports less
competitive.
In short, going beyond the analysis of the economic value of both utilization options alone, the
decision on whether to export gas or use it in the domestic power sector is not straightforward. The
institutional framework of the domestic gas sector is weak, IOCs are more supportive of export
strategies, and exporting gas generates an additional channel of revenues for the Ghanaian
government. However, an export strategy could also have harmful outcomes for the economy and
reduce the government’s incentive to pursue a prudent fiscal policy. Furthermore, the economic value
analysis indicates clearly that Ghana ought to adopt a gas utilization strategy focused on the domestic
gas-to-power market.
7 Dutch disease describes the process when a substantial inflow of foreign currency causes a country’s currency to appreciate making the country’s export goods less competitive.
Gas-to-power market investment incentive for enhancing generation capacity:
an analysis of Ghana’s
17
5. Key challenges for advancement of Ghana’s electricity industry
5.1 Effective tariff setting to encourage investment
In addition to the lack of a reliable and affordable source of fuel for power generation, other factors
inhibit the development of the electricity sector in Ghana. Generation tariffs set by PURC have a
crippling effect on the electricity sector. For 2015, PURC approved a tariff rate of 14.6047 pesewas8
per kWh ($0.04 per kWh) for electricity produced by the VRA and 23.7408 pesewas per kWh ($0.06
per kWh) for electricity produced by IPPs. The electricity generation tariff in Ghana is thus
approximately $0.09 below the average of $0.14 per kWh in Sub-Saharan Africa (Ncube, 2013).
Though Ghana has historically relied on cheap hydroelectric power generation, nearly 50 per cent of
power generation is now thermal, for which the marginal cost is significant. For the gas-to-power
market, current electricity tariffs are too low to permit producers to operate in a fiscally sustainable
manner, while investment levels in the industry also suffer as a result.
The financial fragility of the electricity sector – in large part caused by low generation tariffs – has
acutely compromised investments. With the VRA and the ECG having experienced losses during the
majority of years in the last decade, the government has in the past elected to resolve the financial
problems of both public companies through direct subsidies (World Bank, 2013: 33). This has caused
investment levels to be very low both in generation capacity and the network, with the VRA struggling
to meet increasing demand and the ECG unable to drive its electrification program. Additionally, as a
result of insufficient reinvestment to counteract depreciation, system losses have soared and reduced
the ECG’s operational efficiency still further while deepening the electricity shortages. An efficient
tariff structure is critical for the power system’s short-term fiscal sustainability and ensuring long-term
investment in the sector. The main principles guiding an effective tariff design are system
sustainability, economic efficiency, and consumer protection. Following these principles guarantees
not only operational and capital cost recovery but also fairness, simplicity, cost reflectivity, efficiency,
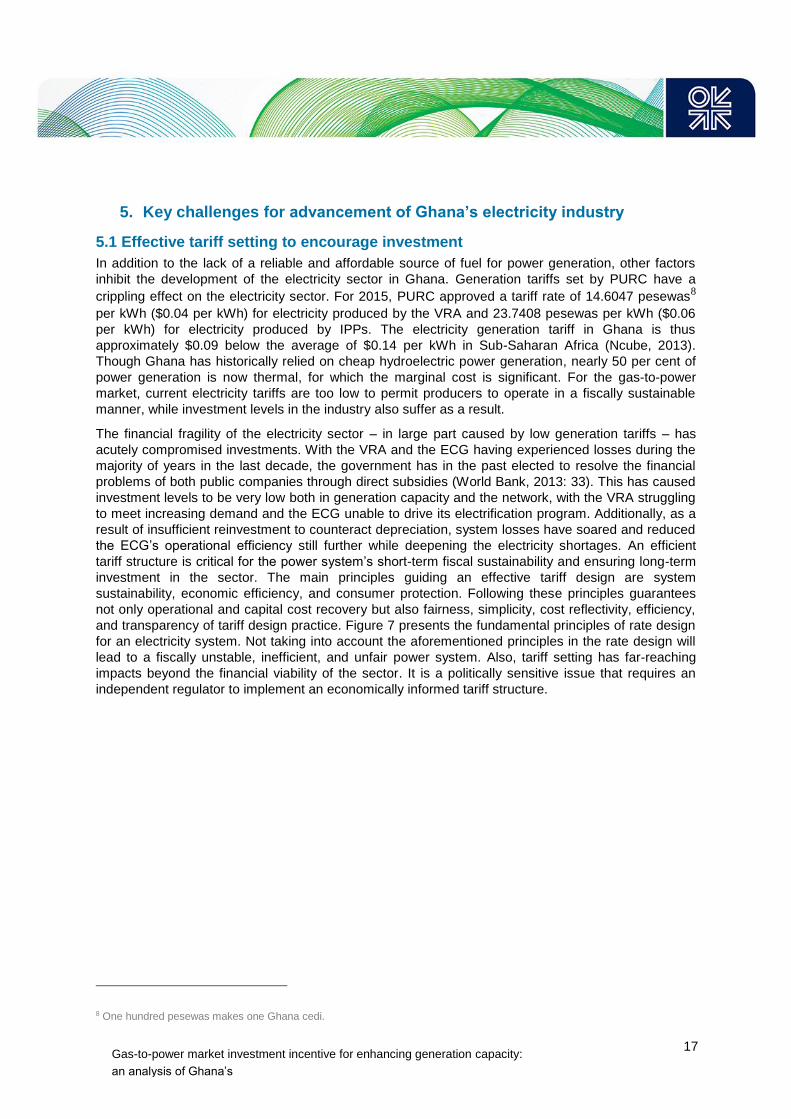
and transparency of tariff design practice. Figure 7 presents the fundamental principles of rate design
for an electricity system. Not taking into account the aforementioned principles in the rate design will
lead to a fiscally unstable, inefficient, and unfair power system. Also, tariff setting has far-reaching
impacts beyond the financial viability of the sector. It is a politically sensitive issue that requires an
independent regulator to implement an economically informed tariff structure.
8 One hundred pesewas makes one Ghana cedi.
Gas-to-power market investment incentive for enhancing generation capacity:
an analysis of Ghana’s
18
Figure 7: Fundamental principles of electricity tariff design
Source: Authors adapted from Athawale and Felder (2016)
The tariff guidelines published by PURC since 1999, and updated on various occasions in the early
2000s, are claimed to be designed based on best practice standards. However, due to political
interference, the tariffs that PURC recommends based on its tariff framework are in many instances
not implemented. For example, the Automatic Adjustment Formula (AAF) for Setting Electricity Tariffs,
last revised in 2011, states clearly that ‘the main objective of the AAF is to review quarterly, electric ity
tariffs to reflect changes in factors whose effects on operations were considered beyond the control of
the utility companies’ (PURC, 2011:2) – such as the cost of fuel.
Yet the government often refuses to ratify the tariffs recommended by PURC, which are based on the
AAF. PURC itself describes the current electricity tariffs as ‘inadequate’ (PURC, 2015). The
government is determined to avoid drastic measures that could affect end-user prices in order to
maintain popular support, even if this implies infringing the constitutional independence of the PURC.
To make investment in Ghana’s electricity generation industry more attractive requires continuous
political will to adhere to the framework in place. For the government of Ghana to build confidence
with local and international investors, the electricity value chain as a whole needs to be adjusted.
Reform of the distribution tariff can help distribution companies to improve their financial position and
thereby accommodate more realistic generation prices.
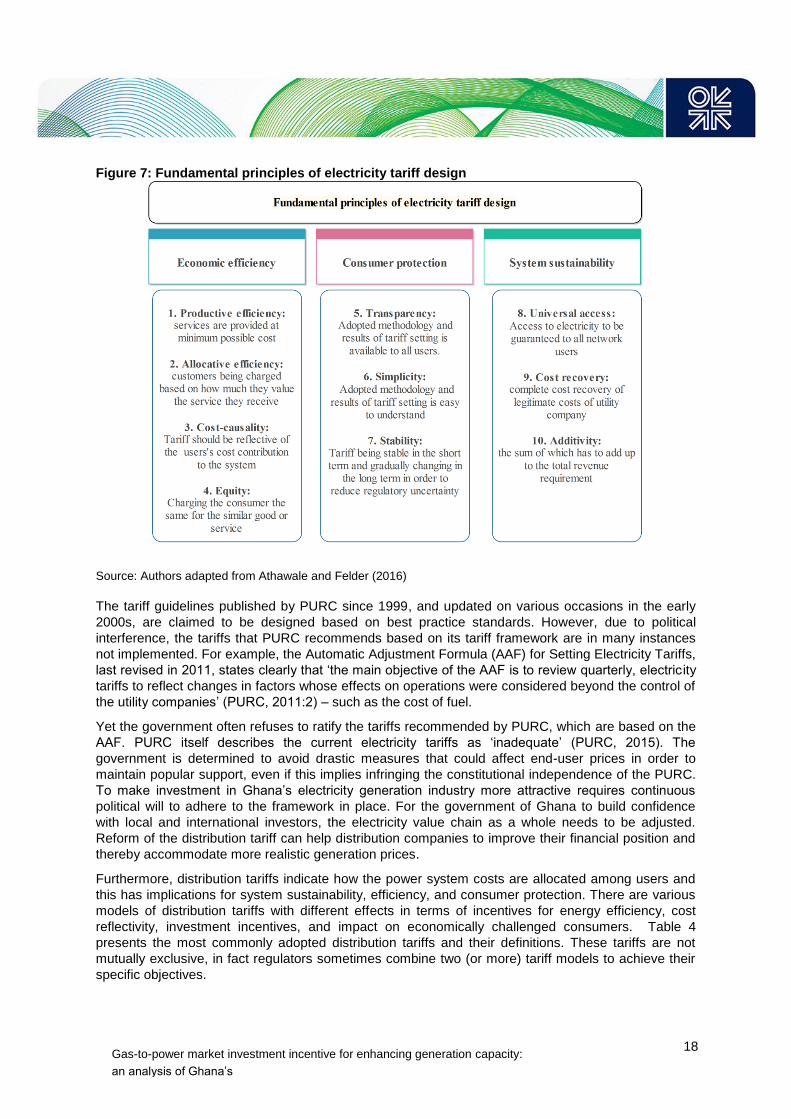
Furthermore, distribution tariffs indicate how the power system costs are allocated among users and
this has implications for system sustainability, efficiency, and consumer protection. There are various
models of distribution tariffs with different effects in terms of incentives for energy efficiency, cost
reflectivity, investment incentives, and impact on economically challenged consumers. Table 4
presents the most commonly adopted distribution tariffs and their definitions. These tariffs are not
mutually exclusive, in fact regulators sometimes combine two (or more) tariff models to achieve their
specific objectives.
Gas-to-power market investment incentive for enhancing generation capacity:
an analysis of Ghana’s
19
Table 4: Common electricity tariff structures
Distribution tariff type Definition
Single-part tariffs
User is charged a flat price for the entire amount of
electricity consumed. Although easy to implement, the
single-part tariff is not reflective of utility costs, which include
significant fixed costs.
Multi-part/two-part tariffs
User is charged per unit of consumption as well as a fixed
price for access. In multi-part tariffs, along with access and
per unit charge, user pays for additional cost drivers such as
contribution to peak demand. These tariffs are non-linear
and better reflect the cost structure of utility.
Block tariffs (inclining, declining)
In inclining block tariffs (IBTs) user pays higher price per unit
of consumption as the volume of consumption increases.
Declining block tariff is opposite of an IBT (in this method it
is assumed that marginal cost is lower than average cost
and decreases when consumption rises).
IBTs better encourage energy efficiency and protect
vulnerable consumers from high prices.
Time-of-day tariffs
(TOD, peak-load, real time pricing)
This method charges consumers based on the time of day.
For instance, the consumers pay less during off-peak
periods and pay more during the peak times. In countries
with competitive wholesale market, real-time pricing is also
possible, where price varies continuously during the day
reflecting the cost of production. These tariffs aim to mimic
the supply function for electricity and thus encourage energy
conservation.
Seasonal tariffs Consumers are charged different rates in summer and
winter when demand for cooling or heating increases (rate is
higher in the season that peak consumption happens). This
method is used where utility companies experience a
significant seasonal cost difference.
Source: Authors adapted from WRI (2014)
The generation and distribution tariff has evolved in Ghana in recent years, but not in response to the
changes in the actual cost of providing the service. An overview of how generation and distribution
tariffs have developed in recent years is provided in Figure 8 below.
Gas-to-power market investment incentive for enhancing generation capacity:
an analysis of Ghana’s
20
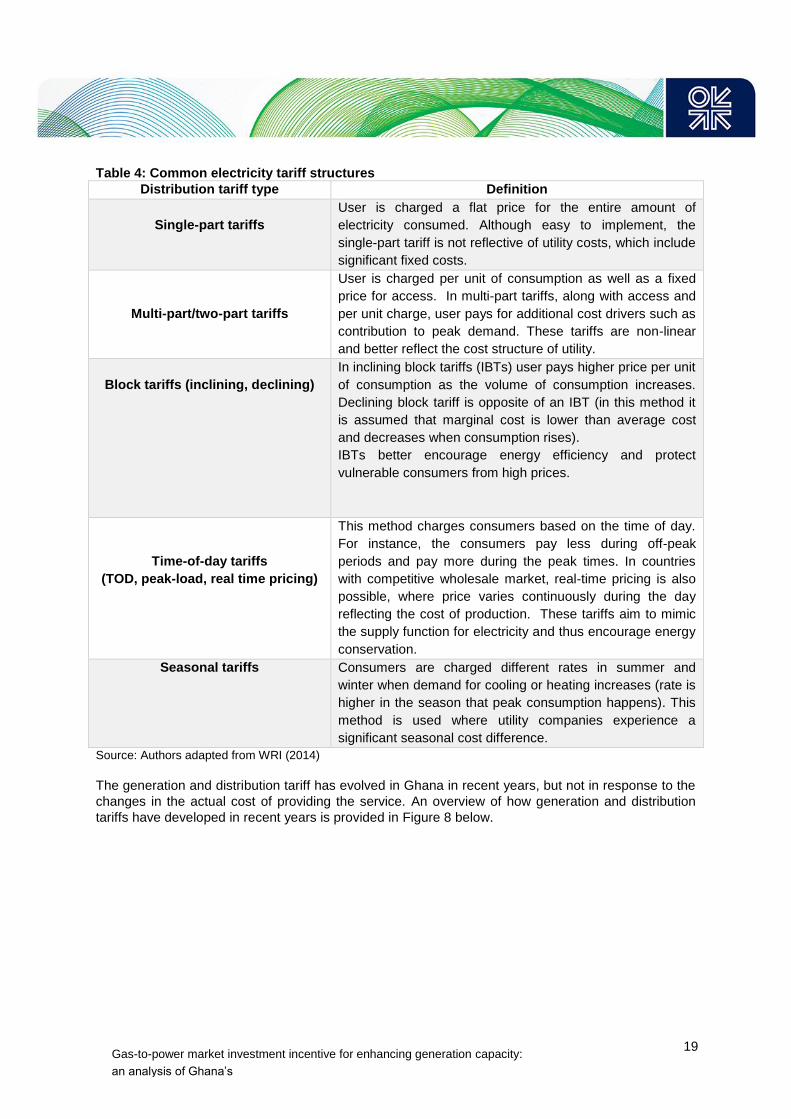
Figure 8: Generation and Distribution Tariffs in Ghana, 2007–2015
Source: Public Utilities Regulatory Commission (2015a) and authors’ calculations
Figure 8 shows that generation tariffs received by the VRA increased from approximately 6 pesewas
per kWh ($0.02 per kWh) in 2007 to 14.60 pesewas per kWh ($0.04 per kWh) in 2015. Despite this
increase, which has been steeper for IPPs, tariffs remain too low for power producers in Ghana to
operate at a reasonable profit. While generation tariffs approximately doubled from 2007 to 2015,
distribution tariffs more than tripled. This indicates that transmission and distribution service charges
have risen significantly in the same period. Yet, with a residential tariff of 42.29 pesewas per kWh in
2015 for customers that consume between 51 and 300 kWh per month, electricity in Ghana remains
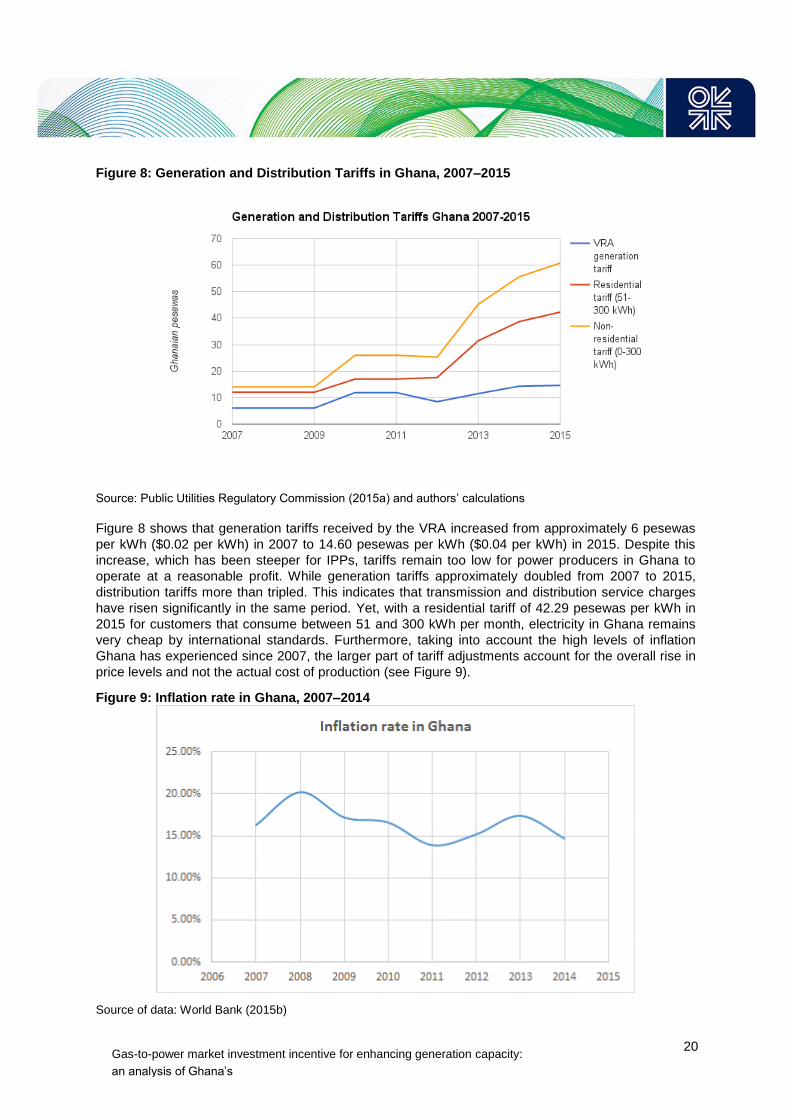
very cheap by international standards. Furthermore, taking into account the high levels of inflation
Ghana has experienced since 2007, the larger part of tariff adjustments account for the overall rise in
price levels and not the actual cost of production (see Figure 9).
Figure 9: Inflation rate in Ghana, 2007–2014
Source of data: World Bank (2015b)
Gas-to-power market investment incentive for enhancing generation capacity:
an analysis of Ghana’s
21
Although the residential and non-residential distribution tariffs have increased considerably in recent
years, they have done so from very low levels and further rises in the price of electricity will need to
occur in order to raise generation tariffs. This will render direct subsidies from the government
unnecessary and create a climate more conducive to long-term planning and investment in the
electricity sector. In this process it is crucial that PURC can decide on and implement tariff
adjustments independently from the government.
That tariff setting by PURC has so far been treated as appropriate in principle but deterred by the
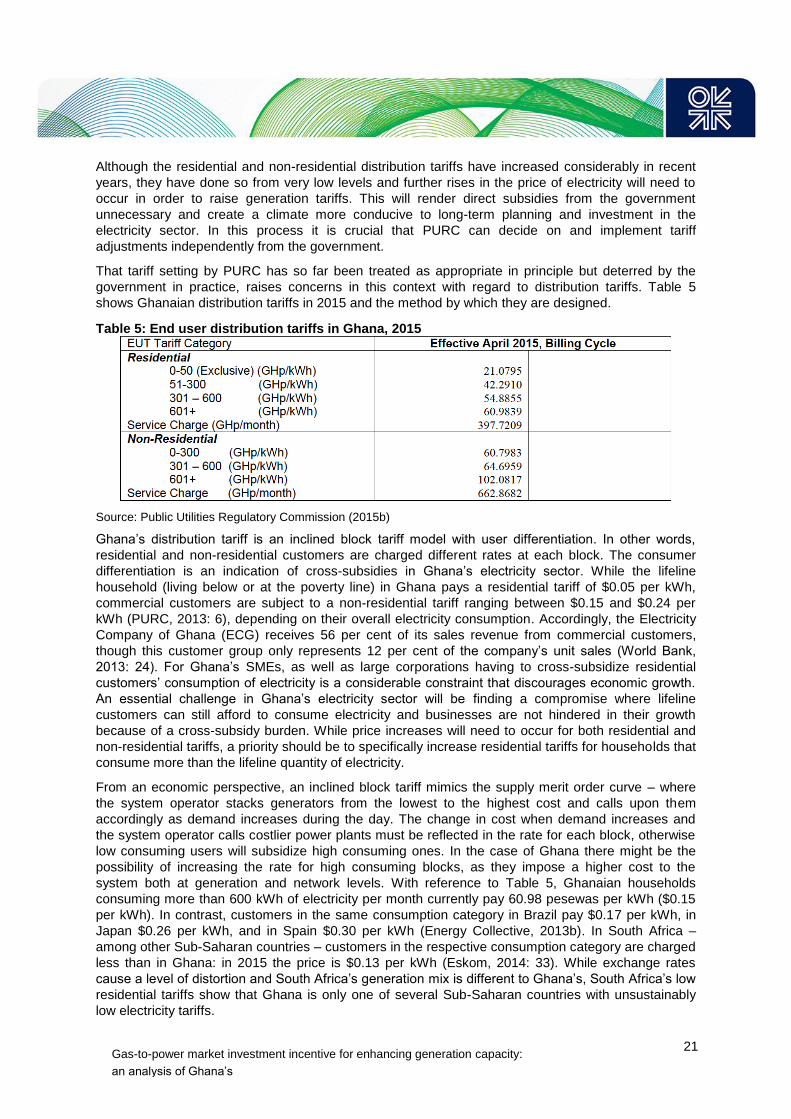
government in practice, raises concerns in this context with regard to distribution tariffs. Table 5
shows Ghanaian distribution tariffs in 2015 and the method by which they are designed.
Table 5: End user distribution tariffs in Ghana, 2015
Source: Public Utilities Regulatory Commission (2015b)
Ghana’s distribution tariff is an inclined block tariff model with user differentiation. In other words,
residential and non-residential customers are charged different rates at each block. The consumer
differentiation is an indication of cross-subsidies in Ghana’s electricity sector. While the lifeline
household (living below or at the poverty line) in Ghana pays a residential tariff of $0.05 per kWh,
commercial customers are subject to a non-residential tariff ranging between $0.15 and $0.24 per
kWh (PURC, 2013: 6), depending on their overall electricity consumption. Accordingly, the Electricity
Company of Ghana (ECG) receives 56 per cent of its sales revenue from commercial customers,
though this customer group only represents 12 per cent of the company’s unit sales (World Bank,
2013: 24). For Ghana’s SMEs, as well as large corporations having to cross-subsidize residential
customers’ consumption of electricity is a considerable constraint that discourages economic growth.
An essential challenge in Ghana’s electricity sector will be finding a compromise where lifeline
customers can still afford to consume electricity and businesses are not hindered in their growth
because of a cross-subsidy burden. While price increases will need to occur for both residential and
non-residential tariffs, a priority should be to specifically increase residential tariffs for households that
consume more than the lifeline quantity of electricity.
From an economic perspective, an inclined block tariff mimics the supply merit order curve – where
the system operator stacks generators from the lowest to the highest cost and calls upon them
accordingly as demand increases during the day. The change in cost when demand increases and
the system operator calls costlier power plants must be reflected in the rate for each block, otherwise
low consuming users will subsidize high consuming ones. In the case of Ghana there might be the
possibility of increasing the rate for high consuming blocks, as they impose a higher cost to the
system both at generation and network levels. With reference to Table 5, Ghanaian households
consuming more than 600 kWh of electricity per month currently pay 60.98 pesewas per kWh ($0.15
per kWh). In contrast, customers in the same consumption category in Brazil pay $0.17 per kWh, in
Japan $0.26 per kWh, and in Spain $0.30 per kWh (Energy Collective, 2013b). In South Africa –
among other Sub-Saharan countries – customers in the respective consumption category are charged
less than in Ghana: in 2015 the price is $0.13 per kWh (Eskom, 2014: 33). While exchange rates
cause a level of distortion and South Africa’s generation mix is different to Ghana’s, South Africa’s low
residential tariffs show that Ghana is only one of several Sub-Saharan countries with unsustainably
low electricity tariffs.
Gas-to-power market investment incentive for enhancing generation capacity:
an analysis of Ghana’s
22
A notable exception to the burden placed on Ghanaian businesses by the cross-subsidy is the state-
owned Volta Aluminium Company (VALCO). Although only running at 20 per cent of its capacity,
VALCO consumes 3.5 per cent of Ghana’s total electricity supply (Economic Consulting Associates,
2014: 26). To break even, VALCO requires electricity supplied at a price of approximately $0.044–
$0.066 per kWh. At the current non-residential distribution tariff, the price of electricity for VALCO
should be 99 pesewas per kWh ($0.24 per kWh). However, VALCO has negotiated favourable terms
with the government – essentially representing a subsidy – that allows the company to consume
electricity at a price at which VALCO breaks even. The government has defended this arrangement
by quoting the positive spillover effects VALCO creates for the Ghanaian economy. However, the
question is whether the social benefit of spillover in this case outweighs the social cost of tariff
underpayment.
5.2 Lack of an effective regulatory framework for investment
Similar to regulation and implementation of electricity tariffs, the framework for private investment in
Ghana’s gas-to-power sector is insufficient. The Ghanaian government recently began an effort to
design feed-in tariffs to encourage the growth of renewable energy forms, but these laudable efforts
will not suffice to develop the generation capacity needed on a national scale.
To catch up with Ghana’s steadily rising demand for electricity, private investors in the gas-to-power
market are required. However, Ghana’s electricity sector does not feature attractive conditions for
private investors. Today there are just two IPPs, one American and one Chinese, operating thermal
power plants in Ghana. The VRA is a minor stakeholder in both ventures, effectively making IPPs in
Ghana public-private partnerships (PPPs). Incentives for IPPs in Ghana are substantial, including tax
breaks, government guarantees, and preferential treatment (Ministry of Finance and Economic
Planning, 2011: 6). For instance, the ECG has to pay the IPPs before paying the VRA for the
electricity they produce. However, despite this advantageous arrangement, the ECG had outstanding
bills with the two IPPs amounting to $15m in 2012 (World Bank, 2013: 25). Although the ECG’s debts
with the VRA are larger, the ECG’s inability to pay IPPs has been compromising its credibility with IPP
investors, who naturally prefer market conditions in which there is a reliable off-taker. The erratic
supply of an affordable fuel for thermal electricity generation – as already discussed with regard to the
VRA – acts as another obstacle to attracting private investors.
Finally, regulation for private sector participation in electricity generation in Ghana does not fulfil
international best practice standards. Companies interested in entering the electricity sector as an IPP
do not currently have a central point of contact in the country’s administration. Responsibility for
public-private partnerships (the usual format of IPPs in Ghana) is shared between the Ministry of
Finance and Economic Planning and the Ministry of Private Sector Development (Ministry of Finance
and Economic Planning, 2014). Accordingly, companies seeking to found an IPP need to enter a
lengthy and inefficient process of communications with two ministries instead of dealing with one
dedicated unit. Though the government is working to streamline the business environment in this
respect, it still remains difficult to attract IPPs to Ghana’s gas-to-power market due to a poor
investment framework and low generation tariffs (Ministry of Finance and Economic Planning, 2014).
The shortage of installed generation capacity is thus likely to persist.
5.3 Missing skills and experience
Ghana’s electricity sector – with the notable exception of GRIDCo – suffers from severe human
capacity constraints such as insufficient levels of experience and skills. Brain drain is a prominent
problem for Ghana’s work force, particularly as high-skilled migration from Ghana to work overseas –
where wages and living conditions are perceived as more attractive – has doubled since 2000
(Gibson and McKenzie, 2009: 2). Due to mediocre educational opportunities and brain drain, there is
a shortage of staff with skills and experience required for technical as well as managerial roles at all
Gas-to-power market investment incentive for enhancing generation capacity:
an analysis of Ghana’s
23
levels of seniority throughout the electricity sector. The ECG, for instance, has struggled to achieve a
number of essential business objectives as a result of skills shortages. In a study sponsored by the
US government, lack of professional experience and skills have to a large extent been blamed for an
erratic and non-transparent tariff collection regime in semi-urban areas (US Department of State,
2011: 61). From a technical perspective, the World Bank stresses that many power outages in Ghana
are not actually caused by a capacity overload but through poor technical maintenance by the ECG
(World Bank, 2013: 19).
Gas-to-power market investment incentive for enhancing generation capacity:
an analysis of Ghana’s
24
6. Conclusion
This paper has highlighted that Ghana’s electricity sector is facing a severe lack of power generation
capacity. In combination with an inefficient distribution network, insufficient generation capacity is
responsible for a consistent power shortage in Ghana, with load shedding and power outages
hampering economic growth and development. Lack of an affordable and reliable fuel source for
power generation is a key factor behind the poor performance of the electricity sector. In light of the
recent discovery of natural gas in Ghana, this paper has investigated whether gas can be a cure for
the country’s power shortage and compared the utilization of domestic gas reserves in the gas-to-
power market to export utilization. The comparison has shown that the economic value of gas-to-
power utilization far exceeds that of gas exports, and also generates beneficial spillover effects given
the positive impact that regular electricity supply has on economic growth and development. However,
institutional problems in developing the domestic gas sector in areas such as regulation and gas
transportation (which are mainly linked to the poor levels of human capital), as well as inherent
preference for export-oriented strategies by both IOCs and the government, reveal the extent of the
challenge involved in developing gas reserves for utilization in the domestic power sector.
In order to encourage investment in gas-fuelled thermal generation capacity, this paper recommends
revising current electricity pricing structures. The rate for consumers with above average electricity
demand – middle and high-income households in particular – needs to be modified so as to better
reflect the cost they impose on the system. In addition, the regulatory framework for attracting
potential IPPs requires streamlining: processes need to be more structured and a dedicated
government unit to communicate with private investors in all regards is desirable.
Establishing a domestic gas-to-power sector does not imply that all the problems faced by the
Ghana’s electricity sector will be completely solved. However, successfully introducing domestic gas
as a fuel for thermal power plants will be an imperative first step that will facilitate the implementation
of other much needed reforms.
Gas-to-power market investment incentive for enhancing generation capacity:
an analysis of Ghana’s
25
Bibliography
Abavana, C. (2011). ‘Electricity Access Progress in Ghana’, [Online], Available:
http://www.unepdtu.org/~/media/Sites/Uneprisoe/Workshop%20Presentations%20(Powerpoints)/SE4
%20All%20Presentations/abavana%20-%20electricity%20access%20progress%20in%20ghana.ashx
[01 Feb 2015].
Aklorbortu, M. (2013). ‘GNPC, BOST, Ghana Gas — Who is who?’, Graphic. Available:
http://graphic.com.gh/features/features/14879-gnpc-bost-ghana-gas-who-is-who.html [30 Sep 2014].
Amesimeku, E. (2015). ‘Ghana: President Mahama turns to the power of prayer’, African Business
March 2015, Available: http://africanbusinessmagazine.com/africa-within/countryfiles/ghana-
president-mahama-turns-power-prayer/ [12 Jan 2015].
Andoh, D. (2014). ‘Looming crisis: Akosombo Dam water levels expected to drop to record low’,
[Online], Available: http://thebftonline.com/content/looming-crisis-akosombo-dam-water-level-
expected-drop-record-low [15 Jan 2015].
Arthur, P., Arthur, E. (2015). ‘Local Content and Private Sector Participation in Ghana's Oil Industry:
An Economic and Strategic Imperative’, Africa Today, vol. 61, no. 2, pp. 56-77.
Athawale, R. and Felder, F. (2016). ‘Residential Rate Design and Death Spiral for Electric Utilities:
Efficiency and Equity Considerations’ in F.P. Sioshansi (eds) Future of utilities, Utilities of the future:
How technological innovations in distributed energy resources will reshape the future of electric power
sector (forthcoming).
Bernard, T. (2012). ‘Impact Analysis of Rural Electrification Projects in Sub-Saharan Africa’, The
World Bank Research Observer, vol. 27, no. 1, pp. 33-51.
Boateng, K. (2014). ‘De-lightning Ghanaians, the state of Ghana’s power sector’, [Online], Available:
http://www.citifmonline.com/2014/06/02/de-lighting-ghanaians-the-state-of-ghanas-power-
sector/#sthash.yNw6haAo.dpbs [02 Feb 2015].
Brunts, L. (2008). ‘Ghana: Africa’s Rising Star’, [Online], Available:
http://www.theatlantic.com/magazine/archive/2008/12/ghana-africas-rising-star/307196/ [21 Nov
2014].
Chene, M. (2010). ‘Overview of corruption and anti-corruption in Ghana’, [Online], Available:
http://www.transparency.org/whatwedo/answer/overview_of_corruption_and_anti_corruption_in_ghan
a [27 Oct 2014].
Cho, E. (2010). Natural gas markets and lessons learned, New York: Nova Science Publishers.
Dontoh, E. (2014). ‘Ghana Won’t Block Tullow Gas Flaring to Boost Oil Production, [Online],
Available: http://www.bloomberg.com/news/articles/2014-06-05/ghana-won-t-block-tullow-gas-flaring-
to-boost-oil-production-1- [26 Mar 2015].
Gas-to-power market investment incentive for enhancing generation capacity:
an analysis of Ghana’s
26
Eberhard, A. (2007). ‘The Political economy of power sector reform in South Africa’, in Victor, D.,
Heller. T. (ed.) The Political Economy of Power Sector Reform, Cambridge: Cambridge University
Press.
Economic Consulting Associates (2014). Gas Master Plan for Ghana, [Not available online].
The Economist (2013). ‘Bye-bye Big Men’, [Online], Available:
http://www.economist.com/news/special-report/21572384-governance-much-africa-visibly-improving-
though-progress-uneven-bye-bye-big?zid=304&ah=e5690753dc78ce91909083042ad12e30 [03 Jan
2015].
Electricity Company of Ghana (2013). ‘2012 Annual Report & Financial Statements’, [Online],
Available: http://www.ecgonline.info/images/Publication/2012%20ECG%20ANNUAL%20REPORT.pdf
[04 Feb 2015].
Elfaki, G., Elgizouli, I., Okech, A., Nyoike, P. (1996). Energy Utilities and Institutions in Africa, London:
Zed Books.
Energy Collective (2013a). ‘Could LNG be a cure for the West African Power Crisis?’, [Online],
Available: http://www.theenergycollective.com/victormallet/202466/could-lng-be-cure-west-african-
power-crisis-natural-gas [08 Jul 2015].
Energy Collective (2013b). ‘The Average Price of Electricity, Country by Country’, [Online], Available:
http://www.theenergycollective.com/lindsay-wilson/279126/average-electricity-prices-around-world-
kwh [08 Jul 2015].
Energy Commission (2014). ‘2014 Energy Outlook for Ghana’, [Online], Available:
http://www.energycom.gov.gh/files/Energy%20Commission%20-
%202014Energy%20Outlook%20for%20Ghana_final_2014.pdf [01 Feb 2015].
Eskom (2014). ‘Tariff & Charges Booklet 2014/2015’, [Online], Available:
http://www.eskom.co.za/CustomerCare/TariffsAndCharges/Documents/TariffBrochureV9.pdf [14 Jul
2015].
Ghana Oil Watch (2011). ‘Sankofa Prospect’, [Online], Available:
http://ghanaoilwatch.org/index.php/sankofa-prospect [08 Jul 2015].
GRIDCo (2010). ‘Ghana Wholesale Power Reliability Assessment 2010’, [Online], Available:
http://www.gridcogh.com/media/photos/forms/rel-
assessment/2010_GRIDCo_Reliability_Assessment_Report.pdf [31 Jan 2015].
Iddrisu, M. (2014). ‘Ghana: Skills Shortages in the Oil and Gas Industry – Lessons for Ghana’,
allAfrica, Available: http://allafrica.com/stories/201402111339.html [13 Oct 2014].
International Monetary Fund (2013). ‘Ghana 2013 Article IV Consultation’, IMF Country Report No.
13/187.
Gas-to-power market investment incentive for enhancing generation capacity:
an analysis of Ghana’s
27
Kapika, J., Eberhard, A. (2013). Power-Sector Reform and Regulation in Africa: Lessons from Ghana,
Kenya, Namibia, Tanzania, Uganda and Zambia, Cape Town: HSRC Press.
Ministry of Energy (1989). ‘National Electrification Scheme’, Available as hard copy from the ministry
only.
Ministry of Energy (2010). ‘Energy Sector Strategy and Development Plan’, [Online], Available:
http://ghanaoilwatch.org/images/laws/energy_strategy.pdf [12 Jan 2015].
Ministry of Finance and Economic Planning (2011). ‘National Policy on Public Private Partnerships’,
[Online], Available: http://www.mofep.gov.gh/sites/default/files/docs/pid/ppp_policy.pdf [21 Mar 2015].
Ministry of Finance and Economic Planning (2013). ‘MoFEP Budget Statement 2014’, [Online],
Available: http://www.pwc.com/en_GH/gh/assets/pdf/2014_budget_highlights_-final.pdf [15 Jan 2015].
Ministry of Finance and Economic Planning (2014). ‘Government believes in the private sector’
[Online], Available: http://www.mofep.gov.gh/?q=news/261011 [27 Mar 2015].
Nexant (2014). ‘Ghana Natural Gas Sector Short Term Action Plan’, a report prepared by Nexant Inc.
for the Ministry of Finance and Economic Planning, Ghana.
Lenhardt, A., Menocal, A. and Engel, J. (2015). ‘Ghana, The Rising Star’, Overseas Development
Institute Case Study Report.
O'Cinneide, E. (2014). ‘Jubilee knock as Ghana Gas work ‘halted’’, [Online], Available:
http://www.upstreamonline.com/live/article1365258.ece [02 Nov 2014].
Osei-Boateng, C. (2011). ‘The Informal Sector in Ghana’, [Online], Available:
http://www.fesghana.org/uploads/PDF/FES_InformalSector_2011_FINAL.pdf [22 Dec 2014].
Oteng-Adjei, J. (2012). ‘A statement on the true state of developments in the power sector’, Available:
http://www.ghana.gov.gh/index.php/information/speeches [26 Aug 2014].
Panford, K. (2014). ‘An Exploratory Survey of Petroleum Skills and Training in Ghana’, Africa Today,
vol. 60, no.3, pp. 56-80.
PwC (2014). ‘Ghana 2014 Budget Highlights’, [Online], Available:
http://www.pwc.com/en_GH/gh/assets/pdf/2014_budget_highlights_-final.pdf [15 Jan 2015].
Public Utilities Regulatory Commission (2015a). ‘PURC Gazette Tariffs’, [Online], Available:
http://www.purc.com.gh/purc/node/178 [04 Jul 2015].
Public Utilities Regulatory Commission (2015b). ‘Publication of Electricity Tariffs’, [Online], Available:
http://www.purc.com.gh/purc/sites/default/files/2nd_qtr_tariff_2015.pdf [04 Jul 2015].
Razzaqi, S. (2011). ‘Dynamic Relationship between Energy and Economic Growth: Evidence from D8
Countries’, The Pakistan Development Review, vol. 50, no. 4, pp. 437-458.
Shell (2014). ‘Prelude FLNG – an overview’, [Online], Available:
http://www.shell.com/global/aboutshell/major-projects-2/prelude-flng/overview.html [12 Mar 2015].
Gas-to-power market investment incentive for enhancing generation capacity:
an analysis of Ghana’s
28
US Army Corps of Engineers (2014). ‘Ghana Liquid Natural Gas Studies and Design Screening
Report’, Available:
http://mida.gov.gh/site/wp-content/uploads/2014/07/Ghana-LNG-studies-Phase-I-Final-Report.pdf [16
Jan 2015].
US Department of State (2011). ‘Ghana Constraints Analysis’, Available:
http://www.state.gov/documents/organization/202533.pdf [26 Feb 2015].
US Environmental Protection Agency (2015). ‘Electricity from Natural Gas’, [Online], Available:
http://www.epa.gov/cleanenergy/energy-and-you/affect/natural-gas.html [25 Mar 2015].
Van Gyampo, R. E. (2011). ‘Saving Ghana from its oil: a critical assessment of preparations so far
made’, Africa Today, vol.57, no.4, pp. 48-69.
West African Gas Pipeline Company (2014). ‘Company Profile’, [Online], Available:
http://www.wagpco.com/index.php?option=com_content&view=article&id=46&Itemid=78&lang=en [17
Dec 2014].
Wolde-Rufael, Y. (2006). ‘Electricity consumption and economic growth: a time series experience for
17 African countries’, Energy Policy, vol. 34, no. 1, pp. 1106–1114.
World Bank (2013). ‘Energizing Economic Growth in Ghana’, [Online], Available: http://www-
wds.worldbank.org/external/default/WDSContentServer/WDSP/IB/2013/07/22/000442464_20130722
120043/Rendered/PDF/796560WP0P13140Box0377384B00PUBLIC0.pdf [29 Dec 2014].
World Bank (2014). Economy Rankings, [Online], Available: http://www.doingbusiness.org/rankings
[27 Oct 2014].
World Bank (2015a). ‘Access to electricity (% of population)’, [Online], Available:
http://data.worldbank.org/indicator/EG.ELC.ACCS.ZS [03 Feb 2015].
World Bank (2015b). ‘World Development Indicators’, [Online], Available:
http://databank.worldbank.org/data//reports.aspx?source=2&country=GHA&series=&period= [04 July
2015].
World Energy Council (2013). ‘Energy Efficiency Technologies’, [Online], Available:
http://www.worldenergy.org/wp-content/uploads/2014/03/EE-Technologies-ANNEX-III-Energy-
Efficient-Solutions-for-Thermal-Power-Solutions.pdf
[04 Feb 2015].
World Resource Institute (2014). ‘Electricity governance initiative: 10 questions to ask about electricity
tariffs’, [Online], Available: http://www.wri.org/publication/10-questions-electricity-tariffs [06 July
2015].