Embed Size (px)
Citation preview

In search of
AF 447
August 2011Volume 38 • Number 4
August 2011Volume 38 • Number 4
• HEALTH CARE EMERGENCYO.R. eases the pain of overcrowding and understaffing in ERs
• CONSTRAINT PROGRAMMINGWhy it’s a must-have tool in every O.R. practitioner’s toolkit
• HEALTH CARE EMERGENCYO.R. eases the pain of overcrowding and understaffing in ERs
• CONSTRAINT PROGRAMMINGWhy it’s a must-have tool in every O.R. practitioner’s toolkit
AL S O I N S I D E:A L S O I N S I D E:
INNOVATIVE EDUCATION: Consulting course benefits students & clientsINNOVATIVE EDUCATION: Consulting course benefits students & clients
In search of
AF 447How O.R. helped locate the
underwater wreckageHow O.R. helped locate the
underwater wreckage
OR/MS TODAY22 August 2011
Air France Flight 447
Air France Flight 447
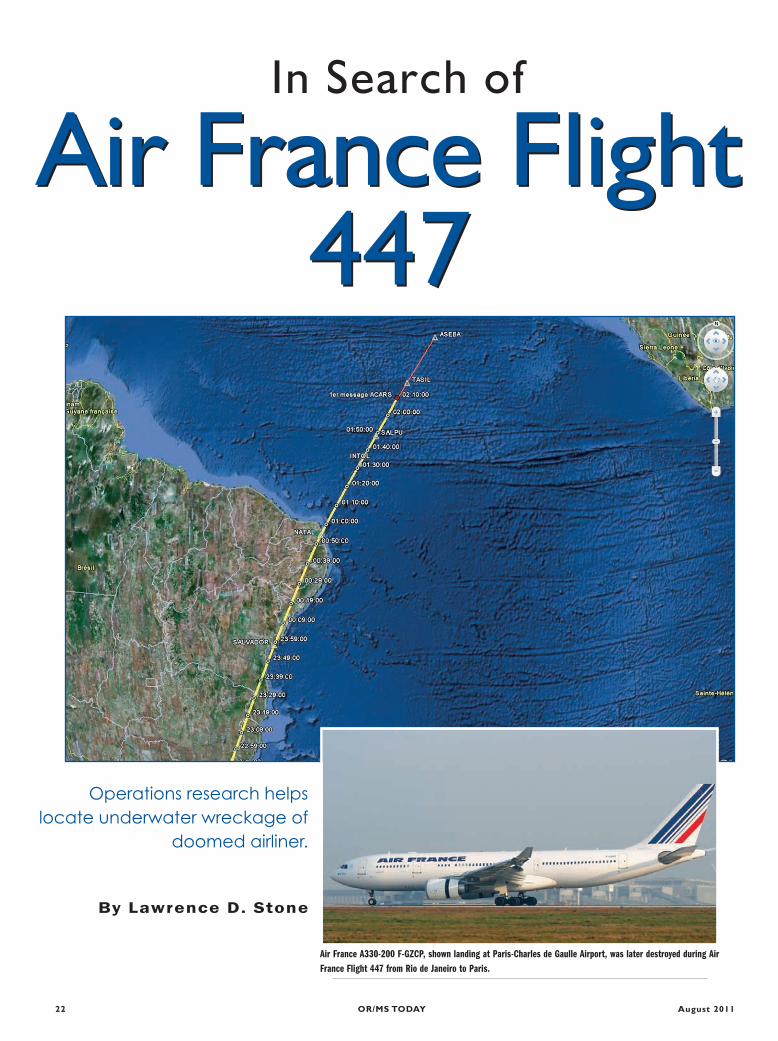
Operations research helpslocate underwater wreckage of
doomed airliner.
In Search of
By Lawrence D. Stone
Air France A330-200 F-GZCP, shown landing at Paris-Charles de Gaulle Airport, was later destroyed during Air
France Flight 447 from Rio de Janeiro to Paris.
In July 2010, Metron was tasked by the BEA to review allinformation about the loss of AF 447 along with all previoussearch efforts in order to produce a probability map for the loca-tion of the underwater wreckage. The result of this effort wasthe Jan. 20, 2011 study published on the BEA website [2]. Thisarticle describes the process and results of producing the proba-bility map that was used to guide the successful search. The suc-cess of this effort provides a powerful illustration of the value ofthis methodical, Bayesian approach to search planning.
The Loss of the Aircraft and Initial Search Efforts
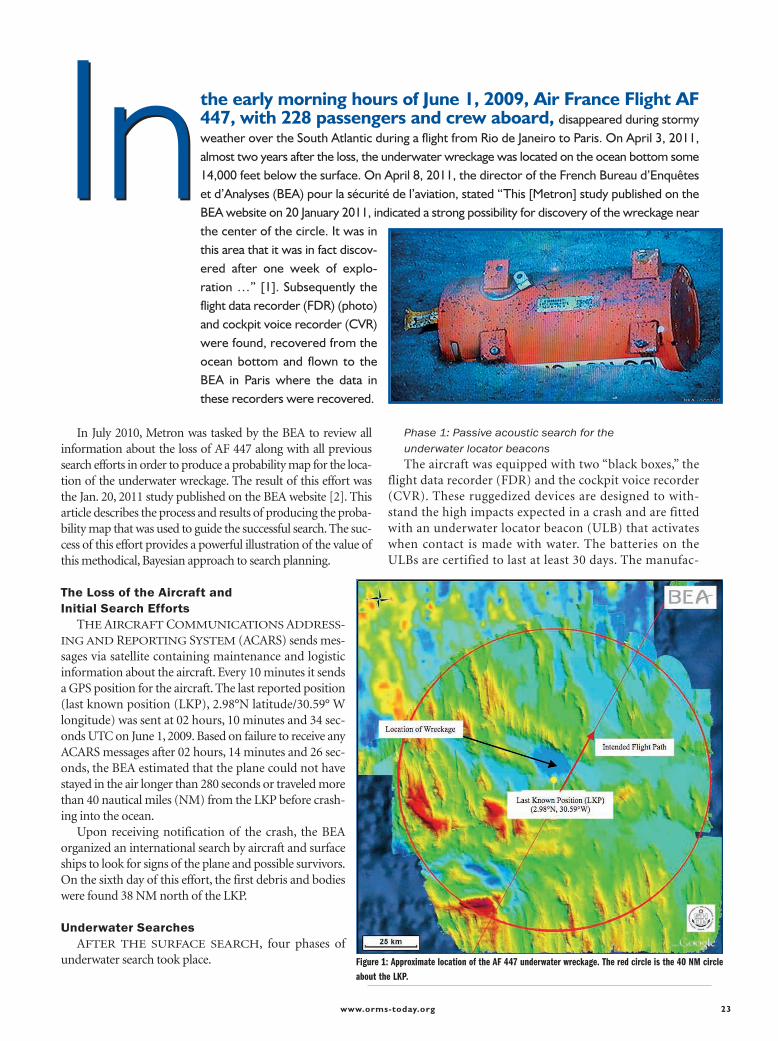
THE AIRCRAFT COMMUNICATIONS ADDRESS-ING AND REPORTING SYSTEM (ACARS) sends mes-sages via satellite containing maintenance and logisticinformation about the aircraft. Every 10 minutes it sendsa GPS position for the aircraft. The last reported position(last known position (LKP), 2.98°N latitude/30.59° Wlongitude) was sent at 02 hours, 10 minutes and 34 sec-onds UTC on June 1, 2009. Based on failure to receive anyACARS messages after 02 hours, 14 minutes and 26 sec-onds, the BEA estimated that the plane could not havestayed in the air longer than 280 seconds or traveled morethan 40 nautical miles (NM) from the LKP before crash-ing into the ocean.
Upon receiving notification of the crash, the BEAorganized an international search by aircraft and surfaceships to look for signs of the plane and possible survivors.On the sixth day of this effort, the first debris and bodieswere found 38 NM north of the LKP.
Underwater SearchesAFTER THE SURFACE SEARCH, four phases of
underwater search took place.
Phase 1: Passive acoustic search for the underwater locator beaconsThe aircraft was equipped with two “black boxes,” the
flight data recorder (FDR) and the cockpit voice recorder(CVR). These ruggedized devices are designed to with-stand the high impacts expected in a crash and are fittedwith an underwater locator beacon (ULB) that activateswhen contact is made with water. The batteries on theULBs are certified to last at least 30 days. The manufac-
www.orms-today.org 23
the early morning hours of June 1, 2009, Air France Flight AF447, with 228 passengers and crew aboard, disappeared during stormyweather over the South Atlantic during a flight from Rio de Janeiro to Paris. On April 3, 2011,almost two years after the loss, the underwater wreckage was located on the ocean bottom some14,000 feet below the surface. On April 8, 2011, the director of the French Bureau d’Enquêteset d’Analyses (BEA) pour la sécurité de l’aviation, stated “This [Metron] study published on theBEA website on 20 January 2011, indicated a strong possibility for discovery of the wreckage nearthe center of the circle. It was inthis area that it was in fact discov-ered after one week of explo-ration …” [1]. Subsequently theflight data recorder (FDR) (photo)and cockpit voice recorder (CVR)were found, recovered from theocean bottom and flown to theBEA in Paris where the data inthese recorders were recovered.
InIn
Figure 1: Approximate location of the AF 447 underwater wreckage. The red circle is the 40 NM circle
about the LKP.
turer of the ULBs fitted on the AF 447 aircraft statedthat the expected duration of the transmissions fromthese beacons was of the order of 40 days.
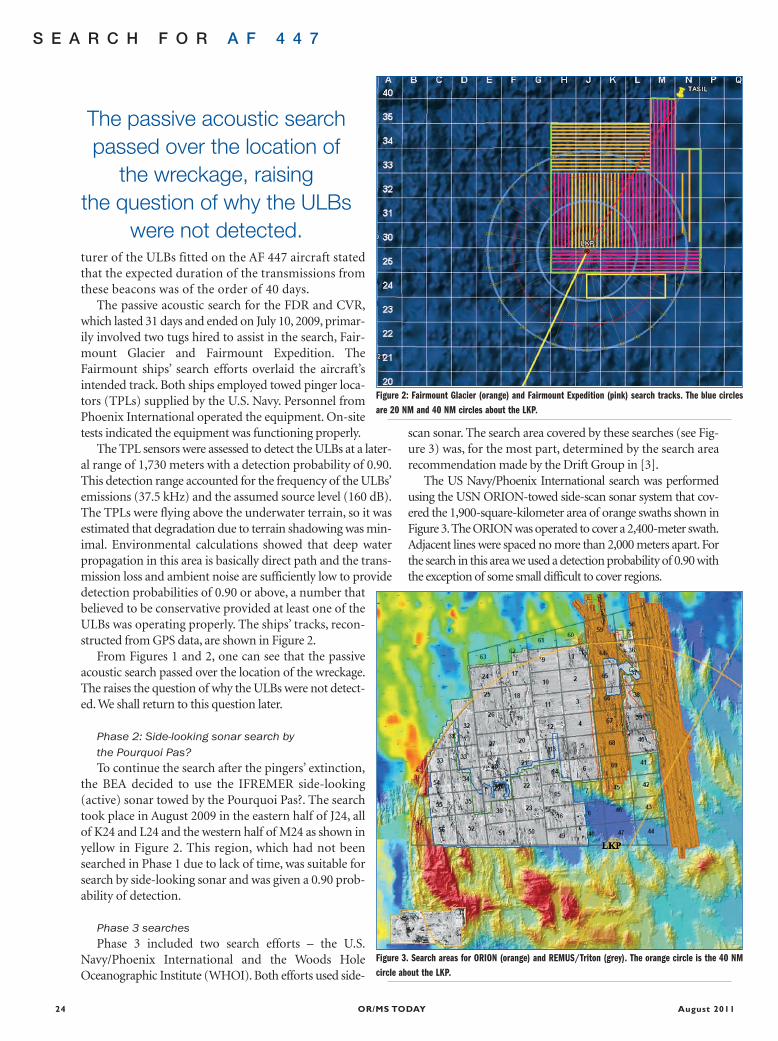
The passive acoustic search for the FDR and CVR,which lasted 31 days and ended on July 10, 2009, primar-ily involved two tugs hired to assist in the search, Fair-mount Glacier and Fairmount Expedition. TheFairmount ships’ search efforts overlaid the aircraft’sintended track. Both ships employed towed pinger loca-tors (TPLs) supplied by the U.S. Navy. Personnel fromPhoenix International operated the equipment. On-sitetests indicated the equipment was functioning properly.
The TPL sensors were assessed to detect the ULBs at a later-al range of 1,730 meters with a detection probability of 0.90.This detection range accounted for the frequency of the ULBs’emissions (37.5 kHz) and the assumed source level (160 dB).The TPLs were flying above the underwater terrain, so it wasestimated that degradation due to terrain shadowing was min-imal. Environmental calculations showed that deep waterpropagation in this area is basically direct path and the trans-mission loss and ambient noise are sufficiently low to providedetection probabilities of 0.90 or above, a number thatbelieved to be conservative provided at least one of theULBs was operating properly. The ships’ tracks, recon-structed from GPS data, are shown in Figure 2.
From Figures 1 and 2, one can see that the passiveacoustic search passed over the location of the wreckage.The raises the question of why the ULBs were not detect-ed. We shall return to this question later.
Phase 2: Side-looking sonar search by the Pourquoi Pas?To continue the search after the pingers’ extinction,
the BEA decided to use the IFREMER side-looking(active) sonar towed by the Pourquoi Pas?. The searchtook place in August 2009 in the eastern half of J24, allof K24 and L24 and the western half of M24 as shown inyellow in Figure 2. This region, which had not beensearched in Phase 1 due to lack of time, was suitable forsearch by side-looking sonar and was given a 0.90 prob-ability of detection.
Phase 3 searchesPhase 3 included two search efforts – the U.S.
Navy/Phoenix International and the Woods HoleOceanographic Institute (WHOI). Both efforts used side-
scan sonar. The search area covered by these searches (see Fig-ure 3) was, for the most part, determined by the search arearecommendation made by the Drift Group in [3].
The US Navy/Phoenix International search was performedusing the USN ORION-towed side-scan sonar system that cov-ered the 1,900-square-kilometer area of orange swaths shown inFigure 3.The ORION was operated to cover a 2,400-meter swath.Adjacent lines were spaced no more than 2,000 meters apart. Forthe search in this area we used a detection probability of 0.90 withthe exception of some small difficult to cover regions.
OR/MS TODAY24 August 2011
S E A R C H F O R A F 4 4 7
Figure 2: Fairmount Glacier (orange) and Fairmount Expedition (pink) search tracks. The blue circles
are 20 NM and 40 NM circles about the LKP.
Figure 3. Search areas for ORION (orange) and REMUS/Triton (grey). The orange circle is the 40 NM
circle about the LKP.
The passive acoustic searchpassed over the location of
the wreckage, raising the question of why the ULBs
were not detected.
WHOI deployed to the search area with three REMUS6000 AUVs and a Triton XLX 4000 ROV. The threeREMUS vehicles covered the 4,375 km area shown in greyin Figure 3. Search legs were spaced a distance apart equalto the maximum range less 50 meters which produceddouble coverage almost everywhere within its search area.Most regions of steep terrain, such as ridges, were imagedfrom both sides and were thus well searched. Exceptionswere regions that contained ridges that were not suitablefor side-looking sonar coverage. The Triton ROV wasdeployed in some of these. We attributed a detectionprobability of 0.90 to the areas shown in grey in Figure 3with exceptions in some small areas.
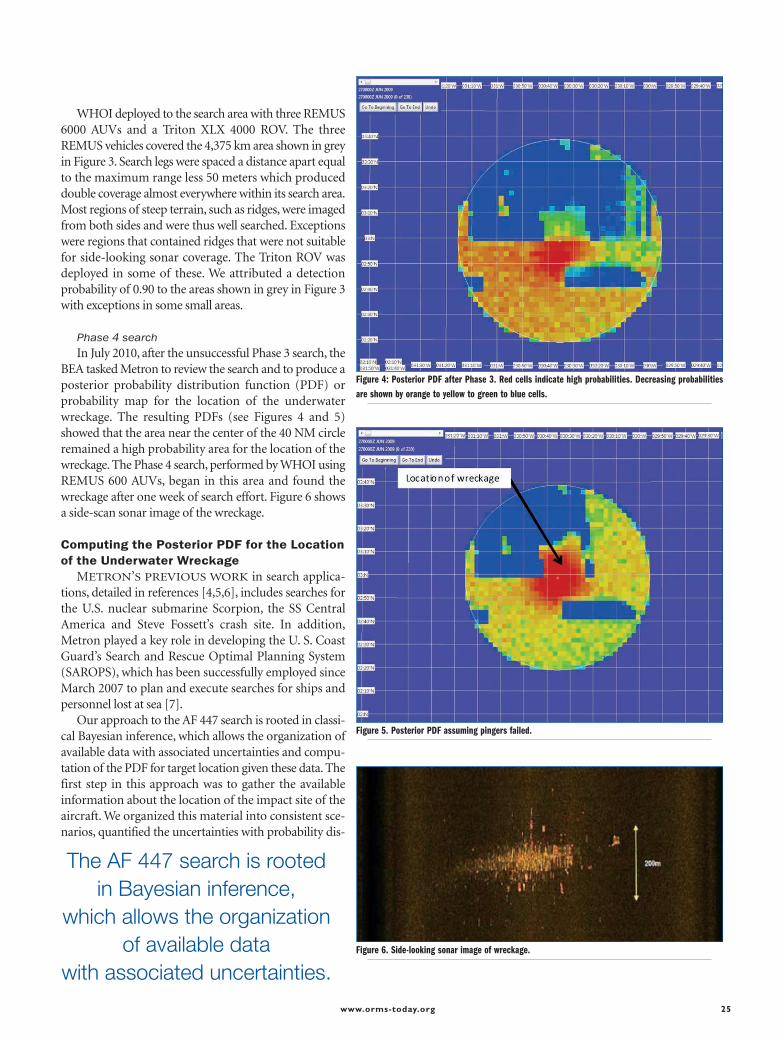
Phase 4 searchIn July 2010, after the unsuccessful Phase 3 search, the
BEA tasked Metron to review the search and to produce aposterior probability distribution function (PDF) orprobability map for the location of the underwaterwreckage. The resulting PDFs (see Figures 4 and 5)showed that the area near the center of the 40 NM circleremained a high probability area for the location of thewreckage. The Phase 4 search, performed by WHOI usingREMUS 600 AUVs, began in this area and found thewreckage after one week of search effort. Figure 6 showsa side-scan sonar image of the wreckage.
Computing the Posterior PDF for the Locationof the Underwater Wreckage
METRON’S PREVIOUS WORK in search applica-tions, detailed in references [4,5,6], includes searches forthe U.S. nuclear submarine Scorpion, the SS CentralAmerica and Steve Fossett’s crash site. In addition,Metron played a key role in developing the U. S. CoastGuard’s Search and Rescue Optimal Planning System(SAROPS), which has been successfully employed sinceMarch 2007 to plan and execute searches for ships andpersonnel lost at sea [7].
Our approach to the AF 447 search is rooted in classi-cal Bayesian inference, which allows the organization ofavailable data with associated uncertainties and compu-tation of the PDF for target location given these data. Thefirst step in this approach was to gather the availableinformation about the location of the impact site of theaircraft. We organized this material into consistent sce-narios, quantified the uncertainties with probability dis-
www.orms-today.org 25
Figure 4: Posterior PDF after Phase 3. Red cells indicate high probabilities. Decreasing probabilities
are shown by orange to yellow to green to blue cells.
Figure 5. Posterior PDF assuming pingers failed.
Figure 6. Side-looking sonar image of wreckage.
The AF 447 search is rooted in Bayesian inference,
which allows the organization of available data
with associated uncertainties.
tributions, weighted the relative likelihood of each sce-nario, and performed a simulation to produce a priorPDF for the location of the wreck. This is the samemethodology that was pioneered in [4] and incorporatedinto SAROPS [7]. Metron used a specially modified ver-sion of SAROPS to compute the PDFs for the AF 447search analysis.
Next we estimated the effect of the unsuccessfulsearch efforts. These efforts included the air and surfacesearches for floating debris and the underwater search-es in Phases 1, 2, and 3. The goal of the Phase 1 searchwas to detect signals from the flight recorders’ ULBs.The Phase 2 and 3 searches involved the use of side-looking sonar and cameras to detect the underwaterdebris field of the wreck of the AF 447 flight. For eachsearch, we enlisted sensor experts and knowledge of thesea state, visibility, underwater geography and water col-umn conditions to estimate sensor performance. Theresults of the search assessment, combined in a Bayesian fash-ion with the prior PDF of the impact site, yielded the poste-rior PDF for the impact location given the unsuccessfulsearch efforts shown in Figures 4 and 5.
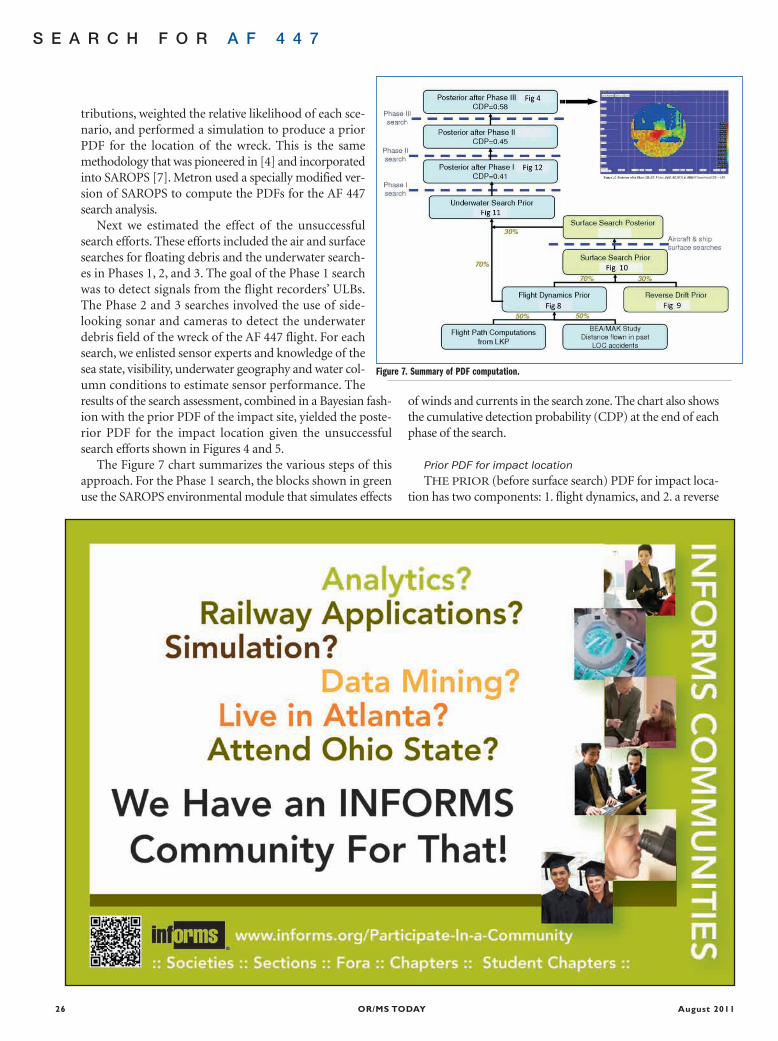
The Figure 7 chart summarizes the various steps of thisapproach. For the Phase 1 search, the blocks shown in greenuse the SAROPS environmental module that simulates effects
of winds and currents in the search zone. The chart also showsthe cumulative detection probability (CDP) at the end of eachphase of the search.
Prior PDF for impact locationTHE PRIOR (before surface search) PDF for impact loca-
tion has two components: 1. flight dynamics, and 2. a reverse
OR/MS TODAY26 August 2011
S E A R C H F O R A F 4 4 7
Figure 7. Summary of PDF computation.
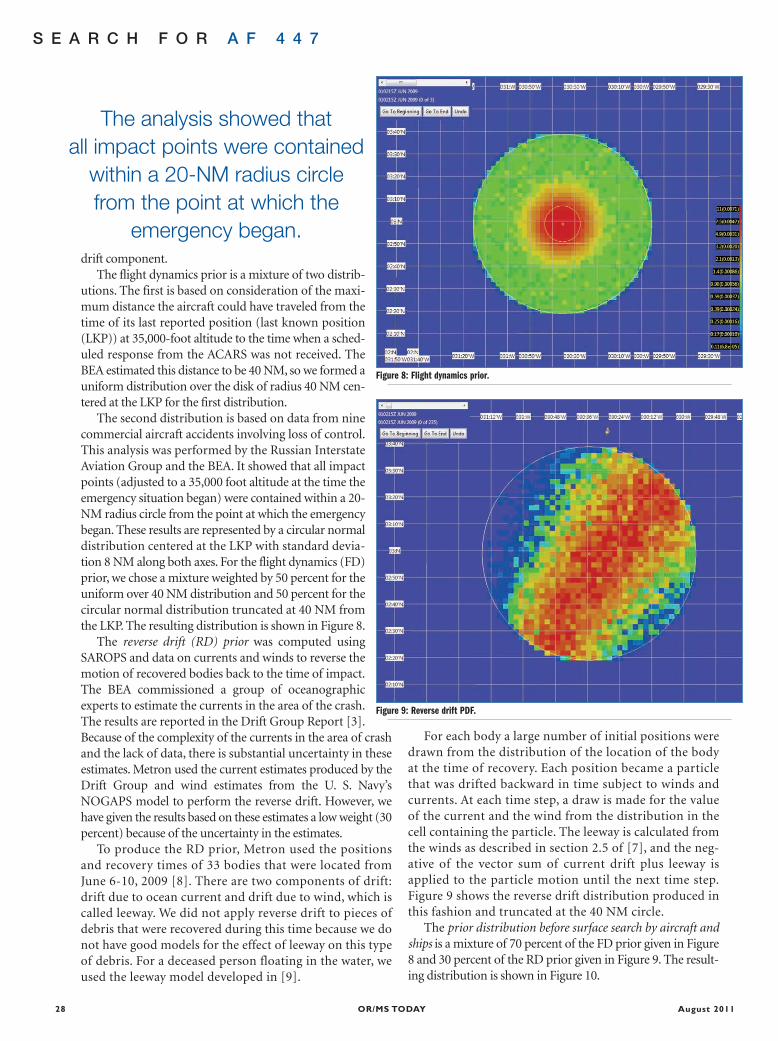
drift component.The flight dynamics prior is a mixture of two distrib-
utions. The first is based on consideration of the maxi-mum distance the aircraft could have traveled from thetime of its last reported position (last known position(LKP)) at 35,000-foot altitude to the time when a sched-uled response from the ACARS was not received. TheBEA estimated this distance to be 40 NM, so we formed auniform distribution over the disk of radius 40 NM cen-tered at the LKP for the first distribution.
The second distribution is based on data from ninecommercial aircraft accidents involving loss of control.This analysis was performed by the Russian InterstateAviation Group and the BEA. It showed that all impactpoints (adjusted to a 35,000 foot altitude at the time theemergency situation began) were contained within a 20-NM radius circle from the point at which the emergencybegan. These results are represented by a circular normaldistribution centered at the LKP with standard devia-tion 8 NM along both axes. For the flight dynamics (FD)prior, we chose a mixture weighted by 50 percent for theuniform over 40 NM distribution and 50 percent for thecircular normal distribution truncated at 40 NM fromthe LKP. The resulting distribution is shown in Figure 8.
The reverse drift (RD) prior was computed usingSAROPS and data on currents and winds to reverse themotion of recovered bodies back to the time of impact.The BEA commissioned a group of oceanographicexperts to estimate the currents in the area of the crash.The results are reported in the Drift Group Report [3].Because of the complexity of the currents in the area of crashand the lack of data, there is substantial uncertainty in theseestimates. Metron used the current estimates produced by theDrift Group and wind estimates from the U. S. Navy’sNOGAPS model to perform the reverse drift. However, wehave given the results based on these estimates a low weight (30percent) because of the uncertainty in the estimates.
To produce the RD prior, Metron used the positionsand recovery times of 33 bodies that were located fromJune 6-10, 2009 [8]. There are two components of drift:drift due to ocean current and drift due to wind, which iscalled leeway. We did not apply reverse drift to pieces ofdebris that were recovered during this time because we donot have good models for the effect of leeway on this typeof debris. For a deceased person floating in the water, weused the leeway model developed in [9].
For each body a large number of initial positions weredrawn from the distribution of the location of the bodyat the time of recovery. Each position became a particlethat was drifted backward in time subject to winds andcurrents. At each time step, a draw is made for the valueof the current and the wind from the distribution in thecell containing the particle. The leeway is calculated fromthe winds as described in section 2.5 of [7], and the neg-ative of the vector sum of current drift plus leeway isapplied to the particle motion until the next time step.Figure 9 shows the reverse drift distribution produced inthis fashion and truncated at the 40 NM circle.
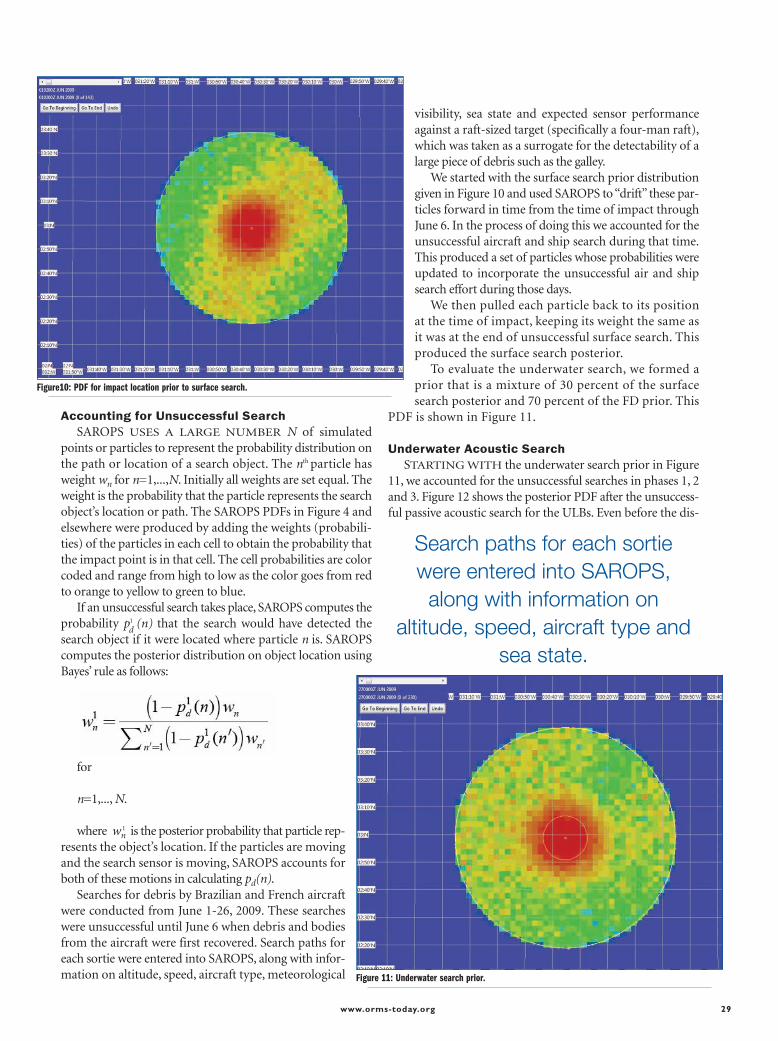
The prior distribution before surface search by aircraft andships is a mixture of 70 percent of the FD prior given in Figure8 and 30 percent of the RD prior given in Figure 9. The result-ing distribution is shown in Figure 10.
OR/MS TODAY28 August 2011
S E A R C H F O R A F 4 4 7
Figure 9: Reverse drift PDF.
Figure 8: Flight dynamics prior.
The analysis showed that all impact points were contained
within a 20-NM radius circlefrom the point at which the
emergency began.
Accounting for Unsuccessful SearchSAROPS USES A LARGE NUMBER N of simulated
points or particles to represent the probability distribution onthe path or location of a search object. The nth particle hasweight wn for n=1,...,N. Initially all weights are set equal. Theweight is the probability that the particle represents the searchobject’s location or path. The SAROPS PDFs in Figure 4 andelsewhere were produced by adding the weights (probabili-ties) of the particles in each cell to obtain the probability thatthe impact point is in that cell. The cell probabilities are colorcoded and range from high to low as the color goes from redto orange to yellow to green to blue.
If an unsuccessful search takes place, SAROPS computes theprobability p1 (n) that the search would have detected thesearch object if it were located where particle n is. SAROPScomputes the posterior distribution on object location usingBayes’ rule as follows:
for
n=1,..., N.
where w 1 is the posterior probability that particle rep-resents the object’s location. If the particles are movingand the search sensor is moving, SAROPS accounts forboth of these motions in calculating pd(n).
Searches for debris by Brazilian and French aircraftwere conducted from June 1-26, 2009. These searcheswere unsuccessful until June 6 when debris and bodiesfrom the aircraft were first recovered. Search paths foreach sortie were entered into SAROPS, along with infor-mation on altitude, speed, aircraft type, meteorological
visibility, sea state and expected sensor performanceagainst a raft-sized target (specifically a four-man raft),which was taken as a surrogate for the detectability of alarge piece of debris such as the galley.
We started with the surface search prior distributiongiven in Figure 10 and used SAROPS to “drift” these par-ticles forward in time from the time of impact throughJune 6. In the process of doing this we accounted for theunsuccessful aircraft and ship search during that time.This produced a set of particles whose probabilities wereupdated to incorporate the unsuccessful air and shipsearch effort during those days.
We then pulled each particle back to its positionat the time of impact, keeping its weight the same asit was at the end of unsuccessful surface search. Thisproduced the surface search posterior.
To evaluate the underwater search, we formed aprior that is a mixture of 30 percent of the surfacesearch posterior and 70 percent of the FD prior. This
PDF is shown in Figure 11.
Underwater Acoustic SearchSTARTING WITH the underwater search prior in Figure
11, we accounted for the unsuccessful searches in phases 1, 2and 3. Figure 12 shows the posterior PDF after the unsuccess-ful passive acoustic search for the ULBs. Even before the dis-
www.orms-today.org 29
Figure10: PDF for impact location prior to surface search.
Figure 11: Underwater search prior.
Search paths for each sortie were entered into SAROPS,
along with information on altitude, speed, aircraft type and
sea state.d
n
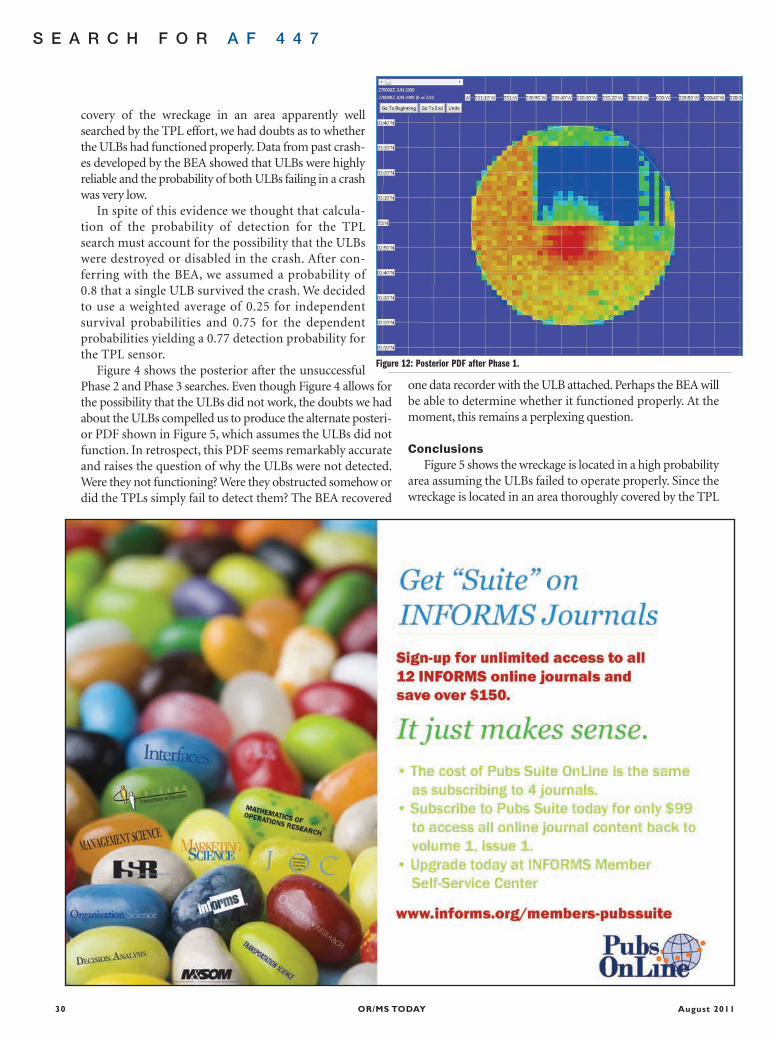
covery of the wreckage in an area apparently wellsearched by the TPL effort, we had doubts as to whetherthe ULBs had functioned properly. Data from past crash-es developed by the BEA showed that ULBs were highlyreliable and the probability of both ULBs failing in a crashwas very low.
In spite of this evidence we thought that calcula-tion of the probability of detection for the TPLsearch must account for the possibility that the ULBswere destroyed or disabled in the crash. After con-ferring with the BEA, we assumed a probability of0.8 that a single ULB survived the crash. We decidedto use a weighted average of 0.25 for independentsurvival probabilities and 0.75 for the dependentprobabilities yielding a 0.77 detection probability forthe TPL sensor.
Figure 4 shows the posterior after the unsuccessfulPhase 2 and Phase 3 searches. Even though Figure 4 allows forthe possibility that the ULBs did not work, the doubts we hadabout the ULBs compelled us to produce the alternate posteri-or PDF shown in Figure 5, which assumes the ULBs did notfunction. In retrospect, this PDF seems remarkably accurateand raises the question of why the ULBs were not detected.Were they not functioning? Were they obstructed somehow ordid the TPLs simply fail to detect them? The BEA recovered
one data recorder with the ULB attached. Perhaps the BEA willbe able to determine whether it functioned properly. At themoment, this remains a perplexing question.
ConclusionsFigure 5 shows the wreckage is located in a high probability
area assuming the ULBs failed to operate properly. Since thewreckage is located in an area thoroughly covered by the TPL
OR/MS TODAY30 August 2011
Figure 12: Posterior PDF after Phase 1.
S E A R C H F O R A F 4 4 7
www.orms-today.org 31
R E F E R E N C E S1. Troadec, Jean-Paul, “Undersea search operations to find the wreckage of theA 330, flight AF 447: the culmination of extensive searches,” note from BEAdirector, April 8, 2011, on the BEA website at www.bea.aero/en/enquetes/flight.af.447/note.from.bea.director.end.phase4.pdf .2. Lawrence D. Stone, C M. Keller, T. M. Kratzke, and J. P. Strumpfer, “SearchAnalysis for the Location of the AF447 Underwater Wreckage,” report to BEA,Jan. 20, 2011.3. “Estimating the Wreckage Location of the Rio-Paris AF447,” report fromDrift Group to BEA, June 30, 2010.4. Henry R. Richardson and L. D. Stone, “Operations Analysis During theUnderwater Search for Scorpion,” Naval Research Logistics Quarterly, Vol. 18,June 1971.5. Lawrence D. Stone, “Search for the SS Central America: MathematicalTreasure Hunting,” Interfaces, Vol. 22: January-February 1992.6. Colleen M. Keller and M. A. Anderson, “Applying Optimal Search Theory toInland SAR: Steve Fossett Case Study,” October 2008.7. Thomas M. Kratzke, L. D. Stone and J. R. Frost, “Search and RescueOptimal Planning System,” Proceedings of the 13th International Conferenceon Information Fusion, Edinburgh Scotland, July 26-29, 2010.9. “Interim Report n°2 on the accident on 1st June 2009 to Airbus A330-203registered F-GZCP operated by Air France, flight AF 447 Rio de Janeiro-Paris”by Bureau d’Enquêtes et d’Analyses, Dec. 17, 2009 (seehttp://www.bea.aero/en/enquetes/flight.af.447/flight.af.447.php).9. Ø. Breivik, A. Allen, C. Maisondieu, and J-C Roth, “Wind-induced drift ofobjects at sea: The leeway field method,” Applied Ocean Research 2011 doi:10.1016/j.apor.2011.01.005
search (see Figure 2), these results suggest it is likely that eitherboth ULBs failed or failed to be detected for some reason. Thisfailure resulted in a long and difficult search.
Our approach used careful and methodical consideration ofall data available, with associated uncertainties, to form an ana-lytic assessment of the highest likelihood areas for future searchefforts. The weighted scenario approach allowed inconsistentinformation to be combined with subjective weights that cap-ture the confidence in each piece of data. The analysis of thedetection effectiveness of each component of the search, whichproduced the Bayesian posterior distributions shown in Figures4 and 5 formed a solid basis for planning the next increment ofsearch. In fact the Phase 4 search commenced in the center ofthe distribution and quickly found the wreckage.
The success of this effort provides a powerful illustrationof the value of this methodical, Bayesian approach to searchplanning. The full report [2] of this work is available on theBEA website. ❙ORMS
Lawrence D. Stone ([email protected]) is chief scientist ofMetron Inc. He is a member of the National Academy ofEngineering and an INFORMS Fellow. In 1975, his text“Theory of Optimal Search” was awarded the LanchesterPrize. In 1986, he produced the probability maps used tolocate the S.S. Central America that sank in 1857. The teamfor the AF447 analysis included Colleen M. Keller and ThomasM. Kratzke of Metron and Johan Strumpfer of Partners for
Change in South Africa. This article is a based on “Search forthe Underwater Wreckage of Air France Flight 447” inProceedings of 14th International Conference on InformationFusion, July 5-8, 2011, Chicago.